Embed Size (px)
Citation preview
July 2014
Athens, Greece
THE OUTLOOK FOR A NATURAL GAS TRADING HUB IN SE EUROPE
An IENE Study Project (M19)
FINAL DRAFT
THE OUTLOOK FOR A NATURAL GAS TRADING HUB IN SE EUROPE
1
THE OUTLOOK FOR A NATURAL GAS TRADING HUB IN EUROPE
An IENE Study Project (M19)
Athens , July 2014
Coordinator: Costis Stambolis
Principal writer: Argiro Roinioti
Contributors:
Rosen Simitchiev, Bulgarian Energy Holding
Nicholas Sofianos, ΙΕΝΕ
Gokhan Yardim, Angoragaz Import Export Wholesale Inc.
Julian Lee, Independent consultant
Pantelis Manis, Hellenic Central Securities Depository
Radamanthys Tsotsos, Hellenic Central Securities Depository
Institute of Energy for S.E. Europe (IENE)
3, Alexandrou Soutsou, 106 71 Athens, Greece
tel: 0030 210 3628457, 3640278 fax: 0030 210 3646144
web: www.iene.gr, e-mail:[email protected]
Copyright ©2014, Institute of Energy for S.E. Europe
THE OUTLOOK FOR A NATURAL GAS TRADING HUB IN SE EUROPE
2
CONTENTS
Abbreviations and units ............................................................................................................................ 8
Acknowledgements ................................................................................................................................ 11
Executive Summary ................................................................................................................................ 12
1. Introduction ..................................................................................................................................... 16
2. European natural gas hubs ........................................................................................................... 20
2.1. Introduction ................................................................................................................................. 20
2.2. Natural gas trading ...................................................................................................................... 21
2.2.1. Physical vs. Virtual hubs ....................................................................................................... 21
2.2.2. Exchange based-trading vs. Over-The-Counter (OTC) trading ............................................. 23
2.3. Natural Gas hubs overview .......................................................................................................... 25
2.3.1. National Balancing Point (NBP) ............................................................................................ 25
2.3.2. Title Transfer Facility (TTF) ................................................................................................... 28
2.3.3. Central European Gas Hub (CEGH) ...................................................................................... 30
2.3.4. Zeebrugge (ZEE) ................................................................................................................... 33
2.3.5. NetConnect Germany (NCG) ................................................................................................ 36
2.3.6. Gaspool Balancing Services .................................................................................................. 39
2.3.7. Points D’ Echange De Gaz (PEGS) ......................................................................................... 40
2.3.8. Punto Di Scambio Virtuale (PSV) .......................................................................................... 43
2.4. Trading activity and prices at European Gas Hubs ...................................................................... 46
2.5. Gas prices on European Hubs ...................................................................................................... 49
3. Europe’s internal energy market and the role of energy exchanges .................................... 51
3.1. The internal energy market of the European Union ................................................................... 51
3.1.1. Integration of the Internal Energy Market for Electricity & Natural Gas ............................. 51
3.1.2. Regional Initiatives ............................................................................................................... 61
3.1.3. National Regulatory Authorities .......................................................................................... 63
3.1.4. Energy Exchanges ................................................................................................................ 64
3.2.Energy exchange traded Products ................................................................................................ 65
3.2.1. Power Market Products ....................................................................................................... 65
3.2.2. Natural Gas .......................................................................................................................... 69
3.2.3. Clearing OTC trades ............................................................................................................. 72
3.2.4. Supplementary products ..................................................................................................... 72
3.3. European Energy Exchanges ........................................................................................................ 76
3.3.1. Nasdaq OΜX Commodities – NordPool Spot AS.................................................................. 76
3.3.2. Nord Pool Spot ..................................................................................................................... 77
3.3.3. ΕΕΧ (European Energy Exchange) ........................................................................................ 79
3.3.4. Powernext ............................................................................................................................ 82
3.3.5. EPEX Spot SE ........................................................................................................................ 87
3.3.6. Gestore dei Mercati Energetici S.p.A (GME) – Italian Power Exchange ............................... 89
3.3.7. Βorsa Italiana – Italian Derivatives Energy Exchange (IDEX) ................................................ 92
3.3.8. ΑΡΧ - ENDEX ......................................................................................................................... 93
3.3.9. ΙCE Futures Europe............................................................................................................... 99
3.3.10. OMI (Iberian Market Operator). ........................................................................................ 99
3.3.11. Romanian Power Exchange (OPCOM) ............................................................................. 100
3.3.12. EXAA - Austria .................................................................................................................. 101
3.3.13. CEGH Gas Exchange ......................................................................................................... 102
3.3.14. Polish Power Exchange .................................................................................................... 104
3.3.15. OTE (Czech republic) ........................................................................................................ 105
3.3.16. Power Exchange Central Europe (PXE) ............................................................................ 106
THE OUTLOOK FOR A NATURAL GAS TRADING HUB IN SE EUROPE
3
3.3.17. CEGH Czech Gas Exchange ............................................................................................... 108
3.3.18. Hungarian Power Exchange (HUPX) ................................................................................. 108
3.3.19. BSP SOUTHPOOL .............................................................................................................. 109
4. The role of hubs in European natural gas pricing ................................................................... 111
4.1. Natural Gas wholesale price formation ..................................................................................... 111
4.2. Spot Hub pricing vs. Long-term contracts ................................................................................. 116
4.3. Gas pricing disputes – The role of Russia .................................................................................. 118
4.4. Price manipulation and the oligopolistic nature of european gas markets............................... 121
5. Potential suppliers of the European gas market and their role in market liquidity ......... 125
5.1. North Africa ............................................................................................................................... 126
5.1.1. Algeria ................................................................................................................................ 127
5.1.2. Egypt .................................................................................................................................. 128
5.1.3. Libya ................................................................................................................................... 129
5.2. Caspian Sea region and Central Asia ......................................................................................... 129
5.3. LNG imports ............................................................................................................................... 131
5.4. Eastern Mediterranean region .................................................................................................. 134
5.5. Middle East ................................................................................................................................ 136
5.6. A potential EU shale gas indrustry ............................................................................................. 137
6. SE Europe as a Gas Transit Region ............................................................................................. 139
6.1. The rising SE European gas market ............................................................................................ 139
6.2. Regional Gas Flows .................................................................................................................... 140
6.3. Planned Major Gas Projects of SE Europe ................................................................................. 143
6.4. Gas Interconnections in SE Europe ............................................................................................ 150
6.5. Available and planned storage capacity .................................................................................... 154
7. Key Market Players and their Role in a regional Gas Hub ..................................................... 158
7.1. Traditional and New Gas Suppliers and their Role in the operation of a Gas Hub .................... 159
7.2. Transit Countries and their Role in a Gas Hub ........................................................................... 162
8. Establishing a Regional Gas Hub ................................................................................................ 168
8.1. Which type of hub for SE Europe? ............................................................................................. 168
8.2. Basic parameters involved in the development of a regional natural gas hub ......................... 172
8.2.1. Generic Hub design and roles of hub participants ............................................................. 172
8.2.2. Conditions for the successful operation of a natural gas hub ........................................... 175
8.2.3. A natural gas hub for SE Europe ........................................................................................ 178
8.3. SWOT analysis............................................................................................................................ 185
8.4. A Roadmap for setting up a regional gas hub ............................................................................ 187
9. Economic implications from the operation of a Gas Hub in SE Europe – A discussion ... 191
10. Conclusions .................................................................................................................................. 197
APPENDIX ............................................................................................................................................. 199
Bibliography .......................................................................................................................................... 204
THE OUTLOOK FOR A NATURAL GAS TRADING HUB IN SE EUROPE
4
List of Figures Figure 1. Dry natural gas consumption in South Eastern Europe. .......................................................... 17 Figure 2. Dry natural gas imports in South Eastern Europe. .................................................................. 17 Figure 3. Projected GDP per capita in USD in South Eastern Europe (current prices). .......................... 18 Figure 4. Projected GDP percent change in South Eastern Europe (constant prices). ........................... 19 Figure 5. European Union - Natural Gas Hubs Evolution. ....................................................................... 20 Figure 6. Transparency on bilateral and exchange-based trading.......................................................... 24 Figure 7. SAP: Weighted average price of all trades for the relevant gas day on the OCM platform in €/KWh (€/£ = 0,21). ................................................................................................................................ 27 Figure 8. Traded volumes at the NBP. .................................................................................................... 27 Figure 9. Monthly churn ratios at the NBP. ............................................................................................ 27 Figure 10. TTF Day-ahead Index (End-of-Gas-Day). ................................................................................ 29 Figure 11. TTF net monthly volumes (Jan. 2009 – Dec. 2013). ............................................................... 29 Figure 12. NBP and TTF traded volumes. ............................................................................................... 30 Figure 13. TTF churn ratio....................................................................................................................... 30 Figure 14. Introduction of the CEGH VTP and consequences for CEGH Title Transfer Points (TTFs). .... 31 Figure 15. CEGH Day ahead market (January – March 2014). ................................................................ 32 Figure 16. CEGH OTC market (monthly). ................................................................................................ 32 Figure 17. CEGH gas exchange volumes. ................................................................................................ 33 Figure 18. Churn ratios at CEGH. ............................................................................................................ 33 Figure 19. APX ZTP Day – Ahead Index. .................................................................................................. 35 Figure 20. Traded and delivered volumes at ZTP (2013). ....................................................................... 35 Figure 21. Traded and delivered volumes at Zeebrugge Beach (2013). ................................................. 36 Figure 22. Churn ratios at ZTP. ............................................................................................................... 36 Figure 23. Reference price at NCG. ........................................................................................................ 38 Figure 24. NCG cumulative development of nominated volumes (Oct. 2012 – Sept. 2013). ................. 38 Figure 25. Churn ratio at NCG and Gaspool. .......................................................................................... 38 Figure 26. Reference price at Gaspool. .................................................................................................. 39 Figure 27. Trade volumes at Gaspool hub. ............................................................................................. 40 Figure 28. Gaspool churn rate for H-Gas and L-Gas. .............................................................................. 40 Figure 29. French PEGs activity. ............................................................................................................. 41 Figure 30. Daily Average Price at PEG Nord and PEG Sud. ..................................................................... 42 Figure 31. Traded volumes at PEGs (bcm). ............................................................................................. 42 Figure 32. Churn ratios at PEGs. ............................................................................................................. 43 Figure 33. PSV premium to TTF. ............................................................................................................. 44 Figure 34. MAGI Index from August 2012 and 70/30 weighting of GeEO transaction and quotation indices from September 2010 to April 2014. ......................................................................................... 45 Figure 35. PSV traded volumes. .............................................................................................................. 45 Figure 36. Churn ratio at PSV.................................................................................................................. 46 Figure 37. Traded volumes on European gas hubs. ................................................................................ 48 Figure 38. European gas hubs churn ratios. ........................................................................................... 48 Figure 39. ICIS Tradability Idex. .............................................................................................................. 49 Figure 40. Wholesale day-ahead gas prices on European gas hubs. ...................................................... 50 Figure 41. One year forward gas prices on European gas hubs. ............................................................ 50 Figure 42. Market structure of energy exchanges.................................................................................. 65 Figure 43. Trading within-day products.................................................................................................. 71 Figure 44. The sub-markets of EEX. ........................................................................................................ 80 Figure 45. Participations of EEX. ............................................................................................................. 81 Figure 46. Powernext and EEX common participants. ........................................................................... 84 Figure 47. Market structure of MGAS. ................................................................................................... 91 Figure 48. APX Group Volume, 2009 – 2013. ......................................................................................... 96 Figure 49. Different block products traded in EXAA. ............................................................................ 101 Figure 50. CEGH structure. ................................................................................................................... 102 Figure 51. CEGH Gas Exchange volume, 2009 – 2013. ......................................................................... 103 Figure 52. Volumes of bilateral contracts registered in OTE system in 2011 – 2013 (GWh). ............... 106 Figure 53. Trading and clearing procedure in HUPX. ............................................................................ 109 Figure 54. Trading results of BSP South Pool. ....................................................................................... 110
THE OUTLOOK FOR A NATURAL GAS TRADING HUB IN SE EUROPE
5
Figure 55. Market- based pricing mechanisms. .................................................................................... 111 Figure 56. Price formation in Europe.................................................................................................... 114 Figure 57. Price formation in the Mediterranean region. .................................................................... 114 Figure 58. Price formation in South Eastern Europe. ........................................................................... 114 Figure 59. Two views of aggregate European supply contract indexation. .......................................... 115 Figure 60. Oil-price indexed contracts. ................................................................................................. 116 Figure 61. Market maturity. ................................................................................................................. 117 Figure 62. Growth in upstream capital costs. ....................................................................................... 119 Figure 63. European gas hubs price correlation. .................................................................................. 122 Figure 64. UK gas price on the day-ahead market and alleged price manipulation (Guardian Newspaper). ......................................................................................................................................... 122 Figure 65. 2012 EU natural gas imports. .............................................................................................. 125 Figure 66. African gas production, 2000-2018. .................................................................................... 126 Figure 67. Actual and projected global LNG demand. .......................................................................... 132 Figure 68. Global LNG capacity and demand. ....................................................................................... 132 Figure 69. Gas production in the Middle East, 2000 – 2018. ............................................................... 136 Figure 70. Stages of market development. .......................................................................................... 172 Figure 71. Stakeholders and hub participants. ..................................................................................... 173 Figure 72. Roles of hub participants in the case of a Virtual Trading Point. ......................................... 173 Figure 73. Proposed hub design. .......................................................................................................... 175 Figure 74. Scheme of an Entry-Exit system. ......................................................................................... 179 Figure 75. Proposed road map for the development of a natural gas hub based in Greece. .............. 182 Figure 76. SWOT analysis for a gas hub in SE Europe. .......................................................................... 186 Figure 77. Next steps. ........................................................................................................................... 187 Figure 78. Roadmap for a regional gas hub. ......................................................................................... 188 Figure 79. Natural gas import and spot prices in Europe, 2007 – 2013. .............................................. 195 Figure 80. Natural gas import prices into European countries. ............................................................ 195
List of Tables
Table 1. Hub types in Europe. ................................................................................................................. 22 Table 2. Differences between exchange-traded and OTC – traded products. ....................................... 24 Table 3. Nominated (net-traded) and physical volumes on European gas hubs (bcm). ........................ 47 Table 4. Characteristics of a Gas Contract of Powernext. ...................................................................... 71 Table 5. Market areas of Nord Pool Spot. .............................................................................................. 78 Table 6. TSOs involved in the operation of Nord Pool Spot. .................................................................. 78 Table 7. Main figures of the energy market of Nord Pool Spot .............................................................. 79 Table 8. Products traded in EEX. ............................................................................................................. 80 Table 9. Activity results of EEX. .............................................................................................................. 82 Table 10. Characteristics of the Day ahead market of EPEX Spot. ......................................................... 87 Table 11. Characteristics of market coupling contracts of EPEX Spot. ................................................... 88 Table 12. Day ahead market volumes of EPEX Spot. .............................................................................. 89 Table 13. Intraday market volumes of EPEX Spot. ................................................................................. 89 Table 14. Electricity prices and traded volumes in the Italian Power Exchange. ................................... 90 Table 15. Natural gas prices and traded volumes in the Italian Power Exchange. ................................. 92 Table 16. Product characteristics of Future Contracts of the Italian Derivatives Energy Exchange. ...... 93 Table 17. Characteristics of the APX ENDEX Day Ahead Market Hourly. ............................................... 95 Table 18. Traded volume and traded value in EXAA. ........................................................................... 101 Table 19. Characteristics of CEGH Gas Exchange Products. ................................................................ 103 Table 20. Key North African natural gas data in 2012 (bcm). ............................................................... 127 Table 21. Greece: Natural Gas Consumption 2010-2013. .................................................................... 140 Table 22. Greece: Natural Gas Consumption Forecast for 2014-2023. ................................................ 140 Table 23. Bulgaria: Natural Gas Consumption 2010 – 2013. ................................................................ 141 Table 24. Bulgaria: Natural Gas Consumption Forecast for 2014 – 2023. ............................................ 141 Table 25. Turkey: Natural Gas Consumption 2010 – 2013. .................................................................. 142
THE OUTLOOK FOR A NATURAL GAS TRADING HUB IN SE EUROPE
6
Table 26. Turkey: Natural Gas Consumption Forecast for 2014 – 2023. .............................................. 143 Table 27. Estimation on when the reverse flow capacity will become available. ................................ 154 Table 28. Additional gas supply potential in Turkey from various sources for 2015 – 2024. ............... 163 Table 29. Anticipated gas deliveries through spot trades in Turkey: Reference Scenario. .................. 163 Table 30. Anticipated gas deliveries through spot trades in Turkey: Optimistic Scenario. .................. 164 Table 31. Anticipated gas deliveries through spot trades in Bulgaria: Reference Scenario. ................ 165 Table 32. Anticipated gas deliveries through spot trades in Bulgaria: Optimistic Scenario. ................ 165 Table 33. Basic structure of European marketplaces for natural gas. .................................................. 174 Table 34. Cost of planned gas infrastructure projects.......................................................................... 192 Table 35. Scenarios for trading activity in the regional natural gas hub. ............................................. 193
List of Pictures
Picture 1. European gas hubs and exchanges. ....................................................................................... 21 Picture 2. Natural Gas exchanges. .......................................................................................................... 23 Picture 3. The Interconnector................................................................................................................. 26 Picture 4. The Zeebrugge hub. ............................................................................................................... 34 Picture 5. Map of the German gas market area. .................................................................................... 37 Picture 6. Title Transfer Points and Transmission System in France. ..................................................... 41 Picture 7. Italian gas transmission network............................................................................................ 44 Picture 8. Integration stages of the European Energy markets. ............................................................. 52 Picture 9. Baltic Regional Initiative (Estonia, Lithuania, Latvia) .............................................................. 61 Picture 10. Regional Initiative of Central and Western Europe (CWE) (France, Belgium, Germany, Holland, Luxembourg) ............................................................................................................................ 61 Picture 11. Regional Initiative of Central and Eastern Europe (CEE) (Germany, Poland, Austria, Czech Republic, Hungary, Slovakia, Slovenia) ................................................................................................... 61 Picture 12. Regional Initiative of Northern Europe (Finland, Norway, Sweden, Denmark, Germany, Poland) ................................................................................................................................................... 61 Picture 13. Regional Initiative Central and Southern Europe (CSE) (France, Germany, Italy, Austria, Greece, Slovenia) .................................................................................................................................... 62 Picture 14. Regional Initiative of Southern and Western Europe (SWE) (Spain, Portugal,France) ........ 62 Picture 15. Regional Initiative France – UK -Ireland ............................................................................... 62 Picture 16. Overall presentation of Regional Initiatives for the integration of electricity markets ....... 62 Picture 17. The natural gas territories in France. ................................................................................... 70 Picture 18. Energy exchanges across Europe. ........................................................................................ 76 Picture 19. The electricity market of Nord Pool Spot. ............................................................................ 77 Picture 20. Market areas of Nord Pool Spot. .......................................................................................... 78 Picture 21. The Powernext Gas market. ................................................................................................. 84 Picture 22. The Powernext Gas Futures market. .................................................................................... 85 Picture 23. PEGAS market areas and products. ...................................................................................... 86 Picture 24. The electricity market of EPEX Spot. .................................................................................... 87 Picture 25. The markets of APX. ............................................................................................................. 94 Picture 26. The electricity market of PXE. ............................................................................................ 107 Picture 27. Pricing models. ................................................................................................................... 112 Picture 28. Caspian Sea region oil and natural gas infrastructure. ....................................................... 130 Picture 29. Southern Corridor. ............................................................................................................. 131 Picture 30. Eastern Mediterranean energy infrastructure. .................................................................. 135 Picture 31. The South Stream Pipeline Project. .................................................................................... 144 Picture 32. The TANAP – TAP Pipeline System. .................................................................................... 146 Picture 33. The TAP - IAP Pipeline System. ........................................................................................... 146 Picture 34. The East Med Pipeline Project. .......................................................................................... 147 Picture 35. Alexandroupolis LNG INGS – A new energy gateway to Europe. ....................................... 149 Picture 36. Gas interconnections in SE Europe. ................................................................................... 150 Picture 37. The Thessaloniki and Istanbul Gas Trading Hubs will between them cover a wide geographical range and adjacent trading zones. .................................................................................. 190

THE OUTLOOK FOR A NATURAL GAS TRADING HUB IN SE EUROPE
7
Picture 38. Revithoussa LNG Terminal. ................................................................................................ 199 Picture 39. South Kavala gas field. ........................................................................................................ 200 Picture 40. South Kavala Underground Gas Storage – Project Characteristics. ................................... 201 Picture 41. South Kavala infrastructure with associated project costs. ............................................... 202
THE OUTLOOK FOR A NATURAL GAS TRADING HUB IN SE EUROPE
8
ABBREVIATIONS AND UNITS
ACER Agency for the Cooperation of Energy Regulators
AIB Association of Issuing Bodies
APX Amsterdam Power Exchange
BBL Balgzand Bacton (pipe)Line
bcm billion cubic metres
CEGH Central European Gas Hub
CEGHIX Central European Gas Hub Index
CER Certified emission reduction
CHP Combined heat and power
CO2-e Carbon dioxide equivalent
CRES Centre for Renewable Energy Sources
DOE Department of Energy
DS Futures Deferred settlement futures
DSO Distribution System Operator
ECC European Commodity Clearing
EEC Energy Efficiency Credit
EECS European Energy Certification System
EEPS Energy Efficiency Portfolio Standard
EEX European Energy Exchange
EGAS Egyptian Natural Gas Holding Company
EGEX European Gas Exchange
EIA Energy Information Administration
EMCC European Market Coupling Company
ENDEX European Energy Derivatives Exchange
ENTSO European Network of Transmission System Operators
EPAD Electricity Price Area Differential
ERGEG European Regulators Group for Electricity and Gas
ESC Energy Saving Certificates
EUA European Union allowance
EXAA Energy Exchange Austria
FCA Financial Conduct Authority (UK)
FERC Federal Energy Regulatory Commission
FSRU Floating storage and regasification unit
FYROM Former Yugoslav Republic of Macedonia
GBP German border price
GDP Gross Domestic Product
GO Guarantee of Origin
GPL Gaspool Balancing Services hub
GTS Gasunie Transport Services
GWh Gigawatt hour
H gas High calorific natural gas
IAP Ionian Adriatic Pipeline
ICE Intercontinental Exchange
IEA International Energy Agency
THE OUTLOOK FOR A NATURAL GAS TRADING HUB IN SE EUROPE
9
IEFE Center for Research on Energy and Environmental Economics and Policy, Università Bocconi
IGB Interconnector Greece-Bulgaria
IGI Interconnector Greece-Italy
IMF International Monetary Fund
ISO Independent System Operator
ITGI Interconnector Turkey-Greece-Italy
ITO Independent Transmission Operator
km Kilometres
KWh Kilowatt hour
L gas Low calorific natural gas
LEBA London Energy Brokers’ Association
LNG Liquefied Natural Gas
m Metres
MAGI Month Ahead Italian Gas Index
mcm million cubic metres
MMbtu Million British Thermal Units
MTF Multilateral trading facility
NBP National Balancing Point
NCG Netconnect Germany
NETA New Electricity Trading Arrangements
NRA National Regulatory Authority
NTS National Transmission System
NYMEX New York Mercantile Exchange
OCM On-the-day Commodity Market
OIES Oxford Institute for Energy Studies
OMI Iberian Market Operator
OTC Over the counter
PEG Point d'Echange de Gaz
PEGAS Pan-European gas co-operation
PSV Punto di Scambio Virtuale
RAE Regulatory Authority for Energy
REC Renewable Energy Certificate
RES Renewable Energy Source
SAP System Average Price
SBU Standard bundled unit
SMBP System Marginal Buy Price
SMSP System Marginal Sell Price
TANAP Trans-Anatolian Pipeline
TAP Trans-Adriatic Pipeline
tcm Trillion cubic metres
TOP Take-or-pay
TPA Third Party Access
TSO Transmission System Operator
TTF Title Transfer Facility
TWh Terrawatt hours

THE OUTLOOK FOR A NATURAL GAS TRADING HUB IN SE EUROPE
10
UGS Underground gas storage
VTP Virtual Trading Point
ZEE Zeebrugge gas hub
ZTP Zeebrugge Trading Point
THE OUTLOOK FOR A NATURAL GAS TRADING HUB IN SE EUROPE
11
ACKNOWLEDGEMENTS
IENE would like to thank the companies who have contributed financially, but also provided
information to carry out the present study. More specifically, the IENE would like to thank
the Public Gas Corporation (DEPA), the Athens Exchange Group, the Hellenic Gas
Transmission System Operator (DESFA), GasTrade SA, part of the Copelouzos Group of
Companies, and the Hellenic Electricity Market Operator (LAGIE). Without the financial
support of the aforementioned companies, undertaking this project would be extremely
difficult. IENE also wishes to thank the Study contributors for their work and also the
organizations which provided important information.
THE OUTLOOK FOR A NATURAL GAS TRADING HUB IN SE EUROPE
12
EXECUTIVE SUMMARY
The European gas sector is facing major challenges affecting the way natural gas is traded
and priced. Oil indexation is the dominant pricing mechanism, but is currently under
increasing pressure as trading is gradually shifting to indexation on hub market prices. Gas
hubs are virtual or physical locations where buyers and sellers of gas can meet and exchange
gas volumes. In other words, gas hubs are marketplaces for natural gas.
The Institute of Energy for South-East Europe (IENE) took the initiative and carried out a
research project in order to examine the conditions and prospects for establishing a regional
Gas Hub for South Eastern Europe. At present, there is neither a market mechanism to buy
or sell gas in an efficient manner in South East Europe, nor a price discovery mechanism to
determine spot prices, and gas exchange is based on bilateral agreements.
Energy security has been very high on the list of the EU energy and foreign policy agenda in
the last decade. The main goals of the E.U. in the energy security domain are to decrease the
energy dependence of member states on as few external suppliers as possible and to
promote stable market rules which will make energy markets open and liquid. The EU aims
to ensure the diversification of gas supply in order to decrease the market share of the
largest foreign gas suppliers, and especially that of its biggest supplier, Russia, in an effort to
shift price negotiations to the benefit of European buyers. The transition to a hub-based
pricing mechanism is considered by many as a solution to EU’s energy dependence problem.
Nevertheless, it should be noted that spot pricing does not imply that natural gas prices will
necessarily be lower than oil prices, just that gas prices will be formed based on supply and
demand dynamics for gas, rather than for oil.
Today, there are nine (9) natural gas hubs operating across Europe. According to the
International Gas Union, gas-on-gas competition in Europe increased from 15% in 2005 to
45% in 2012 while oil indexation decreased from 78% to 50% during the same period.
Liquidity is increasing in European trading hubs, while the European Union aims at further
increasing of liquidity, in the context of the completion of an integrated and interconnected
internal energy market by 2014. The integration is expected to increase the energy market
effectiveness, create a single European gas and electricity market, contribute in keeping
prices at low levels, as well as increase security of supply. Trade between EU member states
will become more flexible and thus, possible curtailments of Russian supplies will have less
impact on the European gas market.
Oil-indexed prices have been associated mainly with long-term contracts while hub prices
have been associated with spot or short-term contracts. Oil-indexed long-term contracts
prevailed in the gas sector because they were considered to ensure investment security for
the producer as well as security of supply for the consumer. On the other hand, a gas price
mechanism which reflects the market value of the product should be considered as a natural
evolution for the pricing of a commodity. Indeed, long-term contracts with prices linked to a
gas market would ensure a price level reflecting the balance of supply and demand of the
product in addition to security of supply.
THE OUTLOOK FOR A NATURAL GAS TRADING HUB IN SE EUROPE
13
Europe sees an important opportunity to meet its energy needs by developing the Southern
gas corridor, at the core of which are gas supplies from the Caspian area (including
Azerbaijan and most likely in the far future from Turkmenistan, Kazakhstan and Iran) and
possibly from the Middle East (Iraq). SE European countries (Greece, Croatia, Bulgaria,
Romania, Turkey and Serbia) have well established gas markets, with supplies coming
primarily through imports from Russia and, in the case of Turkey, from Iran and Azerbaijan
also. Greece and Turkey, which have well developed LNG import and storage terminals, also
import from Algeria, Nigeria, Qatar and other LNG spot markets. Two countries have a
significant proportion of their demand met from domestic supplies (Croatia, Romania) and
three others cover small percentage shares from domestic gas (Bulgaria, Serbia, Turkey).
According to IENE forecasts after 2018-19 some marginal gas quantities will become
available in the SE European region which could be traded and therefore, as far as trading is
concerned, the need will emerge for market prices to be determined. Turkey is already a
major gas importer from Russia, Iran and Azerbaijan. In the future Turkey is likely to get gas
also from Kurdistan, and most likely from Iraq. In addition, LNG will be another important
player in the market, as there are plans for new LNG import terminals in the region. Already
two FSRU1 units are planned to be based in Kavala and Alexandroupolis in Northern Greece,
with the prospect of feeding gas quantities into the Greek, Bulgarian and Turkish natural gas
systems. The Trans-Anatolian Pipeline or TANAP, whose construction is due to start in 2014,
will be connected to Greece through the Trans-Adriatic Pipeline (TAP) pipeline. In addition to
Azeri gas, TAP could be used to transport North African gas to Southern Europe and Turkey
via reverse flow. There will also be a connection between Greece and Bulgaria and Bulgaria
to Turkey via new interconnector pipelines. The immediate result of all of this is that there
will be certain gas quantities available for trading outside long-term contracts.
Consequently, the establishment of a natural gas trading hub initially to enable trading
between Greece, Bulgaria and Turkey, will ensure the determination of market prices
through the exchange of marginal gas volumes.
A hub can be a physical point, at which several pipelines come together (e.g. Zeebrugge) or it
can be a virtual (balancing) point inside a pipeline system (like the NBP). In other words, a
physical hub is an actual transit location or physical point where gas pipelines meet and
natural gas is traded. Physical hubs can serve as transit points for the transportation of
natural gas, as well as storage facilities. Nonetheless, a hub does not need to be a physical
intersection of pipelines.
A virtual hub is a trading platform for the financial transaction of natural gas, where a wide
number of participants have access. Physical hubs are implemented at a specific location
where natural gas must imperatively be transported to. However, in the case of virtual hubs,
the trading platform serves a trans-regional zone or an entire country. Therefore, the traded
gas can be injected into any point on a trans-regional or national grid regardless of the point
of extraction. The obvious advantage of virtual hubs is that all gas which has paid a fee for
access into the network can be traded, while at physical hubs, only gas physically passing at
a precise location can be traded and this entails higher risks.
1 A Floating Storage Regasification Unit (FSRU) is a special type of vessel which is used form transporting LNG.
THE OUTLOOK FOR A NATURAL GAS TRADING HUB IN SE EUROPE
14
Virtual trading hubs, such as NBP or TTF, do not exist in Southern and Eastern Europe. The
region is now starting to warm up to the prospect of a liquid market where long-term
contracts and spot or short-term trading are combined. The establishment and functioning
of a Gas Trading Hub requires a deregulated gas market, which is not the case today in most
countries of South Eastern Europe.
However, one could argue that the operation of a physical i.e. transit regional hub, such as
the Belgian Zeebrugge, could also be possible, due to the flexibility resulting from the
operation of the existing and planned interconnections in the region. The region could serve
as a transit route for carrying Azerbaijani gas to smaller hubs that are planned in the region,
as well as the Central European Gas Hub in Austria. Like the Zeebrugge, a hub where
pipelines physically meet, a regional hub storage and LNG facilities, as well as pipeline
connections, could become a possible balancing point for both storage and transportation.
A virtual hub would offer even greater flexibility, because – as it has already been mentioned
– in virtual hubs, the eligible gas for trading is all the gas which has paid a fee for access into
the network. Especially when moving towards an entry-exit system – which is required by EU
regulation for member states - virtual hubs are more suitable for gas trading.
The establishment of a regional natural gas hub is expected to facilitate the wholesale
trading of natural gas between participants in South Eastern Europe. Essentially, it will allow
gas supply and demand to meet in a marketplace by providing a platform for physical and/or
financial transaction. It will enable competitive markets to function, even though it will
probably have an administrative role in the beginning of its operation.
An important issue to be addressed is where the gas hub will be based. Increased supply
optionality and infrastructure development are prerequisites for creating a market in the
region. At the moment there are several pipeline connections planned in South Eastern
Europe, as well as two FSRU facilities and an underground storage facility in Northern
Greece. Both Greece and Turkey have expressed interest in establishing a gas hub for the
region.
Storage will also play an important role in providing physical gas flexibility. The role of gas
storage is critical as it can serve as an important flexibility tool and may affect the location of
the hub, if physical. If the hub operates as a physical hub, it is possible that the TAP/IGB/IGT
junction can serve as a physical hub. In this respect, the creation of an underground gas
storage facility in South Kavala is key, especially if Greece is to take a lead role in this initial
stage.
The parallel establishment of two major regional hubs is foreseen, one in Thessaloniki linked
to the Athens Energy Exchange (in the process of being set up) and the second in Istanbul
linked to the EPIAS Energy Exchange (to be established). With anticipated marginal gas
volumes in the initial range of 1-1,5 bcm to be available for trading as early as 2018, rising to
6,0 and possibly to 10,0 bcm and more by 2025, it may well become possible to see the
realization of such projection. In a sense, having two regional exchanges will help
considerably from a geographical aspect as the Istanbul one will take care of trades directed
eastwards while the Thessaloniki one will deal with trades to the West and to the North.
THE OUTLOOK FOR A NATURAL GAS TRADING HUB IN SE EUROPE
15
The financial implications arising from the operation of these two likely hubs are
considerable both in terms of planned infrastructure investment (of the order of €6,0 billion)
and in terms of traded volumes (in excess of €4,0 billion per year with conservative churn
ratios and minimal quantities). Although it is difficult, at this stage, to predict market
behaviour and its reflection on spot prices, once the hub enters full operation, based on
European hub operation experience, one could safely assume that spot prices determined
through hub trading will be lower than oil-indexed ones. Of course, this is not the only
positive financial implication arising from a hub operation. The attraction of sizeable
tradable gas volumes and the trading activity arising from this will help to reassure markets
in terms of gas availability and security of supply.
THE OUTLOOK FOR A NATURAL GAS TRADING HUB IN SE EUROPE
16
1. INTRODUCTION
The European gas sector is facing major challenges affecting the way natural gas is traded
and priced. Oil indexation is the dominant pricing mechanism, but is currently under
increasing pressure as trading is gradually shifting to indexation on hub market prices. Gas
hubs are virtual or physical locations where buyers and sellers of gas can meet and exchange
gas volumes. In other words, gas hubs are marketplaces for natural gas [1]. According to the
International Energy Agency (IEA), European spot prices are three to four times higher than
those in the United States, but are still significantly lower than European long‐term contract
prices normally determined through oil indexation. As a result, there has been a lot of
controversy over how natural gas should be priced.
Today, there are nine natural gas hubs operating across Europe. According to the
International Gas Union, gas-on-gas competition in Europe increased from 15% in 2005 to
45% in 2012 while oil indexation decreased from 78% to 50% during the same period.
Liquidity is increasing in European trading hubs, while the European Union aims at further
increasing of liquidity, in the context of the completion of an integrated and interconnected
internal energy market by 20142.
The Institute of Energy for South-East Europe (IENE) took the initiative and carried out a
research project in order to examine the conditions and prospects for establishing a regional
Gas Hub for South Eastern Europe. The findings of this research project are presented in this
volume. At present, there is neither a market mechanism to buy or sell gas in an efficient
manner in South East Europe, nor a price discovery mechanism to determine spot prices,
and gas exchange is based on bilateral agreements.
According to IENE forecasts after 2018-19 some marginal gas quantities will become
available in the SE European region which could be traded and therefore, as far as trading is
concerned, the need will emerge for market prices to be determined. Turkey is already a
major gas importer from Russia, Iran and Azerbaijan. In the future Turkey is likely to get gas
also from Kurdistan and most likely from Iraq. In addition, LNG will be another important
player in the market, as there are plans for new LNG import terminals in the region. Already
two FSRU3 units are planned to be based in Kavala and Alexandroupolis in Northern Greece,
with the prospect of feeding gas quantities into the Greek, Bulgarian and Turkish natural gas
systems. The Trans-Anatolian Pipeline or TANAP, whose construction is due to start in 2014,
will be connected to Greece through the Trans-Adriatic Pipeline (TAP) pipeline. In addition to
Azeri gas, TAP could be used to transport North African gas to Southern Europe and Turkey
via reverse flow. There will also be a connection between Greece and Bulgaria and Bulgaria
2 In February 2011 the EU Heads of State declared the need to complete the internal energy market by 2014.
THE OUTLOOK FOR A NATURAL GAS TRADING HUB IN SE EUROPE
17
to Turkey via new interconnector pipelines. The immediate result of all of this is that there
will be certain gas quantities available for trading outside long-term contracts.
Consequently, the establishment of a natural gas trading hub initially to enable trading
between Greece, Bulgaria and Turkey, will ensure the determination of market prices
through the exchange of marginal gas volumes.
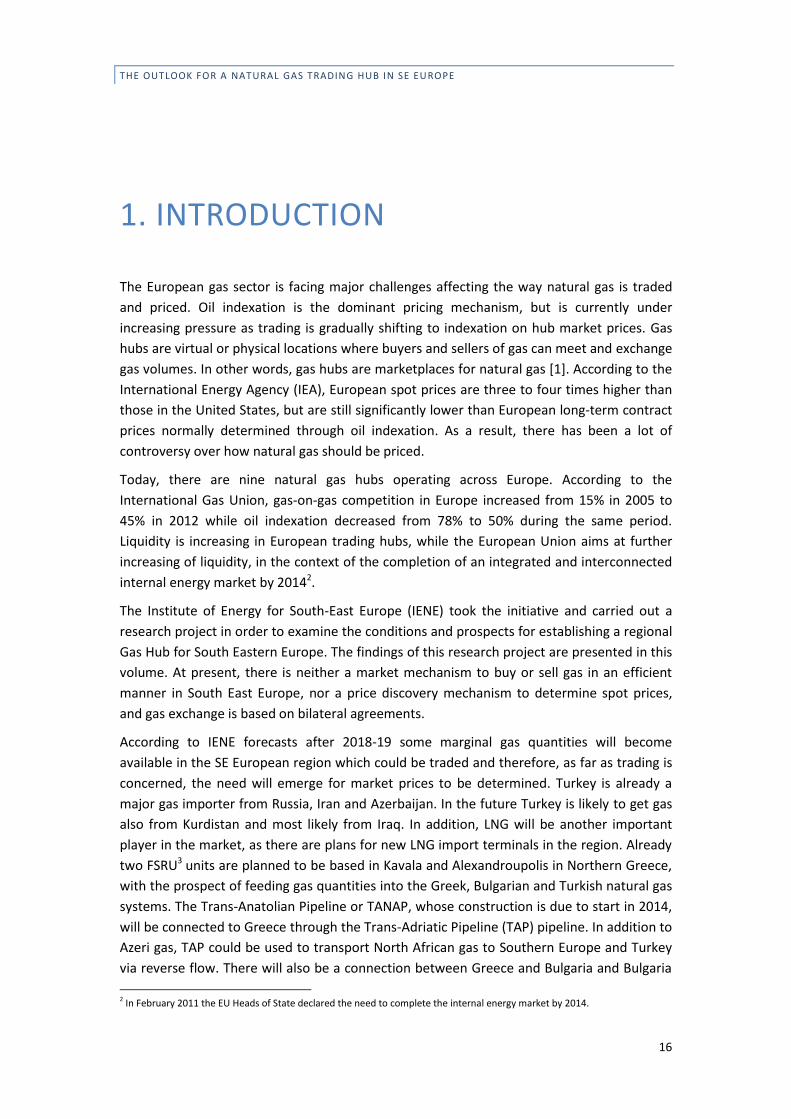
Turkey’s natural gas consumption has grown dramatically over the last decade – from a level
of 15 bcm in 2000 to 45 bcm in 2012 – establishing the country as the largest natural gas
consumer in South Eastern Europe. According to the IEA, Turkish gas demand is expected to
increase even further, reaching 60 bcm by 2018. Turkey does not have any significant
indigenous natural gas reserves and therefore the increase in Turkish gas demand has to be
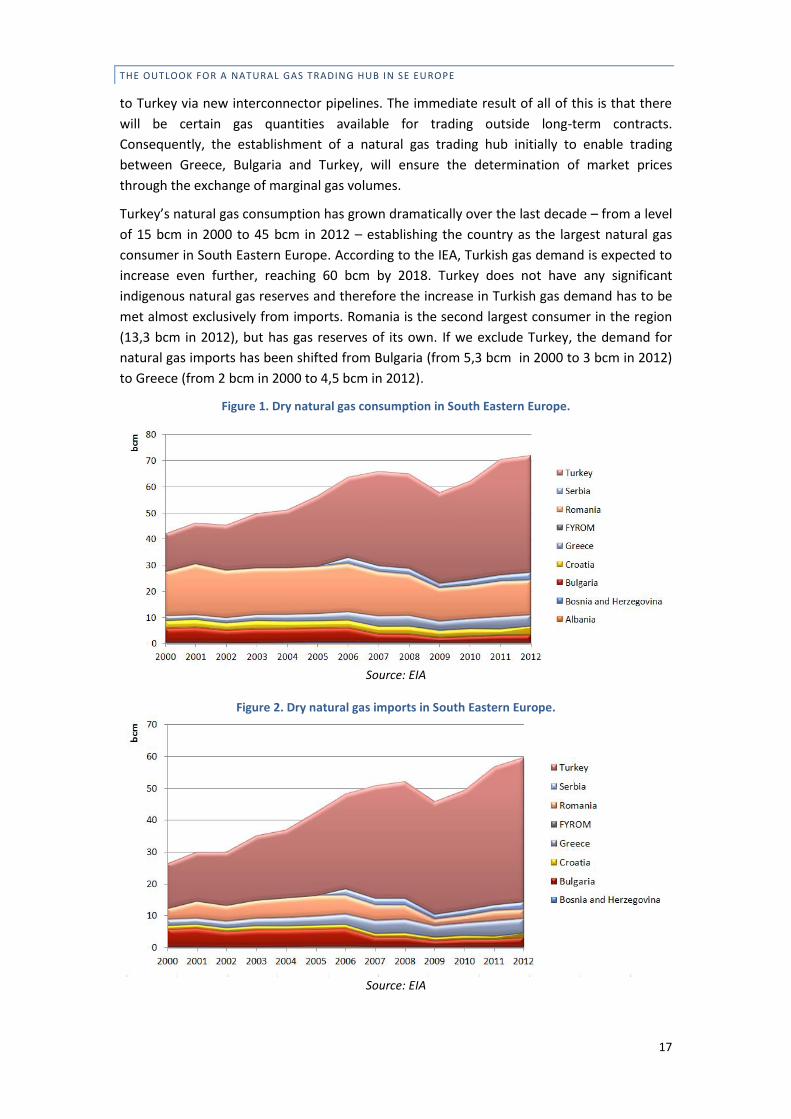
met almost exclusively from imports. Romania is the second largest consumer in the region
(13,3 bcm in 2012), but has gas reserves of its own. If we exclude Turkey, the demand for
natural gas imports has been shifted from Bulgaria (from 5,3 bcm in 2000 to 3 bcm in 2012)
to Greece (from 2 bcm in 2000 to 4,5 bcm in 2012).
Figure 1. Dry natural gas consumption in South Eastern Europe.
Source: EIA
Figure 2. Dry natural gas imports in South Eastern Europe.
Source: EIA
THE OUTLOOK FOR A NATURAL GAS TRADING HUB IN SE EUROPE
18
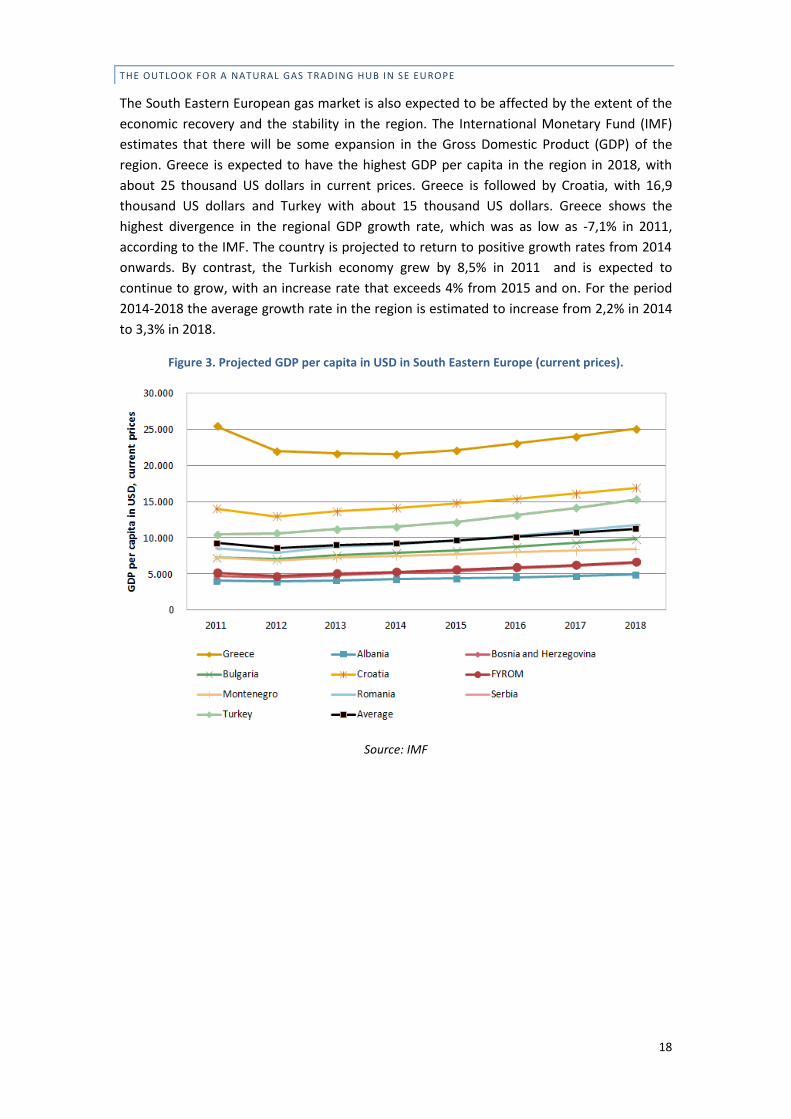
The South Eastern European gas market is also expected to be affected by the extent of the
economic recovery and the stability in the region. The International Monetary Fund (IMF)
estimates that there will be some expansion in the Gross Domestic Product (GDP) of the
region. Greece is expected to have the highest GDP per capita in the region in 2018, with
about 25 thousand US dollars in current prices. Greece is followed by Croatia, with 16,9
thousand US dollars and Turkey with about 15 thousand US dollars. Greece shows the
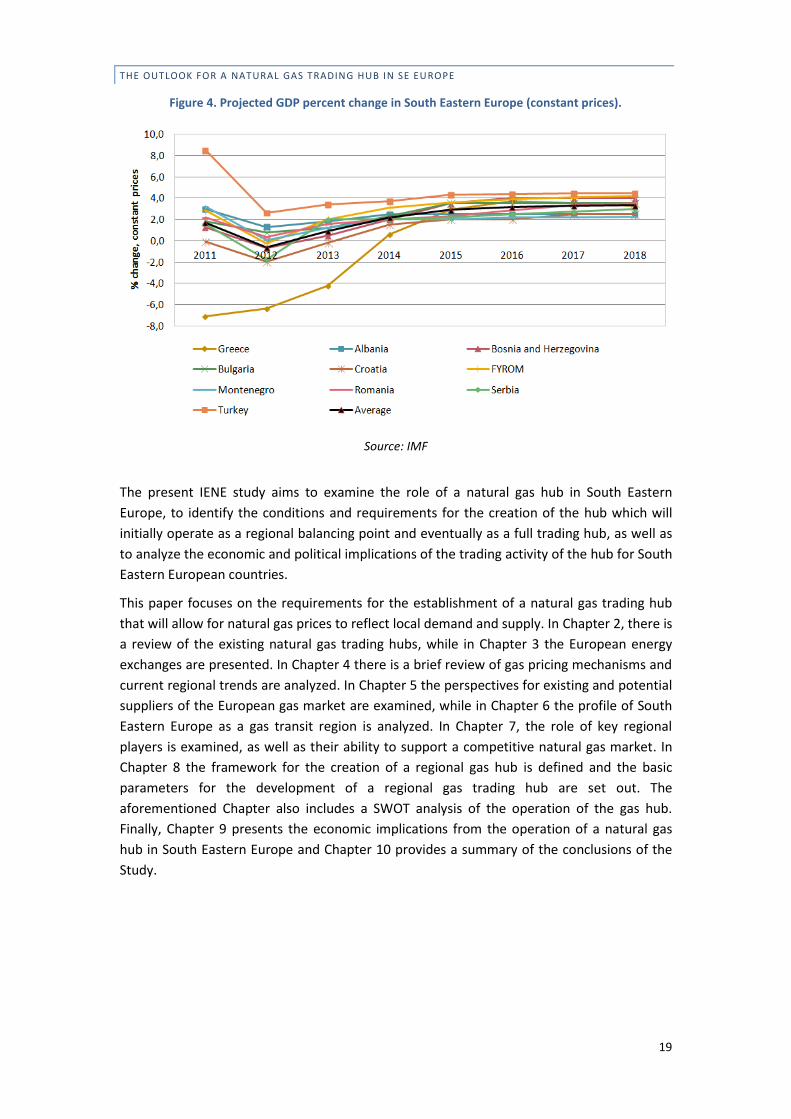
highest divergence in the regional GDP growth rate, which was as low as -7,1% in 2011,
according to the IMF. The country is projected to return to positive growth rates from 2014
onwards. By contrast, the Turkish economy grew by 8,5% in 2011 and is expected to
continue to grow, with an increase rate that exceeds 4% from 2015 and on. For the period
2014-2018 the average growth rate in the region is estimated to increase from 2,2% in 2014
to 3,3% in 2018.
Figure 3. Projected GDP per capita in USD in South Eastern Europe (current prices).
Source: IMF
THE OUTLOOK FOR A NATURAL GAS TRADING HUB IN SE EUROPE
19
Figure 4. Projected GDP percent change in South Eastern Europe (constant prices).
Source: IMF
The present IENE study aims to examine the role of a natural gas hub in South Eastern
Europe, to identify the conditions and requirements for the creation of the hub which will
initially operate as a regional balancing point and eventually as a full trading hub, as well as
to analyze the economic and political implications of the trading activity of the hub for South
Eastern European countries.
This paper focuses on the requirements for the establishment of a natural gas trading hub
that will allow for natural gas prices to reflect local demand and supply. In Chapter 2, there is
a review of the existing natural gas trading hubs, while in Chapter 3 the European energy
exchanges are presented. In Chapter 4 there is a brief review of gas pricing mechanisms and
current regional trends are analyzed. In Chapter 5 the perspectives for existing and potential
suppliers of the European gas market are examined, while in Chapter 6 the profile of South
Eastern Europe as a gas transit region is analyzed. In Chapter 7, the role of key regional
players is examined, as well as their ability to support a competitive natural gas market. In
Chapter 8 the framework for the creation of a regional gas hub is defined and the basic
parameters for the development of a regional gas trading hub are set out. The
aforementioned Chapter also includes a SWOT analysis of the operation of the gas hub.
Finally, Chapter 9 presents the economic implications from the operation of a natural gas
hub in South Eastern Europe and Chapter 10 provides a summary of the conclusions of the
Study.
THE OUTLOOK FOR A NATURAL GAS TRADING HUB IN SE EUROPE
20
2. EUROPEAN NATURAL GAS HUBS
2.1. INTRODUCTION
During the last decades, there have been important changes in the European natural gas
markets. European gas hubs are young and less developed compared to US gas hubs. The
Henry Hub in Louisiana sets the benchmark price for the entire North American trading area,
which is the most liquid gas market in the world. Currently, the European gas market is
characterized by long-term contractual arrangements with gas producers (often outside of
the EU), for the delivery of specific gas volumes at specified points on natural gas
transmission networks. Since deregulation in the mid-1990s and as a result of the gradual
opening of gas markets in several European countries, trading has started gaining ground
and spot markets have developed. However, long-term contracts are still the dominant
feature. The number of participants and traded volumes are increasing along with the
traditional OTC volumes.
The European Union promoted the establishment of virtual (regional) trading hubs in order
to achieve the integration of its natural gas markets. According to the old market regime the
ownership exchange of natural gas is arranged in a bilateral fashion between the buyer and
the supplier using long-term contracts. Market experience shows this market model will
gradually be replaced by wholesale markets where sellers and buyers make short to medium
- term deals through trading hubs. These deals now include futures, swaps, and even a few
options.
The new market model does not include the creation of a single European regulator. To the
contrary, its philosophy is to build on the existing contractual, regulatory and operational
arrangements of national TSOs and regulators and facilitate the efficient use of cross-border
capacity with transparent price formation, which will encourage greater participation in
trading and increase liquidity.
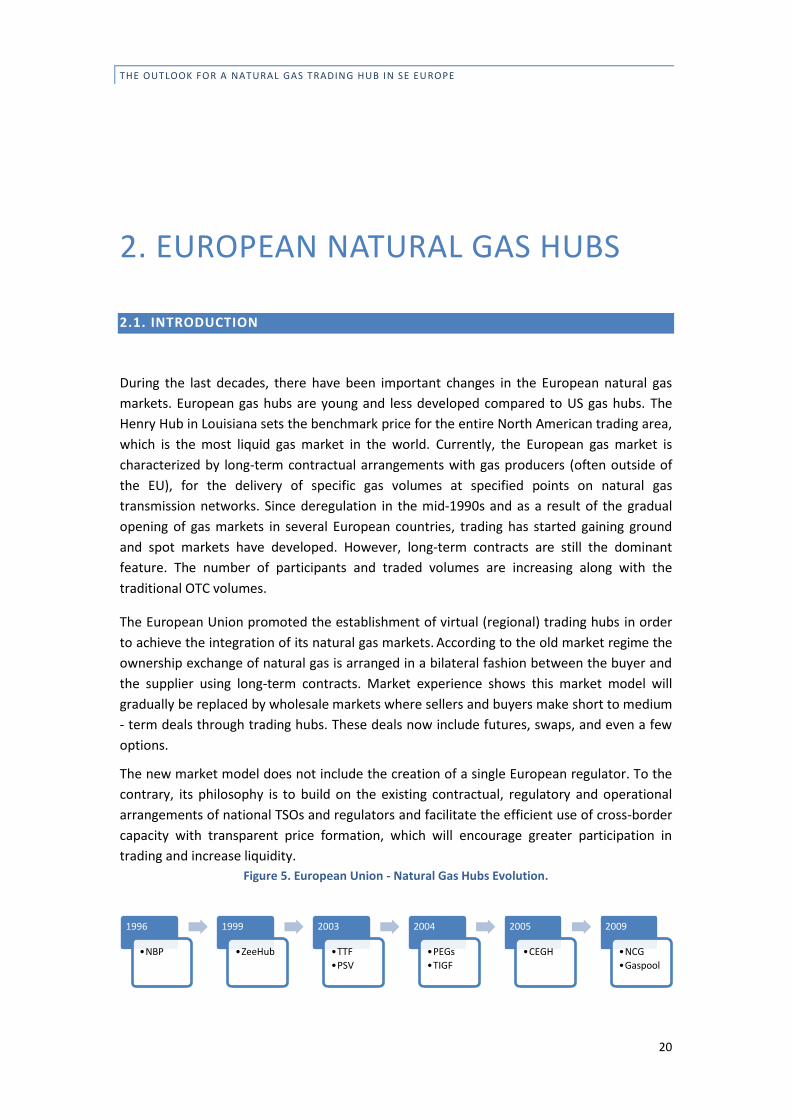
Figure 5. European Union - Natural Gas Hubs Evolution.
1996
•NBP
1999
•ZeeHub
2003
•TTF
•PSV
2004
•PEGs
•TIGF
2005
•CEGH
2009
•NCG
•Gaspool
THE OUTLOOK FOR A NATURAL GAS TRADING HUB IN SE EUROPE
21
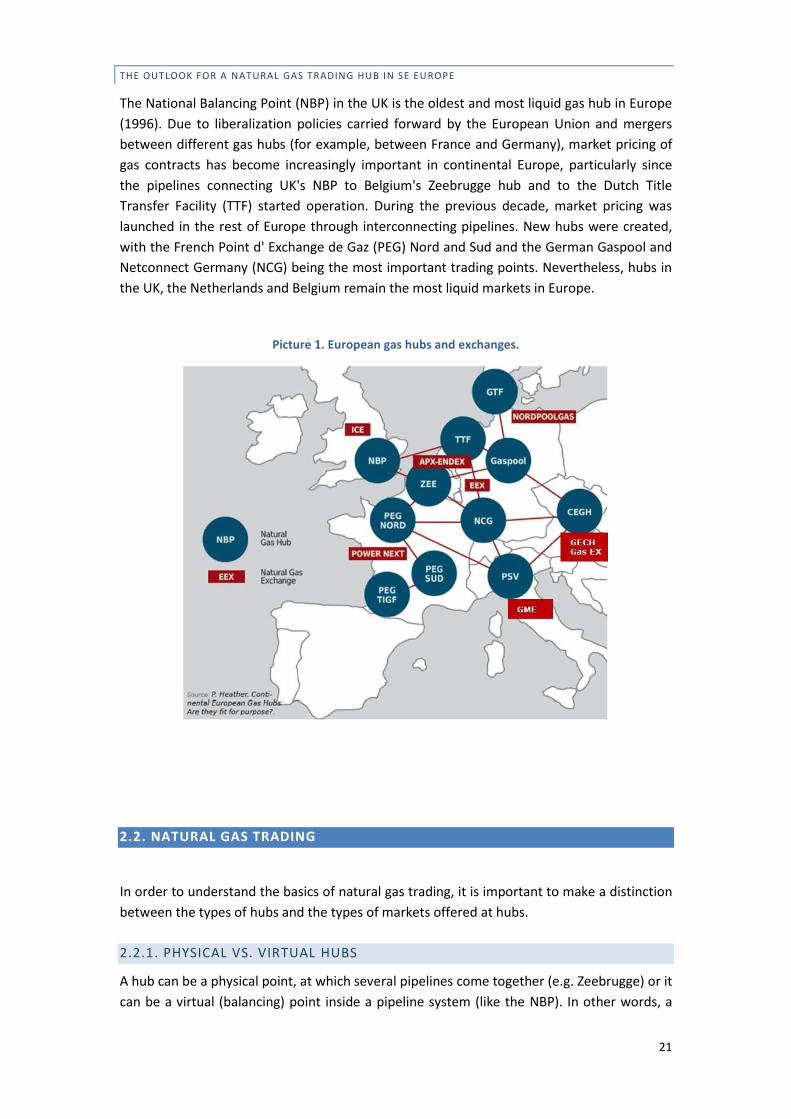
The National Balancing Point (NBP) in the UK is the oldest and most liquid gas hub in Europe
(1996). Due to liberalization policies carried forward by the European Union and mergers
between different gas hubs (for example, between France and Germany), market pricing of
gas contracts has become increasingly important in continental Europe, particularly since
the pipelines connecting UK's NBP to Belgium's Zeebrugge hub and to the Dutch Title
Transfer Facility (TTF) started operation. During the previous decade, market pricing was
launched in the rest of Europe through interconnecting pipelines. New hubs were created,
with the French Point d' Exchange de Gaz (PEG) Nord and Sud and the German Gaspool and
Netconnect Germany (NCG) being the most important trading points. Nevertheless, hubs in
the UK, the Netherlands and Belgium remain the most liquid markets in Europe.
Picture 1. European gas hubs and exchanges.
2.2. NATURAL GAS TRADING
In order to understand the basics of natural gas trading, it is important to make a distinction
between the types of hubs and the types of markets offered at hubs.
2.2.1. PHYSICAL VS. VIRTUAL HUBS
A hub can be a physical point, at which several pipelines come together (e.g. Zeebrugge) or it
can be a virtual (balancing) point inside a pipeline system (like the NBP). In other words, a
THE OUTLOOK FOR A NATURAL GAS TRADING HUB IN SE EUROPE
22
physical hub is an actual transit location or physical point where gas pipelines meet and
natural gas is traded. Physical hubs can serve as transit points for the transportation of
natural gas, as well as storage facilities. Nonetheless, a hub does not need to be a physical
intersection of pipelines.
A virtual hub is a trading platform for the financial transaction of natural gas, where a wide
number of participants have access. Physical hubs are implemented at a specific location
where natural gas must imperatively be transported to. However, in the case of virtual hubs,
the trading platform serves a trans-regional zone or an entire country. Therefore, the traded
gas can be injected into any point on a trans-regional or national grid regardless of the point
of extraction. The obvious advantage of virtual hubs is that all gas which has paid a fee for
access into the network can be traded, while at physical hubs, only gas physically passing at
a precise location can be traded and this entails higher risks.
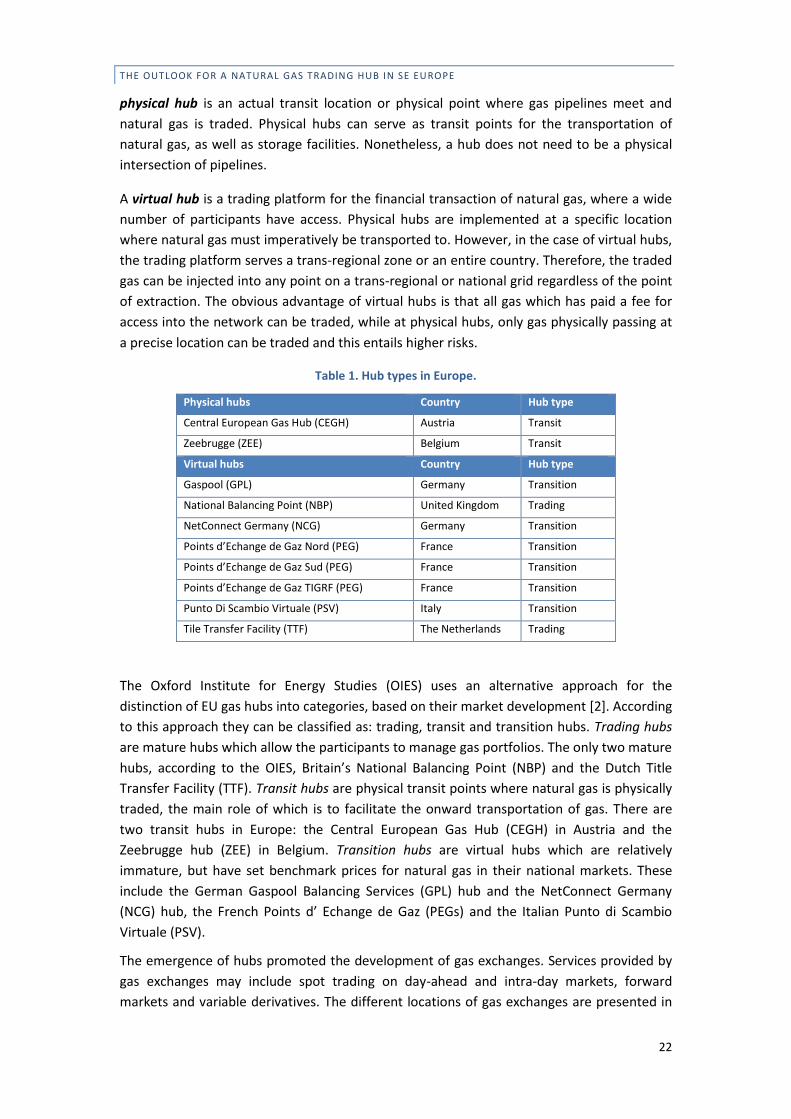
Table 1. Hub types in Europe.
Physical hubs Country Hub type
Central European Gas Hub (CEGH) Austria Transit
Zeebrugge (ZEE) Belgium Transit
Virtual hubs Country Hub type
Gaspool (GPL) Germany Transition
National Balancing Point (NBP) United Kingdom Trading
NetConnect Germany (NCG) Germany Transition
Points d’Echange de Gaz Nord (PEG) France Transition
Points d’Echange de Gaz Sud (PEG) France Transition
Points d’Echange de Gaz TIGRF (PEG) France Transition
Punto Di Scambio Virtuale (PSV) Italy Transition
Tile Transfer Facility (TTF) The Netherlands Trading
The Oxford Institute for Energy Studies (OIES) uses an alternative approach for the
distinction of EU gas hubs into categories, based on their market development [2]. According
to this approach they can be classified as: trading, transit and transition hubs. Trading hubs
are mature hubs which allow the participants to manage gas portfolios. The only two mature
hubs, according to the OIES, Britain’s National Balancing Point (NBP) and the Dutch Title
Transfer Facility (TTF). Transit hubs are physical transit points where natural gas is physically
traded, the main role of which is to facilitate the onward transportation of gas. There are
two transit hubs in Europe: the Central European Gas Hub (CEGH) in Austria and the
Zeebrugge hub (ZEE) in Belgium. Transition hubs are virtual hubs which are relatively
immature, but have set benchmark prices for natural gas in their national markets. These
include the German Gaspool Balancing Services (GPL) hub and the NetConnect Germany
(NCG) hub, the French Points d’ Echange de Gaz (PEGs) and the Italian Punto di Scambio
Virtuale (PSV).
The emergence of hubs promoted the development of gas exchanges. Services provided by
gas exchanges may include spot trading on day-ahead and intra-day markets, forward
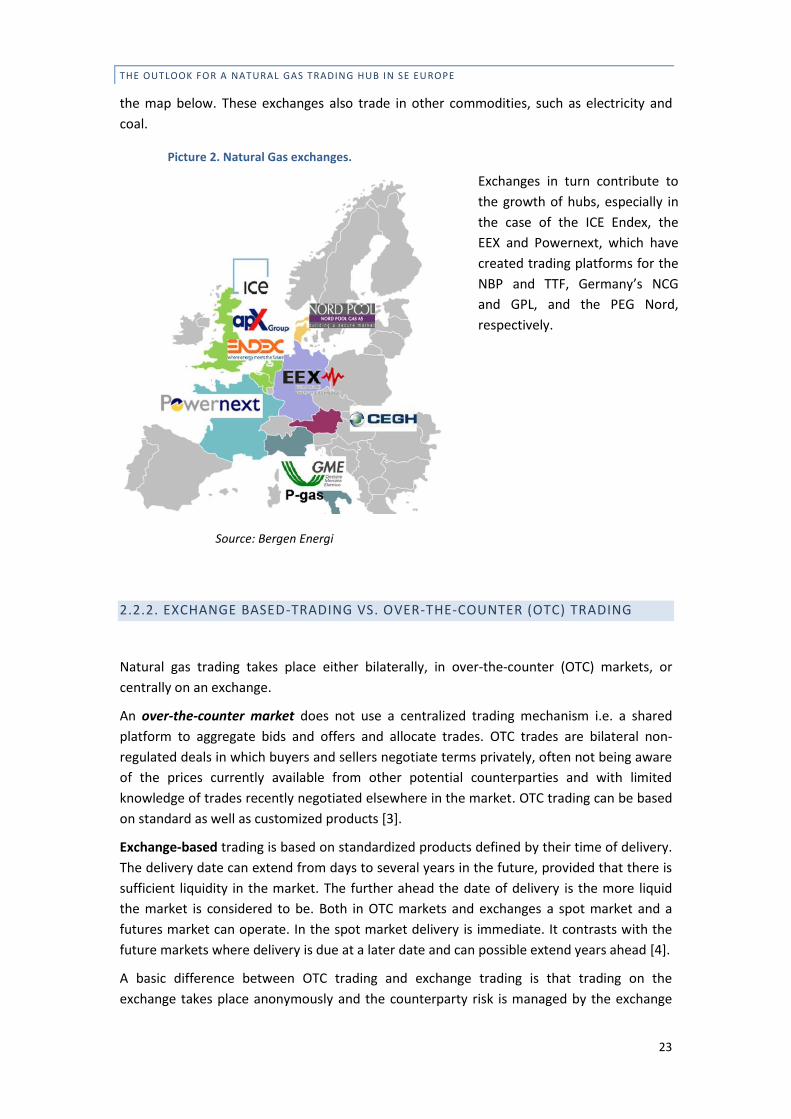
markets and variable derivatives. The different locations of gas exchanges are presented in
THE OUTLOOK FOR A NATURAL GAS TRADING HUB IN SE EUROPE
23
the map below. These exchanges also trade in other commodities, such as electricity and
coal.
Picture 2. Natural Gas exchanges.
Source: Bergen Energi
2.2.2. EXCHANGE BASED-TRADING VS. OVER-THE-COUNTER (OTC) TRADING
Natural gas trading takes place either bilaterally, in over‐the‐counter (OTC) markets, or
centrally on an exchange.
An over-the-counter market does not use a centralized trading mechanism i.e. a shared
platform to aggregate bids and offers and allocate trades. OTC trades are bilateral non-
regulated deals in which buyers and sellers negotiate terms privately, often not being aware
of the prices currently available from other potential counterparties and with limited
knowledge of trades recently negotiated elsewhere in the market. OTC trading can be based
on standard as well as customized products [3].
Exchange-based trading is based on standardized products defined by their time of delivery.
The delivery date can extend from days to several years in the future, provided that there is
sufficient liquidity in the market. The further ahead the date of delivery is the more liquid
the market is considered to be. Both in OTC markets and exchanges a spot market and a
futures market can operate. In the spot market delivery is immediate. It contrasts with the
future markets where delivery is due at a later date and can possible extend years ahead [4].
A basic difference between OTC trading and exchange trading is that trading on the
exchange takes place anonymously and the counterparty risk is managed by the exchange
Exchanges in turn contribute to
the growth of hubs, especially in
the case of the ICE Endex, the
EEX and Powernext, which have
created trading platforms for the
NBP and TTF, Germany’s NCG
and GPL, and the PEG Nord,
respectively.
THE OUTLOOK FOR A NATURAL GAS TRADING HUB IN SE EUROPE
24
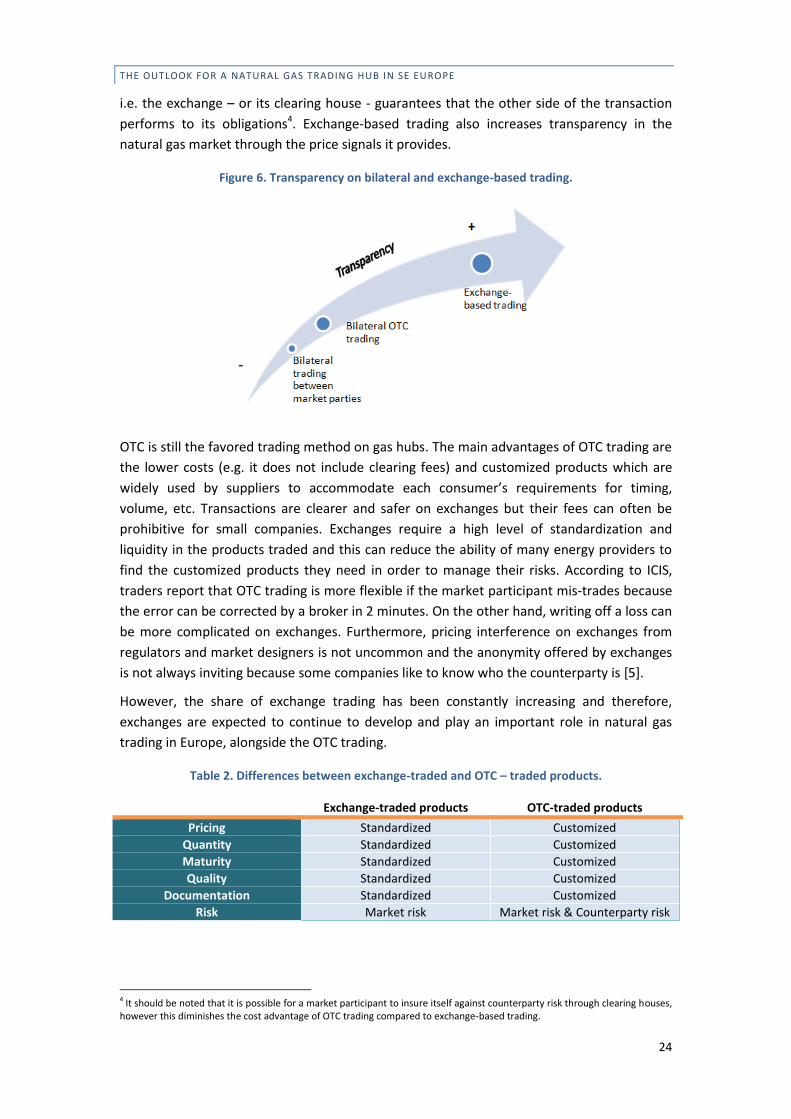
i.e. the exchange – or its clearing house - guarantees that the other side of the transaction
performs to its obligations4. Exchange-based trading also increases transparency in the
natural gas market through the price signals it provides.
Figure 6. Transparency on bilateral and exchange-based trading.
OTC is still the favored trading method on gas hubs. The main advantages of OTC trading are
the lower costs (e.g. it does not include clearing fees) and customized products which are
widely used by suppliers to accommodate each consumer’s requirements for timing,
volume, etc. Transactions are clearer and safer on exchanges but their fees can often be
prohibitive for small companies. Exchanges require a high level of standardization and
liquidity in the products traded and this can reduce the ability of many energy providers to
find the customized products they need in order to manage their risks. According to ICIS,
traders report that OTC trading is more flexible if the market participant mis-trades because
the error can be corrected by a broker in 2 minutes. On the other hand, writing off a loss can
be more complicated on exchanges. Furthermore, pricing interference on exchanges from
regulators and market designers is not uncommon and the anonymity offered by exchanges
is not always inviting because some companies like to know who the counterparty is [5].
However, the share of exchange trading has been constantly increasing and therefore,
exchanges are expected to continue to develop and play an important role in natural gas
trading in Europe, alongside the OTC trading.
Table 2. Differences between exchange-traded and OTC – traded products.
Exchange-traded products OTC-traded products
Pricing Standardized Customized
Quantity Standardized Customized
Maturity Standardized Customized
Quality Standardized Customized
Documentation Standardized Customized
Risk Market risk Market risk & Counterparty risk
4 It should be noted that it is possible for a market participant to insure itself against counterparty risk through clearing houses, however this diminishes the cost advantage of OTC trading compared to exchange-based trading.
THE OUTLOOK FOR A NATURAL GAS TRADING HUB IN SE EUROPE
25
2.3. NATURAL GAS HUBS OVERVIEW
European gas hubs offer a variety of contracts and services. In order to understand the
natural gas market in Europe well, it is necessary to analyze each hub individually.
2.3.1. NATIONAL BALANCING POINT (NBP)
The UK NBP gas market started operation in 1996 and is Europe’s longest-established
natural gas market and most liquid gas trading point. Pricing at this trading point is often
compared to Henry Hub5 in the U.S., which is the trading point for the New York Mercantile
Exchange (NYMEX) natural gas futures contracts. It is operated by the National Grid, the
transmissions system operator in the UK. However, the NBP is not an actual physical
location, but a virtual trading location. Trades at the NBP are made via the OCM (On-the-day
Commodity Market) trading system, a trading service managed by ICE-Endex to which offers
or requests for gas at a nominated price can be posted. ICE – Endex is the counterparty to
every trade in the OTC market and is responsible for nominating the trades to National Grid,
the British Transmission System Operator (TSO). In the prompt market companies need to
perform the nomination by themselves. Companies who have not become Shippers6 in order
to trade, can only trade NBP on the ICE futures. Today around 70% of the total trade
corresponds to Over-The-Counter volumes and the remaining 30% to ICE volumes [2].
The UK NBP price reflects the commodity price in the entire area, as there are no geographic
differentials. This occurs because transport costs are levied separately by the TSO i.e.
National Grid, the system operator for Britain’s gas National Transmission System (NTS), that
runs the British gas network and is regulated by the British energy regulator (Ofgem) [6]. The
NBP price acts as an indicator for Europe’s wholesale gas market, alongside the Dutch TTF.
With its four LNG terminals and established market, the NBP is also used as an indicator for
the European spot LNG market, something no other European hub is likely to achieve
currently.
The NBP was created by the Network Code in order to serve the balancing of the system as it
is detailed in the Code. The Network Code set out the rules and obligations for accessing the
British pipeline grid. On the NBP shippers are required to nominate quantities entering
and/or exiting the network, and not the transport route which the gas should physically
follow.
National Grid serves the role of balancing the system on a daily basis. It is the only gas hub of
this type, except for the TTF which was created on a similar basis [7].
Currently there are three connections between Britain and the EU:
The BBL (Balgzand Bacton Interconnector from Bacton in Norfolk to the Netherlands),
The Interconnector UK (from Bacton in Norfolk to Belgium),
5 The Henry Hub, owned by Sabine Pipe Line LLC, is a distribution hub at Erath in Louisiana that connects many intrastate and interstate pipelines. The settlement prices at this hub are used as benchmarks for the entire North American natural gas market. 6 Shippers are commercial players transporting gas in the transmission network.
THE OUTLOOK FOR A NATURAL GAS TRADING HUB IN SE EUROPE
26
The Irish Interconnectors (from Moffat in Scotland to Northern Ireland, the Republic
of Ireland and the Isle of Man).
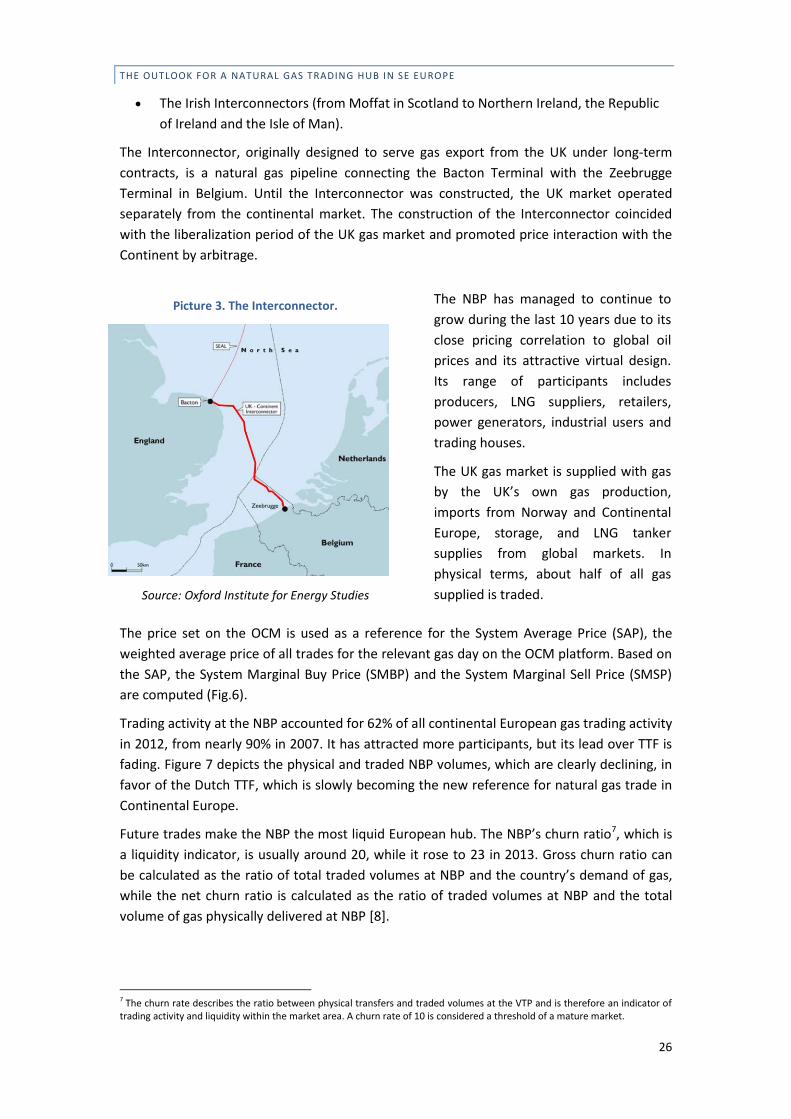
The Interconnector, originally designed to serve gas export from the UK under long-term
contracts, is a natural gas pipeline connecting the Bacton Terminal with the Zeebrugge
Terminal in Belgium. Until the Interconnector was constructed, the UK market operated
separately from the continental market. The construction of the Interconnector coincided
with the liberalization period of the UK gas market and promoted price interaction with the
Continent by arbitrage.
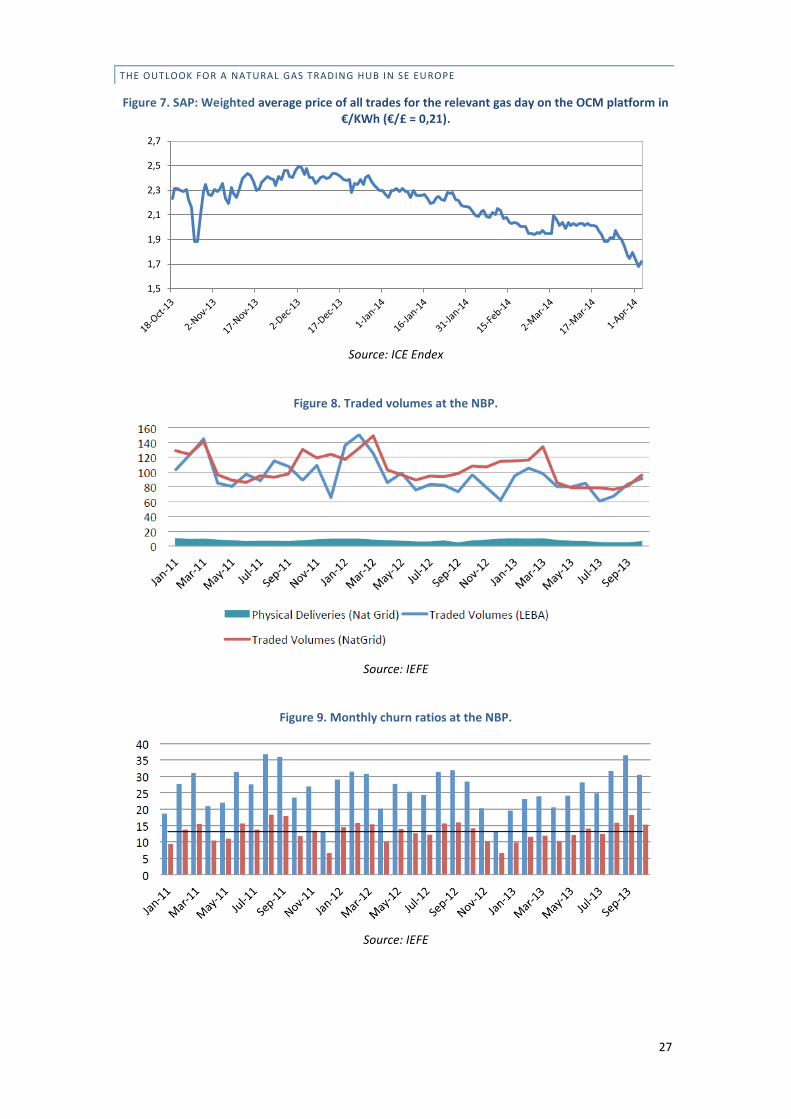
The price set on the OCM is used as a reference for the System Average Price (SAP), the
weighted average price of all trades for the relevant gas day on the OCM platform. Based on
the SAP, the System Marginal Buy Price (SMBP) and the System Marginal Sell Price (SMSP)
are computed (Fig.6).
Trading activity at the NBP accounted for 62% of all continental European gas trading activity
in 2012, from nearly 90% in 2007. It has attracted more participants, but its lead over TTF is
fading. Figure 7 depicts the physical and traded NBP volumes, which are clearly declining, in
favor of the Dutch TTF, which is slowly becoming the new reference for natural gas trade in
Continental Europe.
Future trades make the NBP the most liquid European hub. The NBP’s churn ratio7, which is
a liquidity indicator, is usually around 20, while it rose to 23 in 2013. Gross churn ratio can
be calculated as the ratio of total traded volumes at NBP and the country’s demand of gas,
while the net churn ratio is calculated as the ratio of traded volumes at NBP and the total
volume of gas physically delivered at NBP [8].
7 The churn rate describes the ratio between physical transfers and traded volumes at the VTP and is therefore an indicator of trading activity and liquidity within the market area. A churn rate of 10 is considered a threshold of a mature market.
The NBP has managed to continue to
grow during the last 10 years due to its
close pricing correlation to global oil
prices and its attractive virtual design.
Its range of participants includes
producers, LNG suppliers, retailers,
power generators, industrial users and
trading houses.
The UK gas market is supplied with gas
by the UK’s own gas production,
imports from Norway and Continental
Europe, storage, and LNG tanker
supplies from global markets. In
physical terms, about half of all gas
supplied is traded.
Picture 3. The Interconnector.
Source: Oxford Institute for Energy Studies
THE OUTLOOK FOR A NATURAL GAS TRADING HUB IN SE EUROPE
27
Figure 7. SAP: Weighted average price of all trades for the relevant gas day on the OCM platform in €/KWh (€/£ = 0,21).
Source: ICE Endex
Figure 8. Traded volumes at the NBP.
Source: IEFE
Figure 9. Monthly churn ratios at the NBP.
Source: IEFE
1,5
1,7
1,9
2,1
2,3
2,5
2,7
THE OUTLOOK FOR A NATURAL GAS TRADING HUB IN SE EUROPE
28
2.3.2. TITLE TRANSFER FACILITY (TTF)
The Title Transfer Facility (TTF) is a virtual marketplace established in 2003 by Gasunie
Transport Services (GTS), in order to facilitate trading in the Dutch natural gas market. With
the introduction of the new market model in 2011 the TTF became the central trading point
for all natural gas in the Dutch transmission system.
The TTF can serve as a virtual entry point that offers market parties the possibility to transfer
gas already present in the GTS system to another market player [9]. It was established in
2003 in order to promote gas trading in one market place and increase the liquidity of gas
trading. In TTF a shipper can choose a virtual entry and exit point or can choose not to use
TTF and thus, not pay a fee.
The new balancing regime introduced in April 2011 renders shippers responsible for keeping
their portfolios balanced through buying and selling gas on the TTF. The balancing regime
change has therefore contributed in establishing “market based balancing”. If there are not
adequate gas quantities in the network, incentives are given to the shippers to offer
operational flexibility. In particular, shippers manage their portfolio balance with regard to
the GTS grid balance. A system imbalance appears when the System Balance Signal
published by GTS deviates from zero, which means that there is either a positive or a
negative imbalance. Imbalances are classified into four zones: dark green, light green,
orange and red zone. Shippers have to keep the system price signal on the green zone.
Should the signal leave the dark green zone, a correction mechanism known as the Bid Price
Ladder mechanism, is put into effect and GTS will buy or sell gas depending on whether
there is a shortfall or an excess of gas [8]. This mechanism provides increased availability of
market information to shippers.
This Dutch gas trading exchange has greatly expanded over the last few years and is now the
biggest hub in Continental Europe in terms of traded volume. According to the GTS, the
amount of gas traded is more than 14 times the amount of gas consumed in the
Netherlands. As a result of its expansion, the gas price of the Dutch wholesale platform has
become an important indicator for the European wholesale gas market. Physical short-term
gas and gas futures contracts are traded and handled by ICE ENDEX.
TTF's location between Germany, France and the North Sea coast enables it to transfer gas
from Norway to the German and French markets. The TTF is also connected to Britain's NBP
hub. Additionally, the new Dutch liquefied natural gas (LNG) terminal, opened in 2011, gives
TTF direct access to the global LNG market, an advantage that Germany and Austria both
lack.
ICE Endex provides the platform for spot trading at the TTF. The TTF Spot Within-Day and
Day-Ahead are tradable spot instruments offered at the ICE Endex platform. The TTF Within-
Day Index is a volume-weighted average price of all orders which are executed and delivered
on the same gas day on TTF, while the Day-Ahead Index (see Fig. 9) is a volume-weighted
average price of all orders which are executed on the gas day preceeding the day of delivery
[10].
Fig. 11 shows the development of monthly volumes of the last five years at the TTF (January
2009 – December 2013). November 2013 saw TTF volumes reach their highest levels since
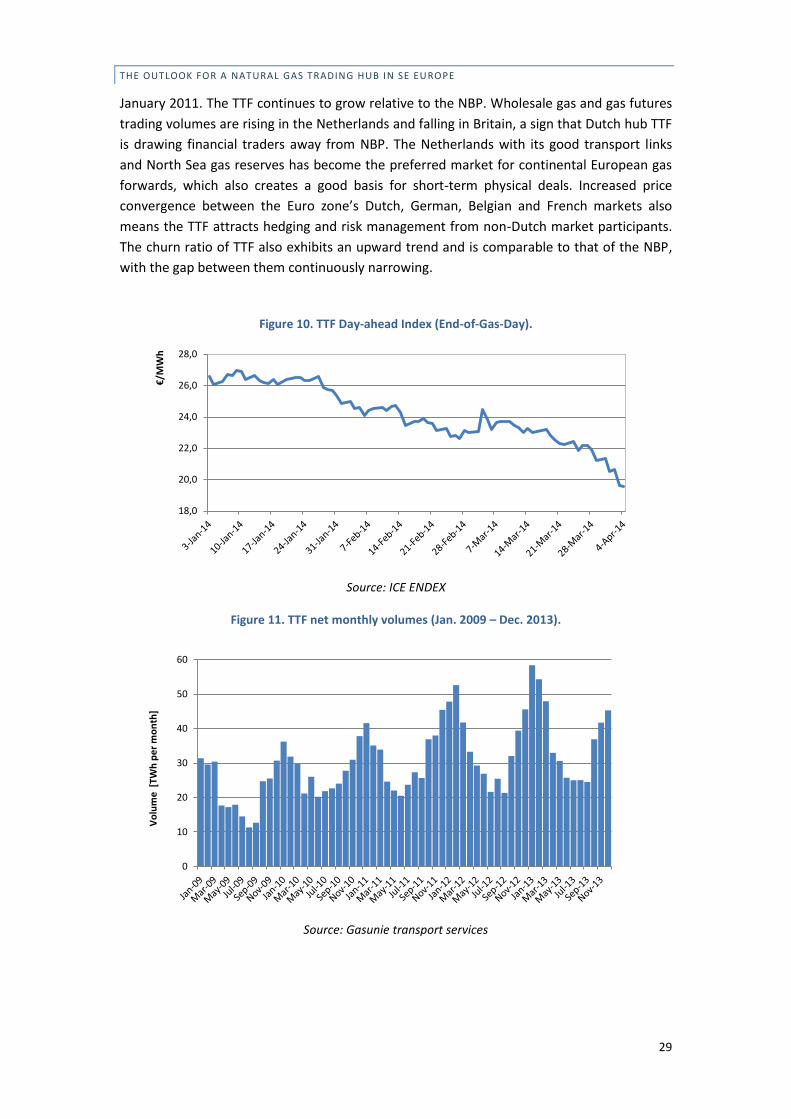
THE OUTLOOK FOR A NATURAL GAS TRADING HUB IN SE EUROPE
29
January 2011. The TTF continues to grow relative to the NBP. Wholesale gas and gas futures
trading volumes are rising in the Netherlands and falling in Britain, a sign that Dutch hub TTF
is drawing financial traders away from NBP. The Netherlands with its good transport links
and North Sea gas reserves has become the preferred market for continental European gas
forwards, which also creates a good basis for short-term physical deals. Increased price
convergence between the Euro zone’s Dutch, German, Belgian and French markets also
means the TTF attracts hedging and risk management from non-Dutch market participants.
The churn ratio of TTF also exhibits an upward trend and is comparable to that of the NBP,
with the gap between them continuously narrowing.
Figure 10. TTF Day-ahead Index (End-of-Gas-Day).
Source: ICE ENDEX
Figure 11. TTF net monthly volumes (Jan. 2009 – Dec. 2013).
Source: Gasunie transport services
18,0
20,0
22,0
24,0
26,0
28,0
€/M
Wh
0
10
20
30
40
50
60
Vo
lum
e [
TWh
pe
r m
on
th]
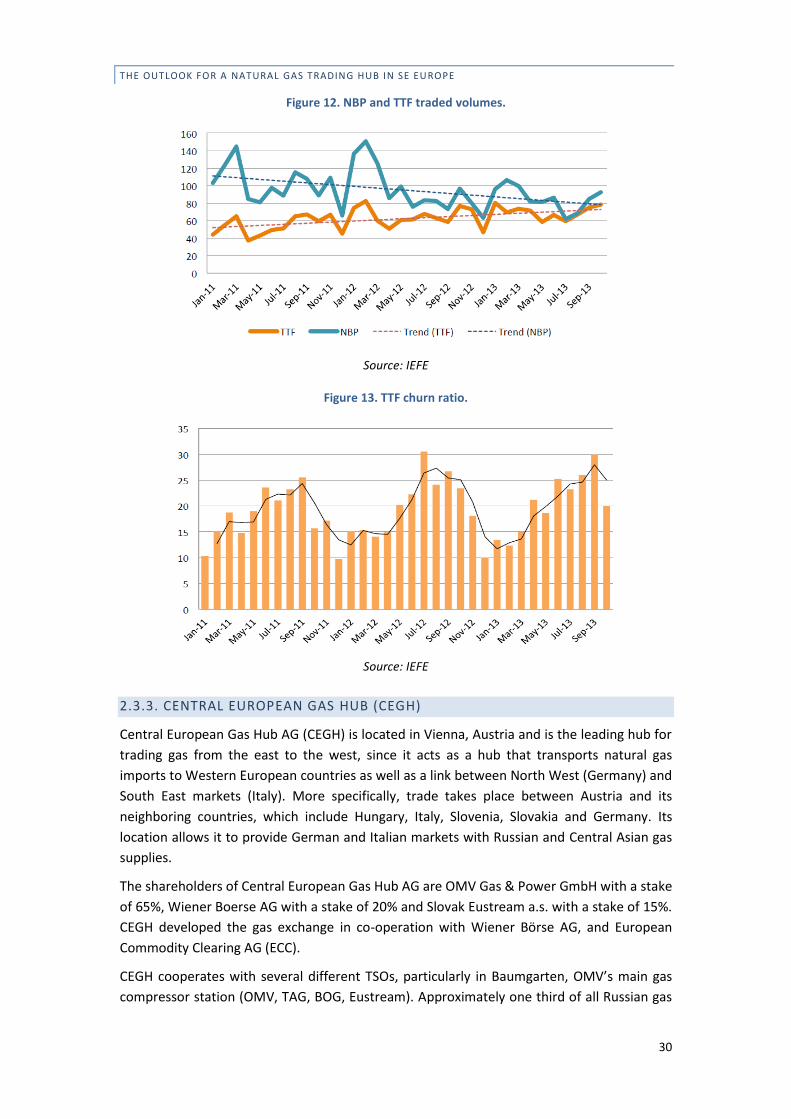
THE OUTLOOK FOR A NATURAL GAS TRADING HUB IN SE EUROPE
30
Figure 12. NBP and TTF traded volumes.
Source: IEFE
Figure 13. TTF churn ratio.
Source: IEFE
2.3.3. CENTRAL EUROPEAN GAS HUB (CEGH)
Central European Gas Hub AG (CEGH) is located in Vienna, Austria and is the leading hub for
trading gas from the east to the west, since it acts as a hub that transports natural gas
imports to Western European countries as well as a link between North West (Germany) and
South East markets (Italy). More specifically, trade takes place between Austria and its
neighboring countries, which include Hungary, Italy, Slovenia, Slovakia and Germany. Its
location allows it to provide German and Italian markets with Russian and Central Asian gas
supplies.
The shareholders of Central European Gas Hub AG are OMV Gas & Power GmbH with a stake
of 65%, Wiener Boerse AG with a stake of 20% and Slovak Eustream a.s. with a stake of 15%.
CEGH developed the gas exchange in co-operation with Wiener Börse AG, and European
Commodity Clearing AG (ECC).
CEGH cooperates with several different TSOs, particularly in Baumgarten, OMV’s main gas
compressor station (OMV, TAG, BOG, Eustream). Approximately one third of all Russian gas
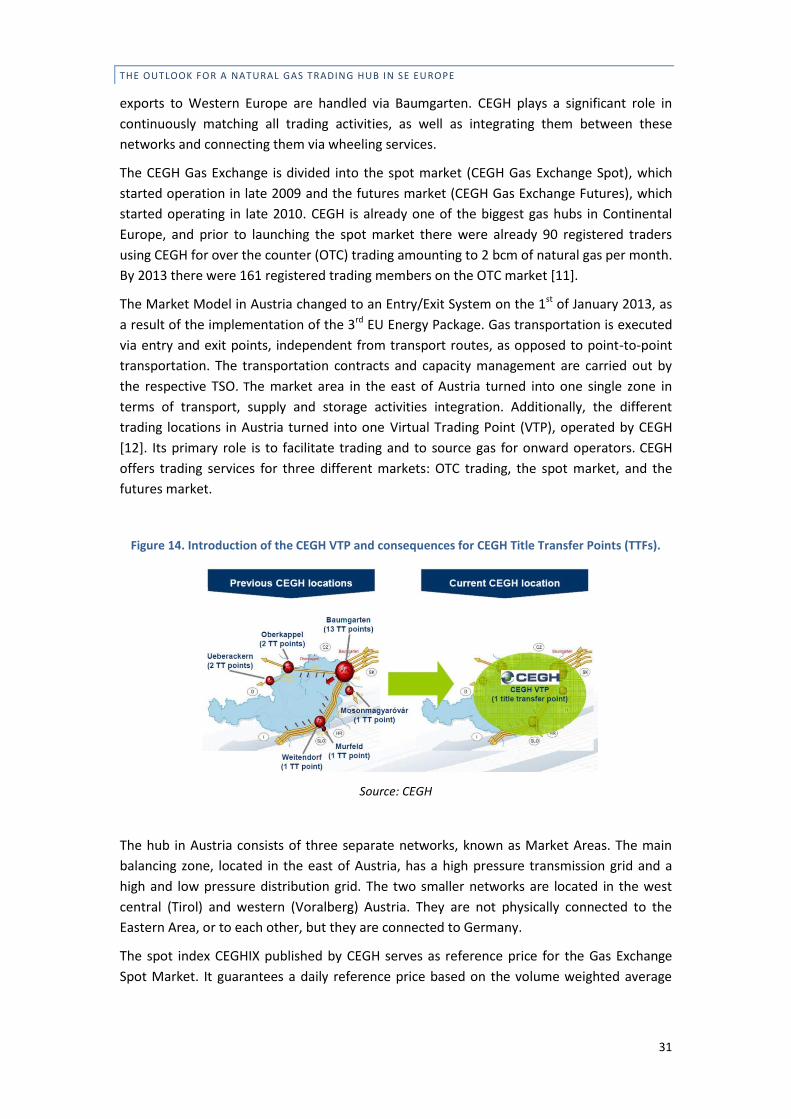
THE OUTLOOK FOR A NATURAL GAS TRADING HUB IN SE EUROPE
31
exports to Western Europe are handled via Baumgarten. CEGH plays a significant role in
continuously matching all trading activities, as well as integrating them between these
networks and connecting them via wheeling services.
The CEGH Gas Exchange is divided into the spot market (CEGH Gas Exchange Spot), which
started operation in late 2009 and the futures market (CEGH Gas Exchange Futures), which
started operating in late 2010. CEGH is already one of the biggest gas hubs in Continental
Europe, and prior to launching the spot market there were already 90 registered traders
using CEGH for over the counter (OTC) trading amounting to 2 bcm of natural gas per month.
By 2013 there were 161 registered trading members on the OTC market [11].
The Market Model in Austria changed to an Entry/Exit System on the 1st of January 2013, as
a result of the implementation of the 3rd EU Energy Package. Gas transportation is executed
via entry and exit points, independent from transport routes, as opposed to point-to-point
transportation. The transportation contracts and capacity management are carried out by
the respective TSO. The market area in the east of Austria turned into one single zone in
terms of transport, supply and storage activities integration. Additionally, the different
trading locations in Austria turned into one Virtual Trading Point (VTP), operated by CEGH
[12]. Its primary role is to facilitate trading and to source gas for onward operators. CEGH
offers trading services for three different markets: OTC trading, the spot market, and the
futures market.
Figure 14. Introduction of the CEGH VTP and consequences for CEGH Title Transfer Points (TTFs).
Source: CEGH
The hub in Austria consists of three separate networks, known as Market Areas. The main
balancing zone, located in the east of Austria, has a high pressure transmission grid and a
high and low pressure distribution grid. The two smaller networks are located in the west
central (Tirol) and western (Voralberg) Austria. They are not physically connected to the
Eastern Area, or to each other, but they are connected to Germany.
The spot index CEGHIX published by CEGH serves as reference price for the Gas Exchange
Spot Market. It guarantees a daily reference price based on the volume weighted average
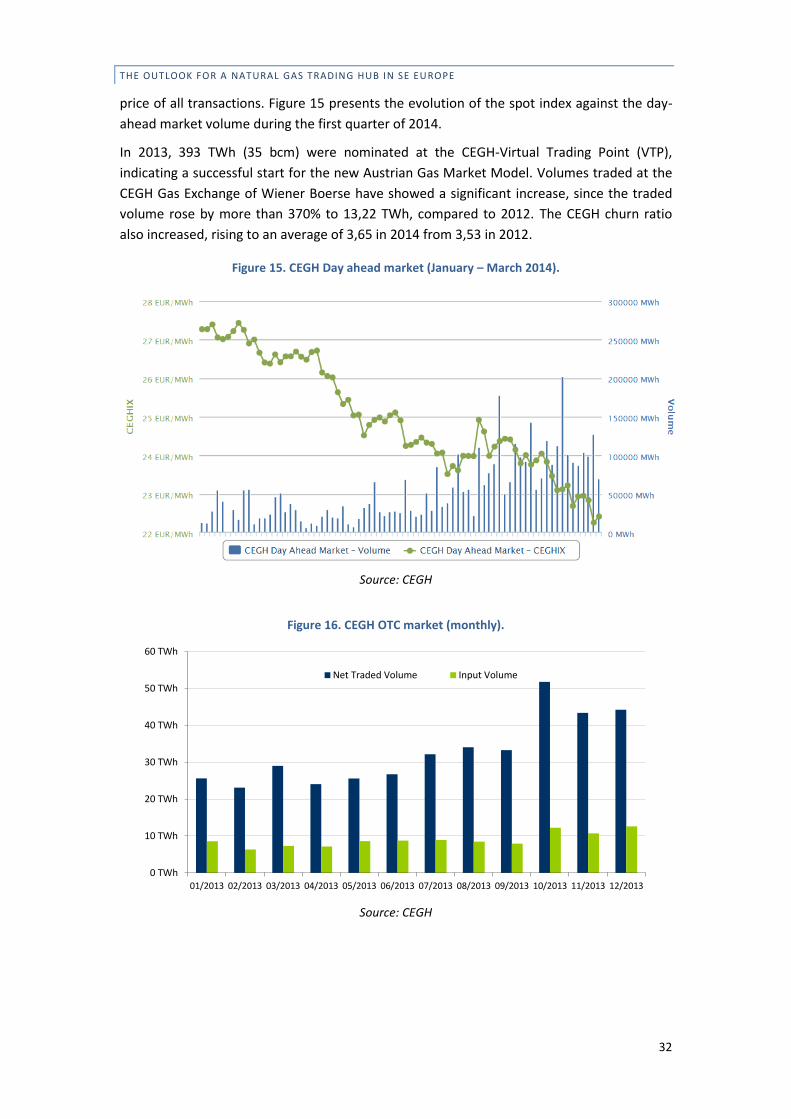
THE OUTLOOK FOR A NATURAL GAS TRADING HUB IN SE EUROPE
32
price of all transactions. Figure 15 presents the evolution of the spot index against the day-
ahead market volume during the first quarter of 2014.
In 2013, 393 TWh (35 bcm) were nominated at the CEGH-Virtual Trading Point (VTP),
indicating a successful start for the new Austrian Gas Market Model. Volumes traded at the
CEGH Gas Exchange of Wiener Boerse have showed a significant increase, since the traded
volume rose by more than 370% to 13,22 TWh, compared to 2012. The CEGH churn ratio
also increased, rising to an average of 3,65 in 2014 from 3,53 in 2012.
Figure 15. CEGH Day ahead market (January – March 2014).
Source: CEGH
Figure 16. CEGH OTC market (monthly).
Source: CEGH
0 TWh
10 TWh
20 TWh
30 TWh
40 TWh
50 TWh
60 TWh
01/2013 02/2013 03/2013 04/2013 05/2013 06/2013 07/2013 08/2013 09/2013 10/2013 11/2013 12/2013
Net Traded Volume Input Volume
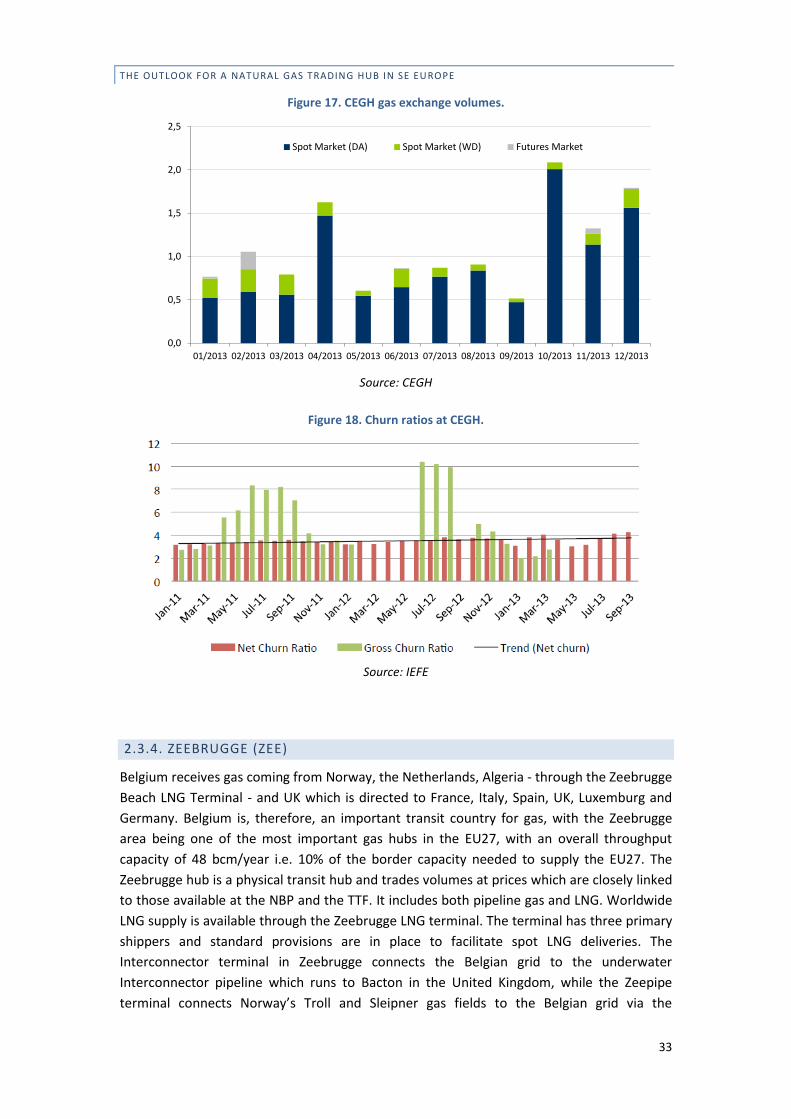
THE OUTLOOK FOR A NATURAL GAS TRADING HUB IN SE EUROPE
33
Figure 17. CEGH gas exchange volumes.
Source: CEGH
Figure 18. Churn ratios at CEGH.
Source: IEFE
2.3.4. ZEEBRUGGE (ZEE)
Belgium receives gas coming from Norway, the Netherlands, Algeria - through the Zeebrugge
Beach LNG Terminal - and UK which is directed to France, Italy, Spain, UK, Luxemburg and
Germany. Belgium is, therefore, an important transit country for gas, with the Zeebrugge
area being one of the most important gas hubs in the EU27, with an overall throughput
capacity of 48 bcm/year i.e. 10% of the border capacity needed to supply the EU27. The
Zeebrugge hub is a physical transit hub and trades volumes at prices which are closely linked
to those available at the NBP and the TTF. It includes both pipeline gas and LNG. Worldwide
LNG supply is available through the Zeebrugge LNG terminal. The terminal has three primary
shippers and standard provisions are in place to facilitate spot LNG deliveries. The
Interconnector terminal in Zeebrugge connects the Belgian grid to the underwater
Interconnector pipeline which runs to Bacton in the United Kingdom, while the Zeepipe
terminal connects Norway’s Troll and Sleipner gas fields to the Belgian grid via the
0,0
0,5
1,0
1,5
2,0
2,5
01/2013 02/2013 03/2013 04/2013 05/2013 06/2013 07/2013 08/2013 09/2013 10/2013 11/2013 12/2013
Spot Market (DA) Spot Market (WD) Futures Market
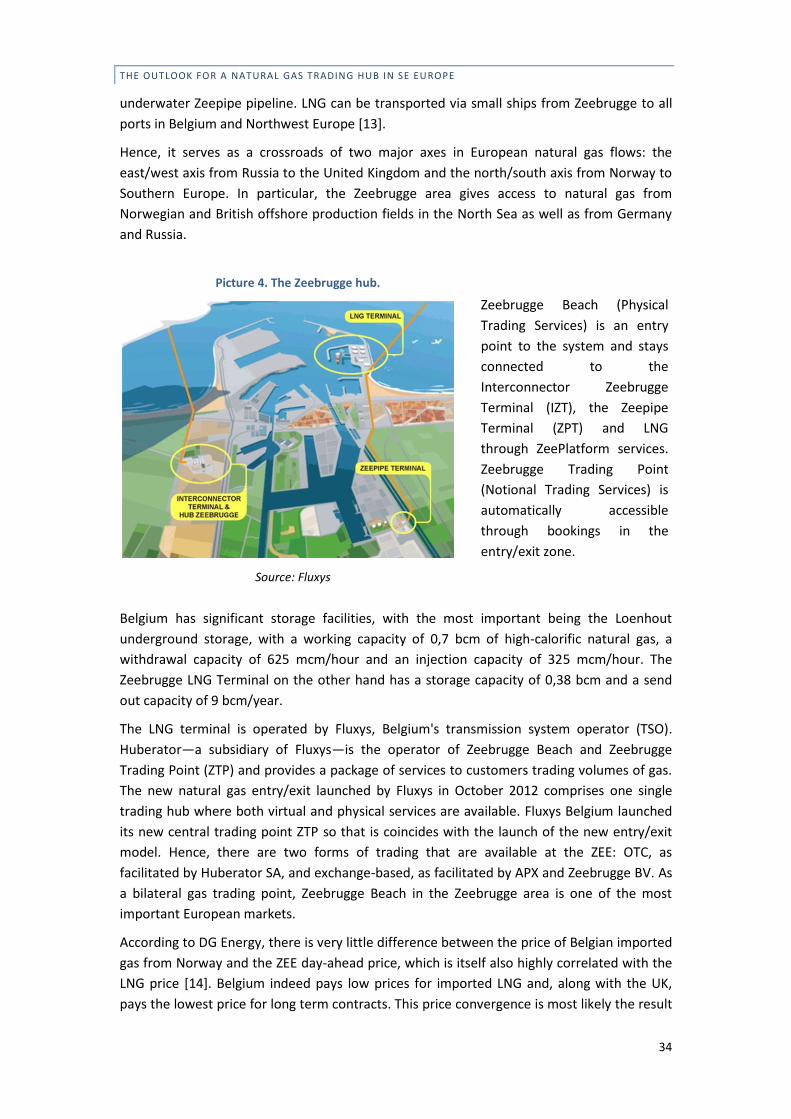
THE OUTLOOK FOR A NATURAL GAS TRADING HUB IN SE EUROPE
34
underwater Zeepipe pipeline. LNG can be transported via small ships from Zeebrugge to all
ports in Belgium and Northwest Europe [13].
Hence, it serves as a crossroads of two major axes in European natural gas flows: the
east/west axis from Russia to the United Kingdom and the north/south axis from Norway to
Southern Europe. In particular, the Zeebrugge area gives access to natural gas from
Norwegian and British offshore production fields in the North Sea as well as from Germany
and Russia.
Picture 4. The Zeebrugge hub.
Source: Fluxys
Belgium has significant storage facilities, with the most important being the Loenhout
underground storage, with a working capacity of 0,7 bcm of high-calorific natural gas, a
withdrawal capacity of 625 mcm/hour and an injection capacity of 325 mcm/hour. The
Zeebrugge LNG Terminal on the other hand has a storage capacity of 0,38 bcm and a send
out capacity of 9 bcm/year.
The LNG terminal is operated by Fluxys, Belgium's transmission system operator (TSO).
Huberator—a subsidiary of Fluxys—is the operator of Zeebrugge Beach and Zeebrugge
Trading Point (ZTP) and provides a package of services to customers trading volumes of gas.
The new natural gas entry/exit launched by Fluxys in October 2012 comprises one single
trading hub where both virtual and physical services are available. Fluxys Belgium launched
its new central trading point ZTP so that is coincides with the launch of the new entry/exit
model. Hence, there are two forms of trading that are available at the ZEE: OTC, as
facilitated by Huberator SA, and exchange-based, as facilitated by APX and Zeebrugge BV. As
a bilateral gas trading point, Zeebrugge Beach in the Zeebrugge area is one of the most
important European markets.
According to DG Energy, there is very little difference between the price of Belgian imported
gas from Norway and the ZEE day-ahead price, which is itself also highly correlated with the
LNG price [14]. Belgium indeed pays low prices for imported LNG and, along with the UK,
pays the lowest price for long term contracts. This price convergence is most likely the result
Zeebrugge Beach (Physical
Trading Services) is an entry
point to the system and stays
connected to the
Interconnector Zeebrugge
Terminal (IZT), the Zeepipe
Terminal (ZPT) and LNG
through ZeePlatform services.
Zeebrugge Trading Point
(Notional Trading Services) is
automatically accessible
through bookings in the
entry/exit zone.
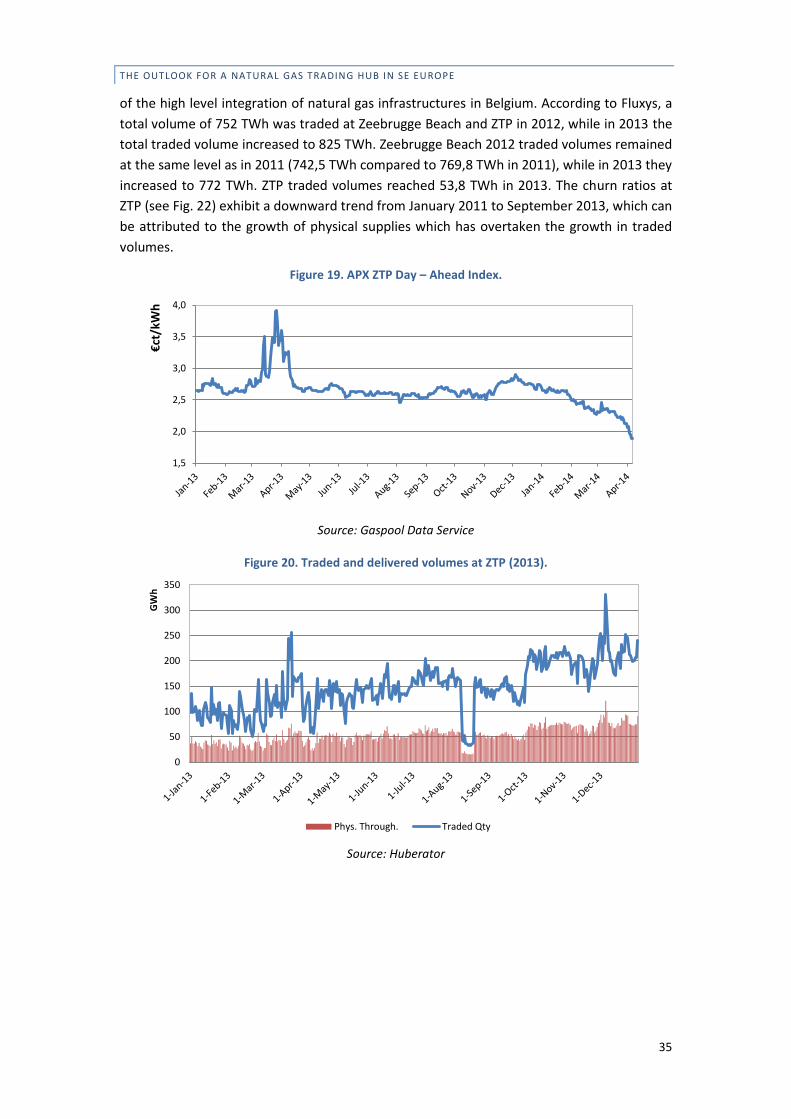
THE OUTLOOK FOR A NATURAL GAS TRADING HUB IN SE EUROPE
35
of the high level integration of natural gas infrastructures in Belgium. According to Fluxys, a
total volume of 752 TWh was traded at Zeebrugge Beach and ZTP in 2012, while in 2013 the
total traded volume increased to 825 TWh. Zeebrugge Beach 2012 traded volumes remained
at the same level as in 2011 (742,5 TWh compared to 769,8 TWh in 2011), while in 2013 they
increased to 772 TWh. ZTP traded volumes reached 53,8 TWh in 2013. The churn ratios at
ZTP (see Fig. 22) exhibit a downward trend from January 2011 to September 2013, which can
be attributed to the growth of physical supplies which has overtaken the growth in traded
volumes.
Figure 19. APX ZTP Day – Ahead Index.
Source: Gaspool Data Service
Figure 20. Traded and delivered volumes at ZTP (2013).
Source: Huberator
1,5
2,0
2,5
3,0
3,5
4,0
€ct
/kW
h
0
50
100
150
200
250
300
350
GW
h
Phys. Through. Traded Qty
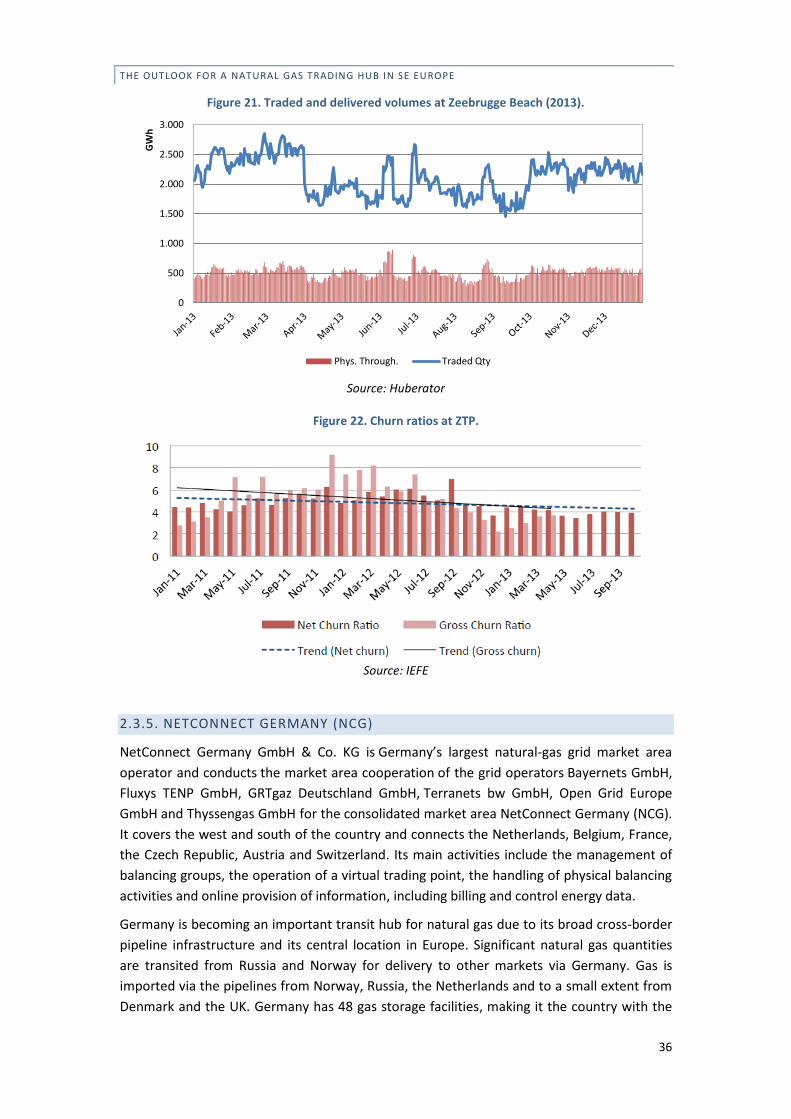
THE OUTLOOK FOR A NATURAL GAS TRADING HUB IN SE EUROPE
36
Figure 21. Traded and delivered volumes at Zeebrugge Beach (2013).
Source: Huberator
Figure 22. Churn ratios at ZTP.
Source: IEFE
2.3.5. NETCONNECT GERMANY (NCG)
NetConnect Germany GmbH & Co. KG is Germany’s largest natural-gas grid market area
operator and conducts the market area cooperation of the grid operators Bayernets GmbH,
Fluxys TENP GmbH, GRTgaz Deutschland GmbH, Terranets bw GmbH, Open Grid Europe
GmbH and Thyssengas GmbH for the consolidated market area NetConnect Germany (NCG).
It covers the west and south of the country and connects the Netherlands, Belgium, France,
the Czech Republic, Austria and Switzerland. Its main activities include the management of
balancing groups, the operation of a virtual trading point, the handling of physical balancing
activities and online provision of information, including billing and control energy data.
Germany is becoming an important transit hub for natural gas due to its broad cross-border
pipeline infrastructure and its central location in Europe. Significant natural gas quantities
are transited from Russia and Norway for delivery to other markets via Germany. Gas is
imported via the pipelines from Norway, Russia, the Netherlands and to a small extent from
Denmark and the UK. Germany has 48 gas storage facilities, making it the country with the
0
500
1.000
1.500
2.000
2.500
3.000
GW
h
Phys. Through. Traded Qty
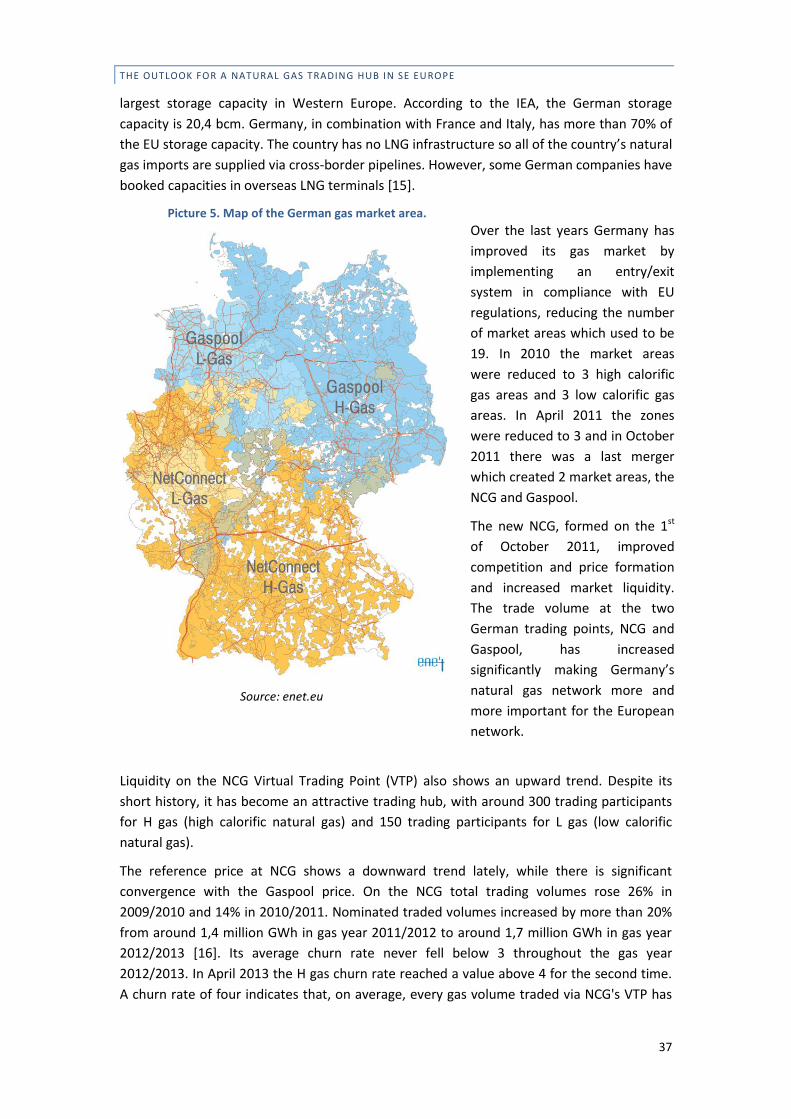
THE OUTLOOK FOR A NATURAL GAS TRADING HUB IN SE EUROPE
37
largest storage capacity in Western Europe. According to the IEA, the German storage
capacity is 20,4 bcm. Germany, in combination with France and Italy, has more than 70% of
the EU storage capacity. The country has no LNG infrastructure so all of the country’s natural
gas imports are supplied via cross-border pipelines. However, some German companies have
booked capacities in overseas LNG terminals [15].
Picture 5. Map of the German gas market area.
Source: enet.eu
Liquidity on the NCG Virtual Trading Point (VTP) also shows an upward trend. Despite its
short history, it has become an attractive trading hub, with around 300 trading participants
for H gas (high calorific natural gas) and 150 trading participants for L gas (low calorific
natural gas).
The reference price at NCG shows a downward trend lately, while there is significant
convergence with the Gaspool price. On the NCG total trading volumes rose 26% in
2009/2010 and 14% in 2010/2011. Nominated traded volumes increased by more than 20%
from around 1,4 million GWh in gas year 2011/2012 to around 1,7 million GWh in gas year
2012/2013 [16]. Its average churn rate never fell below 3 throughout the gas year
2012/2013. In April 2013 the H gas churn rate reached a value above 4 for the second time.
A churn rate of four indicates that, on average, every gas volume traded via NCG's VTP has
Over the last years Germany has
improved its gas market by
implementing an entry/exit
system in compliance with EU
regulations, reducing the number
of market areas which used to be
19. In 2010 the market areas
were reduced to 3 high calorific
gas areas and 3 low calorific gas
areas. In April 2011 the zones
were reduced to 3 and in October
2011 there was a last merger
which created 2 market areas, the
NCG and Gaspool.
The new NCG, formed on the 1st
of October 2011, improved
competition and price formation
and increased market liquidity.
The trade volume at the two
German trading points, NCG and
Gaspool, has increased
significantly making Germany’s
natural gas network more and
more important for the European
network.
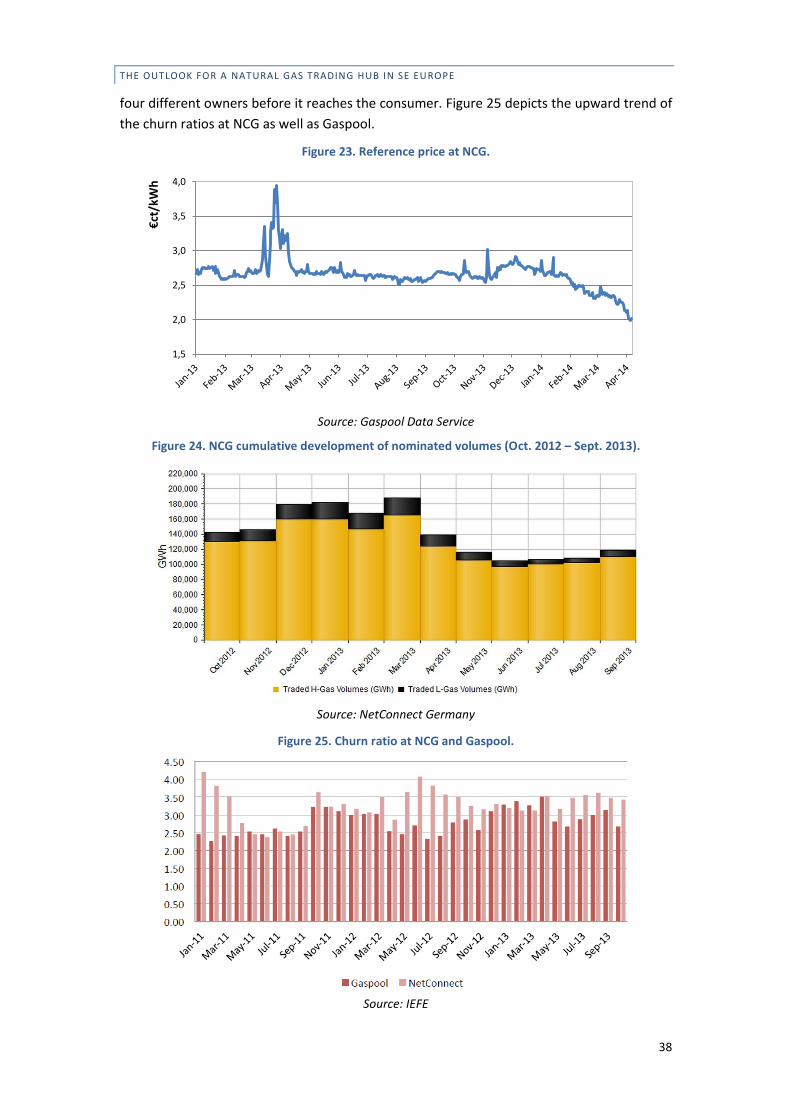
THE OUTLOOK FOR A NATURAL GAS TRADING HUB IN SE EUROPE
38
four different owners before it reaches the consumer. Figure 25 depicts the upward trend of
the churn ratios at NCG as well as Gaspool.
Figure 23. Reference price at NCG.
Source: Gaspool Data Service
Figure 24. NCG cumulative development of nominated volumes (Oct. 2012 – Sept. 2013).
Source: NetConnect Germany
Figure 25. Churn ratio at NCG and Gaspool.
Source: IEFE
1,5
2,0
2,5
3,0
3,5
4,0
€ct
/kW
h
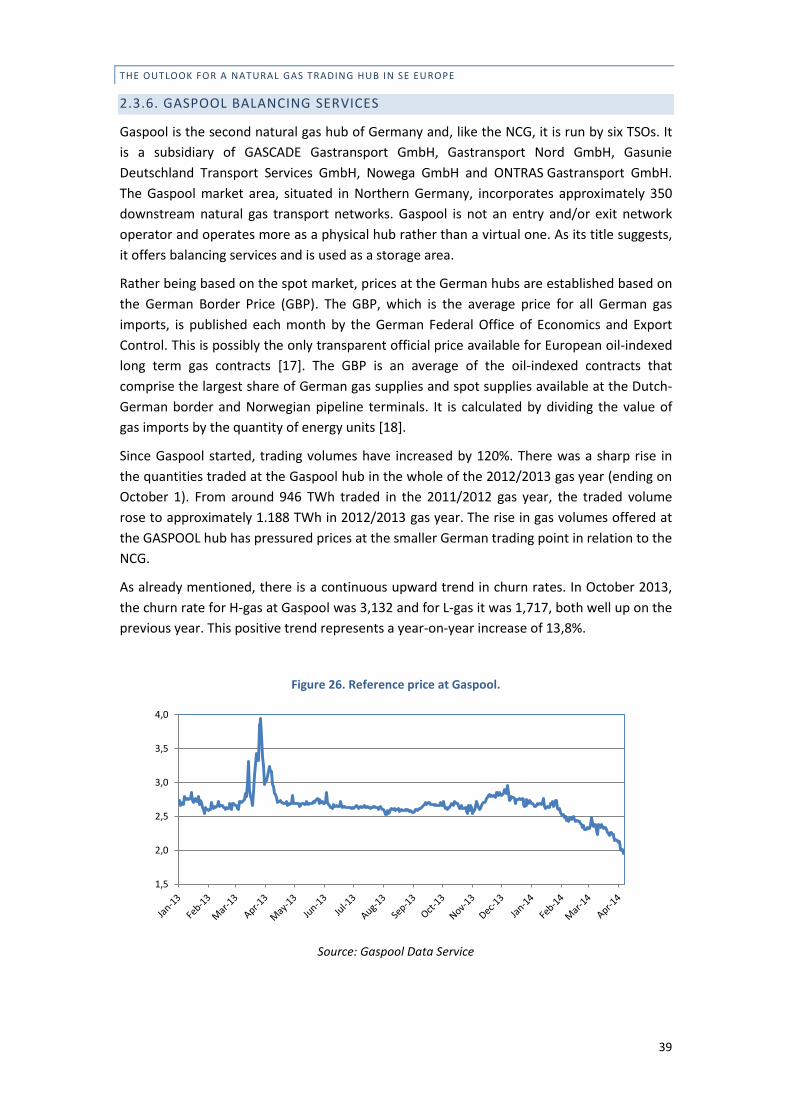
THE OUTLOOK FOR A NATURAL GAS TRADING HUB IN SE EUROPE
39
2.3.6. GASPOOL BALANCING SERVICES
Gaspool is the second natural gas hub of Germany and, like the NCG, it is run by six TSOs. It
is a subsidiary of GASCADE Gastransport GmbH, Gastransport Nord GmbH, Gasunie
Deutschland Transport Services GmbH, Nowega GmbH and ONTRAS Gastransport GmbH.
The Gaspool market area, situated in Northern Germany, incorporates approximately 350
downstream natural gas transport networks. Gaspool is not an entry and/or exit network
operator and operates more as a physical hub rather than a virtual one. As its title suggests,
it offers balancing services and is used as a storage area.
Rather being based on the spot market, prices at the German hubs are established based on
the German Border Price (GBP). The GBP, which is the average price for all German gas
imports, is published each month by the German Federal Office of Economics and Export
Control. This is possibly the only transparent official price available for European oil-indexed
long term gas contracts [17]. The GBP is an average of the oil-indexed contracts that
comprise the largest share of German gas supplies and spot supplies available at the Dutch-
German border and Norwegian pipeline terminals. It is calculated by dividing the value of
gas imports by the quantity of energy units [18].
Since Gaspool started, trading volumes have increased by 120%. There was a sharp rise in
the quantities traded at the Gaspool hub in the whole of the 2012/2013 gas year (ending on
October 1). From around 946 TWh traded in the 2011/2012 gas year, the traded volume
rose to approximately 1.188 TWh in 2012/2013 gas year. The rise in gas volumes offered at
the GASPOOL hub has pressured prices at the smaller German trading point in relation to the
NCG.
As already mentioned, there is a continuous upward trend in churn rates. In October 2013,
the churn rate for H-gas at Gaspool was 3,132 and for L-gas it was 1,717, both well up on the
previous year. This positive trend represents a year-on-year increase of 13,8%.
Figure 26. Reference price at Gaspool.
Source: Gaspool Data Service
1,5
2,0
2,5
3,0
3,5
4,0
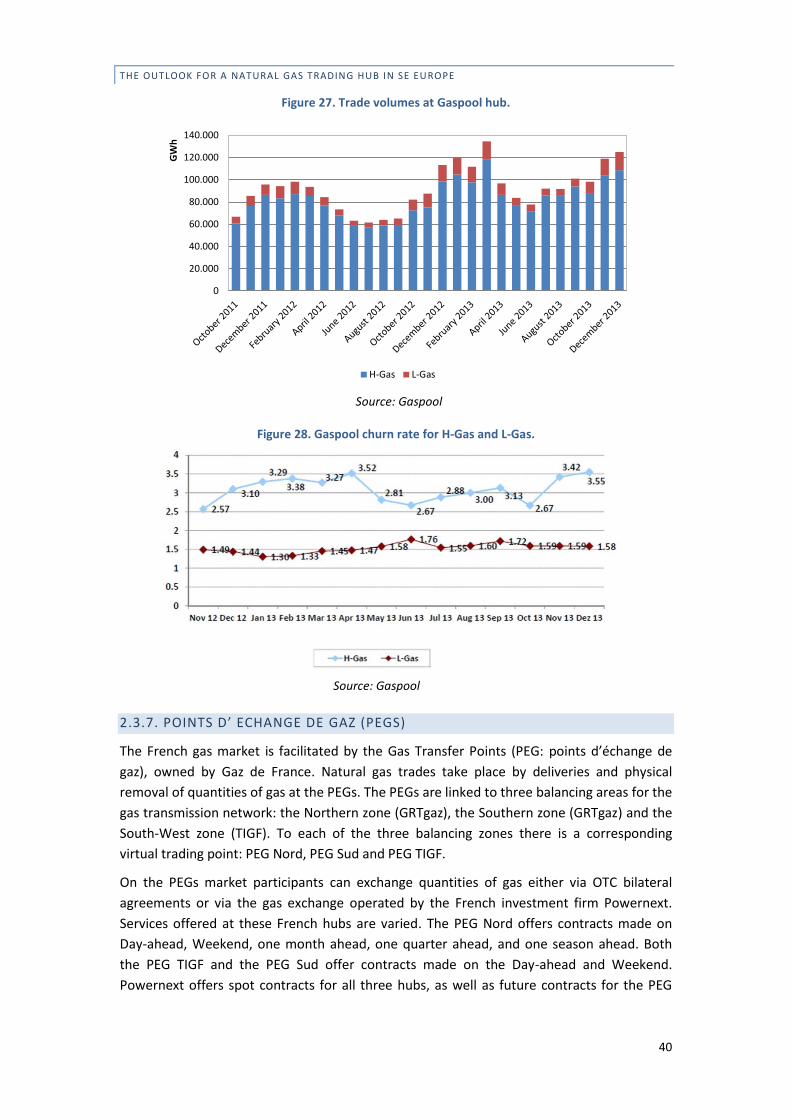
THE OUTLOOK FOR A NATURAL GAS TRADING HUB IN SE EUROPE
40
Figure 27. Trade volumes at Gaspool hub.
Source: Gaspool
Figure 28. Gaspool churn rate for H-Gas and L-Gas.
Source: Gaspool
2.3.7. POINTS D’ ECHANGE DE GAZ (PEGS)
The French gas market is facilitated by the Gas Transfer Points (PEG: points d’échange de
gaz), owned by Gaz de France. Natural gas trades take place by deliveries and physical
removal of quantities of gas at the PEGs. The PEGs are linked to three balancing areas for the
gas transmission network: the Northern zone (GRTgaz), the Southern zone (GRTgaz) and the
South-West zone (TIGF). To each of the three balancing zones there is a corresponding
virtual trading point: PEG Nord, PEG Sud and PEG TIGF.
On the PEGs market participants can exchange quantities of gas either via OTC bilateral
agreements or via the gas exchange operated by the French investment firm Powernext.
Services offered at these French hubs are varied. The PEG Nord offers contracts made on
Day-ahead, Weekend, one month ahead, one quarter ahead, and one season ahead. Both
the PEG TIGF and the PEG Sud offer contracts made on the Day-ahead and Weekend.
Powernext offers spot contracts for all three hubs, as well as future contracts for the PEG
0
20.000
40.000
60.000
80.000
100.000
120.000
140.000
GW
h
H-Gas L-Gas
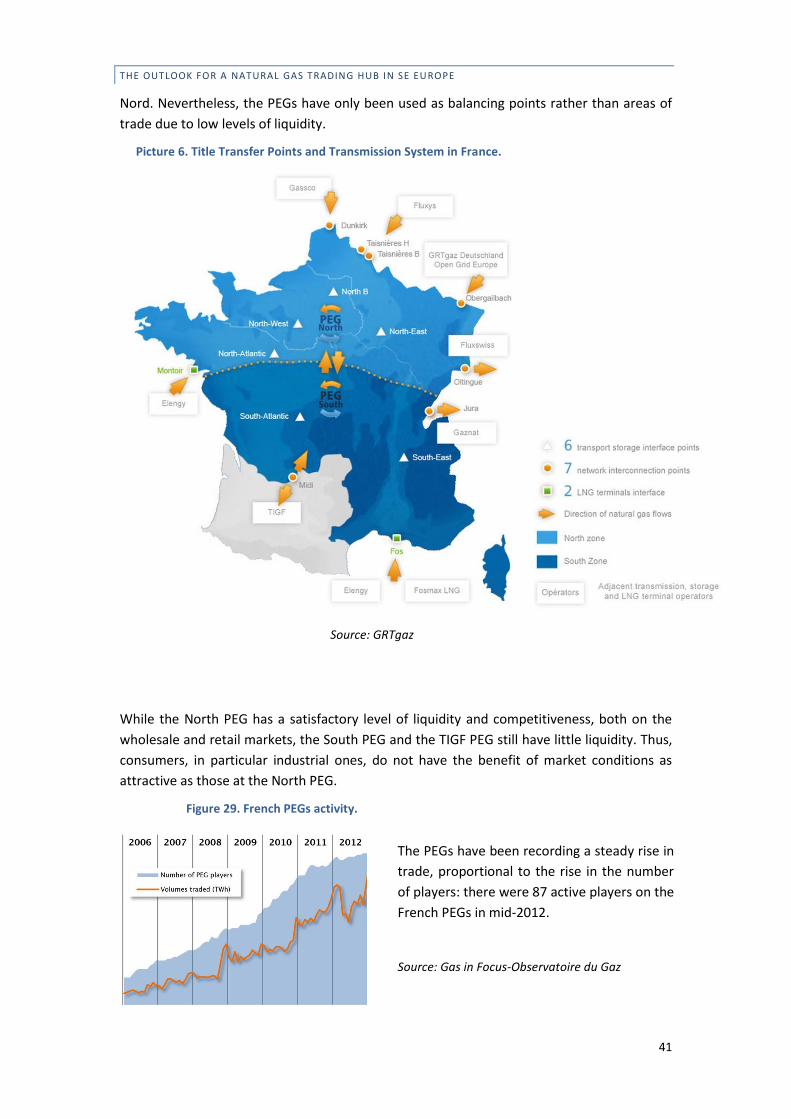
THE OUTLOOK FOR A NATURAL GAS TRADING HUB IN SE EUROPE
41
Nord. Nevertheless, the PEGs have only been used as balancing points rather than areas of
trade due to low levels of liquidity.
Picture 6. Title Transfer Points and Transmission System in France.
Source: GRTgaz
While the North PEG has a satisfactory level of liquidity and competitiveness, both on the
wholesale and retail markets, the South PEG and the TIGF PEG still have little liquidity. Thus,
consumers, in particular industrial ones, do not have the benefit of market conditions as
attractive as those at the North PEG.
Figure 29. French PEGs activity.
The PEGs have been recording a steady rise in
trade, proportional to the rise in the number
of players: there were 87 active players on the
French PEGs in mid-2012.
Source: Gas in Focus-Observatoire du Gaz
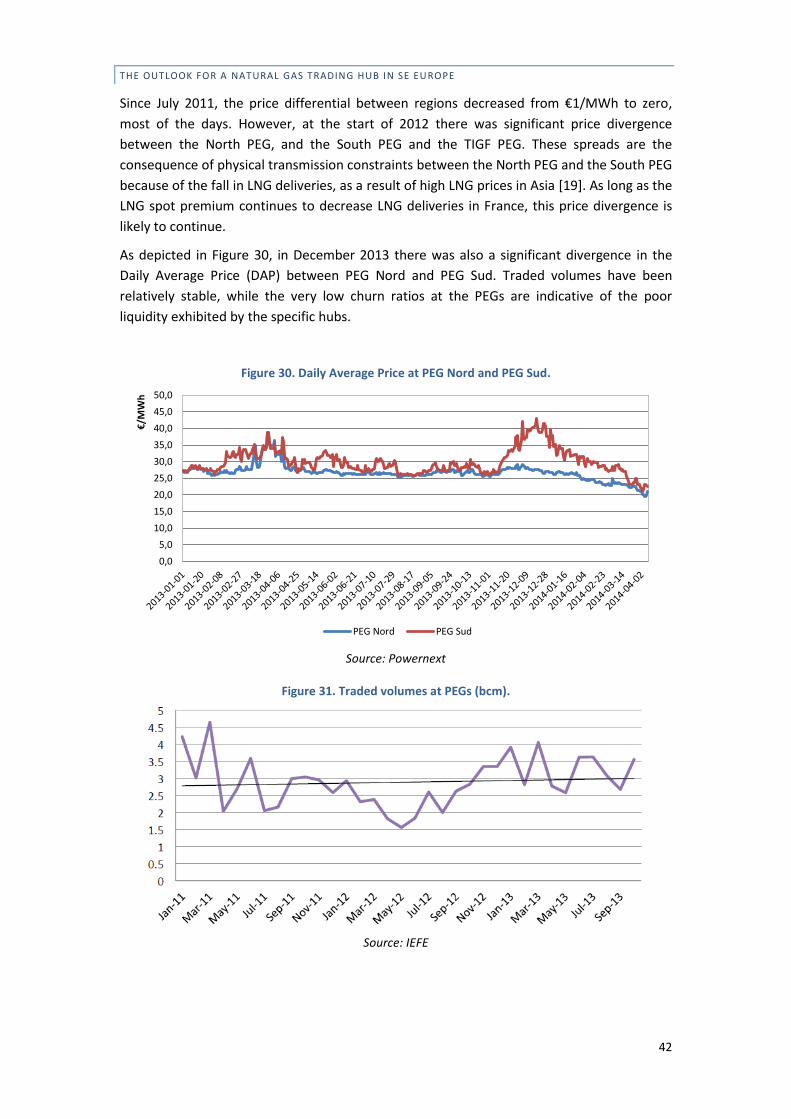
THE OUTLOOK FOR A NATURAL GAS TRADING HUB IN SE EUROPE
42
Since July 2011, the price differential between regions decreased from €1/MWh to zero,
most of the days. However, at the start of 2012 there was significant price divergence
between the North PEG, and the South PEG and the TIGF PEG. These spreads are the
consequence of physical transmission constraints between the North PEG and the South PEG
because of the fall in LNG deliveries, as a result of high LNG prices in Asia [19]. As long as the
LNG spot premium continues to decrease LNG deliveries in France, this price divergence is
likely to continue.
As depicted in Figure 30, in December 2013 there was also a significant divergence in the
Daily Average Price (DAP) between PEG Nord and PEG Sud. Traded volumes have been
relatively stable, while the very low churn ratios at the PEGs are indicative of the poor
liquidity exhibited by the specific hubs.
Figure 30. Daily Average Price at PEG Nord and PEG Sud.
Source: Powernext
Figure 31. Traded volumes at PEGs (bcm).
Source: IEFE
0,0
5,0
10,0
15,0
20,0
25,0
30,0
35,0
40,0
45,0
50,0
€/M
Wh
PEG Nord PEG Sud
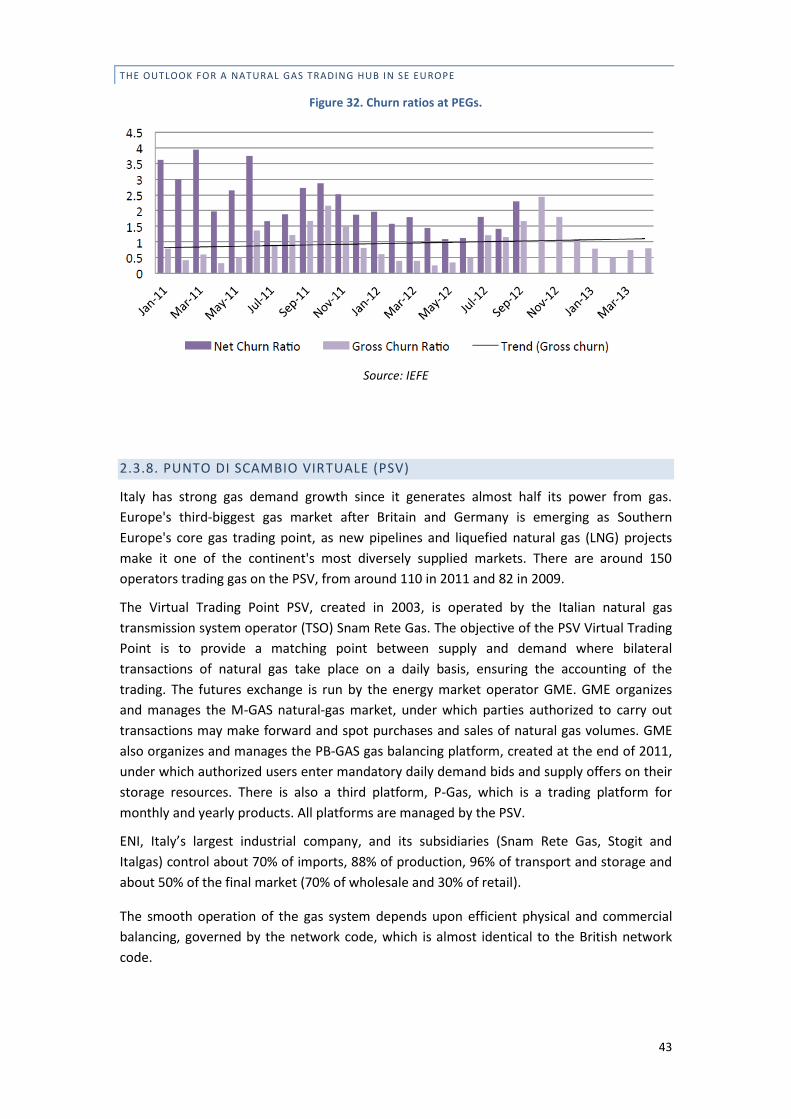
THE OUTLOOK FOR A NATURAL GAS TRADING HUB IN SE EUROPE
43
Figure 32. Churn ratios at PEGs.
Source: IEFE
2.3.8. PUNTO DI SCAMBIO VIRTUALE (PSV)
Italy has strong gas demand growth since it generates almost half its power from gas.
Europe's third-biggest gas market after Britain and Germany is emerging as Southern
Europe's core gas trading point, as new pipelines and liquefied natural gas (LNG) projects
make it one of the continent's most diversely supplied markets. There are around 150
operators trading gas on the PSV, from around 110 in 2011 and 82 in 2009.
The Virtual Trading Point PSV, created in 2003, is operated by the Italian natural gas
transmission system operator (TSO) Snam Rete Gas. The objective of the PSV Virtual Trading
Point is to provide a matching point between supply and demand where bilateral
transactions of natural gas take place on a daily basis, ensuring the accounting of the
trading. The futures exchange is run by the energy market operator GME. GME organizes
and manages the M-GAS natural-gas market, under which parties authorized to carry out
transactions may make forward and spot purchases and sales of natural gas volumes. GME
also organizes and manages the PB-GAS gas balancing platform, created at the end of 2011,
under which authorized users enter mandatory daily demand bids and supply offers on their
storage resources. There is also a third platform, P-Gas, which is a trading platform for
monthly and yearly products. All platforms are managed by the PSV.
ENI, Italy’s largest industrial company, and its subsidiaries (Snam Rete Gas, Stogit and
Italgas) control about 70% of imports, 88% of production, 96% of transport and storage and
about 50% of the final market (70% of wholesale and 30% of retail).
The smooth operation of the gas system depends upon efficient physical and commercial
balancing, governed by the network code, which is almost identical to the British network
code.

THE OUTLOOK FOR A NATURAL GAS TRADING HUB IN SE EUROPE
44
Picture 7. Italian gas transmission network.
Source: Snam Rete Gas
Figure 33. PSV premium to TTF.
Source: ENI
Figure 34 presents the Month Ahead Italian Gas Index (MAGI), which is an independent
index of the Italian gas price at PSV, based 70% on confirmed transactions and 30% on a
market-wide survey. MAGI fell to 24,20 €/MWh in April 2014, which is the lowest monthly
price in the examined period (September 2010 – April 2014).
Despite some signs of progress, the churn rate was 3 in 2013, compared with 19 at TTF and
23 at NBP. As previously mentioned, a churn rate of 10 is considered a threshold for a
Physical balancing is the set of activities
through which the TSO ensures the
efficient handling of gas from injection to
withdrawal points. Storage is the
instrument used for the physical balancing
of the network on a gas-day. Commercial
balancing includes activities required for a
proper accounting and allocation of
transported gas, as well as for the fee
system, encouraging market participants to
keep any quantities injected and
withdrawn from the network equal.
Insufficient liquidity and competition as
well transportation constraints have kept
Italian spot gas prices at a high level
compared to other European hubs, with
Italian day-ahead gas prices trading above
27 €/MWh, a premium of two euros to the
Dutch TTF exchange.
Indeed, Italian gas prices have been
historically high. The price benchmark for
gas on the Italian market is based on the
TTF index plus costs of transportation of
gas to Italy, with the rest of the pricing
depending on the company making the
deal. In 2012 the PSV premium to TTF
started decreasing and therefore, PSV
prices started to converge with the prices
at the Dutch TTF and other North West
European hubs, as a result of resolved
capacity availability issues in linking
infrastructure [67].
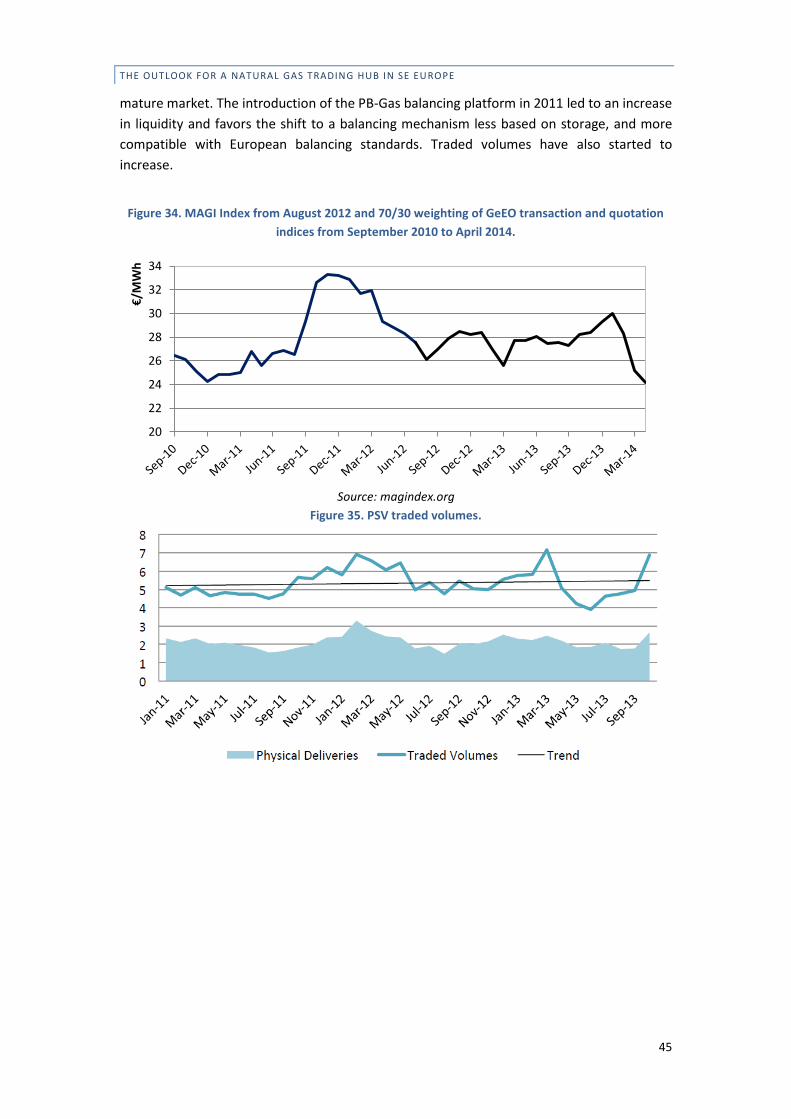
THE OUTLOOK FOR A NATURAL GAS TRADING HUB IN SE EUROPE
45
mature market. The introduction of the PB-Gas balancing platform in 2011 led to an increase
in liquidity and favors the shift to a balancing mechanism less based on storage, and more
compatible with European balancing standards. Traded volumes have also started to
increase.
Figure 34. MAGI Index from August 2012 and 70/30 weighting of GeEO transaction and quotation
indices from September 2010 to April 2014.
Source: magindex.org
Figure 35. PSV traded volumes.
20
22
24
26
28
30
32
34
€/M
Wh
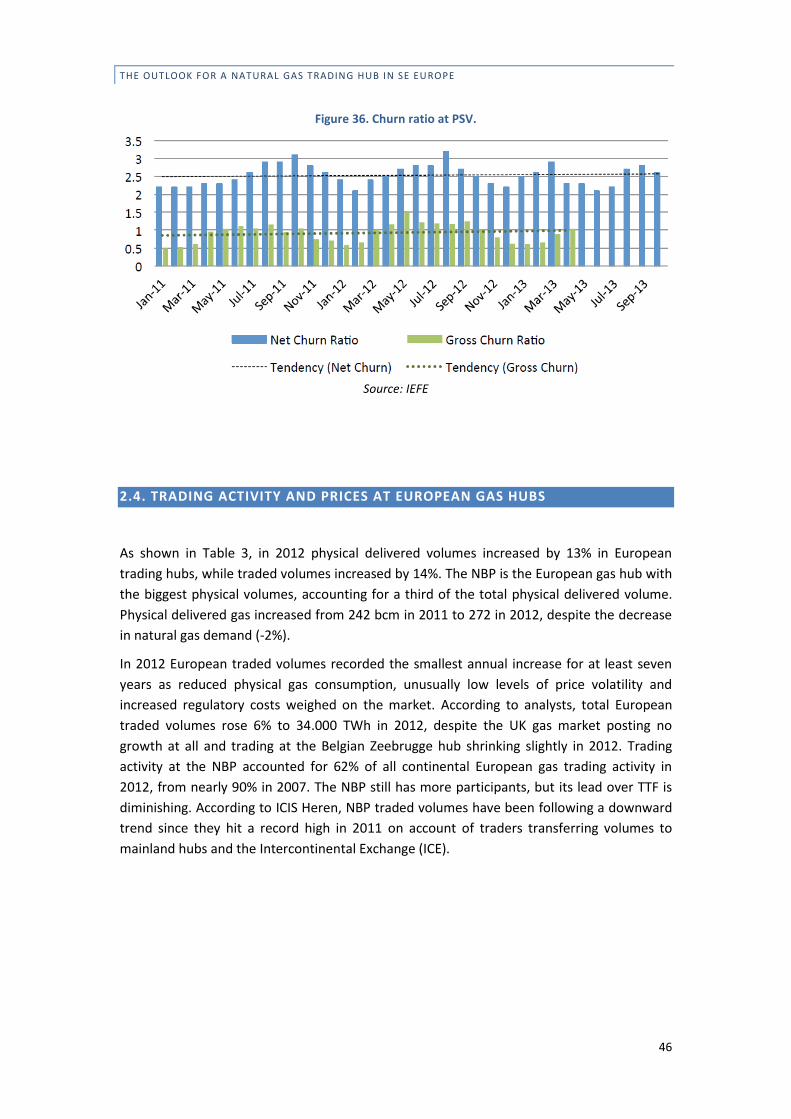
THE OUTLOOK FOR A NATURAL GAS TRADING HUB IN SE EUROPE
46
Figure 36. Churn ratio at PSV.
Source: IEFE
2.4. TRADING ACTIVITY AND PRICES AT EUROPEAN GAS HUBS
As shown in Table 3, in 2012 physical delivered volumes increased by 13% in European
trading hubs, while traded volumes increased by 14%. The NBP is the European gas hub with
the biggest physical volumes, accounting for a third of the total physical delivered volume.
Physical delivered gas increased from 242 bcm in 2011 to 272 in 2012, despite the decrease
in natural gas demand (-2%).
In 2012 European traded volumes recorded the smallest annual increase for at least seven
years as reduced physical gas consumption, unusually low levels of price volatility and
increased regulatory costs weighed on the market. According to analysts, total European
traded volumes rose 6% to 34.000 TWh in 2012, despite the UK gas market posting no
growth at all and trading at the Belgian Zeebrugge hub shrinking slightly in 2012. Trading
activity at the NBP accounted for 62% of all continental European gas trading activity in
2012, from nearly 90% in 2007. The NBP still has more participants, but its lead over TTF is
diminishing. According to ICIS Heren, NBP traded volumes have been following a downward
trend since they hit a record high in 2011 on account of traders transferring volumes to
mainland hubs and the Intercontinental Exchange (ICE).
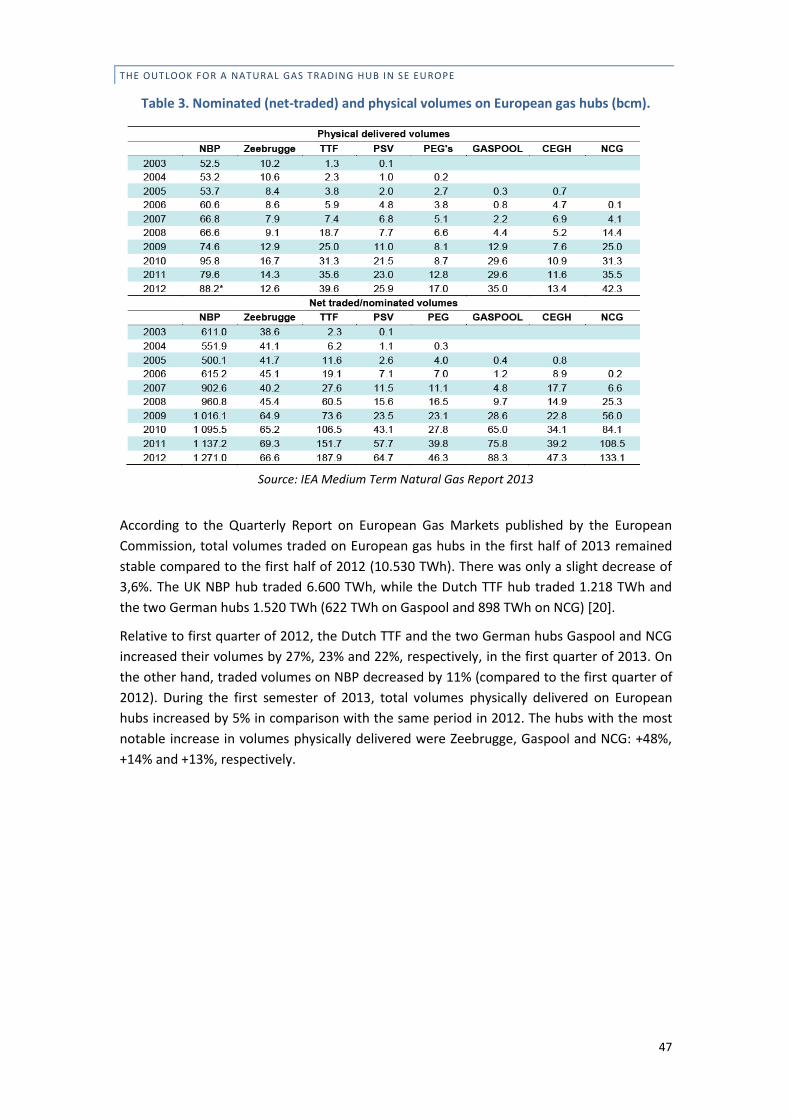
THE OUTLOOK FOR A NATURAL GAS TRADING HUB IN SE EUROPE
47
Table 3. Nominated (net-traded) and physical volumes on European gas hubs (bcm).
Source: IEA Medium Term Natural Gas Report 2013
According to the Quarterly Report on European Gas Markets published by the European
Commission, total volumes traded on European gas hubs in the first half of 2013 remained
stable compared to the first half of 2012 (10.530 TWh). There was only a slight decrease of
3,6%. The UK NBP hub traded 6.600 TWh, while the Dutch TTF hub traded 1.218 TWh and
the two German hubs 1.520 TWh (622 TWh on Gaspool and 898 TWh on NCG) [20].
Relative to first quarter of 2012, the Dutch TTF and the two German hubs Gaspool and NCG
increased their volumes by 27%, 23% and 22%, respectively, in the first quarter of 2013. On
the other hand, traded volumes on NBP decreased by 11% (compared to the first quarter of
2012). During the first semester of 2013, total volumes physically delivered on European
hubs increased by 5% in comparison with the same period in 2012. The hubs with the most
notable increase in volumes physically delivered were Zeebrugge, Gaspool and NCG: +48%,
+14% and +13%, respectively.
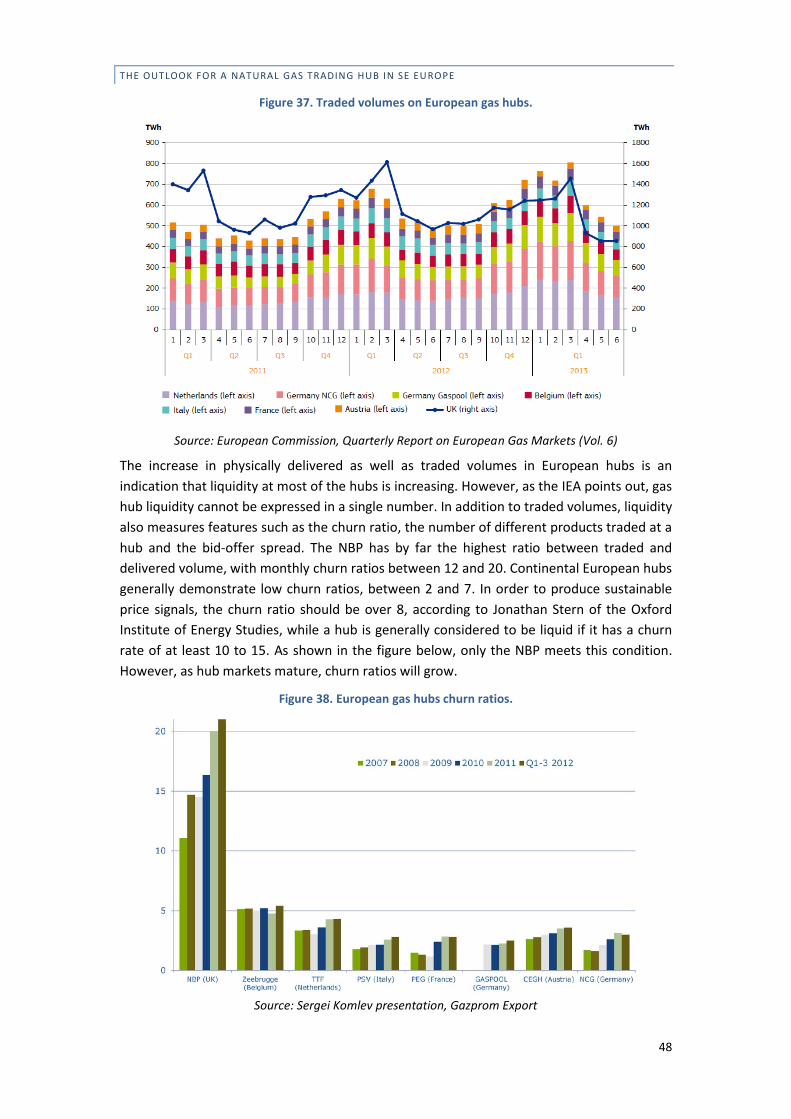
THE OUTLOOK FOR A NATURAL GAS TRADING HUB IN SE EUROPE
48
Figure 37. Traded volumes on European gas hubs.
Source: European Commission, Quarterly Report on European Gas Markets (Vol. 6)
The increase in physically delivered as well as traded volumes in European hubs is an
indication that liquidity at most of the hubs is increasing. However, as the IEA points out, gas
hub liquidity cannot be expressed in a single number. In addition to traded volumes, liquidity
also measures features such as the churn ratio, the number of different products traded at a
hub and the bid-offer spread. The NBP has by far the highest ratio between traded and
delivered volume, with monthly churn ratios between 12 and 20. Continental European hubs
generally demonstrate low churn ratios, between 2 and 7. In order to produce sustainable
price signals, the churn ratio should be over 8, according to Jonathan Stern of the Oxford
Institute of Energy Studies, while a hub is generally considered to be liquid if it has a churn
rate of at least 10 to 15. As shown in the figure below, only the NBP meets this condition.
However, as hub markets mature, churn ratios will grow.
Figure 38. European gas hubs churn ratios.
Source: Sergei Komlev presentation, Gazprom Export
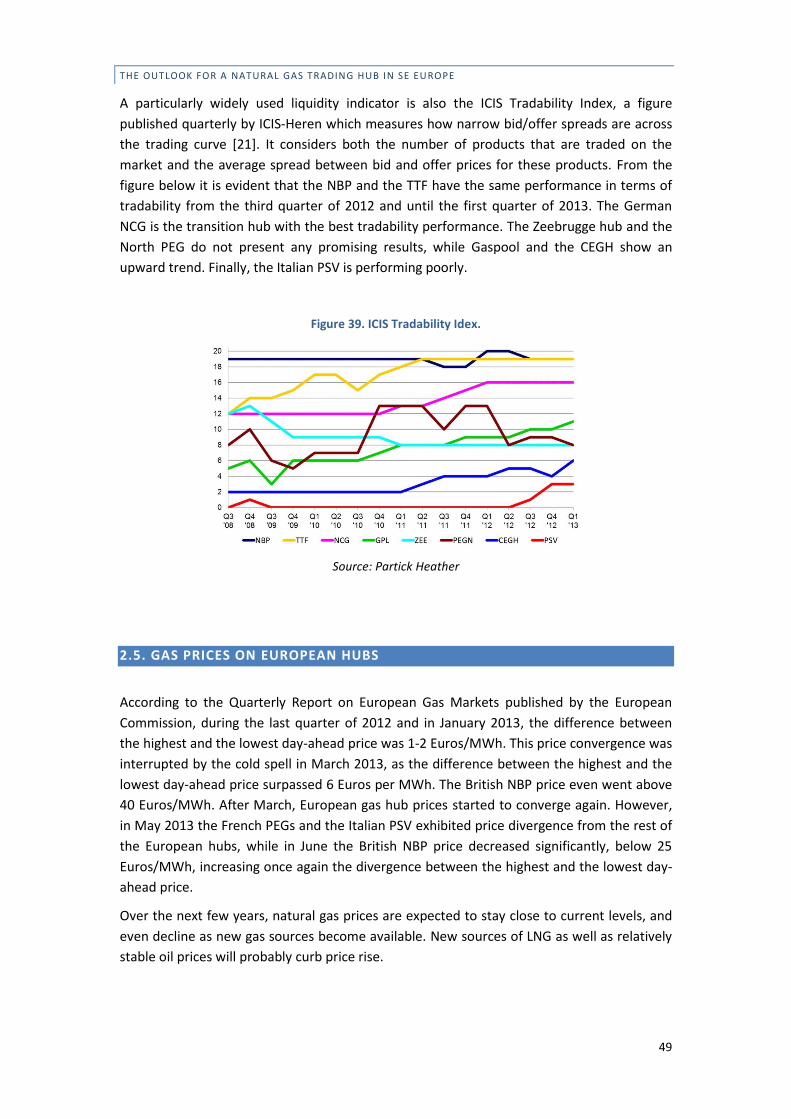
THE OUTLOOK FOR A NATURAL GAS TRADING HUB IN SE EUROPE
49
A particularly widely used liquidity indicator is also the ICIS Tradability Index, a figure
published quarterly by ICIS-Heren which measures how narrow bid/offer spreads are across
the trading curve [21]. It considers both the number of products that are traded on the
market and the average spread between bid and offer prices for these products. From the
figure below it is evident that the NBP and the TTF have the same performance in terms of
tradability from the third quarter of 2012 and until the first quarter of 2013. The German
NCG is the transition hub with the best tradability performance. The Zeebrugge hub and the
North PEG do not present any promising results, while Gaspool and the CEGH show an
upward trend. Finally, the Italian PSV is performing poorly.
Figure 39. ICIS Tradability Idex.
Source: Partick Heather
2.5. GAS PRICES ON EUROPEAN HUBS
According to the Quarterly Report on European Gas Markets published by the European
Commission, during the last quarter of 2012 and in January 2013, the difference between
the highest and the lowest day-ahead price was 1-2 Euros/MWh. This price convergence was
interrupted by the cold spell in March 2013, as the difference between the highest and the
lowest day-ahead price surpassed 6 Euros per MWh. The British NBP price even went above
40 Euros/MWh. After March, European gas hub prices started to converge again. However,
in May 2013 the French PEGs and the Italian PSV exhibited price divergence from the rest of
the European hubs, while in June the British NBP price decreased significantly, below 25
Euros/MWh, increasing once again the divergence between the highest and the lowest day-
ahead price.
Over the next few years, natural gas prices are expected to stay close to current levels, and
even decline as new gas sources become available. New sources of LNG as well as relatively
stable oil prices will probably curb price rise.
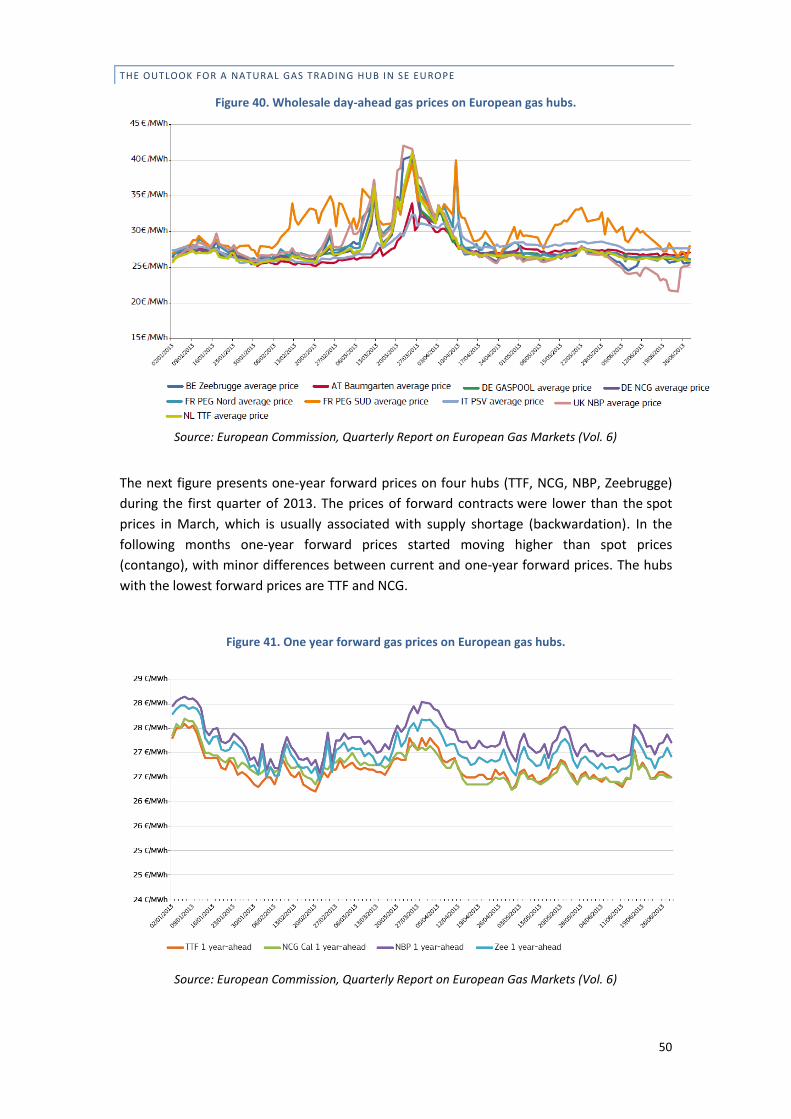
THE OUTLOOK FOR A NATURAL GAS TRADING HUB IN SE EUROPE
50
Figure 40. Wholesale day-ahead gas prices on European gas hubs.
Source: European Commission, Quarterly Report on European Gas Markets (Vol. 6)
The next figure presents one-year forward prices on four hubs (TTF, NCG, NBP, Zeebrugge)
during the first quarter of 2013. The prices of forward contracts were lower than the spot
prices in March, which is usually associated with supply shortage (backwardation). In the
following months one-year forward prices started moving higher than spot prices
(contango), with minor differences between current and one-year forward prices. The hubs
with the lowest forward prices are TTF and NCG.
Figure 41. One year forward gas prices on European gas hubs.
Source: European Commission, Quarterly Report on European Gas Markets (Vol. 6)
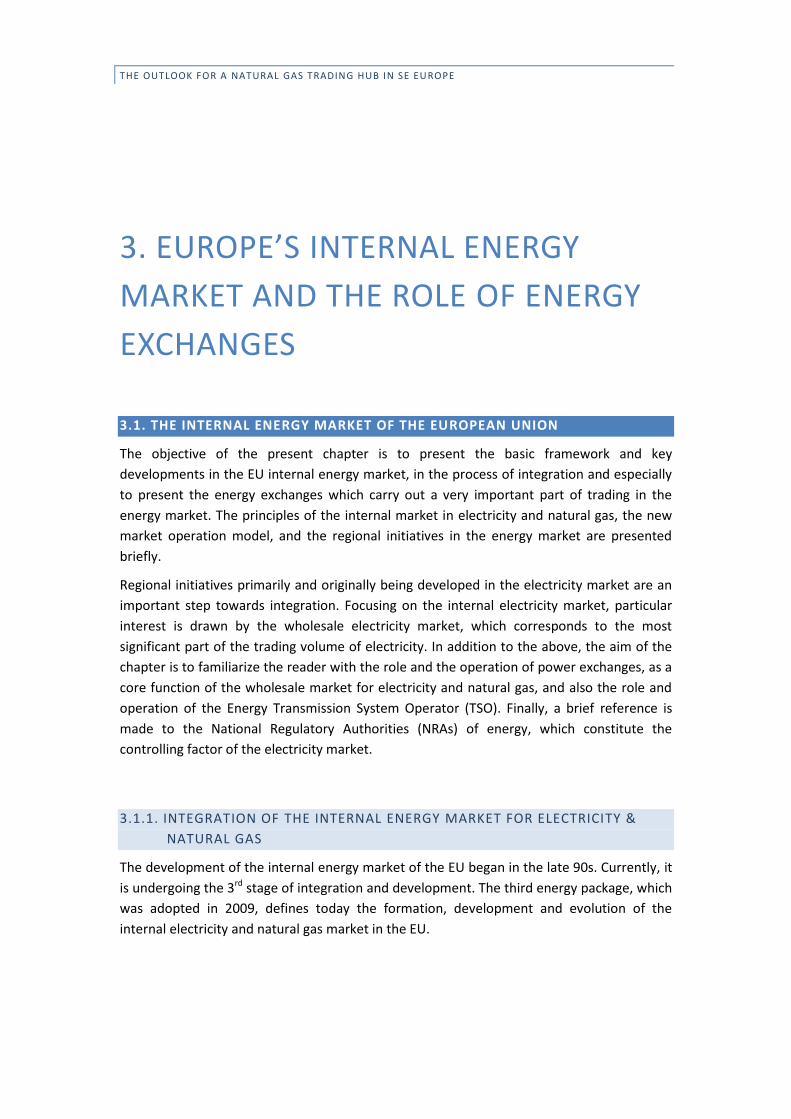
THE OUTLOOK FOR A NATURAL GAS TRADING HUB IN SE EUROPE
3. EUROPE’S INTERNAL ENERGY
MARKET AND THE ROLE OF ENERGY
EXCHANGES
3.1. THE INTERNAL ENERGY MARKET OF THE EUROPEAN UNION
The objective of the present chapter is to present the basic framework and key
developments in the EU internal energy market, in the process of integration and especially
to present the energy exchanges which carry out a very important part of trading in the
energy market. The principles of the internal market in electricity and natural gas, the new
market operation model, and the regional initiatives in the energy market are presented
briefly.
Regional initiatives primarily and originally being developed in the electricity market are an
important step towards integration. Focusing on the internal electricity market, particular
interest is drawn by the wholesale electricity market, which corresponds to the most
significant part of the trading volume of electricity. In addition to the above, the aim of the
chapter is to familiarize the reader with the role and the operation of power exchanges, as a
core function of the wholesale market for electricity and natural gas, and also the role and
operation of the Energy Transmission System Operator (TSO). Finally, a brief reference is
made to the National Regulatory Authorities (NRAs) of energy, which constitute the
controlling factor of the electricity market.
3.1.1. INTEGRATION OF THE INTERNAL ENERGY MARKET FOR ELECTRICITY &
NATURAL GAS
The development of the internal energy market of the EU began in the late 90s. Currently, it
is undergoing the 3rd stage of integration and development. The third energy package, which
was adopted in 2009, defines today the formation, development and evolution of the
internal electricity and natural gas market in the EU.
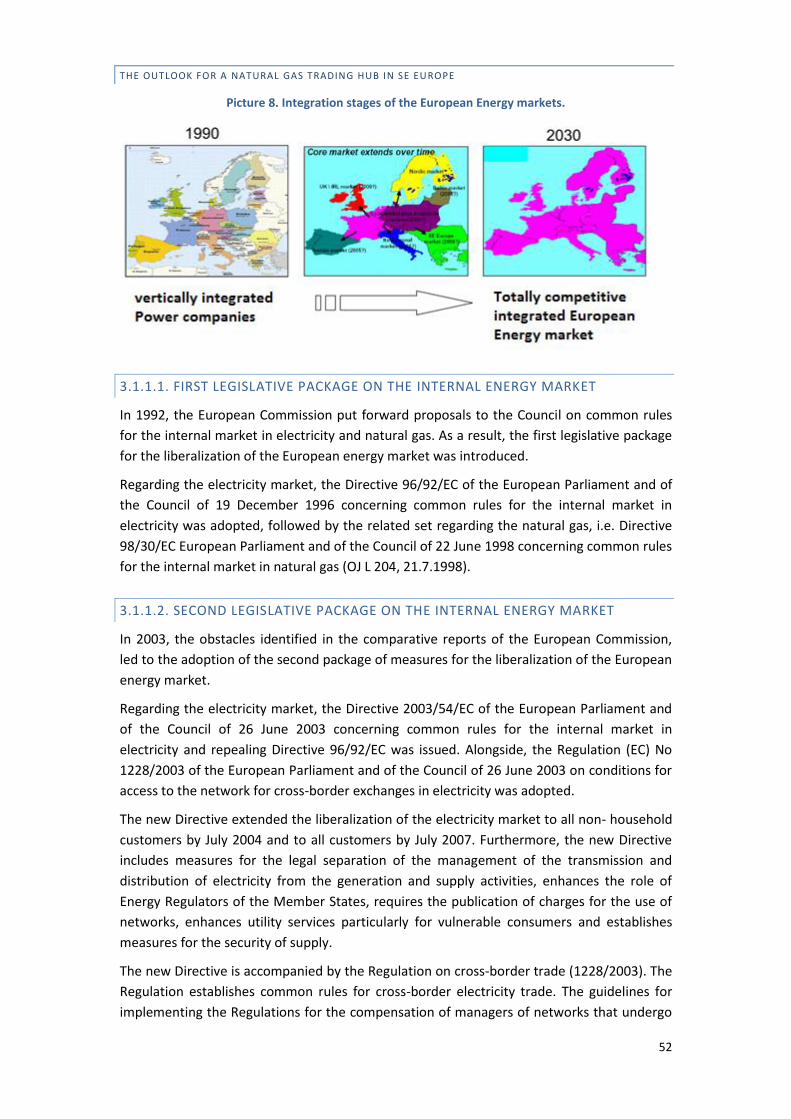
THE OUTLOOK FOR A NATURAL GAS TRADING HUB IN SE EUROPE
52
Picture 8. Integration stages of the European Energy markets.
3.1.1.1. FIRST LEGISLATIVE PACKAGE ON THE INTERNAL ENERGY MARKET
In 1992, the European Commission put forward proposals to the Council on common rules
for the internal market in electricity and natural gas. As a result, the first legislative package
for the liberalization of the European energy market was introduced.
Regarding the electricity market, the Directive 96/92/EC of the European Parliament and of
the Council of 19 December 1996 concerning common rules for the internal market in
electricity was adopted, followed by the related set regarding the natural gas, i.e. Directive
98/30/EC European Parliament and of the Council of 22 June 1998 concerning common rules
for the internal market in natural gas (OJ L 204, 21.7.1998).
3.1.1.2. SECOND LEGISLATIVE PACKAGE ON THE INTERNAL ENERGY MARKET
In 2003, the obstacles identified in the comparative reports of the European Commission,
led to the adoption of the second package of measures for the liberalization of the European
energy market.
Regarding the electricity market, the Directive 2003/54/EC of the European Parliament and
of the Council of 26 June 2003 concerning common rules for the internal market in
electricity and repealing Directive 96/92/EC was issued. Alongside, the Regulation (EC) No
1228/2003 of the European Parliament and of the Council of 26 June 2003 on conditions for
access to the network for cross-border exchanges in electricity was adopted.
The new Directive extended the liberalization of the electricity market to all non- household
customers by July 2004 and to all customers by July 2007. Furthermore, the new Directive
includes measures for the legal separation of the management of the transmission and
distribution of electricity from the generation and supply activities, enhances the role of
Energy Regulators of the Member States, requires the publication of charges for the use of
networks, enhances utility services particularly for vulnerable consumers and establishes
measures for the security of supply.
The new Directive is accompanied by the Regulation on cross-border trade (1228/2003). The
Regulation establishes common rules for cross-border electricity trade. The guidelines for
implementing the Regulations for the compensation of managers of networks that undergo
THE OUTLOOK FOR A NATURAL GAS TRADING HUB IN SE EUROPE
53
transits of electricity, for the harmonization of national charges for transmission and the
distribution of capacity of interconnections will be adopted by the procedure laid down in
the Regulation.
For the regulation of the gas market the Directive 2003/55/EC of the European Parliament
and of the Council of 26 June 2003 concerning common rules for the internal market in
natural gas was adopted along with the Regulation (EC) No 1775/2005 of the European
Parliament and of the Council of 28 September 2005 on conditions for access to the natural
gas transmission networks.
Moreover, the ERGEG was established with the Decision 2003/796/EC of 11 November 2003
on establishing the European Regulators Group for Electricity and Gas.
Furthermore, the 2004 Gas Security Directive has been intended to improve security of
supply in the natural gas sector.
3.1.1.3. THIRD LEGISLATIVE PACKAGE ON THE INTERNAL ENERGY MARKET
The 3rd Energy Package provides for the implementation of the Single European Market
Model, which provides for the creation of the internal market, which will benefit consumers
through equitable access to energy resources of all countries.
The third package includes:
Regulation (EC) No 713/2009 of the European Parliament and of the Council of 13
July 2009 establishing an Agency for the Cooperation of Energy Regulators.
Regulation (EC) No 714/2009 of the European Parliament and of the Council of 13
July 2009 on conditions for access to the network for cross-border exchanges in
electricity and repealing Regulation (EC) No 1228/2003.
Regulation (EC) No 715/2009 of the European Parliament and of the Council of 13
July 2009 on conditions for access to the natural gas transmission networks and
repealing Regulation (EC) No 1775/2005.
The basic settings of the third package include:
Effective separation of the transmission and distribution activities from the activities
of generation and supply.
Promoting competition, regional electricity and natural gas markets, in order to
integrate the internal energy market.
Increased transparency and better functioning of the retail market/consumer
protection and establishing obligations for the supply of utilities services/fighting
energy poverty and implementation of intelligent measuring systems.
Each consumer participates in the formation of the price of electricity charged and
adapts its consumption characteristics by providing opportunities for load
management, thus streamlining the consumption and promoting energy saving.
Strengthening solidarity and regional cooperation between Member States to
ensure security of supply.
THE OUTLOOK FOR A NATURAL GAS TRADING HUB IN SE EUROPE
54
Establishment of the Agency for the effective cooperation between national
regulators, coverage of the regulatory gap at the European level and the promotion
of the effective functioning of the internal energy market.
Establish mandatory cooperation between Transmission System Operators (ENTSOs:
ENTSO-E/ENTSO-G) aiming to harmonize all rules governing the transmission of
energy in Europe, and for coordinated planning of infrastructure investments of
cross-border interest.
Strengthening of the Independent Regulators for effective regulatory oversight.
As stated in Directive 2009/72/EC, the objective of the internal market in natural gas is to
deliver real choice for all consumers of the European Union, be they citizens or businesses,
new business opportunities and more cross-border trade, so as to achieve efficiency gains,
competitive prices, and higher standards of service, and to contribute to security of supply
and sustainability.
Directive 2009/72/EC of the European Parliament and the Council is the heart of the third
energy package. This directive involves adopting common rules for the internal market in
electricity and natural gas and revoking previous arrangements. This Directive establishes
common rules for the transmission, distribution, supply and storage of natural gas. It lays
down the rules relating to the organization and functioning of the natural gas sector, access
to the market, the criteria and procedures applicable to the granting of authorizations for
transmission, distribution, supply and storage of natural gas and the operation of systems.
The rules established by this Directive for natural gas, including LNG, shall also apply in a
non-discriminatory way to biogas and gas from biomass or other types of gas in so far as
such gases can technically and safely be injected into, and transported through, the natural
gas system.
Among the provisions of the directive, it is stated that Member States are responsible for
monitoring security of supply issues and in particular those related to the balance of supply
and demand on the national market, available supplies, maintenance of the networks and
the measures to be taken in the event of supply problems. Regional or international
cooperation may be put in place to ensure security of supply.
It is also provided that Member States shall ensure the integration of national markets at
one or more regional levels, as a first step towards the integration of a fully liberalized
internal market. The gas islands in isolated regions shall also be integrated. In this context,
the national regulatory authorities shall cooperate with the Agency for the Cooperation of
Energy Regulators.
THE OUTLOOK FOR A NATURAL GAS TRADING HUB IN SE EUROPE
55
Unbundling
Starting from 3 March 2012, Member States were directed to unbundle transmission
systems and transmission system operators and to designate one or more storage and LNG
system operators responsible for:
operating, maintaining and developing transmission systems, storage and/or LNG
facilities with due regard to the environment;
ensuring non-discrimination between system users;
providing information to any other transmission system operator, any other storage
system operator, any other LNG system operator and/or any distribution system
operator to ensure the interconnection of the transmission and storage of natural
gas;
providing system users with the information they need to access the system.
Transmission system operators have to build sufficient cross-border capacity to integrate the
European transmission infrastructure. Every year, they submit to the regulatory authority a
ten-year network development plan indicating the main infrastructure that needs to be built
or modernized as well as the investments to be executed over the next ten years.
Distribution and supply
Member States designate distribution system operators or require undertakings from
companies that own or are responsible for distribution systems to act in such roles.
Distribution system operators are mainly responsible for:
ensuring the long-term capacity of the system in terms of the distribution of gas,
operation, maintenance, development and environmental protection;
ensuring transparency with respect to system users;
providing system users with information;
covering energy losses and maintaining reserve capacity.
The distribution system operator is independent in legal terms from other activities not
relating to distribution.
Distribution systems responsible for distributing natural gas within a geographically confined
industrial, commercial or shared services site may be classified by the competent authorities
as closed distribution systems. On this basis, they may be exempted from the requirement
to have their tariffs, or the methodologies underlying their calculation, approved in advance.
Organization of access to the system
Member States or the competent regulatory authorities define the conditions for access to
storage facilities and linepack. They take measures to ensure that eligible customers can
obtain access to upstream pipeline networks. Moreover, they organize a system of third
party access to transmission and distribution systems.
THE OUTLOOK FOR A NATURAL GAS TRADING HUB IN SE EUROPE
56
Natural gas system operators may refuse access to the system on the basis of lack of
capacity or where access to the system would compromise the performance of their public
service obligations. Substantiated reasons shall be given for any such a refusal.
3.1.1.3.1. REGULATION (EC) NO 715/2009 ON CONDITIONS FOR ACCESS TO THE
NATURAL GAS TRANSMISSION NETWORKS
This Regulation lays down rules for natural gas transmission networks, gas storage and
liquefied natural gas (LNG) facilities. It concerns access to infrastructures, particularly by
determining the establishment of tariffs (solely for access to networks), services to be
offered, allocation of capacity, transparency and balancing of the network.
Certification of transmission system operators
National regulatory authorities send notification of decisions relating to the certification of a
transmission system operator to the European Commission. The Commission then has a
period of two months to deliver its opinion to the national regulatory authority. The
authority then adopts the final decision concerning the certification of the transmission
system operator.
European Network of Transmission System Operators (ENTSO) for gas
ENTSOG's role is to manage the development process and fulfil the TSOs’ obligation to
cooperate at European level as defined by Gas Regulation (EC) 715/2009. Established on a
non-profit basis in December 2009, ENTSOG works closely with the European Commission,
the new European regulatory agency ACER, and a wide variety of stakeholders to fulfil its
mandate.
The ENTSO for Gas is responsible for adopting:
common network operation tools;
a ten-year network development plan;
recommendations relating to the coordination of technical cooperation between
Community transmission system operators;
an annual work programme;
an annual report;
annual summer and winter supply outlooks.
Costs and tariffs
The regulatory authorities determine tariffs or methodologies for their calculation. Member
States may take decisions relating to tariffs such as fixing auction arrangements.
Third-party access services
Transmission system operators offer their services equitably to all network users on a rolling
basis in the long and short term.
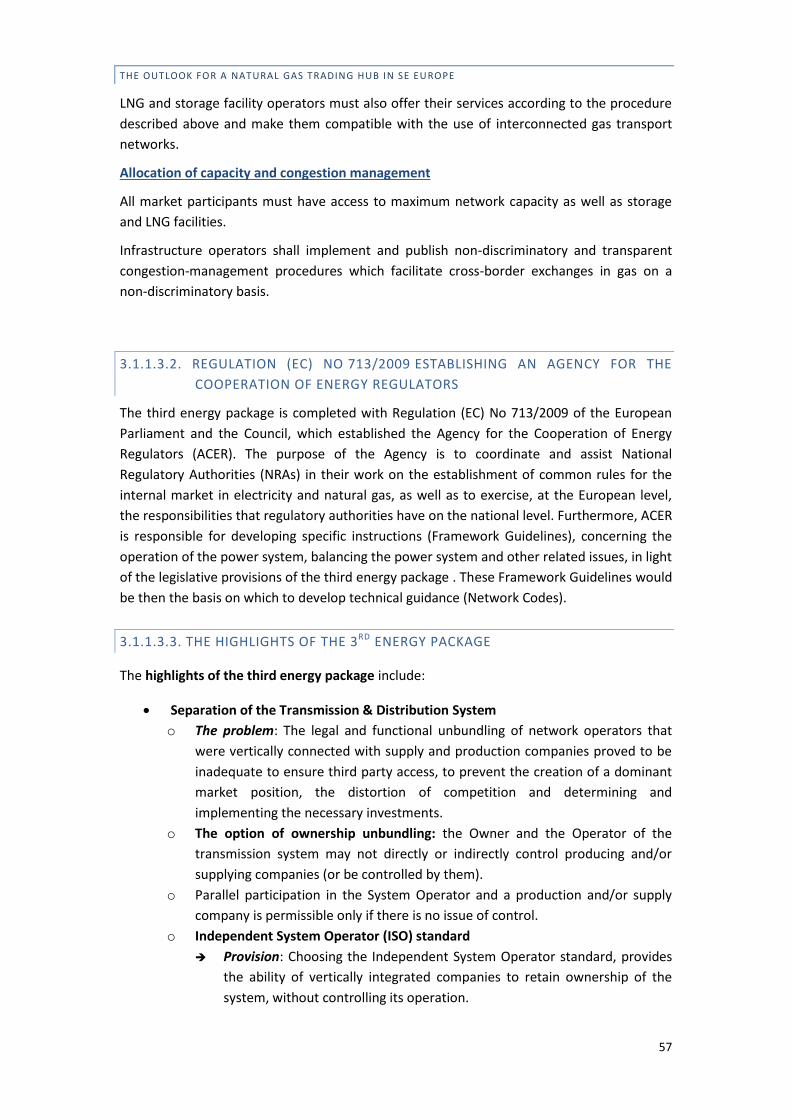
THE OUTLOOK FOR A NATURAL GAS TRADING HUB IN SE EUROPE
57
LNG and storage facility operators must also offer their services according to the procedure
described above and make them compatible with the use of interconnected gas transport
networks.
Allocation of capacity and congestion management
All market participants must have access to maximum network capacity as well as storage
and LNG facilities.
Infrastructure operators shall implement and publish non-discriminatory and transparent
congestion-management procedures which facilitate cross-border exchanges in gas on a
non-discriminatory basis.
3.1.1.3.2. REGULATION (EC) NO 713/2009 ESTABLISHING AN AGENCY FOR THE
COOPERATION OF ENERGY REGULATORS
The third energy package is completed with Regulation (EC) No 713/2009 of the European
Parliament and the Council, which established the Agency for the Cooperation of Energy
Regulators (ACER). The purpose of the Agency is to coordinate and assist National
Regulatory Authorities (NRAs) in their work on the establishment of common rules for the
internal market in electricity and natural gas, as well as to exercise, at the European level,
the responsibilities that regulatory authorities have on the national level. Furthermore, ACER
is responsible for developing specific instructions (Framework Guidelines), concerning the
operation of the power system, balancing the power system and other related issues, in light
of the legislative provisions of the third energy package . These Framework Guidelines would
be then the basis on which to develop technical guidance (Network Codes).
3.1.1.3.3. THE HIGHLIGHTS OF THE 3RD ENERGY PACKAGE
The highlights of the third energy package include:
Separation of the Transmission & Distribution System
o The problem: The legal and functional unbundling of network operators that
were vertically connected with supply and production companies proved to be
inadequate to ensure third party access, to prevent the creation of a dominant
market position, the distortion of competition and determining and
implementing the necessary investments.
o The option of ownership unbundling: the Owner and the Operator of the
transmission system may not directly or indirectly control producing and/or
supplying companies (or be controlled by them).
o Parallel participation in the System Operator and a production and/or supply
company is permissible only if there is no issue of control.
o Independent System Operator (ISO) standard
Provision: Choosing the Independent System Operator standard, provides
the ability of vertically integrated companies to retain ownership of the
system, without controlling its operation.

THE OUTLOOK FOR A NATURAL GAS TRADING HUB IN SE EUROPE
58
Consequence: The new System Operator (ISO) - certified under stringent
conditions and subject to constant supervision - for autonomous trading
and investment decisions
Reception: Choosing the Independent System Operator standard did not
prove popular among Member States.
o Independent Transmission Operator (ITO) Standard
The ownership of the assets of the transmission system, as well as the
authority for the operation of the system is transferred to a new company
(ITO), which remains as member of the group of companies of the parent
company.
The new company must meet strict criteria of independence and
autonomy, especially with respect to particular assets, personnel and
economic operation.
Strengthening of national regulators
o The Problem: Inhomogeneous authorities of the regulatory authorities in the
EU and the problematic regulation of the internal market
o The Solution: Strengthen the independence and powers of national regulatory
authorities, including powers to regional / community.
o Internal Function
Independence from the executive and economic interests particularly in
the energy sector,
Financial Independence
Members: a minimum term of five to seven at most years, renewable once
o Responsibilities on cross border issues. The development of regional markets
and the removal of barriers to cross-border trading is introduced as an objective
for the Regulators. For this purpose the following are established:
Cooperation with Regulatory Authorities of other member states and the
ACER (the Regulatory Council in which they participate with voting rights)
The obligation for compliance and implementation of the decisions of the
Commission and ACER
The obligation to ensure the compatibility of the national program of
investment in transmission infrastructure with the Community-wide
investment program.
o Responsibilities on national Level
Certify that the institution proposed as Operator meets the separation
criteria under Directives and Regulations. The decision is notified to the
European Commission, which may consult the ACER.
They conduct constant supervision on the validity of the certification
criteria
The powers of preventive and repressive control are enhanced. Regulators
impose appropriate measures / binding decisions for businesses, as well as
penalties and especially for the well-functioning of the competition in the
energy market, the emergence of restrictive practices, the operation of the
Operators, etc.
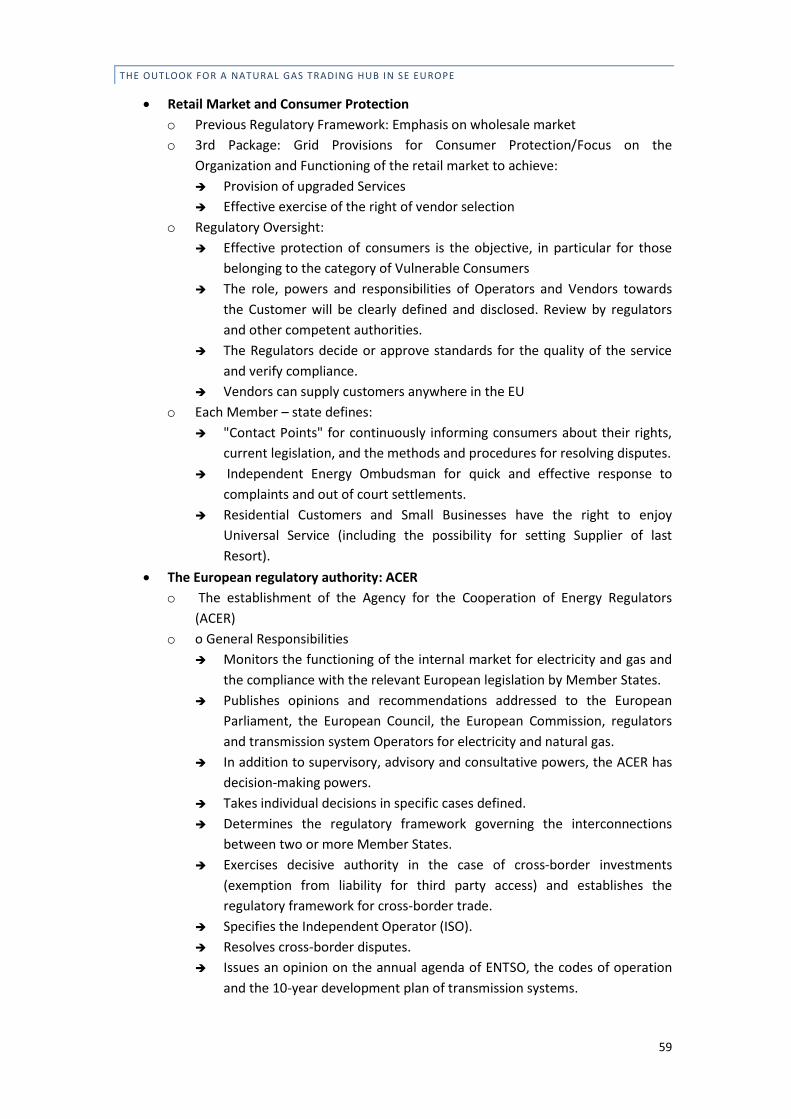
THE OUTLOOK FOR A NATURAL GAS TRADING HUB IN SE EUROPE
59
Retail Market and Consumer Protection
o Previous Regulatory Framework: Emphasis on wholesale market
o 3rd Package: Grid Provisions for Consumer Protection/Focus on the
Organization and Functioning of the retail market to achieve:
Provision of upgraded Services
Effective exercise of the right of vendor selection
o Regulatory Oversight:
Effective protection of consumers is the objective, in particular for those
belonging to the category of Vulnerable Consumers
The role, powers and responsibilities of Operators and Vendors towards
the Customer will be clearly defined and disclosed. Review by regulators
and other competent authorities.
The Regulators decide or approve standards for the quality of the service
and verify compliance.
Vendors can supply customers anywhere in the EU
o Each Member – state defines:
"Contact Points" for continuously informing consumers about their rights,
current legislation, and the methods and procedures for resolving disputes.
Independent Energy Ombudsman for quick and effective response to
complaints and out of court settlements.
Residential Customers and Small Businesses have the right to enjoy
Universal Service (including the possibility for setting Supplier of last
Resort).
The European regulatory authority: ACER
o The establishment of the Agency for the Cooperation of Energy Regulators
(ACER)
o o General Responsibilities
Monitors the functioning of the internal market for electricity and gas and
the compliance with the relevant European legislation by Member States.
Publishes opinions and recommendations addressed to the European
Parliament, the European Council, the European Commission, regulators
and transmission system Operators for electricity and natural gas.
In addition to supervisory, advisory and consultative powers, the ACER has
decision-making powers.
Takes individual decisions in specific cases defined.
Determines the regulatory framework governing the interconnections
between two or more Member States.
Exercises decisive authority in the case of cross-border investments
(exemption from liability for third party access) and establishes the
regulatory framework for cross-border trade.
Specifies the Independent Operator (ISO).
Resolves cross-border disputes.
Issues an opinion on the annual agenda of ENTSO, the codes of operation
and the 10-year development plan of transmission systems.
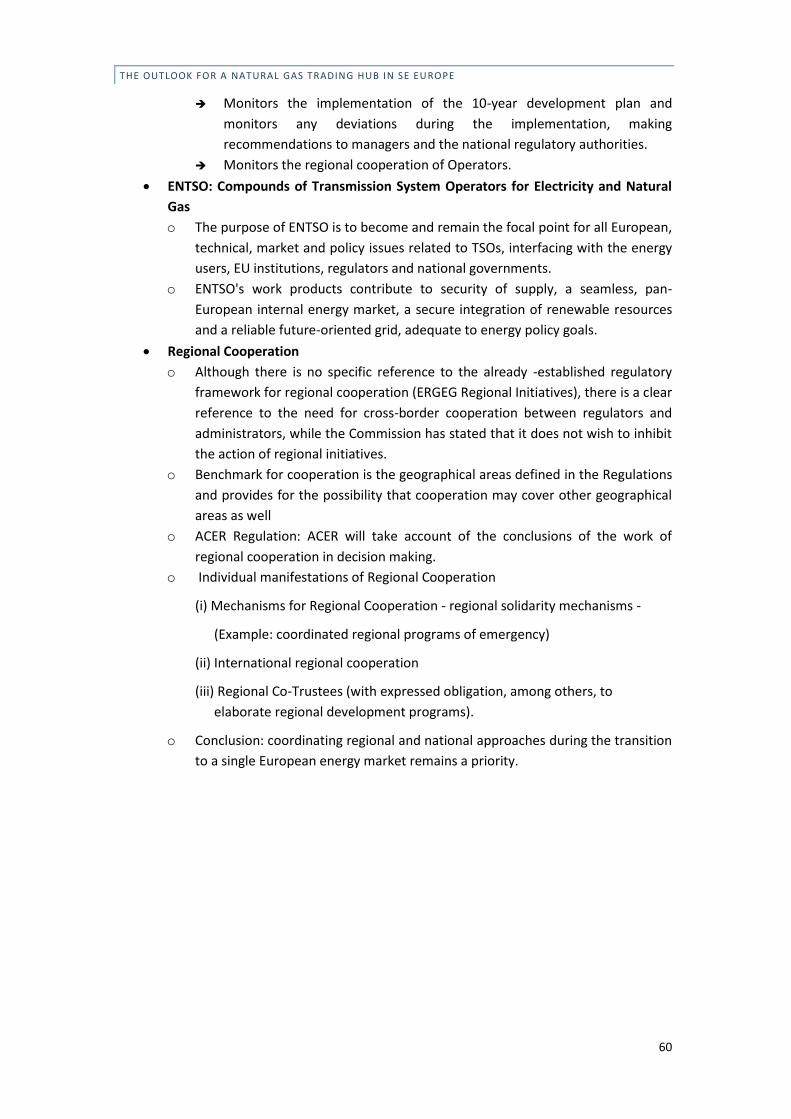
THE OUTLOOK FOR A NATURAL GAS TRADING HUB IN SE EUROPE
60
Monitors the implementation of the 10-year development plan and
monitors any deviations during the implementation, making
recommendations to managers and the national regulatory authorities.
Monitors the regional cooperation of Operators.
ENTSO: Compounds of Transmission System Operators for Electricity and Natural
Gas
o The purpose of ENTSO is to become and remain the focal point for all European,
technical, market and policy issues related to TSOs, interfacing with the energy
users, EU institutions, regulators and national governments.
o ENTSO's work products contribute to security of supply, a seamless, pan-
European internal energy market, a secure integration of renewable resources
and a reliable future-oriented grid, adequate to energy policy goals.
Regional Cooperation
o Although there is no specific reference to the already -established regulatory
framework for regional cooperation (ERGEG Regional Initiatives), there is a clear
reference to the need for cross-border cooperation between regulators and
administrators, while the Commission has stated that it does not wish to inhibit
the action of regional initiatives.
o Benchmark for cooperation is the geographical areas defined in the Regulations
and provides for the possibility that cooperation may cover other geographical
areas as well
o ACER Regulation: ACER will take account of the conclusions of the work of
regional cooperation in decision making.
o Individual manifestations of Regional Cooperation
(i) Mechanisms for Regional Cooperation - regional solidarity mechanisms -
(Example: coordinated regional programs of emergency)
(ii) International regional cooperation
(iii) Regional Co-Trustees (with expressed obligation, among others, to
elaborate regional development programs).
o Conclusion: coordinating regional and national approaches during the transition
to a single European energy market remains a priority.
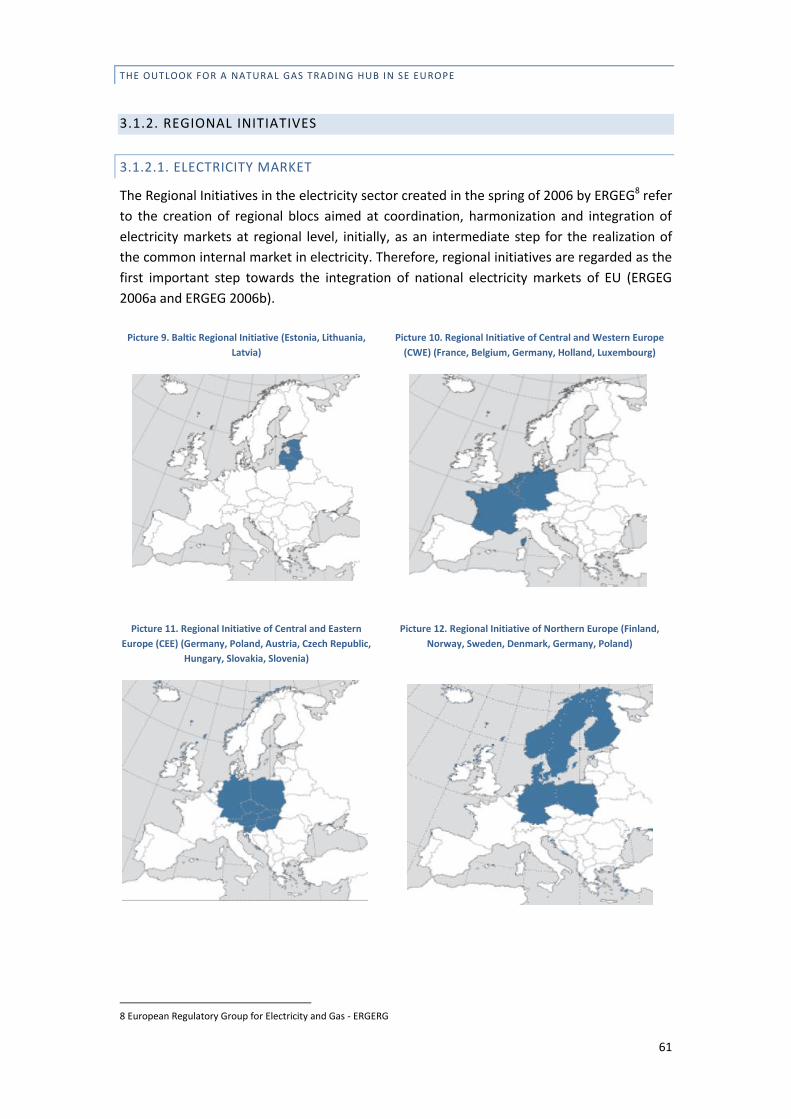
THE OUTLOOK FOR A NATURAL GAS TRADING HUB IN SE EUROPE
61
3.1.2. REGIONAL INITIATIVES
3.1.2.1. ELECTRICITY MARKET
The Regional Initiatives in the electricity sector created in the spring of 2006 by ERGEG8 refer
to the creation of regional blocs aimed at coordination, harmonization and integration of
electricity markets at regional level, initially, as an intermediate step for the realization of
the common internal market in electricity. Therefore, regional initiatives are regarded as the
first important step towards the integration of national electricity markets of EU (ERGEG
2006a and ERGEG 2006b).
Picture 9. Baltic Regional Initiative (Estonia, Lithuania,
Latvia)
Picture 10. Regional Initiative of Central and Western Europe
(CWE) (France, Belgium, Germany, Holland, Luxembourg)
Picture 11. Regional Initiative of Central and Eastern
Europe (CEE) (Germany, Poland, Austria, Czech Republic,
Hungary, Slovakia, Slovenia)
Picture 12. Regional Initiative of Northern Europe (Finland,
Norway, Sweden, Denmark, Germany, Poland)
8 European Regulatory Group for Electricity and Gas - ERGERG
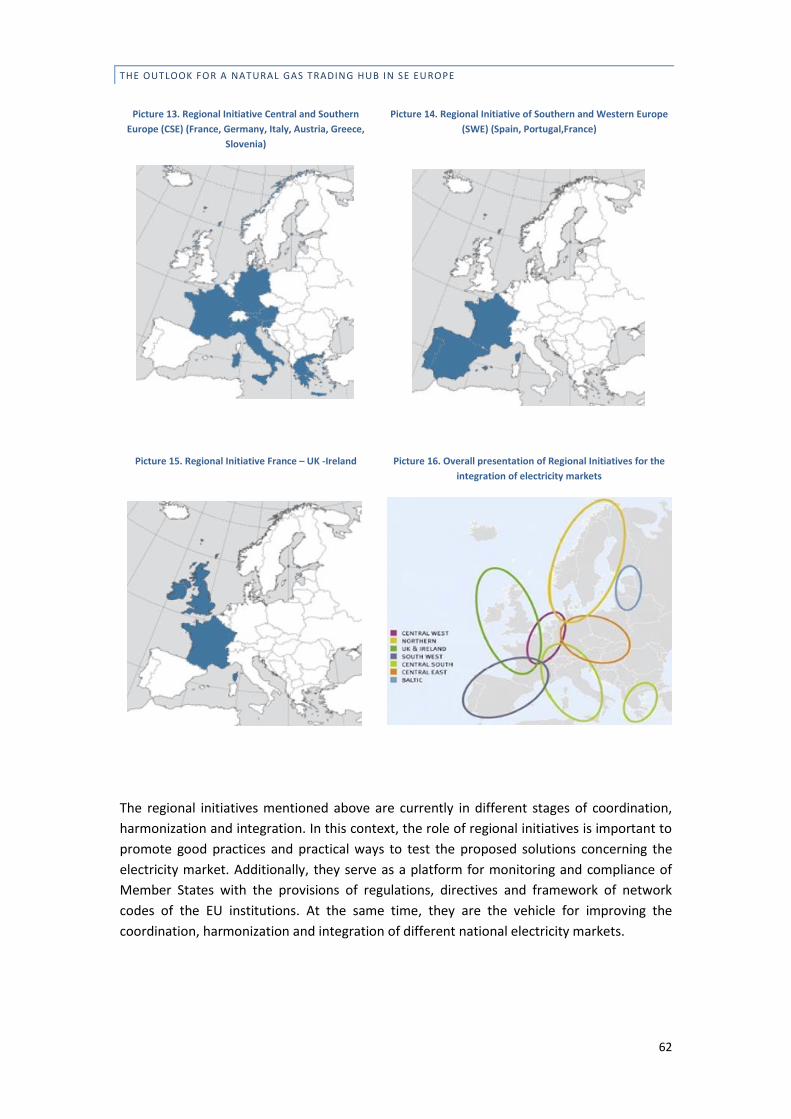
THE OUTLOOK FOR A NATURAL GAS TRADING HUB IN SE EUROPE
62
Picture 13. Regional Initiative Central and Southern
Europe (CSE) (France, Germany, Italy, Austria, Greece,
Slovenia)
Picture 14. Regional Initiative of Southern and Western Europe
(SWE) (Spain, Portugal,France)
Picture 15. Regional Initiative France – UK -Ireland
Picture 16. Overall presentation of Regional Initiatives for the
integration of electricity markets
The regional initiatives mentioned above are currently in different stages of coordination,
harmonization and integration. In this context, the role of regional initiatives is important to
promote good practices and practical ways to test the proposed solutions concerning the
electricity market. Additionally, they serve as a platform for monitoring and compliance of
Member States with the provisions of regulations, directives and framework of network
codes of the EU institutions. At the same time, they are the vehicle for improving the
coordination, harmonization and integration of different national electricity markets.
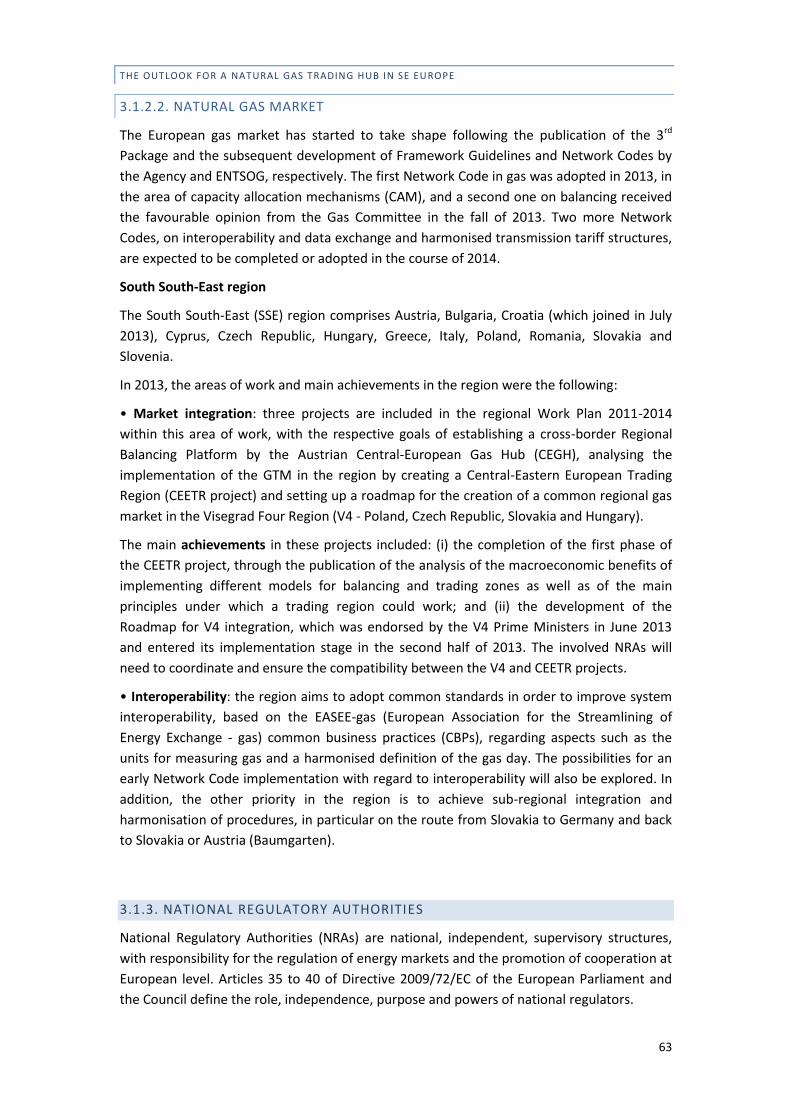
THE OUTLOOK FOR A NATURAL GAS TRADING HUB IN SE EUROPE
63
3.1.2.2. NATURAL GAS MARKET
The European gas market has started to take shape following the publication of the 3rd
Package and the subsequent development of Framework Guidelines and Network Codes by
the Agency and ENTSOG, respectively. The first Network Code in gas was adopted in 2013, in
the area of capacity allocation mechanisms (CAM), and a second one on balancing received
the favourable opinion from the Gas Committee in the fall of 2013. Two more Network
Codes, on interoperability and data exchange and harmonised transmission tariff structures,
are expected to be completed or adopted in the course of 2014.
South South-East region
The South South-East (SSE) region comprises Austria, Bulgaria, Croatia (which joined in July
2013), Cyprus, Czech Republic, Hungary, Greece, Italy, Poland, Romania, Slovakia and
Slovenia.
In 2013, the areas of work and main achievements in the region were the following:
• Market integration: three projects are included in the regional Work Plan 2011-2014
within this area of work, with the respective goals of establishing a cross-border Regional
Balancing Platform by the Austrian Central-European Gas Hub (CEGH), analysing the
implementation of the GTM in the region by creating a Central-Eastern European Trading
Region (CEETR project) and setting up a roadmap for the creation of a common regional gas
market in the Visegrad Four Region (V4 - Poland, Czech Republic, Slovakia and Hungary).
The main achievements in these projects included: (i) the completion of the first phase of
the CEETR project, through the publication of the analysis of the macroeconomic benefits of
implementing different models for balancing and trading zones as well as of the main
principles under which a trading region could work; and (ii) the development of the
Roadmap for V4 integration, which was endorsed by the V4 Prime Ministers in June 2013
and entered its implementation stage in the second half of 2013. The involved NRAs will
need to coordinate and ensure the compatibility between the V4 and CEETR projects.
• Interoperability: the region aims to adopt common standards in order to improve system
interoperability, based on the EASEE-gas (European Association for the Streamlining of
Energy Exchange - gas) common business practices (CBPs), regarding aspects such as the
units for measuring gas and a harmonised definition of the gas day. The possibilities for an
early Network Code implementation with regard to interoperability will also be explored. In
addition, the other priority in the region is to achieve sub-regional integration and
harmonisation of procedures, in particular on the route from Slovakia to Germany and back
to Slovakia or Austria (Baumgarten).
3.1.3. NATIONAL REGULATORY AUTHORITIES
National Regulatory Authorities (NRAs) are national, independent, supervisory structures,
with responsibility for the regulation of energy markets and the promotion of cooperation at
European level. Articles 35 to 40 of Directive 2009/72/EC of the European Parliament and
the Council define the role, independence, purpose and powers of national regulators.
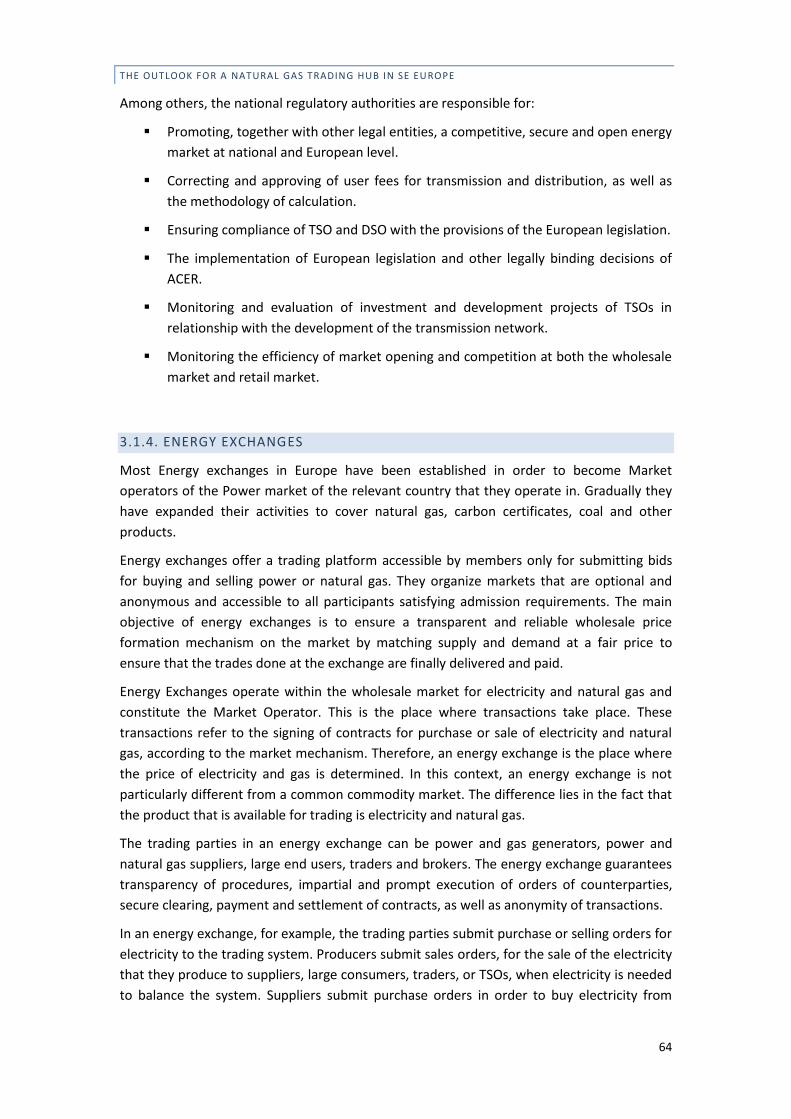
THE OUTLOOK FOR A NATURAL GAS TRADING HUB IN SE EUROPE
64
Among others, the national regulatory authorities are responsible for:
Promoting, together with other legal entities, a competitive, secure and open energy
market at national and European level.
Correcting and approving of user fees for transmission and distribution, as well as
the methodology of calculation.
Ensuring compliance of TSO and DSO with the provisions of the European legislation.
The implementation of European legislation and other legally binding decisions of
ACER.
Monitoring and evaluation of investment and development projects of TSOs in
relationship with the development of the transmission network.
Monitoring the efficiency of market opening and competition at both the wholesale
market and retail market.
3.1.4. ENERGY EXCHANGES
Most Energy exchanges in Europe have been established in order to become Market
operators of the Power market of the relevant country that they operate in. Gradually they
have expanded their activities to cover natural gas, carbon certificates, coal and other
products.
Energy exchanges offer a trading platform accessible by members only for submitting bids
for buying and selling power or natural gas. They organize markets that are optional and
anonymous and accessible to all participants satisfying admission requirements. The main
objective of energy exchanges is to ensure a transparent and reliable wholesale price
formation mechanism on the market by matching supply and demand at a fair price to
ensure that the trades done at the exchange are finally delivered and paid.
Energy Exchanges operate within the wholesale market for electricity and natural gas and
constitute the Market Operator. This is the place where transactions take place. These
transactions refer to the signing of contracts for purchase or sale of electricity and natural
gas, according to the market mechanism. Therefore, an energy exchange is the place where
the price of electricity and gas is determined. In this context, an energy exchange is not
particularly different from a common commodity market. The difference lies in the fact that
the product that is available for trading is electricity and natural gas.
The trading parties in an energy exchange can be power and gas generators, power and
natural gas suppliers, large end users, traders and brokers. The energy exchange guarantees
transparency of procedures, impartial and prompt execution of orders of counterparties,
secure clearing, payment and settlement of contracts, as well as anonymity of transactions.
In an energy exchange, for example, the trading parties submit purchase or selling orders for
electricity to the trading system. Producers submit sales orders, for the sale of the electricity
that they produce to suppliers, large consumers, traders, or TSOs, when electricity is needed
to balance the system. Suppliers submit purchase orders in order to buy electricity from
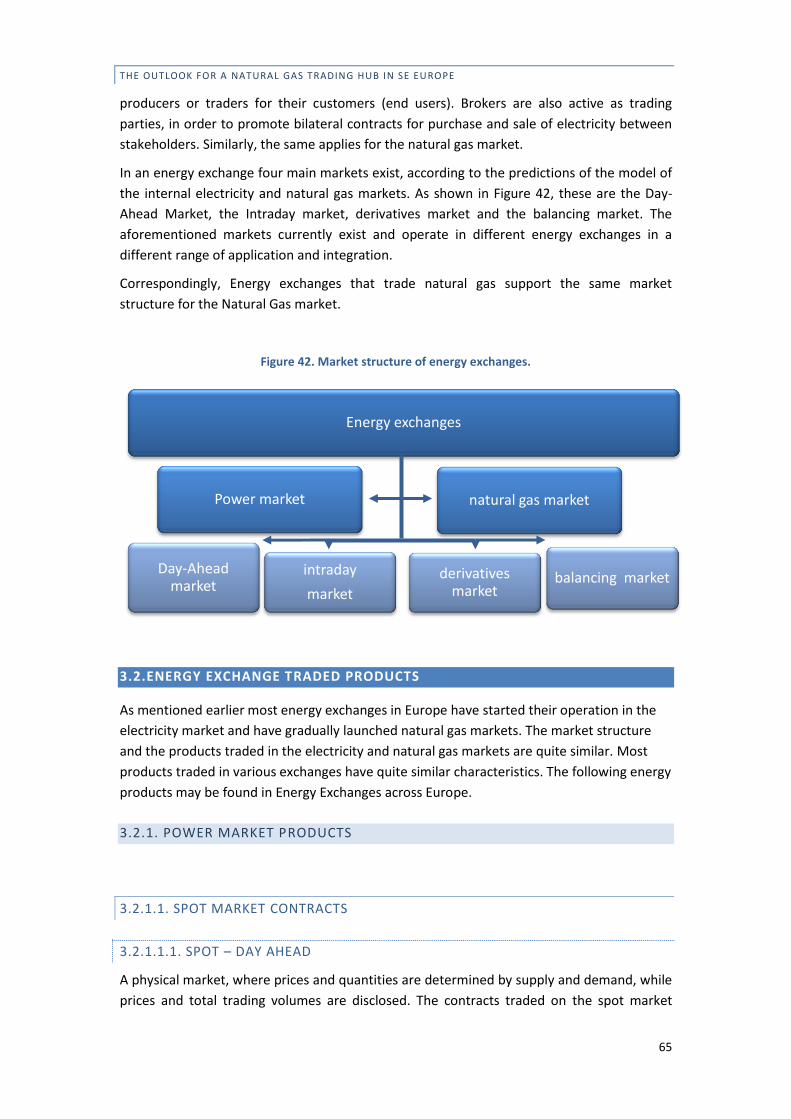
THE OUTLOOK FOR A NATURAL GAS TRADING HUB IN SE EUROPE
65
producers or traders for their customers (end users). Brokers are also active as trading
parties, in order to promote bilateral contracts for purchase and sale of electricity between
stakeholders. Similarly, the same applies for the natural gas market.
In an energy exchange four main markets exist, according to the predictions of the model of
the internal electricity and natural gas markets. As shown in Figure 42, these are the Day-
Ahead Market, the Intraday market, derivatives market and the balancing market. The
aforementioned markets currently exist and operate in different energy exchanges in a
different range of application and integration.
Correspondingly, Energy exchanges that trade natural gas support the same market
structure for the Natural Gas market.
Figure 42. Market structure of energy exchanges.
3.2.ENERGY EXCHANGE TRADED PRODUCTS
As mentioned earlier most energy exchanges in Europe have started their operation in the
electricity market and have gradually launched natural gas markets. The market structure
and the products traded in the electricity and natural gas markets are quite similar. Most
products traded in various exchanges have quite similar characteristics. The following energy
products may be found in Energy Exchanges across Europe.
3.2.1. POWER MARKET PRODUCTS
3.2.1.1. SPOT MARKET CONTRACTS
3.2.1.1.1. SPOT – DAY AHEAD
A physical market, where prices and quantities are determined by supply and demand, while
prices and total trading volumes are disclosed. The contracts traded on the spot market
Energy exchanges
Power market
Day-Ahead market
intraday
market
natural gas market
derivatives market
balancing market
THE OUTLOOK FOR A NATURAL GAS TRADING HUB IN SE EUROPE
66
involve the delivery and receipt of power on the day following the trading day (day ahead).
Trading is usually concluded at noon and deliveries take place from midnight to 24 hours
ahead. The producers and consumers of energy submit their tenders on the market from 12
to 36 hours before delivery, indicating the amount of electricity supplied or demanded and
the corresponding price. Then, for each hour, the price cleared in the market is determined
in the energy exchange. In principle, all energy producers and consumers can trade in the
energy exchange, but in reality, only large consumers (distribution companies, trading
companies and large industries) and producers operating in the market trade in, while
smaller businesses create marketing cooperatives (as in the case of wind turbines), or agree
with larger businesses so that they can act on their behalf .
This market mainly concerns:
Electricity producing companies
Intermediaries of Electricity trading
Electricity consumers
Wholesale electricity trading companies
Brokers and commodities brokerage companies.
3.2.1.1.2. SPOT – INTRADAY DAILY
Quite long time lags exist between the closing of trading on the day-ahead market, and the
settlement of the energy market. The Intraday market therefore acts as an "intermediate
market", where the participants of the day-ahead market may trade bilaterally. Usually, the
product negotiating is a contract with duration of one hour of supply of electricity. The
prices determined in this market are based on supply and demand.
Intraday trading is needed due to imbalances that are generated by sudden fluctuations in
total production or consumption in the respective units of production and consumption. The
variations are particularly likely in the production of wind energy, since it is difficult to
forecast the exact production more than a few hours earlier.
The intraday market aims to help increase competition by offering additional trading
opportunities, as the time of delivery is approaching. Thus, unexpected fluctuations in
supply and/or demand can be solved through changes in prices, according to the available
information used by market participants to assess their positions on the market.
In the Elbas market of Nord Pool, for example, electricity may be traded up to 1 hour prior to
delivery, whereas in the United Kingdom a group of markets operate in which participants
can correct previously underwriting positions via so-called NETA bilateral contracts. In this
case, the transactions made during the three and a half hours before delivery.
Most of these markets function with a continuous trading system, and some through the
auction system, as in the case of Spain.
THE OUTLOOK FOR A NATURAL GAS TRADING HUB IN SE EUROPE
67
3.2.1.1.3. SPOT – INTRADAY HOURLY – BALANCING SERVICES/REAL-TIME MARKET
To balance power generation to load at any time during real-time operations, system
operators use a balancing or real-time market. After the closure of the spot market,
participants can submit bids that specify the prices they require (offer) to increase their
generation or decrease their consumption (decrease their generation or increase their
consumption) for a specific volume immediately.
Such balancing services (also referred to as ancillary services), for which competitive market
mechanisms are increasingly sought, cover the provision of a number of services, for
instance voltage control, frequency response and reactive power support.
Some grid operators in Europe have started to procure the capacities and energy necessary
to provide ancillary services from other companies via published auctions. This currently still
fragmented market is expected to become increasingly integrated in the near future.
Therefore, especially the tertiary and minute-reserve market could turn into a liquid
wholesale market, as there are many power producers who are able to provide those
services and to meet the existing substantial needs of both the grid operators and the
suppliers in this direction. Furthermore, as there is no need to make additional investments
in technical equipment, the market access barrier is small.
CHP plants could basically provide these services, too, given that sufficient capacity is being
held in reserve for these purposes when optimizing the unit commitment and/or
dispatching. The authority responsible for the bidding at the market has – sometimes
simultaneously – to find the best bidding strategy for electricity, reserve capacity, heat, and
possibly fuel in order to maximize profits.
3.2.1.2. DERIVATIVES
Financial contracts used to hedge price changes and for risk management. The contracts
have a time horizon of up to six years, covering daily, weekly, monthly, quarterly and annual
contracts. The system price calculated in the spot market is used as a reference value
(underlying) for the derivatives market.
No physical delivery is provided for financial electricity contracts. The cash settlement takes
place throughout the course of trading – and/or maturity, commencing on the expiration
date of each contract, depending on whether the product is a futures or forward. Technical
terms, such as traffic congestion and network access are not taken into account when
negotiating these contracts. However, buyers and sellers can with the help of derivative
financial contracts of the energy market manage risks related to prices in the underlying
market.
THE OUTLOOK FOR A NATURAL GAS TRADING HUB IN SE EUROPE
68
3.2.1.2.1. FUTURES - FORWARDS
Futures and forwards are traded on most energy exchanges in Europe, usually as contracts
involving cash settlement, while there is a great variety of available maturities which are
weekly, monthly, quarterly, and yearly.
A forward contract with physical delivery for electrical power supply (power derivative) is a
contract in which the seller (issuer of the contract) is committing to deliver electrical power
on a specific date (term) in the future, at a specified price and the buyer (buyer of the
contract) commits to purchase electrical power on a specified date and at a specified price.
Forward contracts with physical delivery allow setting the price of electrical power over a
longer time horizon, which creates significant price incentives for investors planning to build
new generation capacity. They allow power dealers and large consumers to forecast the
prices and optimize their costs of buying/selling electrical power.
One of the key characteristics, which differentiate a futures contract from a forward
contract, is the fact that, in the former, the gains and losses resulting from price fluctuation,
during the trading phase, are settled on a daily basis while in the latter this only occurs
during the contract delivery period and on a monthly basis.
Futures are also distinguished based on the period of time during each day for which
delivery of electricity is agreed. The available options refer to the base load, meaning the
delivery of power for 24 hours per day, the peak hours and the off peak hours. The peak load
time span varies in each market, depending on the needs of the respective network of the
reference country. Usually it refers to a period of 8:00 to 20:00.
Settlement of futures contracts involves both a daily mark-to-market settlement and a final
spot reference cash settlement, after the contract reaches its expiry date. Mark-to-market
settlement covers profit or loss from day-to-day changes in the daily closing price of each
contract. Final settlement, which begins at delivery, covers the difference between the final
closing price of the futures contract and the system price in the delivery period. Throughout
the final settlement period, which starts on the expiry date, the member is credited/debited
an amount equal to the difference between the spot market price and the futures contracts
final closing price.
Execution of the contract (physical delivery)
On the day dated one day before the delivery date (after closure of the trading session) the
contract is being reduced by the amount of energy subject to delivery on particular hours of
the delivery date. Execution of a forward contract means physical delivery of the energy, in
compliance with the scheduled period of delivery, depending on the type of contract, in a
breakdown adequate to the daily energy batches, corresponding to the following product:
"number of hours during the day (depending on the type of contract) x number of
contracts"
As a result, in the execution period, forward contracts are converted to physical contracts
(so-called reduced contracts) with a volume decreasing daily by the daily volume of energy
delivery.
THE OUTLOOK FOR A NATURAL GAS TRADING HUB IN SE EUROPE
69
3.2.1.2.2. OPTIONS
Similar to the financial options, options in the energy exchange give the right to the owner
to purchase electricity (call option) or sell (put option) a certain quantity of electricity at a
specified future date (or time span) at a predetermined exercise price.
The buyer of a call option (call) is entitled to receive a long position in the
corresponding Base Month Future at the exercise price of the option on the last
trading day.
The seller of the call option (call) receives a short position in the corresponding Base
Month Future after the call option is exercised and assigned at the exercise price on
the last trading day.
They buyer of a put option (put) is entitled to receive a short position in the
corresponding Base Month Future at the exercise price of the option on the last
trading day.
The seller of the put option (put) receives a long position in the corresponding Base
MonthFuture at the exercise price after the put option is exercised and assigned on
the last trading day.
The buyer of an option contract is obliged to pay the price for the purchase of the right of
option (option premium) on the Business Day after the purchase. The premium is credited to
the seller of the option on the same day.
Power exchange options are usually European type, i.e. the option can only be exercised on
the last trading day.
Maturities are usually Month, Quarter, Season and Year.
The option can only be exercised on the last trading day. Said exercise is carried out by
means of an entry into the system between 08:00 a.m. and 03:00 p.m. (Exercise Period) on
the last trading day. On the last trading day the exchange determines the intraday market
value of the underlying and publishes it in due time before the end of the Exercise Period.
3.2.2. NATURAL GAS
3.2.2.1. SPOT MARKET CONTRACTS
Similarly to the electricity market, the spot market for natural gas is separated in the Day
Ahead, the Intraday and the balancing market.
Contracts for the physical delivery and receipt of gas are being traded in the spot market of
Energy exchanges around the clock (24/7) and on all calendar days of the year. The spot
contracts for natural gas are block contracts for the delivery and/or supply of gas at a
constant rate of delivery for daily load (Daily Natural Gas Contracts) or weekend (Natural
Gas weekend Contracts), as well as the variable delivery capacity on an intraday basis
(Intraday Natural Gas Contracts).
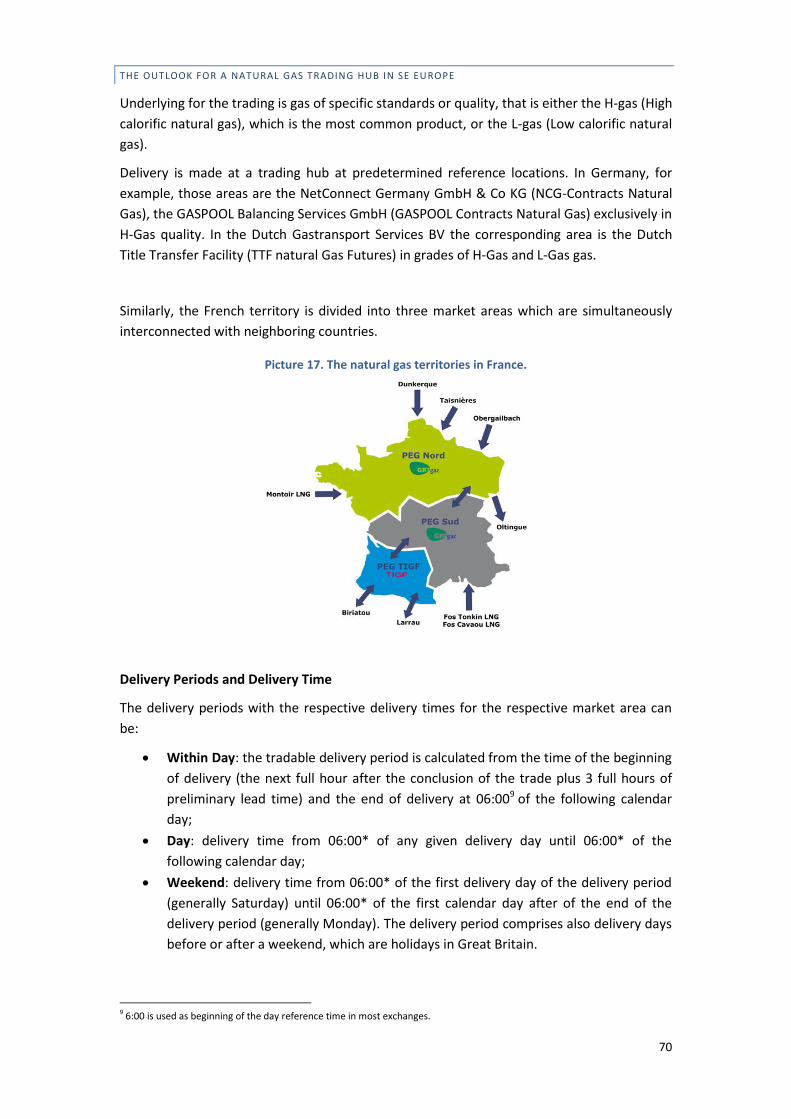
THE OUTLOOK FOR A NATURAL GAS TRADING HUB IN SE EUROPE
70
Underlying for the trading is gas of specific standards or quality, that is either the H-gas (High
calorific natural gas), which is the most common product, or the L-gas (Low calorific natural
gas).
Delivery is made at a trading hub at predetermined reference locations. In Germany, for
example, those areas are the NetConnect Germany GmbH & Co KG (NCG-Contracts Natural
Gas), the GASPOOL Balancing Services GmbH (GASPOOL Contracts Natural Gas) exclusively in
H-Gas quality. In the Dutch Gastransport Services BV the corresponding area is the Dutch
Title Transfer Facility (TTF natural Gas Futures) in grades of H-Gas and L-Gas gas.
Similarly, the French territory is divided into three market areas which are simultaneously
interconnected with neighboring countries.
Picture 17. The natural gas territories in France.
Delivery Periods and Delivery Time
The delivery periods with the respective delivery times for the respective market area can
be:
Within Day: the tradable delivery period is calculated from the time of the beginning
of delivery (the next full hour after the conclusion of the trade plus 3 full hours of
preliminary lead time) and the end of delivery at 06:009 of the following calendar
day;
Day: delivery time from 06:00* of any given delivery day until 06:00* of the
following calendar day;
Weekend: delivery time from 06:00* of the first delivery day of the delivery period
(generally Saturday) until 06:00* of the first calendar day after of the end of the
delivery period (generally Monday). The delivery period comprises also delivery days
before or after a weekend, which are holidays in Great Britain.
9 6:00 is used as beginning of the day reference time in most exchanges.
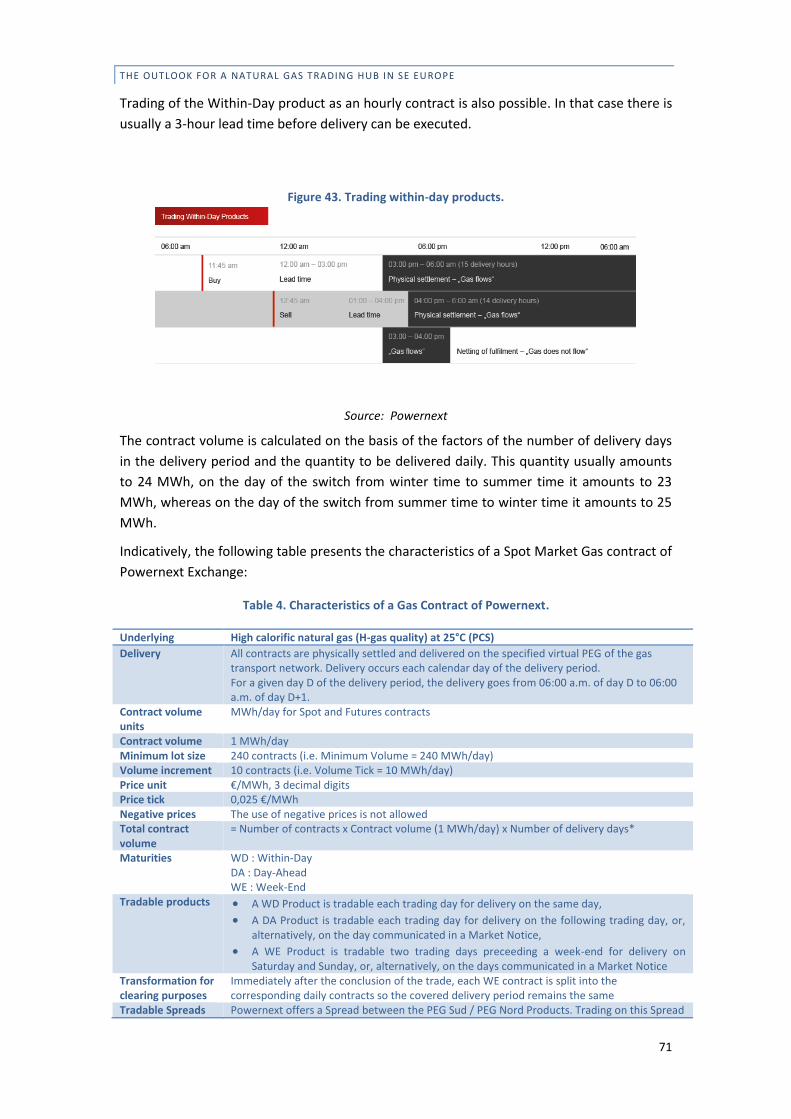
THE OUTLOOK FOR A NATURAL GAS TRADING HUB IN SE EUROPE
71
Trading of the Within-Day product as an hourly contract is also possible. In that case there is
usually a 3-hour lead time before delivery can be executed.
Figure 43. Trading within-day products.
Source: Powernext
The contract volume is calculated on the basis of the factors of the number of delivery days
in the delivery period and the quantity to be delivered daily. This quantity usually amounts
to 24 MWh, on the day of the switch from winter time to summer time it amounts to 23
MWh, whereas on the day of the switch from summer time to winter time it amounts to 25
MWh.
Indicatively, the following table presents the characteristics of a Spot Market Gas contract of
Powernext Exchange:
Table 4. Characteristics of a Gas Contract of Powernext.
Underlying High calorific natural gas (H-gas quality) at 25°C (PCS)
Delivery All contracts are physically settled and delivered on the specified virtual PEG of the gas transport network. Delivery occurs each calendar day of the delivery period. For a given day D of the delivery period, the delivery goes from 06:00 a.m. of day D to 06:00 a.m. of day D+1.
Contract volume units
MWh/day for Spot and Futures contracts
Contract volume 1 MWh/day Minimum lot size 240 contracts (i.e. Minimum Volume = 240 MWh/day) Volume increment 10 contracts (i.e. Volume Tick = 10 MWh/day) Price unit €/MWh, 3 decimal digits Price tick 0,025 €/MWh Negative prices The use of negative prices is not allowed Total contract volume
= Number of contracts x Contract volume (1 MWh/day) x Number of delivery days*
Maturities WD : Within-Day DA : Day-Ahead WE : Week-End
Tradable products A WD Product is tradable each trading day for delivery on the same day,
A DA Product is tradable each trading day for delivery on the following trading day, or, alternatively, on the day communicated in a Market Notice,
A WE Product is tradable two trading days preceeding a week-end for delivery on Saturday and Sunday, or, alternatively, on the days communicated in a Market Notice
Transformation for clearing purposes
Immediately after the conclusion of the trade, each WE contract is split into the corresponding daily contracts so the covered delivery period remains the same
Tradable Spreads Powernext offers a Spread between the PEG Sud / PEG Nord Products. Trading on this Spread
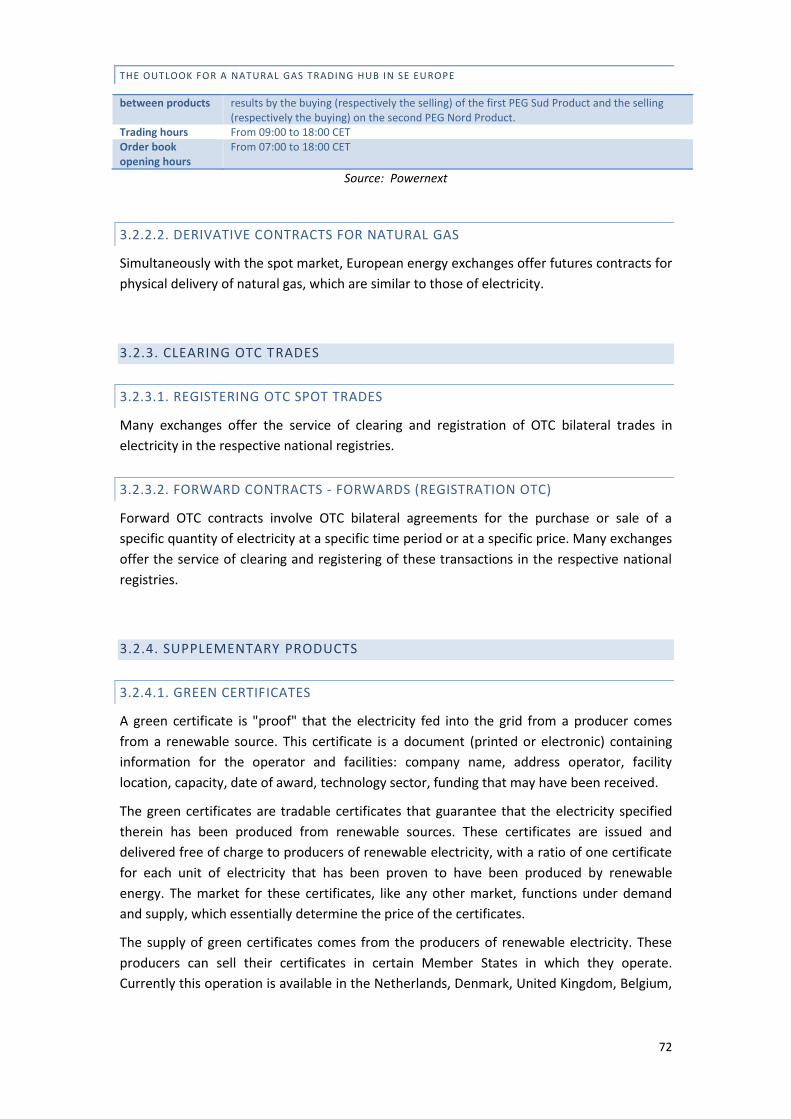
THE OUTLOOK FOR A NATURAL GAS TRADING HUB IN SE EUROPE
72
between products results by the buying (respectively the selling) of the first PEG Sud Product and the selling (respectively the buying) on the second PEG Nord Product.
Trading hours From 09:00 to 18:00 CET Order book opening hours
From 07:00 to 18:00 CET
Source: Powernext
3.2.2.2. DERIVATIVE CONTRACTS FOR NATURAL GAS
Simultaneously with the spot market, European energy exchanges offer futures contracts for
physical delivery of natural gas, which are similar to those of electricity.
3.2.3. CLEARING OTC TRADES
3.2.3.1. REGISTERING OTC SPOT TRADES
Many exchanges offer the service of clearing and registration of OTC bilateral trades in
electricity in the respective national registries.
3.2.3.2. FORWARD CONTRACTS - FORWARDS (REGISTRATION OTC)
Forward OTC contracts involve OTC bilateral agreements for the purchase or sale of a
specific quantity of electricity at a specific time period or at a specific price. Many exchanges
offer the service of clearing and registering of these transactions in the respective national
registries.
3.2.4. SUPPLEMENTARY PRODUCTS
3.2.4.1. GREEN CERTIFICATES
A green certificate is "proof" that the electricity fed into the grid from a producer comes
from a renewable source. This certificate is a document (printed or electronic) containing
information for the operator and facilities: company name, address operator, facility
location, capacity, date of award, technology sector, funding that may have been received.
The green certificates are tradable certificates that guarantee that the electricity specified
therein has been produced from renewable sources. These certificates are issued and
delivered free of charge to producers of renewable electricity, with a ratio of one certificate
for each unit of electricity that has been proven to have been produced by renewable
energy. The market for these certificates, like any other market, functions under demand
and supply, which essentially determine the price of the certificates.
The supply of green certificates comes from the producers of renewable electricity. These
producers can sell their certificates in certain Member States in which they operate.
Currently this operation is available in the Netherlands, Denmark, United Kingdom, Belgium,

THE OUTLOOK FOR A NATURAL GAS TRADING HUB IN SE EUROPE
73
Italy, Sweden, and subsequently throughout the EU if the green credentials are mutually
recognized by all EU Member States.
Currently in Greece there is no legal framework for the issuance and trading of "Green
Certificates". Although the National Policy sets a target for the minimum energy production
from renewable sources, there is no regulatory framework that specifies the procedures and
requirements for the certification of electricity from renewable sources.
Consequently, since the mechanism of "Green Certificates" is not supported by relevant laws
and is not applicable in Greece, green certificates cannot be issued in Greece, or purchased
abroad and used in Greece.
3.2.4.2. RENEWABLE ENERGY CERTIFICATES, GUARANTEE OF ORIGIN
A Renewable Energy Certificate (REC) or a guarantee of origin is a certificate that proves
that power is produced from renewable energy sources. A certificate represents the
production of a megawatt hour of electricity. A REC is sold separately from the power
output. The buyer of a REC can claim after the acquisition that he has purchased renewable
energy.
When the competent body for issuing the certificate - issuing authority – is appointed by the
government, the system is called system of guarantee of origin or GO-system, and when the
issuing agency is appointed by market players it is called RECS-system. In some cases a
guarantee of origin shall be accepted by a system of RECs, but the reverse is not possible.
The Guarantee of Origin and the REC certificates are standardized within the European
Energy Certification System and exclude one another (dual version is not possible).
There are currently 16 countries with a standardized system certificate. The issuing authority
as a member of the Association of Issuing Bodies (AIB) allows market players to transfer
licenses from one system (or country) to another.
The European Energy Certification System (EECS) is a commercially funded, comprehensive
European framework for the issuance, holding, transfer and processing of different
electronic files. It is developed by the AIB to provide a suitable platform for setting
Guarantees of Origin Renewable Energy, as proposed by Directive 2009/28/EC (Directive on
renewable energy), which supports the Directive 2009/72 / EC (Directive on the internal
market in electricity). The EECS supports all types of electricity, regardless of the source or
production technology.
In Greece the corresponding certificates are offered through the following procedure:
• Guarantee of Origin (GO): The electronic certificate issued by the Competent Body Issue
(Independent Power Transmission Operator (IPTO), certifying the origin of 1MWh of
electricity produced from a RES or CHP facility for a specified period.
• Purpose of GO: It is proof to the final user that a proportion or amount of electricity has
been produced from RES or CHP even though the electricity supplier has no renewable
energy or CHP capacity of its own.
THE OUTLOOK FOR A NATURAL GAS TRADING HUB IN SE EUROPE
74
• issuing body:
a) The responsible Operators or CRES as defined in Article 16 of L.3468/2006 order for
electricity produced from RES and
b) For electricity produced from high efficiency cogeneration without using RES, the
Transmission System Operator where the establishment is located in the geographical
area served by the interconnected system (either connected to the system directly or
through the Network, or a stand-alone installation) and the non-Interconnected Islands
when installed in a non-interconnected islands (whether connected to the network of the
island or stand-alone installation).
• Supervision Authority: the Regulatory Authority for Energy (RAE) as defined in Article 16
of Law 3468/2006.
3.2.4.3. ENERGY SAVINGS CERTIFICATES
The energy saving certificate is a tradable certificate. Each energy saving certificate is
equivalent to one tonne of CO2-e from energy-saving activities.
In the environmental policy, energy saving certificates (ESC), or white certificates are
documents certifying that a certain reduction of energy consumption is achieved. In most
applications, white certificates are tradable and combined with an obligation to achieve a
specific savings target. Under this system, manufacturers, suppliers or distributors of
electricity, gas and oil are required to undertake energy efficiency for the end user, which is
consistent with a fixed percentage of the annual energy quantities they produce. If the
energy producers do not meet this target for energy consumption they are required to pay a
penalty. White certificates are given to producers whenever an amount of energy is saved,
so the manufacturer can use the certificate of conformity for their own goals or they may be
sold to others who cannot achieve their own respective goals. Quite similar to the closely
related concept of emissions trading, the liquidity in theory guarantees that the total energy
savings are achieved with the minimal cost while the certificates guarantee that the overall
savings target is achieved.
A white certificate, also called Energy Savings Certificate (ESC), Energy Efficiency Credit
(EEC), or white tag, is an instrument issued by an authorized body guaranteeing that a
certain amount of energy savings has been achieved. Each certificate is a unique and
identifiable commodity carrying a property right over a certain amount of additional energy
savings and ensures that the benefit of these savings has not been recorded elsewhere.
A white certificate can be expressed in units of energy saving, such as 1 megawatt hour
(MWh), or in common energy units that allow direct comparisons of efficiency between gas
and electricity saving, such as British thermal units or tons of oil equivalent. White
certificates can be designed to incorporate estimated savings over the expected life of the
measure or represent efficiency savings on an annual accumulated basis. The assignment of
one MWh to a white certificate simplifies its use, making it easier to compare with the
Renewable Energy Certificate (REC).
White certificates can be used for the purchase and sale of the social and environmental
benefits as a separate product, either bilaterally or at auction, with the package of benefits
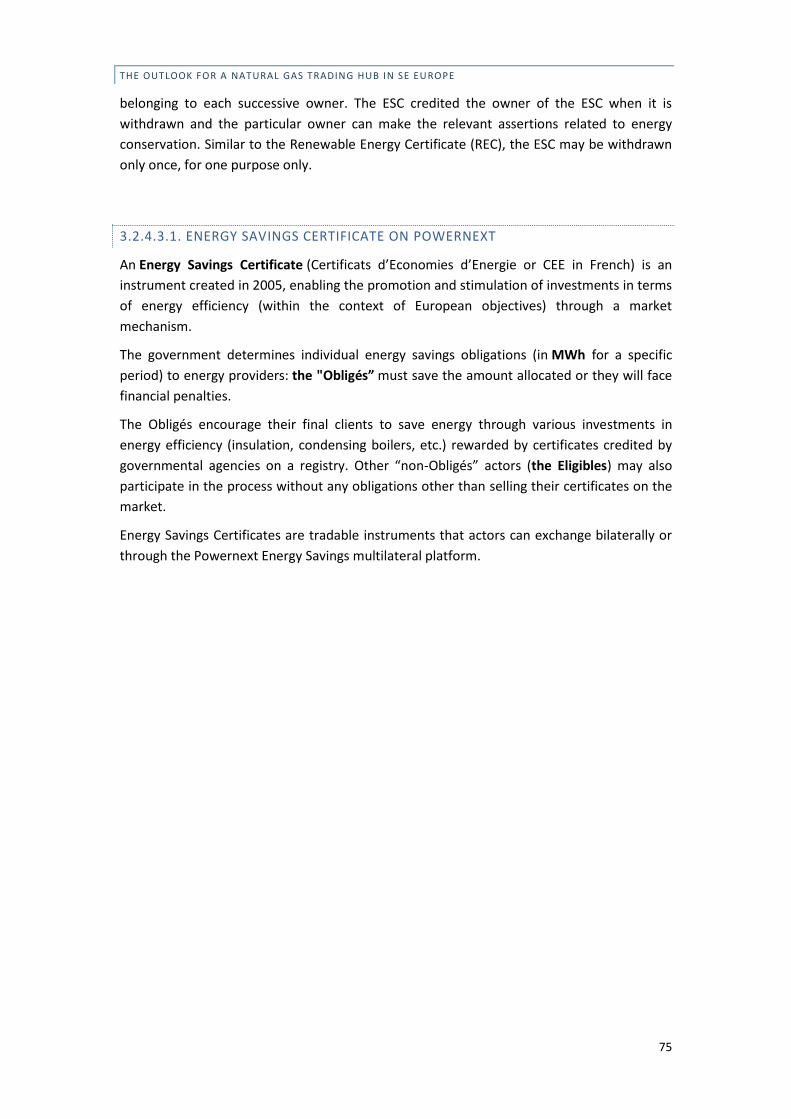
THE OUTLOOK FOR A NATURAL GAS TRADING HUB IN SE EUROPE
75
belonging to each successive owner. The ESC credited the owner of the ESC when it is
withdrawn and the particular owner can make the relevant assertions related to energy
conservation. Similar to the Renewable Energy Certificate (REC), the ESC may be withdrawn
only once, for one purpose only.
3.2.4.3.1. ENERGY SAVINGS CERTIFICATE ON POWERNEXT
An Energy Savings Certificate (Certificats d’Economies d’Energie or CEE in French) is an
instrument created in 2005, enabling the promotion and stimulation of investments in terms
of energy efficiency (within the context of European objectives) through a market
mechanism.
The government determines individual energy savings obligations (in MWh for a specific
period) to energy providers: the "Obligés” must save the amount allocated or they will face
financial penalties.
The Obligés encourage their final clients to save energy through various investments in
energy efficiency (insulation, condensing boilers, etc.) rewarded by certificates credited by
governmental agencies on a registry. Other “non-Obligés” actors (the Eligibles) may also
participate in the process without any obligations other than selling their certificates on the
market.
Energy Savings Certificates are tradable instruments that actors can exchange bilaterally or
through the Powernext Energy Savings multilateral platform.
THE OUTLOOK FOR A NATURAL GAS TRADING HUB IN SE EUROPE
76
3.3. EUROPEAN ENERGY EXCHANGES
Picture 18. Energy exchanges across Europe.
The most significant Energy Exchanges in Europe are:
3.3.1. NASDAQ OΜX COMMODITIES – NORDPOOL SPOT AS
It is one of the largest and most active energy exchanges in Europe, located in Norway (since
2002), and operating in Sweden, Finland and Denmark, and present in Germany and the
United Kingdom. The NordPool Spot AS operates the spot market for electricity, while
Nasdaq OMX Commodities provides trading and clearing of Nordic and international power
derivatives, European Union allowances (EUAs) and certified emission reductions (CERs).
3.3.1.1. NASDAQ OMX COMMODITIES
www.nasdaqomxcommodities.com
The products traded at NASDAQ OMX
Commodities Europe’s financial market
comprise of Nordic, German, Dutch and UK
power derivatives, European Union allowances (EUA) and certified emission reductions
(CER). The derivatives are base and peak load futures, Deferred Settlement Futures (DS
Futures), options, and Electricity Price Area Differentials (EPAD).
These contracts are used for trading and risk management purposes, and have a current
trading time horizon of up to six years. Base load contracts are delivered Mon-Sun, 00.00–
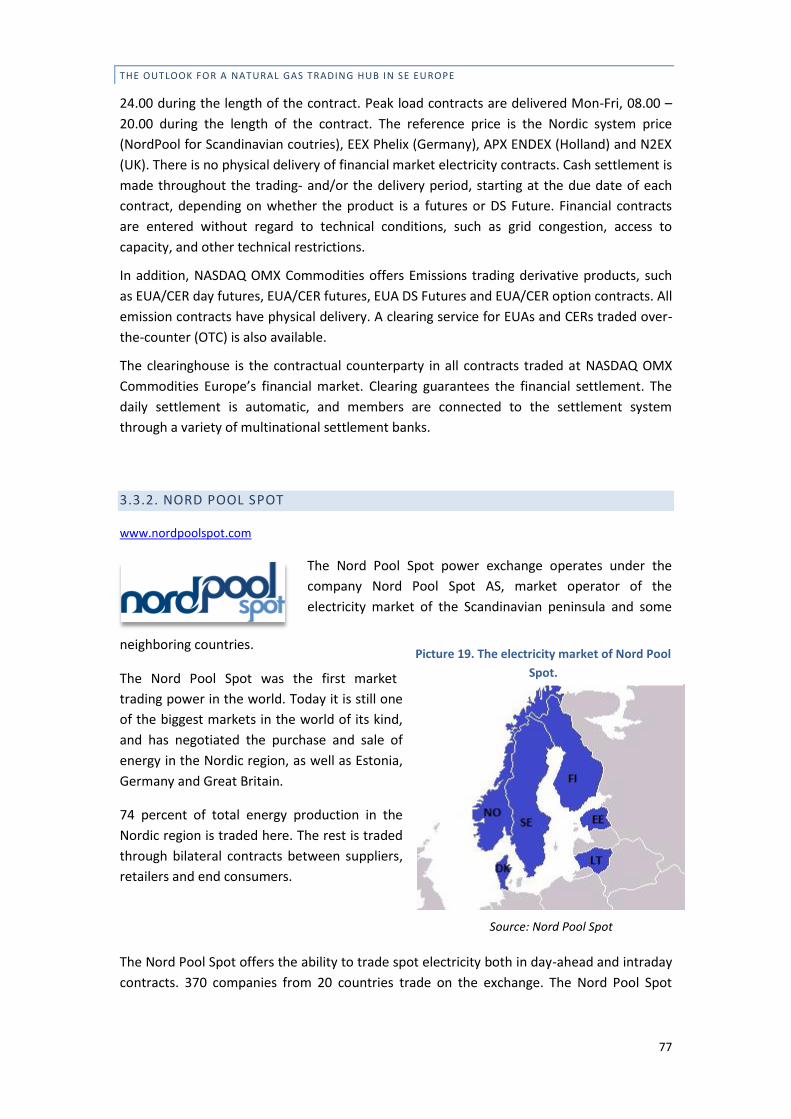
THE OUTLOOK FOR A NATURAL GAS TRADING HUB IN SE EUROPE
77
24.00 during the length of the contract. Peak load contracts are delivered Mon-Fri, 08.00 –
20.00 during the length of the contract. The reference price is the Nordic system price
(NordPool for Scandinavian coutries), EEX Phelix (Germany), APX ENDEX (Holland) and N2EX
(UK). There is no physical delivery of financial market electricity contracts. Cash settlement is
made throughout the trading- and/or the delivery period, starting at the due date of each
contract, depending on whether the product is a futures or DS Future. Financial contracts
are entered without regard to technical conditions, such as grid congestion, access to
capacity, and other technical restrictions.
In addition, NASDAQ OMX Commodities offers Emissions trading derivative products, such
as EUA/CER day futures, EUA/CER futures, EUA DS Futures and EUA/CER option contracts. All
emission contracts have physical delivery. A clearing service for EUAs and CERs traded over-
the-counter (OTC) is also available.
The clearinghouse is the contractual counterparty in all contracts traded at NASDAQ OMX
Commodities Europe’s financial market. Clearing guarantees the financial settlement. The
daily settlement is automatic, and members are connected to the settlement system
through a variety of multinational settlement banks.
3.3.2. NORD POOL SPOT
www.nordpoolspot.com
The Nord Pool Spot power exchange operates under the
company Nord Pool Spot AS, market operator of the
electricity market of the Scandinavian peninsula and some
neighboring countries.
The Nord Pool Spot was the first market
trading power in the world. Today it is still one
of the biggest markets in the world of its kind,
and has negotiated the purchase and sale of
energy in the Nordic region, as well as Estonia,
Germany and Great Britain.
74 percent of total energy production in the
Nordic region is traded here. The rest is traded
through bilateral contracts between suppliers,
retailers and end consumers.
The Nord Pool Spot offers the ability to trade spot electricity both in day-ahead and intraday
contracts. 370 companies from 20 countries trade on the exchange. The Nord Pool Spot
Source: Nord Pool Spot
Picture 19. The electricity market of Nord Pool
Spot.
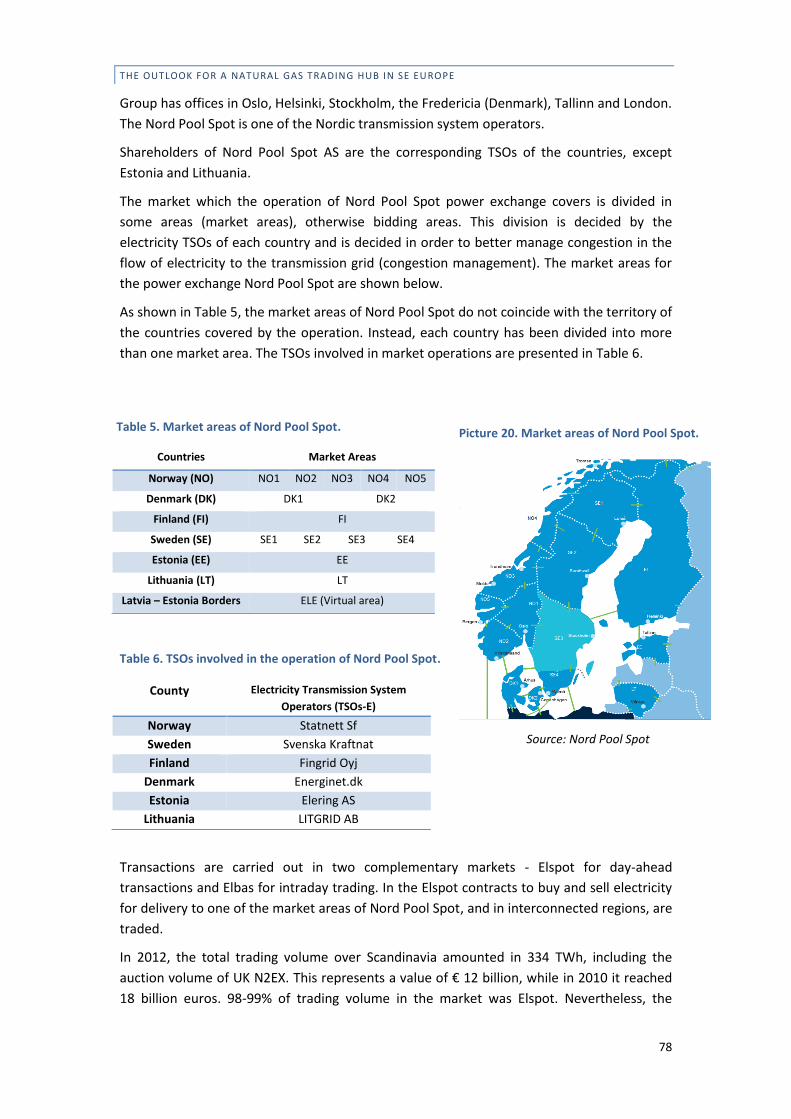
THE OUTLOOK FOR A NATURAL GAS TRADING HUB IN SE EUROPE
78
Group has offices in Oslo, Helsinki, Stockholm, the Fredericia (Denmark), Tallinn and London.
The Nord Pool Spot is one of the Nordic transmission system operators.
Shareholders of Nord Pool Spot AS are the corresponding TSOs of the countries, except
Estonia and Lithuania.
The market which the operation of Nord Pool Spot power exchange covers is divided in
some areas (market areas), otherwise bidding areas. This division is decided by the
electricity TSOs of each country and is decided in order to better manage congestion in the
flow of electricity to the transmission grid (congestion management). The market areas for
the power exchange Nord Pool Spot are shown below.
As shown in Table 5, the market areas of Nord Pool Spot do not coincide with the territory of
the countries covered by the operation. Instead, each country has been divided into more
than one market area. The TSOs involved in market operations are presented in Table 6.
Table 6. TSOs involved in the operation of Nord Pool Spot.
Transactions are carried out in two complementary markets - Elspot for day-ahead
transactions and Elbas for intraday trading. In the Elspot contracts to buy and sell electricity
for delivery to one of the market areas of Nord Pool Spot, and in interconnected regions, are
traded.
In 2012, the total trading volume over Scandinavia amounted in 334 TWh, including the
auction volume of UK N2EX. This represents a value of € 12 billion, while in 2010 it reached
18 billion euros. 98-99% of trading volume in the market was Elspot. Nevertheless, the
Table 5. Market areas of Nord Pool Spot.
Countries Market Areas
Norway (NO) NO1 NO2 NO3 NO4 NO5
Denmark (DK) DK1 DK2
Finland (FI) FI
Sweden (SE) SE1 SE2 SE3 SE4
Estonia (EE) ΕΕ
Lithuania (LT) LT
Latvia – Estonia Borders ELE (Virtual area)
County Electricity Transmission System
Operators (TSOs-E)
Norway Statnett Sf
Sweden Svenska Kraftnat
Finland Fingrid Oyj
Denmark Energinet.dk
Estonia Elering AS
Lithuania LITGRID AB
Source: Nord Pool Spot
Picture 20. Market areas of Nord Pool Spot.
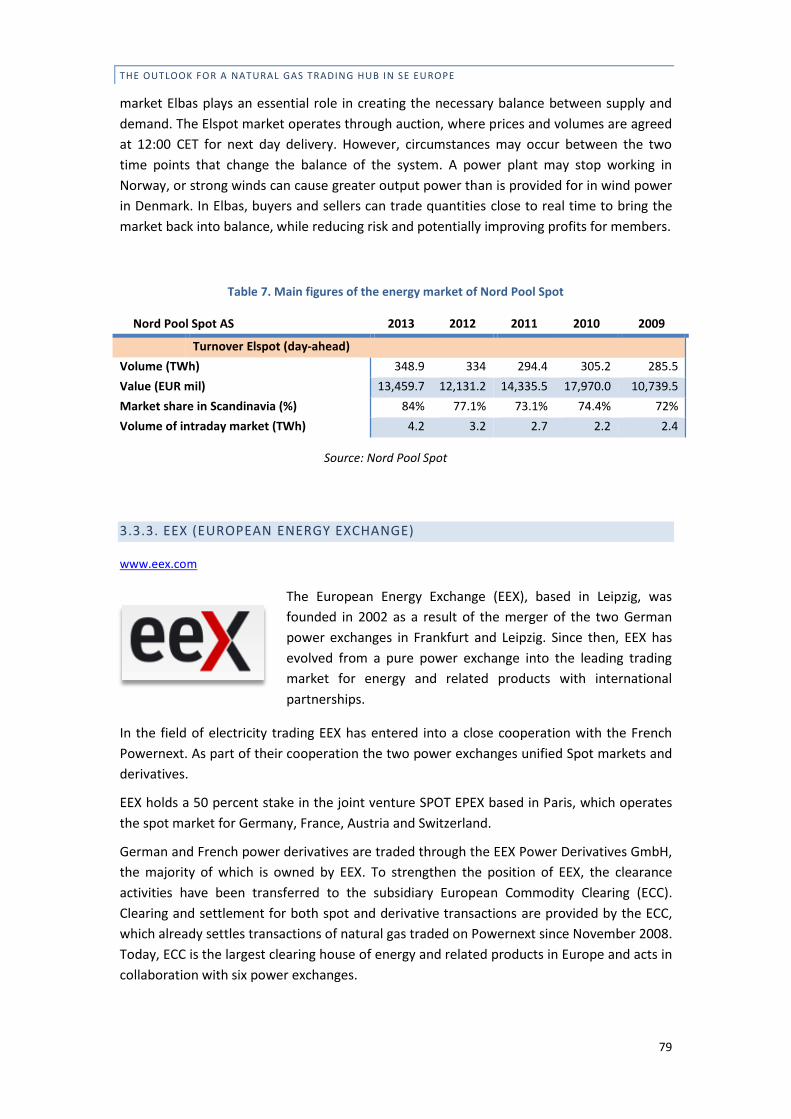
THE OUTLOOK FOR A NATURAL GAS TRADING HUB IN SE EUROPE
79
market Elbas plays an essential role in creating the necessary balance between supply and
demand. The Elspot market operates through auction, where prices and volumes are agreed
at 12:00 CET for next day delivery. However, circumstances may occur between the two
time points that change the balance of the system. A power plant may stop working in
Norway, or strong winds can cause greater output power than is provided for in wind power
in Denmark. In Elbas, buyers and sellers can trade quantities close to real time to bring the
market back into balance, while reducing risk and potentially improving profits for members.
Table 7. Main figures of the energy market of Nord Pool Spot
Nord Pool Spot AS 2013 2012 2011 2010 2009
Turnover Elspot (day-ahead)
Volume (TWh) 348.9 334 294.4 305.2 285.5
Value (EUR mil) 13,459.7 12,131.2 14,335.5 17,970.0 10,739.5
Market share in Scandinavia (%) 84% 77.1% 73.1% 74.4% 72%
Volume of intraday market (TWh) 4.2 3.2 2.7 2.2 2.4
3.3.3. ΕΕΧ (EUROPEAN ENERGY EXCHANGE)
www.eex.com
The European Energy Exchange (EEX), based in Leipzig, was
founded in 2002 as a result of the merger of the two German
power exchanges in Frankfurt and Leipzig. Since then, EEX has
evolved from a pure power exchange into the leading trading
market for energy and related products with international
partnerships.
In the field of electricity trading EEX has entered into a close cooperation with the French
Powernext. As part of their cooperation the two power exchanges unified Spot markets and
derivatives.
EEX holds a 50 percent stake in the joint venture SPOT EPEX based in Paris, which operates
the spot market for Germany, France, Austria and Switzerland.
German and French power derivatives are traded through the EEX Power Derivatives GmbH,
the majority of which is owned by EEX. To strengthen the position of EEX, the clearance
activities have been transferred to the subsidiary European Commodity Clearing (ECC).
Clearing and settlement for both spot and derivative transactions are provided by the ECC,
which already settles transactions of natural gas traded on Powernext since November 2008.
Today, ECC is the largest clearing house of energy and related products in Europe and acts in
collaboration with six power exchanges.
Source: Nord Pool Spot
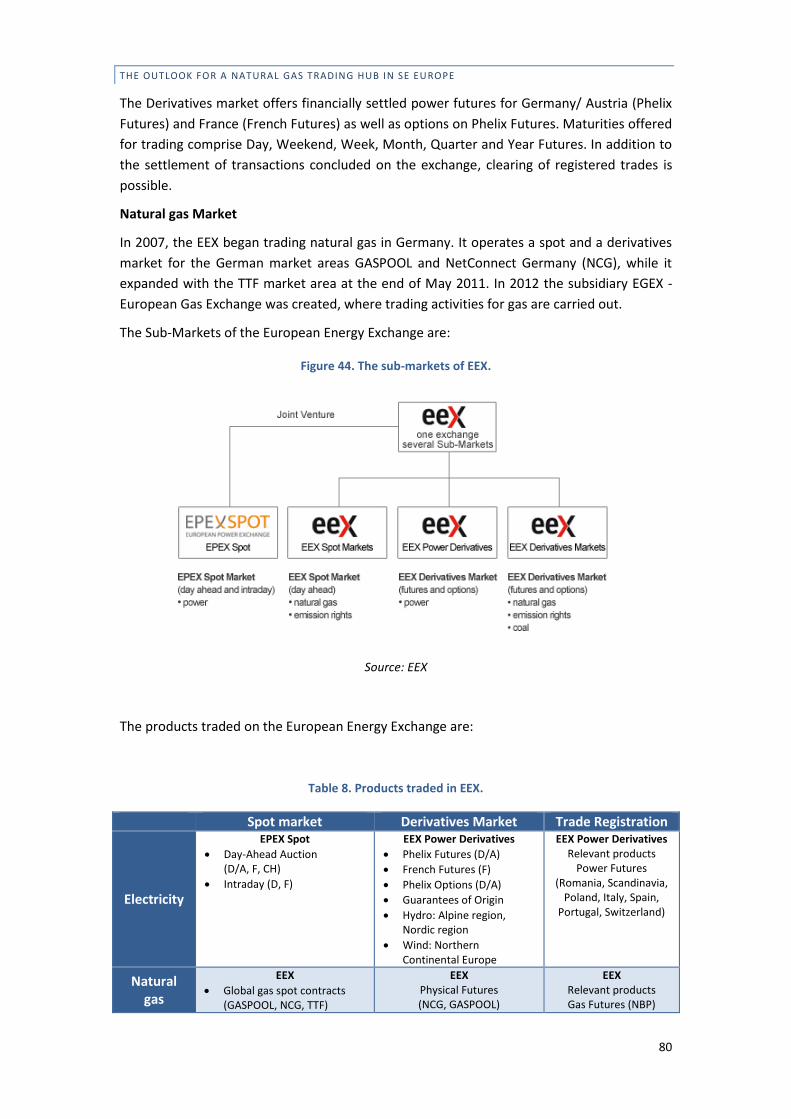
THE OUTLOOK FOR A NATURAL GAS TRADING HUB IN SE EUROPE
80
The Derivatives market offers financially settled power futures for Germany/ Austria (Phelix
Futures) and France (French Futures) as well as options on Phelix Futures. Maturities offered
for trading comprise Day, Weekend, Week, Month, Quarter and Year Futures. In addition to
the settlement of transactions concluded on the exchange, clearing of registered trades is
possible.
Natural gas Market
In 2007, the EEX began trading natural gas in Germany. It operates a spot and a derivatives
market for the German market areas GASPOOL and NetConnect Germany (NCG), while it
expanded with the TTF market area at the end of May 2011. In 2012 the subsidiary EGEX -
European Gas Exchange was created, where trading activities for gas are carried out.
The Sub-Markets of the European Energy Exchange are:
Figure 44. The sub-markets of EEX.
Source: EEX
The products traded on the European Energy Exchange are:
Table 8. Products traded in EEX.
Spot market Derivatives Market Trade Registration
Electricity
EPEX Spot
Day-Ahead Auction (D/A, F, CH)
Intraday (D, F)
EEX Power Derivatives
Phelix Futures (D/A)
French Futures (F)
Phelix Options (D/A)
Guarantees of Origin
Hydro: Alpine region, Nordic region
Wind: Northern Continental Europe
EEX Power Derivatives Relevant products
Power Futures (Romania, Scandinavia,
Poland, Italy, Spain, Portugal, Switzerland)
Natural gas
EEX
Global gas spot contracts (GASPOOL, NCG, TTF)
EEX Physical Futures (NCG, GASPOOL)
EEX Relevant products Gas Futures (NBP)
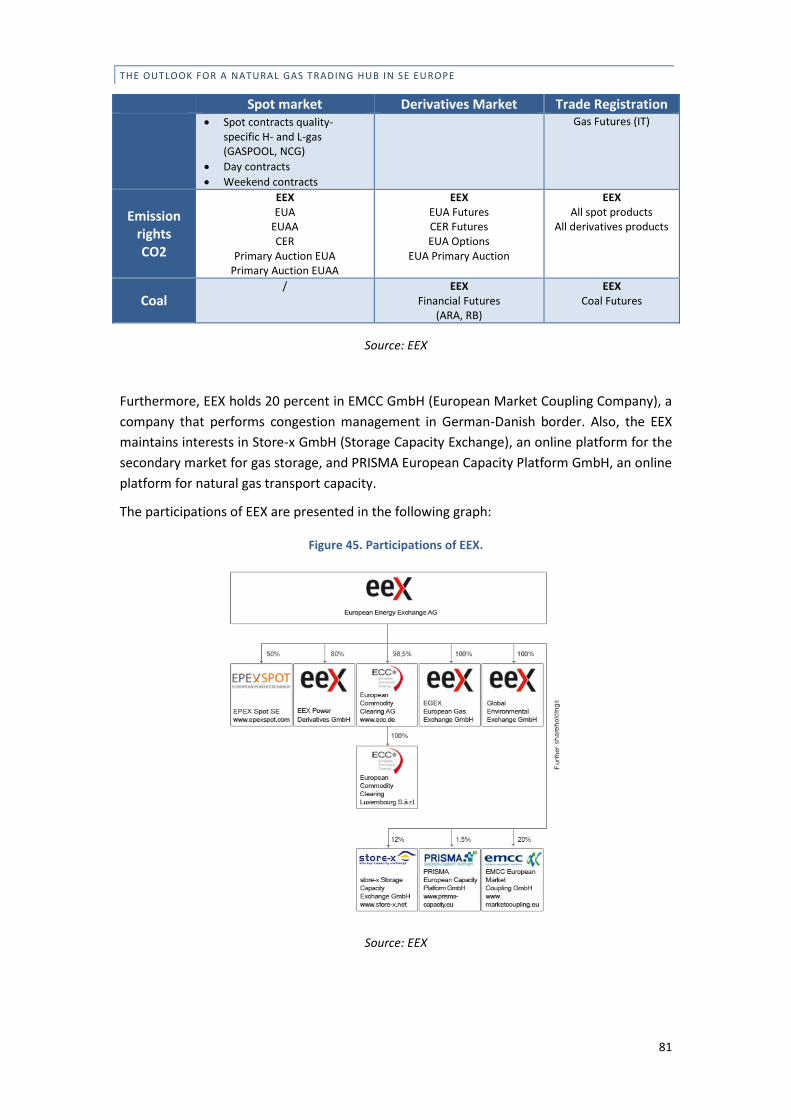
THE OUTLOOK FOR A NATURAL GAS TRADING HUB IN SE EUROPE
81
Spot market Derivatives Market Trade Registration Spot contracts quality-
specific H- and L-gas (GASPOOL, NCG)
Day contracts
Weekend contracts
Gas Futures (IT)
Emission rights CO2
EEX EUA
EUAA CER
Primary Auction EUA Primary Auction EUAA
EEX EUA Futures CER Futures EUA Options
EUA Primary Auction
EEX All spot products
All derivatives products
Coal / EEX
Financial Futures (ARA, RB)
EEX Coal Futures
Source: EEX
Furthermore, EEX holds 20 percent in EMCC GmbH (European Market Coupling Company), a
company that performs congestion management in German-Danish border. Also, the EEX
maintains interests in Store-x GmbH (Storage Capacity Exchange), an online platform for the
secondary market for gas storage, and PRISMA European Capacity Platform GmbH, an online
platform for natural gas transport capacity.
The participations of EEX are presented in the following graph:
Figure 45. Participations of EEX.
Source: EEX
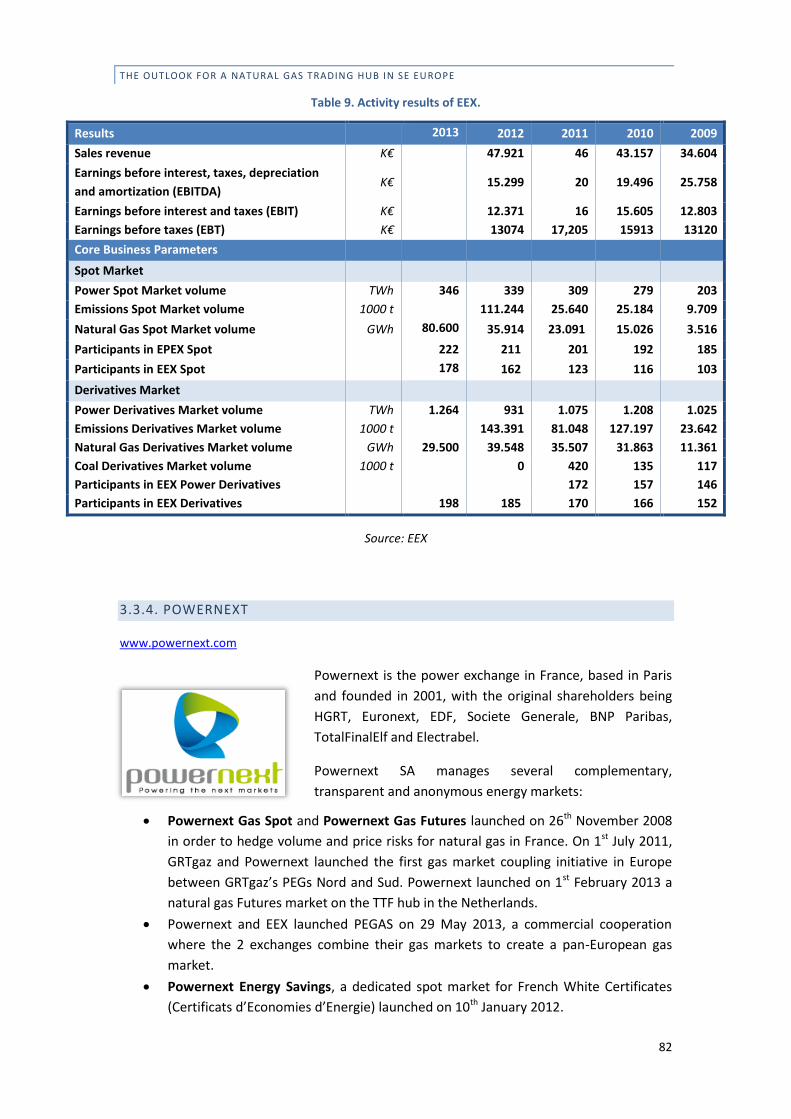
THE OUTLOOK FOR A NATURAL GAS TRADING HUB IN SE EUROPE
82
Table 9. Activity results of EEX.
Results 2013 2012 2011 2010 2009
Sales revenue K€ 47.921 46 43.157 34.604
Earnings before interest, taxes, depreciation
and amortization (EBITDA) K€
15.299 20 19.496 25.758
Earnings before interest and taxes (EBIT) K€ 12.371 16 15.605 12.803
Earnings before taxes (EBT) K€ 13074 17,205 15913 13120
Core Business Parameters
Spot Market
Power Spot Market volume TWh 346 339 309 279 203
Emissions Spot Market volume 1000 t 111.244 25.640 25.184 9.709
Natural Gas Spot Market volume GWh 80.600 35.914 23.091 15.026 3.516
Participants in EPEX Spot 222 211 201 192 185
Participants in EEX Spot 178 162 123 116 103
Derivatives Market
Power Derivatives Market volume TWh 1.264 931 1.075 1.208 1.025
Emissions Derivatives Market volume 1000 t 143.391 81.048 127.197 23.642
Natural Gas Derivatives Market volume GWh 29.500 39.548 35.507 31.863 11.361
Coal Derivatives Market volume 1000 t 0 420 135 117
Participants in EEX Power Derivatives 172 157 146
Participants in EEX Derivatives 198 185 170 166 152
Source: EEX
3.3.4. POWERNEXT
www.powernext.com
Powernext is the power exchange in France, based in Paris
and founded in 2001, with the original shareholders being
HGRT, Euronext, EDF, Societe Generale, BNP Paribas,
TotalFinalElf and Electrabel.
Powernext SA manages several complementary,
transparent and anonymous energy markets:
Powernext Gas Spot and Powernext Gas Futures launched on 26th November 2008
in order to hedge volume and price risks for natural gas in France. On 1st July 2011,
GRTgaz and Powernext launched the first gas market coupling initiative in Europe
between GRTgaz’s PEGs Nord and Sud. Powernext launched on 1st February 2013 a
natural gas Futures market on the TTF hub in the Netherlands.
Powernext and EEX launched PEGAS on 29 May 2013, a commercial cooperation
where the 2 exchanges combine their gas markets to create a pan-European gas
market.
Powernext Energy Savings, a dedicated spot market for French White Certificates
(Certificats d’Economies d’Energie) launched on 10th January 2012.
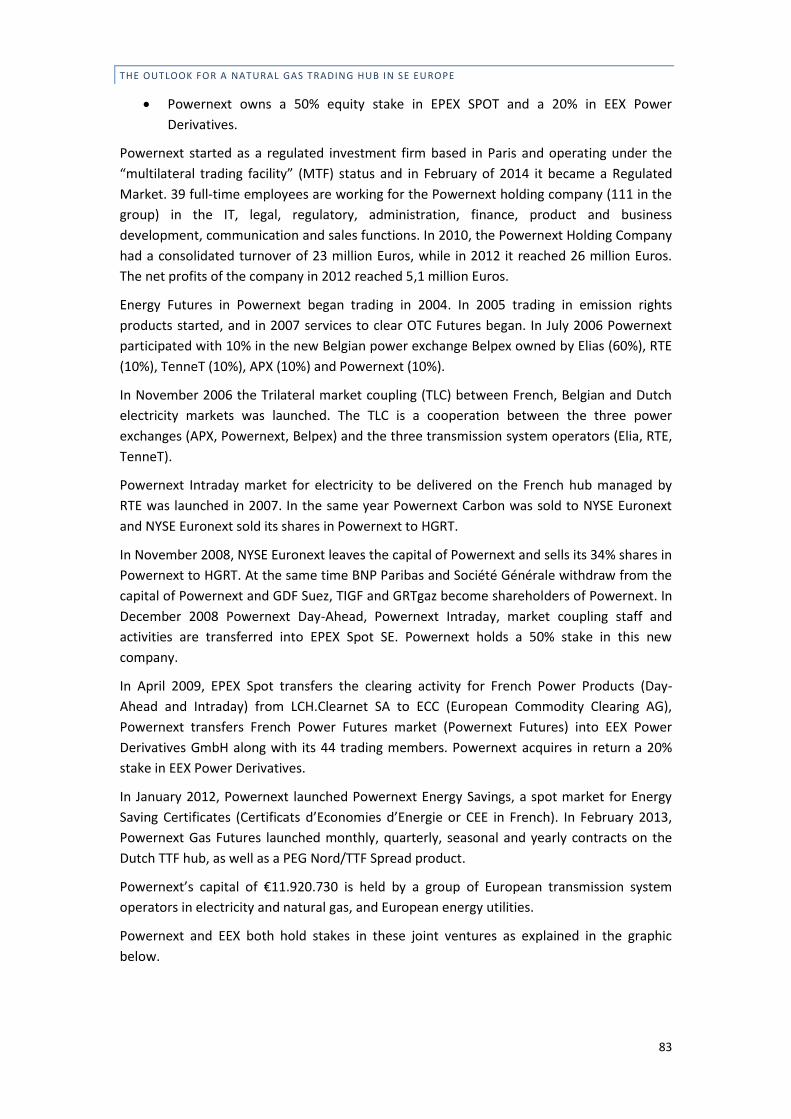
THE OUTLOOK FOR A NATURAL GAS TRADING HUB IN SE EUROPE
83
Powernext owns a 50% equity stake in EPEX SPOT and a 20% in EEX Power
Derivatives.
Powernext started as a regulated investment firm based in Paris and operating under the
“multilateral trading facility” (MTF) status and in February of 2014 it became a Regulated
Market. 39 full-time employees are working for the Powernext holding company (111 in the
group) in the IT, legal, regulatory, administration, finance, product and business
development, communication and sales functions. In 2010, the Powernext Holding Company
had a consolidated turnover of 23 million Euros, while in 2012 it reached 26 million Euros.
The net profits of the company in 2012 reached 5,1 million Euros.
Energy Futures in Powernext began trading in 2004. In 2005 trading in emission rights
products started, and in 2007 services to clear OTC Futures began. In July 2006 Powernext
participated with 10% in the new Belgian power exchange Belpex owned by Elias (60%), RTE
(10%), TenneT (10%), APX (10%) and Powernext (10%).
In November 2006 the Trilateral market coupling (TLC) between French, Belgian and Dutch
electricity markets was launched. The TLC is a cooperation between the three power
exchanges (APX, Powernext, Belpex) and the three transmission system operators (Elia, RTE,
TenneT).
Powernext Intraday market for electricity to be delivered on the French hub managed by
RTE was launched in 2007. In the same year Powernext Carbon was sold to NYSE Euronext
and NYSE Euronext sold its shares in Powernext to HGRT.
In November 2008, NYSE Euronext leaves the capital of Powernext and sells its 34% shares in
Powernext to HGRT. At the same time BNP Paribas and Société Générale withdraw from the
capital of Powernext and GDF Suez, TIGF and GRTgaz become shareholders of Powernext. In
December 2008 Powernext Day-Ahead, Powernext Intraday, market coupling staff and
activities are transferred into EPEX Spot SE. Powernext holds a 50% stake in this new
company.
In April 2009, EPEX Spot transfers the clearing activity for French Power Products (Day-
Ahead and Intraday) from LCH.Clearnet SA to ECC (European Commodity Clearing AG),
Powernext transfers French Power Futures market (Powernext Futures) into EEX Power
Derivatives GmbH along with its 44 trading members. Powernext acquires in return a 20%
stake in EEX Power Derivatives.
In January 2012, Powernext launched Powernext Energy Savings, a spot market for Energy
Saving Certificates (Certificats d’Economies d’Energie or CEE in French). In February 2013,
Powernext Gas Futures launched monthly, quarterly, seasonal and yearly contracts on the
Dutch TTF hub, as well as a PEG Nord/TTF Spread product.
Powernext’s capital of €11.920.730 is held by a group of European transmission system
operators in electricity and natural gas, and European energy utilities.
Powernext and EEX both hold stakes in these joint ventures as explained in the graphic
below.
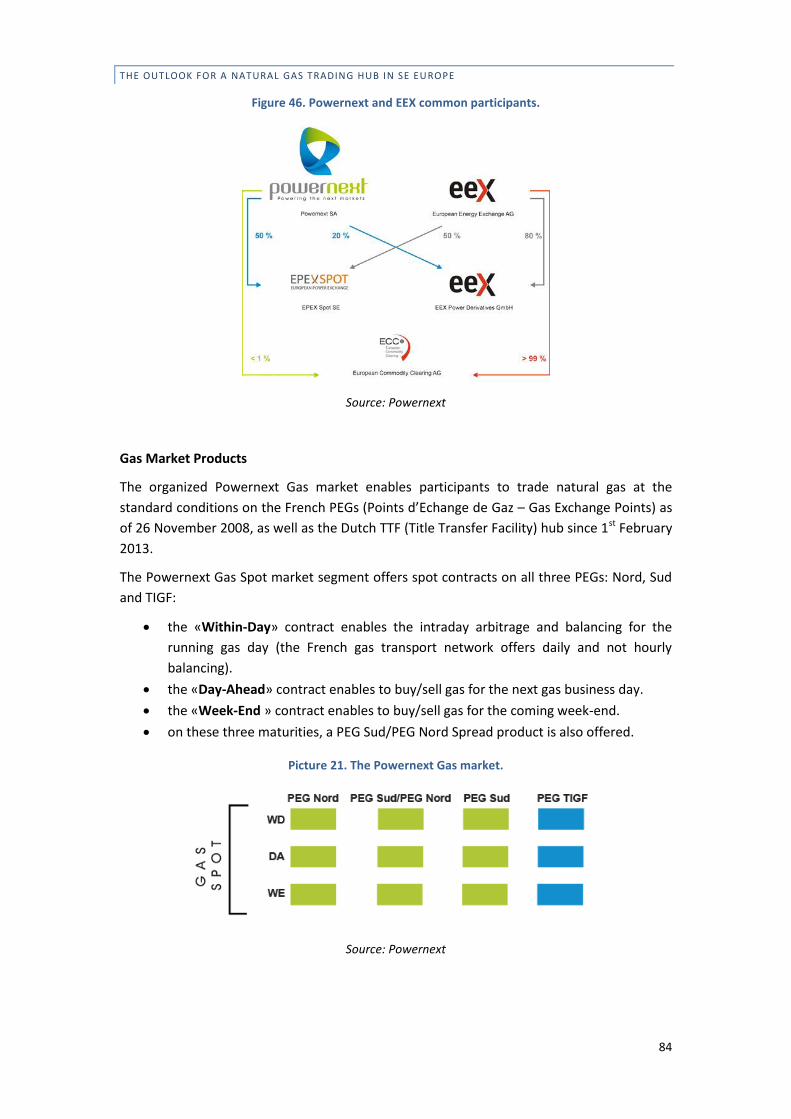
THE OUTLOOK FOR A NATURAL GAS TRADING HUB IN SE EUROPE
84
Figure 46. Powernext and EEX common participants.
Source: Powernext
Gas Market Products
The organized Powernext Gas market enables participants to trade natural gas at the
standard conditions on the French PEGs (Points d’Echange de Gaz – Gas Exchange Points) as
of 26 November 2008, as well as the Dutch TTF (Title Transfer Facility) hub since 1st February
2013.
The Powernext Gas Spot market segment offers spot contracts on all three PEGs: Nord, Sud
and TIGF:
the «Within-Day» contract enables the intraday arbitrage and balancing for the
running gas day (the French gas transport network offers daily and not hourly
balancing).
the «Day-Ahead» contract enables to buy/sell gas for the next gas business day.
the «Week-End » contract enables to buy/sell gas for the coming week-end.
on these three maturities, a PEG Sud/PEG Nord Spread product is also offered.
Picture 21. The Powernext Gas market.
Source: Powernext
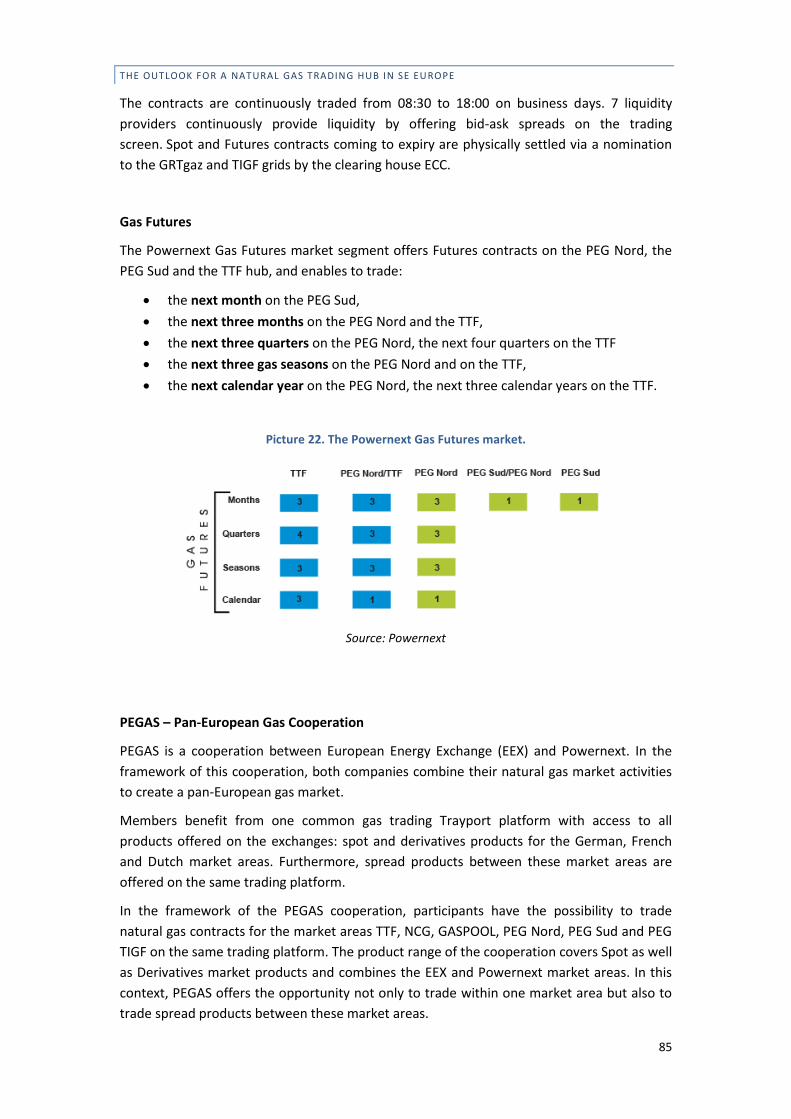
THE OUTLOOK FOR A NATURAL GAS TRADING HUB IN SE EUROPE
85
The contracts are continuously traded from 08:30 to 18:00 on business days. 7 liquidity
providers continuously provide liquidity by offering bid-ask spreads on the trading
screen. Spot and Futures contracts coming to expiry are physically settled via a nomination
to the GRTgaz and TIGF grids by the clearing house ECC.
Gas Futures
The Powernext Gas Futures market segment offers Futures contracts on the PEG Nord, the
PEG Sud and the TTF hub, and enables to trade:
the next month on the PEG Sud,
the next three months on the PEG Nord and the TTF,
the next three quarters on the PEG Nord, the next four quarters on the TTF
the next three gas seasons on the PEG Nord and on the TTF,
the next calendar year on the PEG Nord, the next three calendar years on the TTF.
Picture 22. The Powernext Gas Futures market.
Source: Powernext
PEGAS – Pan-European Gas Cooperation
PEGAS is a cooperation between European Energy Exchange (EEX) and Powernext. In the
framework of this cooperation, both companies combine their natural gas market activities
to create a pan-European gas market.
Members benefit from one common gas trading Trayport platform with access to all
products offered on the exchanges: spot and derivatives products for the German, French
and Dutch market areas. Furthermore, spread products between these market areas are
offered on the same trading platform.
In the framework of the PEGAS cooperation, participants have the possibility to trade
natural gas contracts for the market areas TTF, NCG, GASPOOL, PEG Nord, PEG Sud and PEG
TIGF on the same trading platform. The product range of the cooperation covers Spot as well
as Derivatives market products and combines the EEX and Powernext market areas. In this
context, PEGAS offers the opportunity not only to trade within one market area but also to
trade spread products between these market areas.
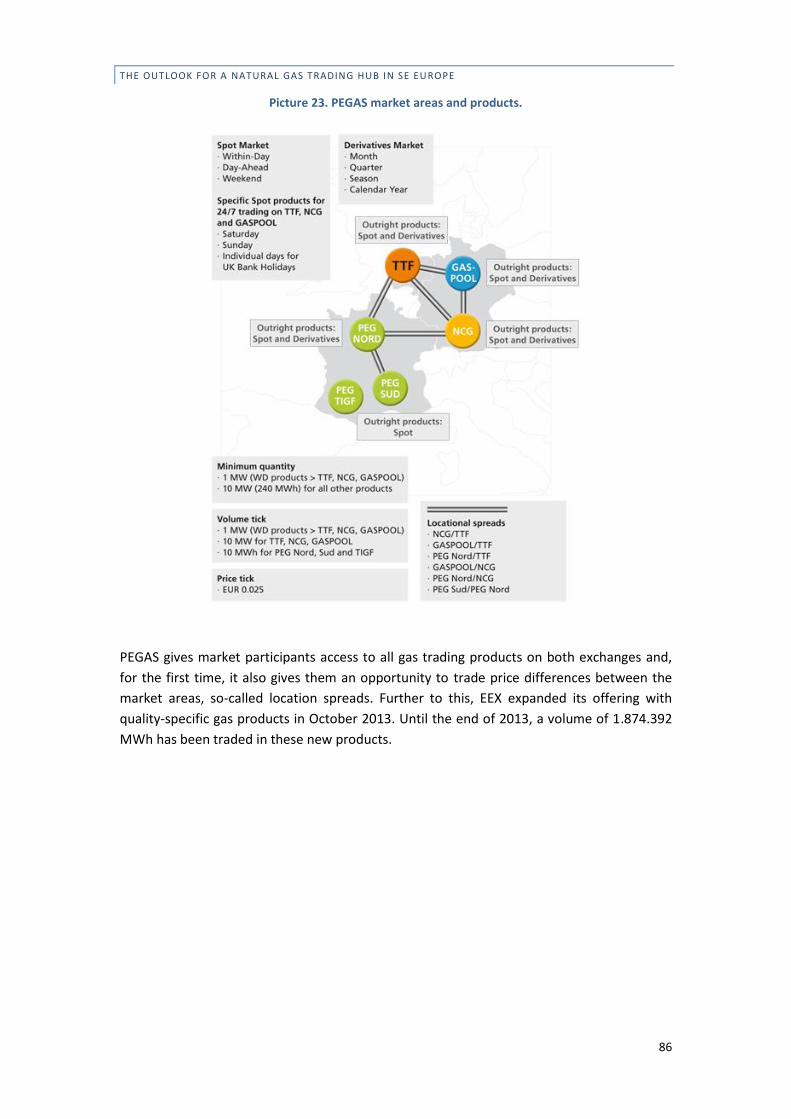
THE OUTLOOK FOR A NATURAL GAS TRADING HUB IN SE EUROPE
86
Picture 23. PEGAS market areas and products.
PEGAS gives market participants access to all gas trading products on both exchanges and,
for the first time, it also gives them an opportunity to trade price differences between the
market areas, so-called location spreads. Further to this, EEX expanded its offering with
quality-specific gas products in October 2013. Until the end of 2013, a volume of 1.874.392
MWh has been traded in these new products.
THE OUTLOOK FOR A NATURAL GAS TRADING HUB IN SE EUROPE
87
3.3.5. EPEX SPOT SE
www.epexspot.com
EPEX Spot is a joint venture owned by the French Powernext
(50%) and the German ΕΕΧ (50%) located in Paris. EPEX SPOT
was created in 2008 through the merger of the power spot
activities of the energy exchanges Powernext SA in France
and EEX AG in Germany.
The products that can be traded on EPEX SPOT are standard contracts for the physical
delivery of electricity within the Austrian, French, German or the Swiss transmission
systems. The products are characterized by two different trading processes: auction and
continuous trading.
Table 10. Characteristics of the Day ahead market of EPEX Spot.
Epex Spot Day Ahead Market features
Day-Ahead Market by Region
• EPEX Spot Market Auction Day-Ahead for Area France (French Day-
Ahead Auction)
• EPEX Spot Market Auction Day-Ahead for Area Austrian / German
(Austrian / German Day-Ahead Auction)
• EPEX Spot Market Auction Day-Ahead for Area of Switzerland (Swiss
Day-Ahead Auction)
Trading Procedure Daily Auction
Trading Period All year
Traded Products
(Maturities - delivery)
Electricity for one hour of the day
Hour 01: The period between 00:00 and 01:00
Hour 02: The period between 01:00 and 02:00
......
Hour 24: The period between 11:00 and 00:00
Maximum and Minimum Order 3000.0€ /-3000.0€
Price Characteristics Prices in Euro / MWh with one decimal point
Volume Characteristics Volumes in MW
Source: EPEX Spot
Source: EPEX Spot
The European Power Exchange EPEX SPOT SE
operates the power spot markets for France,
Germany, Austria and Switzerland (Day-
Ahead and Intraday). Together these
countries account for more than one third of
the European electricity consumption. EPEX
SPOT SE is a European company (Societas
Europaea) based in Paris with a branch in
Leipzig. 339 TWh were traded on EPEX
SPOT’s power markets in 2012.
Picture 24. The electricity market of EPEX Spot.
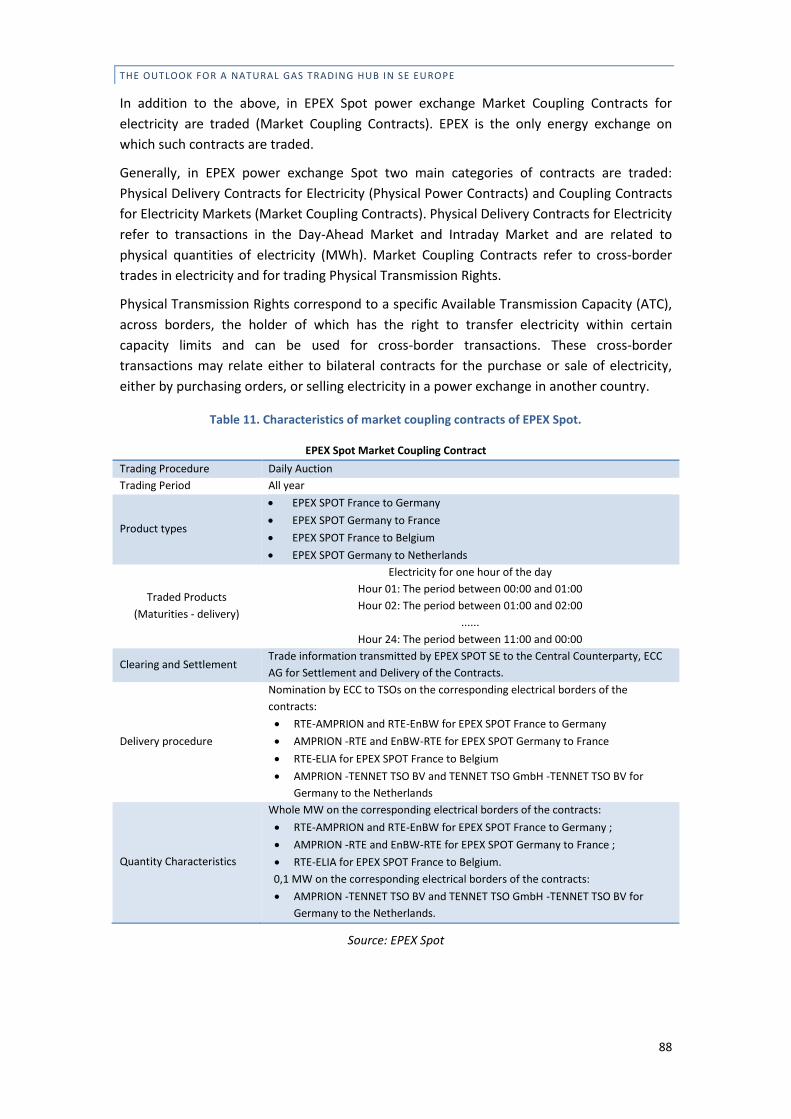
THE OUTLOOK FOR A NATURAL GAS TRADING HUB IN SE EUROPE
88
In addition to the above, in EPEX Spot power exchange Market Coupling Contracts for
electricity are traded (Market Coupling Contracts). EPEX is the only energy exchange on
which such contracts are traded.
Generally, in EPEX power exchange Spot two main categories of contracts are traded:
Physical Delivery Contracts for Electricity (Physical Power Contracts) and Coupling Contracts
for Electricity Markets (Market Coupling Contracts). Physical Delivery Contracts for Electricity
refer to transactions in the Day-Ahead Market and Intraday Market and are related to
physical quantities of electricity (MWh). Market Coupling Contracts refer to cross-border
trades in electricity and for trading Physical Transmission Rights.
Physical Transmission Rights correspond to a specific Available Transmission Capacity (ATC),
across borders, the holder of which has the right to transfer electricity within certain
capacity limits and can be used for cross-border transactions. These cross-border
transactions may relate either to bilateral contracts for the purchase or sale of electricity,
either by purchasing orders, or selling electricity in a power exchange in another country.
Table 11. Characteristics of market coupling contracts of EPEX Spot.
EPEX Spot Market Coupling Contract
Trading Procedure Daily Auction
Trading Period All year
Product types
EPEX SPOT France to Germany
EPEX SPOT Germany to France
EPEX SPOT France to Belgium
EPEX SPOT Germany to Netherlands
Traded Products
(Maturities - delivery)
Electricity for one hour of the day
Hour 01: The period between 00:00 and 01:00
Hour 02: The period between 01:00 and 02:00
......
Hour 24: The period between 11:00 and 00:00
Clearing and Settlement Trade information transmitted by EPEX SPOT SE to the Central Counterparty, ECC
AG for Settlement and Delivery of the Contracts.
Delivery procedure
Nomination by ECC to TSOs on the corresponding electrical borders of the
contracts:
RTE-AMPRION and RTE-EnBW for EPEX SPOT France to Germany
AMPRION -RTE and EnBW-RTE for EPEX SPOT Germany to France
RTE-ELIA for EPEX SPOT France to Belgium
AMPRION -TENNET TSO BV and TENNET TSO GmbH -TENNET TSO BV for
Germany to the Netherlands
Quantity Characteristics
Whole MW on the corresponding electrical borders of the contracts:
RTE-AMPRION and RTE-EnBW for EPEX SPOT France to Germany ;
AMPRION -RTE and EnBW-RTE for EPEX SPOT Germany to France ;
RTE-ELIA for EPEX SPOT France to Belgium.
0,1 MW on the corresponding electrical borders of the contracts:
AMPRION -TENNET TSO BV and TENNET TSO GmbH -TENNET TSO BV for
Germany to the Netherlands.
Source: EPEX Spot
THE OUTLOOK FOR A NATURAL GAS TRADING HUB IN SE EUROPE
89
Day-Ahead markets
Day-Ahead trading volumes in 2013 were totaling 322.788.544 MWh (2012: 321.228.968 MWh) and can be broken down as follows:
Table 12. Day ahead market volumes of EPEX Spot.
Areas Volume 2013
in MWh
Volume 2012
in MWh
Average Base Price 2013 / 2012
Euro/MWh
Germany/ Austria 245.566.864 245.268.525 37,78 / 42,60
France 58.478.684 59.282.499 43,24 / 46,94
Switzerland 18.742.997 16.677.944 44,73 / 49,52
Source: EPEX Spot
Intraday markets
In 2013, total trading volumes on the Intraday markets amounted to 23.054.242 MWh (2012: 17.924.234 MWh), including:
Table 13. Intraday market volumes of EPEX Spot.
Areas Volume 2013
in MWh
Volume 2012
in MWh
Germany/ Austria 19.699.240 15.757.403
France 2.881.145 2.166.831
Switzerland 473.857 0
Source: EPEX Spot
3.3.6. GESTORE DEI MERCATI ENERGETICI S.P.A (GME) – ITALIAN POWER
EXCHANGE
www.mercatoelettrico.org/En/
Gestore dei Mercati Energetici S.p.A, the power exchange in
Italy, is active since 2004. It was established in response to
the attempt of the government to liberalize the domestic
energy market and to attract the interest of foreign
investors.
The electricity market, named Italian Power Exchange (IPEX), allows producers, consumers
and wholesale market participants to buy and sell electric power on an hourly basis.
The electricity market consists of:
1. the Spot Electricity Market (MPE), which includes :
a) The Electricity Day-Ahead Market (MGP), which is an auction market (and not a
continuous-trading market), where producers, wholesalers and eligible end users
can buy or sell electricity for the next day. The GME is a central counterparty to
transactions concluded on the market MGP. In the MGP, hourly energy blocks are

THE OUTLOOK FOR A NATURAL GAS TRADING HUB IN SE EUROPE
90
traded for the next day. The MGP sitting opens at 8 a.m. of the ninth day before the
day of delivery and closes at 9:15 a.m. of the day before the day of delivery. The
results of the MGP are made known within 10:45 a.m. of the day before the day of
delivery. The accepted demand bids pertaining to consuming units belonging to
Italian geographical zones are valued at the “Prezzo Unico Nazionale” (PUN –
national single price); this price is equal to the average of the prices of geographical
zones, weighted for the quantities purchased in these zones.
b) The Electricity Intra-Day Market (MI), where producers, wholesalers and eligible
end users can alter the timing of the introduction or withdrawal of energy from the
system in relation to what has been determined in buying MGP. The GME is a
central counterparty to transactions concluded on the market MI.
c) The Ancillary Services Market (MSD) is the venue where Terna S.p.A. (Italian energy
TSO) procures the resources that it requires for managing, operating, monitoring
and controlling the power system (relief of intra-zonal congestions, creation of
energy reserve, real-time balancing). In the MSD, Terna acts as a central
counterparty. Accepted bids/offers are valued at the offered price (pay-as-bid). The
MSD consists of a scheduling stage (ex-ante MSD) and of the Balancing Market (MB).
The ex-ante MSD and the MB take place in multiple sessions.
2. The futures market for electricity with the undertaking of delivery/receipt (JSC), where
participants can sell/ buy future supplies of electricity. The GME is a central
counterparty to trades concluded in the JSC.
3. The platform for physical delivery of financial contracts concluded in IDEX (CDE), where
financial derivatives of electricity are traded. The IDEX is the financial derivatives
segment of IDEM, the Italian Derivatives Markets managed by Borsa Italiana SpA where
financial derivatives of electricity are traded. Contracts executed in CDE are those for
which the Participant has requested to exercise his right to physical delivery in the
electricity market.
Moreover, GME also manages the OTC Registration Platform (PCE) for registration of
forward electricity purchase/sale contracts that have been concluded off the market.
Table 14. Electricity prices and traded volumes in the Italian Power Exchange.
Year purchasing price - National Single Price
total volumes (MWh) liquidity (%) no. of participants at 31 Dec
PUN (€/MWh)
average min max
2004 51,6 1,1 189,2 231.571.983 29,1 73
2005 58,6 10,4 170,6 323.184.850 62,8 91
2006 74,8 15,1 378,5 329.790.030 59,6 103
2007 71 21,4 242,4 329.949.207 67,1 127
2008 87 21,5 212 336.961.297 69 151
2009 63,7 9,07 172,3 313.425.166 68 167
2010 64,1 10 174,6 318.561.565 62,6 198
2011 72,2 10 164,8 311.493.877 57,9 181
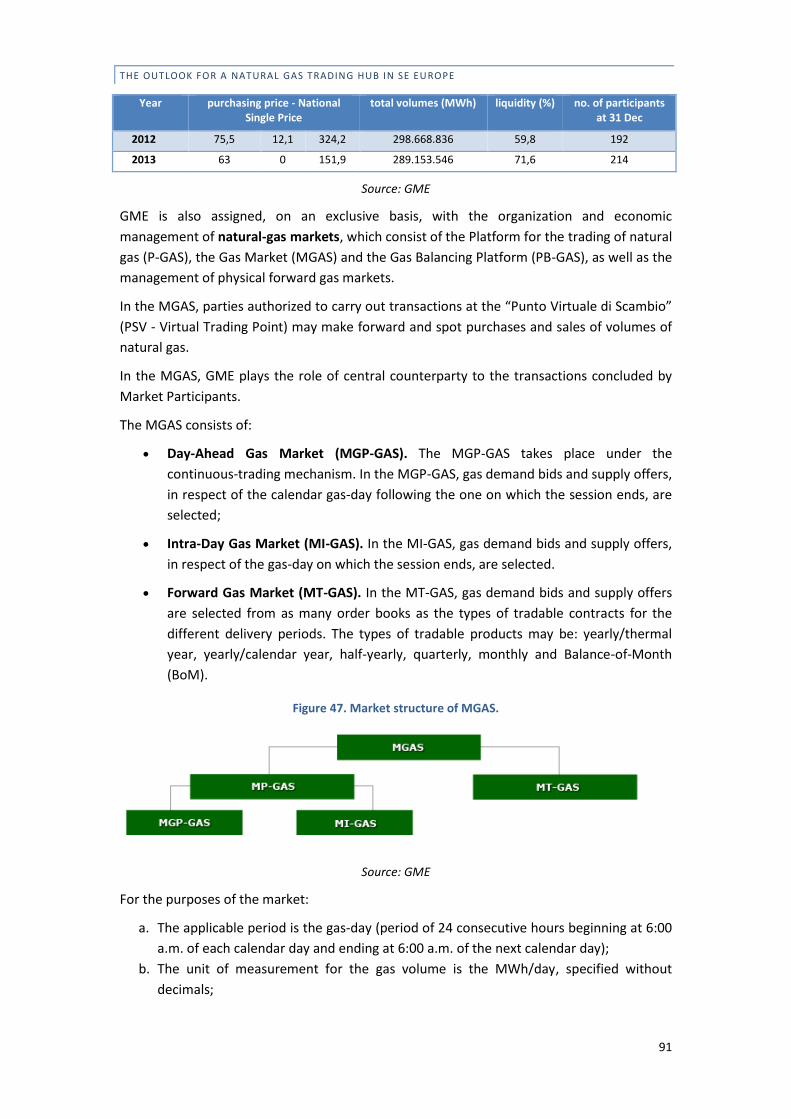
THE OUTLOOK FOR A NATURAL GAS TRADING HUB IN SE EUROPE
91
Year purchasing price - National Single Price
total volumes (MWh) liquidity (%) no. of participants at 31 Dec
2012 75,5 12,1 324,2 298.668.836 59,8 192
2013 63 0 151,9 289.153.546 71,6 214
Source: GME
GME is also assigned, on an exclusive basis, with the organization and economic
management of natural-gas markets, which consist of the Platform for the trading of natural
gas (P-GAS), the Gas Market (MGAS) and the Gas Balancing Platform (PB-GAS), as well as the
management of physical forward gas markets.
In the MGAS, parties authorized to carry out transactions at the “Punto Virtuale di Scambio”
(PSV - Virtual Trading Point) may make forward and spot purchases and sales of volumes of
natural gas.
In the MGAS, GME plays the role of central counterparty to the transactions concluded by
Market Participants.
The MGAS consists of:
Day-Ahead Gas Market (MGP-GAS). The MGP-GAS takes place under the
continuous-trading mechanism. In the MGP-GAS, gas demand bids and supply offers,
in respect of the calendar gas-day following the one on which the session ends, are
selected;
Intra-Day Gas Market (MI-GAS). In the MI-GAS, gas demand bids and supply offers,
in respect of the gas-day on which the session ends, are selected.
Forward Gas Market (MT-GAS). In the MT-GAS, gas demand bids and supply offers
are selected from as many order books as the types of tradable contracts for the
different delivery periods. The types of tradable products may be: yearly/thermal
year, yearly/calendar year, half-yearly, quarterly, monthly and Balance-of-Month
(BoM).
Figure 47. Market structure of MGAS.
Source: GME
For the purposes of the market:
a. The applicable period is the gas-day (period of 24 consecutive hours beginning at 6:00
a.m. of each calendar day and ending at 6:00 a.m. of the next calendar day);
b. The unit of measurement for the gas volume is the MWh/day, specified without
decimals;
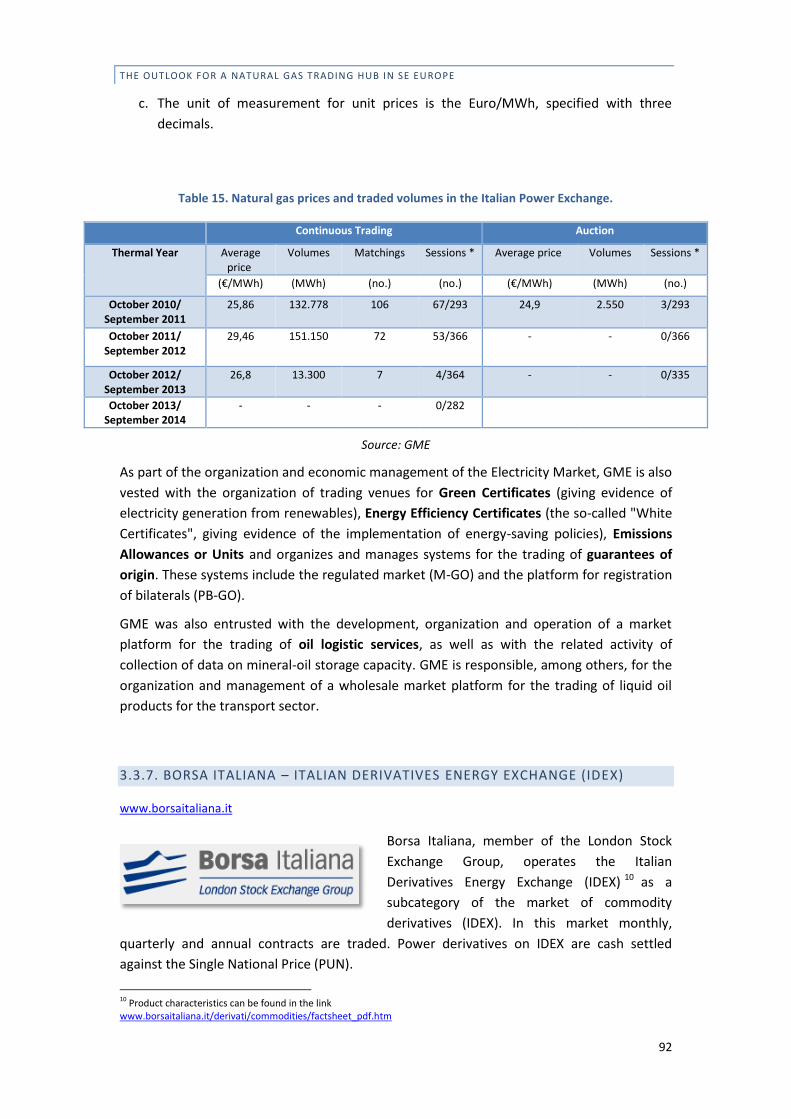
THE OUTLOOK FOR A NATURAL GAS TRADING HUB IN SE EUROPE
92
c. The unit of measurement for unit prices is the Euro/MWh, specified with three
decimals.
Table 15. Natural gas prices and traded volumes in the Italian Power Exchange.
Continuous Trading Auction
Thermal Year Average price
Volumes Matchings Sessions * Average price Volumes Sessions *
(€/MWh) (MWh) (no.) (no.) (€/MWh) (MWh) (no.)
October 2010/ September 2011
25,86 132.778 106 67/293 24,9 2.550 3/293
October 2011/ September 2012
29,46 151.150 72 53/366 - - 0/366
October 2012/ September 2013
26,8 13.300 7 4/364 - - 0/335
October 2013/ September 2014
- - - 0/282
Source: GME
As part of the organization and economic management of the Electricity Market, GME is also
vested with the organization of trading venues for Green Certificates (giving evidence of
electricity generation from renewables), Energy Efficiency Certificates (the so-called "White
Certificates", giving evidence of the implementation of energy-saving policies), Emissions
Allowances or Units and organizes and manages systems for the trading of guarantees of
origin. These systems include the regulated market (M-GO) and the platform for registration
of bilaterals (PB-GO).
GME was also entrusted with the development, organization and operation of a market
platform for the trading of oil logistic services, as well as with the related activity of
collection of data on mineral-oil storage capacity. GME is responsible, among others, for the
organization and management of a wholesale market platform for the trading of liquid oil
products for the transport sector.
3.3.7. ΒORSA ITALIANA – ITALIAN DERIVATIVES ENERGY EXCHANGE (IDEX)
www.borsaitaliana.it
Βorsa Italiana, member of the London Stock
Exchange Group, operates the Italian
Derivatives Energy Exchange (IDEX) 10 as a
subcategory of the market of commodity
derivatives (IDEX). In this market monthly,
quarterly and annual contracts are traded. Power derivatives on IDEX are cash settled
against the Single National Price (PUN).
10 Product characteristics can be found in the link www.borsaitaliana.it/derivati/commodities/factsheet_pdf.htm
THE OUTLOOK FOR A NATURAL GAS TRADING HUB IN SE EUROPE
93
Launched in 2008, IDEX is the only regulated financial market on Italian power derivatives
and it currently offers both Baseload and Peakload Futures.
Table 16. Product characteristics of Future Contracts of the Italian Derivatives Energy Exchange.
Product Characteristics
The underlying power
spot market
The Day-ahead Market of GME (Gestore Mercati Energetici).
The Single National purchase Price (PUN: “Prezzo Unico Nazionale”)
is calculated for every hour as a weighted average of the zonal prices
determined on the day-ahead market.
Contract type:
Base load futures (power delivered every day for 24 hours per day)
and
peak load futures (power delivered during peak-period from 08:00
hours to 20:00 hours Monday to Friday)
Delivery rate: 1 Megawatt (MW)
Delivery periods: Monthly, quarterly, yearly
Expiries:
Next 3 months, 4 quarters and 1 year. The second annual expiry is
traded from September to the end of December for baseload futures
only.
Settlement type: Cash settlement
Optional physical delivery: Members of GME markets can ask for physical delivery instead of
cash settlement
Trading period: Until last trading day before the beginning of the delivery period
(monthly futures) or until cascading (quarterly and yearly futures)
Source: Βorsa Italiana
3.3.8. ΑΡΧ - ENDEX
http://www.apxendex.com/
3.3.8.1. ΑΡΧ POWER SPOT EXCHANGE
www.apxgroup.com
The APX power spot exchange operates the spot
markets for electricity in the Netherlands, the United
Kingdom, and Belgium. APX provides exchange trading,
central clearing and settlement, and data distribution
services as well as benchmark data and industry indices.
APX has over 150 members from more than 15 countries. In 2012, a total volume of 86 TWh
of energy was traded or cleared by APX.
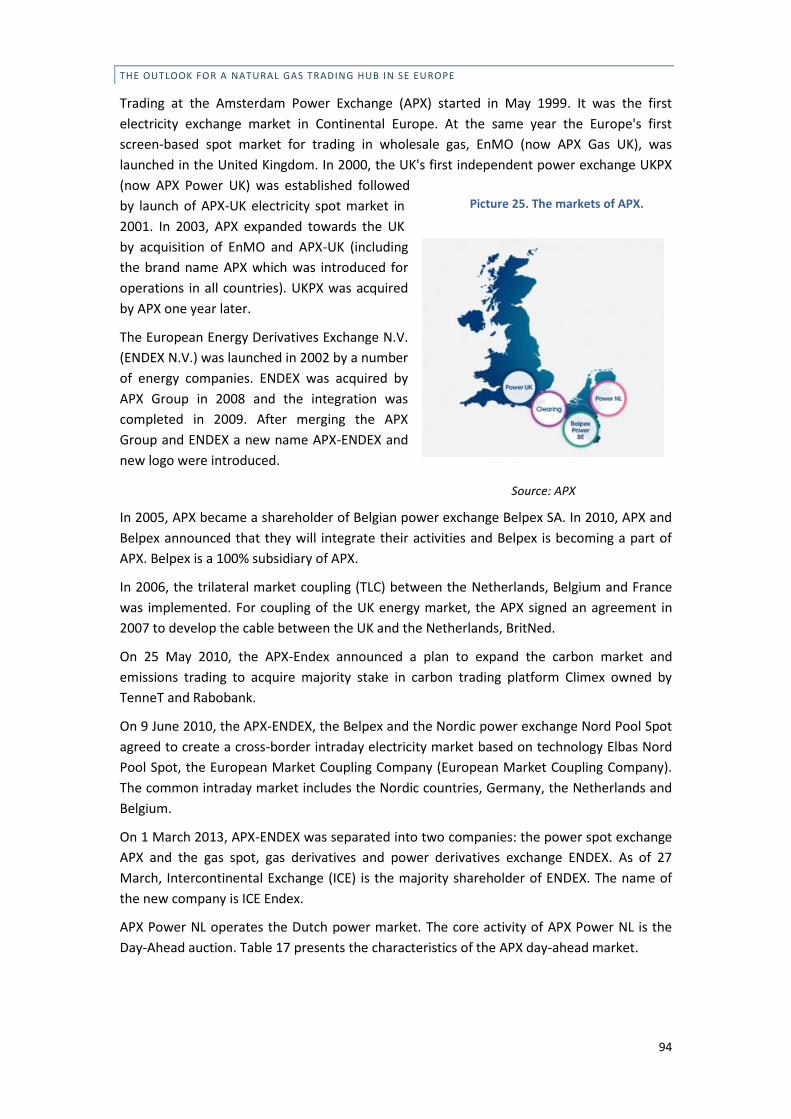
THE OUTLOOK FOR A NATURAL GAS TRADING HUB IN SE EUROPE
94
Trading at the Amsterdam Power Exchange (APX) started in May 1999. It was the first
electricity exchange market in Continental Europe. At the same year the Europe's first
screen-based spot market for trading in wholesale gas, EnMO (now APX Gas UK), was
launched in the United Kingdom. In 2000, the UK's first independent power exchange UKPX
(now APX Power UK) was established followed
by launch of APX-UK electricity spot market in
2001. In 2003, APX expanded towards the UK
by acquisition of EnMO and APX-UK (including
the brand name APX which was introduced for
operations in all countries). UKPX was acquired
by APX one year later.
The European Energy Derivatives Exchange N.V.
(ENDEX N.V.) was launched in 2002 by a number
of energy companies. ENDEX was acquired by
APX Group in 2008 and the integration was
completed in 2009. After merging the APX
Group and ENDEX a new name APX-ENDEX and
new logo were introduced.
In 2005, APX became a shareholder of Belgian power exchange Belpex SA. In 2010, APX and
Belpex announced that they will integrate their activities and Belpex is becoming a part of
APX. Belpex is a 100% subsidiary of APX.
In 2006, the trilateral market coupling (TLC) between the Netherlands, Belgium and France
was implemented. For coupling of the UK energy market, the APX signed an agreement in
2007 to develop the cable between the UK and the Netherlands, BritNed.
On 25 May 2010, the APX-Endex announced a plan to expand the carbon market and
emissions trading to acquire majority stake in carbon trading platform Climex owned by
TenneT and Rabobank.
On 9 June 2010, the APX-ENDEX, the Belpex and the Nordic power exchange Nord Pool Spot
agreed to create a cross-border intraday electricity market based on technology Elbas Nord
Pool Spot, the European Market Coupling Company (European Market Coupling Company).
The common intraday market includes the Nordic countries, Germany, the Netherlands and
Belgium.
On 1 March 2013, APX-ENDEX was separated into two companies: the power spot exchange
APX and the gas spot, gas derivatives and power derivatives exchange ENDEX. As of 27
March, Intercontinental Exchange (ICE) is the majority shareholder of ENDEX. The name of
the new company is ICE Endex.
APX Power NL operates the Dutch power market. The core activity of APX Power NL is the
Day-Ahead auction. Table 17 presents the characteristics of the APX day-ahead market.
Source: APX
Picture 25. The markets of APX.
THE OUTLOOK FOR A NATURAL GAS TRADING HUB IN SE EUROPE
95
Table 17. Characteristics of the APX ENDEX Day Ahead Market Hourly.
APX ENDEX DAM Hourly
Delivery Point and
Delivery Process
Delivery as purchase contract for the next day in Dutch TSO Tennet
TSO BV, through an agreement
Pricing Euro and Euro cents per MWh
Minimum Price Step 1 Euro cent per MWh, € / MWh 0.01
Minimum Quantity Step 0.1 MW (100 kW)
Price range Contract prices expressed in € / MWh.
minimum / maximum Range -> -3000.00 / +3000.00 € / MWh
Product Expiry Hourly contracts cease trading at 12:00 CET, the day just before the
day of delivery.
Available time periods Available time periods for the purchase and sale of electricity is
each of the 24 hours of day
Source: APX
3.3.8.3. BELPEX
www.belpex.be
Belpex Spot power exchange operates under the
Belpex Spot BV and is the Spot market of
electricity for the region of Belgium. It is a
subsidiary of APX power exchange. It operates
under the initiative coupling exchanges in Central
and Western Europe (CWE Market Coupling).
The whole territory of Belgium is considered a
market area, where contracts to buy and sell electricity are traded. In the operation of the
electricity market in Belgium the company Elia System Operator SA (Elia), as TSOs-E is
involved. In the Belpex Spot day-ahead market (Belpex DAM) contracts for the purchase and
sale of electricity for delivery in the TSO in Belgium (Elia) and in interconnected regions are
traded, for delivery the day after this trading, as well as intraday trading products.
Results of the APXGroup
In 2013 in the Dutch spot market 47,26 TWh were traded, including day-ahead and Intraday
markets, compared to 50 TWh in 2012. The total traded volume represents almost half
(48%) of the total Dutch load.
In the spot electricity market in Belgium 17,13 TWh were traded in 2013, including day-
ahead and Intraday, an increase of 4% compared with 2012. The total volume represents
21% of the Belgian load.
The Power UK volume recorded a total of 22,6 TWh in 2013. The UK Day-Ahead Auction
volumes increased 77% year-on-year from 4,84 TWh in 2012 to 8,57 TWh in 2013. Volumes
on the Spot Market increased from 10,39 TWh in 2012 to 10,66 TWh in 2013.

THE OUTLOOK FOR A NATURAL GAS TRADING HUB IN SE EUROPE
96
Figure 48. APX Group Volume, 2009 – 2013.
Source: APX
The value of the cleared volumes of power and gas of the APX group in 2013 reached €9
billion.
3.3.8.2. ICE ENDEX
www.iceendex.com
ICE Endex serves markets for trading natural gas and power
derivatives. In the electricity segment of the market, futures are
traded, covering the Netherlands, the United Kingdom and
Belgium (weekly, monthly, quarterly and yearly in base, peak and
peak 16-hour period).
Gas Market
ICE Endex provides transparent and widely accessible continental European markets for
trading natural gas, gas balancing markets and gas storage services, including the Title
Transfer Facility (TTF) Virtual Trading Point in the Netherlands, the UK On-the-Day
Commodity Market (OCM), the German Virtual Trading Points: GASPOOL and NetConnect
Germany (NCG), and the Belgian Zeebrugge Trading Point (ZTP).
The Within-Day Market for TTF Spot (TTF) is open for trading on a 24/7 basis. Rolling 24
hourly blocks can be traded continuously and anonymously with the backup of complete
TSO (GTS) nomination and clearing services. The Day-Ahead Market is open for trading on
Dutch business days from 06:00 am to 04:00 am CET. Individual Days, Weekend Strip,
Balance of Week and Working Days Next Week instruments can be anonymously traded on a
continuous spot market model, as a primary tool to help shippers to fully optimize their TTF
portfolios.
ZTP Spot went live for trading in September 2012 as Continental Europe’s first exchange
traded market, combining 24/7 virtual gas trading and TSO physical balancing in an end of
day balancing model. ZTP Spot is the result of a close cooperation between ICE Endex and
Fluxys Belgium SA which offers an anonymous market place for integrated trading, clearing
THE OUTLOOK FOR A NATURAL GAS TRADING HUB IN SE EUROPE
97
and notification of day-ahead, within-day contracts for delivery at the ZTP notional hub in
Belgium.
The Day Ahead Market of ZTP is open for trading seven days a week, from 06:00 am to 04:00
am CET. Individual Days, Weekend Strip, Balance of Week and Working Days Next Week
instruments can be anonymously traded on a continuous spot market model. ZTP Spot is a
primary tool to help shippers fully optimize their gas portfolios, vis-á-vis other short term
NW European gas markets, on a single screen via Trayport Technology.
The Within-Day instruments for the ZTP Spot market are open for trading on a 24/7 basis.
Rolling 24 hourly end of gas day virtual instruments can be traded continuously and
anonymously, with the peace of mind of single sided TSO nominations up to 40 minutes
before delivery. Further the market is integrated with Fluxys balancing operations, critical
TSO balancing messages can be seen via the ICE Endex front end as well as the opportunity
to place physical orders resulting in a firm commitment to flow gas to help the system
operator restore transmission balance.
The On-the-day Commodity Market (OCM) provides trading products to meet the changing
requirements of today’s traders. Three products are traded on the OCM, namely Locational,
Physical and Title, all of which result in exchange of rights to gas at the UK hub, the NBP
(National Balancing Point). Two of these products include an obligation to change physical
gas flows at entry/exit points around the hub.
ICE Endex is the assigned market operator for the On-the-day Commodity Market. Products
consist of Title, Physical and Locational. Of the three products, Title is the most liquid and
runs from 12:00 midday Day-Ahead until 03:35am calendar day following the gas day, with
gas being delivered in accordance with the UK standard ‘gas-day’ 06:00hrs until 06:00hrs.
In 2012, the volume of transactions in spot market OCM reached 137 TWh, remaining
unchanged compared with the previous year, while trading volume for gas storage reached
928 GWh, increasing by 164%.
In the Derivatives Market of ICE Endex the following products are being traded:
TTF Gas Futures
TTF Gas Options
GASPOOL Gas Futures
NCG Gas Futures
Belgian Power Futures
Dutch Power Futures
In 2012 in the Dutch spot gas market 13,7 TWh were traded, an increase of 15% compared
with the previous year, while in the derivatives market the traded volume reached 366 TWh,
(includes exchange traded and OTC), an increase of 10%. Similarly, in Belgium 1,8 TWh were
traded in the spot market.
THE OUTLOOK FOR A NATURAL GAS TRADING HUB IN SE EUROPE
98
Rough Gas Storage Trading
In co-operation with Centrica Storage Ltd (CSL), the Gas Storage is a market for trading
secondary storage capacity and gas in store at Rough, the UK’s largest gas storage facility.
The Gas Storage Market is available to all members of the On-the-day Commodity Market
(OCM), provided that they are signatories of CSL’s Storage Services Contract and the
associated Credit Agreement.
ICE Endex Gas UK members are able to use existing collateral provided for trading on the
OCM, while all contracts traded on the Gas Storage Market are fully collateralized to ensure
risk is fully covered at all times. APX Commodities Ltd. is appointed by ICE Endex as the
central counterparty to all trades; all contracts are traded anonymously, then cleared and
settled by APX Commodities Ltd.
All trades at Rough will be notified to Centrica Storage Ltd, a supplier of physical gas storage
in the United Kingdom. The transfer of commodity or capacity is made on behalf of members
via StorIT, Centrica’s online customer services system.
GasTerra – Gas Storage Services
On behalf of GasTerra, ICE Endex auctions gas storage services in the Netherlands. The
storage services are sold in the form Standard Bundled Units or SBUs which allow market
parties to inject natural gas in or withdraw from a virtual storage facility. Almost 2 bcm of
gas storage, in the form of 13,2 million SBUs is offered under market based conditions.
Since 2011, ICE Endex has successfully operated auctions for a yearly product. In addition to
the one-year product, ICE Endex introduced a new five-year product, providing long-term
storage capacity starting 1 April 2014 and ending 31 March 2019. Roughly 30% was sold as
five-year storage capacity in the auction on 20 November 2013. The remaining capacity will
be offered as one-year storage capacity for the coming five storage years. The first 3.653.682
SBUs for the storage year 2014-2015 were sold on 21 November 2013. The remaining
5.445.219 SBUs has been offered in the auction on 12 February 2014.
ICE Endex developed a custom built single-sided auction mechanism which ensures that the
SBUs are sold in a transparent, independent and market-based way. More importantly, ICE
Endex ensures the anonymity of market parties who bid in the auction and the
confidentiality of all information regarding their bids. A notary monitors the auction process
to ensure that it is conducted in a transparent and non-discriminatory manner. All
information pertaining to bidders and their bids is only accessible to ICE Endex and the
notary. GasTerra does not have access to this information and neither does it have any
involvement in the auction process. The auction process, the rules for price determination
and allocation are further detailed in the Auction Rules. ICE Endex facilitates the day-to-day
nomination processes as well as the financial settlement of the contracts.
THE OUTLOOK FOR A NATURAL GAS TRADING HUB IN SE EUROPE
99
3.3.9. ΙCE FUTURES EUROPE
www.theice.com
ICE Futures Europe, based in London, is an organized
and fully electronic futures exchange for global energy
markets. On the ICE Futures Europe half of the volume
of futures trading of crude oil and refined products in
the world are traded. The ICE also operates one of the
leading European futures markets on emissions, gas, coal and electricity. Participants from
more than 70 countries have access to a range of futures and options contracts.
Transactions on ICE Futures Europe are cleared through ICE Clear Europe.
In the power market segment it offers futures and OTC registration in the UK market.
Futures contracts have daily, monthly and quarterly maturities at base and peak loads.
Settlement refers to the physical delivery (debit / credit into Energy accounts).
3.3.10. OMI (IBERIAN MARKET OPERATOR).
The two Iberian countries Spain and Portugal decided in 2004 to proceed in the integration
of energy markets and create a single entity called the OMI (Iberian Market Operator).
For this purpose they created 2 Holding management/exchanges, the OMEL (Spain) and
OMIP (Portugal), involving joint participation with 50% each in the share capital of
OMEL (spot trading market)
o It operates with a mixed system and as a power exchange in the spot
market.
OMIP (Derivatives market)
o It serves as a derivatives exchange and having a subsidiary clearing company
(OMIP Clear).
Both exchanges have common members in both countries. Each member which gets
approved by the local Energy Regulatory Authority automatically acquires the same
membership status on the other exchange. It is also important to mention that they have a
common Board which brings together the energy companies of the two countries, while the
shareholders of both companies and up to 40% are the same as the energy companies of the
two countries. Finally, the two exchanges are supervised by the Capital Market Commissions
and Regulatory Authorities for Energy (RAE) of each country.
In the OMEL spot market transactions are being carried out in the day-ahead, the intraday
market and balancing market.
In the OMIP market derivatives products such as futures, options, swaps and forward
contracts are traded.
Various types of futures are traded on OMIP:
Spanish and Portuguese electricity.
THE OUTLOOK FOR A NATURAL GAS TRADING HUB IN SE EUROPE
100
Baseload (24h) and spot charge (12h).
With physical settlement and with financial settlement, where both types of
contract benefit from a single order book.
With maturities of days, weekends, weeks, months, quarters and years.
Besides providing a registration platform for OTC transactions to be cleared on OMIClear, for
all these futures contracts, OMIP also allows the registration of forward and swap trades:
Foreseeing for the former, physical delivery and settlement of VAT and for the latter,
a purely financial settlement excluding VAT.
Both on Spanish electricity
With the same maturities as futures contracts.
The size of all of these contracts is 1 MW, with a 0,01 Euros/MWh tick.
OMEL has established a market for auctioning gas, which are being carried out periodically.
Furthermore, in April 2012 OMEL and OMIP SGPS decided to launch the MIBGAS initiative
for undertaking the work associated with the design and implementation of an operating
model for the Iberian gas market, which pursuant to the guidelines contained in the
European Gas Target Model adapts to the specific needs of the Iberian gas system.
3.3.11. ROMANIAN POWER EXCHANGE (OPCOM)
www.opcom.ro
The company Operatorul Pietei de Energie Electrica si Gaze
Naturale “OPCOM” S.A. fulfills the role of the electricity market
administrator, providing an organized, viable and efficient
framework for the commercial trades’ deployment on the
wholesale electricity market and performs administration activities
of the centralized markets in the natural gas sector.
The Romanian Power Market Operator-Opcom S.A. was established
in 2000, as a joint stock company subsidiary of the Romanian Transmission and System
Operator - Transelectrica S.A. and is fully owned by it. The day-ahead electricity market, the
intraday electricity market, the market for bilateral contracts awarded through public
auction, the green certificates market and emission rights are the markets that operate in
the energy Exchange.
At the same time, it is planning to operate an electronic auction platform for gas, which will
trade weekly, monthly, quarterly and annual contracts for the supply of natural gas.
Trading volume in the day ahead, intraday and bilateral agreements markets in 2012
amounted to 18.983.898 MWh, which corresponds to about 35% of consumption in the
country, against 13.990.405 MWh, in 2011, which was 26% of the consumption.
THE OUTLOOK FOR A NATURAL GAS TRADING HUB IN SE EUROPE
101
Also, in 2012 1.053.229 green certificates were traded, against 451.841 in 2011. In 2012
there were no transactions for ERU and CER Emission Rights, while in 2011 1.500.000
contracts were traded.
3.3.12. EXAA - AUSTRIA
www.exaa.at
EXAA (Abwicklungsstelle für
Energieprodukte AG) is Austria’s energy
and environmental exchange seated in
Vienna. EXAA was founded on 8 June 2001 and opened for spot market trading in electric
power on 21 March 2002.
EXAA Energy Exchange Austria is a spot electricity market covering Austria and is active in
the German market. It offers the ability to trade electricity for the next day (day-ahead), and
from 2012 it began trading green electricity (Green Energy), i.e. the electricity that comes
from certified renewable energy generators. The EXAA market share is 15,6% of the Austrian
electricity market in 2012.
All 24 hours of the day are defined as individual trading products. This enables trading
participants to cover their daily demand as best as possible through trading on the
exchange. The minimum trading volume is 0,1 MWh. Furthermore, the volumes can be
traded in intervals of 0,1 MWh. The order prices are entered in EUR with two decimal places.
Since market launch several block products (combination of several consecutive hours to
one block) were introduced. Block products give exchange members higher security with
respect to the uninterrupted buying and selling of electricity for several hours.
Figure 49. Different block products traded in EXAA.
Source: EXAA
The product range of EXAA consists of 24 single hours and tradable standardized blocks,
which are included in the hourly auction.
Table 18. Traded volume and traded value in EXAA.
2012 2011
Trade volume (GWh) 7,820 9,346 7,558 Trade value (EUR) 297,856,687 407,174,833 390,236,567
Source: EXAA
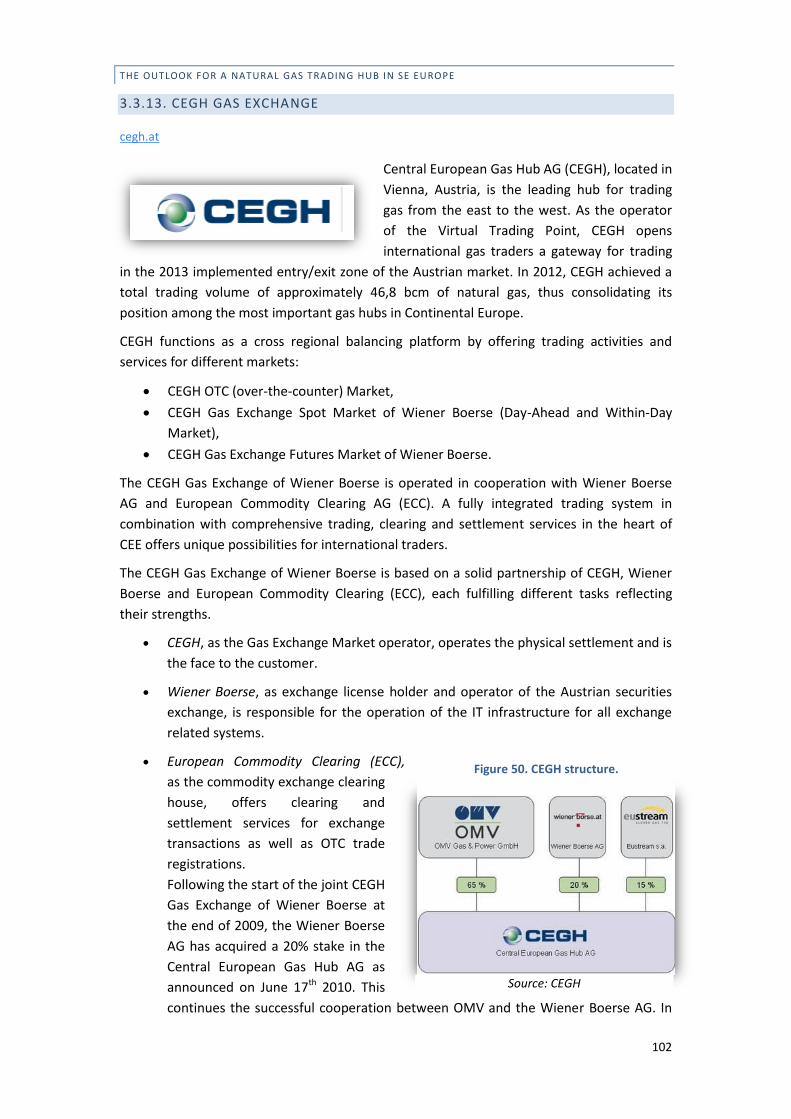
THE OUTLOOK FOR A NATURAL GAS TRADING HUB IN SE EUROPE
102
3.3.13. CEGH GAS EXCHANGE
cegh.at
Central European Gas Hub AG (CEGH), located in
Vienna, Austria, is the leading hub for trading
gas from the east to the west. As the operator
of the Virtual Trading Point, CEGH opens
international gas traders a gateway for trading
in the 2013 implemented entry/exit zone of the Austrian market. In 2012, CEGH achieved a
total trading volume of approximately 46,8 bcm of natural gas, thus consolidating its
position among the most important gas hubs in Continental Europe.
CEGH functions as a cross regional balancing platform by offering trading activities and
services for different markets:
CEGH OTC (over-the-counter) Market,
CEGH Gas Exchange Spot Market of Wiener Boerse (Day-Ahead and Within-Day
Market),
CEGH Gas Exchange Futures Market of Wiener Boerse.
The CEGH Gas Exchange of Wiener Boerse is operated in cooperation with Wiener Boerse
AG and European Commodity Clearing AG (ECC). A fully integrated trading system in
combination with comprehensive trading, clearing and settlement services in the heart of
CEE offers unique possibilities for international traders.
The CEGH Gas Exchange of Wiener Boerse is based on a solid partnership of CEGH, Wiener
Boerse and European Commodity Clearing (ECC), each fulfilling different tasks reflecting
their strengths.
CEGH, as the Gas Exchange Market operator, operates the physical settlement and is
the face to the customer.
Wiener Boerse, as exchange license holder and operator of the Austrian securities
exchange, is responsible for the operation of the IT infrastructure for all exchange
related systems.
European Commodity Clearing (ECC),
as the commodity exchange clearing
house, offers clearing and
settlement services for exchange
transactions as well as OTC trade
registrations.
Following the start of the joint CEGH
Gas Exchange of Wiener Boerse at
the end of 2009, the Wiener Boerse
AG has acquired a 20% stake in the
Central European Gas Hub AG as
announced on June 17th 2010. This
continues the successful cooperation between OMV and the Wiener Boerse AG. In
Source: CEGH
Figure 50. CEGH structure.
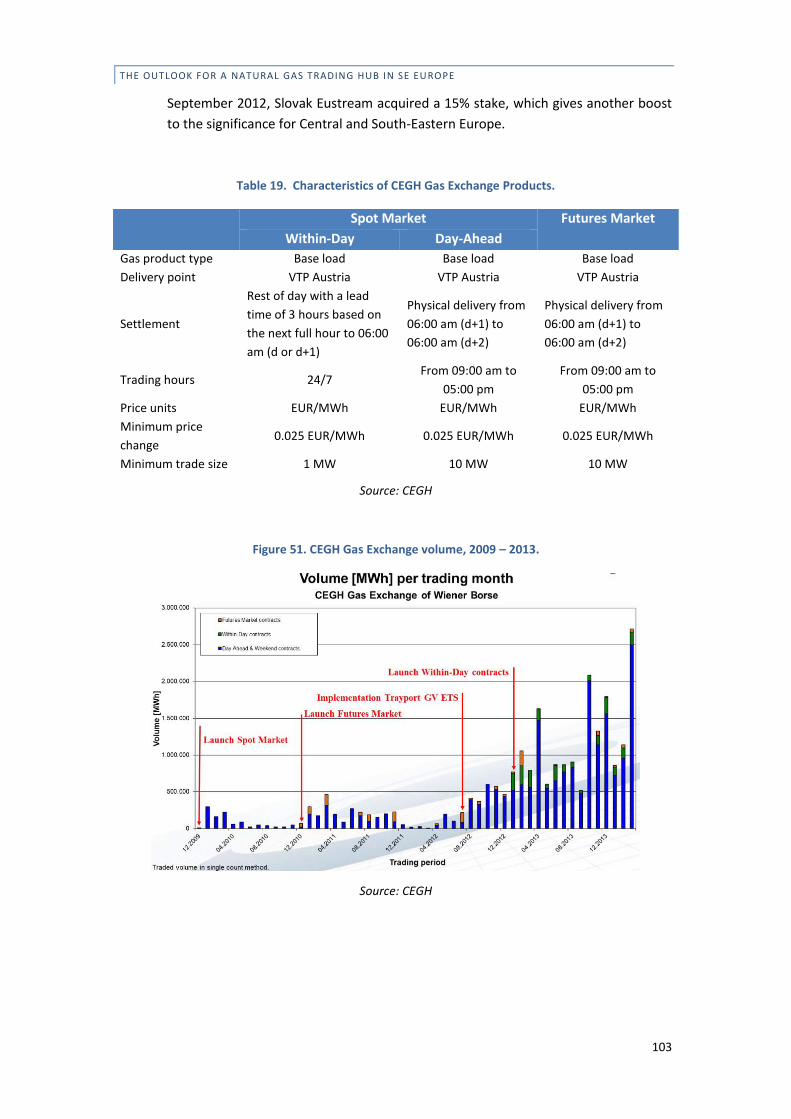
THE OUTLOOK FOR A NATURAL GAS TRADING HUB IN SE EUROPE
103
September 2012, Slovak Eustream acquired a 15% stake, which gives another boost
to the significance for Central and South-Eastern Europe.
Table 19. Characteristics of CEGH Gas Exchange Products.
Spot Market Futures Market
Within-Day Day-Ahead
Gas product type Base load Base load Base load
Delivery point VTP Austria VTP Austria VTP Austria
Settlement
Rest of day with a lead
time of 3 hours based on
the next full hour to 06:00
am (d or d+1)
Physical delivery from
06:00 am (d+1) to
06:00 am (d+2)
Physical delivery from
06:00 am (d+1) to
06:00 am (d+2)
Trading hours 24/7 From 09:00 am to
05:00 pm
From 09:00 am to
05:00 pm
Price units EUR/MWh EUR/MWh EUR/MWh
Minimum price
change 0.025 EUR/MWh 0.025 EUR/MWh 0.025 EUR/MWh
Minimum trade size 1 MW 10 MW 10 MW
Source: CEGH
Figure 51. CEGH Gas Exchange volume, 2009 – 2013.
Source: CEGH
THE OUTLOOK FOR A NATURAL GAS TRADING HUB IN SE EUROPE
104
3.3.14. POLISH POWER EXCHANGE
www.polpx.pl/en
Towarowa Giełda Energii SA (currently POLPX) was
established at the end of 1999. In the first six
months, from registration of its business operations,
it launched the Day Ahead Market (electricity spot
market). In 2003, POLPX was the first and so-far only entity to obtain a license to run a
commodity exchange market from the Financial Supervision Commission (KNF). Since
February 2012, it has been part of the Warsaw Stock Exchange Group, which holds 98% of
POLPX shares.
The key areas of POLPX operations are:
Day Ahead Market (DAM),
Intraday Market (IDM),
Day Ahead Market gas (DAMg),
Commodity Forward Instruments Market with Physical Delivery (CFIM),
Commodity Forward Instruments Market with Physical Delivery gas (CFIMg),
Property Rights Market for Renewable Energy Sources and Co-generation, (PRM)
CO2 Emission Allowance Market (EAM).
The Commodity Forward Instruments Market with Physical Delivery (CFIM) was established
on November 19th, 2008. Initially, the CFIM market traded BASE-type contracts with 24h
execution. On January 19th 2009, POLPX introduced PEAK5 contracts with supply between
7:00 and 22:00 (15 hours per day), on working days.
Currently, the CFIM Market is trading four types of instruments (classified in relation to their
term of execution):
Weekly (BASE_W), ( PEAK5_W), (PEAK7_W), (OFFPEAK_W)
Monthly (BASE_M), (PEAK5_M), (PEAK7_M), (OFFPEAK_M)
Quarterly (BASE_Q), (PEAK5_Q), (PEAK7_Q), (OFFPEAK_Q)
Yearly (BASE_Y),(PEAK5_Y), (PEAK7_Y), (OFFPEAK_Y)
Three nearest series of contracts are being traded for a particular execution date. This
means that for instance if a monthly BASE_M-01-09 contract is being executed (01 means
the number of the month - in this case it is January, 09 means the year, in this case 2009),
there will be three subsequent monthly contracts in the trading period: BASE_M-02-09,
BASE_M-03-09 and BASE_M-04-09. PEAK5 contracts are traded in a similar way.
Trading of the contracts is carried out in the continuous trading mode only, in the form of a
table of orders, using the IT system of POLPX. Trading sessions take place from Monday to
Friday 8:00 to 14:00.
The total volume of trading in electricity markets of POLPX in 2012 reached 131.997 TWh,
showing an increase of 4,20% over the previous year. This amounts to 82,57% of the total
energy produced in Poland and 84,06% of total consumption.
THE OUTLOOK FOR A NATURAL GAS TRADING HUB IN SE EUROPE
105
In 2006, POLPX launched a spot market for CO2 emission certificates in collaboration with
the National Administrator of the Emission Allowance Certificates Trading System.
Participants of this market can trade EUA units (European Union Allowance).
Natural Gas market
In December 2012 POLPX admitted forward contracts to trading on the Commodity Forward
Instruments Market with physical delivery. The contracts are settled by way of a physical
delivery of Group E high-methane natural gas and are hereinafter referred to as “gas
forward contracts”. The launch of the Commodity Forward Instruments Market with physical
delivery (gas) is only the beginning for the gas exchange in Poland. On 31 December 2012
the gas spot market Day-Ahead Market (DAMg) was launched.
The first half of 2013, the total trading volume in the gas reached 464.648 MWh, 179.071
MWh of which were traded in the spot market and 285.577 MWh in the forward market.
The total trading volume of the day-ahead market of natural gas in 2013 reached 1.399,76
MWh.
Energy Efficiency Certificates
As of 4 November 2013, the property rights arising from Energy Efficiency Certificates, i.e.
the so-called White Certificates have been introduced to trading on the Polish Power
Exchange.
The trading takes place daily, Monday till Thursday; OTC deals on Mondays and
Wednesdays, session trading on Tuesdays and Thursdays.
The Certificate of Origin Register keeps the records of the quantity of the Energy Efficiency
Certificates and the property rights arising therefrom with the accuracy of 0,001 toe. This
means that the number of the Property Rights corresponds to the toe value specified in the
relevant Energy Efficiency Certificate where one property right corresponds to 0,001 toe.
Toe stands for a tonne of oil equivalent, i.e. the equivalent of one tonne of oil with calorific
value of 41.868 kJ/kg.
3.3.15. OTE (CZECH REPUBLIC)
http://www.ote-cr.cz/
OTE, a.s., was founded on 18 April 2001 as a joint-stock
company by the Czech Republic’s government, which is
the Company’s sole shareholder. The Czech Ministry of
Industry and Trade is authorized by the government to
exercise the shareholders’ rights. In connection with OTE’s new role in the gas sector, the
Company’s original business name – Operátor trhu s elektřinou, a.s. – was changed to OTE,
a.s., in 2009. OTE, the Czech electricity and gas market operator provides comprehensive
services to individual electricity and gas market players. OTE commenced organizing trading
in the day-ahead electricity market in 2002 and the intra-day and block electricity markets in
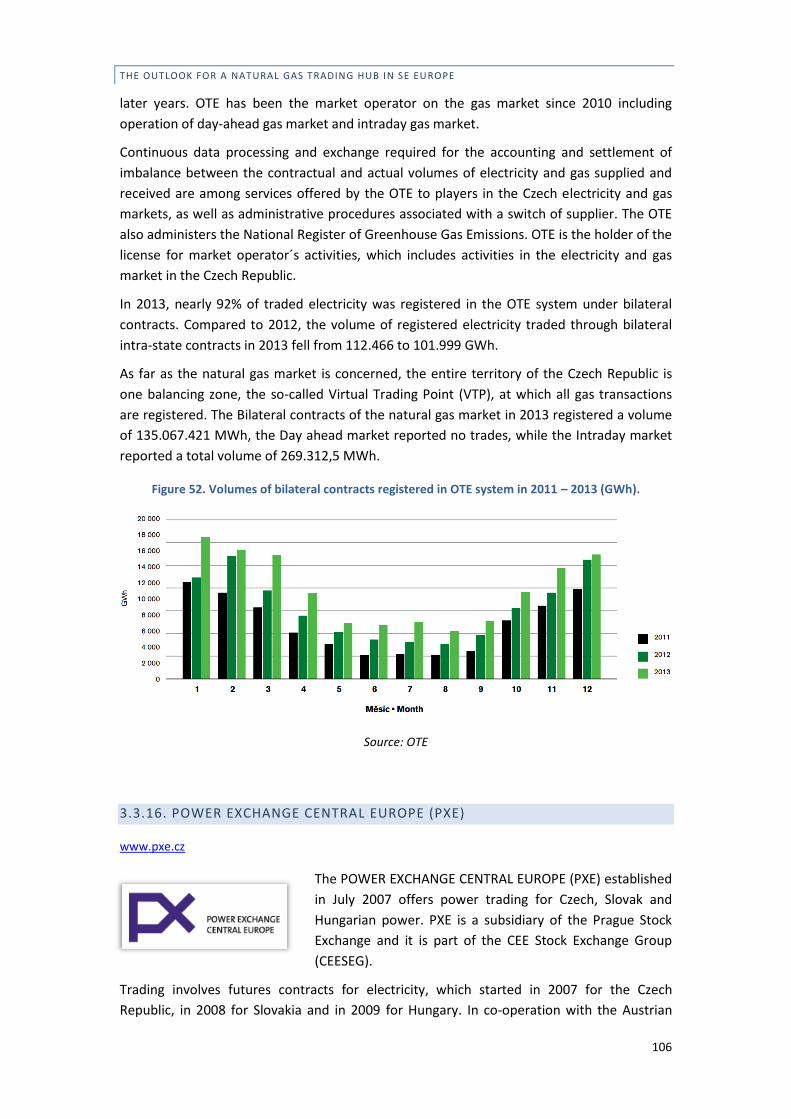
THE OUTLOOK FOR A NATURAL GAS TRADING HUB IN SE EUROPE
106
later years. OTE has been the market operator on the gas market since 2010 including
operation of day-ahead gas market and intraday gas market.
Continuous data processing and exchange required for the accounting and settlement of
imbalance between the contractual and actual volumes of electricity and gas supplied and
received are among services offered by the OTE to players in the Czech electricity and gas
markets, as well as administrative procedures associated with a switch of supplier. The OTE
also administers the National Register of Greenhouse Gas Emissions. OTE is the holder of the
license for market operator´s activities, which includes activities in the electricity and gas
market in the Czech Republic.
In 2013, nearly 92% of traded electricity was registered in the OTE system under bilateral
contracts. Compared to 2012, the volume of registered electricity traded through bilateral
intra-state contracts in 2013 fell from 112.466 to 101.999 GWh.
As far as the natural gas market is concerned, the entire territory of the Czech Republic is
one balancing zone, the so-called Virtual Trading Point (VTP), at which all gas transactions
are registered. The Bilateral contracts of the natural gas market in 2013 registered a volume
of 135.067.421 MWh, the Day ahead market reported no trades, while the Intraday market
reported a total volume of 269.312,5 MWh.
Figure 52. Volumes of bilateral contracts registered in OTE system in 2011 – 2013 (GWh).
Source: OTE
3.3.16. POWER EXCHANGE CENTRAL EUROPE (PXE)
www.pxe.cz
The POWER EXCHANGE CENTRAL EUROPE (PXE) established
in July 2007 offers power trading for Czech, Slovak and
Hungarian power. PXE is a subsidiary of the Prague Stock
Exchange and it is part of the CEE Stock Exchange Group
(CEESEG).
Trading involves futures contracts for electricity, which started in 2007 for the Czech
Republic, in 2008 for Slovakia and in 2009 for Hungary. In co-operation with the Austrian
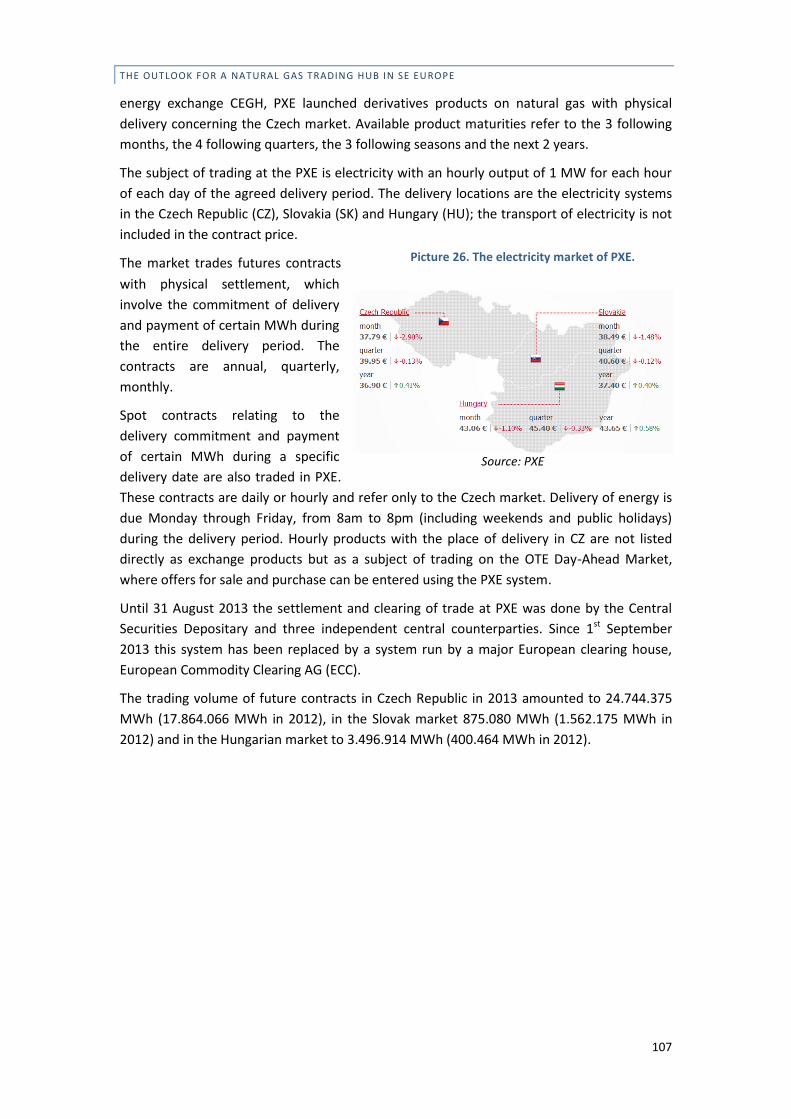
THE OUTLOOK FOR A NATURAL GAS TRADING HUB IN SE EUROPE
107
energy exchange CEGH, PXE launched derivatives products on natural gas with physical
delivery concerning the Czech market. Available product maturities refer to the 3 following
months, the 4 following quarters, the 3 following seasons and the next 2 years.
The subject of trading at the PXE is electricity with an hourly output of 1 MW for each hour
of each day of the agreed delivery period. The delivery locations are the electricity systems
in the Czech Republic (CZ), Slovakia (SK) and Hungary (HU); the transport of electricity is not
included in the contract price.
The market trades futures contracts
with physical settlement, which
involve the commitment of delivery
and payment of certain MWh during
the entire delivery period. The
contracts are annual, quarterly,
monthly.
Spot contracts relating to the
delivery commitment and payment
of certain MWh during a specific
delivery date are also traded in PXE.
These contracts are daily or hourly and refer only to the Czech market. Delivery of energy is
due Monday through Friday, from 8am to 8pm (including weekends and public holidays)
during the delivery period. Hourly products with the place of delivery in CZ are not listed
directly as exchange products but as a subject of trading on the OTE Day-Ahead Market,
where offers for sale and purchase can be entered using the PXE system.
Until 31 August 2013 the settlement and clearing of trade at PXE was done by the Central
Securities Depositary and three independent central counterparties. Since 1st September
2013 this system has been replaced by a system run by a major European clearing house,
European Commodity Clearing AG (ECC).
The trading volume of future contracts in Czech Republic in 2013 amounted to 24.744.375
MWh (17.864.066 MWh in 2012), in the Slovak market 875.080 MWh (1.562.175 MWh in
2012) and in the Hungarian market to 3.496.914 MWh (400.464 MWh in 2012).
Source: PXE
Picture 26. The electricity market of PXE.
THE OUTLOOK FOR A NATURAL GAS TRADING HUB IN SE EUROPE
108
3.3.17. CEGH CZECH GAS EXCHANGE
The CEGH Czech Gas Exchange is a natural gas futures market launched by the Central
European Gas Hub (CEGH) and Power Exchange Central Europe (PXE). CEGH with its long
experience in operating gas markets and PXE with the know-how of the Czech market and in
electricity trading together bring a lot of benefits for gas traders. CEGH Czech Gas Market is
operated by PXE. For members of both, CEGH or PXE the access to the CEGH Czech Gas
Market is available at reasonable costs with significant discounts on the participation fees.
At the CEGH Czech Gas Exchange the following products can be traded:
Monthly futures 3 consecutive months
Quarterly futures 4 consecutive quarters
Seasons 3 consecutive seasons (winter/summer)
Yearly futures 2 consecutive years
The trading method is order driven with market makers and fully electronic. The market runs
on the Trayport GlobalVision Exchange Trading System (ETS). The registration of OTC deals
for clearing is possible.
Clearing and settlement is provided by European Commodity Clearing AG (ECC).
3.3.18. HUNGARIAN POWER EXCHANGE (HUPX)
www.hupx.hu
The mission of HUPX Ltd. is to carry out the
obligatory task assigned to MAVIR Ltd. (as
Transmission System Operator) by the
Hungarian Energy Office requiring the
formation and operation of the organized
electricity market in Hungary.
In HUPX electricity products are traded in the Day ahead market since 2010, and futures
with physical delivery since 2011.
The products that can be traded on HUPXDAM are standard hourly contracts for the day-
ahead physical delivery of electricity within the Hungarian transmission systems.
On the HUPXPhF physical futures market four (4) front week, three (3) front month, four (4)
front quarter and three (3) front year electricity contracts are tradable, which are physically
delivered through the Hungarian electricity grid after their expiry.
The total trade volume in 2012 reached 13 TWh, which represents 30% of total consumption
in Hungary. In the day-ahead market 6.321 TWh were traded, while in the futures market
6.291 TWh.
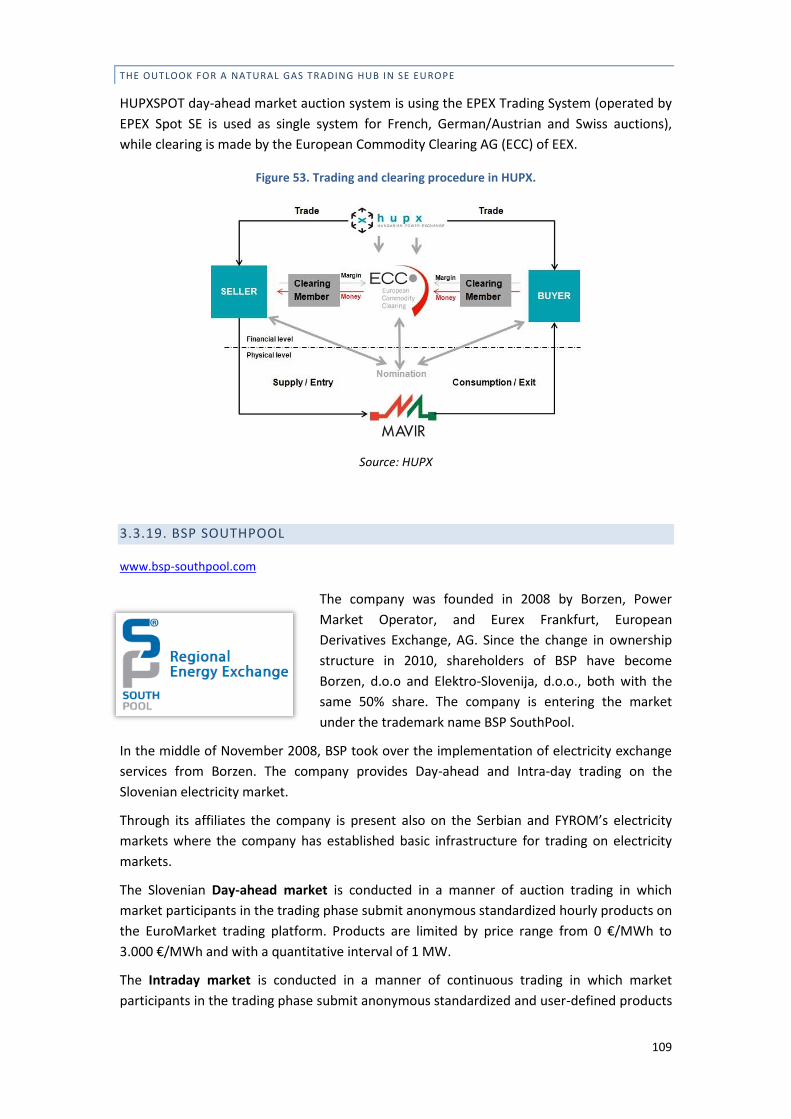
THE OUTLOOK FOR A NATURAL GAS TRADING HUB IN SE EUROPE
109
HUPXSPOT day-ahead market auction system is using the EPEX Trading System (operated by
EPEX Spot SE is used as single system for French, German/Austrian and Swiss auctions),
while clearing is made by the European Commodity Clearing AG (ECC) of EEX.
Figure 53. Trading and clearing procedure in HUPX.
Source: HUPX
3.3.19. BSP SOUTHPOOL
www.bsp-southpool.com
The company was founded in 2008 by Borzen, Power
Market Operator, and Eurex Frankfurt, European
Derivatives Exchange, AG. Since the change in ownership
structure in 2010, shareholders of BSP have become
Borzen, d.o.o and Elektro-Slovenija, d.o.o., both with the
same 50% share. The company is entering the market
under the trademark name BSP SouthPool.
In the middle of November 2008, BSP took over the implementation of electricity exchange
services from Borzen. The company provides Day-ahead and Intra-day trading on the
Slovenian electricity market.
Through its affiliates the company is present also on the Serbian and FYROM’s electricity
markets where the company has established basic infrastructure for trading on electricity
markets.
The Slovenian Day-ahead market is conducted in a manner of auction trading in which
market participants in the trading phase submit anonymous standardized hourly products on
the EuroMarket trading platform. Products are limited by price range from 0 €/MWh to
3.000 €/MWh and with a quantitative interval of 1 MW.
The Intraday market is conducted in a manner of continuous trading in which market
participants in the trading phase submit anonymous standardized and user-defined products
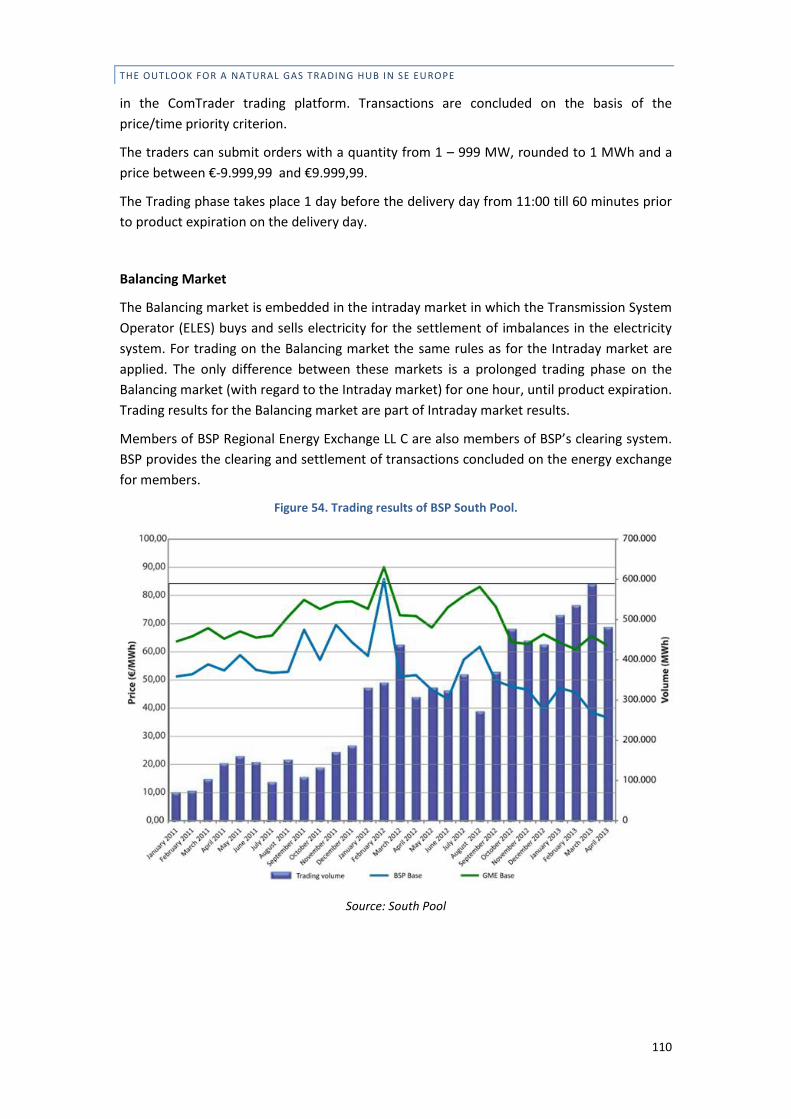
THE OUTLOOK FOR A NATURAL GAS TRADING HUB IN SE EUROPE
110
in the ComTrader trading platform. Transactions are concluded on the basis of the
price/time priority criterion.
The traders can submit orders with a quantity from 1 – 999 MW, rounded to 1 MWh and a
price between €-9.999,99 and €9.999,99.
The Trading phase takes place 1 day before the delivery day from 11:00 till 60 minutes prior
to product expiration on the delivery day.
Balancing Market
The Balancing market is embedded in the intraday market in which the Transmission System
Operator (ELES) buys and sells electricity for the settlement of imbalances in the electricity
system. For trading on the Balancing market the same rules as for the Intraday market are
applied. The only difference between these markets is a prolonged trading phase on the
Balancing market (with regard to the Intraday market) for one hour, until product expiration.
Trading results for the Balancing market are part of Intraday market results.
Members of BSP Regional Energy Exchange LL C are also members of BSP’s clearing system.
BSP provides the clearing and settlement of transactions concluded on the energy exchange
for members.
Figure 54. Trading results of BSP South Pool.
Source: South Pool
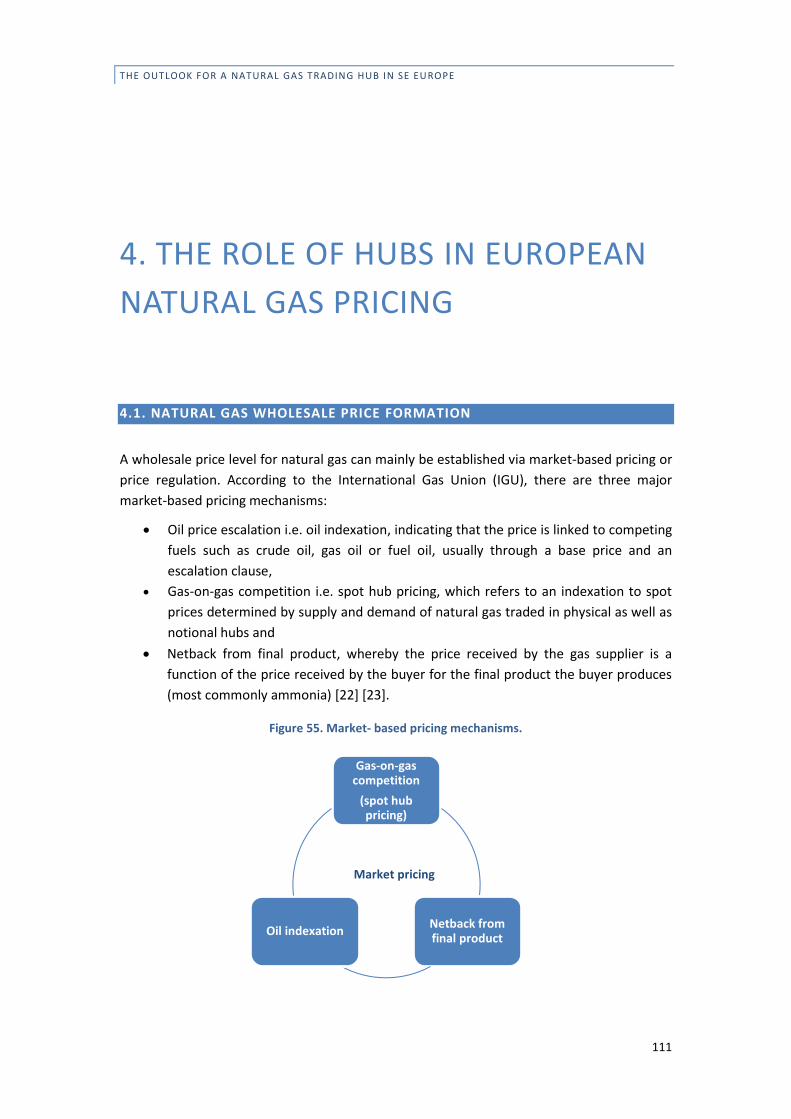
THE OUTLOOK FOR A NATURAL GAS TRADING HUB IN SE EUROPE
111
4. THE ROLE OF HUBS IN EUROPEAN
NATURAL GAS PRICING
4.1. NATURAL GAS WHOLESALE PRICE FORMATION
A wholesale price level for natural gas can mainly be established via market‐based pricing or
price regulation. According to the International Gas Union (IGU), there are three major
market-based pricing mechanisms:
Oil price escalation i.e. oil indexation, indicating that the price is linked to competing
fuels such as crude oil, gas oil or fuel oil, usually through a base price and an
escalation clause,
Gas‐on‐gas competition i.e. spot hub pricing, which refers to an indexation to spot
prices determined by supply and demand of natural gas traded in physical as well as
notional hubs and
Netback from final product, whereby the price received by the gas supplier is a
function of the price received by the buyer for the final product the buyer produces
(most commonly ammonia) [22] [23].
Figure 55. Market- based pricing mechanisms.
Gas-on-gas competition
(spot hub pricing)
Netback from final product
Oil indexation
Market pricing

THE OUTLOOK FOR A NATURAL GAS TRADING HUB IN SE EUROPE
112
Market‐based pricing in fact indicates that the price of natural gas is subject to a number of
market factors, such as supply and demand, exploration, production and storage levels,
weather patterns, pricing and availability of substitute fuels and market incumbents’ views
on future developments. It can also mean that the price of natural gas is linked i.e. indexed
to another commodity, such as oil, therefore allowing another market to affect the price
development of natural gas. Oil indexation is essentially based on the economic concept of
substitution.
On the other hand, when the natural gas wholesale price is determined by the government
(price regulation), price formation follows government policy objectives. According to the
IGU, price regulation mechanisms are principally applied in the former Soviet Union, the
Middle East, China, Malaysia and Indonesia. Price formation in Russia is both regulated and
non-regulated. Mainly State-owned Gazprom is the major natural gas supplier in the
regulated sector, while independent gas producers represent the non-regulated sector.
On the other side of the Atlantic North American natural gas prices are set in an open and
highly competitive market. Gas-on-gas competition is after all a mechanism created in the
US. Natural gas prices are set based on spot and futures markets where thousands of well-
informed buyers and sellers participate.
In Europe, gas pricing systems based on spot markets and oil price indexed formulas have
co-existed for more than ten years. Oil indexing emerged in Europe in the 1960s, and spread
to Asia, where it remains the prevalent model. However, in today’s two-tier European
pricing system, oil indexation is losing ground as the European gas market is moving
increasingly towards hub-based pricing.
Picture 27. Pricing models.
Source: Bergen Energi
In Europe, the competition oriented EU strategy and the participants’ preference to hub-
based pricing have led to dramatic changes in the price formation regime. According to IGU,
THE OUTLOOK FOR A NATURAL GAS TRADING HUB IN SE EUROPE
113
Europe has been shifting from oil indexation to gas-on-gas competition since 2005. Gas-on-
gas competition increased from 15% in 2005 to 45% in 2012 while oil indexation decreased
from 78% to 50% during the same period. The remaining 5% is mainly regulated. However,
in the Mediterranean11, oil indexation has decreased from 100% in 2005 to just nearly 90%
in 2012 with gas-on-gas competition representing the remaining 10%. This shift can be
attributed to spot LNG imports with some spot pipeline imports into Italy.
In South Eastern Europe12 there is no gas-on-gas competition (see Fig. 58). A large segment
of price formation is regulated: There is RCS (Regulation: Cost of Service) in Romania and
RSP (Regulation: Social and Political) in Croatia. According to IGU, lower imports in Romania
resulted in lower oil indexation levels in 2009 and 2010, while the increase in 2012 can be
attributed to the Bulgarian shift from Bilateral Monopoly to oil indexation.
GAS-ON-GAS COMPETITION VS. OIL INDEXATION
Oil-indexed prices have been associated mainly with long-term contracts while hub prices
have been associated with spot or short-term contracts. Oil-indexed long-term contracts
prevailed in the gas sector because they were considered to ensure investment security for
the producer as well as security of supply for the consumer. Oil-linked prices were also
considered to be more predictable than prices set by gas-on-gas competition. However, they
are now under pressure by a combination of factors, predominantly the consequences of the
2008 financial crisis, the full liberalization of British energy markets, the deregulation of
European electricity prices and the arrival of shale gas. It is interesting to note that in gas-
indexed markets such as in the US and UK, the oil indexed price has a high correlation with
the gas indexed price in the long run [24].
There has been a lot of debate about pricing gas based on oil product prices. Nowadays, the
transition away from oil product price linkage in contracts has already started, with a
significant degree of spot gas pricing indexation in long-term contracts. Major European
wholesalers want change. However, oil indexation is preferred by sellers, especially Russia.
On the other hand, a gas price mechanism which reflects the market value of the product
should be considered as a natural evolution for the pricing of a commodity. Indeed, long-
term contracts with prices linked to a gas market would ensure a price level reflecting the
balance of supply and demand of the product in addition to security of supply [25]. It is
widely regarded that gas-on-gas competition provides the “right” price of gas. Another
advantage of market pricing is that it allows for separate financial risk management since it
separates the “financial” from the “physical”. Market pricing is also more transparent and
open. The big question is whether traded gas markets will become the dominant gas price-
driver in Europe.
11 Greece, Italy, Portugal, Spain, Turkey 12 Bosnia, Bulgaria, Croatia, FYROM, Romania, Serbia, Slovenia
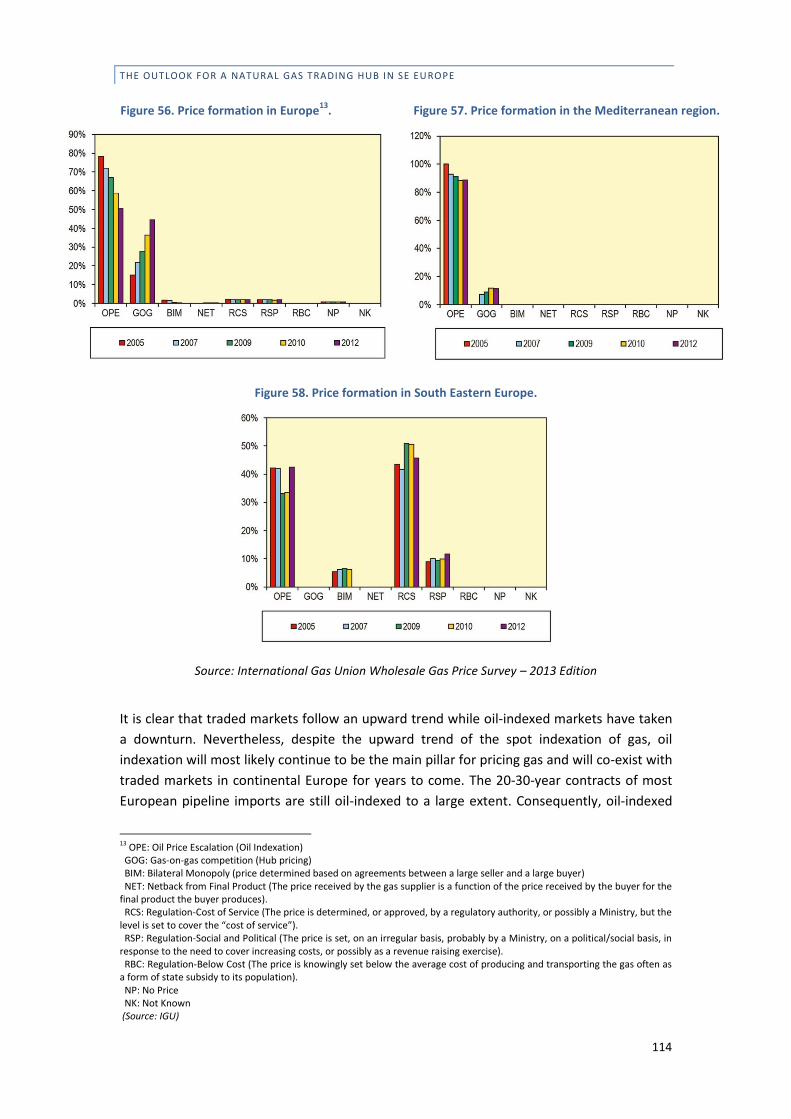
THE OUTLOOK FOR A NATURAL GAS TRADING HUB IN SE EUROPE
114
Figure 56. Price formation in Europe13
.
Figure 57. Price formation in the Mediterranean region.
Figure 58. Price formation in South Eastern Europe.
Source: International Gas Union Wholesale Gas Price Survey – 2013 Edition
It is clear that traded markets follow an upward trend while oil-indexed markets have taken
a downturn. Nevertheless, despite the upward trend of the spot indexation of gas, oil
indexation will most likely continue to be the main pillar for pricing gas and will co-exist with
traded markets in continental Europe for years to come. The 20-30-year contracts of most
European pipeline imports are still oil-indexed to a large extent. Consequently, oil-indexed
13 OPE: Oil Price Escalation (Oil Indexation) GOG: Gas-on-gas competition (Hub pricing) BIM: Bilateral Monopoly (price determined based on agreements between a large seller and a large buyer) NET: Netback from Final Product (The price received by the gas supplier is a function of the price received by the buyer for the final product the buyer produces). RCS: Regulation-Cost of Service (The price is determined, or approved, by a regulatory authority, or possibly a Ministry, but the level is set to cover the “cost of service”). RSP: Regulation-Social and Political (The price is set, on an irregular basis, probably by a Ministry, on a political/social basis, in response to the need to cover increasing costs, or possibly as a revenue raising exercise). RBC: Regulation-Below Cost (The price is knowingly set below the average cost of producing and transporting the gas often as a form of state subsidy to its population). NP: No Price NK: Not Known (Source: IGU)
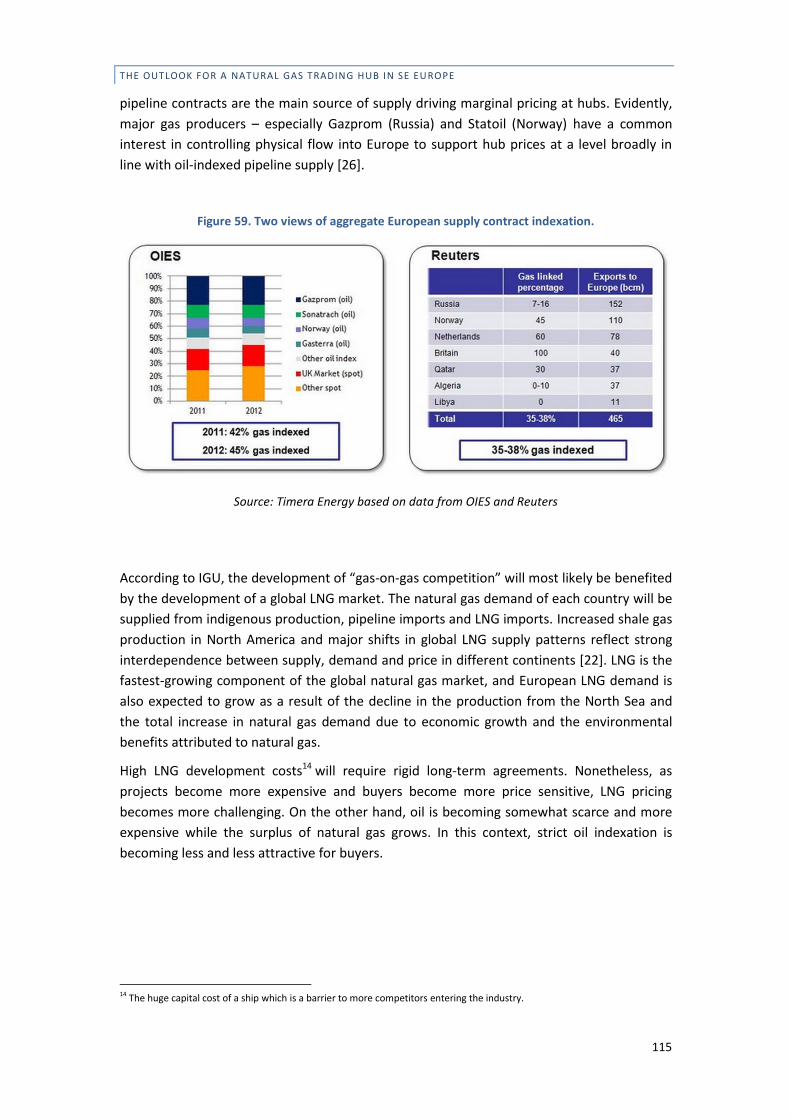
THE OUTLOOK FOR A NATURAL GAS TRADING HUB IN SE EUROPE
115
pipeline contracts are the main source of supply driving marginal pricing at hubs. Evidently,
major gas producers – especially Gazprom (Russia) and Statoil (Norway) have a common
interest in controlling physical flow into Europe to support hub prices at a level broadly in
line with oil-indexed pipeline supply [26].
Figure 59. Two views of aggregate European supply contract indexation.
Source: Timera Energy based on data from OIES and Reuters
According to IGU, the development of “gas-on-gas competition” will most likely be benefited
by the development of a global LNG market. The natural gas demand of each country will be
supplied from indigenous production, pipeline imports and LNG imports. Increased shale gas
production in North America and major shifts in global LNG supply patterns reflect strong
interdependence between supply, demand and price in different continents [22]. LNG is the
fastest-growing component of the global natural gas market, and European LNG demand is
also expected to grow as a result of the decline in the production from the North Sea and
the total increase in natural gas demand due to economic growth and the environmental
benefits attributed to natural gas.
High LNG development costs14 will require rigid long-term agreements. Nonetheless, as
projects become more expensive and buyers become more price sensitive, LNG pricing
becomes more challenging. On the other hand, oil is becoming somewhat scarce and more
expensive while the surplus of natural gas grows. In this context, strict oil indexation is
becoming less and less attractive for buyers.
14 The huge capital cost of a ship which is a barrier to more competitors entering the industry.

THE OUTLOOK FOR A NATURAL GAS TRADING HUB IN SE EUROPE
116
4.2. SPOT HUB PRICING VS. LONG-TERM CONTRACTS
Long-term contracts link sellers and buyers for a period of 20-30 years into a bilateral
monopoly, during which both of them have specifically defined obligations. New long-term
contracts often refer to a shorter period of 8-10 years. The risks are shared between the
parties, with the buyer bearing the volume risk and the seller bearing the price risk. Long-
term contracts provide companies that make significant investments in the extraction of gas
and in the building of dedicated infrastructures, with security of demand, giving them a
guaranteed source of revenue. Additionally, they provide wholesalers with security of supply
and facilitate long-term energy planning [27].
In contract negotiations, gas-producing companies want deals that can support their
infrastructure investments, while buyers aim at prices which can increase their market share
compared to competing fuels. Oil indexation is used to a large extent in order to protect the
buyer against price fluctuation relative to competing fuels, but has proven more
advantageous for producers due to the high oil prices compared to the lower natural gas
prices. Therefore, producers are not motivated to shift to hub-based pricing. They also
hesitate to abandon well-established practices such as long-term contracts and often
question a hub’s ability to provide a reliable price for natural gas [6].
Long-term contracts in the gas industry typically included a 20-year term, take-or-pay (TOP)
clauses and quarterly pricing adjustment based on competing fuels prices (usually oil). A TOP
obligation refers to an unconditional predetermined payment, which enables the purchaser
to receive a certain quantity of gas. However, minimum purchase commitments in long-term
gas contracts became increasingly unmanageable as buyers were forced to pay for natural
gas deliveries at much higher prices than their competitors [28].
Figure 60. Oil-price indexed contracts.
Source: Deloitte

THE OUTLOOK FOR A NATURAL GAS TRADING HUB IN SE EUROPE
117
On the other hand, sellers and buyers at spot markets can trade standardized natural gas
products at a variety of delivery dates and locations, anonymously, without specific relations
between the seller and the buyer. Hub trading is often used to supplement the long-term
contract volumes in a portfolio, as well as to adjust a portfolio towards delivery day [29].
They now offer a realistic alternative for buyers and sellers to balance their commitments.
Liquidity and transparency are the fundamentals for the success of a natural gas hub. As gas
market liquidity and integration increase, hub prices will reflect the EU demand and supply
of natural gas and will be less vulnerable to price manipulations. As already mentioned, the
usual metrics for a hub efficiency include measures of liquidity, such as the churn ratio (re-
trading ratio), the number of trading parties and the depth of liquidity in the futures curve,
and measures of trade concentration, such as the frequency distribution of volumes trades
on an individual basis [1]. The spot market is continuously developing, both in volumes and
in churn ratio and new hubs are emerging in Continental Europe. The competition between
them, as well as their traded volume, is increasing.
The gas-on-gas competition pricing model demands the creation of hubs, which will function
in a competitive and transparent regulatory environment. Spot transactions and futures are
essential for the development of hub-based pricing. Financial trading of natural gas means
that non-gas players, such as institutional investors, banks, trading firms etc. can participate
in the gas market and take on gas-specific risks. As a result, natural gas futures are now the
third largest physical commodity futures contract in the world by volume and continue to
grow.
The futures market provides financial products based on an underlying asset price and is
used to hedge physical positions. It basically allows the market participant to mitigate risk by
financially hedging a future position and locking in profits. This kind of hedging is successful
because futures prices are closely correlated with gas spot prices.
As the natural gas market matures (see Fig. 61), trading will increasingly be based on future
pricing. These developments towards future pricing do not necessarily mean market
participants will give up long‐term contracts, due to their strategic importance in securing
long‐term supply and demand.
Figure 61. Market maturity.
Long-term contracts
Short-term contracts
Spot/Future deals
Future pricing
Initial growth Intensive growth Mature market

THE OUTLOOK FOR A NATURAL GAS TRADING HUB IN SE EUROPE
118
Regardless of market dynamics, the role of long-term contracts is about to change because
they now have to be in line with the rules integrating the EU internal gas market. Market
monitoring will increase and contracts that do not meet the objectives set by the EU will not
be accepted. Gas pricing mechanisms are also expected to be affected by the internal gas
markets integration in the EU. Gas hub development is expected to benefit from the EU
energy strategy as well. The European Commission along with the Agency for the
Cooperation of Energy Bodies (ACER) and National Regulatory Authorities (NRA) will try to
remove any barriers to the integration of the internal gas markets and therefore, the level of
competition is about to improve [25].
4.3. GAS PRICING DISPUTES – THE ROLE OF RUSSIA
In the past few years the European gas market has emerged as the main battleground for
gas pricing. On the one hand gas suppliers support the dominant gas pricing mechanism,
which is oil-indexation, and on the other consumers demand the transition to the gas-on-gas
competition mechanism. While oil indexation still dominates Europe's gas supply contracts,
the market is shifting in favor of spot pricing. Major gas suppliers such as Russia and Qatar
rely heavily on oil indexation. Great Britain and the Netherlands are the only countries
where most of the gas is supplied on a spot market basis.
Long‐term oil-indexed contracts usually include an adjusting mechanism to possible changes
in market conditions (e.g. an unforeseen increase or decrease in demand), which is the
renegotiation of contract terms and their adaptation to the market conditions. Following the
shrinking of natural gas demand in 2009, the natural gas industry in Europe saw a
considerable number of renegotiations [6]. Indeed, European utilities have argued against
the oil-gas link, renegotiated the terms on their long-term contracts with major suppliers
and achieved a reduction in contract prices. Norwegian Statoil, Europe's second-biggest gas
supplier after Russia's Gazprom, now supplies almost half of its gas to Europe on a spot
basis. In 2012, Norway supplied European buyers with gas at significantly lower spot-indexed
prices and forced Russia to agree to a price concession and pay more than $4 billion in 2013
in order to compensate European customers who had complained about expensive gas
prices linked to the oil market. However, in 2013 Russia supplied around 133 bcm to Europe
widening its lead over Norway to about 30%.
In contrast to their European customers, major gas exporters, primarily Gazprom, remain
keen on maintaining the oil-gas link as the best natural gas pricing mechanism. High oil-
indexed prices have threatened to reduce Gazprom’ s market share in the past and are likely
to do so in the future, by promoting the development of shale gas in Europe and the building
of more LNG import terminals.
According to Gazprom, the rising cost of natural gas exploration, production and
infrastructure makes the increase of the oil-indexed gas price reasonable. As depicted in Fig.
59, upstream construction and operating costs have increased over recent years, driven
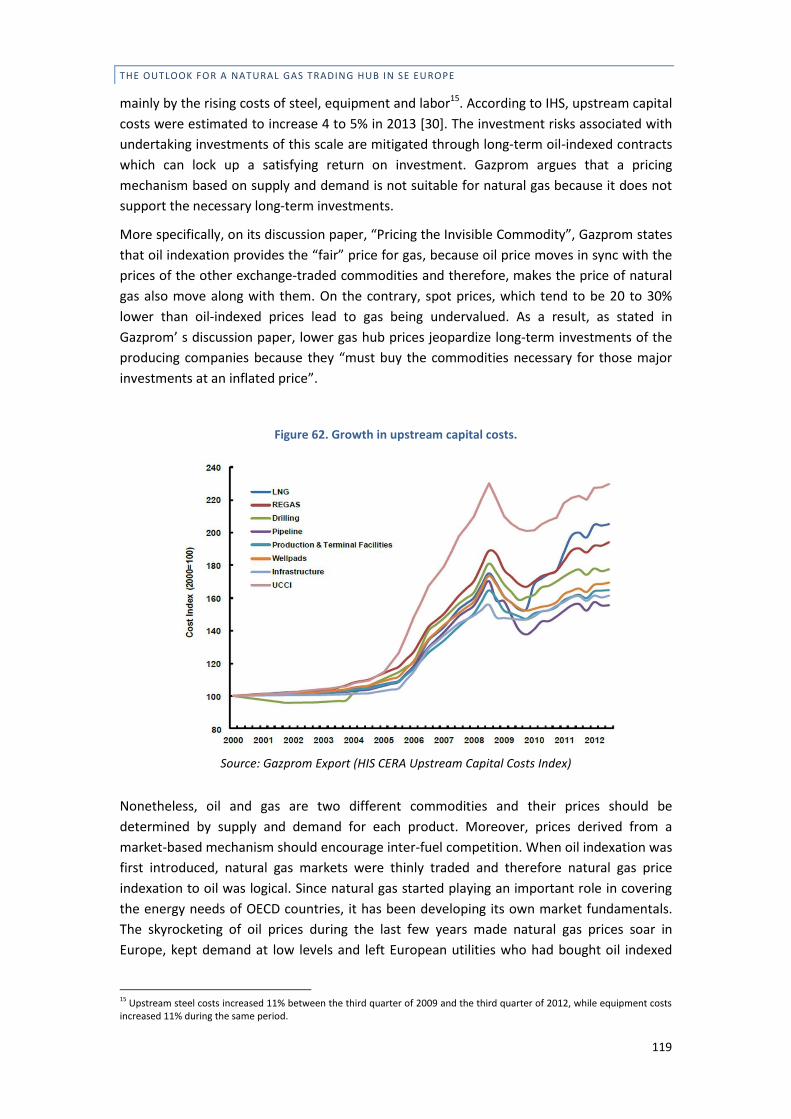
THE OUTLOOK FOR A NATURAL GAS TRADING HUB IN SE EUROPE
119
mainly by the rising costs of steel, equipment and labor15. According to IHS, upstream capital
costs were estimated to increase 4 to 5% in 2013 [30]. The investment risks associated with
undertaking investments of this scale are mitigated through long‐term oil-indexed contracts
which can lock up a satisfying return on investment. Gazprom argues that a pricing
mechanism based on supply and demand is not suitable for natural gas because it does not
support the necessary long-term investments.
More specifically, on its discussion paper, “Pricing the Invisible Commodity”, Gazprom states
that oil indexation provides the “fair” price for gas, because oil price moves in sync with the
prices of the other exchange-traded commodities and therefore, makes the price of natural
gas also move along with them. On the contrary, spot prices, which tend to be 20 to 30%
lower than oil-indexed prices lead to gas being undervalued. As a result, as stated in
Gazprom’ s discussion paper, lower gas hub prices jeopardize long-term investments of the
producing companies because they “must buy the commodities necessary for those major
investments at an inflated price”.
Figure 62. Growth in upstream capital costs.
Source: Gazprom Export (HIS CERA Upstream Capital Costs Index)
Nonetheless, oil and gas are two different commodities and their prices should be
determined by supply and demand for each product. Moreover, prices derived from a
market-based mechanism should encourage inter‐fuel competition. When oil indexation was
first introduced, natural gas markets were thinly traded and therefore natural gas price
indexation to oil was logical. Since natural gas started playing an important role in covering
the energy needs of OECD countries, it has been developing its own market fundamentals.
The skyrocketing of oil prices during the last few years made natural gas prices soar in
Europe, kept demand at low levels and left European utilities who had bought oil indexed
15 Upstream steel costs increased 11% between the third quarter of 2009 and the third quarter of 2012, while equipment costs increased 11% during the same period.
THE OUTLOOK FOR A NATURAL GAS TRADING HUB IN SE EUROPE
120
contracts exposed to competition. This situation resulted in an increase in arbitration
proceedings16 [31].
The gas-on-gas pricing mechanism, which is basically spot pricing, can quickly adapt to
rapidly changing market fundamentals. However, spot pricing does not imply that natural
gas prices will necessarily be lower than oil prices, just that gas prices will be formed based
on supply and demand dynamics for gas, rather than for oil. It is a common misconception
that oil-linked gas prices will necessarily be higher than those set at gas trading hubs. A long-
term gas contract based on the price at one or more trading hub could yield higher prices
than a similar contract linked to oil prices, depending on the selection of base prices and
escalators. Whether this price relationship would endure over the long term would depend
on the relative tightness of the oil and gas markets. Were oil prices to collapse as a result of
abundant supply (which may seem unlikely given the ongoing political problems besetting
major oil producers like Iraq and Libya), at a time when incremental gas supplies were
limited by delays to new LNG projects, then a situation could well emerge in which contracts
with hub-based prices could provide higher prices to producers than those linked to oil.
The shift will not be immediate nor will it signify the end of long-term contracts. It is more
likely that there will be a gradual but partial shift from oil indexation to spot/hub-based
pricing. With gas being used increasingly in power generation, oil indexation has lost its
rationale. Long-term contracts on the other hand, will still play an important role along with
the spot markets.
More concisely, oil indexation of gas contracts will be meeting more and more barriers for
the following reasons:
competition between sellers increases,
buyers become more price-sensitive,
gas-on-gas competition becomes more intense,
energy deregulation is promoted and
spot-price-based LNG exports become more available [32].
Oil prices will continue to affect natural gas prices, since oil is an economical substitute for
natural gas for power generators, manufacturers and large building owners, but the market
shift to spot pricing is already in process. In fact, it is estimated that in 2013 more than 50%
of Europe’s gas was brought to market by hub-based pricing rather than oil-indexed pricing.
16 European gas contracts include an arbitration clause according to which, in the case that there is an unresolved disagreement, the parties can resort to an arbitral tribunal or and appointed expert for a decision [17].
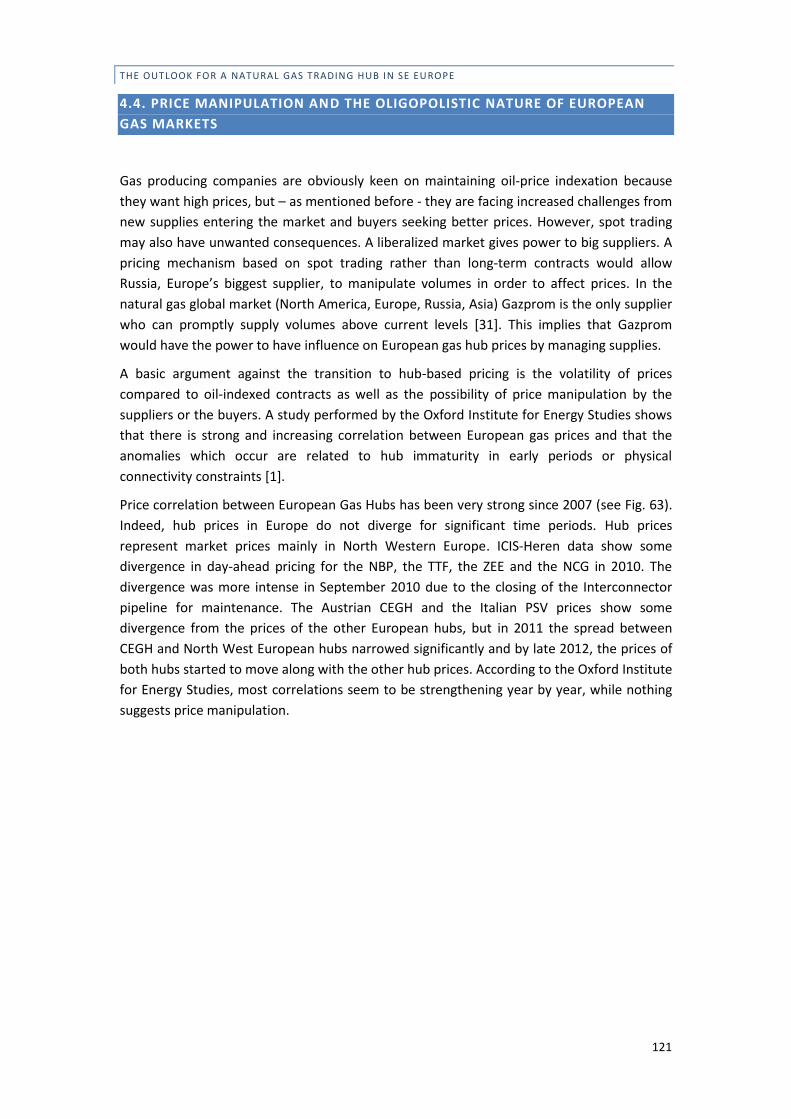
THE OUTLOOK FOR A NATURAL GAS TRADING HUB IN SE EUROPE
121
4.4. PRICE MANIPULATION AND THE OLIGOPOLISTIC NATURE OF EUROPEAN
GAS MARKETS
Gas producing companies are obviously keen on maintaining oil-price indexation because
they want high prices, but – as mentioned before - they are facing increased challenges from
new supplies entering the market and buyers seeking better prices. However, spot trading
may also have unwanted consequences. A liberalized market gives power to big suppliers. A
pricing mechanism based on spot trading rather than long-term contracts would allow
Russia, Europe’s biggest supplier, to manipulate volumes in order to affect prices. In the
natural gas global market (North America, Europe, Russia, Asia) Gazprom is the only supplier
who can promptly supply volumes above current levels [31]. This implies that Gazprom
would have the power to have influence on European gas hub prices by managing supplies.
A basic argument against the transition to hub-based pricing is the volatility of prices
compared to oil-indexed contracts as well as the possibility of price manipulation by the
suppliers or the buyers. A study performed by the Oxford Institute for Energy Studies shows
that there is strong and increasing correlation between European gas prices and that the
anomalies which occur are related to hub immaturity in early periods or physical
connectivity constraints [1].
Price correlation between European Gas Hubs has been very strong since 2007 (see Fig. 63).
Indeed, hub prices in Europe do not diverge for significant time periods. Hub prices
represent market prices mainly in North Western Europe. ICIS-Heren data show some
divergence in day-ahead pricing for the NBP, the TTF, the ZEE and the NCG in 2010. The
divergence was more intense in September 2010 due to the closing of the Interconnector
pipeline for maintenance. The Austrian CEGH and the Italian PSV prices show some
divergence from the prices of the other European hubs, but in 2011 the spread between
CEGH and North West European hubs narrowed significantly and by late 2012, the prices of
both hubs started to move along with the other hub prices. According to the Oxford Institute
for Energy Studies, most correlations seem to be strengthening year by year, while nothing
suggests price manipulation.
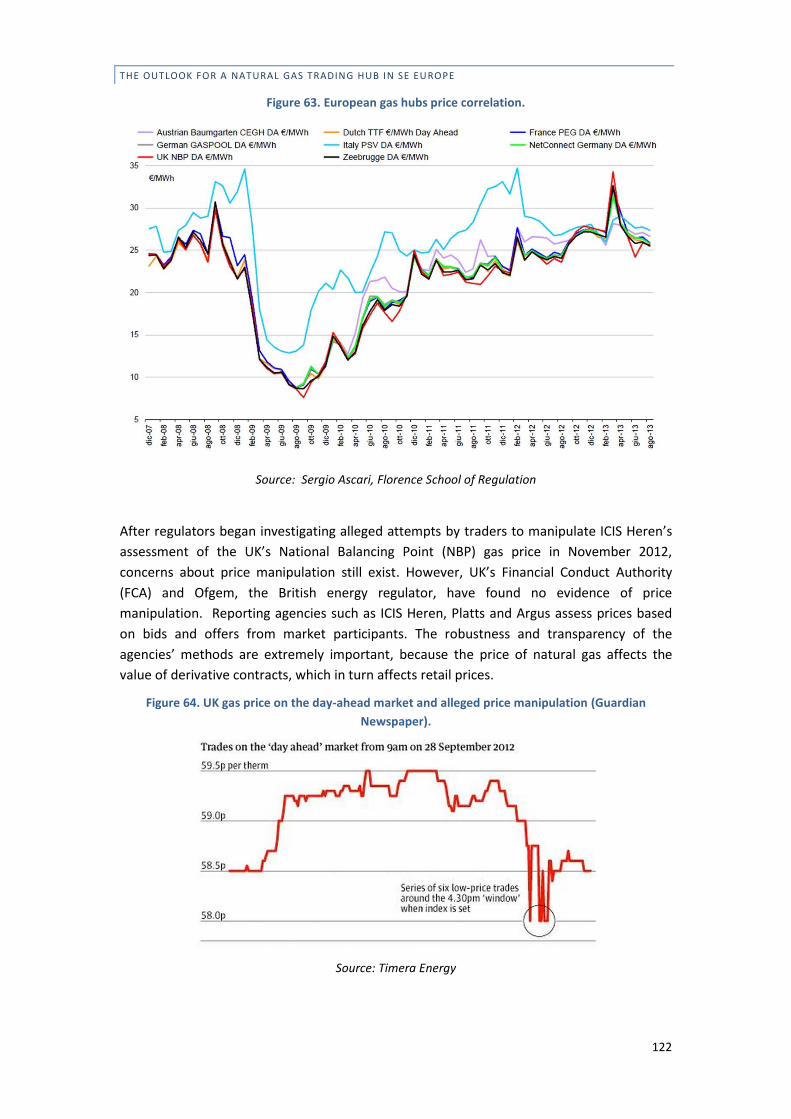
THE OUTLOOK FOR A NATURAL GAS TRADING HUB IN SE EUROPE
122
Figure 63. European gas hubs price correlation.
Source: Sergio Ascari, Florence School of Regulation
After regulators began investigating alleged attempts by traders to manipulate ICIS Heren’s
assessment of the UK’s National Balancing Point (NBP) gas price in November 2012,
concerns about price manipulation still exist. However, UK’s Financial Conduct Authority
(FCA) and Ofgem, the British energy regulator, have found no evidence of price
manipulation. Reporting agencies such as ICIS Heren, Platts and Argus assess prices based
on bids and offers from market participants. The robustness and transparency of the
agencies’ methods are extremely important, because the price of natural gas affects the
value of derivative contracts, which in turn affects retail prices.
Figure 64. UK gas price on the day-ahead market and alleged price manipulation (Guardian
Newspaper).
Source: Timera Energy
THE OUTLOOK FOR A NATURAL GAS TRADING HUB IN SE EUROPE
123
As depicted in Fig. 64, it appears that traders executed sell orders below the prevailing
market prices on 28 September 2012. The Heren index is set at the last price a product was
traded. Therefore, this price behavior probably had a bigger impact on the end of day price
assessment. A price based on the last trade means that it reflects more the price a product is
actually valued at, while the weighted average price on the other hand, catches the entire
life of a product. However, significant movements in the past can still impact the final price.
Price manipulation can occur when a trader takes a leveraged position in an instrument the
value of which derives from a price index. A trader can try to manipulate a price index with a
small trading volume in order to affect the value of wholesale contract volumes. The trader
has a loss this way, but his loss can be outweighed by a gain in the large contract volumes
with a value dependent on the index [33].
If a transaction takes place at an exchange, there is more transparency since the exchange
monitors and reports market prices. Nevertheless, the exchange cannot prevent two
counterparties agreeing at prices below the prevailing market and then moving forward on
the transaction. As far as the Over-the-Counter trades (OTC) are concerned, involved parties
are not obliged to disclose any detailed price information. Only indicative prices can be
made public from OTC counterparties.
Concerns over alleged trading malpractice are enforced by the conclusion of Hegde and
Fjeldstad that the majority of trading in many European hubs is done by incumbent gas
companies and domestic producers [24]. This becomes more evident at the less liquid hubs
in Central and Southern Europe, but can also be observed at the more liquid hubs.
Nevertheless, these concerns will recede as the market liberalization process moves forward
in the European Union. Hubs will gradually become more liquid and will have more market
participants. As a consequence, a single trader will not have the power to manipulate prices.
THE OLIGOPOLISTIC EUROPEAN GAS MARKET
The liberalization of the EU gas sector led to a shift from national monopolies to a bilateral
oligopoly, with a high degree of market concentration, where both buyers and sellers have
significant market power. The supply side is dominated by three major foreign sellers (the
Russian Gazprom, the Algerian Sonatrach, and the Norwegian Statoil), while the buying side
is dominated by major utility companies (e.g. Gaz de France, E.ON, Eni, EDF, Enel, RWE etc.).
Price negotiations can be intense because buyers try to protect final consumers’ interests.
However, one could argue that there is no real competition in the European natural gas
market. Prices are set competitively, but the oil-indexed contract dominance and the
oligopolistic market structure have prevented the expected price behavior of a competition-
based market. Oligopoly behavior with potential supply disruptions enables the producers to
control prices. Significant investments in networks and gas storage capacities are needed in
order to overcome competition barriers [34] [35].
Energy security has been very high on the list of the EU energy and foreign policy agenda in
the last decade. The main goals of the E.U. in the energy security domain are to decrease the
energy dependence of member states on as few external suppliers as possible and to
THE OUTLOOK FOR A NATURAL GAS TRADING HUB IN SE EUROPE
124
promote stable market rules which will make energy markets open and liquid. The EU aims
to ensure the diversification of gas supply in order to decrease the market share of the
largest foreign gas suppliers, and especially that of its biggest supplier, Russia, in an effort to
shift price negotiations to the benefit of European buyers. Russian – Ukrainian tensions in
2006 and 2009 resulted in disruptions in gas supply from Russia. Particularly, the Ukraine-
Russia gas dispute in 2009 caused the biggest gas supply crisis in Europe’s history. Supplies
to Europe were disrupted when negotiations between the two countries over gas prices and
outstanding debts resulted in Russia disrupting shipments to Ukraine. In 2006 the issue was
quickly resolved and supplies were restored leaving European exports unaffected. However,
the tense relations between Russia and Ukraine in 2009 were intensified when Gazprom
accused Ukraine of stealing millions of dollars' worth of transit supplies. Following this, all
Russian gas flows through Ukraine were halted for 13 days.
In early June 2014, Russia cut off gas supplies to Ukraine in response to the Kiev
government’s failure to pay for past deliveries. The cut-off of supplies was quickly followed
by an explosion on one of the transit gas pipelines across Ukraine carrying gas to Europe.
The availability of spare capacity along alternative routes meant that there was no
disruption to Russian gas deliveries to Europe. Neither Russia nor Ukraine has anything to
gain by disrupting deliveries to Europe, unless it can convincingly blame the disruption on
the other party.
Ukraine is by far the most important transit country for Europe, since it transports the
biggest volume of gas destined for Europe (about 20% of Europe’s gas supply). If Gazprom
and the Russian Federal Government were to have their way, this could change in the
future. The construction of bypass capacity beneath the Baltic Sea (55 bcm/yr already
operating and a similar additional capacity proposed through Nord Stream) and the Black
Sea (63 bcm/yr of capacity planned through South Stream) would, in time, allow Gazprom to
end the transit of gas to Europe across Ukraine. According to data published by the Ministry
of Energy and Coal Industry of Ukraine, 86 bcm of Russian gas transited the country in 2013,
a volume that could easily be diverted via Gazprom's proposed Nord Stream and South
Stream pipelines.

THE OUTLOOK FOR A NATURAL GAS TRADING HUB IN SE EUROPE
125
5. POTENTIAL SUPPLIERS OF THE
EUROPEAN GAS MARKET AND THEIR
ROLE IN MARKET LIQUIDITY
In 2012 roughly 80% of the EU gas import was based on pipeline gas, while the rest was
LNG. Pipeline imports will continue to dominate EU supplies, especially because a large part
of LNG supplies will be absorbed by the energy-hungry Asian markets. Europe remains the
second-largest LNG importer behind OECD Asia Oceania. Net natural gas imports in Europe
are expected to increase by 36 bcm to 277 bcm by 2018. According to the 2013 IEA Medium
Term Gas Market report, around 70% of OECD Europe imports will still be based on pipeline
gas in 2018 and Europe’s only additional source of supply will be Russia due to the absence
of any alternatives able to provide significant volumes. LNG imports are expected to
become more available after 2015 [36].
Figure 65. 2012 EU natural gas imports.
Source: BP Statistical Review of World Energy 2013
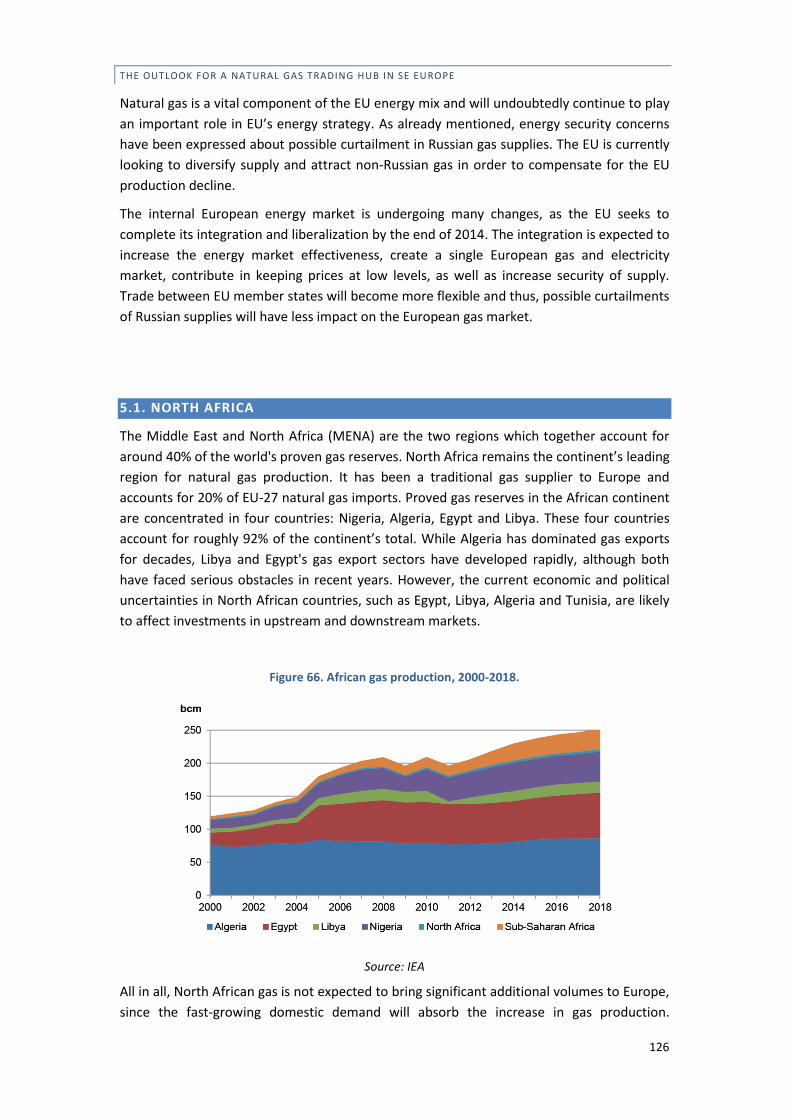
THE OUTLOOK FOR A NATURAL GAS TRADING HUB IN SE EUROPE
126
Natural gas is a vital component of the EU energy mix and will undoubtedly continue to play
an important role in EU’s energy strategy. As already mentioned, energy security concerns
have been expressed about possible curtailment in Russian gas supplies. The EU is currently
looking to diversify supply and attract non-Russian gas in order to compensate for the EU
production decline.
The internal European energy market is undergoing many changes, as the EU seeks to
complete its integration and liberalization by the end of 2014. The integration is expected to
increase the energy market effectiveness, create a single European gas and electricity
market, contribute in keeping prices at low levels, as well as increase security of supply.
Trade between EU member states will become more flexible and thus, possible curtailments
of Russian supplies will have less impact on the European gas market.
5.1. NORTH AFRICA
The Middle East and North Africa (MENA) are the two regions which together account for
around 40% of the world's proven gas reserves. North Africa remains the continent’s leading
region for natural gas production. It has been a traditional gas supplier to Europe and
accounts for 20% of EU-27 natural gas imports. Proved gas reserves in the African continent
are concentrated in four countries: Nigeria, Algeria, Egypt and Libya. These four countries
account for roughly 92% of the continent’s total. While Algeria has dominated gas exports
for decades, Libya and Egypt's gas export sectors have developed rapidly, although both
have faced serious obstacles in recent years. However, the current economic and political
uncertainties in North African countries, such as Egypt, Libya, Algeria and Tunisia, are likely
to affect investments in upstream and downstream markets.
Figure 66. African gas production, 2000-2018.
Source: IEA
All in all, North African gas is not expected to bring significant additional volumes to Europe,
since the fast-growing domestic demand will absorb the increase in gas production.
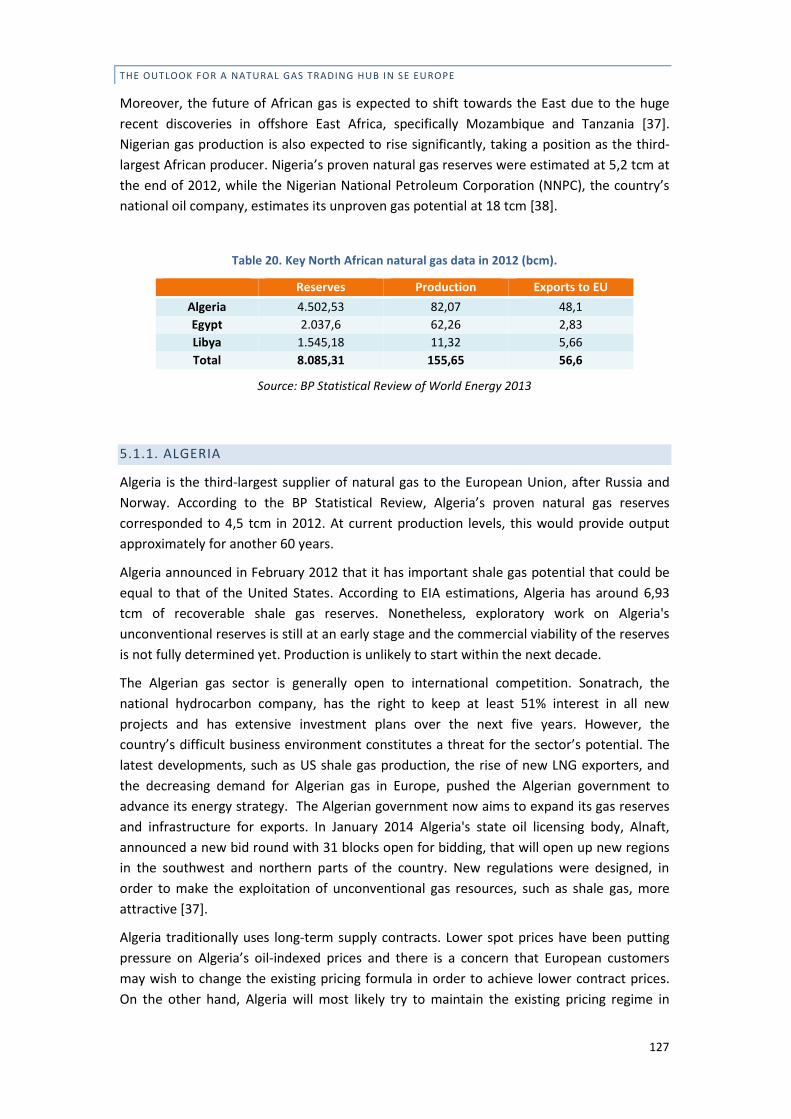
THE OUTLOOK FOR A NATURAL GAS TRADING HUB IN SE EUROPE
127
Moreover, the future of African gas is expected to shift towards the East due to the huge
recent discoveries in offshore East Africa, specifically Mozambique and Tanzania [37].
Nigerian gas production is also expected to rise significantly, taking a position as the third-
largest African producer. Nigeria’s proven natural gas reserves were estimated at 5,2 tcm at
the end of 2012, while the Nigerian National Petroleum Corporation (NNPC), the country’s
national oil company, estimates its unproven gas potential at 18 tcm [38].
Table 20. Key North African natural gas data in 2012 (bcm).
Reserves Production Exports to EU
Algeria 4.502,53 82,07 48,1
Egypt 2.037,6 62,26 2,83
Libya 1.545,18 11,32 5,66
Total 8.085,31 155,65 56,6
Source: BP Statistical Review of World Energy 2013
5.1.1. ALGERIA
Algeria is the third-largest supplier of natural gas to the European Union, after Russia and
Norway. According to the BP Statistical Review, Algeria’s proven natural gas reserves
corresponded to 4,5 tcm in 2012. At current production levels, this would provide output
approximately for another 60 years.
Algeria announced in February 2012 that it has important shale gas potential that could be
equal to that of the United States. According to EIA estimations, Algeria has around 6,93
tcm of recoverable shale gas reserves. Nonetheless, exploratory work on Algeria's
unconventional reserves is still at an early stage and the commercial viability of the reserves
is not fully determined yet. Production is unlikely to start within the next decade.
The Algerian gas sector is generally open to international competition. Sonatrach, the
national hydrocarbon company, has the right to keep at least 51% interest in all new
projects and has extensive investment plans over the next five years. However, the
country’s difficult business environment constitutes a threat for the sector’s potential. The
latest developments, such as US shale gas production, the rise of new LNG exporters, and
the decreasing demand for Algerian gas in Europe, pushed the Algerian government to
advance its energy strategy. The Algerian government now aims to expand its gas reserves
and infrastructure for exports. In January 2014 Algeria's state oil licensing body, Alnaft,
announced a new bid round with 31 blocks open for bidding, that will open up new regions
in the southwest and northern parts of the country. New regulations were designed, in
order to make the exploitation of unconventional gas resources, such as shale gas, more
attractive [37].
Algeria traditionally uses long-term supply contracts. Lower spot prices have been putting
pressure on Algeria’s oil-indexed prices and there is a concern that European customers
may wish to change the existing pricing formula in order to achieve lower contract prices.
On the other hand, Algeria will most likely try to maintain the existing pricing regime in
THE OUTLOOK FOR A NATURAL GAS TRADING HUB IN SE EUROPE
128
exchange for security of supply via pipelines and LNG delivery. However, this may turn out
to be a challenge for Algeria, at a period when European demand is low and domestic
demand is increasing. A disruption of Algeria’s gas industry or exports would create serious
problems for Algeria – due to the country’s heavy economic dependence on its energy
sector – as well as for Italy, Spain, and France, the major European importers of Algerian
natural gas. In view of the development of unconventional gas resources, traditional gas
producers such as Algeria may seek to increase their own exports even at lower prices. If
these market trends continue, it is very likely that Algeria will try to find alternative markets,
while the decoupling of natural gas prices from oil prices will increase [39].
5.1.2. EGYPT
Egypt is Africa’s second largest natural gas producer. The Suez Canal, a 163-km link between
the Red Sea and the Mediterranean, and the 320-km Sumed pipeline are strategic transit
routes for Persian Gulf oil and gas shipments to Europe and North America. Egypt’s gas
exports to the EU are in the form of LNG. Egypt has two LNG plants, Damietta and Idku. In
2010 Egypt’s gas exports to the EU decreased by 35%, while in 2011 they decreased by 12%,
as a result of a government decision to enact a two-year moratorium on new gas export
deals in 2008 due to the growing domestic demand for natural gas and the low international
gas prices at the time. LNG exports are expected to decline further in 2013 because
increased local demand has absorbed the additional natural gas supply.
Egyptian proven gas reserves correspond to 2 tcm and could cover the country’s energy
needs for many years to come. However, due to the increase in domestic demand, existing
export commitments and delayed gas explorations, Egypt is now experiencing nowadays a
natural gas crisis. According to BG Group, the British oil and gas producer, which announced
on January that it broke contracts with customers and lenders because it was unable to
export enough LNG from Egypt, gas exports fell because the Egyptian government, which
has to deal with social unrest, had ordered the diversion of the company’s natural gas
production to domestic purposes. Therefore, Egypt is not expected to export any gas in the
short to medium term, at least as far as its own production is concerned. Nevertheless,
Egyptian LNG facilities could use Israeli gas to export LNG, but this would take 3-4 years to
happen, if agreed.
Egypt's state-owned Egyptian Natural Gas Holding Company (EGAS) issued a tender for a
floating storage and regasification unit (FSRU) in 2013, which was planned to start operation
by April 2014, in order to meet rising demand. Its construction has experienced delays and it
is now estimated that it will not start operation before summer 2014. Furthermore, the
Norwegian firm awarded the project rejected the commercial terms, making it more difficult
for the Egyptian government to deal with the already acute shortages. Indeed, according to
government estimates, production will fail to meet the domestic demand in the next fiscal
year. The country’s political turmoil is aggravating the situation even more.
Egypt’s energy insecurity currently affects its consumers, the local industry, as well as the
Egyptian economy in general. According to analysts, energy imports would send a negative
THE OUTLOOK FOR A NATURAL GAS TRADING HUB IN SE EUROPE
129
signal to foreign firms, which are becoming increasingly reconciled to the prospect of LNG
exports halting entirely this summer. Nevertheless, it is estimated that unless Egypt handles
the issues blocking gas production by foreign companies, it will inevitably have to import
increasing volumes to meet own rising energy needs.
5.1.3. LIBYA
With the development of offshore fields and the opening of the Greenstream pipeline to
Europe, Libyan natural gas production and exports increased after 2003 [40]. The Marsa El
Brega LNG terminal Libya ceased to export LNG in 2012 after the 2011 crisis, and is assumed
de-commissioned [41]. During 2011’s civil war, Libya’s natural gas production and exports
were suspended. However, since the end of 2011, gas production has been restored and is
now close to pre-crisis levels.
According to the 2013 BP Statistical Review, Libya's proven natural gas reserves
corresponded to 1,5 tcm at the end of 2012. The Libyan National Oil Corporation (NOC) has
stated that Libya’s gas reserves are “largely unexploited and unexplored”. Libya may truly
have a significant potential to increase its natural gas exports if natural gas exploration is
boosted. Nevertheless, local demand for electricity generation may boost domestic demand
for natural gas.
5.2. CASPIAN SEA REGION AND CENTRAL ASIA
The European Commission welcomed the final investment decision (FID) on extracting gas
from the Shah Deniz II gas field in Azerbaijan in December 2013. This FID will eventually
open the Southern Gas Corridor and will bring Europe closer to its goal of diversifying
natural gas supplies by ensuring that gas will be transported from the Caspian Sea region to
Europe, specifically Central Europe and South Eastern Europe, which depend solely on
Russia for gas supplies. Starting from end 2019, Europe will obtain 10 bcm of gas per year
from the Caspian Sea region, starting with Azerbaijan. At a later stage and provided that the
necessary infrastructure is in place, gas can be exported to Europe also from Kazakhstan,
Turkmenistan, Uzbekistan and Iran.
Azerbaijan's proven natural gas reserves are about 0,9 tcm, most of which are found in the
Shah Deniz field. Kazakhstan’s total proved gas reserves correspond to 1,3 tcm, while
Turkmenistan and Ubzekistan have 17,5 and 1,1 tcm of total proved gas reserves
correspondingly [42]. Kazakhstan and Ubzekistan however, utilize most of the gas they
produce domestically. Russia of course, has the largest gas reserves in the region.
Nonetheless, a significant part of the expected gas flows towards Europe are expected to be
absorbed by the energy-hungry Turkish market, as an annual output of 16 bcm/yr has
already been contracted from Shah Deniz II.
The region's strategic location between both Europe and Asia renders it attractive for
energy investments by a variety of international companies. The ability of the Caspian Sea
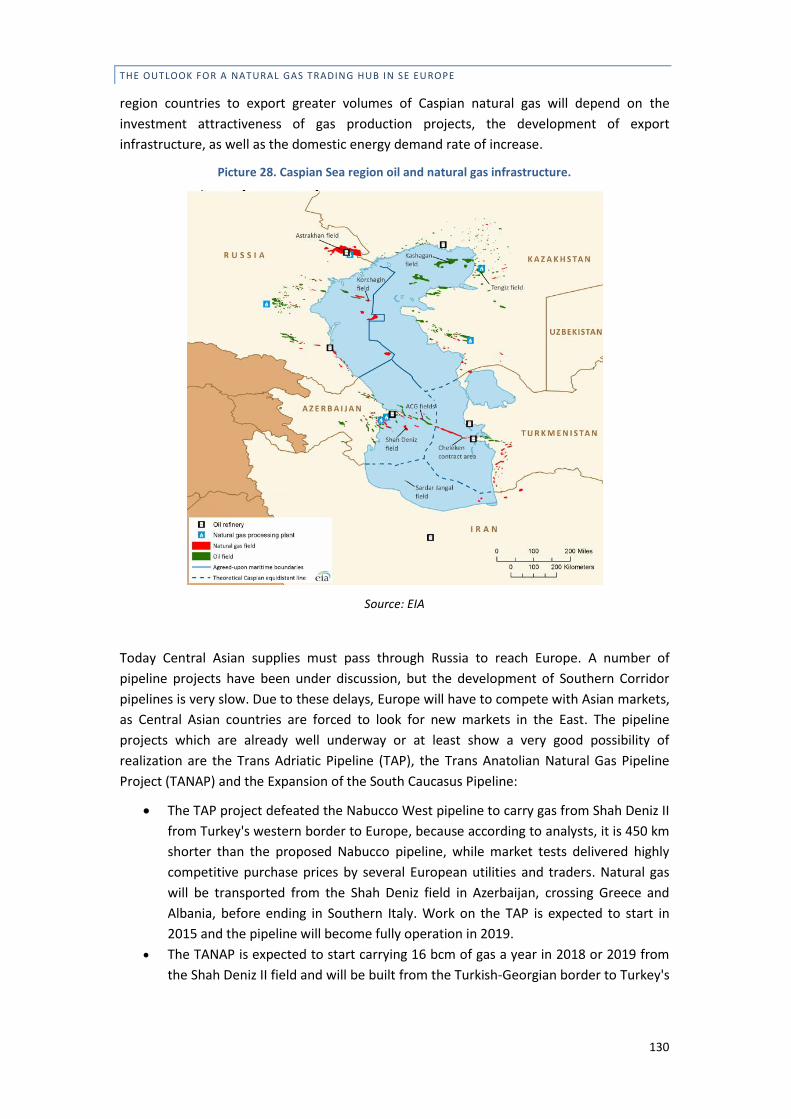
THE OUTLOOK FOR A NATURAL GAS TRADING HUB IN SE EUROPE
130
region countries to export greater volumes of Caspian natural gas will depend on the
investment attractiveness of gas production projects, the development of export
infrastructure, as well as the domestic energy demand rate of increase.
Picture 28. Caspian Sea region oil and natural gas infrastructure.
Source: EIA
Today Central Asian supplies must pass through Russia to reach Europe. A number of
pipeline projects have been under discussion, but the development of Southern Corridor
pipelines is very slow. Due to these delays, Europe will have to compete with Asian markets,
as Central Asian countries are forced to look for new markets in the East. The pipeline
projects which are already well underway or at least show a very good possibility of
realization are the Trans Adriatic Pipeline (TAP), the Trans Anatolian Natural Gas Pipeline
Project (TANAP) and the Expansion of the South Caucasus Pipeline:
The TAP project defeated the Nabucco West pipeline to carry gas from Shah Deniz II
from Turkey's western border to Europe, because according to analysts, it is 450 km
shorter than the proposed Nabucco pipeline, while market tests delivered highly
competitive purchase prices by several European utilities and traders. Natural gas
will be transported from the Shah Deniz field in Azerbaijan, crossing Greece and
Albania, before ending in Southern Italy. Work on the TAP is expected to start in
2015 and the pipeline will become fully operation in 2019.
The TANAP is expected to start carrying 16 bcm of gas a year in 2018 or 2019 from
the Shah Deniz II field and will be built from the Turkish-Georgian border to Turkey's
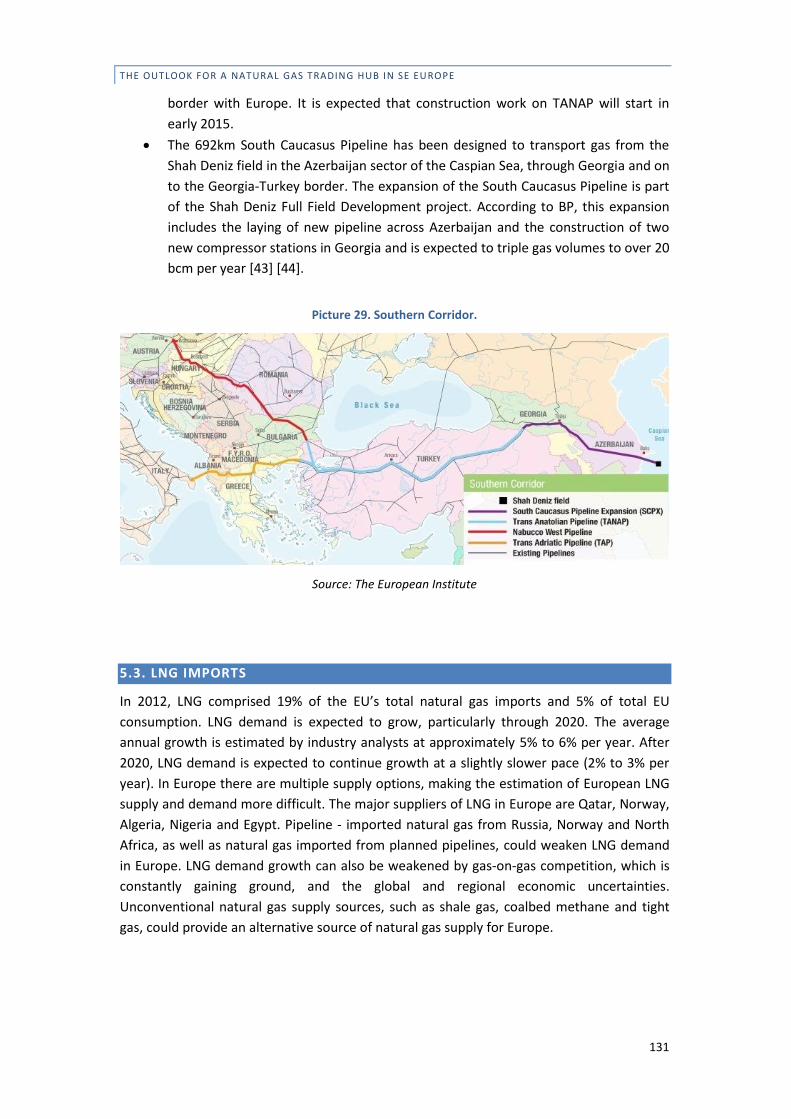
THE OUTLOOK FOR A NATURAL GAS TRADING HUB IN SE EUROPE
131
border with Europe. It is expected that construction work on TANAP will start in
early 2015.
The 692km South Caucasus Pipeline has been designed to transport gas from the
Shah Deniz field in the Azerbaijan sector of the Caspian Sea, through Georgia and on
to the Georgia-Turkey border. The expansion of the South Caucasus Pipeline is part
of the Shah Deniz Full Field Development project. According to BP, this expansion
includes the laying of new pipeline across Azerbaijan and the construction of two
new compressor stations in Georgia and is expected to triple gas volumes to over 20
bcm per year [43] [44].
Picture 29. Southern Corridor.
Source: The European Institute
5.3. LNG IMPORTS
In 2012, LNG comprised 19% of the EU’s total natural gas imports and 5% of total EU
consumption. LNG demand is expected to grow, particularly through 2020. The average
annual growth is estimated by industry analysts at approximately 5% to 6% per year. After
2020, LNG demand is expected to continue growth at a slightly slower pace (2% to 3% per
year). In Europe there are multiple supply options, making the estimation of European LNG
supply and demand more difficult. The major suppliers of LNG in Europe are Qatar, Norway,
Algeria, Nigeria and Egypt. Pipeline - imported natural gas from Russia, Norway and North
Africa, as well as natural gas imported from planned pipelines, could weaken LNG demand
in Europe. LNG demand growth can also be weakened by gas-on-gas competition, which is
constantly gaining ground, and the global and regional economic uncertainties.
Unconventional natural gas supply sources, such as shale gas, coalbed methane and tight
gas, could provide an alternative source of natural gas supply for Europe.
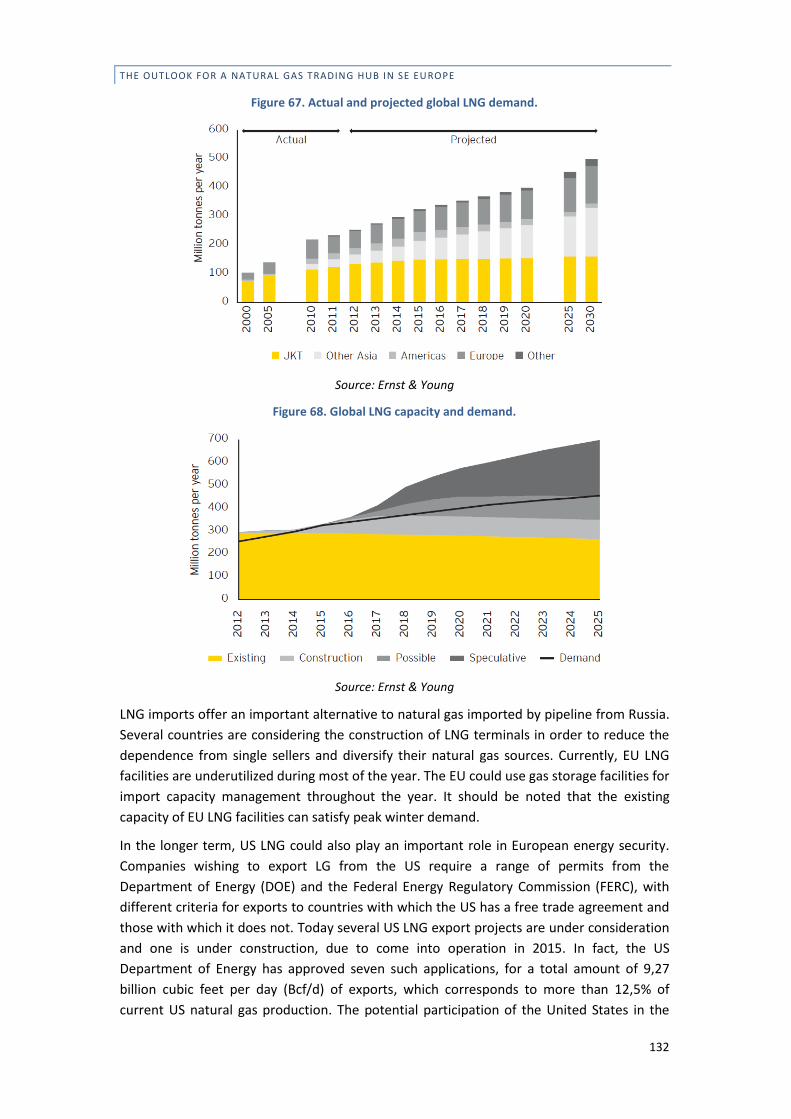
THE OUTLOOK FOR A NATURAL GAS TRADING HUB IN SE EUROPE
132
Figure 67. Actual and projected global LNG demand.
Source: Ernst & Young
Figure 68. Global LNG capacity and demand.
Source: Ernst & Young
LNG imports offer an important alternative to natural gas imported by pipeline from Russia.
Several countries are considering the construction of LNG terminals in order to reduce the
dependence from single sellers and diversify their natural gas sources. Currently, EU LNG
facilities are underutilized during most of the year. The EU could use gas storage facilities for
import capacity management throughout the year. It should be noted that the existing
capacity of EU LNG facilities can satisfy peak winter demand.
In the longer term, US LNG could also play an important role in European energy security.
Companies wishing to export LG from the US require a range of permits from the
Department of Energy (DOE) and the Federal Energy Regulatory Commission (FERC), with
different criteria for exports to countries with which the US has a free trade agreement and
those with which it does not. Today several US LNG export projects are under consideration
and one is under construction, due to come into operation in 2015. In fact, the US
Department of Energy has approved seven such applications, for a total amount of 9,27
billion cubic feet per day (Bcf/d) of exports, which corresponds to more than 12,5% of
current US natural gas production. The potential participation of the United States in the
THE OUTLOOK FOR A NATURAL GAS TRADING HUB IN SE EUROPE
133
global LNG market is expected to affect natural gas pricing globally, reducing the price
differential between LNG in Europe and in Asia. US LNG production will therefore, offer an
additional source of gas supply and can lead to a decrease in natural gas prices. Moreover,
since US natural gas prices are not linked to those for oil, significant volumes of LNG exports
from the US would put additional pressure to traditional sellers like Russia, to delink the two
fuels [45]. US LNG will be sold by private companies driven to maximize their profits and
there is no guarantee that large volumes of US LNG will be exported to Europe if better
returns can be earned from sales to Asian buyers.
Furthermore, East African countries, particularly Mozambique and Tanzania, present new
opportunities as somewhat underexplored areas with resource potential. Although the US
EIA reports that gas reserves of Mozambique amounted to 4,5 tcf and those of Tanzania
amount to only 0,23 tcf in 2013, recent discoveries indicate that these numbers will
increase. Anadarko Petroleum Corp., an American oil and gas exploration company, has
discovered recoverable gas reserves of 50-70 tcf, while Italy’s Eni projects that it has around
93 tcf of recoverable natural gas. Eni has also announced that it plans to build an onshore
LNG plant and two floating LNG plants in Mozambique’s Mamba field with a combined
capacity of 10 million tonnes per annum (mtpa). A final investment decision (FID) is
expected in 2015, while production is due to start in 2020.
Tanzania’s estimated reserves are smaller but still significant. The latest estimates indicate
that there are total recoverable gas resources amounting to 23-26 trillion cubic feet (tcf).
The resource exploration and appraisal is still ongoing. However, the British BG Group and
the Norwegian Statoil have announced their plan to build an LNG export terminal which is
expected to start production after 2020, while a final investment decision is expected in late
2016.
According to the US EIA, Angola, the second largest proven natural gas reserves in sub-
Saharan Africa after Nigeria, had approximately 12,9 tcf in proven natural gas reserves in
2013 [46]. The LNG processing facility in Soyo, the largest investment ever made in Angola,
will have a capacity of 6,8 bcm/yr at full production. The main focus for LNG exports will be
drawn to Asian and European markets, although they were originally focused on the US
market. However, the growing US shale gas production US lead to a decrease in US gas
prices and forced the Angola LNG project partners to negotiate new contracts aiming to find
markets with higher prices [39]. In June 2013 the first cargo was shipped to Japan, but only
10 cargoes since it started up. The LNG facility has been recently forced to shut down due to
technical issues which have caused an unplanned interruption to production and according
to Minister Jose Maria Botelho de Vasconcelos will remain offline until 2015 to allow its
contractor, Bechtel, to make repairs and increase capacity at the plant.
Finally, the role of Canada has emerged, as an LNG supply source for Europe, as the German
company E.ON confirmed in June 2013 that it agreed with Canada's Pieridae Energy to
purchase 5 million tons of LNG annually for 20 years starting in 2020. Also, Spanish Repsol
SA is considering building a $2 billion plant at its existing Canaport facility in order to export
natural gas. The Canadian government intends to back LNG projects on the East Coast,
which will increase the competition between Canada and the US for a larger share of the
European gas market.
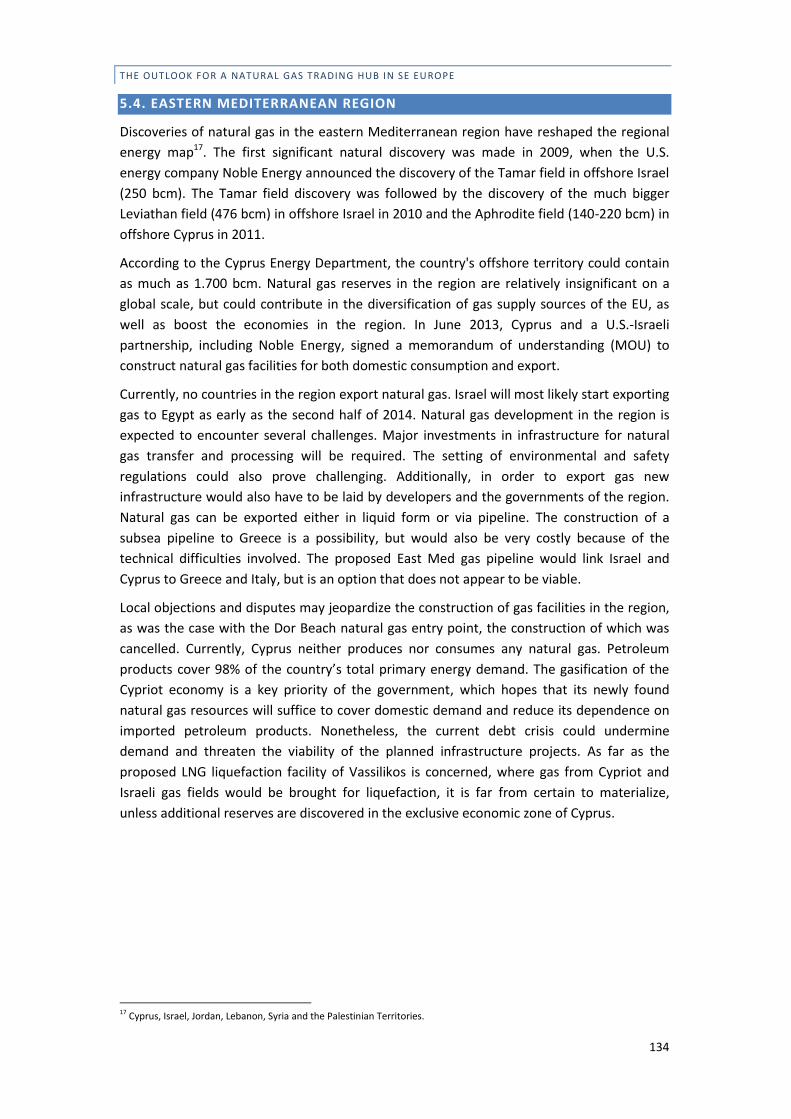
THE OUTLOOK FOR A NATURAL GAS TRADING HUB IN SE EUROPE
134
5.4. EASTERN MEDITERRANEAN REGION
Discoveries of natural gas in the eastern Mediterranean region have reshaped the regional
energy map17. The first significant natural discovery was made in 2009, when the U.S.
energy company Noble Energy announced the discovery of the Tamar field in offshore Israel
(250 bcm). The Tamar field discovery was followed by the discovery of the much bigger
Leviathan field (476 bcm) in offshore Israel in 2010 and the Aphrodite field (140-220 bcm) in
offshore Cyprus in 2011.
According to the Cyprus Energy Department, the country's offshore territory could contain
as much as 1.700 bcm. Natural gas reserves in the region are relatively insignificant on a
global scale, but could contribute in the diversification of gas supply sources of the EU, as
well as boost the economies in the region. In June 2013, Cyprus and a U.S.-Israeli
partnership, including Noble Energy, signed a memorandum of understanding (MOU) to
construct natural gas facilities for both domestic consumption and export.
Currently, no countries in the region export natural gas. Israel will most likely start exporting
gas to Egypt as early as the second half of 2014. Natural gas development in the region is
expected to encounter several challenges. Major investments in infrastructure for natural
gas transfer and processing will be required. The setting of environmental and safety
regulations could also prove challenging. Additionally, in order to export gas new
infrastructure would also have to be laid by developers and the governments of the region.
Natural gas can be exported either in liquid form or via pipeline. The construction of a
subsea pipeline to Greece is a possibility, but would also be very costly because of the
technical difficulties involved. The proposed East Med gas pipeline would link Israel and
Cyprus to Greece and Italy, but is an option that does not appear to be viable.
Local objections and disputes may jeopardize the construction of gas facilities in the region,
as was the case with the Dor Beach natural gas entry point, the construction of which was
cancelled. Currently, Cyprus neither produces nor consumes any natural gas. Petroleum
products cover 98% of the country’s total primary energy demand. The gasification of the
Cypriot economy is a key priority of the government, which hopes that its newly found
natural gas resources will suffice to cover domestic demand and reduce its dependence on
imported petroleum products. Nonetheless, the current debt crisis could undermine
demand and threaten the viability of the planned infrastructure projects. As far as the
proposed LNG liquefaction facility of Vassilikos is concerned, where gas from Cypriot and
Israeli gas fields would be brought for liquefaction, it is far from certain to materialize,
unless additional reserves are discovered in the exclusive economic zone of Cyprus.
17 Cyprus, Israel, Jordan, Lebanon, Syria and the Palestinian Territories.
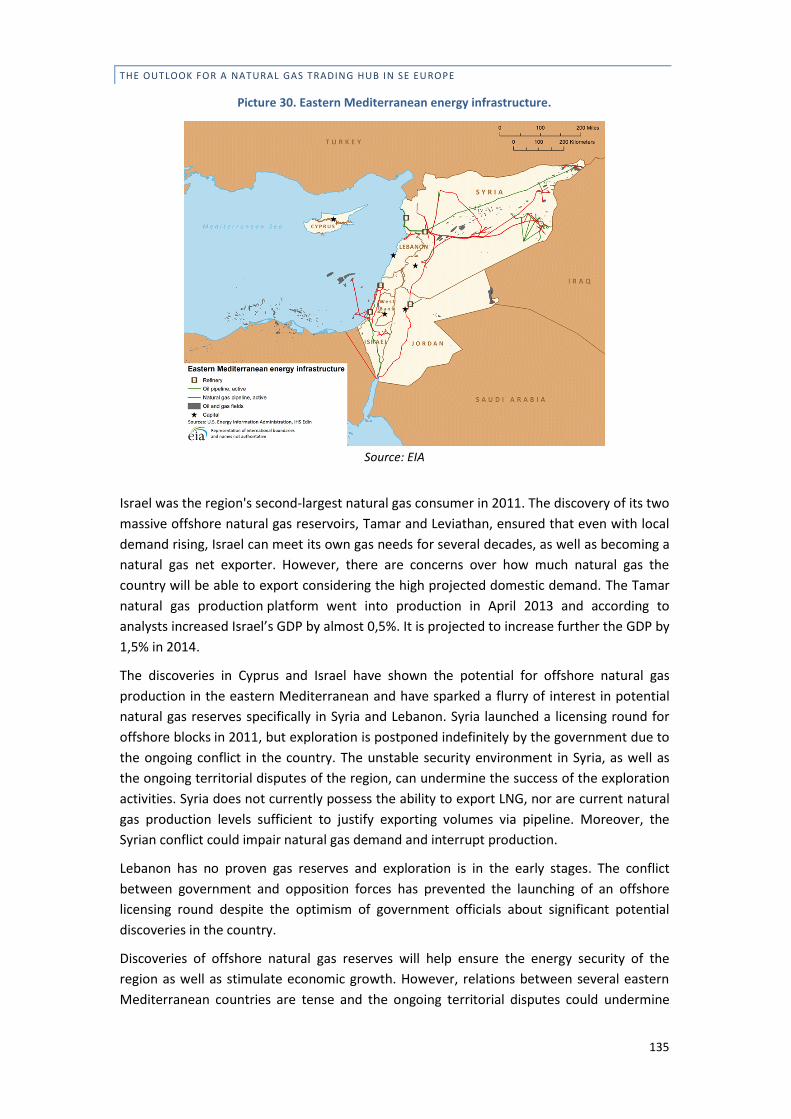
THE OUTLOOK FOR A NATURAL GAS TRADING HUB IN SE EUROPE
135
Picture 30. Eastern Mediterranean energy infrastructure.
Source: EIA
Israel was the region's second-largest natural gas consumer in 2011. The discovery of its two
massive offshore natural gas reservoirs, Tamar and Leviathan, ensured that even with local
demand rising, Israel can meet its own gas needs for several decades, as well as becoming a
natural gas net exporter. However, there are concerns over how much natural gas the
country will be able to export considering the high projected domestic demand. The Tamar
natural gas production platform went into production in April 2013 and according to
analysts increased Israel’s GDP by almost 0,5%. It is projected to increase further the GDP by
1,5% in 2014.
The discoveries in Cyprus and Israel have shown the potential for offshore natural gas
production in the eastern Mediterranean and have sparked a flurry of interest in potential
natural gas reserves specifically in Syria and Lebanon. Syria launched a licensing round for
offshore blocks in 2011, but exploration is postponed indefinitely by the government due to
the ongoing conflict in the country. The unstable security environment in Syria, as well as
the ongoing territorial disputes of the region, can undermine the success of the exploration
activities. Syria does not currently possess the ability to export LNG, nor are current natural
gas production levels sufficient to justify exporting volumes via pipeline. Moreover, the
Syrian conflict could impair natural gas demand and interrupt production.
Lebanon has no proven gas reserves and exploration is in the early stages. The conflict
between government and opposition forces has prevented the launching of an offshore
licensing round despite the optimism of government officials about significant potential
discoveries in the country.
Discoveries of offshore natural gas reserves will help ensure the energy security of the
region as well as stimulate economic growth. However, relations between several eastern
Mediterranean countries are tense and the ongoing territorial disputes could undermine
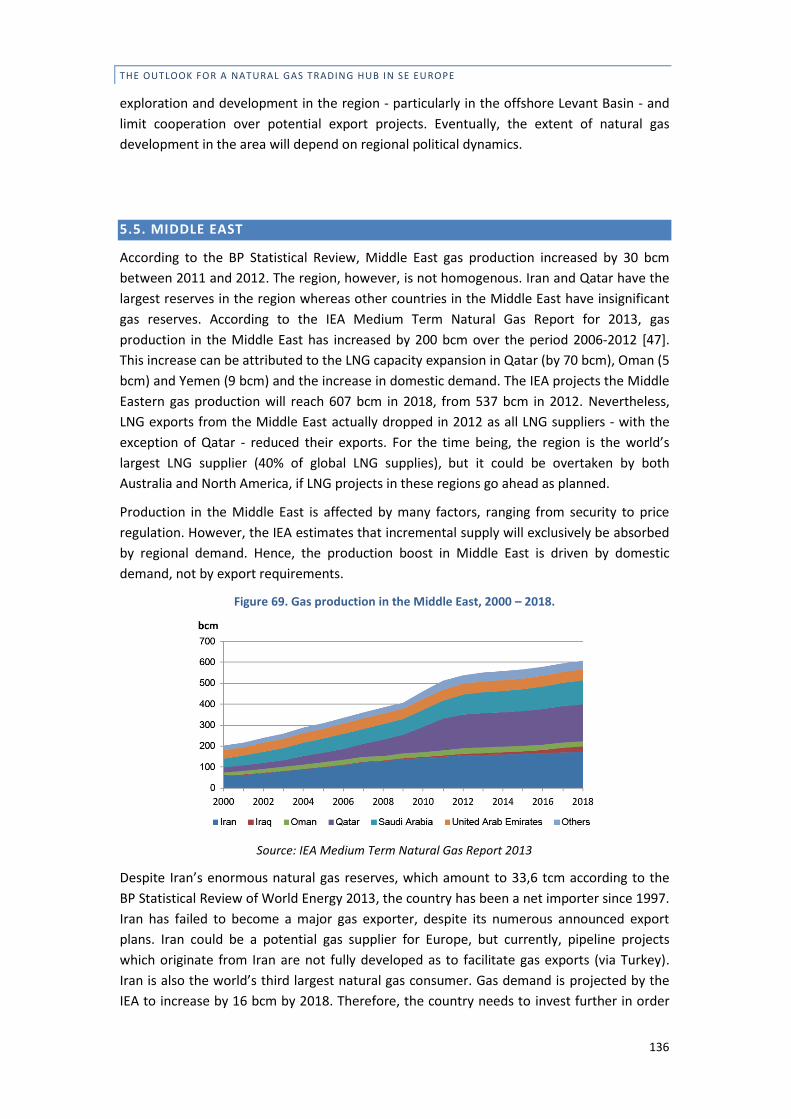
THE OUTLOOK FOR A NATURAL GAS TRADING HUB IN SE EUROPE
136
exploration and development in the region - particularly in the offshore Levant Basin - and
limit cooperation over potential export projects. Eventually, the extent of natural gas
development in the area will depend on regional political dynamics.
5.5. MIDDLE EAST
According to the BP Statistical Review, Middle East gas production increased by 30 bcm
between 2011 and 2012. The region, however, is not homogenous. Iran and Qatar have the
largest reserves in the region whereas other countries in the Middle East have insignificant
gas reserves. According to the IEA Medium Term Natural Gas Report for 2013, gas
production in the Middle East has increased by 200 bcm over the period 2006-2012 [47].
This increase can be attributed to the LNG capacity expansion in Qatar (by 70 bcm), Oman (5
bcm) and Yemen (9 bcm) and the increase in domestic demand. The IEA projects the Middle
Eastern gas production will reach 607 bcm in 2018, from 537 bcm in 2012. Nevertheless,
LNG exports from the Middle East actually dropped in 2012 as all LNG suppliers - with the
exception of Qatar - reduced their exports. For the time being, the region is the world’s
largest LNG supplier (40% of global LNG supplies), but it could be overtaken by both
Australia and North America, if LNG projects in these regions go ahead as planned.
Production in the Middle East is affected by many factors, ranging from security to price
regulation. However, the IEA estimates that incremental supply will exclusively be absorbed
by regional demand. Hence, the production boost in Middle East is driven by domestic
demand, not by export requirements.
Figure 69. Gas production in the Middle East, 2000 – 2018.
Source: IEA Medium Term Natural Gas Report 2013
Despite Iran’s enormous natural gas reserves, which amount to 33,6 tcm according to the
BP Statistical Review of World Energy 2013, the country has been a net importer since 1997.
Iran has failed to become a major gas exporter, despite its numerous announced export
plans. Iran could be a potential gas supplier for Europe, but currently, pipeline projects
which originate from Iran are not fully developed as to facilitate gas exports (via Turkey).
Iran is also the world’s third largest natural gas consumer. Gas demand is projected by the
IEA to increase by 16 bcm by 2018. Therefore, the country needs to invest further in order
THE OUTLOOK FOR A NATURAL GAS TRADING HUB IN SE EUROPE
137
to create an export capacity which can ensure that the increase in natural gas production
will be at a faster rate than the rise in the local demand [48].
In July 2011, Iran, Iraq and Syria signed a Memorandum of Understanding for the
construction of a gas pipeline project that would transit gas from Iran’s South Pars field to
Greece and elsewhere in Europe, via Iraq, Syria and Lebanon, with a possible transit capacity
of 110 mcm of natural gas per day. The implementation of the project has ceased, due to
the conflict and lack of security in Syria. However, Deputy Oil Minister for International
Affairs of Iran, Ali Majedi, stated on May 5 this year that if the situation in Syria returns to
normal, the project will materialize.
As far as Qatar is concerned, six LNG mega-trains and the Pearl GTL project were completed
over the past few years adding 80 bcm to production capacity in total. Qatar was the world's
fourth largest dry natural gas producer in 2012 (behind the United States, Russia, and Iran),
having also risen as the world’ leading LNG supplier [49]. As far as the Barzan offshore
project is concerned, Qatar’s RasGas Company announced that four offshore platform
topside modules have been successfully installed, which marks more than 80% completion
of the project's offshore and onshore construction. The project’s output is estimated at 14
bcm annually, but it will be used to cover the domestic needs of the power sector and the
industry.
Saudi Arabia’s natural gas production remains limited, although it has significant untapped
natural gas potential, as its gas reserves amounted in 8,2 tcm at the end of 2012 [42]. Saudi
Aramco has accelerated its gas development programme in the Persian Gulf, with major gas
development projects under way. The Al Wasit Gas Program alone is estimated to increase
Saudi Arabia's gas production capacity by 21%, while production from the Wasit and Karan
gas fields together are expected to increase Saudi Aramco's gas output by 40%.
5.6. A POTENTIAL EU SHALE GAS INDRUSTRY
According to an assessment of technically recoverable shale oil and gas resources
performed by the U.S. Energy Information Administration, Europe’s technically recoverable
shale gas resources – including Ukraine - were estimated at 624 tcf. However, in 2013 the
US EIA revised its assessment of Europe’s shale gas resources, with the new estimate being
883 tcf [50]. The countries with the biggest estimated reserves in Europe are Russia (285
tcf), Poland (148 tcf), France (137 tcf) and Ukraine (128 tcf). Europe's shale gas production is
still zero as there has not been enough shale gas exploration and it is not certain that the US
experience can be implemented in Europe, since the petro-physical properties of shale gas
differ from one rock formation to another [51].
The most common method of shale gas extraction is hydraulic fracturing i.e. the injection of
high-pressure streams of water into rock formations, creating fissures through which
trapped gas can be collected. Nevertheless, the potential risk of groundwater pollution and
earthquakes attributed to this approach led the constitutional court of France to ban
THE OUTLOOK FOR A NATURAL GAS TRADING HUB IN SE EUROPE
138
hydraulic fracturing. Bulgaria was the second country after France, to ban this method. On
the other hand, Ukraine has signed a $10 billion shale gas production-sharing agreement
with U.S. Chevron to develop the Olesska block in Western Ukraine, as well as with Royal
Dutch Shell, in order to develop its Yuzivska field in East Ukraine. Poland had hoped to begin
shale gas production by 2015, but the American technology used to extract shale gas did not
prove successful in Poland, as 30 to 40 wells were planned for 2013, but only one well could
produce enough gas to be economically viable.
Shale gas remains a controversial issue for Europe. Further exploration is needed to define
whether shale gas exploitation is economically feasible in the continent. Indeed, the
majority of industry observers estimate that shale gas production in Europe could not reach
commercial levels for at least another 10 years [51].
THE OUTLOOK FOR A NATURAL GAS TRADING HUB IN SE EUROPE
139
6. SE EUROPE AS A GAS TRANSIT
REGION
6.1. THE RISING SE EUROPEAN GAS MARKET
Europe sees an important opportunity to meet its energy needs by developing the Southern
gas corridor, at the core of which are gas supplies from the Caspian area (including
Azerbaijan and most likely in the far future from Turkmenistan, Kazakhstan and Iran) and
possibly from the Middle East (Iraq). According to the current state of play in South Eastern
Europe, forecasts predict that the demand will grow up to 2025 at a rate of 1% each year.
Six of the SE European countries (Greece, Croatia, Bulgaria, Romania, Turkey and Serbia)
already use natural gas, having well established markets, with supplies coming primarily
through imports from Russia and, in the case of Turkey, from Iran and Azerbaijan also.
Greece and Turkey, which have well developed LNG import and storage terminals, also
import from Algeria, Nigeria, Qatar and other LNG spot markets. Two countries have a
significant proportion of their demand met from domestic supplies (Croatia, Romania) and
three others cover small percentage shares from domestic gas (Bulgaria, Serbia, Turkey). In
projecting future demand for gas in the region, one of the main issues is the extent to which
availability of gas would make possible the displacement of other fuels in various categories
of demand, such as power generation and residential, commercial and industrial
applications. Relative prices and competing fuels lie at the heart of analysis, although
potential growth in demand for gas will also be driven by other factors, including
environmental aspects and national policies.
It is generally assumed that the natural gas sector will grow faster in the SE European region
mainly because the main driver for gas consumption growth is power generation which is
emerging as one of the faster developing sectors of the broader SE European Energy
market. While each single SEE gas market is relatively small, a regional approach provides a
sound basis for development. Romania is the biggest gas producer of the region with 10,9
bcm annual production (2012), while the consumption of the SE region (excluding Turkey) is
around 26,6 bcm (2012). The three most gas dependent countries of the SE European region
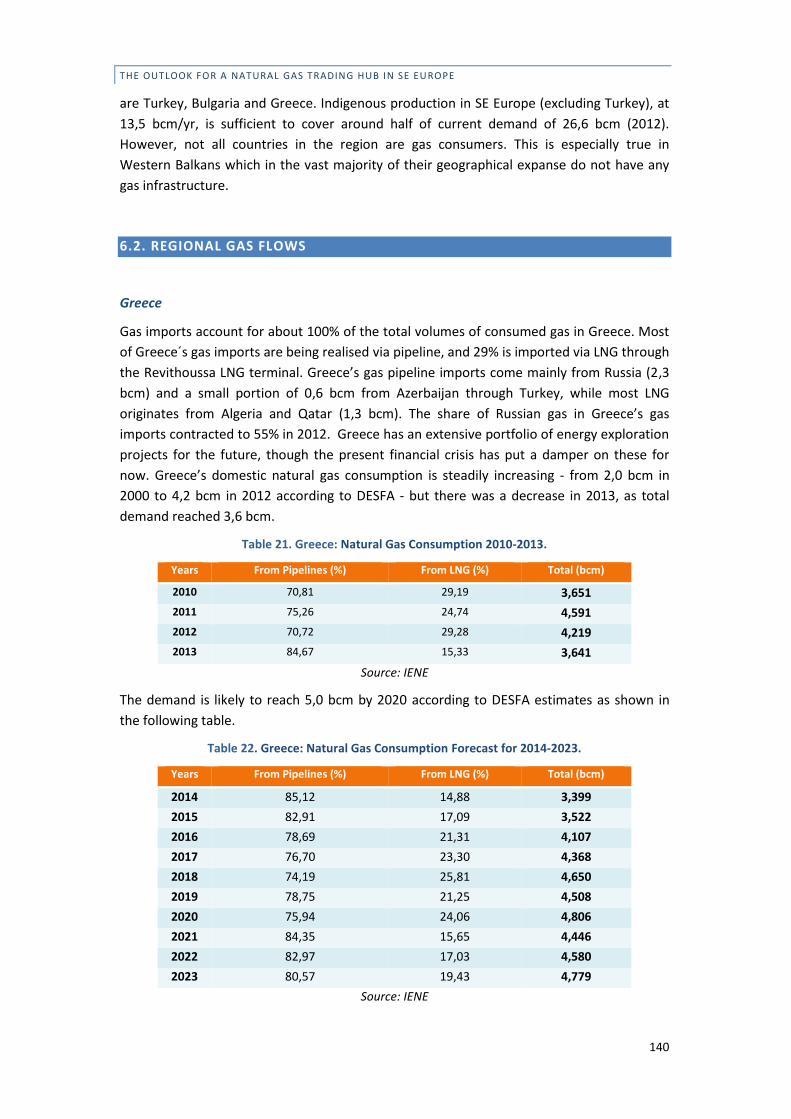
THE OUTLOOK FOR A NATURAL GAS TRADING HUB IN SE EUROPE
140
are Turkey, Bulgaria and Greece. Indigenous production in SE Europe (excluding Turkey), at
13,5 bcm/yr, is sufficient to cover around half of current demand of 26,6 bcm (2012).
However, not all countries in the region are gas consumers. This is especially true in
Western Balkans which in the vast majority of their geographical expanse do not have any
gas infrastructure.
6.2. REGIONAL GAS FLOWS
Greece
Gas imports account for about 100% of the total volumes of consumed gas in Greece. Most
of Greece´s gas imports are being realised via pipeline, and 29% is imported via LNG through
the Revithoussa LNG terminal. Greece’s gas pipeline imports come mainly from Russia (2,3
bcm) and a small portion of 0,6 bcm from Azerbaijan through Turkey, while most LNG
originates from Algeria and Qatar (1,3 bcm). The share of Russian gas in Greece’s gas
imports contracted to 55% in 2012. Greece has an extensive portfolio of energy exploration
projects for the future, though the present financial crisis has put a damper on these for
now. Greece’s domestic natural gas consumption is steadily increasing - from 2,0 bcm in
2000 to 4,2 bcm in 2012 according to DESFA - but there was a decrease in 2013, as total
demand reached 3,6 bcm.
Table 21. Greece: Natural Gas Consumption 2010-2013.
Years From Pipelines (%) From LNG (%) Total (bcm)
2010 70,81 29,19 3,651
2011 75,26 24,74 4,591
2012 70,72 29,28 4,219
2013 84,67 15,33 3,641
Source: IENE
The demand is likely to reach 5,0 bcm by 2020 according to DESFA estimates as shown in
the following table.
Table 22. Greece: Natural Gas Consumption Forecast for 2014-2023.
Years From Pipelines (%) From LNG (%) Total (bcm)
2014 85,12 14,88 3,399
2015 82,91 17,09 3,522
2016 78,69 21,31 4,107
2017 76,70 23,30 4,368
2018 74,19 25,81 4,650
2019 78,75 21,25 4,508
2020 75,94 24,06 4,806
2021 84,35 15,65 4,446
2022 82,97 17,03 4,580
2023 80,57 19,43 4,779
Source: IENE
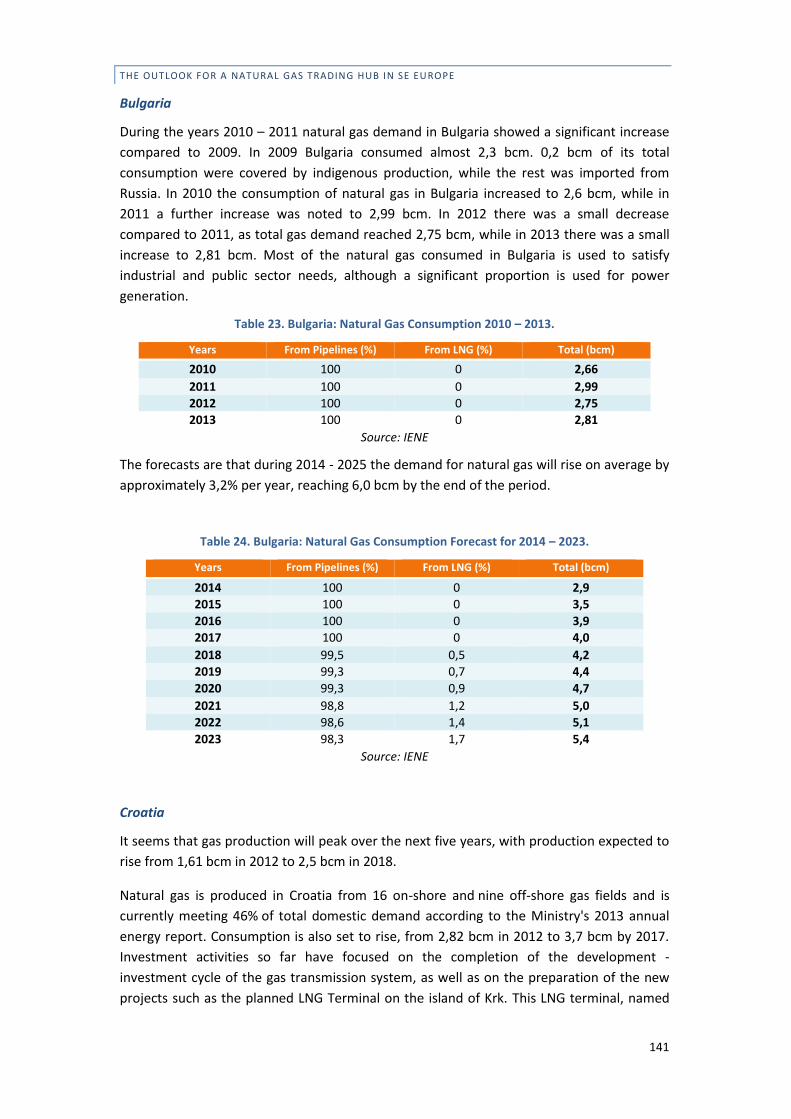
THE OUTLOOK FOR A NATURAL GAS TRADING HUB IN SE EUROPE
141
Bulgaria
During the years 2010 – 2011 natural gas demand in Bulgaria showed a significant increase
compared to 2009. In 2009 Bulgaria consumed almost 2,3 bcm. 0,2 bcm of its total
consumption were covered by indigenous production, while the rest was imported from
Russia. In 2010 the consumption of natural gas in Bulgaria increased to 2,6 bcm, while in
2011 a further increase was noted to 2,99 bcm. In 2012 there was a small decrease
compared to 2011, as total gas demand reached 2,75 bcm, while in 2013 there was a small
increase to 2,81 bcm. Most of the natural gas consumed in Bulgaria is used to satisfy
industrial and public sector needs, although a significant proportion is used for power
generation.
Table 23. Bulgaria: Natural Gas Consumption 2010 – 2013.
Years From Pipelines (%) From LNG (%) Total (bcm)
2010 100 0 2,66
2011 100 0 2,99
2012 100 0 2,75
2013 100 0 2,81
Source: IENE
The forecasts are that during 2014 - 2025 the demand for natural gas will rise on average by
approximately 3,2% per year, reaching 6,0 bcm by the end of the period.
Table 24. Bulgaria: Natural Gas Consumption Forecast for 2014 – 2023.
Years From Pipelines (%) From LNG (%) Total (bcm)
2014 100 0 2,9
2015 100 0 3,5
2016 100 0 3,9
2017 100 0 4,0
2018 99,5 0,5 4,2
2019 99,3 0,7 4,4
2020 99,3 0,9 4,7
2021 98,8 1,2 5,0
2022 98,6 1,4 5,1
2023 98,3 1,7 5,4
Source: IENE
Croatia
It seems that gas production will peak over the next five years, with production expected to
rise from 1,61 bcm in 2012 to 2,5 bcm in 2018.
Natural gas is produced in Croatia from 16 on-shore and nine off-shore gas fields and is
currently meeting 46% of total domestic demand according to the Ministry's 2013 annual
energy report. Consumption is also set to rise, from 2,82 bcm in 2012 to 3,7 bcm by 2017.
Investment activities so far have focused on the completion of the development -
investment cycle of the gas transmission system, as well as on the preparation of the new
projects such as the planned LNG Terminal on the island of Krk. This LNG terminal, named
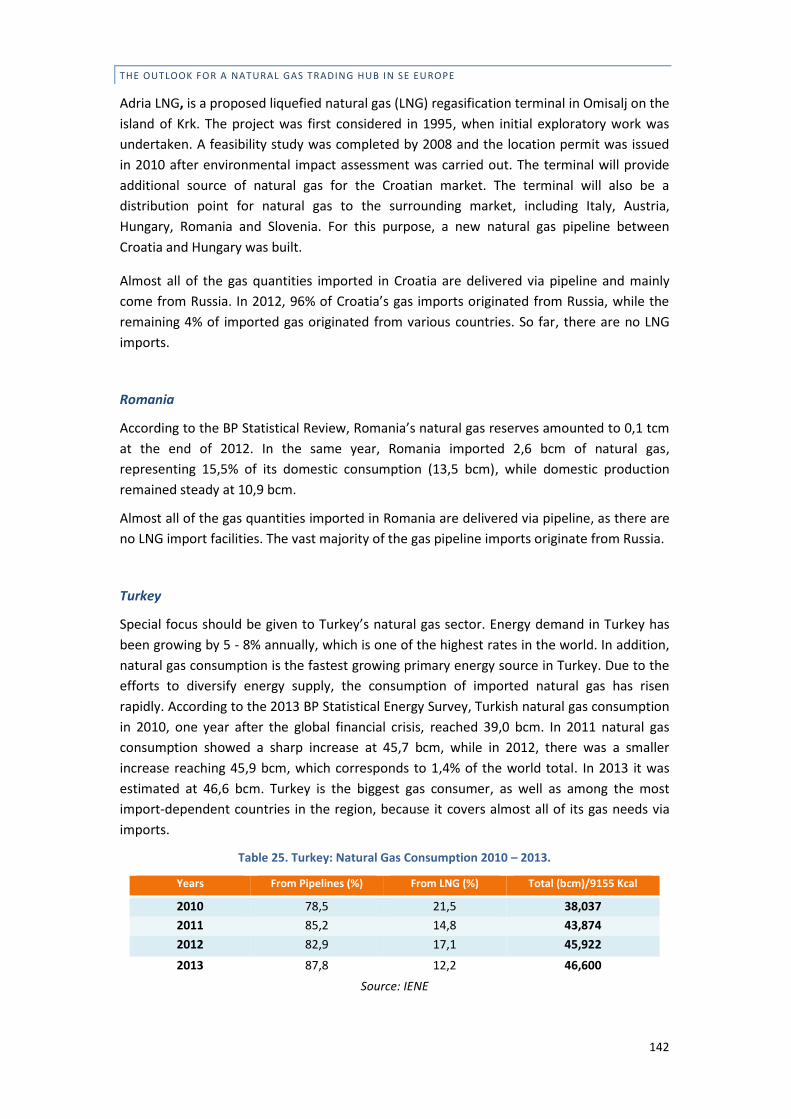
THE OUTLOOK FOR A NATURAL GAS TRADING HUB IN SE EUROPE
142
Adria LNG, is a proposed liquefied natural gas (LNG) regasification terminal in Omisalj on the
island of Krk. The project was first considered in 1995, when initial exploratory work was
undertaken. A feasibility study was completed by 2008 and the location permit was issued
in 2010 after environmental impact assessment was carried out. The terminal will provide
additional source of natural gas for the Croatian market. The terminal will also be a
distribution point for natural gas to the surrounding market, including Italy, Austria,
Hungary, Romania and Slovenia. For this purpose, a new natural gas pipeline between
Croatia and Hungary was built.
Almost all of the gas quantities imported in Croatia are delivered via pipeline and mainly
come from Russia. In 2012, 96% of Croatia’s gas imports originated from Russia, while the
remaining 4% of imported gas originated from various countries. So far, there are no LNG
imports.
Romania
According to the BP Statistical Review, Romania’s natural gas reserves amounted to 0,1 tcm
at the end of 2012. In the same year, Romania imported 2,6 bcm of natural gas,
representing 15,5% of its domestic consumption (13,5 bcm), while domestic production
remained steady at 10,9 bcm.
Almost all of the gas quantities imported in Romania are delivered via pipeline, as there are
no LNG import facilities. The vast majority of the gas pipeline imports originate from Russia.
Turkey
Special focus should be given to Turkey’s natural gas sector. Energy demand in Turkey has
been growing by 5 - 8% annually, which is one of the highest rates in the world. In addition,
natural gas consumption is the fastest growing primary energy source in Turkey. Due to the
efforts to diversify energy supply, the consumption of imported natural gas has risen
rapidly. According to the 2013 BP Statistical Energy Survey, Turkish natural gas consumption
in 2010, one year after the global financial crisis, reached 39,0 bcm. In 2011 natural gas
consumption showed a sharp increase at 45,7 bcm, while in 2012, there was a smaller
increase reaching 45,9 bcm, which corresponds to 1,4% of the world total. In 2013 it was
estimated at 46,6 bcm. Turkey is the biggest gas consumer, as well as among the most
import-dependent countries in the region, because it covers almost all of its gas needs via
imports.
Table 25. Turkey: Natural Gas Consumption 2010 – 2013.
Years From Pipelines (%) From LNG (%) Total (bcm)/9155 Kcal
2010 78,5 21,5 38,037
2011 85,2 14,8 43,874
2012 82,9 17,1 45,922
2013 87,8 12,2 46,600
Source: IENE
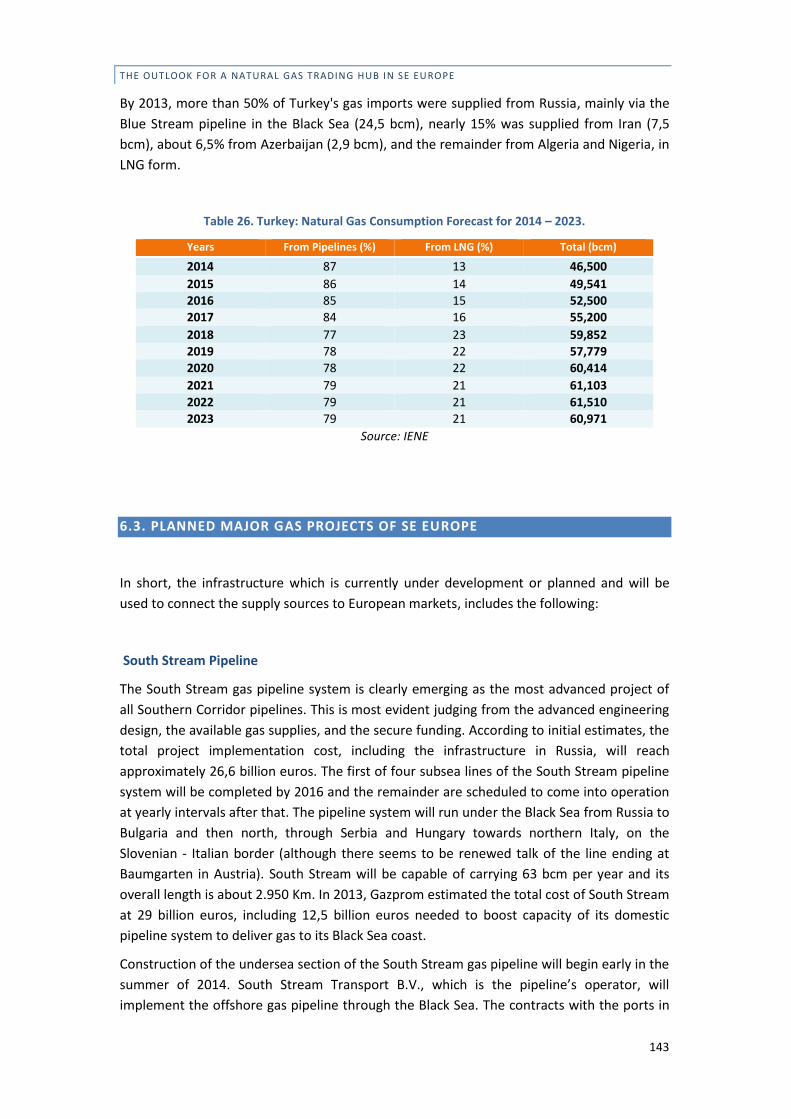
THE OUTLOOK FOR A NATURAL GAS TRADING HUB IN SE EUROPE
143
By 2013, more than 50% of Turkey's gas imports were supplied from Russia, mainly via the
Blue Stream pipeline in the Black Sea (24,5 bcm), nearly 15% was supplied from Iran (7,5
bcm), about 6,5% from Azerbaijan (2,9 bcm), and the remainder from Algeria and Nigeria, in
LNG form.
Table 26. Turkey: Natural Gas Consumption Forecast for 2014 – 2023.
Years From Pipelines (%) From LNG (%) Total (bcm)
2014 87 13 46,500
2015 86 14 49,541
2016 85 15 52,500
2017 84 16 55,200
2018 77 23 59,852
2019 78 22 57,779
2020 78 22 60,414
2021 79 21 61,103
2022 79 21 61,510
2023 79 21 60,971
Source: IENE
6.3. PLANNED MAJOR GAS PROJECTS OF SE EUROPE
In short, the infrastructure which is currently under development or planned and will be
used to connect the supply sources to European markets, includes the following:
South Stream Pipeline
The South Stream gas pipeline system is clearly emerging as the most advanced project of
all Southern Corridor pipelines. This is most evident judging from the advanced engineering
design, the available gas supplies, and the secure funding. According to initial estimates, the
total project implementation cost, including the infrastructure in Russia, will reach
approximately 26,6 billion euros. The first of four subsea lines of the South Stream pipeline
system will be completed by 2016 and the remainder are scheduled to come into operation
at yearly intervals after that. The pipeline system will run under the Black Sea from Russia to
Bulgaria and then north, through Serbia and Hungary towards northern Italy, on the
Slovenian - Italian border (although there seems to be renewed talk of the line ending at
Baumgarten in Austria). South Stream will be capable of carrying 63 bcm per year and its
overall length is about 2.950 Km. In 2013, Gazprom estimated the total cost of South Stream
at 29 billion euros, including 12,5 billion euros needed to boost capacity of its domestic
pipeline system to deliver gas to its Black Sea coast.
Construction of the undersea section of the South Stream gas pipeline will begin early in the
summer of 2014. South Stream Transport B.V., which is the pipeline’s operator, will
implement the offshore gas pipeline through the Black Sea. The contracts with the ports in
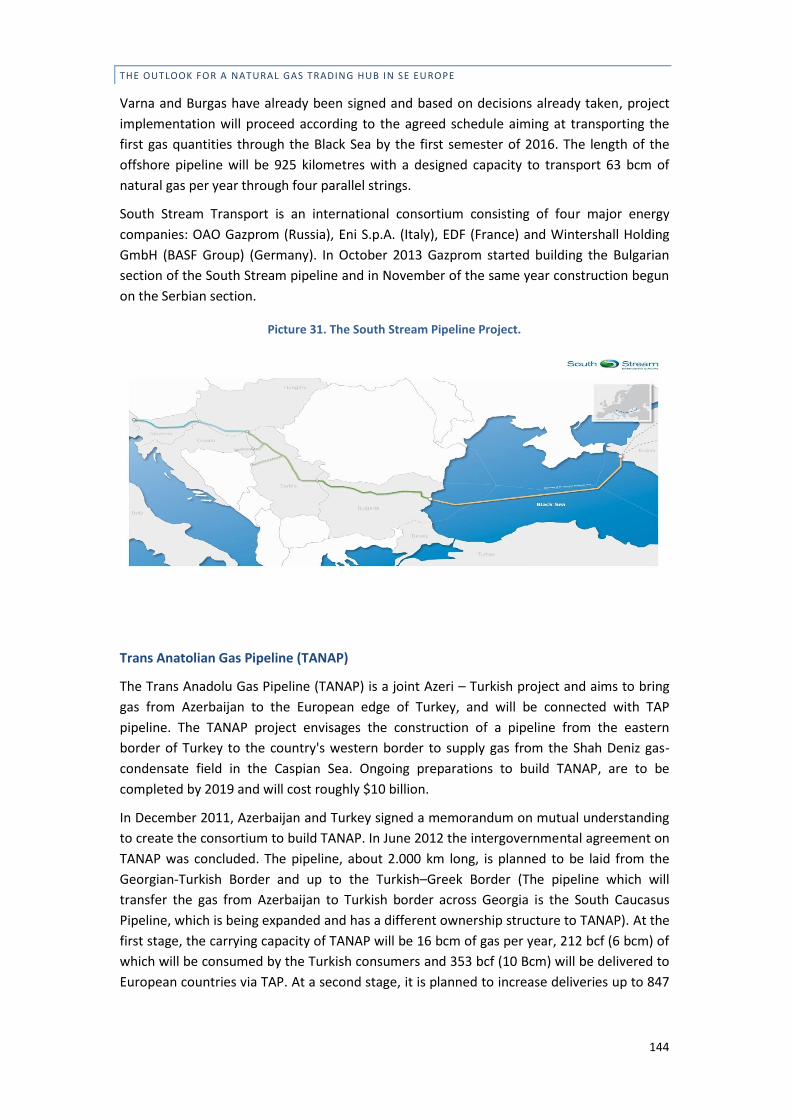
THE OUTLOOK FOR A NATURAL GAS TRADING HUB IN SE EUROPE
144
Varna and Burgas have already been signed and based on decisions already taken, project
implementation will proceed according to the agreed schedule aiming at transporting the
first gas quantities through the Black Sea by the first semester of 2016. The length of the
offshore pipeline will be 925 kilometres with a designed capacity to transport 63 bcm of
natural gas per year through four parallel strings.
South Stream Transport is an international consortium consisting of four major energy
companies: OAO Gazprom (Russia), Eni S.p.A. (Italy), EDF (France) and Wintershall Holding
GmbH (BASF Group) (Germany). In October 2013 Gazprom started building the Bulgarian
section of the South Stream pipeline and in November of the same year construction begun
on the Serbian section.
Picture 31. The South Stream Pipeline Project.
Trans Anatolian Gas Pipeline (TANAP)
The Trans Anadolu Gas Pipeline (TANAP) is a joint Azeri – Turkish project and aims to bring
gas from Azerbaijan to the European edge of Turkey, and will be connected with TAP
pipeline. The TANAP project envisages the construction of a pipeline from the eastern
border of Turkey to the country's western border to supply gas from the Shah Deniz gas-
condensate field in the Caspian Sea. Ongoing preparations to build TANAP, are to be
completed by 2019 and will cost roughly $10 billion.
In December 2011, Azerbaijan and Turkey signed a memorandum on mutual understanding
to create the consortium to build TANAP. In June 2012 the intergovernmental agreement on
TANAP was concluded. The pipeline, about 2.000 km long, is planned to be laid from the
Georgian-Turkish Border and up to the Turkish–Greek Border (The pipeline which will
transfer the gas from Azerbaijan to Turkish border across Georgia is the South Caucasus
Pipeline, which is being expanded and has a different ownership structure to TANAP). At the
first stage, the carrying capacity of TANAP will be 16 bcm of gas per year, 212 bcf (6 bcm) of
which will be consumed by the Turkish consumers and 353 bcf (10 Bcm) will be delivered to
European countries via TAP. At a second stage, it is planned to increase deliveries up to 847

THE OUTLOOK FOR A NATURAL GAS TRADING HUB IN SE EUROPE
145
bcf (24 bcm). The gas pipeline is planned to be put into operation in 2019 and will be
devoted from the beginning to gas produced from the Shah-Deniz Phase-2 field.
Trans Adriatic Pipeline (TAP)
TAP has been selected by the Shah Deniz consortium, instead of the northern route
(Nabucco West) to carry gas into Europe from Turkey's western border. The Trans Adriatic
Pipeline (TAP) will connect existing and planned grids for natural gas transport in Southeast
Europe with gas systems in Western Europe via Greece, Albania, the Adriatic Sea and Italy.
The pipeline will therefore give Europe better access to the major reserves of natural gas
located mainly in the Caspian region. The pipeline is designed with an initial 10 bcm/yr
transport capacity and will be 48 – inches in diameter. It will have a combined length of 682
km onshore and 105 km offshore. It is estimated that the construction of the pipeline will
cost about 5,3 billion dollars. In February 13, 2013, the governments of Greece, Italy and
Albania confirmed their full support and commitment to the Trans Adriatic Pipeline (TAP)
project by signing in Athens a tri-lateral intergovernmental agreement (IGA).
The natural gas reverse flow feature of TAP is an EU requirement set out in Regulation (EU)
No. 994/2010 concerning measures to safeguard security of gas supply. It will also enable
the region to connect to new gas sources, such as those in Northern Africa as well as to
other more diverse sources, such as the partially liquid gas market in Italy. TAP is the only
gas project, after the exclusion of ITGI by the Shah Deniz II consortium and the Russian
refusal, to supply Greece and Albania with gas quantities via a southern branch of South
Stream, destined to bring new gas supplies to the region. In a second stage there are plans
for pipeline extension to West Balkan countries (Montenegro, Bosnia and Croatia) via the
IAP pipeline. TAP as a Project of Common Interest has the support of European Union.
On May 17, 2013, the relevant regulatory authorities in Italy, Greece and Albania, the
European Commission formally approved the Trans Adriatic Pipeline’s (TAP) application for
Third Party Access (TPA) exemption for the initial capacity of 10bcm/yr. The decision means
that TAP can offer capacity for export of gas volumes from Azerbaijan to Europe for a period
of 25 years. In addition, the Commission has approved exemptions from regulated tariffs on
both TAP’s initial and expansion capacity, as well as exemption from ownership unbundling
for 25 years. Therefore, it must be noted that there is no exception for TAP’s reverse flow
capacity from Italy to Greece.
European Union internal market regulations typically require third party access to all energy
infrastructure, including gas pipelines. However, national regulators can grant exemptions
to this rule for a limited period of time, in order to facilitate major infrastructure projects
such as international pipelines. Provided that all conditions have been met, the European
Union then corroborates the decision, offering an exemption from certain provisions in the
regulatory framework.
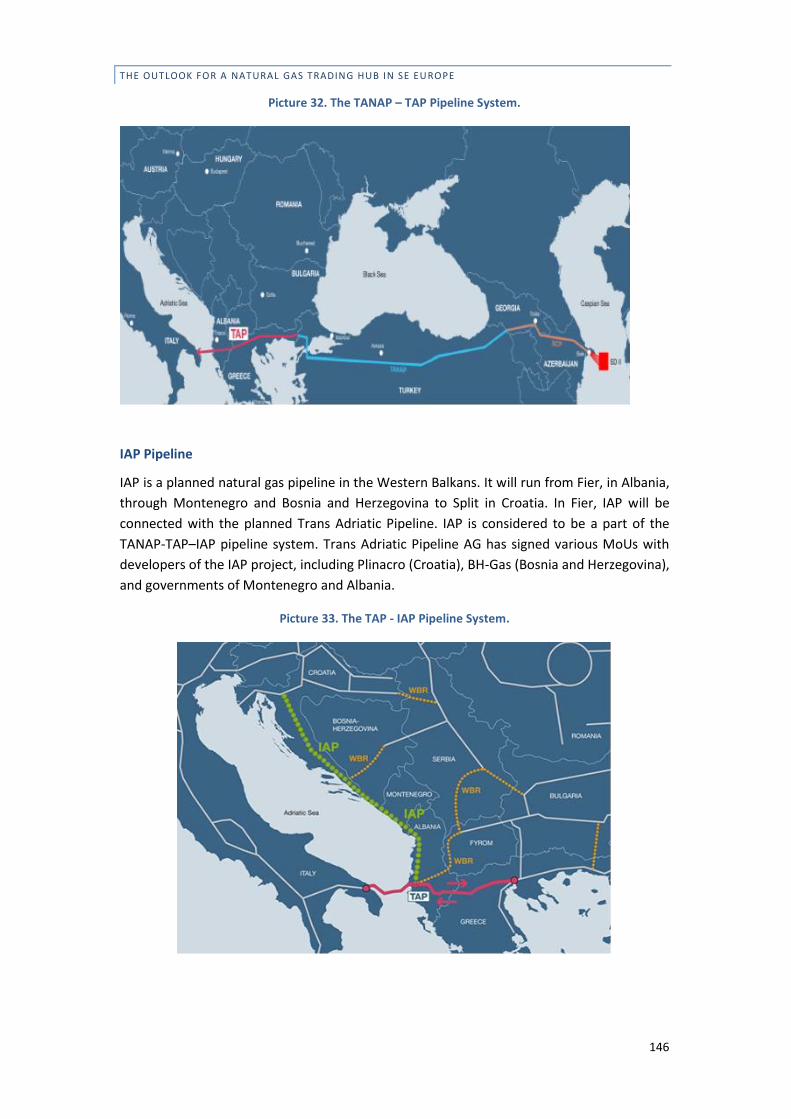
THE OUTLOOK FOR A NATURAL GAS TRADING HUB IN SE EUROPE
146
Picture 32. The TANAP – TAP Pipeline System.
IAP Pipeline
IAP is a planned natural gas pipeline in the Western Balkans. It will run from Fier, in Albania,
through Montenegro and Bosnia and Herzegovina to Split in Croatia. In Fier, IAP will be
connected with the planned Trans Adriatic Pipeline. IAP is considered to be a part of the
TANAP-TAP–IAP pipeline system. Trans Adriatic Pipeline AG has signed various MoUs with
developers of the IAP project, including Plinacro (Croatia), BH-Gas (Bosnia and Herzegovina),
and governments of Montenegro and Albania.
Picture 33. The TAP - IAP Pipeline System.
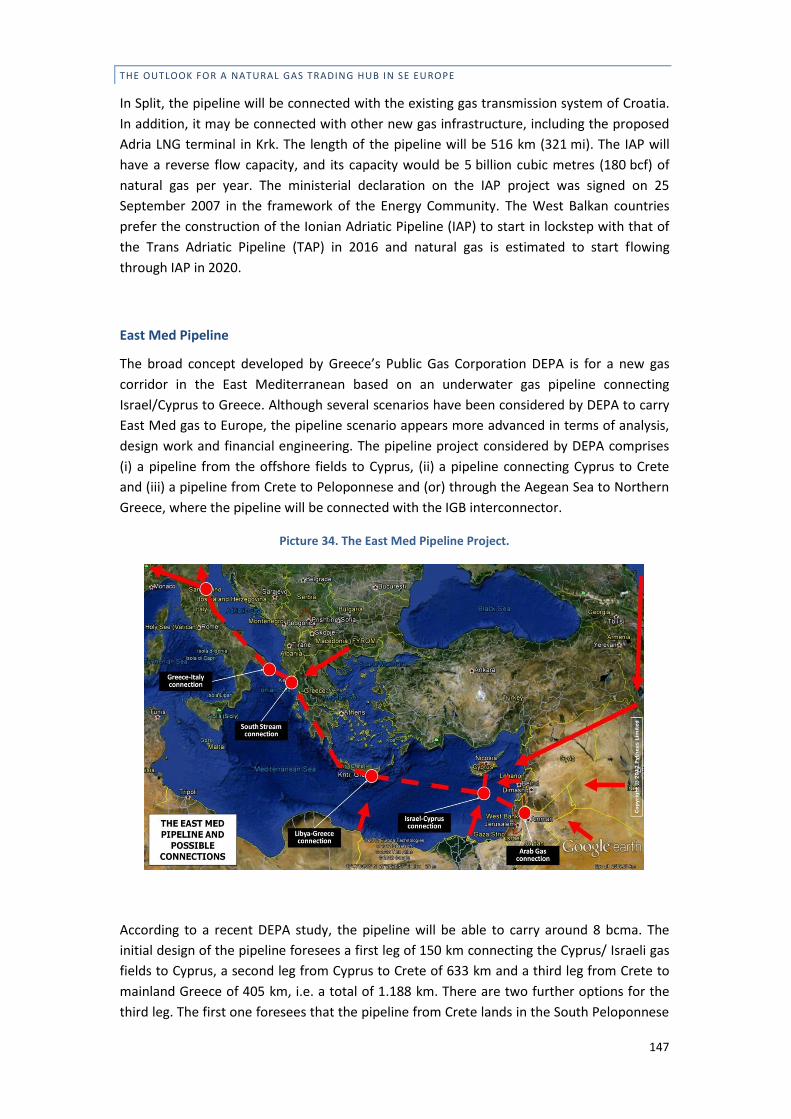
THE OUTLOOK FOR A NATURAL GAS TRADING HUB IN SE EUROPE
147
In Split, the pipeline will be connected with the existing gas transmission system of Croatia.
In addition, it may be connected with other new gas infrastructure, including the proposed
Adria LNG terminal in Krk. The length of the pipeline will be 516 km (321 mi). The IAP will
have a reverse flow capacity, and its capacity would be 5 billion cubic metres (180 bcf) of
natural gas per year. The ministerial declaration on the IAP project was signed on 25
September 2007 in the framework of the Energy Community. The West Balkan countries
prefer the construction of the Ionian Adriatic Pipeline (IAP) to start in lockstep with that of
the Trans Adriatic Pipeline (TAP) in 2016 and natural gas is estimated to start flowing
through IAP in 2020.
East Med Pipeline
The broad concept developed by Greece’s Public Gas Corporation DEPA is for a new gas
corridor in the East Mediterranean based on an underwater gas pipeline connecting
Israel/Cyprus to Greece. Although several scenarios have been considered by DEPA to carry
East Med gas to Europe, the pipeline scenario appears more advanced in terms of analysis,
design work and financial engineering. The pipeline project considered by DEPA comprises
(i) a pipeline from the offshore fields to Cyprus, (ii) a pipeline connecting Cyprus to Crete
and (iii) a pipeline from Crete to Peloponnese and (or) through the Aegean Sea to Northern
Greece, where the pipeline will be connected with the IGB interconnector.
Picture 34. The East Med Pipeline Project.
According to a recent DEPA study, the pipeline will be able to carry around 8 bcma. The
initial design of the pipeline foresees a first leg of 150 km connecting the Cyprus/ Israeli gas
fields to Cyprus, a second leg from Cyprus to Crete of 633 km and a third leg from Crete to
mainland Greece of 405 km, i.e. a total of 1.188 km. There are two further options for the
third leg. The first one foresees that the pipeline from Crete lands in the South Peloponnese
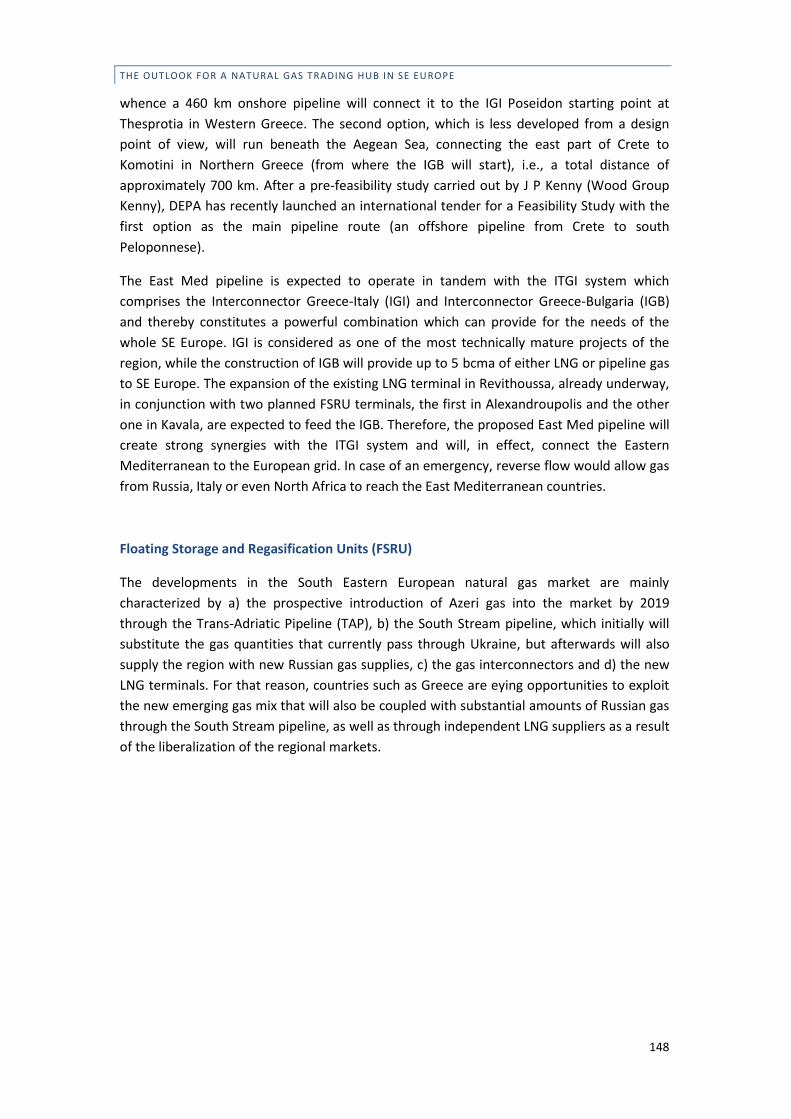
THE OUTLOOK FOR A NATURAL GAS TRADING HUB IN SE EUROPE
148
whence a 460 km onshore pipeline will connect it to the IGI Poseidon starting point at
Thesprotia in Western Greece. The second option, which is less developed from a design
point of view, will run beneath the Aegean Sea, connecting the east part of Crete to
Komotini in Northern Greece (from where the IGB will start), i.e., a total distance of
approximately 700 km. After a pre-feasibility study carried out by J P Kenny (Wood Group
Kenny), DEPA has recently launched an international tender for a Feasibility Study with the
first option as the main pipeline route (an offshore pipeline from Crete to south
Peloponnese).
The East Med pipeline is expected to operate in tandem with the ITGI system which
comprises the Interconnector Greece-Italy (IGI) and Interconnector Greece-Bulgaria (IGB)
and thereby constitutes a powerful combination which can provide for the needs of the
whole SE Europe. IGI is considered as one of the most technically mature projects of the
region, while the construction of IGB will provide up to 5 bcma of either LNG or pipeline gas
to SE Europe. The expansion of the existing LNG terminal in Revithoussa, already underway,
in conjunction with two planned FSRU terminals, the first in Alexandroupolis and the other
one in Kavala, are expected to feed the IGB. Therefore, the proposed East Med pipeline will
create strong synergies with the ITGI system and will, in effect, connect the Eastern
Mediterranean to the European grid. In case of an emergency, reverse flow would allow gas
from Russia, Italy or even North Africa to reach the East Mediterranean countries.
Floating Storage and Regasification Units (FSRU)
The developments in the South Eastern European natural gas market are mainly
characterized by a) the prospective introduction of Azeri gas into the market by 2019
through the Trans-Adriatic Pipeline (TAP), b) the South Stream pipeline, which initially will
substitute the gas quantities that currently pass through Ukraine, but afterwards will also
supply the region with new Russian gas supplies, c) the gas interconnectors and d) the new
LNG terminals. For that reason, countries such as Greece are eying opportunities to exploit
the new emerging gas mix that will also be coupled with substantial amounts of Russian gas
through the South Stream pipeline, as well as through independent LNG suppliers as a result
of the liberalization of the regional markets.
THE OUTLOOK FOR A NATURAL GAS TRADING HUB IN SE EUROPE
149
Picture 35. Alexandroupolis LNG INGS – A new energy gateway to Europe.
More specifically on the LNG sector, apart from projects aiming at either enhancing the
existing infrastructure or establishing new terminals, there are two noteworthy plans in
Greece, regarding the construction of Floating Storage and Regasification Units (FSRU). They
are to be located right beside the route of the TAP project and the Greek–Bulgarian
interconnector IGB and the existing Greek–Turkey (IGT) nearby the Bulgarian and Turkish
markets, in order to be able to link themselves through the planned interconnectors.
Firstly, the private Greek company GASTRADE, who received an Independent Natural Gas
System license in 2011, is developing a 6,1 bcm annual capacity floating LNG storage and
regasification unit offshore Alexandroupolis. The project has been submitted to the Greek
energy regulator in 2010 and has received environmental assessment approval in 2013. The
170.000 m3 offshore storage facility will be linked to the Greek National Natural Gas System
through a 28 km subsea and onshore pipeline. The project location is in proximity with the
TAP route and is around 55 km from the entry point of the planned interconnector Greece-
Bulgaria (IGB). Completion of the permitting process is expected within the third quarter of
2014, whilst commercial operation start up can be seen as early as 2016. The
Alexandroupolis LNG Terminal has been included in the first list of the EC Projects of
Common Interest (PCIs). The budget of this project is estimated at €340 million and will be
able to accommodate imports from various LNG sources through long-term and spot
purchases, including gas from the Eastern Mediterranean fields when it becomes
commercially available, adding thus to the liquidity of the local and regional markets.
Concurrently, the Greek DEPA Company is also laying down its own plans concerning a
separate FSRU unit, a 3 bcm per annum facility near the port of Kavala and in a strategic
location close to the aforementioned pipeline and interconnector. The project aims for a
150.000 cubic meters storage capacity and DEPA already actively seeks international
investor backing for this 400 million-dollar plan. The medium-term business plan of DEPA
calls for an increase in the capacity of the Kavala FSRU to 5 bcm. Success depends mostly on

THE OUTLOOK FOR A NATURAL GAS TRADING HUB IN SE EUROPE
150
DEPA’s ability to attract international investor interest, taking into account the state of
affairs of the Greek economy nowadays that prohibits DEPA from raising such capital by
itself. Moreover, the moves by neighbouring countries are crucial, since a series of similar
projects involving FSRU and underground storage cannot proceed all together, due to
limitations of market dynamics and the rather low potential of the regional markets, as
compared to the rest of the EU.
6.4. GAS INTERCONNECTIONS IN SE EUROPE
In February 2011, the European Council decided that each EU member state should have at
least two sources of gas and electricity by 2014 to avoid repeating the scenario some
member nations encountered following the Russian-Ukrainian gas crisis in January 2009.
The dispute left many countries of the region, such as Bulgaria, without gas for three weeks.
It should be noted that during the crisis between Russia and Ukraine, the Revithoussa LNG
terminal in Greece not only fully covered domestic needs in natural gas, making Greece the
only European country supplied from Russia not facing any problems in covering its
consumption, but also allowed the natural gas supply of Bulgaria for two days.
As a result, Greece, Bulgaria, Romania and Serbia commenced construction of gas
infrastructures and especially gas interconnections, in order to avoid future gas disruptions
and increase their energy security. This network of gas interconnectors will supply the
region with new natural gas quantities coming from the TAP pipeline, the liquefied natural
gas terminal in Revithoussa (currently the only LNG terminal in Greece) and possibly from
one of the planned floating LNG terminals (FSRU) in Northern Greece.
Picture 36. Gas interconnections in SE Europe.
THE OUTLOOK FOR A NATURAL GAS TRADING HUB IN SE EUROPE
151
The Interconnector Bulgaria and Romania (IBR)
Bulgaria commenced construction of a gas interconnection with Romania, on August 2011.
Total project value is approximately €24 million, €9 million of which are EU funds, €11
million are from Bulgaria, and the rest is to be provided by the Romanian Transgaz. The total
length of the pipeline between Giurgiu and Ruse is 25 km with 15,4km in Bulgaria and 2,1
km beneath the Danube. Following a number of technical delays, the Bulgaria-Romania gas
grid interconnection was expected to start functioning in June 2014.
Bulgaria, through the above interconnector, could import gas from Romania which has an
advantage over Bulgaria in terms of natural gas deposits in the Black Sea. The pipeline
between Giurgiu and Ruse will have an annual capacity of between 0,5 and 1,5 bcm of
natural gas, representing half of Bulgaria's consumption. The initial capacity of the
interconnector will be at 0,5 bcm.
Interconnection between Bulgaria and Romania is a project highly supported by Romania as
well. It is particularly important because it can provide short-term flow of gas in a moment
of crisis due to its reverse flow capacity, and in the long term, contribute to security of
supply of both countries.
The gas interconnection pipeline between Bulgaria and Romania is not the only project that
Bulgaria is counting on in order to reduce its energy dependence from Russian gas, allowing
it to avoid gas supply crises, such as it experienced in the winter of 2009. Bulgaria will also
build a connection with the Greek natural gas transmission system through the IGB, while
the Bulgarian Ministry of Economy is working closely with the Turkish Ministry of Energy
and Natural Resources on the Bulgarian-Turkish gas interconnection.
Bulgarian-Turkish gas interconnection (ITB)
The project is likely to receive a grant from the European Union. The interconnector project
with Turkey is described as being "key" to Bulgaria's energy diversification efforts in view of
the fact that the Turkish system has six entry points for natural gas. The 77km-long gas
pipeline (75 km on Bulgarian territory and 2 km on Turkish territory) will carry up to 3 bcm
metres of Caspian natural gas a year initially, the pipe diameter is 28 inches (700 mm) and
the working pressure 75 bar.
The ITB project will provide a supply point not only of Azerbaijan gas, but also for traders
using future gas liquefaction terminals to liquefy gas in Turkey. On March 20, 2012, Bulgaria
and Turkey signed a declaration to accelerate the construction of the gas interconnection
between the two countries. The implementation of this project will provide conditions
necessary for the diversification of sources and routes for Bulgaria. However, the project is
still at an initial planning – conceptual stage.
THE OUTLOOK FOR A NATURAL GAS TRADING HUB IN SE EUROPE
152
Bulgarian-Serbian gas Interconnection (IBS)
Interconnection Sofia-Dimitrovgrad (Serbia)-Nis (Serbia), will connect national transmission
networks of Bulgaria and Serbia. The aim is to ensure diversification of routes, intersystem
connectivity and gas transmission. It is expected that construction of the pipeline will
provide an option for delivery of up to 1,8 bcm/yr of natural gas, in both directions, with the
opportunity to further increase the volumes up to 4,5 bcm/yr. The total length of the route
is 150 km, of which around 50 km are on Bulgarian territory. Possible pipe diameter is 28"
and the working pressure is 55 bar.
On 8 April, 2011, a Memorandum of Understanding between the Government of the
Republic of Bulgaria and the Republic of Serbia was signed in order to create favourable
conditions for connecting the transmission systems of both countries and on 15 April 2011,
a contract was signed between the Ministry of Economy, Energy and Tourism and the
Ministry of Regional Development and Public Works, for the implementation of a project
"Preparation, studies and design for construction of a Gas Interconnection Bulgaria-Serbia".
Anticipated benefits from project realization:
Development of cross-border cooperation between Bulgaria and Serbia.
Implementation of a direct connection for the gas markets of the four member
states - Bulgaria, Romania, Greece and Hungary - to the gas markets of the other
SEE countries;
Diversification of sources of natural gas to Bulgaria and the markets for importers,
increasing access to alternative suppliers and decreasing their dependence on one
source;
Greater flexibility for the operator in balancing the transmission system in the
country and the region, and wider access to regional underground gas storages and
opportunities to further increase natural gas consumption;
Create jobs and support further economic recovery.
Through interconnections with neighbours in gas transport, Bulgaria proves to be the
initiator of many projects of this type, making use of EU grants. The European Commission
has already approved €9 million in financing for the Bulgaria-Romania gas interconnection
and €45 million for the Bulgaria-Greece gas interconnection, as well as another €2,5 million
for a feasibility study for the Bulgaria – Serbia Interconnector. The interconnector will start
functioning not earlier than 2018.
Greece Bulgaria Gas Interconnector (IGB)
The IGB, which will supply Bulgaria and hence, South Eastern Europe region, with up to 5
bcma, will be operational by 2015. The project includes the construction of a trans-border
reverse flow gas pipeline with a length of about 168,5 km (140 km in Bulgaria, 28,5 km in
Greece), connecting the Greek gas network in the area of Komotini with the Bulgarian gas
network in the area of Stara Zagora. The capacity of the gas pipeline is foreseen to be 3 up
to 5 billion m3/yr, with a pipe diameter of 750 mm (32").

THE OUTLOOK FOR A NATURAL GAS TRADING HUB IN SE EUROPE
153
The total indicative value of this project is €200 million. Funding is secured from the
European Energy Recovery Programme and the amount of €45 million has already been
earmarked (Decision C (2010) 5813 of the European Commission on 30.08.2010).
The construction of the Greece-Bulgaria Interconnection Pipeline will help Bulgaria to
achieve real diversification of natural gas supply sources, as it will allow the delivery of
additional natural gas through the Southern Gas Corridor. This interconnector will also help
Bulgaria access LNG gas from Greece, by allowing direct purchases from suppliers. In
addition, the IGB will help develop a more liquid market in the region.
Gas from the above interconnector may originate from:
(a) the 1st phase of Shah Deniz.
(b) LNG terminals, either the existing one in Revithoussa or the planned FSRUs in
Northern Greece (Alexandroupolis, Kavala)
(c) Should, by 2020, TAP pipeline between Greece and Italy be operational, it will be
possible to access Algerian gas through Italy (via reverse flow).
Interconnector Greece-Italy (IGI Poseidon)
IGI Poseidon, the 50/50 Joint Venture between Edison and Greece’s DEPA, submitted a
technical and commercial proposal to transit gas from the Shah Deniz II field in Azerbaijan to
Europe through ITGI transit corridor (Interconnector Turkey-Greece-Italy). IGI Poseidon is
the company responsible for the development and construction of the new pipeline
between Greece and Italy, which will be part of the transit corridor ITGI (Interconnector
Turkey-Greece-Italy).
ITGI project will use existing infrastructures in Turkey and Greece, with a new pipeline to be
built connecting Greece to Italy (IGI pipeline). IGI pipeline has a transport capacity of up to
12 bcm a year and comprises two sections:
IGI Onshore: 600 km onshore pipeline in the Greek territory (to be developed by
Desfa, the Greek Transmission System Operator)
IGI Poseidon: 200 km offshore pipeline across the Ionian Sea (under development by
IGI Poseidon SA, a joint venture between Edison and the Greek company DEPA).
The shareholders of IGI (DEPA and Edison) have decided to continue the development of IGI
Poseidon, based on the maturity of the project and the strong belief that it is a crucial
project for the security of supply of the entire region, even though this project was not
selected by the Shah Deniz consortium. It should be noted that IGI Poseidon remains open
to export natural gas from alternative sources. The EU acknowledged IGI as a Project of
European Interest and included it among its Projects of Common Interest (PCI).
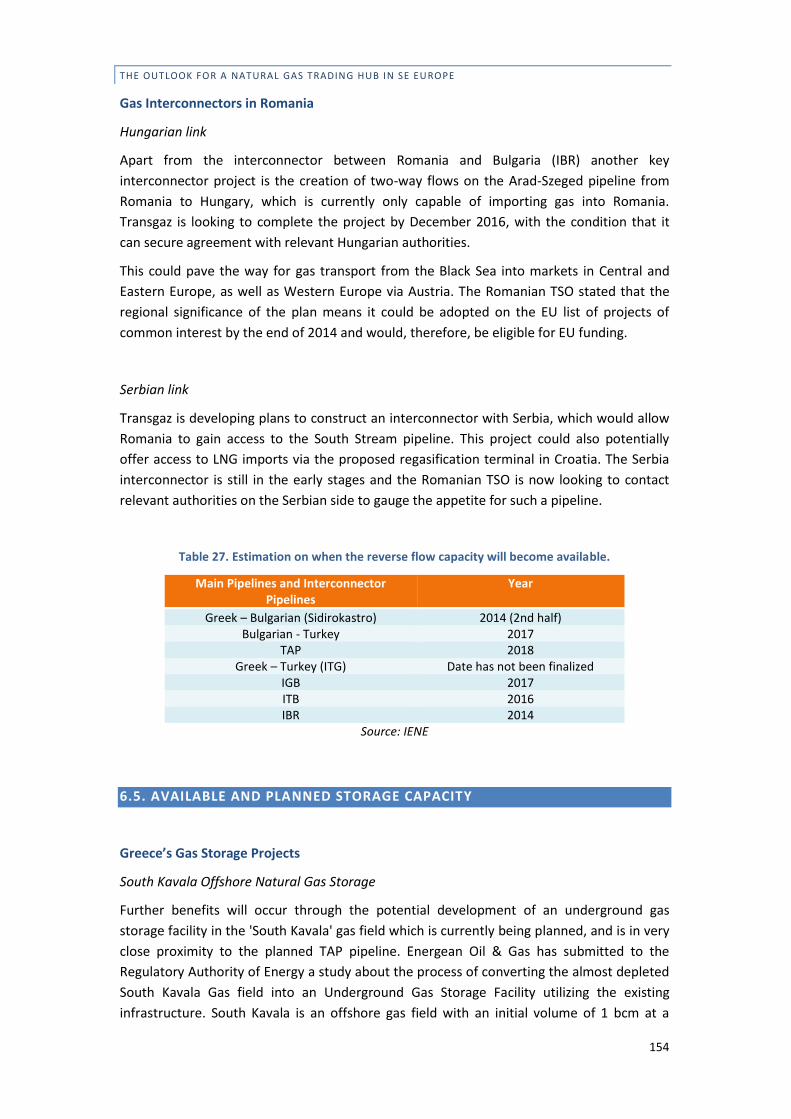
THE OUTLOOK FOR A NATURAL GAS TRADING HUB IN SE EUROPE
154
Gas Interconnectors in Romania
Hungarian link
Apart from the interconnector between Romania and Bulgaria (IBR) another key
interconnector project is the creation of two-way flows on the Arad-Szeged pipeline from
Romania to Hungary, which is currently only capable of importing gas into Romania.
Transgaz is looking to complete the project by December 2016, with the condition that it
can secure agreement with relevant Hungarian authorities.
This could pave the way for gas transport from the Black Sea into markets in Central and
Eastern Europe, as well as Western Europe via Austria. The Romanian TSO stated that the
regional significance of the plan means it could be adopted on the EU list of projects of
common interest by the end of 2014 and would, therefore, be eligible for EU funding.
Serbian link
Transgaz is developing plans to construct an interconnector with Serbia, which would allow
Romania to gain access to the South Stream pipeline. This project could also potentially
offer access to LNG imports via the proposed regasification terminal in Croatia. The Serbia
interconnector is still in the early stages and the Romanian TSO is now looking to contact
relevant authorities on the Serbian side to gauge the appetite for such a pipeline.
Table 27. Estimation on when the reverse flow capacity will become available.
Main Pipelines and Interconnector Pipelines
Year
Greek – Bulgarian (Sidirokastro) 2014 (2nd half) Bulgarian - Turkey 2017
TAP 2018 Greek – Turkey (ITG) Date has not been finalized
IGB 2017 ITB 2016 IBR 2014
Source: IENE
6.5. AVAILABLE AND PLANNED STORAGE CAPACITY
Greece’s Gas Storage Projects
South Kavala Offshore Natural Gas Storage
Further benefits will occur through the potential development of an underground gas
storage facility in the 'South Kavala' gas field which is currently being planned, and is in very
close proximity to the planned TAP pipeline. Energean Oil & Gas has submitted to the
Regulatory Authority of Energy a study about the process of converting the almost depleted
South Kavala Gas field into an Underground Gas Storage Facility utilizing the existing
infrastructure. South Kavala is an offshore gas field with an initial volume of 1 bcm at a
THE OUTLOOK FOR A NATURAL GAS TRADING HUB IN SE EUROPE
155
depth of 52 m and 30 km from the coast. The conversion into an underground natural gas
storage facility will require an investment of approximately 400 million euros.
The working gas storage capacity ranges from 360 to 530 mcm, the total volume - from 720
up to 1 billion, a daily rate of withdrawal - from 4 to 9 mcm, a daily rate of injection - from 5
to 7,5 mcm. The existing marine and coastal infrastructure (a set of offshore platforms and
installations for processing gas for further transportation), and close proximity to the
national gas transmission network, are also in favour of the conversion project.
The Underground Gas Storage Facility of South Kavala together with Revithoussa LNG
storage will fulfil the obligation on Member States to cover the maximum daily consumption
in the event of disruption of the single largest gas import infrastructure with possible
occurrence once in 20 years. The Kavala Gas Storage is ideally positioned to support major
gas pipelines and interconnectors (TAP, IGB, IGI) or act as an entry point for new offshore
gas projects in the East Med region.
The project has been adopted by European Commission as a Project of Common Interest
under Regulation (EU) No 347/2013 on Guidelines for trans-European energy infrastructure.
Detailed information of the planned underground gas storage facility in South Kavala is
given in Appendix.
Expansion of Revithoussa LNG Terminal
The Revithoussa LNG Terminal is the only LNG terminal in Greece. It is located on the island
of Revithoussa, in the Gulf of Megara, west of Athens. It was completed in 1999 and is
operated by DESFA. In 2007, an expansion project was completed to upgrade the terminal,
increasing its capacity to 185 bcf/y (5,2-5,3 bcm annually). The LNG is stored in two in-
ground tanks, with a total capacity of 130.000 m3.
Revithoussa terminal is to expand its cryogenic facilities, which will boost the gas send-out
rate to 1.400 m3 per hour. Currently, the terminal handles 0,68 bcm of gas per year, and
consists of an import jetty, two full containment storage tanks, plus one under construction,
re-gasification equipment and send-out facilities.
Bulgarian Gas Storage Projects
Chiren Underground Storage Facility
In Bulgaria natural gas is being stored in the Chiren underground storage facility, owned by
"Bulgartransgaz" EAD. The storage has been constructed on the basis of an already
exhausted gas field in the area. The storage facility is used to compensate for the seasonal
irregularities of natural gas consumption in the country, as well as to ensure the security of
gas supplies in Bulgaria. The storage has a capacity of 1,35 bcm of natural gas. The available
production capacity is 0,6 bcm, while the other 0,75 bcm are used to keep the facility
operational. Bulgaria's only natural gas storage facility in Chiren will be expanded to reach
THE OUTLOOK FOR A NATURAL GAS TRADING HUB IN SE EUROPE
156
its maximum usable capacity of 1 bcm of natural gas. The expansion of the Chiren site –
which should be completed by 2015, will cost the company about 200 million euros.
Galata offshore Gas Storage
The gas field located off the Black Sea coast about 20km from the eastern port of Varna is
operated by Scottish-based oil and gas company Melrose Resources. It ceased production at
the field on 31 January 2009 in order to start preparations for converting the field into a gas
storage facility. The field lies at a water depth of 35m and had gross proved and recoverable
reserves of 1,37 bcm, and proved and probable reserves of 2,26 bcm. About 0,2 bcm of gas
reserves were left at the field when production ceased.
Melrose had talks with the Bulgarian Government in order to get approval to complete the
Karvarna field development as a subsea tie back and for the gas injection at the Galata gas
storage project. The company also plans to speed up the activities related to completing the
agreements required for the commencement of the Galata gas storage project. Karvarna
and Kaliakra are two other fields being developed within the Galata project. First gas
production from the two fields began in November 2010 after receiving government
approvals in November 2009.
A memorandum of understanding was signed between Melrose and the state-owned gas
utility Bulgargaz at the end of 2007. As per the agreement, the company and Bulgargaz
conducted an assessment of the feasibility of converting the gas field into a storage facility.
The project was found feasible and further plans were drawn up for a three phase
conversion of the field. A capital expenditure of $90m was committed for developing the
storage facility with a capacity of 1,8 bcm. The first phase of development of the gas storage
facility started in 2009 and involved field compression. The second and third phases will
involve tying-back Galata second well and installation of metering facilities respectively. The
first phase required an investment of $30m. Phase I will provide storage capacity of 0,7bcm.
Phases II and III, with an investment of $30m each, will raise the capacity to 1,2bcm and
1,8bcm, respectively.
Romanian Gas Storage Projects
Romania has eight underground storage facilities with a combined capacity of 3 bcm (106
bcf). Of the eight, six are operated by Romgaz and two are operated by Depomureş and
Amgaz. The Romgaz underground storage facilities have a combined capacity of 2,76 bcm.
The storage facilities are located in Sărmăşel and Cetatea de Baltă in Transylvania and in
Bilciureşti, Bălăceanca, Urziceni and Gherceşti in Southern Romania. The largest of the six
storages is the Bilciureti facility located 40 km North-West of Bucharest having a storage
capacity of 1,3 bcm in one cycle and it is located at a depth of 2.000 m.
A joint venture between Romanian gas producer Romgaz and Gazprom for the construction
of the Roman-Margineni gas storage facility was established in 2009. However, a project
THE OUTLOOK FOR A NATURAL GAS TRADING HUB IN SE EUROPE
157
feasibility study indicated that such a storage facility should not be built before the
implementation of the gas supply diversification projects that are planned in Romania.
Albanian Gas Storage Projects
The need for more storage in South East Europe goes hand in hand with advances in the
gasification process. It is evident that the need for new storage will be greatest where new
gasification occurs. Within this frame the Albanian government is planning the development
of natural underground gas storage (UGS) reservoirs located in the Southwest part of the
country where many depleted oil fields exist. There are two possible locations for the
construction of a UGS: the depleted gas field near Divjaka and the salt formation in Dumre,
in Central Albania. Although feasibility studies have been carried out on both locations, their
economic attractiveness is questionable. The project of Divjaka envisages a large number of
wells, which means high maintenance costs. Moreover, the lower pressure in the storage
could require additional measures, which will probably increase the value of construction
works by 50%.
The scenarios for the Dumre gas storage depend on its function. If Dumre is developed as
storage to cover only national needs, two caverns of 55-60 m diameter will be leached, each
storing some 65-75 mcm of natural gas. Such a decision, however, will diminish the
quantities as well as the chances of investment in salt production. The shaping of the two
caverns will take four years. In the second scenario, Dumre will meet the need of the
regional and the transit gas markets. The project includes the leaching of eight caverns with
70-80 m diameter, which will have a combined storage of up to 1,2 bcm of gas. It is very
likely for the project to attract a salt production company to develop the mine and reduce
the operation costs of the storage. Taking away the salt and leaching four caverns will take
about eight years.
Serbian Gas Storage Projects
In 2010, Serbia launched its first natural gas underground storage facility in the northern
town of Banatski Dvor. The Serbian storage facility is to be part of the South Stream project
and it is one of the largest underground gas storage (UGS) facilities in South Eastern Europe.
Its working gas volume makes up 450 mcm, maximum deliverability – 5 mcm per day. In
addition, Banatski Dvor has a potential for further expansion. The UGS facility enhances the
security of Russian gas export to Hungary, Serbia, Bosnia and Herzegovina.
THE OUTLOOK FOR A NATURAL GAS TRADING HUB IN SE EUROPE
158
7. KEY MARKET PLAYERS AND THEIR
ROLE IN A REGIONAL GAS HUB
As shown in Chapter 6, several natural gas infrastructure projects in South Eastern European
countries are moving ahead and slowly but steadily building up the regional market and
paving the way for the establishment of a natural gas hub in the region, thus enhancing
energy security and market competition.
Greece already operates the Revithoussa LNG terminal close to Athens, which mainly
imports from Algerian Sonatrach and aims to be able to have a throughput capacity of more
than 2 bcm per year over the coming years. Concurrently, Turkey operates two terminals,
one in the Marmara Sea, close to Istanbul, and another in Izmir, supplied by a variety of
companies from Nigeria, Equatorial Guinea and Qatar. The construction of at least one FSRU
station in North Greece will facilitate the access of South Eastern Europe to more LNG
quantities in addition to the LNG terminal in Revithoussa.
Overall, these plans can work in conjunction with the IGB, which should be operational by
late 2016, and will complement other regional interconnectors, such as those between
Bulgaria-Romania, Bulgaria–Serbia, Turkey–Bulgaria, Romania-Serbia and Hungary-Romania.
Market integration will be facilitated in the first phase from the operation of the existing
Interconnector Greece-Turkey, which already brings Azeri gas to Greece via Turkey and
which is planned to have a reverse flow in order to facilitate deliveries to Turkey, which is by
far the largest consumer of gas in the region, with estimates that it will need more than 80
bcm per year by 2025. Additionally, the East Mediterranean gas resources, mainly from
Israel and Cyprus, over the course of the next 10 years, could provide much needed new gas
inputs into the European energy grid in comparable, if not greater, quantities from those
originating from Azerbaijan.
Consequently, sizable gas volumes will be entering South Eastern Europe’s system by 2018 -
2023 and the case for gas price competition will become much stronger. On the other hand,
for the hub vision to be realized, there needs to be sufficient spot gas traded in the region
to form a reliable price index and not only gas volumes traded under oil indexed long-term
contracts. Any plans made to establish a gas trading hub in the region should take these
developments into account, since most gas flow and trade will eventually end up in the
THE OUTLOOK FOR A NATURAL GAS TRADING HUB IN SE EUROPE
159
Turkish, Greek and Bulgarian transmission systems. Some countries are likely to play a
particularly important role in the formation of a regional trading hub and have the potential
to make a real contribution to the market’s integration and development.
7.1. TRADITIONAL AND NEW GAS SUPPLIERS AND THEIR ROLE IN THE
OPERATION OF A GAS HUB
Russia
Russia accounts for 34% of EU natural gas imports, making it the lead supplier of natural gas
to the EU and particularly to South Eastern Europe. While European demand growth will
most likely remain weak, import dependence is slated to increase due to the decline in
European gas production, meaning that the EU will have to rely ever more heavily on
exporters such as Russia. The annual export volumes from Russia to South Eastern Europe
(Turkey, Greece, Bulgaria, Romania and Croatia) exceeds 35,5 bcm of gas and could
potentially reach 50 bcm following the launching of South Stream and the implementation
of other gas infrastructures such as underground gas storages and gas interconnectors.
The Ukraine crisis has led to a debate concerning the implications for European gas markets
and how to deal with possible threats to gas supplies, both in the short and long term. There
is no question that Europe will remain dependent to a large extent on Russian gas imports.
This implies that the EU should support Gazprom’s efforts to diversify away from Ukraine, in
particular through the Nord Stream and South Stream pipelines. The current conflict with
Ukraine strengthens the rationale for the South Stream pipeline, which would bring Russian
gas across the Black Sea to Bulgaria.
Gazprom might not be able to book and utilise full capacity in the onshore extensions of
both Nord Stream and South Stream, as the EU Third Package for gas requires inter alia
Third Party Access unless an exemption is granted. Some arguments support the view that
in light of the Ukraine crisis, the EU should allow Gazprom to use Nord Stream and in the
future the new South Stream pipeline for itself, without a requirement to grant access to
third parties. Nevertheless, others suggest that the EU should adopt a strict regulatory
policy towards South Stream and subject all of Gazprom’s activities to intense legal scrutiny.
The European Commission announced in March 2014 that it wants to further investigate
this project before making a decision. Furthermore, Energy Commissioner Günther
Oettinger stated that the EU would “delay” a decision on South Stream in response to
Russian actions in Ukraine.
Securing TPA for the South Stream pipeline project is critical, as it will allow the countries of
the region, especially Bulgaria, Serbia, Hungary and Slovenia, to improve their capacity
utilization and trade some marginal gas quantities. The TPA would force Gazprom to allow
third-party gas suppliers, such as Greece or the Shah Deniz project partners, to also use the
European section of South Stream pipeline. This is very important because trading hubs are
created only when there is a TPA regime and this has reached a certain level of maturity. In
THE OUTLOOK FOR A NATURAL GAS TRADING HUB IN SE EUROPE
160
a trading hub, shippers can freely trade their excess capacities, thereby improving the
liquidity of pipeline capacity in the region.
On April 4, 2014, Bulgaria’s parliament legislated for the Bulgarian section of South Stream
to be redefined as a “gas grid interconnection” rather than a pipeline, which theoretically
allows the project to circumvent EU competition legislation. The idea is that the new legal
definition of South Stream as a connector that is an extension of an existing network will
mean that Gazprom will not have to open the crucial Bulgarian part of the pipeline to third
parties under the EU’s Third Energy Package. The widespread assumption is that Gazprom
would be less keen on the project were it forced to open up its infrastructure to other
suppliers.
North Africa
In North Africa, some countries like Algeria, Libya and Egypt have the potential to become
some of the largest European suppliers. The three countries together could provide about
44 percent of what Russia does today, according to the U.S. Energy Information
Administration. However, problems with infrastructure and political instability are getting in
the way.
Currently, Algeria ranks as the fourth-largest supplier of natural gas to the European Union,
exporting some 47 bcm/yr primarily to Spain, Italy, France and the United Kingdom.
Currently Algeria supplies about 30% of Italian and 20% of Spanish gas demand. It is also
interesting to note that 45% of the Algerian volumes arrive in Europe as LNG, rather than by
pipeline. The country's export infrastructure is highly developed and features two sub-
Mediterranean pipelines and three LNG facilities, each with spare capacity. Moreover,
Algeria has been willing to commit to long-term supply contracts, which are preferred by
several European countries that typically favour locking in advantageous prices and terms,
for long periods of time. In case of an emergency, Algeria could play a crucial role in feeding
the Balkan countries with gas, as the TAP's reverse flow capability would allow gas from
North Africa to reach the South Eastern European region through Italy.
Algeria’s regional neighbor Egypt has seen domestic for natural gas increase more than 57
percent since 2005, but production is limited, partly because of hard-to-reach reserves.
While potentially a rich new source of supply for Europe, attacks from Bedouin and terrorist
groups in the Sinai Peninsula have halted Egyptian exports much closer to home in Israel
and Jordan. Egypt will need to make the tough political decisions to cut fuel subsidies and
encourage western investment before it can tackle an ambitious export plan. Several
sources from the market say that even under the most optimistic scenario, the Egyptians
will be unable to overcome its gas shortage before the 2020s.
On the other hand, in Libya, natural gas production dropped 90 percent during the 2011 civil
war. The industry has recovered to a degree but civil unrest, protests and strikes still
hamper production. Still, Libya holds the fourth-largest amount of natural gas reserves in
Africa, and new leadership could help facilitate further exports.
THE OUTLOOK FOR A NATURAL GAS TRADING HUB IN SE EUROPE
161
Iran
Holding the world’s largest reserves of natural gas, Iran was expected to become a large-
scale exporter for many decades. However, Iran is in reality a net-importer of natural gas.
Imports of 9,4 bcm exceeded the country’s total exports of 8,4 bcm in 2012, according to
the BP statistical review (2013). The only larger export project, with Turkey at 7,5 bcm/yr, is
running far from smooth while trade with Armenia and Azerbaijan is marginal. Furthermore,
sanctions imposed by USA and West leaders are obviously responsible for Iran’s isolation
and the lack of investments from west companies. Before sanctions, Iran enjoyed access to
international banking with European companies like ENI or Total actively engaged in Iranian
gas projects.
Assuming a solution is found to the nuclear issue and sanctions are lifted, Iran will have the
chance to export gas to Europe, Persian Gulf states and Iraq. Recently, Iran announced that
the completion of the three gas trunk-lines IGAT-6, IGAT-7 and IGAT-9 will facilitate gas
exports to Iraq, Europe and Persian Gulf. Therefore, Iran and Iraq have signed an agreement
for the construction of a pipeline that will carry Iranian natural gas to feed power plants in
the Southern Iraqi province of Basra. The 56-inch pipeline originating from Assaluyeh, near
the massive offshore South Pars Gas Field in Southern Iran, will continue into Iraq to feed
three Iraqi power plants consuming gas.
The pipeline will be designed in such a way that it will be able to deliver gas to other Muslim
countries like Jordan, Syria and Lebanon in the future. Iran is making efforts to raise its gas
output by more foreign and domestic investments, especially in the Southern Pars gas field.
Laying a pipeline to carry Iranian gas to Iraq has been worked out and negotiations with the
Iraqi officials to initiate export of Iranian gas to Iraq were under way. The deal for gas export
to Iraq finalized in early May 2014. However, the implementation of the project came to an
halt due to lack of security in Syria and the recent Iraqi crisis. Iranian officials stated that if
the situation in Syria and Iraq comes to normal, the project will be implemented.
Azerbaijan
Azerbaijan is capable of playing two key roles in helping ensure stable gas supplies to
Europe: as a producer with its own gas sources and as a prospective entry point for the
supplies from the Eastern shores of the Caspian Sea (Turkmenistan, Kazakhstan).
Nevertheless, Azerbaijan is unlikely to play a transit role before it has secured markets for
its own gas, not just from Shah Deniz, but also from a number of other prospective
developments, including Absheron (being developed by Total of France), Umid (being
developed by Socar, with possible future foreign participation) and a number of other
prospects. Therefore, until markets are secured for this gas, Azerbaijan has little incentive to
provide a transit route for competing supplies from Turkmenistan. It is now generally
agreed that Shah Deniz contains around 0,9 tcm of recoverable gas reserves. For Azerbaijan,
establishing a direct connection between Turkey and Italy through the implementation of
the TAP project is likely to prove the key element for increasing its gas exports to the
European market. At present, Azerbaijan is already shipping around 8 bcm/yr westward,
most of which is directed to Turkey, while a small part is re-exported (up to 0,75 bcm/year)
THE OUTLOOK FOR A NATURAL GAS TRADING HUB IN SE EUROPE
162
to Greece. In the immediate future, the focus is on the second phase of development of
Azerbaijan's giant Shah Deniz field, which will bring 16 bcm of new gas that will be delivered
through the TANAP – TAP system. Once that connection is made, the Southern Corridor can
be expected to grow organically – and that will result in gas flowing in ever greater volumes
from the Caspian to all parts of Europe – not just to Italy, but via Greece and Albania to the
rest of SE Europe.
Cyprus & Israel
Almost one tcm of recoverable natural gas has been discovered in Israeli and Cypriot
waters, comparable to the proven reserves of Azerbaijan's Shah Deniz field, enough to cover
a small part of European demand over several years. Although export projects are at early
stages and politically difficult to implement due to the region's instability, increased efforts
are being made to make some of this gas available to Europe. Through Cyprus, the EU would
gain a new internal supply source. These new sources of gas will help enhance supply
diversification in the European market. The East Mediterranean gas quantities will involve
supplies from Israeli and Cyprus fields and in a second phase, potentially from Lebanon and
Syria, beyond 2030. Gas deliveries could be at first in the form of LNG supplies and then
delivered by pipeline (e.g. the East Med pipeline). For Cyprus the construction of an onshore
LNG terminal in the Vassilikos coastal side continues to be a top priority project. In order for
the LNG terminal to be commercially viable, more sufficient quantities of natural gas need
to be found in Cypriot waters. On the other hand, Israel has expressed its intention to
export to its immediate neighbours – Jordan, Egypt and the Palestinian Authority – and has
entertained the possibility of using Egypt's unused LNG export terminals to process Israeli
gas. More specifically, in May 2014, the Tamar natural gas field licensees announced the
signing of a letter of intent to sell 4,5 bcm of gas per year to Spain's Union Fenosa SA, which
operates Egypt's natural gas export facility at Damietta.
According to estimates, Israel and Cyprus could deliver to European markets after 2020 -
2022 an amount of 10 bcm per year. However, accessing East Mediterranean gas will be
expensive. Total anticipated investments in East Med gas development, for both Israel and
Cyprus, are likely to reach 60 billion euros by 2023. Building gas export facilities in the
region will also be politically challenging.
7.2. TRANSIT COUNTRIES AND THEIR ROLE IN A GAS HUB
Turkey
Turkey holds a strategic role in natural gas transit through its position between the world's
second-largest natural gas market, continental Europe, and the substantial natural gas
reserves of the Caspian Basin and the Middle East. With the launch of the Baku-Tbilisi-
Erzurum pipeline in 2007 and the subsequent launch of re-exports of natural gas to Greece,
Turkey has begun to stake out its position as an energy bridge for gas supplies from the
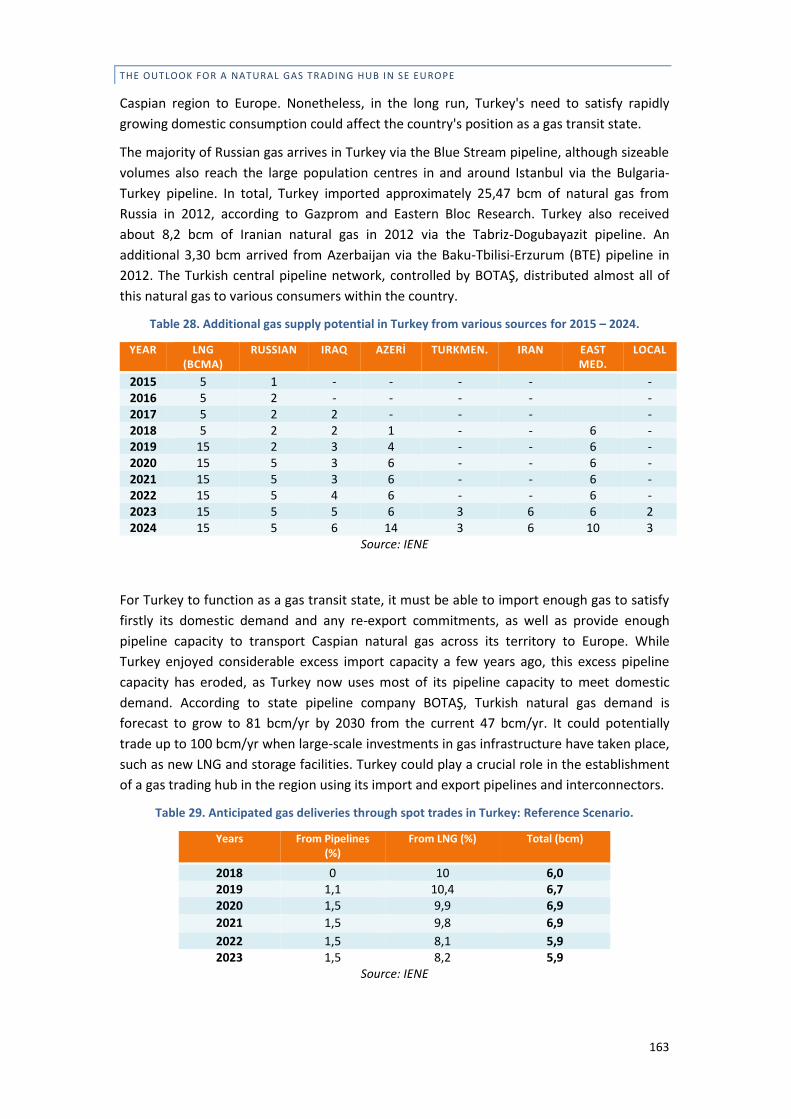
THE OUTLOOK FOR A NATURAL GAS TRADING HUB IN SE EUROPE
163
Caspian region to Europe. Nonetheless, in the long run, Turkey's need to satisfy rapidly
growing domestic consumption could affect the country's position as a gas transit state.
The majority of Russian gas arrives in Turkey via the Blue Stream pipeline, although sizeable
volumes also reach the large population centres in and around Istanbul via the Bulgaria-
Turkey pipeline. In total, Turkey imported approximately 25,47 bcm of natural gas from
Russia in 2012, according to Gazprom and Eastern Bloc Research. Turkey also received
about 8,2 bcm of Iranian natural gas in 2012 via the Tabriz-Dogubayazit pipeline. An
additional 3,30 bcm arrived from Azerbaijan via the Baku-Tbilisi-Erzurum (BTE) pipeline in
2012. The Turkish central pipeline network, controlled by BOTAŞ, distributed almost all of
this natural gas to various consumers within the country.
Table 28. Additional gas supply potential in Turkey from various sources for 2015 – 2024.
YEAR LNG (BCMA)
RUSSIAN IRAQ AZERİ TURKMEN. IRAN EAST MED.
LOCAL
2015 5 1 - - - - - 2016 5 2 - - - - - 2017 5 2 2 - - - - 2018 5 2 2 1 - - 6 - 2019 15 2 3 4 - - 6 - 2020 15 5 3 6 - - 6 - 2021 15 5 3 6 - - 6 - 2022 15 5 4 6 - - 6 - 2023 15 5 5 6 3 6 6 2 2024 15 5 6 14 3 6 10 3
Source: IENE
For Turkey to function as a gas transit state, it must be able to import enough gas to satisfy
firstly its domestic demand and any re-export commitments, as well as provide enough
pipeline capacity to transport Caspian natural gas across its territory to Europe. While
Turkey enjoyed considerable excess import capacity a few years ago, this excess pipeline
capacity has eroded, as Turkey now uses most of its pipeline capacity to meet domestic
demand. According to state pipeline company BOTAŞ, Turkish natural gas demand is
forecast to grow to 81 bcm/yr by 2030 from the current 47 bcm/yr. It could potentially
trade up to 100 bcm/yr when large-scale investments in gas infrastructure have taken place,
such as new LNG and storage facilities. Turkey could play a crucial role in the establishment
of a gas trading hub in the region using its import and export pipelines and interconnectors.
Table 29. Anticipated gas deliveries through spot trades in Turkey: Reference Scenario.
Source: IENE
Years From Pipelines (%)
From LNG (%) Total (bcm)
2018 0 10 6,0 2019 1,1 10,4 6,7 2020 1,5 9,9 6,9
2021 1,5 9,8 6,9
2022 1,5 8,1 5,9 2023 1,5 8,2 5,9
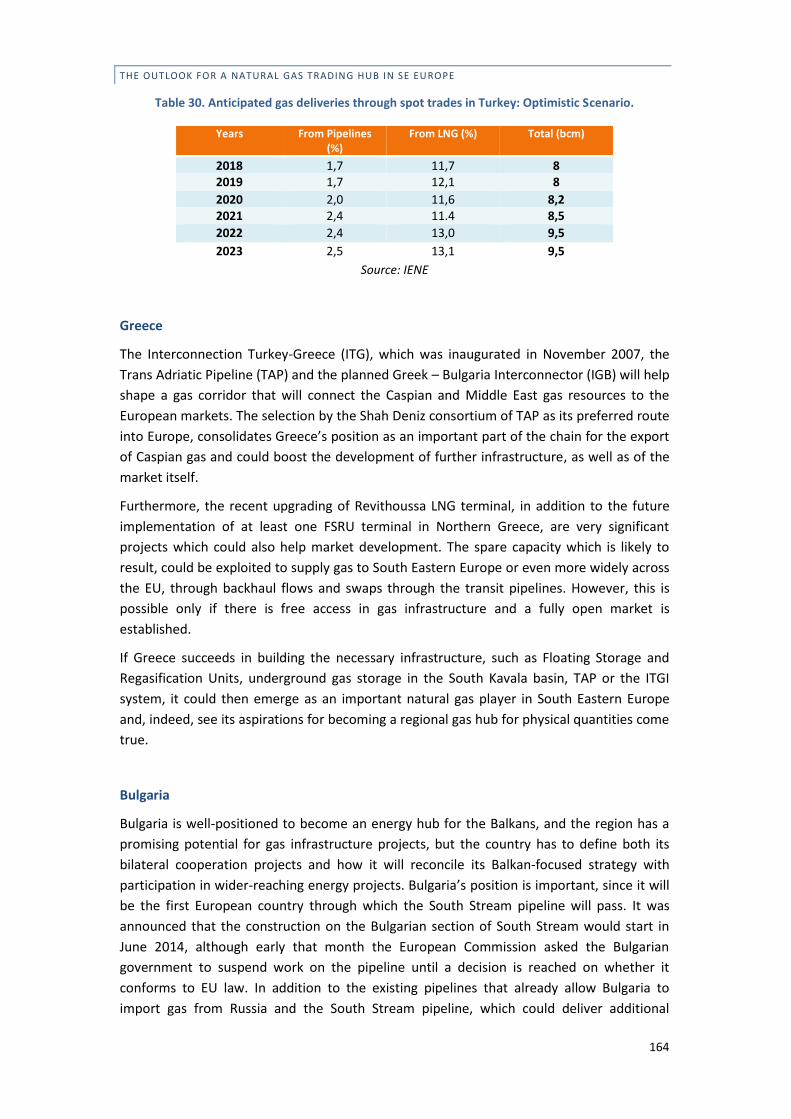
THE OUTLOOK FOR A NATURAL GAS TRADING HUB IN SE EUROPE
164
Table 30. Anticipated gas deliveries through spot trades in Turkey: Optimistic Scenario.
Years From Pipelines (%)
From LNG (%) Total (bcm)
2018 1,7 11,7 8 2019 1,7 12,1 8
2020 2,0 11,6 8,2 2021 2,4 11.4 8,5
2022 2,4 13,0 9,5
2023 2,5 13,1 9,5
Source: IENE
Greece
The Interconnection Turkey-Greece (ITG), which was inaugurated in November 2007, the
Trans Adriatic Pipeline (TAP) and the planned Greek – Bulgaria Interconnector (IGB) will help
shape a gas corridor that will connect the Caspian and Middle East gas resources to the
European markets. The selection by the Shah Deniz consortium of TAP as its preferred route
into Europe, consolidates Greece’s position as an important part of the chain for the export
of Caspian gas and could boost the development of further infrastructure, as well as of the
market itself.
Furthermore, the recent upgrading of Revithoussa LNG terminal, in addition to the future
implementation of at least one FSRU terminal in Northern Greece, are very significant
projects which could also help market development. The spare capacity which is likely to
result, could be exploited to supply gas to South Eastern Europe or even more widely across
the EU, through backhaul flows and swaps through the transit pipelines. However, this is
possible only if there is free access in gas infrastructure and a fully open market is
established.
If Greece succeeds in building the necessary infrastructure, such as Floating Storage and
Regasification Units, underground gas storage in the South Kavala basin, TAP or the ITGI
system, it could then emerge as an important natural gas player in South Eastern Europe
and, indeed, see its aspirations for becoming a regional gas hub for physical quantities come
true.
Bulgaria
Bulgaria is well-positioned to become an energy hub for the Balkans, and the region has a
promising potential for gas infrastructure projects, but the country has to define both its
bilateral cooperation projects and how it will reconcile its Balkan-focused strategy with
participation in wider-reaching energy projects. Bulgaria’s position is important, since it will
be the first European country through which the South Stream pipeline will pass. It was
announced that the construction on the Bulgarian section of South Stream would start in
June 2014, although early that month the European Commission asked the Bulgarian
government to suspend work on the pipeline until a decision is reached on whether it
conforms to EU law. In addition to the existing pipelines that already allow Bulgaria to
import gas from Russia and the South Stream pipeline, which could deliver additional
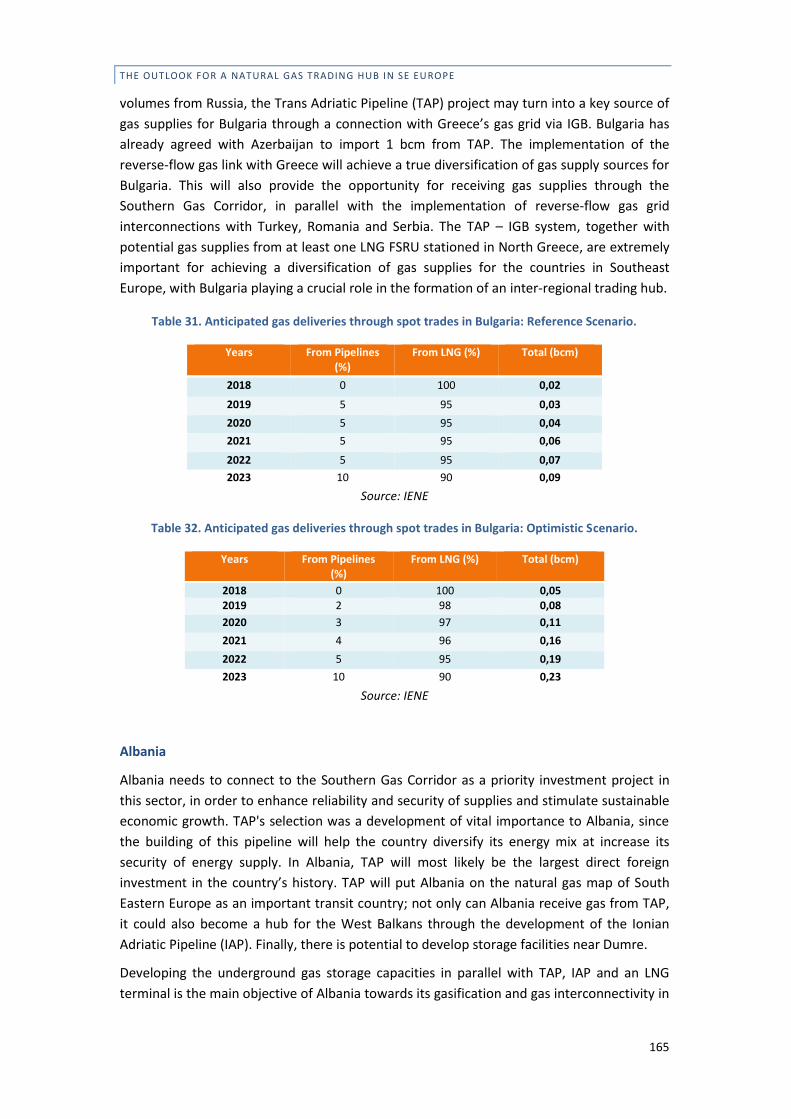
THE OUTLOOK FOR A NATURAL GAS TRADING HUB IN SE EUROPE
165
volumes from Russia, the Trans Adriatic Pipeline (TAP) project may turn into a key source of
gas supplies for Bulgaria through a connection with Greece’s gas grid via IGB. Bulgaria has
already agreed with Azerbaijan to import 1 bcm from TAP. The implementation of the
reverse-flow gas link with Greece will achieve a true diversification of gas supply sources for
Bulgaria. This will also provide the opportunity for receiving gas supplies through the
Southern Gas Corridor, in parallel with the implementation of reverse-flow gas grid
interconnections with Turkey, Romania and Serbia. The TAP – IGB system, together with
potential gas supplies from at least one LNG FSRU stationed in North Greece, are extremely
important for achieving a diversification of gas supplies for the countries in Southeast
Europe, with Bulgaria playing a crucial role in the formation of an inter-regional trading hub.
Table 31. Anticipated gas deliveries through spot trades in Bulgaria: Reference Scenario.
Years From Pipelines (%)
From LNG (%) Total (bcm)
2018 0 100 0,02
2019 5 95 0,03
2020 5 95 0,04
2021 5 95 0,06
2022 5 95 0,07
2023 10 90 0,09
Source: IENE
Table 32. Anticipated gas deliveries through spot trades in Bulgaria: Optimistic Scenario.
Years From Pipelines (%)
From LNG (%) Total (bcm)
2018 0 100 0,05 2019 2 98 0,08
2020 3 97 0,11
2021 4 96 0,16
2022 5 95 0,19
2023 10 90 0,23
Source: IENE
Albania
Albania needs to connect to the Southern Gas Corridor as a priority investment project in
this sector, in order to enhance reliability and security of supplies and stimulate sustainable
economic growth. TAP's selection was a development of vital importance to Albania, since
the building of this pipeline will help the country diversify its energy mix at increase its
security of energy supply. In Albania, TAP will most likely be the largest direct foreign
investment in the country’s history. TAP will put Albania on the natural gas map of South
Eastern Europe as an important transit country; not only can Albania receive gas from TAP,
it could also become a hub for the West Balkans through the development of the Ionian
Adriatic Pipeline (IAP). Finally, there is potential to develop storage facilities near Dumre.
Developing the underground gas storage capacities in parallel with TAP, IAP and an LNG
terminal is the main objective of Albania towards its gasification and gas interconnectivity in
THE OUTLOOK FOR A NATURAL GAS TRADING HUB IN SE EUROPE
166
the region. If Albania can become a hub for supplies mainly to the West Balkans region and
possibly house a gas storage facility, it will have a major positive impact in the region.
Developing such strategic infrastructure will help establish an integrated gas market over
South Eastern Europe. Nevertheless, the main challenge in Albania is that TAP is such a big
cross-border project and legislation is not yet complete for every element of a venture of
this magnitude. Unlike in Italy and in Greece, there is no precedent for developing natural
gas pipeline projects. Although there is widespread support for TAP, adapting permitting,
legal and fiscal terms is necessary in order to meet the overall project schedule and
financing requirements.
Romania
Romania can play a dual role in ensuring new volumes of gas in the region. Upon the
completion of gas interconnectors with Hungary, Serbia and Bulgaria, Romania will gain
access to additional gas quantities from Austria (through Hungary), from South Stream
(through Serbia) and from Greece (through Bulgaria) in addition to the volumes already
imported from Russia. In addition, Romania can feed the region with its domestically
produced gas, which may correspond to relatively small quantities, but may prove to be
particularly important in the event of a gas crisis. Consequently, Romania could become a
bridge between SE Europe and Central Europe and a viable transit country.
Serbia
The construction of the Serbian section of the South Stream pipeline, which will stretch to
about 280 miles, started near Belgrade in November 2013. Serbia is likely to become a key
country through which the South Stream pipeline will pass, since it will branch out into
neighbouring countries from Serbia (i.e. Croatia, Bosnia – Herzegovina, Kosovo). The gas
pipeline construction in Serbia will add considerable momentum to the development of the
whole gas transmission system, turning the country into an important gas transit and
storage centre for the region. Srbijagas and Gazprom have also agreed to build large gas
storage facilities in Serbia with total capacities of up to 7 bcm that would serve as
distribution centres. This will make Serbia an important energy player, able to distribute gas
quantities to Bosnia, Croatia, FYROM, Romania and Bulgaria.
Italy
Italy, Europe's third-biggest gas market after the UK and Germany, is emerging as Southern
Europe's core gas trading point, as new pipelines and LNG projects make it one of the
continent's most diversely supplied markets.
Yet, despite importing 68 bcm of gas from Russia, North Africa (Algeria and Libya) and the
Netherlands, and with more than 40 bcm of extra import capacity planned for coming years,
a lack of transparency has crippled trading activity. A virtual gas trading point, the PSV, was
created in 2003, but a lack of liquidity and competition, together with pipeline bottlenecks,
have kept Italian spot prices at a premium to those at other European trading points.

THE OUTLOOK FOR A NATURAL GAS TRADING HUB IN SE EUROPE
167
Government measures forcing Eni to spin off pipeline capacity have, however, boosted
trading and prices have finally started to track spot prices on Northern European hubs.
As it was already pointed out in Chapter 2, Italian day-ahead gas prices trade above 27
euros ($36,02) per megawatt hour (MWh), a premium of two euros to the Dutch TTF
exchange, mainland Europe's most liquid gas. Yet, despite recent progress, gas trading
liquidity in Italy still lags far behind other western European hubs.
TAP will now help Italy to become a truly Mediterranean hub. It is the missing link
connecting Italy to enormous resources of gas in the Caspian, but it is also of great
importance because it will link the enormous gas market of Italy with an emerging South
Eastern European gas market, which in many countries of the region does not yet exist. TAP
is expected to contribute about 10% - 12% of Italy’s gas consumption, while, with its reverse
flow, it will be possible to transfer gas through Albania and Greece to the rest of South
Eastern Europe.
THE OUTLOOK FOR A NATURAL GAS TRADING HUB IN SE EUROPE
168
8. ESTABLISHING A REGIONAL GAS
HUB
8.1. WHICH TYPE OF HUB FOR SE EUROPE?
For reasons stated in earlier chapters it is desirable to consider the setting up of a regional
Gas Trading Hub to take care of the needs of the South East European area. At a time when
nine (9) such hubs operate across Europe proper it is rather odd that an area of almost
equal size and through which substantial gas quantities are already being transmitted (with
a lot more planned) does not have one single hub where gas quantities can be freely traded.
The answer of course lies in the fact that today the regional market of South Eastern Europe
lacks the necessary liquidity in terms of gas volumes and worse it remains terribly isolated
between its various sub regions – through the lack of interconnectors – but also from the
main European gas market, again through the lack of major connections.
However, as has been argued in Chapter 6, the gas supply and gas transmission situation is
likely to change after 2018-2019, when substantial new gas quantities are expected to enter
the region via Turkey and Greece (through the TANAP – TAP gas system) and through the
South Stream, via Bulgaria and Serbia. In addition, it is anticipated that some sizeable new
gas storage will become available through Greece’s planned two FSRU projects
(Alexandroupolis and Kavala), the South Kavala gas storage facility, Bulgaria’s expanded
Chiren storage area and potential new storage capacity in Turkey, Romania, Serbia, Hungary
and Slovenia. These new quantities, channeled through main trunk pipelines and a web of
interconnectors, which are expected to be in place by that time, will enable the trading
initially of marginal quantities and at a later stage, as the gas markets become more
liberalized, of substantial quantities.
As has already been pointed out, the establishment and functioning of a Gas Trading Hub
requires a deregulated gas market, which is not the case today in most countries of South
Eastern Europe. During a complex process such as the deregulation of the natural gas
sector, as a relevant Study published by the IEA observes, “the ultimate policy aim would be
that the sector sustains itself by attracting outside investments to more efficiently serve its
customers. However, to allow gas supply and demand to meet in a marketplace, a platform
for exchange is needed, more commonly referred to as a hub” [6].

THE OUTLOOK FOR A NATURAL GAS TRADING HUB IN SE EUROPE
169
Physical vs. Virtual Hubs
In order to understand the parameters involved in the operation of a Gas Trading Hub, it is
useful to consider some examples where the distinction is made between a physical hub
and a virtual (regional) trading hub. Virtual trading hubs, such as NBP or TTF, do not exist in
Southern and Eastern Europe. The region is now starting to perceive the concept of a liquid
market where long-term contracts and spot or short-term trading are combined.
However, one could argue that the operation of a physical i.e. transit regional hub, such as
the Belgian Zeebrugge, could also be possible, due to the flexibility resulting from the
operation of the existing and planned interconnections in the region. The region could serve
as a transit route for carrying Azerbaijani gas to smaller hubs that are planned in the region,
as well as the Central European Gas Hub in Austria. Like the Zeebrugge, a hub where
pipelines physically meet and regional hub storage and LNG facilities are offered, could
become a possible balancing point for both storage and transportation.
A virtual hub would offer even greater flexibility, because – as it has already been
mentioned – in virtual hubs, the eligible gas for trading is all the gas which has paid a fee for
access into the network. Trading at virtual hubs does not require physical access to the hub.
Hence, a virtual hub is more favorable for liquidity purposes. On the other hand, at physical
hubs, only gas passing at a precise physical location can be traded. At virtual hubs, pipeline
congestion is not an issue and traders have higher flexibility. Therefore, by establishing
national or transnational hubs competition can be enhanced [52]. Especially when moving
towards an entry-exit system, virtual hubs are more suitable for gas trading. Furthermore,
European experience to date has proven that virtual hubs present more rapid development
than the physical hubs.
Which Type of Hub?
In examining the type of hub that would be more appropriate for a start-up operation in
South Eastern Europe and as observed by the IEA, “one has to be aware that regardless of
whether the hub is physical or virtual, when moving from physical balancing on the spot
market to a liquid futures market, the physical gas supply and the virtual gas supply will
meet at this hub. The natural gas hub will then bring together market participants that use
the same natural gas market for different aims. This has consequences for the way that
natural gas is traded, for the type of market participants active in the market, and for the
products that are traded in the market” [6].
As defined by the European Commission Regulation 312/201418, which has established a
Network Code on gas balancing of Transmission networks, the Network Code aims at
fostering the short term gas markets and providing price signals as well as contributing to
the development of a competitive and efficient gas wholesale market in the EU and will
apply from 1 October 2015. The Network Code set out “gas balancing rules, including
network-related rules on nomination procedures, imbalance charges, settlement processes
associated with the daily imbalance charge and operational balancing between transmission
18
The E.C. Regulation 312/2014 can be found at the Appendix.
THE OUTLOOK FOR A NATURAL GAS TRADING HUB IN SE EUROPE
170
system operators’ networks”. In accordance with the above regulation, the Transmission
System Operator will be responsible for the operational balancing [53]. More specifically:
1. The transmission system operator shall undertake balancing actions in order to:
(a) maintain the transmission network within its operational limits,
(b) achieve an end of day linepack position in the transmission network different from the
one anticipated on the basis of expected inputs and off-takes for that gas day, consistent
with economic and efficient operation of the transmission network.
2. While undertaking balancing actions the transmission system operator shall consider at
least the following in respect of the balancing zone:
(a) the transmission system operator’s own estimates of demand of gas over and within the
gas day for which the balancing action(s) is (are) considered;
(b) nomination and allocation information and measured gas flows;
(c) gas pressures throughout the transmission network(s).
3. The transmission system operator shall undertake balancing actions through:
(a) purchase and sale of short term standardized products on a trading platform; and/or
(b) the use of balancing services.
4. While undertaking balancing actions the transmission system operator shall take into
account the following principles:
(a) the balancing actions shall be undertaken on a non-discriminatory basis;
(b) the balancing actions shall have regard to any obligation upon transmission system
operators to operate an economic and efficient transmission network.
Looking more closely at the South Eastern European scene and in particular Bulgaria, Greece
and Turkey and taking into consideration the much higher gas volumes that will become
available after 2018-2019, and therefore the need to trade at first marginal and at a later
stage even main gas volumes, it becomes apparent that some sort of Gas Trading Hub will
be desirable for serving the needs of the broader region.
In this respect, Greece’s Gas Transmission Operator (DESFA) is already developing the
necessary infrastructure, partly in the context of EU regulatory requirements, but also
taking a longer term view, in order to meet market coupling requirements, to satisfy
anticipated commodity movements and capacity building. In this respect, DESFA is set to
have a fully functioning balancing platform, which will be able to accommodate full trading
THE OUTLOOK FOR A NATURAL GAS TRADING HUB IN SE EUROPE
171
requirements, by October 1, 2015. However, according to DESFA’s plans, the operation of
the balancing point is expected to start in the first semester of 2016.
At this point it is important to note that Bulgaria’s TSO, namely Bulgartansgaz, is in touch
with Greece’s DESFA concerning its access to the platform that Greece’s TSO is now
developing. As a result, cooperation between Greece and Bulgaria has already begun
through their participation in the same common platform. In this respect, with Greece and
Bulgaria both being EU member countries, and hence under obligation to comply with
Directive 312/2014, we may observe that the foundations for the transition to a hub type
regime and the free exchange of gas volumes have been laid.
In view of the above positive development concerning cooperation between Greece and
Bulgaria and assessing the gas market situation in Greece, Bulgaria and Turkey post 2018,
we see that Greece is likely to emerge as a forerunner for the setting up and operation of a
regional Gas Trading Hub for a number of reasons which can be summarized as follows:
i. By 2018-2019 the Greek market will enjoy much higher liquidity than Bulgaria, as
extra gas quantities will become available from TAP, through the Greece-Bulgaria
Interconnector, one or possible two FSRU units, additional gas from the Revithoussa
LNG plant where a 3rd storage unit of more than 70.000 m3 will be available, and
possibly more gas from the South Kavala Gas Storage facility, which is likely to
operate by that time (see Appendix).
ii. The Komotini-Alexandroupolis axis, which is a continuation of the existing Greek-
Turkey interconnector, appears to be the main activity area in terms of inputs and
outputs which will facilitate gas movements. This axis appears to combine more
advantages compared to Bulgaria, and say the corresponding Varna-Sofia axis, as it
will have several entry and exit points with substantial anticipated gas storage
capacity.
iii. A Gas Trading Hub located in Greece has certain distinct advantages for an outside
trader over one in Turkey, and the Istanbul vicinity in particular. These advantages
appear because the Hub is located within the EU, where a specific legislative, fiscal
and tax regime applies, similar to that under which the other existing European gas
hubs operate.
iv. Already interest has been expressed by traders to export limited gas quantities to
Turkey through the existing Greece-Turkey Interconnector (IGT), although a fully
commissioned reverse flow operation is not yet available. Once DESFA’s platform
will become operative such exchanges will be facilitated.

THE OUTLOOK FOR A NATURAL GAS TRADING HUB IN SE EUROPE
172
8.2. BASIC PARAMETERS INVOLVED IN THE DEVELOPMENT OF A REGIONAL
NATURAL GAS HUB
The establishment of a regional natural gas hub is expected to facilitate the wholesale
trading of natural gas between participants in South Eastern Europe. Essentially, it will allow
gas supply and demand to meet in a marketplace by providing a platform for physical
and/or financial transaction. It will enable competitive markets to function, even though it
will probably have an administrative role in the beginning of its operation.
Based on the developments observed, it is possible to identify different stages of market
development towards a liquid hub. These include: (i) Bilateral transactions, (ii) Marketplace
for balancing and (iii) the development of a Forward market. As already mentioned, the
natural gas market in South Eastern Europe is in the phase of bilateral transactions.
Figure 70. Stages of market development.
Source: Eclipse Energy Group
8.2.1. GENERIC HUB DESIGN AND ROLES OF HUB PARTICIPANTS
The stakeholders of a hub include network users and traders, brokers and regulatory
authorities. Network users i.e. shippers that deliver gas to consumers can use the spot
market as a balancing tool for their portfolio. Shippers are responsible for balancing their
portfolios19 in order to minimize the need for the TSO to implement balancing actions.
Brokers act as mediators for market parties facilitating the search for counterparties to
sell/buy gas. On the other hand, the operation of a natural gas hub usually involves a
Transmission System Operator (TSO), a hub operator and an exchange.
19 Balancing their inputs against their off-takes.
Bilateral transactions
•no price discovery
•no standard agreement
Marketplace for balancing
•within day, day-ahead and month-ahead trading
•standard contract agreement
•marketplace for transactions
•price reporting
•new participants
Forward market
•possible to buy gas for future delivery
•index information at hub
•entry of financial players in the market
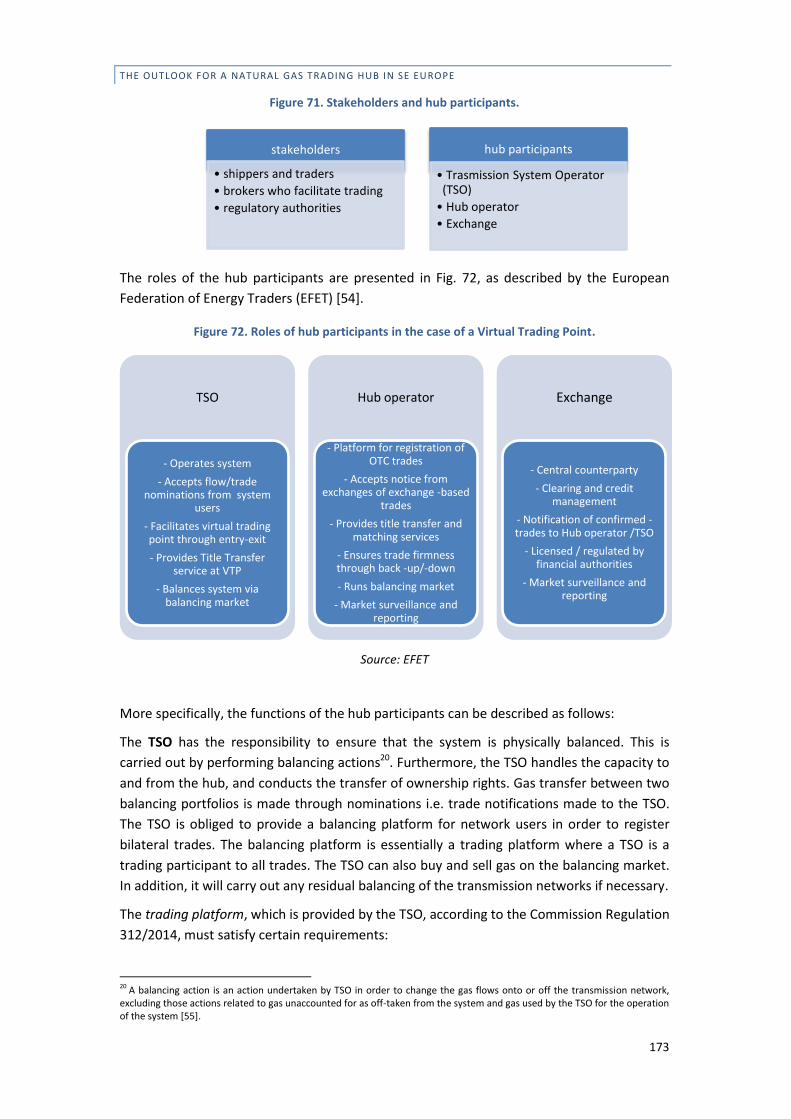
THE OUTLOOK FOR A NATURAL GAS TRADING HUB IN SE EUROPE
173
Figure 71. Stakeholders and hub participants.
The roles of the hub participants are presented in Fig. 72, as described by the European
Federation of Energy Traders (EFET) [54].
Figure 72. Roles of hub participants in the case of a Virtual Trading Point.
Source: EFET
More specifically, the functions of the hub participants can be described as follows:
The TSO has the responsibility to ensure that the system is physically balanced. This is
carried out by performing balancing actions20. Furthermore, the TSO handles the capacity to
and from the hub, and conducts the transfer of ownership rights. Gas transfer between two
balancing portfolios is made through nominations i.e. trade notifications made to the TSO.
The TSO is obliged to provide a balancing platform for network users in order to register
bilateral trades. The balancing platform is essentially a trading platform where a TSO is a
trading participant to all trades. The TSO can also buy and sell gas on the balancing market.
In addition, it will carry out any residual balancing of the transmission networks if necessary.
The trading platform, which is provided by the TSO, according to the Commission Regulation
312/2014, must satisfy certain requirements:
20 A balancing action is an action undertaken by TSO in order to change the gas flows onto or off the transmission network, excluding those actions related to gas unaccounted for as off-taken from the system and gas used by the TSO for the operation of the system [55].
stakeholders
• shippers and traders
• brokers who facilitate trading
• regulatory authorities
hub participants
• Trasmission System Operator (TSO)
• Hub operator
• Exchange
TSO
- Operates system
- Accepts flow/trade nominations from system
users
- Facilitates virtual trading point through entry-exit
- Provides Title Transfer service at VTP
- Balances system via balancing market
Hub operator
- Platform for registration of OTC trades
- Accepts notice from exchanges of exchange -based
trades
- Provides title transfer and matching services
- Ensures trade firmness through back -up/-down
- Runs balancing market
- Market surveillance and reporting
Exchange
- Central counterparty
- Clearing and credit management
- Notification of confirmed - trades to Hub operator /TSO
- Licensed / regulated by financial authorities
- Market surveillance and reporting
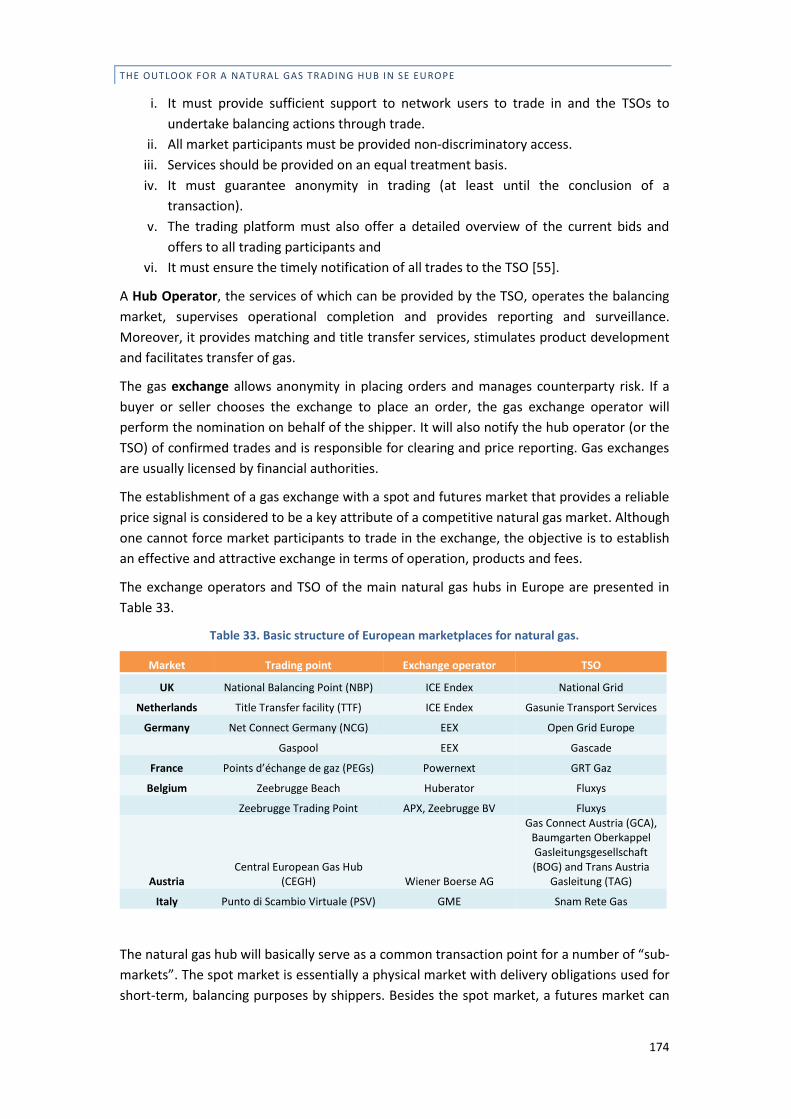
THE OUTLOOK FOR A NATURAL GAS TRADING HUB IN SE EUROPE
174
i. It must provide sufficient support to network users to trade in and the TSOs to
undertake balancing actions through trade.
ii. All market participants must be provided non-discriminatory access.
iii. Services should be provided on an equal treatment basis.
iv. It must guarantee anonymity in trading (at least until the conclusion of a
transaction).
v. The trading platform must also offer a detailed overview of the current bids and
offers to all trading participants and
vi. It must ensure the timely notification of all trades to the TSO [55].
A Hub Operator, the services of which can be provided by the TSO, operates the balancing
market, supervises operational completion and provides reporting and surveillance.
Moreover, it provides matching and title transfer services, stimulates product development
and facilitates transfer of gas.
The gas exchange allows anonymity in placing orders and manages counterparty risk. If a
buyer or seller chooses the exchange to place an order, the gas exchange operator will
perform the nomination on behalf of the shipper. It will also notify the hub operator (or the
TSO) of confirmed trades and is responsible for clearing and price reporting. Gas exchanges
are usually licensed by financial authorities.
The establishment of a gas exchange with a spot and futures market that provides a reliable
price signal is considered to be a key attribute of a competitive natural gas market. Although
one cannot force market participants to trade in the exchange, the objective is to establish
an effective and attractive exchange in terms of operation, products and fees.
The exchange operators and TSO of the main natural gas hubs in Europe are presented in
Table 33.
Table 33. Basic structure of European marketplaces for natural gas.
Market Trading point Exchange operator TSO
UK National Balancing Point (NBP) ICE Endex National Grid
Netherlands Title Transfer facility (TTF) ICE Endex Gasunie Transport Services
Germany Net Connect Germany (NCG) EEX Open Grid Europe
Gaspool EEX Gascade
France Points d’échange de gaz (PEGs) Powernext GRT Gaz
Belgium Zeebrugge Beach Huberator Fluxys
Zeebrugge Trading Point APX, Zeebrugge BV Fluxys
Austria Central European Gas Hub
(CEGH) Wiener Boerse AG
Gas Connect Austria (GCA), Baumgarten Oberkappel Gasleitungsgesellschaft (BOG) and Trans Austria
Gasleitung (TAG)
Italy Punto di Scambio Virtuale (PSV) GME Snam Rete Gas
The natural gas hub will basically serve as a common transaction point for a number of “sub-
markets”. The spot market is essentially a physical market with delivery obligations used for
short‐term, balancing purposes by shippers. Besides the spot market, a futures market can
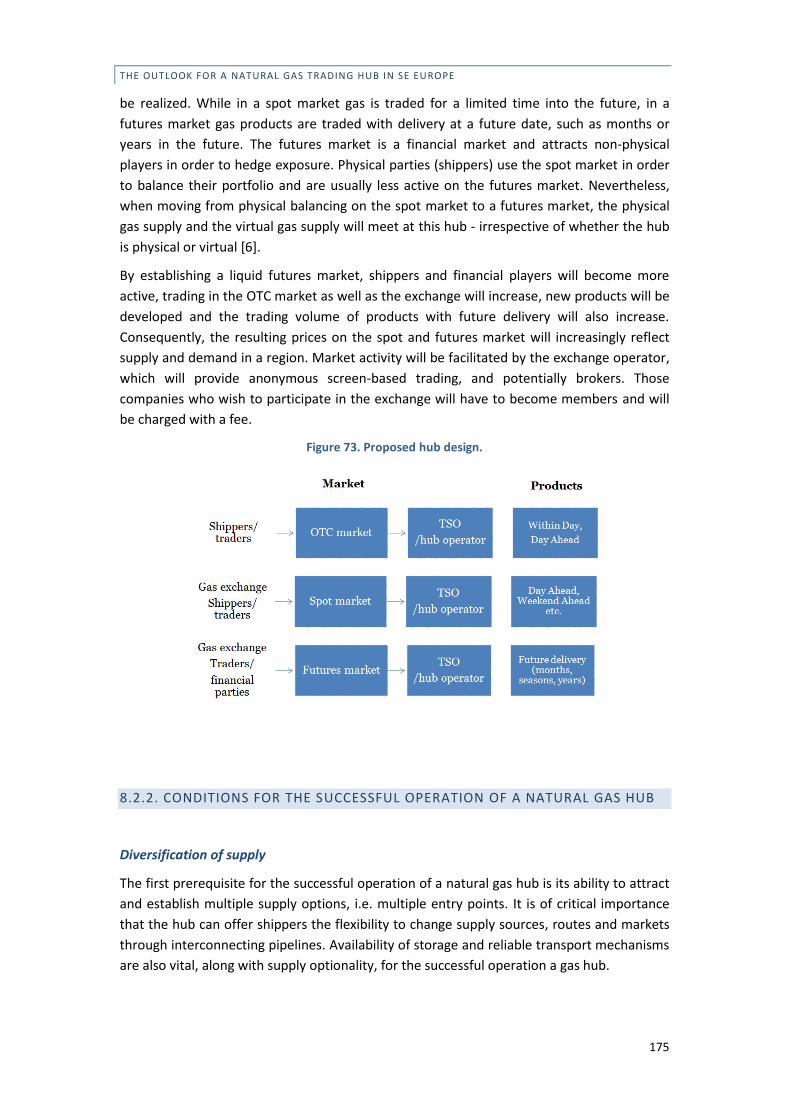
THE OUTLOOK FOR A NATURAL GAS TRADING HUB IN SE EUROPE
175
be realized. While in a spot market gas is traded for a limited time into the future, in a
futures market gas products are traded with delivery at a future date, such as months or
years in the future. The futures market is a financial market and attracts non-physical
players in order to hedge exposure. Physical parties (shippers) use the spot market in order
to balance their portfolio and are usually less active on the futures market. Nevertheless,
when moving from physical balancing on the spot market to a futures market, the physical
gas supply and the virtual gas supply will meet at this hub - irrespective of whether the hub
is physical or virtual [6].
By establishing a liquid futures market, shippers and financial players will become more
active, trading in the OTC market as well as the exchange will increase, new products will be
developed and the trading volume of products with future delivery will also increase.
Consequently, the resulting prices on the spot and futures market will increasingly reflect
supply and demand in a region. Market activity will be facilitated by the exchange operator,
which will provide anonymous screen-based trading, and potentially brokers. Those
companies who wish to participate in the exchange will have to become members and will
be charged with a fee.
Figure 73. Proposed hub design.
8.2.2. CONDITIONS FOR THE SUCCESSFUL OPERATION OF A NATURAL GAS HUB
Diversification of supply
The first prerequisite for the successful operation of a natural gas hub is its ability to attract
and establish multiple supply options, i.e. multiple entry points. It is of critical importance
that the hub can offer shippers the flexibility to change supply sources, routes and markets
through interconnecting pipelines. Availability of storage and reliable transport mechanisms
are also vital, along with supply optionality, for the successful operation a gas hub.
THE OUTLOOK FOR A NATURAL GAS TRADING HUB IN SE EUROPE
176
Moreover, diversification of gas supply sources is crucial for ensuring security of supply, a
major concern as far as EU energy policy is concerned.
Liquidity
At the start, it is necessary that potential market participants express interest in
participating in such a hub, thus ensuring initial activity. As already mentioned, establishing
a virtual hub constitutes a boost for liquidity in a natural gas market. A number of factors
which contribute in increased liquidity are the following:
The number of active trading parties
The number of transactions concluded
Volume nominated within the hub in per cent of volume traded
Volume delivered physically in per cent of volume traded
The existence of market participants who are always willing to buy and sell
The volume that can be traded without moving the market
Price volatility and price differentials between hubs
The ability to find counterparts for any given size of transaction
The variety of services / products offered at the hub
The size of bid-offer spreads in the market
Flows of gas between hubs
Utilization of capacity on the routes between the relevant hubs [56].
As the hub becomes more liquid, it will attract non-physical parties. Their trading will in turn
increase the liquidity of the hub.
Transparency
Transparent trading is a necessary condition for the development of a gas hub. Product
price must be transparent and all participants must have access to information. Establishing
a range of indices can help to ensure price reporting on a regular basis. Building a regulated
trading platform can also contribute to creating a transparent environment which will
provide reliable published prices. A transparent reference price for the gas market would
deliver a reliable price signal that accurately reflects regional supply and demand, support
the liquidity of the market and help establish the gas trading hub as a price setting point for
South Eastern Europe. It would also increase overall participation in the gas market by
attracting large users (such as LNG plants, industrial users and gas-powered generators).
The introduction of competition in the market can help to achieve an increased price
transparency level. Trading of balancing energy must also be non-discriminatory.
As it is argued that some traders might try to manipulate index prices by misreporting
trading to the daily price publications, efficient monitoring between traders on reported
prices, as well as auditing of the prices used to value the trading portfolios, can enhance
transparency and the reliability of the published prices [57].

THE OUTLOOK FOR A NATURAL GAS TRADING HUB IN SE EUROPE
177
Reliable delivery mechanism
Another important prerequisite for a successful gas market is a reliable delivery mechanism.
Shippers need to have uninterrupted access to capacity. Buyers need to be able to physically
receive gas and sellers need to be able to deliver gas. If there is not enough gas available in
the network, incentives have to be provided to the shippers to supply the network with gas.
Increased hub functionalities and back-up services can enhance the “firmness” of a hub and
improve the availability of gas volumes. Managing fluctuations in supply and demand is also
critical and can be reinforced with flexible storage facilities.
As far as the financial players are concerned, if there is not enough volume to back up the
physical delivery, the risk becomes higher for financial trading. A reliable delivery
mechanism preserves the link between the financial position and the physical need and
therefore, provides incentives for trading.
Standardization
Standardization (contracts with standard features and terms for trading) and making gas a
tradable commodity are essential for the ability of the hub to “pool” transactions such that
they can provide net positions. Creating standard products allows shippers and traders to
trade quantities of gas labelled as a “product” by their time of delivery. Moreover, creating
standard gas products that a number of companies can easily trade enables financial parties
to value the products and start trading them on the futures market [6].
In quantitative terms, there is a set of indicative criteria for assessing the functionality of a
wholesale gas market, established in the framework of the European Gas Target Model
(GTM1).
a. Churn rate
The churn rate, as already mentioned, is the volume of gas traded relative to physical
volume. According to the aforementioned model, churn rate must be greater than or equal
to 8.
b. Target Market zone size
Target market zone size, i.e. the consumption of gas by consumers within a market zone,
must be greater than or equal to 20 bcm (215 TWh).
c. Number of supply sources
The number of supply sources, which corresponds to the number of countries imports
originate from, must be at least 3.
d. HHI (Herfindahl Hirschman Index)
The Herfindahl Hirschman Index is a measure of concentration amongst suppliers based on
energy measured by firm. The Index must less than or equal to 2.000.
THE OUTLOOK FOR A NATURAL GAS TRADING HUB IN SE EUROPE
178
e. RSI (Residual Supply Index)
The Residual Supply Index is essentially the share of consumption which can be met without
the largest supplier based on supply capability, i.e. capacity (again on firm level). The RSI
must greater than or equal to 110% [58].
However, as the Gas Target Model is currently being revised, the above set of criteria will be
enriched with additional relevant criteria, which will constitute the criteria of the updated
Gas Target Model.
8.2.3. A NATURAL GAS HUB FOR SE EUROPE
A regional hub can provide a marketplace for shippers and traders from countries in the
region and hence enhance liquidity in the wholesale gas market of South Eastern Europe, a
region where market concentration remains high [54]. The operational framework of the
hub must be clearly defined, as a regional hub would span multiple regimes and regulatory
jurisdictions.
Regulation 715/2009 of the European Parliament and of the Council points out that in order
to enhance competition, it is important that natural gas can be traded independently in the
system. Therefore, network users need to be able to book entry and exit capacity
independently. This means that TSOs should have a de-coupled entry-exit system in place
[59].
According to a study prepared for the European Commission, “an entry-exit system is a gas
network access model which allows network users to book capacity rights independently at
entry and exit points, thereby creating gas transport through zones instead of along
contractual paths. The independence of entry and exit capacities is further supported by a
virtual trading point where network users who have booked entry or exit capacity can sell or
buy gas, respectively” [60]. The EU model of TSO entry/exit systems, therefore, inherently
incorporates virtual trading points. The establishment of such virtual trading points is of
course the vital step or prerequisite for the emergence of a virtual trading hub which, in our
case, is the ultimate goal.
Since the development of Regulation 715/2009, EU member states have been trying to
implement entry-exit systems and have developed different solutions while implementing
them. If a regional hub was created in South Eastern Europe, it would require an entry-exit
system across multiple TSOs, covering different regulatory systems.
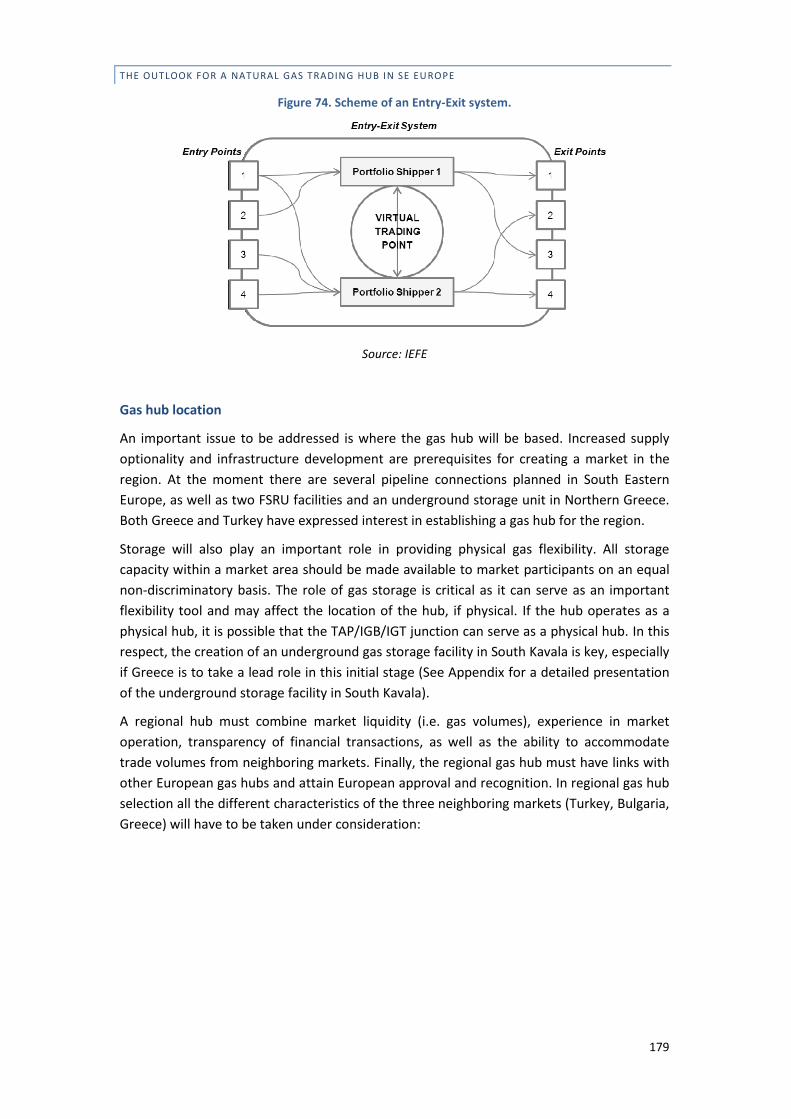
THE OUTLOOK FOR A NATURAL GAS TRADING HUB IN SE EUROPE
179
Figure 74. Scheme of an Entry-Exit system.
Source: IEFE
Gas hub location
An important issue to be addressed is where the gas hub will be based. Increased supply
optionality and infrastructure development are prerequisites for creating a market in the
region. At the moment there are several pipeline connections planned in South Eastern
Europe, as well as two FSRU facilities and an underground storage unit in Northern Greece.
Both Greece and Turkey have expressed interest in establishing a gas hub for the region.
Storage will also play an important role in providing physical gas flexibility. All storage
capacity within a market area should be made available to market participants on an equal
non-discriminatory basis. The role of gas storage is critical as it can serve as an important
flexibility tool and may affect the location of the hub, if physical. If the hub operates as a
physical hub, it is possible that the TAP/IGB/IGT junction can serve as a physical hub. In this
respect, the creation of an underground gas storage facility in South Kavala is key, especially
if Greece is to take a lead role in this initial stage (See Appendix for a detailed presentation
of the underground storage facility in South Kavala).
A regional hub must combine market liquidity (i.e. gas volumes), experience in market
operation, transparency of financial transactions, as well as the ability to accommodate
trade volumes from neighboring markets. Finally, the regional gas hub must have links with
other European gas hubs and attain European approval and recognition. In regional gas hub
selection all the different characteristics of the three neighboring markets (Turkey, Bulgaria,
Greece) will have to be taken under consideration:
THE OUTLOOK FOR A NATURAL GAS TRADING HUB IN SE EUROPE
180
8.2.3.1. THE CASE OF TURKEY
The Turkish economy, as well as Turkish energy demand, is growing rapidly. Turkey has the
largest energy market in the region in terms of volume and several entry points for both
pipeline transmission and LNG deliveries (6 at present, 8 potentially). The country can offer
gas supply diversification as it is very close to energy suppliers from the Caspian, the Middle
East, as well as the Mediterranean region. The country holds a strategic role in natural gas
transit as it is positioned between continental Europe and the significant natural gas
reserves of the Caspian Basin and the Middle East. The Turkish government is in favour of
creating a gas hub in Turkey, however the country is vulnerable to supply disruptions and its
pipeline capacity may not be enough to meet rising domestic demand and exports [61]. In
addition, the market is tightly controlled by BOTAŞ, which may not want to see the
flexibility, competition and free market deals that a hub regime implies.
Gas consumption is expected to continue to increase in Turkey as new gas-fired power
plants are put into operation. The resulting increased participation of natural gas in
electricity production can significantly contribute in enhancing competition in the Turkish
natural gas market. However, in Turkey there are regulatory constraints that may impede
the development of competition and the natural gas market in general, the most important
of which has been the provision in Natural Gas Market Law No. 4646, which does not allow
companies of the private sector to import pipeline gas directly from supplier countries that
already have a supply agreement with the TSO, i.e. BOTAŞ. Draft amendments to the Law
have excluded this provision.
Law No. 4646 also requires the legal unbundling of the transmission, storage and trade
activities of BOTAŞ, with a deadline for the 1st of January in 2015, so that an autonomous
TSO is in charge of the transmission network operation. No unbundling has been put into
effect to date, neither has a third-party access regime been introduced in Turkey, although
draft provisions of the aforementioned Law require that all storage capacity is made
available to third parties. Nevertheless, there is no equivalent requirement for LNG
terminals. It is clear that a third-party access regime that allows private investments in
transmission, storage and LNG terminals must be introduced at some point [62]. Energy
infrastructure and especially gas transport infrastructure, needs to be further developed.
However, the lack of reliable and transparent market prices and long term transit tariff
mechanisms holds up progress in energy infrastructure investments. One should also note
that natural gas prices are to a large extent subsidized in Turkey, since BOTAS provides
subsidized prices to distribution companies and wholesale consumers, such as Independent
Power Producers.
The liberalization of the power market was intended to be the locomotive for the
liberalization of the gas market, but its pace has slowed down. EPIAS, the Turkish energy
exchange, has not been formally incorporated yet and the start date of the platform
operation is in question, as it was initially announced that it would start operation by
October 2013. Nonetheless, Mustafa Karahan, vice chairman of Turkey's Energy Traders'
Association stated that the process of inviting private companies to apply to take a stake
could be completed by the end of the summer 2014.
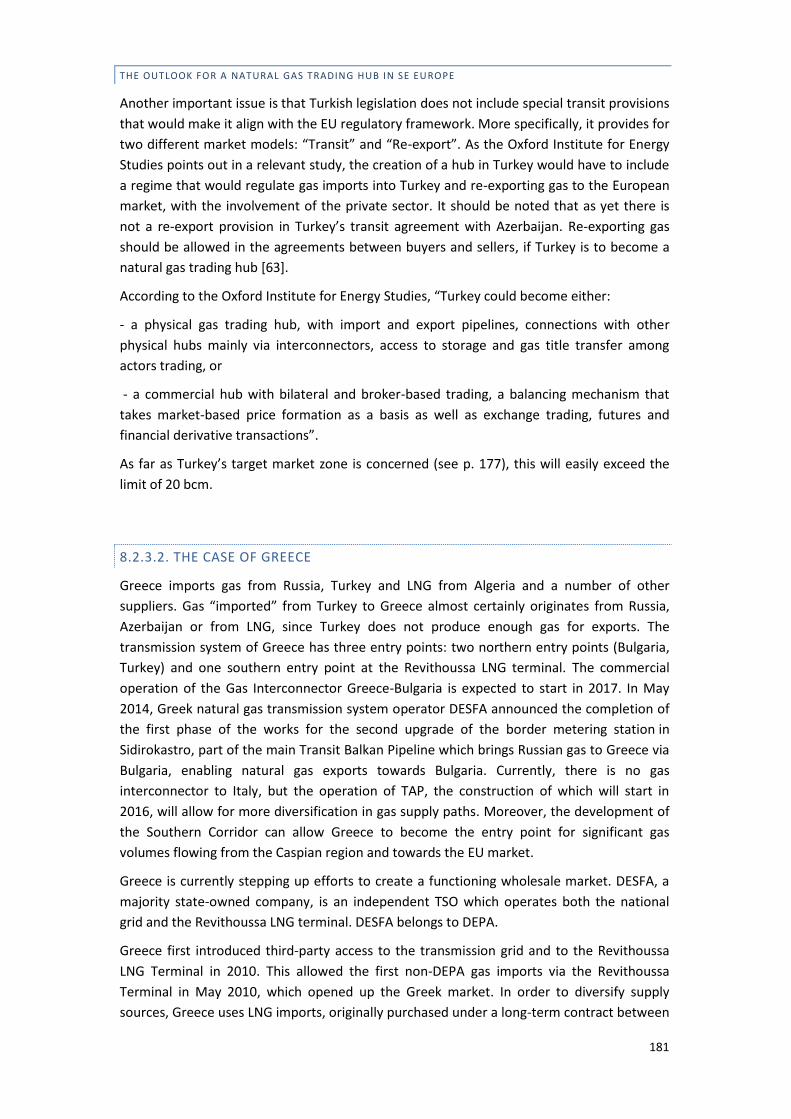
THE OUTLOOK FOR A NATURAL GAS TRADING HUB IN SE EUROPE
181
Another important issue is that Turkish legislation does not include special transit provisions
that would make it align with the EU regulatory framework. More specifically, it provides for
two different market models: “Transit” and “Re-export”. As the Oxford Institute for Energy
Studies points out in a relevant study, the creation of a hub in Turkey would have to include
a regime that would regulate gas imports into Turkey and re-exporting gas to the European
market, with the involvement of the private sector. It should be noted that as yet there is
not a re-export provision in Turkey’s transit agreement with Azerbaijan. Re-exporting gas
should be allowed in the agreements between buyers and sellers, if Turkey is to become a
natural gas trading hub [63].
According to the Oxford Institute for Energy Studies, “Turkey could become either:
- a physical gas trading hub, with import and export pipelines, connections with other
physical hubs mainly via interconnectors, access to storage and gas title transfer among
actors trading, or
- a commercial hub with bilateral and broker-based trading, a balancing mechanism that
takes market-based price formation as a basis as well as exchange trading, futures and
financial derivative transactions”.
As far as Turkey’s target market zone is concerned (see p. 177), this will easily exceed the
limit of 20 bcm.
8.2.3.2. THE CASE OF GREECE
Greece imports gas from Russia, Turkey and LNG from Algeria and a number of other
suppliers. Gas “imported” from Turkey to Greece almost certainly originates from Russia,
Azerbaijan or from LNG, since Turkey does not produce enough gas for exports. The
transmission system of Greece has three entry points: two northern entry points (Bulgaria,
Turkey) and one southern entry point at the Revithoussa LNG terminal. The commercial
operation of the Gas Interconnector Greece-Bulgaria is expected to start in 2017. In May
2014, Greek natural gas transmission system operator DESFA announced the completion of
the first phase of the works for the second upgrade of the border metering station in
Sidirokastro, part of the main Transit Balkan Pipeline which brings Russian gas to Greece via
Bulgaria, enabling natural gas exports towards Bulgaria. Currently, there is no gas
interconnector to Italy, but the operation of TAP, the construction of which will start in
2016, will allow for more diversification in gas supply paths. Moreover, the development of
the Southern Corridor can allow Greece to become the entry point for significant gas
volumes flowing from the Caspian region and towards the EU market.
Greece is currently stepping up efforts to create a functioning wholesale market. DESFA, a
majority state-owned company, is an independent TSO which operates both the national
grid and the Revithoussa LNG terminal. DESFA belongs to DEPA.
Greece first introduced third-party access to the transmission grid and to the Revithoussa
LNG Terminal in 2010. This allowed the first non-DEPA gas imports via the Revithoussa
Terminal in May 2010, which opened up the Greek market. In order to diversify supply
sources, Greece uses LNG imports, originally purchased under a long-term contract between
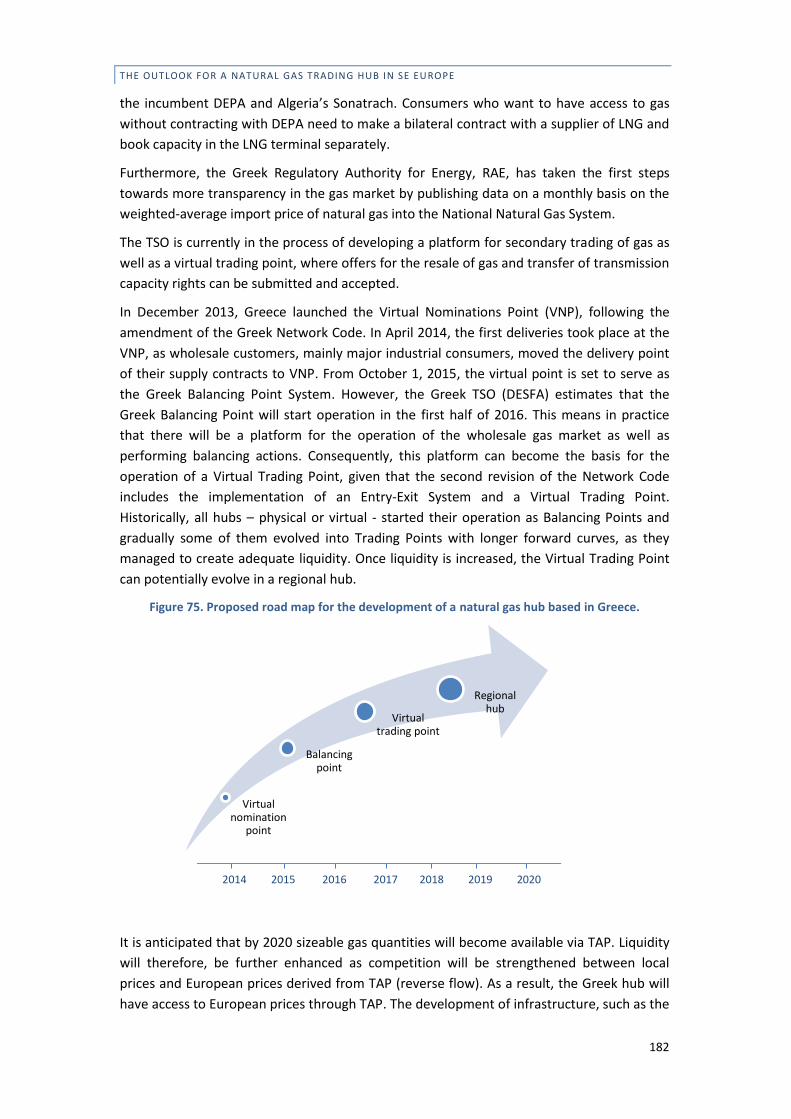
THE OUTLOOK FOR A NATURAL GAS TRADING HUB IN SE EUROPE
182
the incumbent DEPA and Algeria’s Sonatrach. Consumers who want to have access to gas
without contracting with DEPA need to make a bilateral contract with a supplier of LNG and
book capacity in the LNG terminal separately.
Furthermore, the Greek Regulatory Authority for Energy, RAE, has taken the first steps
towards more transparency in the gas market by publishing data on a monthly basis on the
weighted-average import price of natural gas into the National Natural Gas System.
The TSO is currently in the process of developing a platform for secondary trading of gas as
well as a virtual trading point, where offers for the resale of gas and transfer of transmission
capacity rights can be submitted and accepted.
In December 2013, Greece launched the Virtual Nominations Point (VNP), following the
amendment of the Greek Network Code. In April 2014, the first deliveries took place at the
VNP, as wholesale customers, mainly major industrial consumers, moved the delivery point
of their supply contracts to VNP. From October 1, 2015, the virtual point is set to serve as
the Greek Balancing Point System. However, the Greek TSO (DESFA) estimates that the
Greek Balancing Point will start operation in the first half of 2016. This means in practice
that there will be a platform for the operation of the wholesale gas market as well as
performing balancing actions. Consequently, this platform can become the basis for the
operation of a Virtual Trading Point, given that the second revision of the Network Code
includes the implementation of an Entry-Exit System and a Virtual Trading Point.
Historically, all hubs – physical or virtual - started their operation as Balancing Points and
gradually some of them evolved into Trading Points with longer forward curves, as they
managed to create adequate liquidity. Once liquidity is increased, the Virtual Trading Point
can potentially evolve in a regional hub.
Figure 75. Proposed road map for the development of a natural gas hub based in Greece.
2014 2015 2016 2017 2018 2019 2020
It is anticipated that by 2020 sizeable gas quantities will become available via TAP. Liquidity
will therefore, be further enhanced as competition will be strengthened between local
prices and European prices derived from TAP (reverse flow). As a result, the Greek hub will
have access to European prices through TAP. The development of infrastructure, such as the
Virtual nomination
point
Balancing point
Virtual trading point
Regional hub
THE OUTLOOK FOR A NATURAL GAS TRADING HUB IN SE EUROPE
183
planned underground gas storage facility in South Kavala, the FSRU facility in
Alexandroupolis and possibly another one in Kavala, and the IGB, will facilitate the access of
network users to the Greek gas market, and will contribute in initiating trading activities in
the Greek gas hub. In this context, Greece’s target market zone could equal or exceed the
limit of 20 bcm, as the broader geographical area of its market will, in addition to its
domestic market, encompass Bulgaria, Romania and part of Turkey.
The regulatory framework is already in line with the Third Energy Package and this puts
Greece a few steps ahead compared to its neighbours, in terms of market liberalization.
Greece also has further advantage over its neighbouring countries, as it is part of the
Eurozone and uses the Euro for all its trading. In addition, the operation of the VNP acts in
favour of Greece as well, since it is the only active VNP in the region. Furthermore, the
Greek stock market is governed by strict operation rules, which promote transparency and
are in line with the European Union regulatory framework. On that account, the Greek stock
market could easily offer gas futures trading, for delivery in the Greek gas hub. Hence, if by
2020 the trading platform is in full operation and Greece has set up the primary and
secondary market, it will have a competitive advantage over the neighbouring countries.
On the other hand, low demand in the market due to the Greek economic crisis could
restrain the development of the necessary liquidity. Delays in market liberalization of the
neighbouring gas markets could also prevent traders who are active in the region from
accessing the Greek gas market and vice versa. Finally, the fact that TAP will not come into
operation until around 2020, as well as the fact that other necessary infrastructure is not
yet available, may also delay the creation of adequate liquidity in the market.
The creation of an underground storage facility is absolutely necessary, as the Greek gas
market needs to be able to provide storage services to gas suppliers. Gas suppliers tend to
bind to storage capacity and execute trades close to the physical location of the storage
facility.
8.2.3.3. THE CASE OF ROMANIA
Romania has a long history in gas exploration and production, as it has the third largest gas
reserves in the EU. As a result, it is one of the EU countries least dependent on Russian gas
imports. However, Romania’s hydrocarbon reserves are old and big investments in new
extraction technologies are required in order to boost productivity. OMV Petrom, the
largest Romanian oil company, has an ambitious investment programme of about €1 billion
per year over the next few years. Exploring offshore fields is another – yet more expensive -
option for Romania. Romania also holds significant shale gas reserves, with the technically
recoverable reserves having been estimated at 1,61 bcm by EIA. However, as in the cases of
other European countries, in Romania there were extensive protests against shale gas
exploration [64].
Romania is obliged to comply with EU requirements for gas market liberalization and
unbundling. The legal unbundling of the distribution and supply activities of
distribution/supply operators was completed in 2007 – 2008. The state owns the majority of
THE OUTLOOK FOR A NATURAL GAS TRADING HUB IN SE EUROPE
184
shares in Transgaz SA, the Transmission System Operator for gas. The OPCOM gas exchange
is already in operation, with OMV Petrom Gas putting OPCOM gas for auction for the first
time in February 2014.
In the Romanian gas market natural gas price is still not based on offer and demand, but is a
‘basket price’ set by ANRE, the Romanian National Regulatory Authority, i.e. an average of
domestic and import prices weighted with the respective quantities. However, complying
with the EU regulatory framework will eventually lead to abandoning the subsidized “social”
tariff. Gas market liberalization is expected to be completed by the end of 2014, with a
possible extension to December 31, 2015.
Romania is interconnected with Hungary, while reverse flow interconnections with Bulgaria
and Moldova are to be completed in 2014. More specifically, a new two-way high-pressure
natural gas interconnection between Romania and Bulgaria is planned to become
operational in the summer 2014. This project is expected to increase the security of supply
for natural gas by diversifying gas sources within Romania and Bulgaria, as well as within the
region (Greece, Hungary and Turkey). With the full development of Shaz Deniz II field – not
achievable before 2020 - the aforementioned interconnectors will be able to supply
Romania with Azerbaijani gas [65].
It should also be mentioned that Romania hoped to host part of the Nabucco gas pipeline,
but it abandoned its plans when it was decided by the Shah Deniz II Consortium to select
the TAP project for transporting gas from Azerbaijan to the EU. The AGRI Project
(Azerbaijan-Georgia-Romania Interconnector) could also prove to be a new way for
Romania to access the gas reserves in the Caspian region. By materializing the AGRI project,
Azerbaijani gas will be transported via pipeline to the Black Sea coast of Georgia, where the
gas will be liquefied at a special terminal and directed afterwards towards Romania and
other European countries via LNG vessels. The feasibility study for this project is being
concluded.
8.2.3.4. THE CASE OF BULGARIA
Bulgaria is a small market, but will soon become the European entry point for the South
Stream pipeline. At present, it has one entry point and 4 potential ones. It also has the
advantage that it operates within EU jurisdiction.
Bulgaria needs desperately to diversify its gas supply sources. It should be noted that in
2012 Bulgaria relied on Russia for 99% of its gas supplies. In January 2009 Bulgaria was hit
by the shock of gas supply disruption from the Russian Federation. The construction of new
pipeline interconnections is envisaged by the European Commission as a means of
increasing security of energy supply and this is why it has decided to fund cross-border gas
pipeline projects, including the Greece-Bulgaria interconnector.
The participation of Bulgaria in the EU Internal Gas Market proves to be a difficult task as
the natural gas sector has still certain inefficiencies to overcome.
Bulgarian Energy Holding is a state enterprise and holds monopoly rights for gas supply and
transmission, through its subsidiaries Bulgargaz EAD, the state natural gas distribution
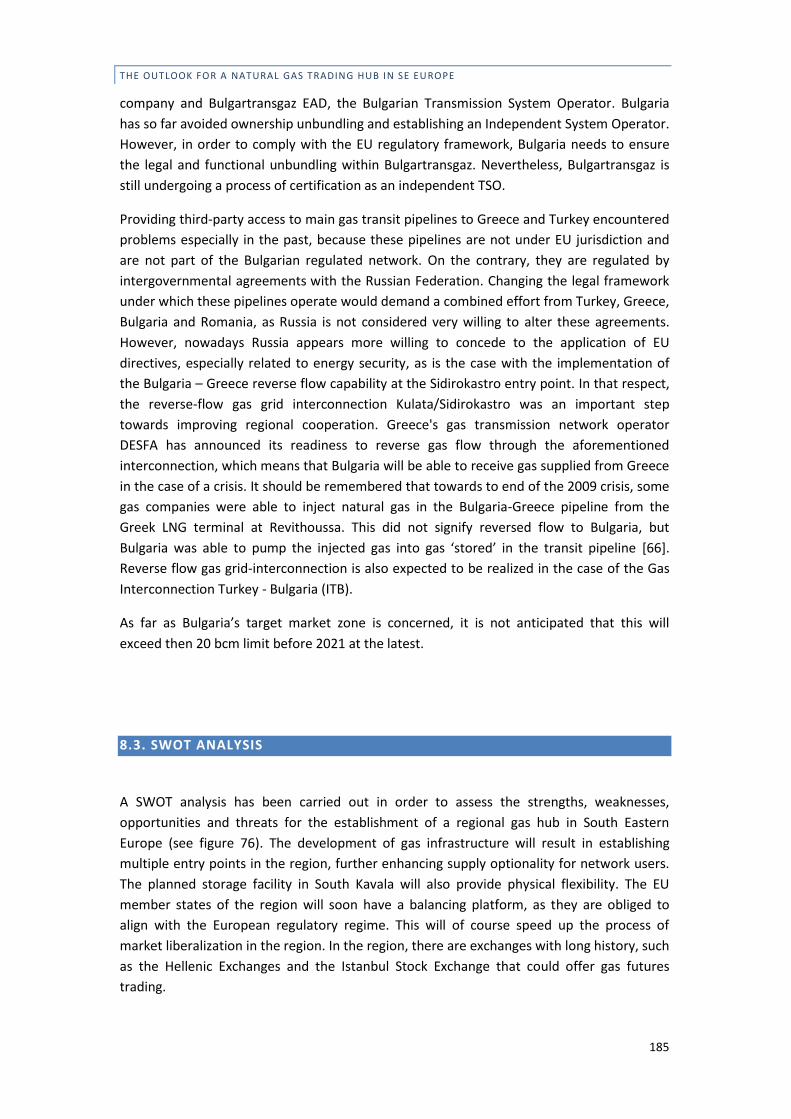
THE OUTLOOK FOR A NATURAL GAS TRADING HUB IN SE EUROPE
185
company and Bulgartransgaz EAD, the Bulgarian Transmission System Operator. Bulgaria
has so far avoided ownership unbundling and establishing an Independent System Operator.
However, in order to comply with the EU regulatory framework, Bulgaria needs to ensure
the legal and functional unbundling within Bulgartransgaz. Nevertheless, Bulgartransgaz is
still undergoing a process of certification as an independent TSO.
Providing third-party access to main gas transit pipelines to Greece and Turkey encountered
problems especially in the past, because these pipelines are not under EU jurisdiction and
are not part of the Bulgarian regulated network. On the contrary, they are regulated by
intergovernmental agreements with the Russian Federation. Changing the legal framework
under which these pipelines operate would demand a combined effort from Turkey, Greece,
Bulgaria and Romania, as Russia is not considered very willing to alter these agreements.
However, nowadays Russia appears more willing to concede to the application of EU
directives, especially related to energy security, as is the case with the implementation of
the Bulgaria – Greece reverse flow capability at the Sidirokastro entry point. In that respect,
the reverse-flow gas grid interconnection Kulata/Sidirokastro was an important step
towards improving regional cooperation. Greece's gas transmission network operator
DESFA has announced its readiness to reverse gas flow through the aforementioned
interconnection, which means that Bulgaria will be able to receive gas supplied from Greece
in the case of a crisis. It should be remembered that towards to end of the 2009 crisis, some
gas companies were able to inject natural gas in the Bulgaria-Greece pipeline from the
Greek LNG terminal at Revithoussa. This did not signify reversed flow to Bulgaria, but
Bulgaria was able to pump the injected gas into gas ‘stored’ in the transit pipeline [66].
Reverse flow gas grid-interconnection is also expected to be realized in the case of the Gas
Interconnection Turkey - Bulgaria (ITB).
As far as Bulgaria’s target market zone is concerned, it is not anticipated that this will
exceed then 20 bcm limit before 2021 at the latest.
8.3. SWOT ANALYSIS
A SWOT analysis has been carried out in order to assess the strengths, weaknesses,
opportunities and threats for the establishment of a regional gas hub in South Eastern
Europe (see figure 76). The development of gas infrastructure will result in establishing
multiple entry points in the region, further enhancing supply optionality for network users.
The planned storage facility in South Kavala will also provide physical flexibility. The EU
member states of the region will soon have a balancing platform, as they are obliged to
align with the European regulatory regime. This will of course speed up the process of
market liberalization in the region. In the region, there are exchanges with long history, such
as the Hellenic Exchanges and the Istanbul Stock Exchange that could offer gas futures
trading.
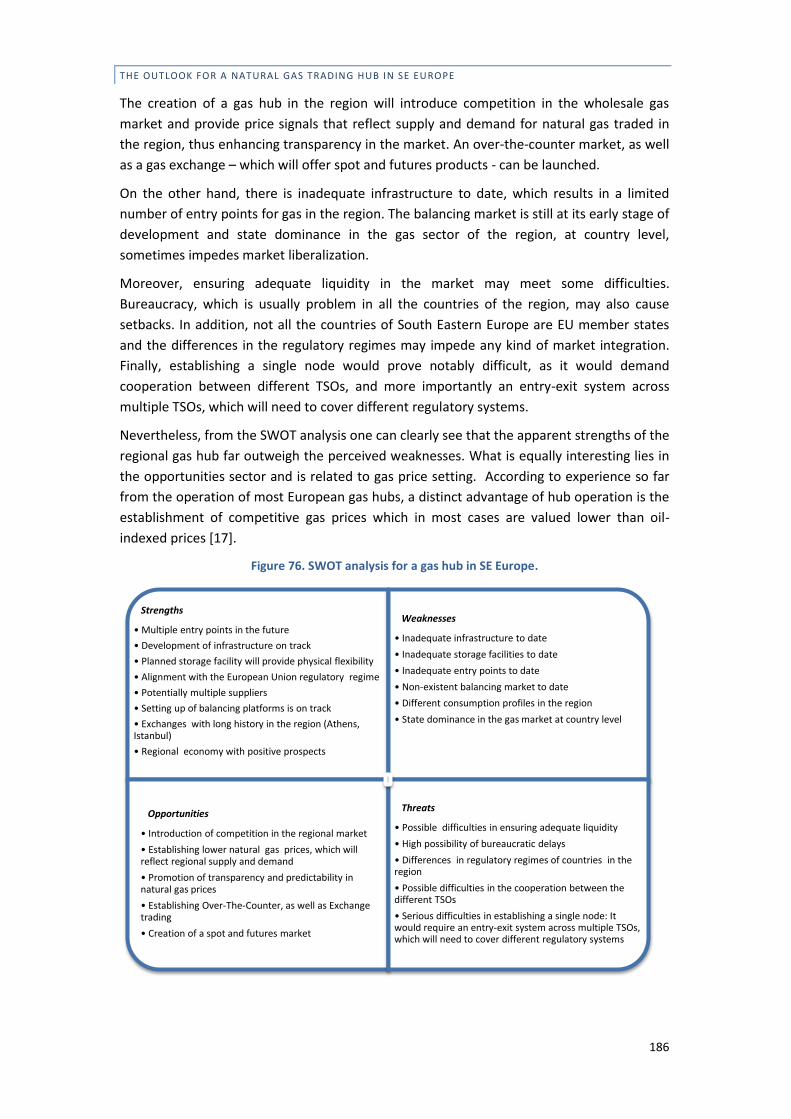
THE OUTLOOK FOR A NATURAL GAS TRADING HUB IN SE EUROPE
186
The creation of a gas hub in the region will introduce competition in the wholesale gas
market and provide price signals that reflect supply and demand for natural gas traded in
the region, thus enhancing transparency in the market. An over-the-counter market, as well
as a gas exchange – which will offer spot and futures products - can be launched.
On the other hand, there is inadequate infrastructure to date, which results in a limited
number of entry points for gas in the region. The balancing market is still at its early stage of
development and state dominance in the gas sector of the region, at country level,
sometimes impedes market liberalization.
Moreover, ensuring adequate liquidity in the market may meet some difficulties.
Bureaucracy, which is usually problem in all the countries of the region, may also cause
setbacks. In addition, not all the countries of South Eastern Europe are EU member states
and the differences in the regulatory regimes may impede any kind of market integration.
Finally, establishing a single node would prove notably difficult, as it would demand
cooperation between different TSOs, and more importantly an entry-exit system across
multiple TSOs, which will need to cover different regulatory systems.
Nevertheless, from the SWOT analysis one can clearly see that the apparent strengths of the
regional gas hub far outweigh the perceived weaknesses. What is equally interesting lies in
the opportunities sector and is related to gas price setting. According to experience so far
from the operation of most European gas hubs, a distinct advantage of hub operation is the
establishment of competitive gas prices which in most cases are valued lower than oil-
indexed prices [17].
Figure 76. SWOT analysis for a gas hub in SE Europe.
Strengths
• Multiple entry points in the future
• Development of infrastructure on track
• Planned storage facility will provide physical flexibility
• Alignment with the European Union regulatory regime
• Potentially multiple suppliers
• Setting up of balancing platforms is on track
• Exchanges with long history in the region (Athens, Istanbul)
• Regional economy with positive prospects
Weaknesses
• Inadequate infrastructure to date
• Inadequate storage facilities to date
• Inadequate entry points to date
• Non-existent balancing market to date
• Different consumption profiles in the region
• State dominance in the gas market at country level
Opportunities
• Introduction of competition in the regional market
• Establishing lower natural gas prices, which will reflect regional supply and demand
• Promotion of transparency and predictability in natural gas prices
• Establishing Over-The-Counter, as well as Exchange trading
• Creation of a spot and futures market
Threats
• Possible difficulties in ensuring adequate liquidity
• High possibility of bureaucratic delays
• Differences in regulatory regimes of countries in the region
• Possible difficulties in the cooperation between the different TSOs
• Serious difficulties in establishing a single node: It would require an entry-exit system across multiple TSOs, which will need to cover different regulatory systems
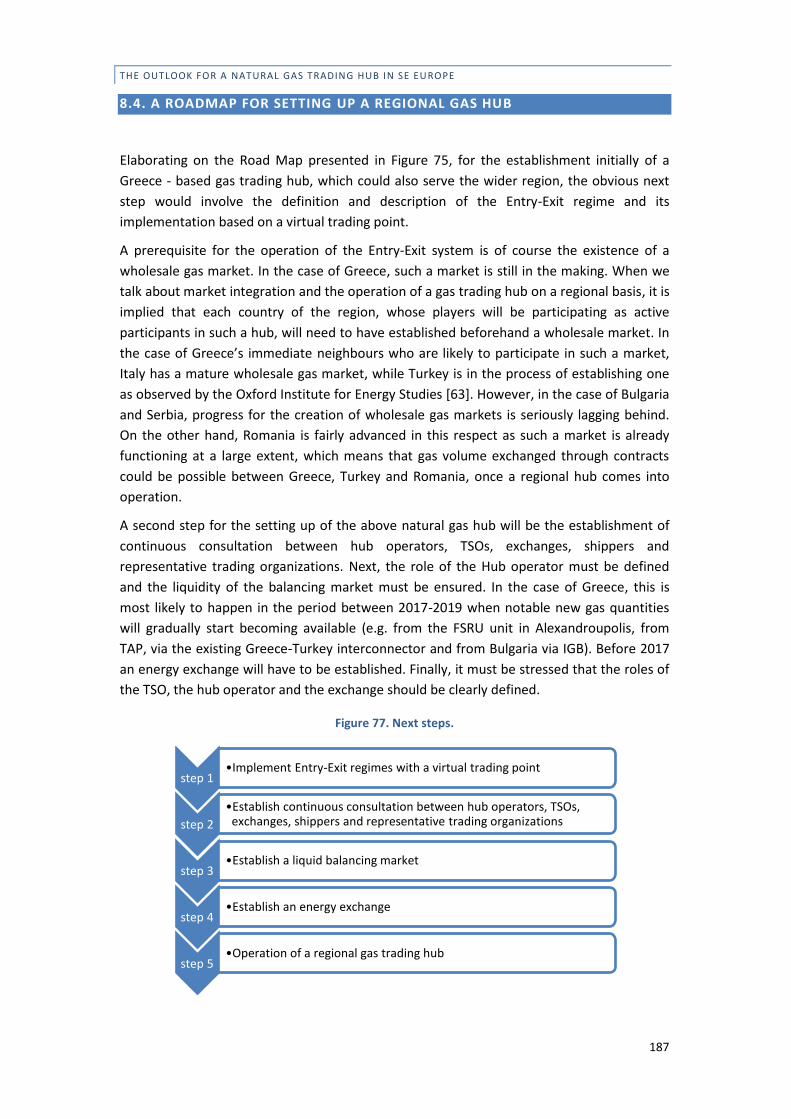
THE OUTLOOK FOR A NATURAL GAS TRADING HUB IN SE EUROPE
187
8.4. A ROADMAP FOR SETTING UP A REGIONAL GAS HUB
Elaborating on the Road Map presented in Figure 75, for the establishment initially of a
Greece - based gas trading hub, which could also serve the wider region, the obvious next
step would involve the definition and description of the Entry-Exit regime and its
implementation based on a virtual trading point.
A prerequisite for the operation of the Entry-Exit system is of course the existence of a
wholesale gas market. In the case of Greece, such a market is still in the making. When we
talk about market integration and the operation of a gas trading hub on a regional basis, it is
implied that each country of the region, whose players will be participating as active
participants in such a hub, will need to have established beforehand a wholesale market. In
the case of Greece’s immediate neighbours who are likely to participate in such a market,
Italy has a mature wholesale gas market, while Turkey is in the process of establishing one
as observed by the Oxford Institute for Energy Studies [63]. However, in the case of Bulgaria
and Serbia, progress for the creation of wholesale gas markets is seriously lagging behind.
On the other hand, Romania is fairly advanced in this respect as such a market is already
functioning at a large extent, which means that gas volume exchanged through contracts
could be possible between Greece, Turkey and Romania, once a regional hub comes into
operation.
A second step for the setting up of the above natural gas hub will be the establishment of
continuous consultation between hub operators, TSOs, exchanges, shippers and
representative trading organizations. Next, the role of the Hub operator must be defined
and the liquidity of the balancing market must be ensured. In the case of Greece, this is
most likely to happen in the period between 2017-2019 when notable new gas quantities
will gradually start becoming available (e.g. from the FSRU unit in Alexandroupolis, from
TAP, via the existing Greece-Turkey interconnector and from Bulgaria via IGB). Before 2017
an energy exchange will have to be established. Finally, it must be stressed that the roles of
the TSO, the hub operator and the exchange should be clearly defined.
Figure 77. Next steps.
step 1 •Implement Entry-Exit regimes with a virtual trading point
step 2
•Establish continuous consultation between hub operators, TSOs, exchanges, shippers and representative trading organizations
step 3 •Establish a liquid balancing market
step 4 •Establish an energy exchange
step 5 •Operation of a regional gas trading hub
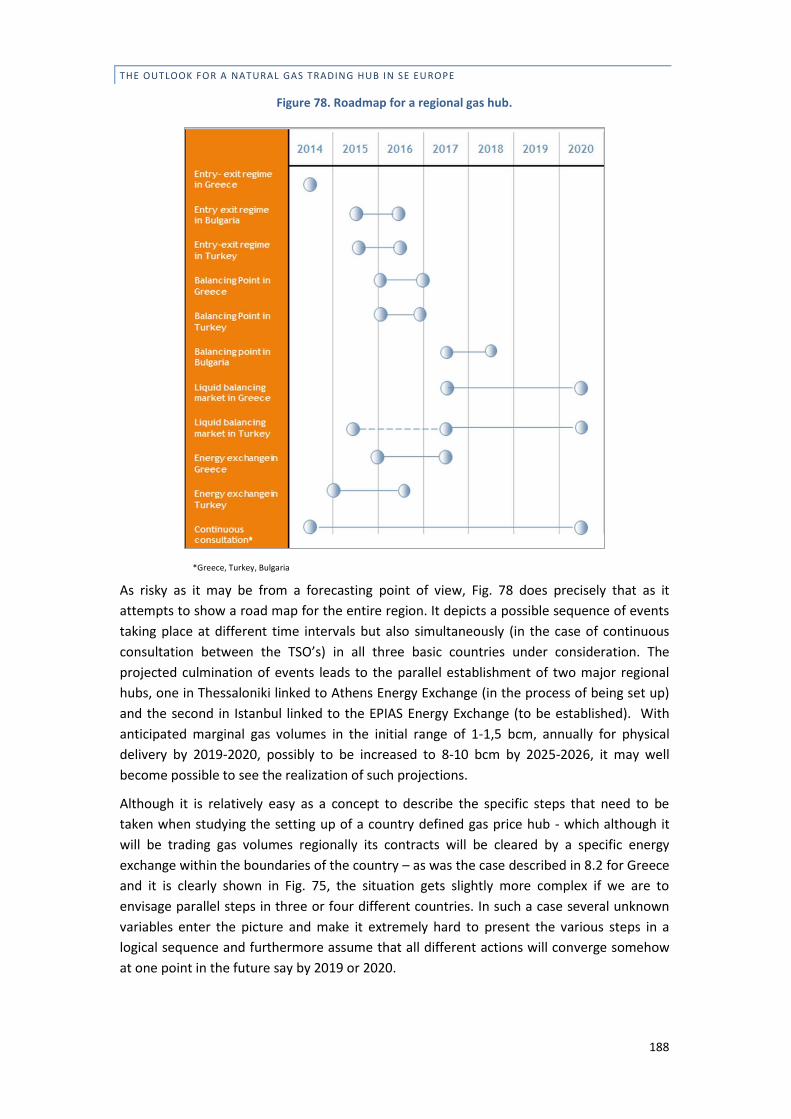
THE OUTLOOK FOR A NATURAL GAS TRADING HUB IN SE EUROPE
188
Figure 78. Roadmap for a regional gas hub.
*Greece, Turkey, Bulgaria
As risky as it may be from a forecasting point of view, Fig. 78 does precisely that as it
attempts to show a road map for the entire region. It depicts a possible sequence of events
taking place at different time intervals but also simultaneously (in the case of continuous
consultation between the TSO’s) in all three basic countries under consideration. The
projected culmination of events leads to the parallel establishment of two major regional
hubs, one in Thessaloniki linked to Athens Energy Exchange (in the process of being set up)
and the second in Istanbul linked to the EPIAS Energy Exchange (to be established). With
anticipated marginal gas volumes in the initial range of 1-1,5 bcm, annually for physical
delivery by 2019-2020, possibly to be increased to 8-10 bcm by 2025-2026, it may well
become possible to see the realization of such projections.
Although it is relatively easy as a concept to describe the specific steps that need to be
taken when studying the setting up of a country defined gas price hub - which although it
will be trading gas volumes regionally its contracts will be cleared by a specific energy
exchange within the boundaries of the country – as was the case described in 8.2 for Greece
and it is clearly shown in Fig. 75, the situation gets slightly more complex if we are to
envisage parallel steps in three or four different countries. In such a case several unknown
variables enter the picture and make it extremely hard to present the various steps in a
logical sequence and furthermore assume that all different actions will converge somehow
at one point in the future say by 2019 or 2020.
THE OUTLOOK FOR A NATURAL GAS TRADING HUB IN SE EUROPE
189
The broad concept is for the two regional gas hubs (in Thessaloniki and Istanbul) to handle
between them the anticipated gas volumes that will be generated following the opening up
of the regional gas market. A lot will depend on the trading conditions that each Energy
Exchange will offer in terms of charges, speed of execution and clearance of orders and
transparency. In a sense, having two regional exchanges will help considerably from a
geographical aspect as the Istanbul one will take care of trades directed eastwards while the
Thessaloniki one will deal with trades to the west and to the North. This proposed division
of trading responsibility is of course one of several possible scenarios, but in our view it
encompasses several advantages, the most important of which is the notion of competition
(between the two hubs) right from the start. This will inevitably help to speed up
developments in establishing the hub(s) and attracting active participants (traders).
Charting a Road Map for the introduction of free and competitive gas trading to cover the
south part of the SE Europe Region is by necessity based on certain arbitrary, but realistic
assumptions at this early stage. On the one hand, we have the gradual and planned steps by
Greece’s TSO for the setting up of a Virtual Nomination Point and Balancing Point as clearly
foreseen in the EU Directive and on the other hand we have the ever growing Turkish gas
market and its dynamic gas companies which will seek to establish sooner or later a trading
platform to take care of their internal trading requirements. Establishing such a platform
will by necessity lead to the formation of a much bigger, i.e. regional, trading hub.

THE OUTLOOK FOR A NATURAL GAS TRADING HUB IN SE EUROPE
190
Picture 37. The Thessaloniki and Istanbul Gas Trading Hubs will between them cover a wide geographical range and adjacent trading zones.
THE OUTLOOK FOR A NATURAL GAS TRADING HUB IN SE EUROPE
191
9. ECONOMIC IMPLICATIONS FROM
THE OPERATION OF A GAS HUB IN SE
EUROPE – A DISCUSSION
From whichever perspective one should examine the setting up and operation of a regional
gas trading hub, there are important economic implications involved. However, the precise
impact of an operating gas trading hub on market conditions is hard to predict and even
harder to quantify, the reason being that we are introducing a completely new approach,
together with a new and inclusive price-setting regime into a market where none existed
before; other than bilateral negotiations based on strict oil-indexed contracts. These
bilateral arrangements still determine the price of gas in our region – Bulgaria, Serbia,
Romania, Greece, Turkey – which is predominantly supplied via pipeline. In the case of
Greece and Turkey there is a certain differentiation, since both countries satisfy about 10-
20% of their needs from LNG imports, which are priced differently, although oil is still used
as the basis.
On the other hand, it is relatively easy to categorize the economic parameters involved that
should be taken into consideration in the ensuing discussion. These can be itemized as
follows:
a. The minimum level of investment required in gas infrastructure work to enable the
availability of adequate gas quantities to be traded through the hub.
b. The origin of gas to be supplied and to be traded through the hub, together with
their recent price history (i.e. average quarterly prices over the last five years)
c. The anticipated volume of gas to be traded through the hub and the forecast churn
ratio.
In order to discuss the economic implications from the operation of the proposed regional
gas trading hub, a number of assumptions have to be made in terms of geography,
infrastructure and its cost, prospective gas supplies and their origin, and anticipated trading
conditions. These assumptions are summarized as follows:
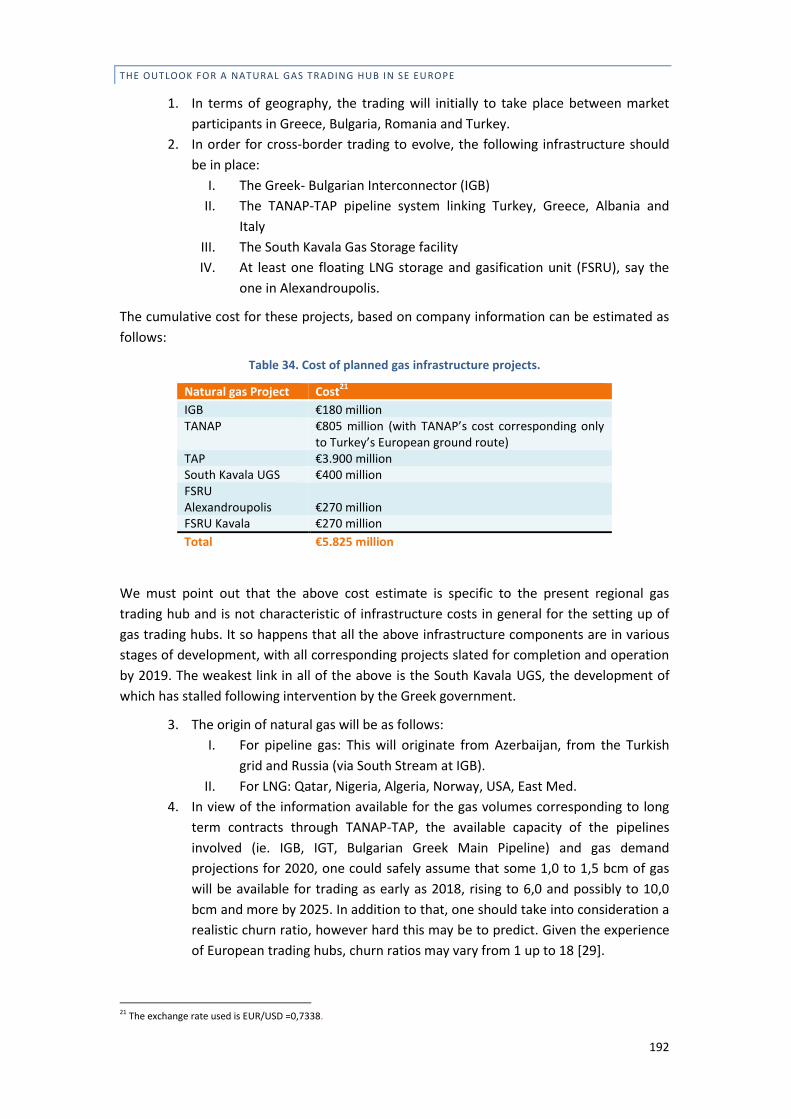
THE OUTLOOK FOR A NATURAL GAS TRADING HUB IN SE EUROPE
192
1. In terms of geography, the trading will initially to take place between market
participants in Greece, Bulgaria, Romania and Turkey.
2. In order for cross-border trading to evolve, the following infrastructure should
be in place:
I. The Greek- Bulgarian Interconnector (IGB)
II. The TANAP-TAP pipeline system linking Turkey, Greece, Albania and
Italy
III. The South Kavala Gas Storage facility
IV. At least one floating LNG storage and gasification unit (FSRU), say the
one in Alexandroupolis.
The cumulative cost for these projects, based on company information can be estimated as
follows:
Table 34. Cost of planned gas infrastructure projects.
Natural gas Project Cost21
IGB €180 million TANAP €805 million (with TANAP’s cost corresponding only
to Turkey’s European ground route) TAP €3.900 million South Kavala UGS €400 million FSRU Alexandroupolis
€270 million
FSRU Kavala €270 million
Total €5.825 million
We must point out that the above cost estimate is specific to the present regional gas
trading hub and is not characteristic of infrastructure costs in general for the setting up of
gas trading hubs. It so happens that all the above infrastructure components are in various
stages of development, with all corresponding projects slated for completion and operation
by 2019. The weakest link in all of the above is the South Kavala UGS, the development of
which has stalled following intervention by the Greek government.
3. The origin of natural gas will be as follows:
I. For pipeline gas: This will originate from Azerbaijan, from the Turkish
grid and Russia (via South Stream at IGB).
II. For LNG: Qatar, Nigeria, Algeria, Norway, USA, East Med.
4. In view of the information available for the gas volumes corresponding to long
term contracts through TANAP-TAP, the available capacity of the pipelines
involved (ie. IGB, IGT, Bulgarian Greek Main Pipeline) and gas demand
projections for 2020, one could safely assume that some 1,0 to 1,5 bcm of gas
will be available for trading as early as 2018, rising to 6,0 and possibly to 10,0
bcm and more by 2025. In addition to that, one should take into consideration a
realistic churn ratio, however hard this may be to predict. Given the experience
of European trading hubs, churn ratios may vary from 1 up to 18 [29].
21 The exchange rate used is EUR/USD =0,7338.
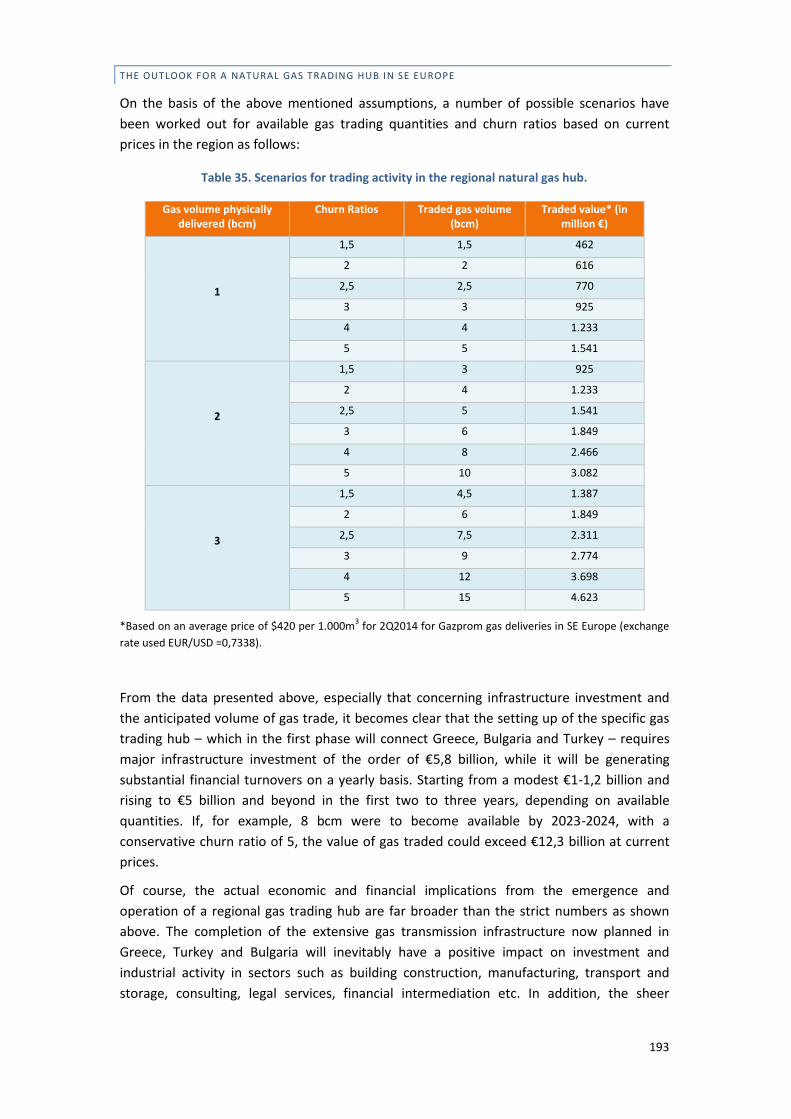
THE OUTLOOK FOR A NATURAL GAS TRADING HUB IN SE EUROPE
193
On the basis of the above mentioned assumptions, a number of possible scenarios have
been worked out for available gas trading quantities and churn ratios based on current
prices in the region as follows:
Table 35. Scenarios for trading activity in the regional natural gas hub.
Gas volume physically delivered (bcm)
Churn Ratios Traded gas volume (bcm)
Traded value* (in million €)
1
1,5 1,5 462
2 2 616
2,5 2,5 770
3 3 925
4 4 1.233
5 5 1.541
2
1,5 3 925
2 4 1.233
2,5 5 1.541
3 6 1.849
4 8 2.466
5 10 3.082
3
1,5 4,5 1.387
2 6 1.849
2,5 7,5 2.311
3 9 2.774
4 12 3.698
5 15 4.623
*Based on an average price of $420 per 1.000m3 for 2Q2014 for Gazprom gas deliveries in SE Europe (exchange
rate used EUR/USD =0,7338).
From the data presented above, especially that concerning infrastructure investment and
the anticipated volume of gas trade, it becomes clear that the setting up of the specific gas
trading hub – which in the first phase will connect Greece, Bulgaria and Turkey – requires
major infrastructure investment of the order of €5,8 billion, while it will be generating
substantial financial turnovers on a yearly basis. Starting from a modest €1-1,2 billion and
rising to €5 billion and beyond in the first two to three years, depending on available
quantities. If, for example, 8 bcm were to become available by 2023-2024, with a
conservative churn ratio of 5, the value of gas traded could exceed €12,3 billion at current
prices.
Of course, the actual economic and financial implications from the emergence and
operation of a regional gas trading hub are far broader than the strict numbers as shown
above. The completion of the extensive gas transmission infrastructure now planned in
Greece, Turkey and Bulgaria will inevitably have a positive impact on investment and
industrial activity in sectors such as building construction, manufacturing, transport and
storage, consulting, legal services, financial intermediation etc. In addition, the sheer
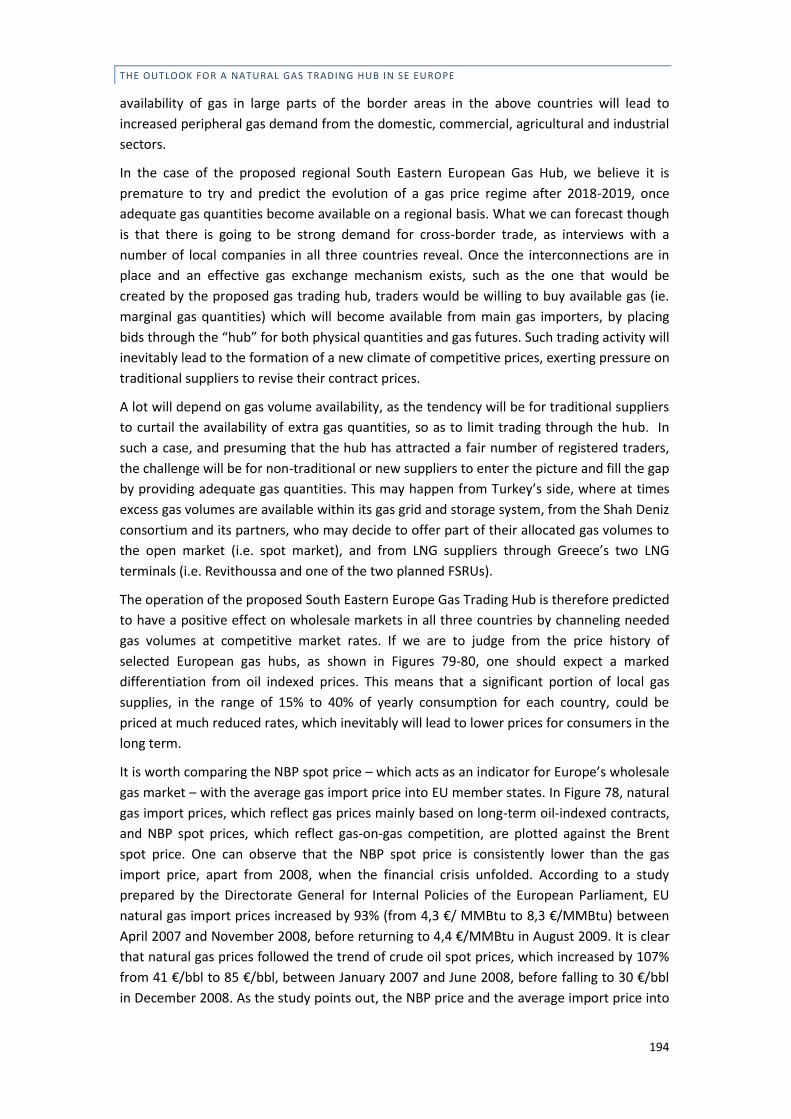
THE OUTLOOK FOR A NATURAL GAS TRADING HUB IN SE EUROPE
194
availability of gas in large parts of the border areas in the above countries will lead to
increased peripheral gas demand from the domestic, commercial, agricultural and industrial
sectors.
In the case of the proposed regional South Eastern European Gas Hub, we believe it is
premature to try and predict the evolution of a gas price regime after 2018-2019, once
adequate gas quantities become available on a regional basis. What we can forecast though
is that there is going to be strong demand for cross-border trade, as interviews with a
number of local companies in all three countries reveal. Once the interconnections are in
place and an effective gas exchange mechanism exists, such as the one that would be
created by the proposed gas trading hub, traders would be willing to buy available gas (ie.
marginal gas quantities) which will become available from main gas importers, by placing
bids through the “hub” for both physical quantities and gas futures. Such trading activity will
inevitably lead to the formation of a new climate of competitive prices, exerting pressure on
traditional suppliers to revise their contract prices.
A lot will depend on gas volume availability, as the tendency will be for traditional suppliers
to curtail the availability of extra gas quantities, so as to limit trading through the hub. In
such a case, and presuming that the hub has attracted a fair number of registered traders,
the challenge will be for non-traditional or new suppliers to enter the picture and fill the gap
by providing adequate gas quantities. This may happen from Turkey’s side, where at times
excess gas volumes are available within its gas grid and storage system, from the Shah Deniz
consortium and its partners, who may decide to offer part of their allocated gas volumes to
the open market (i.e. spot market), and from LNG suppliers through Greece’s two LNG
terminals (i.e. Revithoussa and one of the two planned FSRUs).
The operation of the proposed South Eastern Europe Gas Trading Hub is therefore predicted
to have a positive effect on wholesale markets in all three countries by channeling needed
gas volumes at competitive market rates. If we are to judge from the price history of
selected European gas hubs, as shown in Figures 79-80, one should expect a marked
differentiation from oil indexed prices. This means that a significant portion of local gas
supplies, in the range of 15% to 40% of yearly consumption for each country, could be
priced at much reduced rates, which inevitably will lead to lower prices for consumers in the
long term.
It is worth comparing the NBP spot price – which acts as an indicator for Europe’s wholesale
gas market – with the average gas import price into EU member states. In Figure 78, natural
gas import prices, which reflect gas prices mainly based on long-term oil-indexed contracts,
and NBP spot prices, which reflect gas-on-gas competition, are plotted against the Brent
spot price. One can observe that the NBP spot price is consistently lower than the gas
import price, apart from 2008, when the financial crisis unfolded. According to a study
prepared by the Directorate General for Internal Policies of the European Parliament, EU
natural gas import prices increased by 93% (from 4,3 €/ MMBtu to 8,3 €/MMBtu) between
April 2007 and November 2008, before returning to 4,4 €/MMBtu in August 2009. It is clear
that natural gas prices followed the trend of crude oil spot prices, which increased by 107%
from 41 €/bbl to 85 €/bbl, between January 2007 and June 2008, before falling to 30 €/bbl
in December 2008. As the study points out, the NBP price and the average import price into
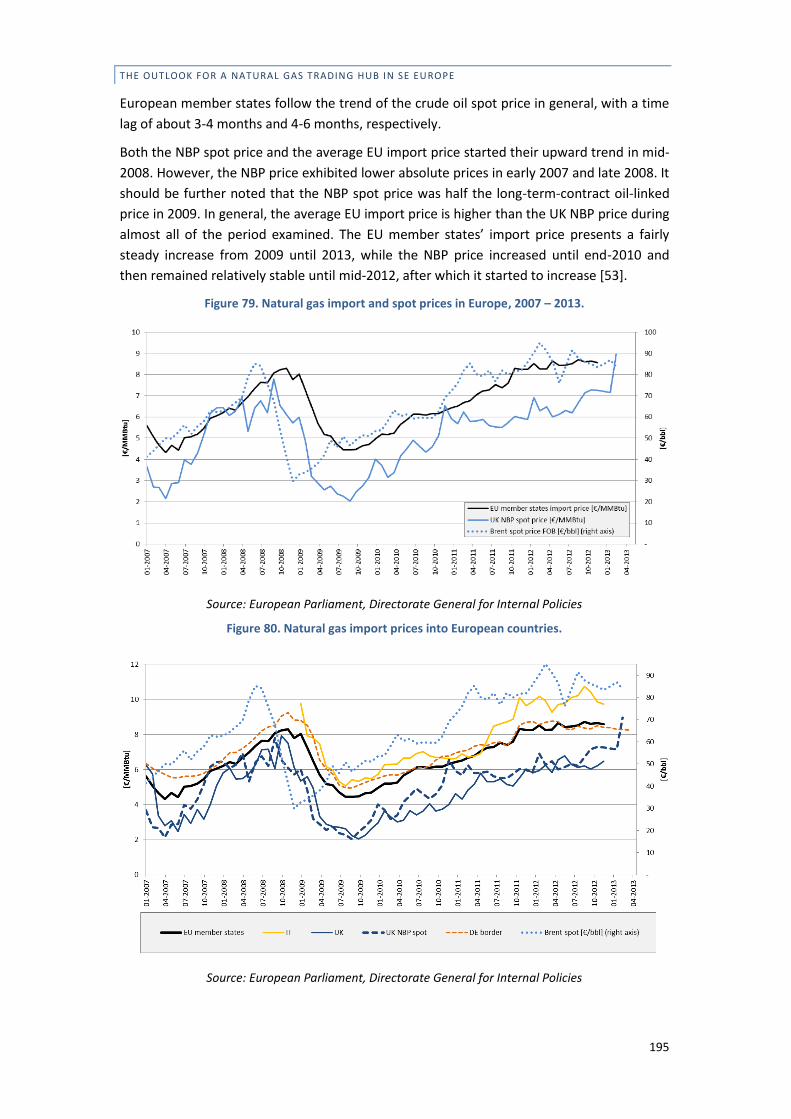
THE OUTLOOK FOR A NATURAL GAS TRADING HUB IN SE EUROPE
195
European member states follow the trend of the crude oil spot price in general, with a time
lag of about 3-4 months and 4-6 months, respectively.
Both the NBP spot price and the average EU import price started their upward trend in mid-
2008. However, the NBP price exhibited lower absolute prices in early 2007 and late 2008. It
should be further noted that the NBP spot price was half the long-term-contract oil-linked
price in 2009. In general, the average EU import price is higher than the UK NBP price during
almost all of the period examined. The EU member states’ import price presents a fairly
steady increase from 2009 until 2013, while the NBP price increased until end-2010 and
then remained relatively stable until mid-2012, after which it started to increase [53].
Figure 79. Natural gas import and spot prices in Europe, 2007 – 2013.
Source: European Parliament, Directorate General for Internal Policies
Figure 80. Natural gas import prices into European countries.
Source: European Parliament, Directorate General for Internal Policies

THE OUTLOOK FOR A NATURAL GAS TRADING HUB IN SE EUROPE
196
Figures 79 and 80 are the most appropriate when discussing the financial implications from
the operation of a gas trading hub in our region, as they show the notable difference in
prevailing prices between oil-indexed contracts and spot prices. Although it is difficult, at
this stage, to predict market behaviour and its reflection on spot prices, once the hub enters
full operation, based on European hub operation experience, one could safely assume that
spot prices determined through hub trading will be lower than oil-indexed ones. Of course,
this is not the only positive financial implication arising from a hub operation. The attraction
of sizeable tradable gas volumes and the trading activity arising from this will help to
reassure markets in terms of gas availability and security of supply.
THE OUTLOOK FOR A NATURAL GAS TRADING HUB IN SE EUROPE
197
10. CONCLUSIONS
1. There is a definite trend in European gas markets for gas volumes to be traded
through gas hubs, several of which have been established and are operating
successfully in many EU countries. Already nine (9) such hubs are in operation and
more are planned over the next one to two years.
2. Trading gas hubs come under two broad categories:
i. physical gas trading hubs, with import and export pipelines, connections with
other physical hubs mainly via interconnectors, access to storage and gas title
transfer among actors trading, and
ii. commercial hubs with bilateral and broker-based trading, a balancing
mechanism that takes market-based price formation as a basis as well as
exchange trading, futures and financial derivative transactions.
It should be noted that gas trading hubs are not necessarily limited to strict
geographical boundaries as participants tend to trade gas volumes over extended
boundaries. Therefore, the concept of gas hubs capable of serving the need of a wider
region is fast gaining ground.
3. Historical records from the operation of European gas trading hubs over the last ten
years show that spot prices for gas volumes traded through the hubs are markedly
lower than corresponding prices for long term oil indexed contracts.
4. In view of pressing European gas market needs to meet demand from a diversified
supply base and planned new transit routes and interconnectors in the SE European
region, coupled with increased storage capacity and new LNG terminals, available
gas volumes in the region are set to increase sustainability by 2018-2020.
5. On the basis of presently contracted gas volumes to be transited through SE Europe
by 2018-2019, it appears that market liquidity will substantially increase over the
next few years with a parallel rise of gas trading opportunities
6. Today there is not one gas trading hub (or hubs) serving the needs of the SE
European region. The Vienna-based CEGH is the nearest such hub which at present
serves the needs of Central European countries.

THE OUTLOOK FOR A NATURAL GAS TRADING HUB IN SE EUROPE
198
7. The background is already set for the planning and establishment of one or two gas
trading hubs which will serve the needs of the broader SE European region enabling
market participants in Greece, Bulgaria, Romania, Turkey and possibly Serbia, to
participate in gas trading activities.
8. Already the TSOs of the countries in the region, Stock Exchanges, key market players
and other stake holders are actively exploring the possibilities and prospects of
establishing gas trading hubs.
9. The EU’s role through its existing legislation and Directives is crucial towards the
establishment of suitable conditions (i.e. balancing point and virtual trading point)
in the various country members of the region, which will allow free and competitive
gas trading.
10. In order for one or more regional gas trading hubs to be established market liquidity
must increase considerably. For this to happen a series of key infrastructure projects
(i.e. TAP-TANAP, IGB, South Kavala UGS, FSRUs) must be implemented, construction
and operation of which must converge in 2018-2019.
11. From the analysis undertaken in the present study it is concluded that the process
for the setting up and operation of at least two regional gas trading hubs has been
set in motion. A road map for the establishment of these hubs is presented based
on certain realistic assumptions.
12. The broad concept is for two regional gas hubs (possibly in Thessaloniki and
Istanbul) to handle between them the anticipated gas volumes that will be
generated following the opening up of the regional gas market. A lot will depend
though, on the trading conditions that each Energy Exchange will offer in terms of
accessibility, charges, speed of execution and clearance of orders and transparency.
In a sense, having two regional exchanges will help considerably from a
geographical aspect as the Istanbul one could take care of trades directed
eastwards while the Thessaloniki one could deal with trades to the West and the
North.
13. The financial implications arising from the operation of these two likely hubs are
considerable both in terms of planned infrastructure investment (of the order of
€6,0 billion) and in terms of traded volumes (in excess of €4,0 billion per year with
conservative churn ratios and minimal quantities).
14. A SWOT analysis has revealed far more strengths and opportunities than
weaknesses and threats.
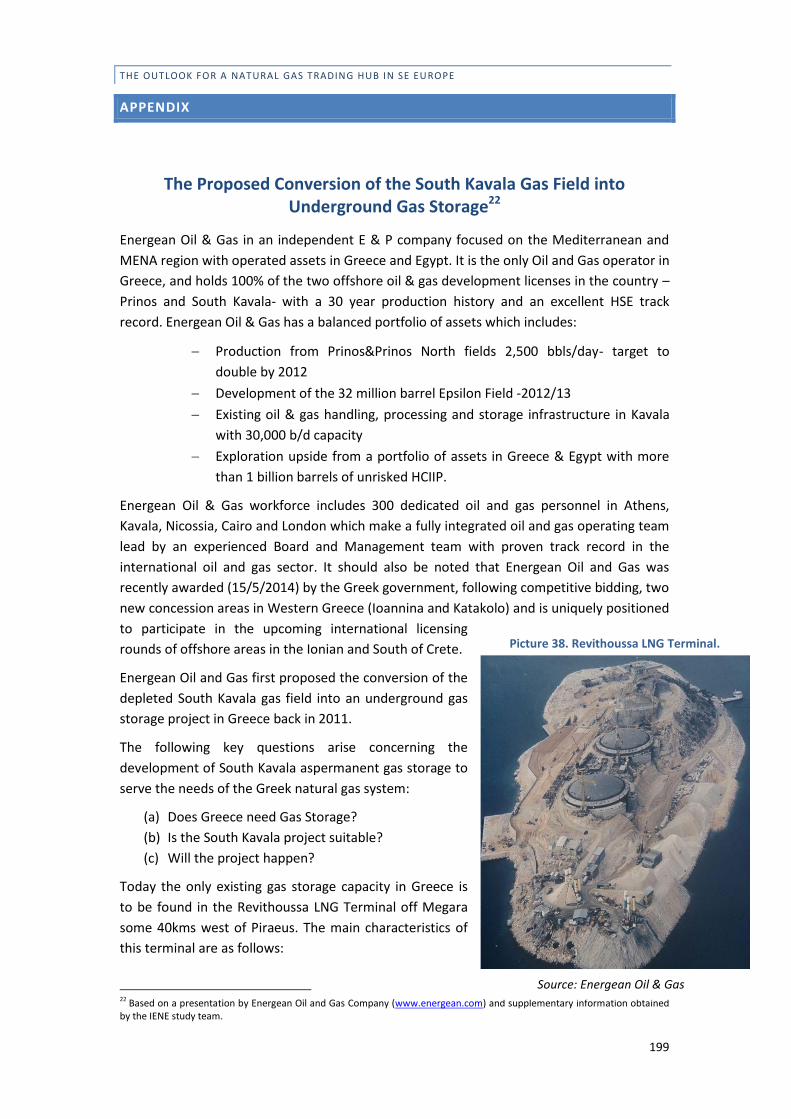
THE OUTLOOK FOR A NATURAL GAS TRADING HUB IN SE EUROPE
199
APPENDIX
The Proposed Conversion of the South Kavala Gas Field into Underground Gas Storage22
Energean Oil & Gas in an independent E & P company focused on the Mediterranean and
MENA region with operated assets in Greece and Egypt. It is the only Oil and Gas operator in
Greece, and holds 100% of the two offshore oil & gas development licenses in the country –
Prinos and South Kavala- with a 30 year production history and an excellent HSE track
record. Energean Oil & Gas has a balanced portfolio of assets which includes:
Production from Prinos&Prinos North fields 2,500 bbls/day- target to
double by 2012
Development of the 32 million barrel Epsilon Field -2012/13
Existing oil & gas handling, processing and storage infrastructure in Kavala
with 30,000 b/d capacity
Exploration upside from a portfolio of assets in Greece & Egypt with more
than 1 billion barrels of unrisked HCIIP.
Energean Oil & Gas workforce includes 300 dedicated oil and gas personnel in Athens,
Kavala, Nicossia, Cairo and London which make a fully integrated oil and gas operating team
lead by an experienced Board and Management team with proven track record in the
international oil and gas sector. It should also be noted that Energean Oil and Gas was
recently awarded (15/5/2014) by the Greek government, following competitive bidding, two
new concession areas in Western Greece (Ioannina and Katakolo) and is uniquely positioned
to participate in the upcoming international licensing
rounds of offshore areas in the Ionian and South of Crete.
Energean Oil and Gas first proposed the conversion of the
depleted South Kavala gas field into an underground gas
storage project in Greece back in 2011.
The following key questions arise concerning the
development of South Kavala aspermanent gas storage to
serve the needs of the Greek natural gas system:
(a) Does Greece need Gas Storage?
(b) Is the South Kavala project suitable?
(c) Will the project happen?
Today the only existing gas storage capacity in Greece is
to be found in the Revithoussa LNG Terminal off Megara
some 40kms west of Piraeus. The main characteristics of
this terminal are as follows:
22 Based on a presentation by Energean Oil and Gas Company (www.energean.com) and supplementary information obtained by the IENE study team.
Picture 38. Revithoussa LNG Terminal.
Source: Energean Oil & Gas
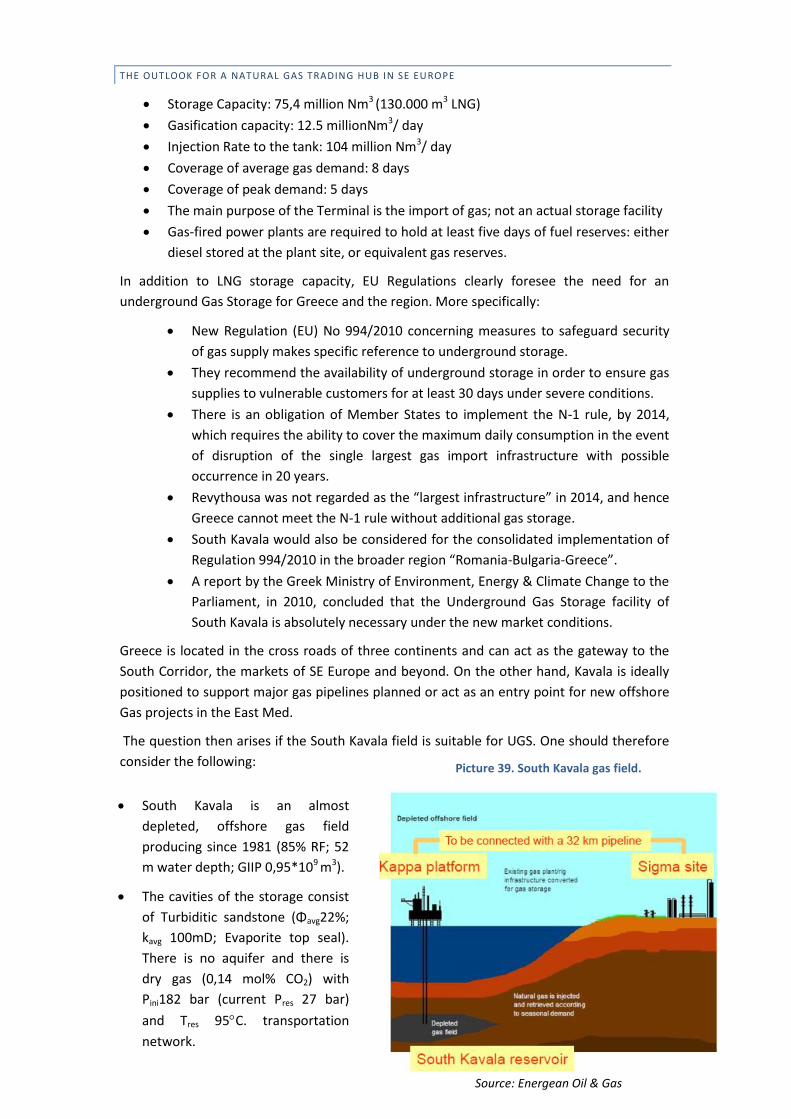
THE OUTLOOK FOR A NATURAL GAS TRADING HUB IN SE EUROPE
200
Storage Capacity: 75,4 million Nm3 (130.000 m3 LNG)
Gasification capacity: 12.5 millionNm3/ day
Injection Rate to the tank: 104 million Nm3/ day
Coverage of average gas demand: 8 days
Coverage of peak demand: 5 days
The main purpose of the Terminal is the import of gas; not an actual storage facility
Gas-fired power plants are required to hold at least five days of fuel reserves: either
diesel stored at the plant site, or equivalent gas reserves.
In addition to LNG storage capacity, EU Regulations clearly foresee the need for an
underground Gas Storage for Greece and the region. More specifically:
New Regulation (EU) No 994/2010 concerning measures to safeguard security
of gas supply makes specific reference to underground storage.
They recommend the availability of underground storage in order to ensure gas
supplies to vulnerable customers for at least 30 days under severe conditions.
There is an obligation of Member States to implement the N-1 rule, by 2014,
which requires the ability to cover the maximum daily consumption in the event
of disruption of the single largest gas import infrastructure with possible
occurrence in 20 years.
Revythousa was not regarded as the “largest infrastructure” in 2014, and hence
Greece cannot meet the N-1 rule without additional gas storage.
South Kavala would also be considered for the consolidated implementation of
Regulation 994/2010 in the broader region “Romania-Bulgaria-Greece”.
A report by the Greek Ministry of Environment, Energy & Climate Change to the
Parliament, in 2010, concluded that the Underground Gas Storage facility of
South Kavala is absolutely necessary under the new market conditions.
Greece is located in the cross roads of three continents and can act as the gateway to the
South Corridor, the markets of SE Europe and beyond. On the other hand, Kavala is ideally
positioned to support major gas pipelines planned or act as an entry point for new offshore
Gas projects in the East Med.
The question then arises if the South Kavala field is suitable for UGS. One should therefore
consider the following:
South Kavala is an almost
depleted, offshore gas field
producing since 1981 (85% RF; 52
m water depth; GIIP 0,95*109 m3).
The cavities of the storage consist
of Turbiditic sandstone (Φavg22%;
kavg 100mD; Evaporite top seal).
There is no aquifer and there is
dry gas (0,14 mol% CO2) with
Pini182 bar (current Pres 27 bar)
and Tres 95C. transportation
network.
Picture 39. South Kavala gas field.
Source: Energean Oil & Gas
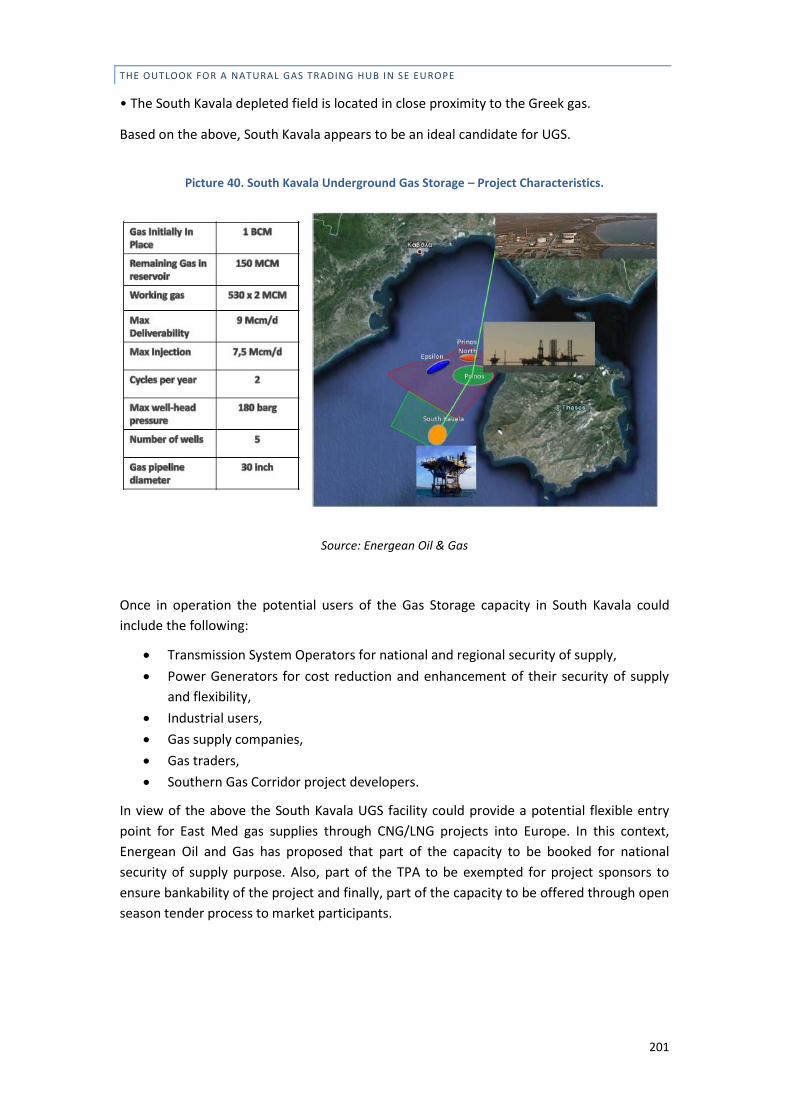
THE OUTLOOK FOR A NATURAL GAS TRADING HUB IN SE EUROPE
201
• The South Kavala depleted field is located in close proximity to the Greek gas.
Based on the above, South Kavala appears to be an ideal candidate for UGS.
Picture 40. South Kavala Underground Gas Storage – Project Characteristics.
Source: Energean Oil & Gas
Once in operation the potential users of the Gas Storage capacity in South Kavala could
include the following:
Transmission System Operators for national and regional security of supply,
Power Generators for cost reduction and enhancement of their security of supply
and flexibility,
Industrial users,
Gas supply companies,
Gas traders,
Southern Gas Corridor project developers.
In view of the above the South Kavala UGS facility could provide a potential flexible entry
point for East Med gas supplies through CNG/LNG projects into Europe. In this context,
Energean Oil and Gas has proposed that part of the capacity to be booked for national
security of supply purpose. Also, part of the TPA to be exempted for project sponsors to
ensure bankability of the project and finally, part of the capacity to be offered through open
season tender process to market participants.
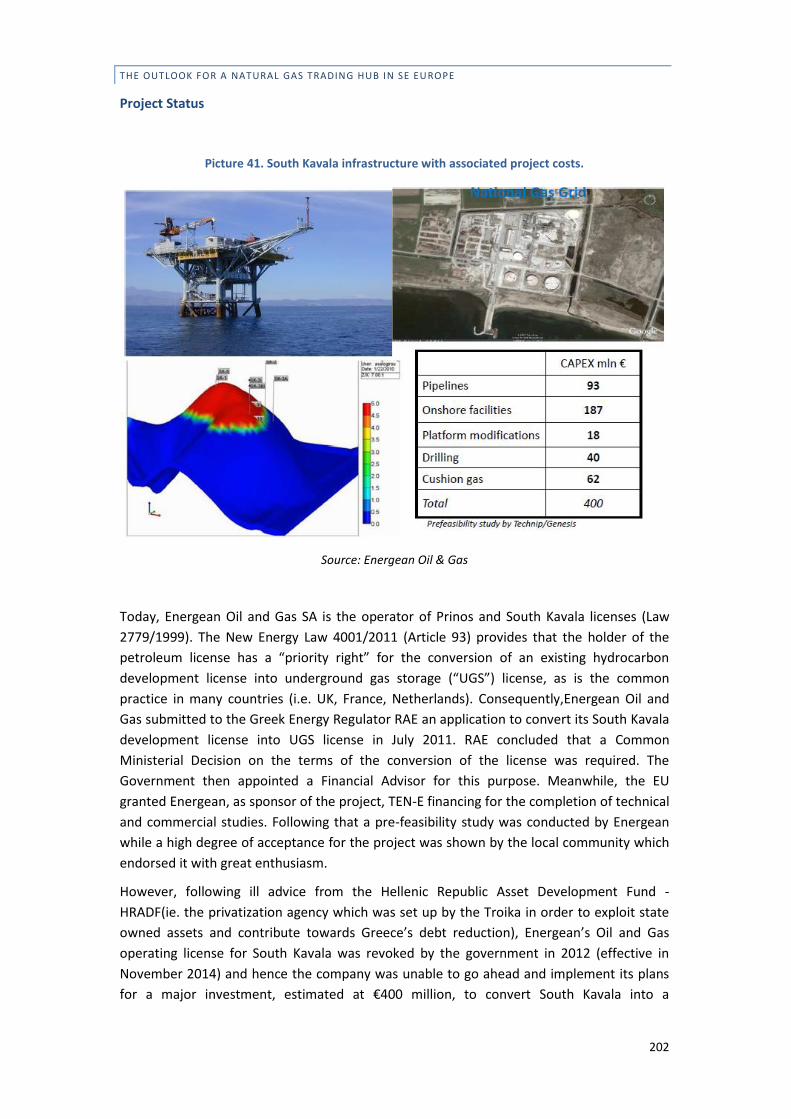
THE OUTLOOK FOR A NATURAL GAS TRADING HUB IN SE EUROPE
202
Project Status
Picture 41. South Kavala infrastructure with associated project costs.
Source: Energean Oil & Gas
Today, Energean Oil and Gas SA is the operator of Prinos and South Kavala licenses (Law
2779/1999). The New Energy Law 4001/2011 (Article 93) provides that the holder of the
petroleum license has a “priority right” for the conversion of an existing hydrocarbon
development license into underground gas storage (“UGS”) license, as is the common
practice in many countries (i.e. UK, France, Netherlands). Consequently,Energean Oil and
Gas submitted to the Greek Energy Regulator RAE an application to convert its South Kavala
development license into UGS license in July 2011. RAE concluded that a Common
Ministerial Decision on the terms of the conversion of the license was required. The
Government then appointed a Financial Advisor for this purpose. Meanwhile, the EU
granted Energean, as sponsor of the project, TEN-E financing for the completion of technical
and commercial studies. Following that a pre-feasibility study was conducted by Energean
while a high degree of acceptance for the project was shown by the local community which
endorsed it with great enthusiasm.
However, following ill advice from the Hellenic Republic Asset Development Fund -
HRADF(ie. the privatization agency which was set up by the Troika in order to exploit state
owned assets and contribute towards Greece’s debt reduction), Energean’s Oil and Gas
operating license for South Kavala was revoked by the government in 2012 (effective in
November 2014) and hence the company was unable to go ahead and implement its plans
for a major investment, estimated at €400 million, to convert South Kavala into a
THE OUTLOOK FOR A NATURAL GAS TRADING HUB IN SE EUROPE
203
permanent underground storage facility. Ownership and exploitation rights for South Kavala
were accordingly returned to the state as foreseen by law 2001/2011, and without the
government examining at all Energean’s Oil and Gas investment plans for South Kavala as it
was clearly obliged to do, (again under law 2001/2011) prior to revoking its license. So far
HRADF has shown no interest whatsoever in developing this project as it clearly lacks the
technical and administrative capability and investment drive to organize an international
tender (which by law is obliged to do).
In Brief
A number of questions naturally arise with regard to the South Kavala USG project and the
government’s poor handling of the matter so far:
Does Greece Need Gas Storage?
Today, there is effectively no Gas Storage in the country
EU regulations require Greece to have more storage capacity
The market participants need more storage capacity
Competition in the market will be introduced
Is South Kavala Suitable for a UGS project?
It is an ideal gas reservoir with a readily available operator that has a 30
year production history and excellent HSE track record
The existing offshore and onshore infrastructure with proximity to the
national gas grid, as well as the planned regional gas pipeline network,
make the South Kaval USG an ideal project to implement
Being the only depleted gas reservoir in Greece makes it unique in the
region
As far as the project status is concerned the following summarize the present situation:
The legal framework is in place mainly through energy law (2001/2011) and the
existing licensing status of Energean Oil and Gas.
There are strong project sponsors while the combination of the reservoir and local
knowledge, technical and financial strength can ensure the seamless execution of
the project.
The Hellenic Republic Asset Development Fund (HRDAF)which now has sole
responsibility of the project- and does not require any further approvals by the
government-needs to go ahead and organize an international tender and invite bids
for the award of the license to convert the South Kavala field into a permanent
underground storage facility and operate it accordingly.
Unfortunately, HRDAF has not provided any indication as to its intentions
concerning a firm timetable for the project’s implementation.
THE OUTLOOK FOR A NATURAL GAS TRADING HUB IN SE EUROPE
204
BIBLIOGRAPHY
[1] The Oxford Institute for Energy Studies, Beatrice Petrovich, "European gas hubs: how strong is
price correlation?," October 2013.
[2] The Oxford Institute for Energy Studies, "Continental European Gas Hubs: Are they fit for
purpose?," 2012.
[3] Princeton University Press, "Over-the- counter Markets," [Online]. Available:
http://press.princeton.edu/.
[4] International Energy Agency (IEA), "Gas ricing and regulation. China's Challenges and IEA
experience.," 2012.
[5] ICIS Heren, "European Gas Hubs," in Florence School of Regulation, 2010.
[6] International Energy Agency (IEA), "Developing a Natural Gas Trading Hub in Asia," 2013.
[7] The Oxford Institute for Energy Studies, "The Evolution and Functioning of the Traded Gas
Market in Britain," August 2010.
[8] IEFE - Centre for Research on Energy and Environmental Economics and Policy at Bocconi
University, "Balancing Systems and Flexibility Tools in European Gas Markets," 2014.
[9] Gasunie Transport Services, 2014. [Online]. Available: http://www.gasunietransportservices.nl/.
[10] ICE Endex, 2014. [Online]. Available: http://www.iceendex.com/market-data/spot-markets/ttf-
spot/ttf-spot-index-methodology/.
[11] Central European Gas Hub AG, "7th CEGH Workshop," 5 December 2013.
[12] Central European Gas Hub AG , [Online]. Available: http://www.cegh.at/.
[13] The Huberator, [Online]. Available: http://www.huberator.com/.
[14] European Commission, DG Energy , "Quarterly Report on European Gas Markets, Volume 5,"
2012.
[15] International Energy Agency , "Oil and Gas Emergency Policy - Germany 2012 update," 2012.
[16] NetConnect Germany, [Online]. Available: http://www.net-connect-germany.de.
[17] The Oxford Institute for Energy Studies, Jonathan Stern and Howard Rogers, "The Transition to
Hub-Based Gas Pricing in Continental Europe," 2011.
[18] Carnegie Endowment For International Peace, "Natural gas pricing and its future - Europe as the
Battleground," 2012.
[19] Commission de régulation de l'énergie (CRE), [Online]. Available: http://www.cre.fr/.
[20] European Commission, Market Observatory for Energy, DG Energy, "Quarterly Report on
European Gas Markets (Volume 6, issue 2)," 2013.
[21] Patrick Heather, "Growth factors for European Gas Hubs," in Relazione Annuale 2012 del Gestore
dei Mercati Energetici, Rome, July 10 2013.
[22] International Gas Union (IGU), "Wholesale Gas Price Formation 2012 - A global review of drivers
and regional trends".
[23] International Gas Union (IGU), "Wholesale Gas Price Survey - 2013 Edition - A global review of
price formation mechanisms 2005 -2012".
[24] Kjersti Hegde,Eirik Fjeldstad, "The future of European Long-Term Natural Gas Contracts," Bergen
Energi, 2010.
[25] Instytut Sobieskiego, Robert Zajdler, "The future of gas pricing in long-term contracts in Central
THE OUTLOOK FOR A NATURAL GAS TRADING HUB IN SE EUROPE
205
Eastern Europe," 2012.
[26] Timera Energy, [Online]. Available: http://www.timera-energy.com/.
[27] Karsten Neuhoff and Christian von Hirschhausen, "Long-term vs. Short-term Contracts: A
European Perspective on Natural Gas," 2005.
[28] Michele Polo, Carlo Scarpa, "Liberalizing the gas industry: Take-or-pay contracts, retail
competition and wholesale trade," International Journal of Industrial Organization, 2013.
[29] Patrick Heather, "Growth factors for European gas hubs," in Relazione Annuale 2012 del Gestore
dei Mercati Energetici, 2013.
[30] Gazprom Export, Sergei Komlev, "Pricing the “Invisible” Commodity," 2013.
[31] The Oxford Institute for Energy Studies, Jonathan Stern and Howard Rogers, "The Pricing of
Internationally Traded Gas: the search for new fundamentals," in IEEJ, 2013.
[32] Ernst and Young , "Global LNG: Will new demand and new supply mean new pricing?," 2013.
[33] Timera Energy, "Is the UK gas market being rigged?," 2012.
[34] United Nations Economic Commission For Europe, "The Impact of Liberalization of Natural Gas
Markets in the UNECE region - Efficiency and Security," 2012.
[35] Franziska Holz, Philipp M. Richter and Ruud Egging, "The Role of Natural Gas in a Low-Carbon
Europe: Infrastructure and Regional Supply Security in the Global Gas Model," 2013.
[36] International Energy Agency (IEA), "Medium Term Gas Market Report," 2013.
[37] Ernst & Young, "Natural gas in Africa - The frontiers of the Golden Age," 2012.
[38] KPMG, "Oil and Gas in Africa - Africa's reserves, potential and prospects," 2013.
[39] Harvard University’s Belfer Center and Rice University’s Baker Institute Center for Energy
Studies, "The Changing Geopolitics of Natural Gas: The Case of Algeria," 2013.
[40] US Energy Information Administration, "Libya - Country Analysis," 2012.
[41] International Gas Union (IGU), "World LNG Report - 2013 Edition," 2013.
[42] BP, "Statistical Review of World Energy," 2013.
[43] US Energy Information Administration (EIA) , "Azerbaijan: Country report," 2013.
[44] BP, [Online]. Available: http://www.bp.com/.
[45] Congressional Research Service, "Europe's Energy Security: Options and Challenges to Natural
Gas Supply Diversification," 2013.
[46] US Energy Information Administration, "International Energy Statistics," [Online]. Available:
http://www.eia.gov/cfapps/ipdbproject/IEDIndex3.cfm?tid=3&pid=3&aid=6. [Accessed 2014].
[47] International Energy Agency , "Medium Term Natural Gas Report 2013".
[48] The Oxford Institute for Energy Studies , "Iran's gas exports: can past failure become future
success?," 2013.
[49] US Energy Information Administration, "Qatar: Country report," 2014.
[50] US Energy Information Administration , "Technically Recoverable Shale Oil and Shale Gas
Resources: An Assessment of 137 Shale Formations in 41 Countries Outside the United States,"
2013.
[51] Ernst and Young , "Shale gas in Europe: revolution or evolution?," 2013.
[52] European Regulators' Group for Electricity and Gas (ERGEG), "Monitoring Report 2010 on the
regulatory oversight of natural gas hubs," 2010.
[53] European Parliament, Directorate General for Internal Policies , "The impact of the oil price on
EU energy prices," 2014.
THE OUTLOOK FOR A NATURAL GAS TRADING HUB IN SE EUROPE
206
[54] European Federation of Energy Traders (EFET), "EFET Guide on the Features of a Successful
Virtual Trading Point," 2013.
[55] Official Journal of the European Union , "COMMISSION REGULATION (EU) No 312/2014 of 26
March 2014, establishing a Network Code on Gas Balancing of Transmission Networks," 2014.
[56] European Regulators’ Group for Electricity and Gas (ERGEG), "The hub used as a balancing point
(in the South-South East Region)".
[57] International Energy Agency (IEA), "Development of competitive gas trading in Continental
Europe," 2008.
[58] Frontier Economics, "Wholesale market functioning: GTM1 criteria," 2nd ACER Workshop on Gas
Target Model review and update, 2014.
[59] "Regulation (EC) No 715/2009 of the European Parliament and of the Council on conditions for
access to the natural gas transmission networks and repealing Regulation (EC) No 1775/2005".
[60] KEMA, "Study on Entry-Exit Regimes in Gas, Part A: Implementation of Entry-Exit Systems
(project for the European Commission)," 2013.
[61] US Energy Information Administration, "Turkey: Country Overview," 2014.
[62] PWC, "Liberalising natural gas in Turkey," 2014.
[63] The Oxford Institute for Energy Studies, "Natural gas in the Turkish domestic energy market:
Policies and challenges," 2014.
[64] Radu Dudău, "Romania’s energy strategy options: Current trends in Eastern Europe's natural gas
markets," Energy Policy Group, 2014.
[65] European Commission, "Energy Market of Romania," 2011.
[66] Florent Silve and Pierre Noël, "Cost Curves for Gas Supply Security: The Case of Bulgaria,"
University of Cambridge, 2010.
[67] The Oxford Institute for Energy Studies , "The Italian Gas Market: Challenges and Opportunities,"
Anouk Honore, 2012.