Embed Size (px)
Citation preview
David E. DismukesCenter for Energy StudiesLouisiana State University
The Outlook for Energy
Presentation to the Sunshine Rotary ClubBaton Rouge, Louisiana
April 28, 2005
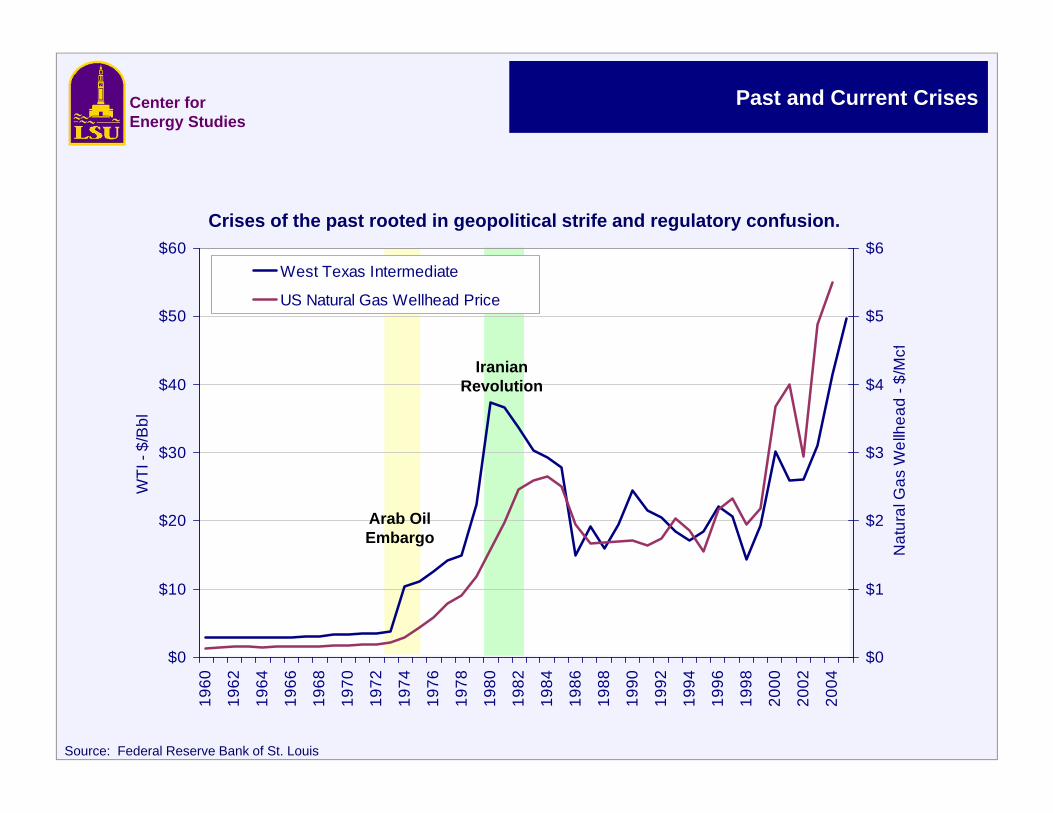
Crises of the past rooted in geopolitical strife and regulatory confusion.
Center for Energy Studies
$0
$10
$20
$30
$40
$50
$60
1960
1962
1964
1966
1968
1970
1972
1974
1976
1978
1980
1982
1984
1986
1988
1990
1992
1994
1996
1998
2000
2002
2004
WTI
- $/
Bbl
$0
$1
$2
$3
$4
$5
$6
Nat
ural
Gas
Wel
lhea
d - $
/Mcf
West Texas Intermediate
US Natural Gas Wellhead Price
Arab OilEmbargo
Past and Current Crises
IranianRevolution
Source: Federal Reserve Bank of St. Louis
Past and Current Crises
While geopolitical issues are aggravating today’s energy markets, the fundamental source of the problem is clearly rooted in economic fundamentals.
• Most basic energy markets are global, and prices are driven by what goes on in global markets.
– Capital is mobile across the globe for energy production decisions.
– Production and output are global in destination markets.
– Prices are traded on recognized hubs, and through recognized institutions, throughout the globe.
– While natural gas has been primarily continental, the development of LNG is pushing these markets towards globalization as well.
Center for Energy Studies

World Oil Demand
-0.5
0.0
0.5
1.0
1.5
2.0
2.5
3.0
1991-1999
Average
2000 2001 2002 2003 2004 2005 2006
Mill
ion
Bar
rels
per
Day
Rest of World
China
US
Source: Energy Information Administration
Projections
World oil demand growth currently surging at relatively high ratesand continues to be strong through 2006
Center for Energy Studies
China’s demand
increases 173 percent from 2003
to 2004
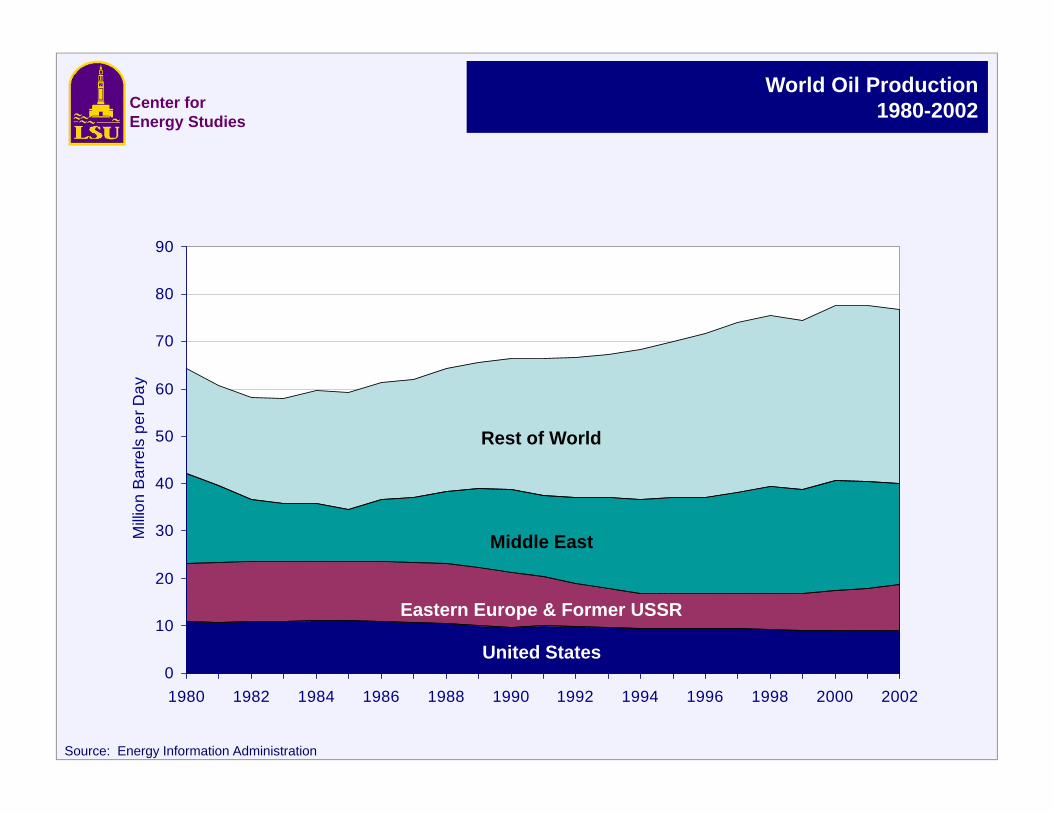
World Oil Production1980-2002
Source: Energy Information Administration
0
10
20
30
40
50
60
70
80
90
1980 1982 1984 1986 1988 1990 1992 1994 1996 1998 2000 2002
Milli
on B
arre
ls p
er D
ay
Center for Energy Studies
Eastern Europe & Former USSR
United States
Middle East
Rest of World
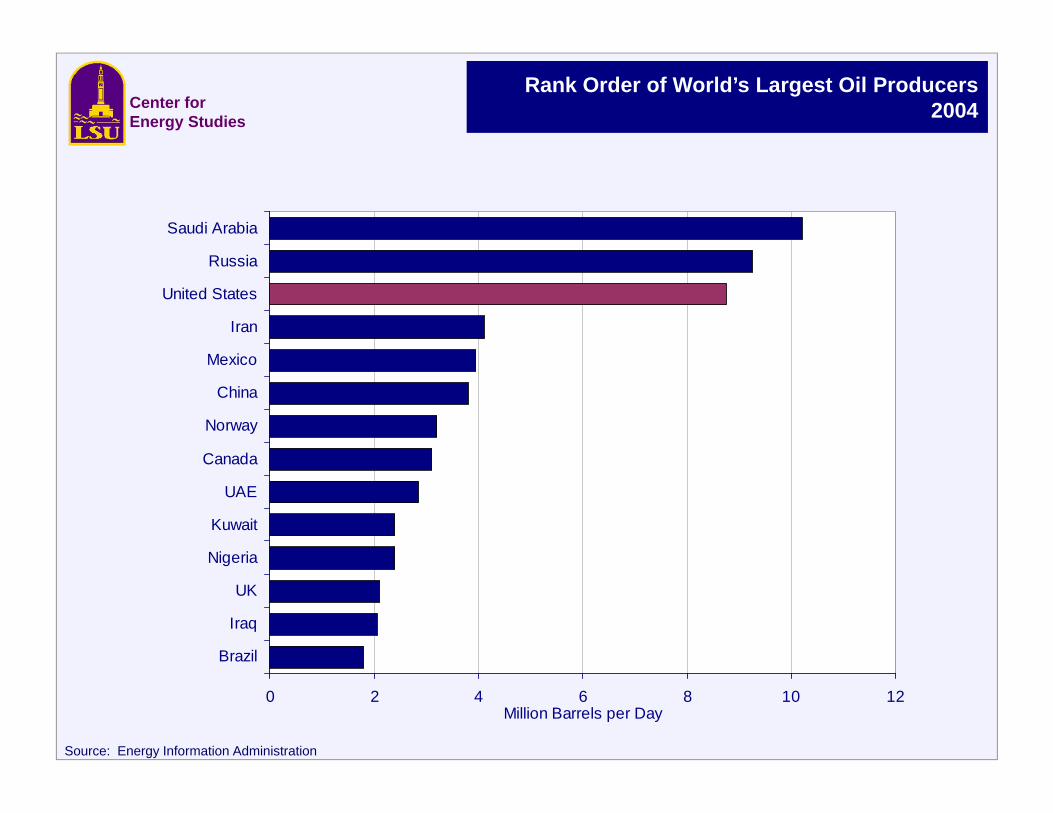
Rank Order of World’s Largest Oil Producers2004
Source: Energy Information Administration
0 2 4 6 8 10 12
Brazil
Iraq
UK
Nigeria
Kuwait
UAE
Canada
Norway
China
Mexico
Iran
United States
Russia
Saudi Arabia
Million Barrels per Day
Center for Energy Studies
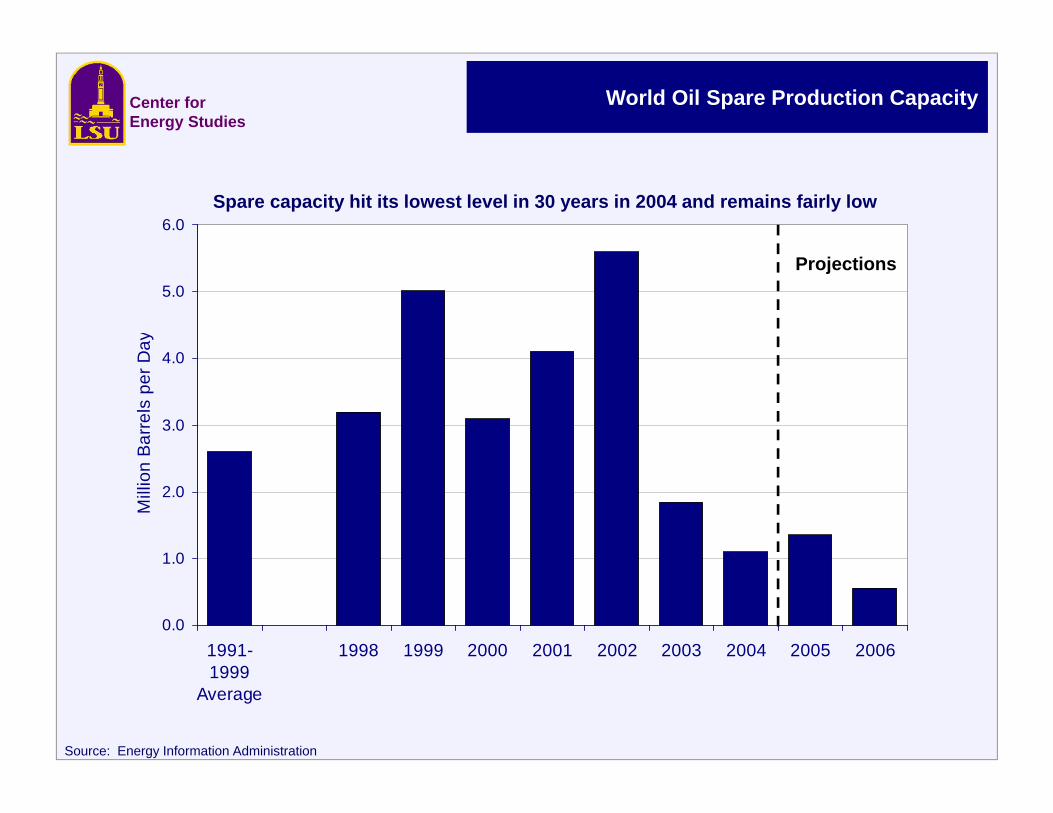
World Oil Spare Production Capacity
Source: Energy Information Administration
0.0
1.0
2.0
3.0
4.0
5.0
6.0
1991-1999
Average
1998 1999 2000 2001 2002 2003 2004 2005 2006
Mill
ion
Bar
rels
per
Day
Projections
Spare capacity hit its lowest level in 30 years in 2004 and remains fairly low
Center for Energy Studies
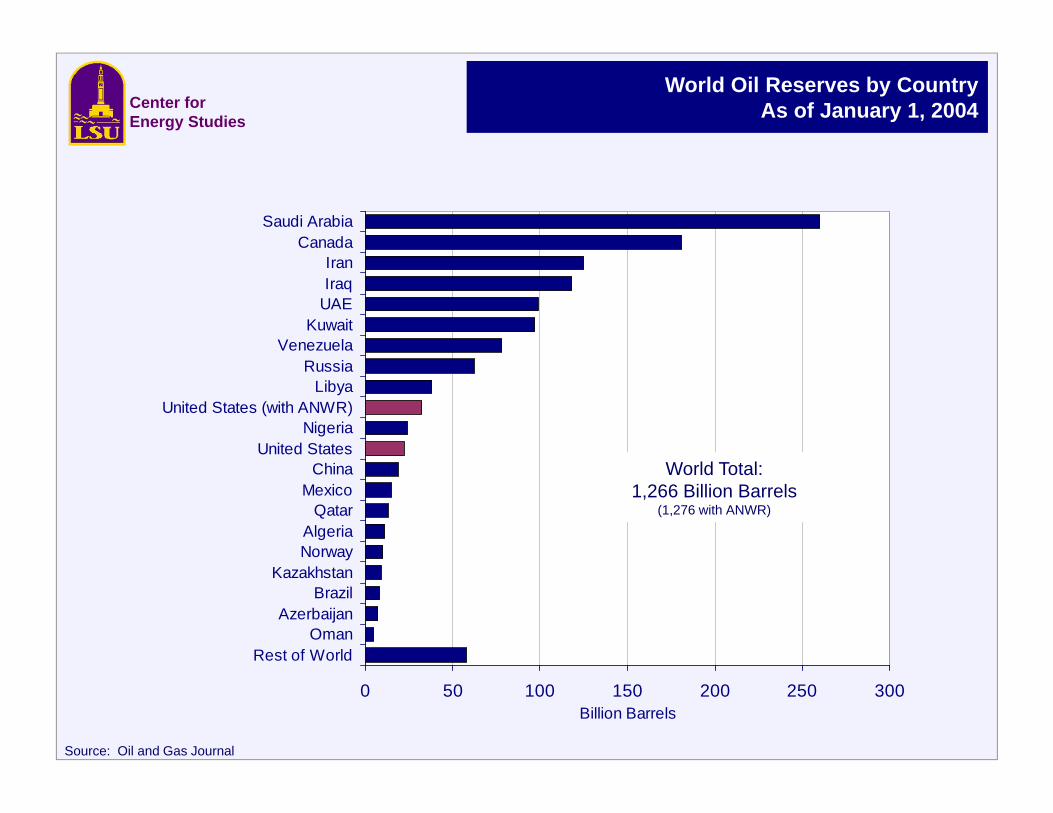
World Oil Reserves by CountryAs of January 1, 2004
Source: Oil and Gas Journal
0 50 100 150 200 250 300
Rest of WorldOman
AzerbaijanBrazil
KazakhstanNorwayAlgeria
QatarMexico
ChinaUnited States
NigeriaUnited States (with ANWR)
LibyaRussia
VenezuelaKuwait
UAEIraqIran
CanadaSaudi Arabia
Billion Barrels
World Total:1,266 Billion Barrels
(1,276 with ANWR)
Center for Energy Studies
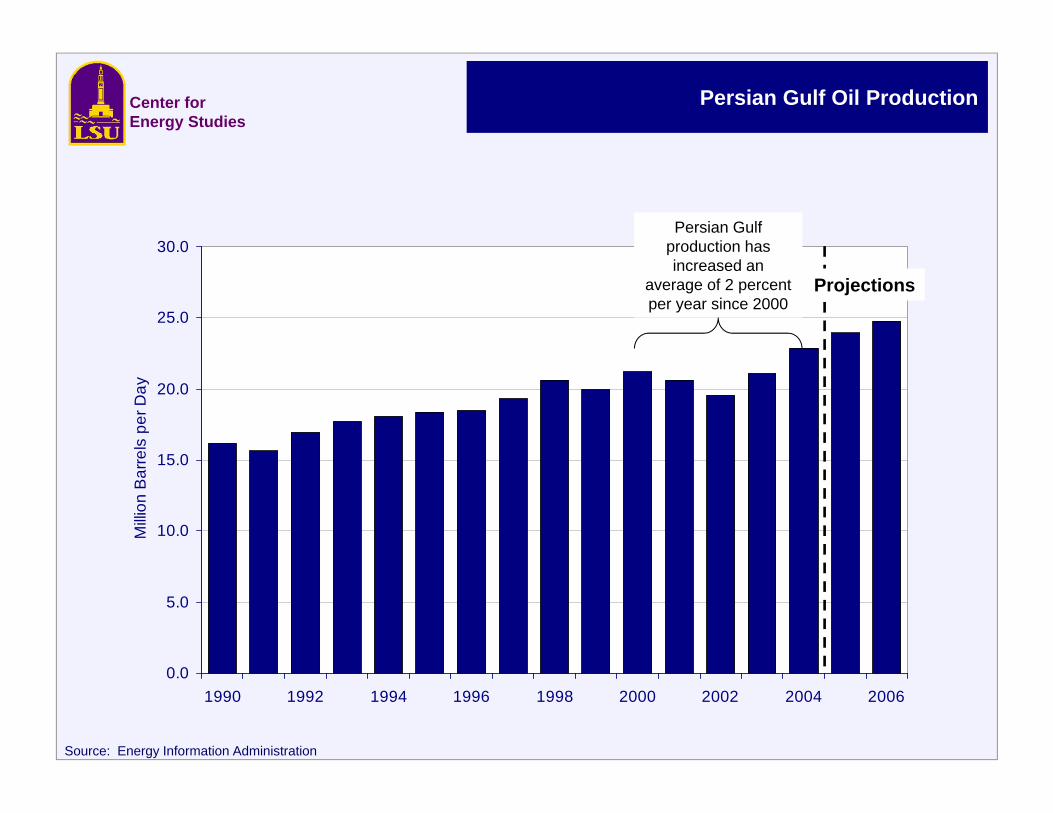
Persian Gulf Oil Production
Source: Energy Information Administration
0.0
5.0
10.0
15.0
20.0
25.0
30.0
1990 1992 1994 1996 1998 2000 2002 2004 2006
Milli
on B
arre
ls p
er D
ay
Projections
Center for Energy Studies
Persian Gulf production has increased an
average of 2 percent per year since 2000
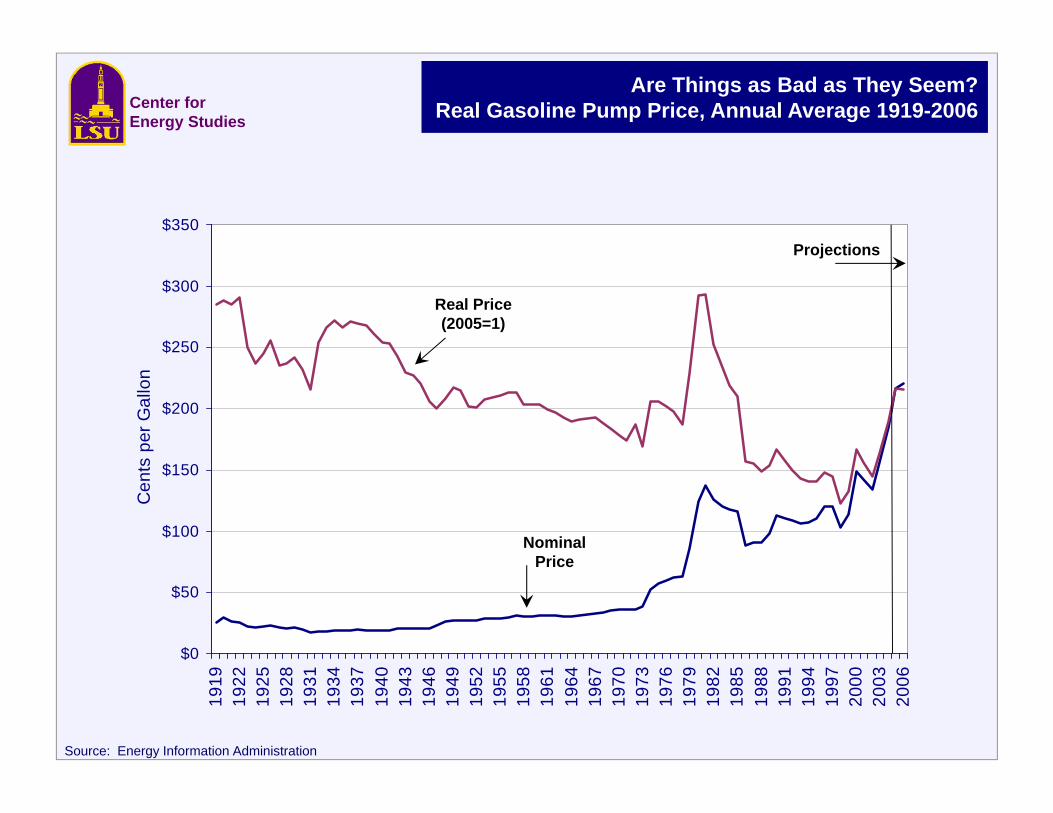
Are Things as Bad as They Seem?Real Gasoline Pump Price, Annual Average 1919-2006Center for
Energy Studies
$0
$50
$100
$150
$200
$250
$300
$35019
1919
2219
2519
2819
3119
3419
3719
4019
4319
4619
4919
5219
5519
5819
6119
6419
6719
7019
7319
7619
7919
8219
8519
8819
9119
9419
9720
0020
0320
06
Cen
ts p
er G
allo
n
Real Price(2005=1)
NominalPrice
Projections
Source: Energy Information Administration
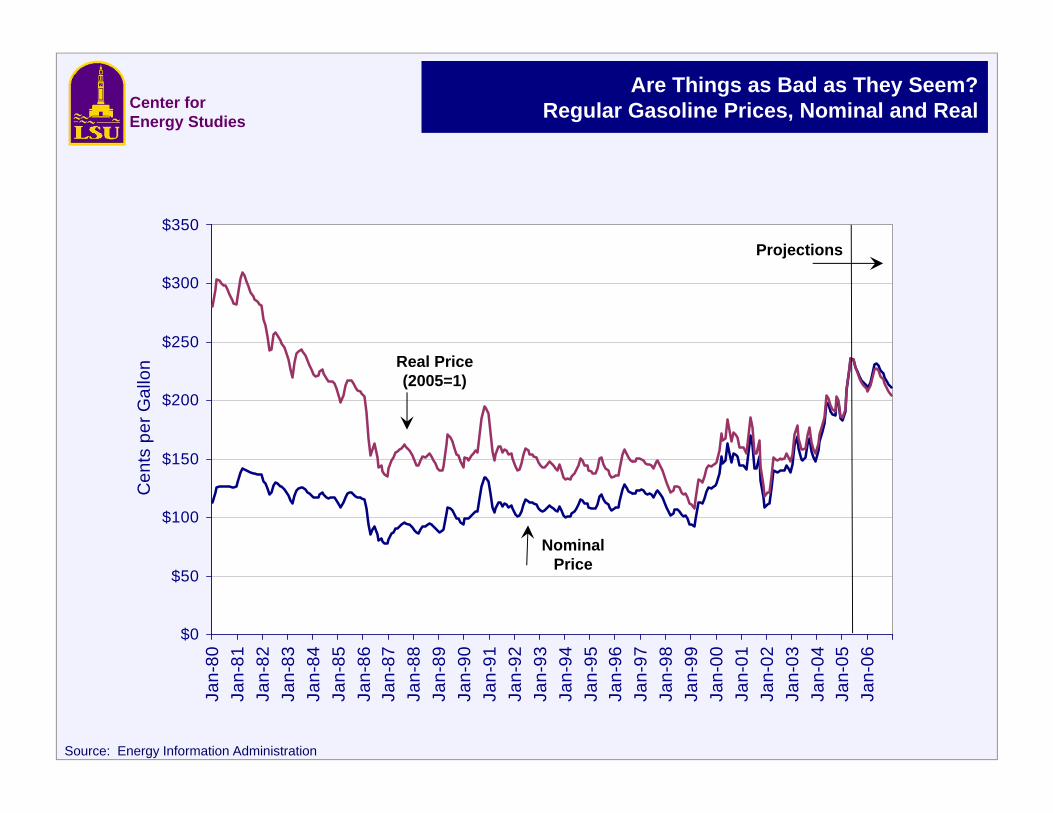
Are Things as Bad as They Seem?Regular Gasoline Prices, Nominal and RealCenter for
Energy Studies
$0
$50
$100
$150
$200
$250
$300
$350Ja
n-80
Jan-
81Ja
n-82
Jan-
83Ja
n-84
Jan-
85Ja
n-86
Jan-
87Ja
n-88
Jan-
89Ja
n-90
Jan-
91Ja
n-92
Jan-
93Ja
n-94
Jan-
95Ja
n-96
Jan-
97Ja
n-98
Jan-
99Ja
n-00
Jan-
01Ja
n-02
Jan-
03Ja
n-04
Jan-
05Ja
n-06
Cen
ts p
er G
allo
n Real Price(2005=1)
NominalPrice
Projections
Source: Energy Information Administration
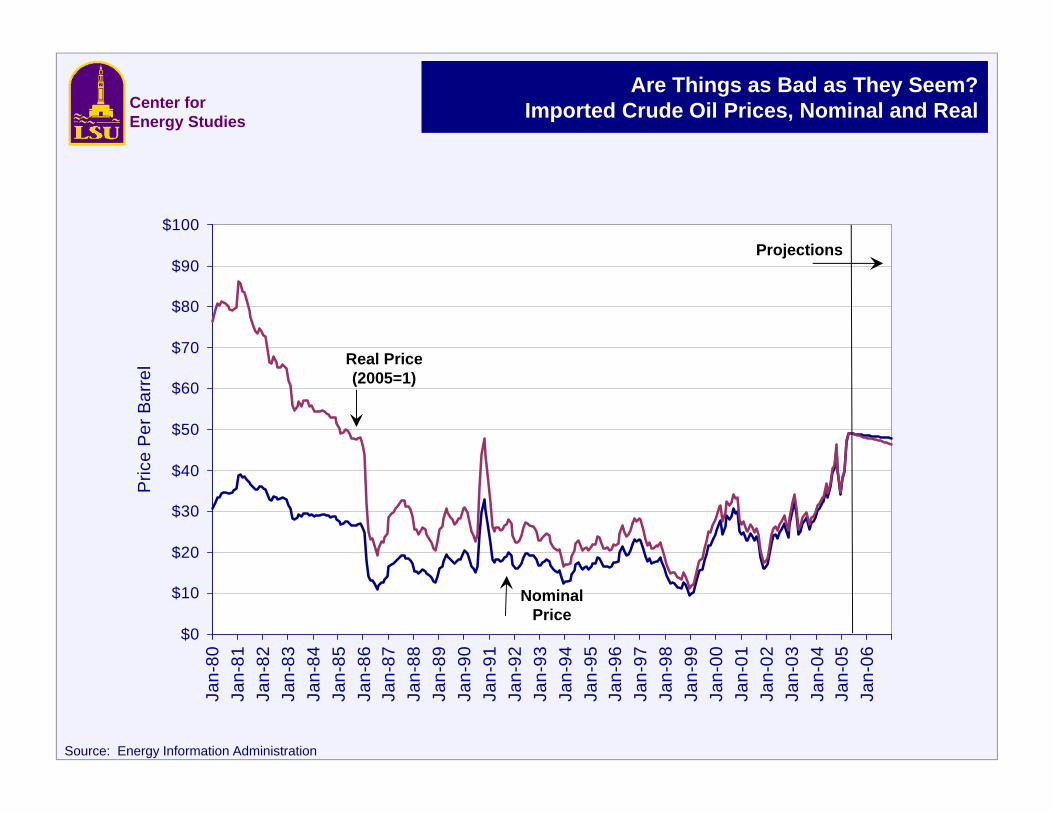
Are Things as Bad as They Seem?Imported Crude Oil Prices, Nominal and RealCenter for
Energy Studies
$0
$10
$20
$30
$40
$50
$60
$70
$80
$90
$100Ja
n-80
Jan-
81Ja
n-82
Jan-
83Ja
n-84
Jan-
85Ja
n-86
Jan-
87Ja
n-88
Jan-
89Ja
n-90
Jan-
91Ja
n-92
Jan-
93Ja
n-94
Jan-
95Ja
n-96
Jan-
97Ja
n-98
Jan-
99Ja
n-00
Jan-
01Ja
n-02
Jan-
03Ja
n-04
Jan-
05Ja
n-06
Pric
e P
er B
arre
l Real Price(2005=1)
NominalPrice
Projections
Source: Energy Information Administration
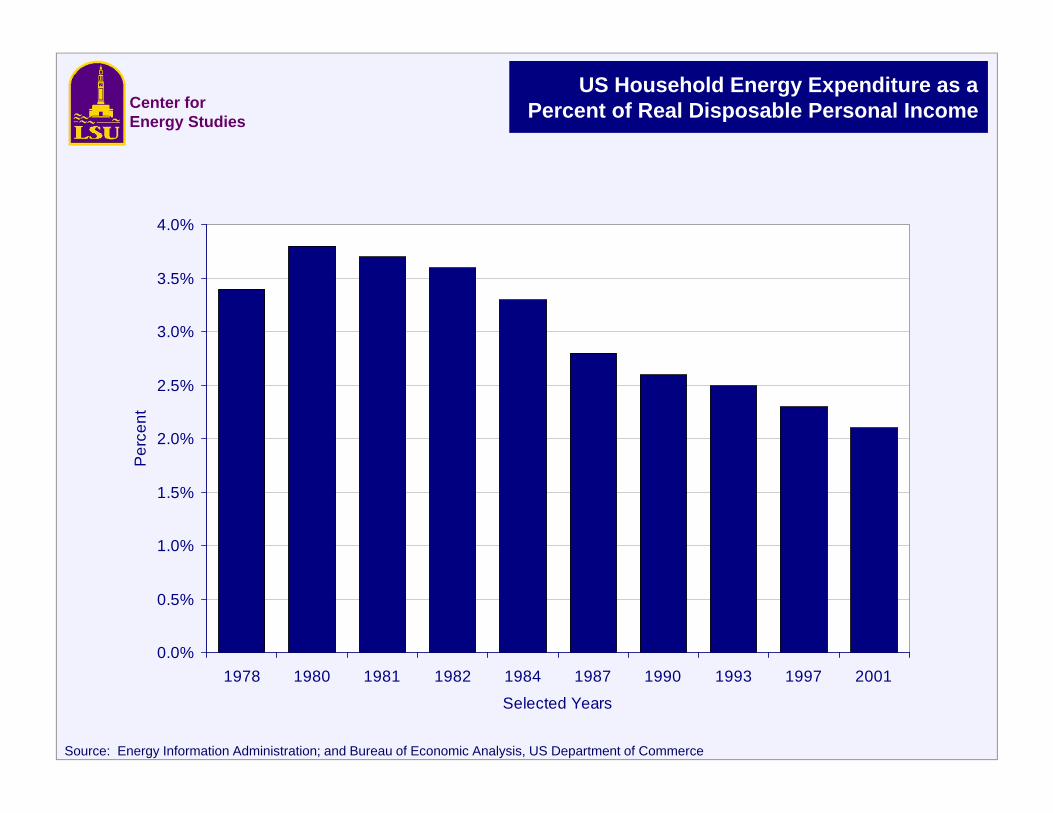
US Household Energy Expenditure as aPercent of Real Disposable Personal IncomeCenter for
Energy Studies
0.0%
0.5%
1.0%
1.5%
2.0%
2.5%
3.0%
3.5%
4.0%
1978 1980 1981 1982 1984 1987 1990 1993 1997 2001
Selected Years
Per
cent
Source: Energy Information Administration; and Bureau of Economic Analysis, US Department of Commerce
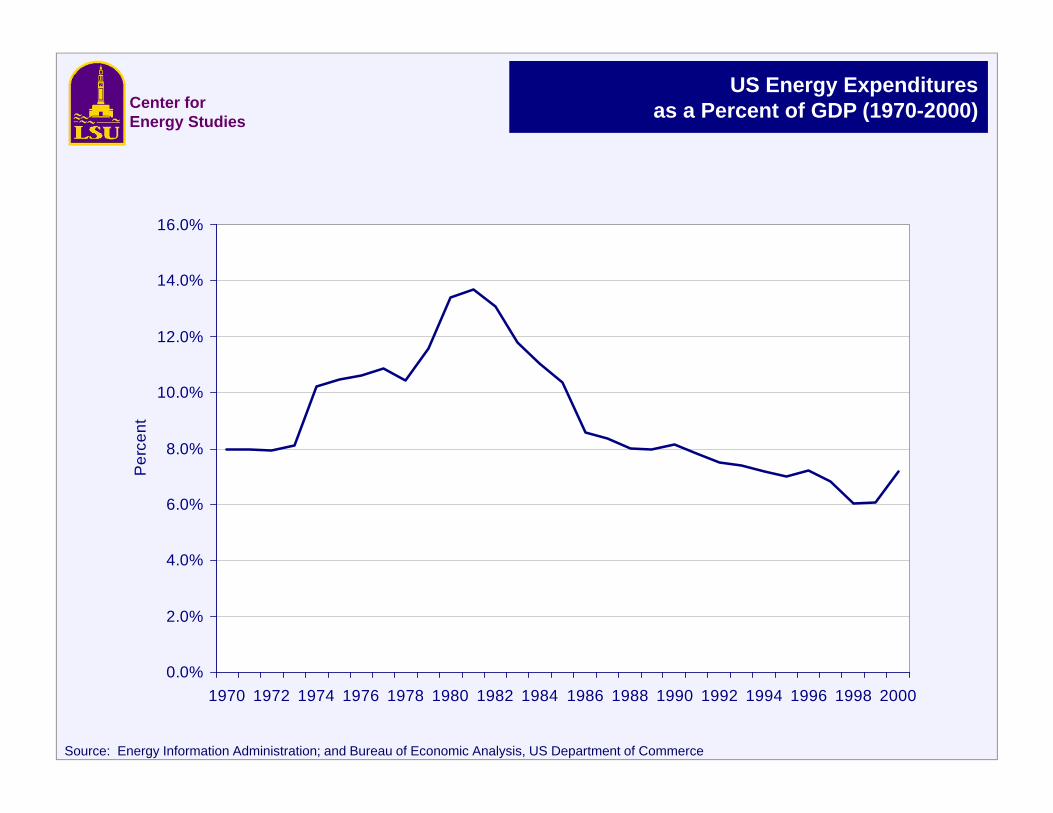
US Energy Expendituresas a Percent of GDP (1970-2000)Center for
Energy Studies
0.0%
2.0%
4.0%
6.0%
8.0%
10.0%
12.0%
14.0%
16.0%
1970 1972 1974 1976 1978 1980 1982 1984 1986 1988 1990 1992 1994 1996 1998 2000
Per
cent
Source: Energy Information Administration; and Bureau of Economic Analysis, US Department of Commerce
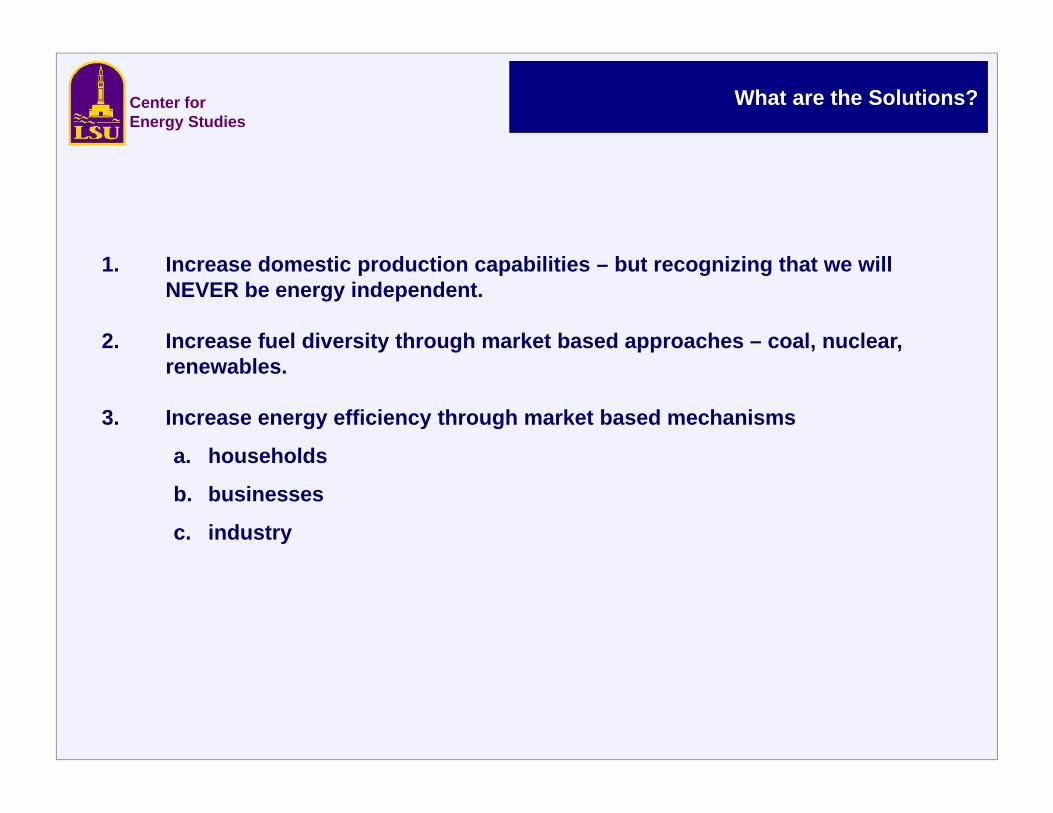
What are the Solutions?
1. Increase domestic production capabilities – but recognizing that we will NEVER be energy independent.
2. Increase fuel diversity through market based approaches – coal, nuclear, renewables.
3. Increase energy efficiency through market based mechanisms
a. households
b. businesses
c. industry
Center for Energy Studies
Center for Energy Studies
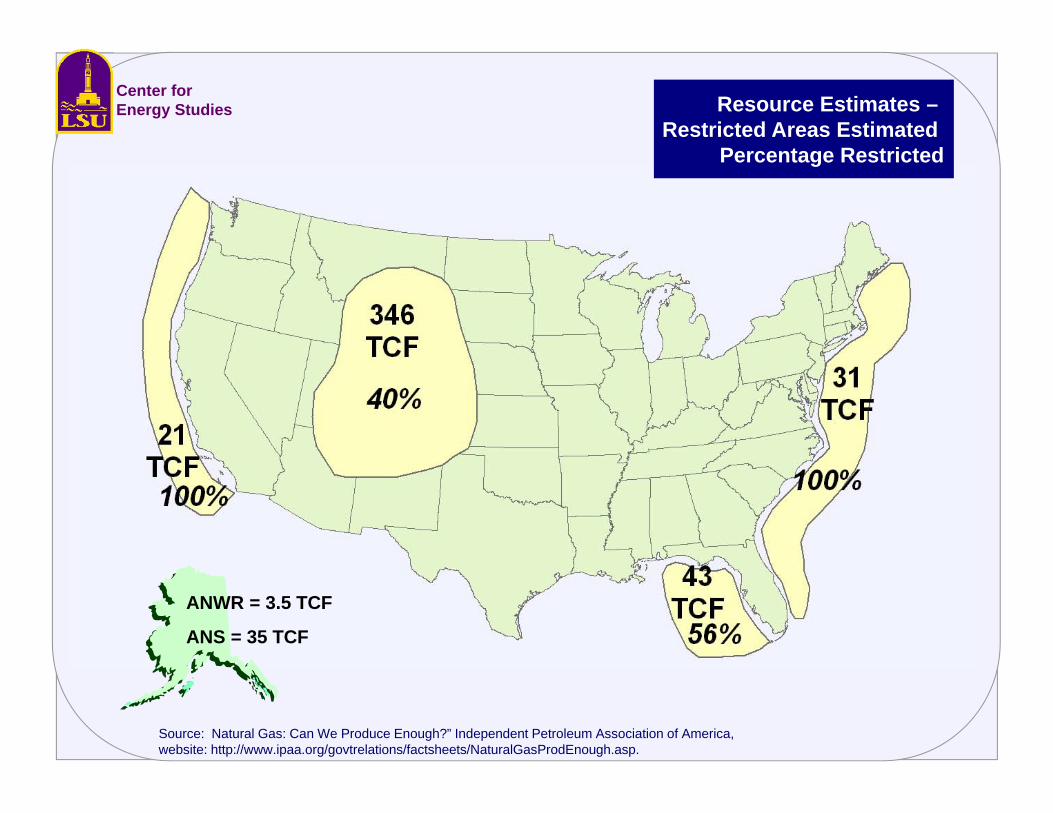
Source: Natural Gas: Can We Produce Enough?” Independent Petroleum Association of America, website: http://www.ipaa.org/govtrelations/factsheets/NaturalGasProdEnough.asp.
Resource Estimates –Restricted Areas Estimated
Percentage Restricted
ANWR = 3.5 TCF
ANS = 35 TCF
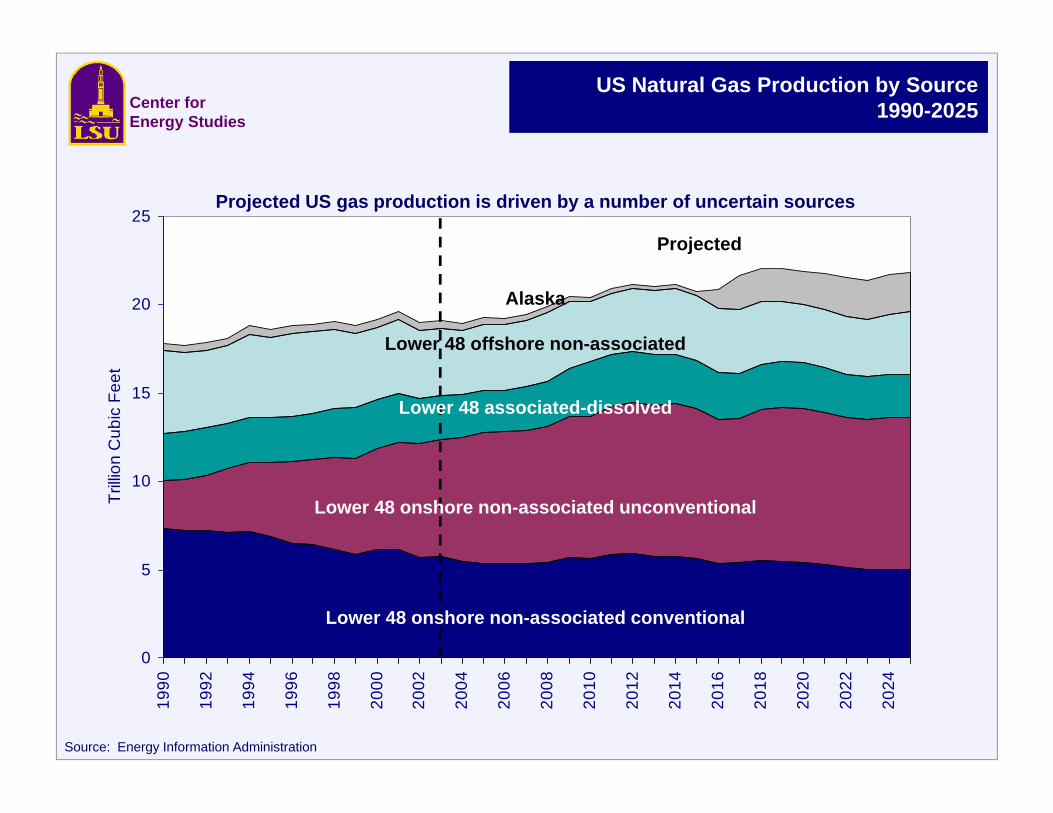
US Natural Gas Production by Source1990-2025
0
5
10
15
20
25
1990
1992
1994
1996
1998
2000
2002
2004
2006
2008
2010
2012
2014
2016
2018
2020
2022
2024
Trilli
on C
ubic
Fee
t
Source: Energy Information Administration
Projected
Center for Energy Studies
Lower 48 onshore non-associated conventional
Lower 48 onshore non-associated unconventional
Lower 48 associated-dissolved
Lower 48 offshore non-associated
Alaska
Projected US gas production is driven by a number of uncertain sources
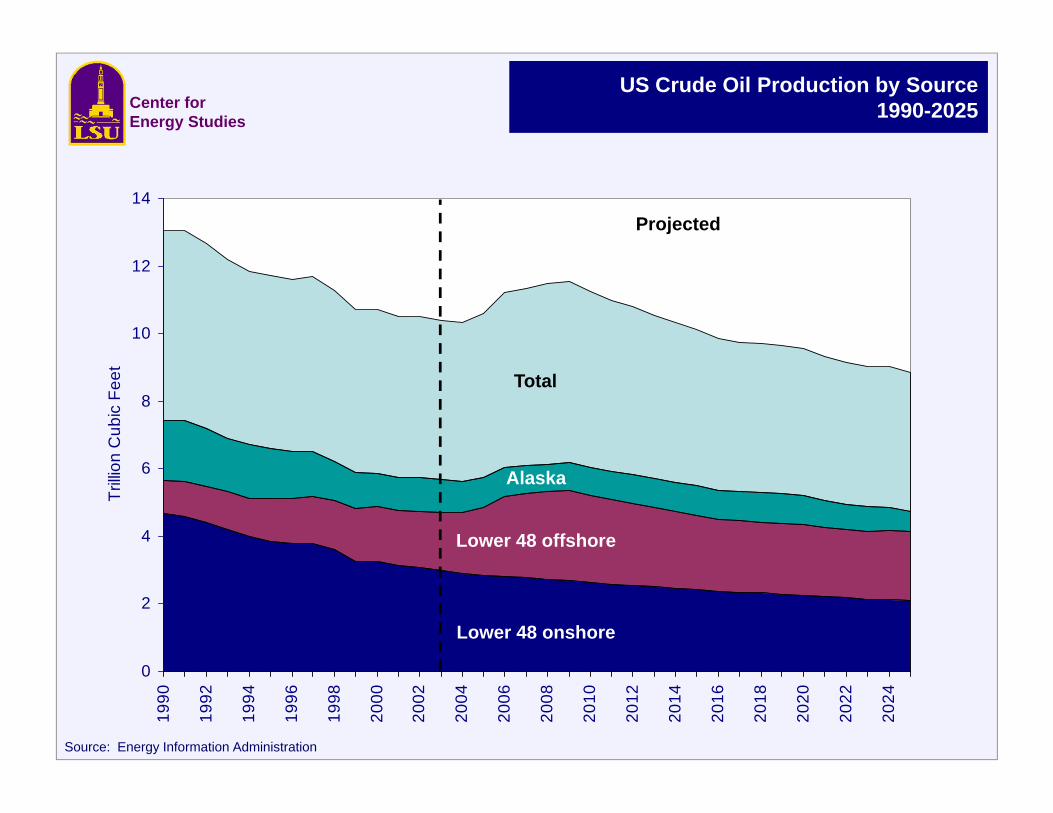
US Crude Oil Production by Source1990-2025
0
2
4
6
8
10
12
14
1990
1992
1994
1996
1998
2000
2002
2004
2006
2008
2010
2012
2014
2016
2018
2020
2022
2024
Trilli
on C
ubic
Fee
t
Projected
Center for Energy Studies
Lower 48 onshore
Lower 48 offshore
Alaska
Total
Source: Energy Information Administration
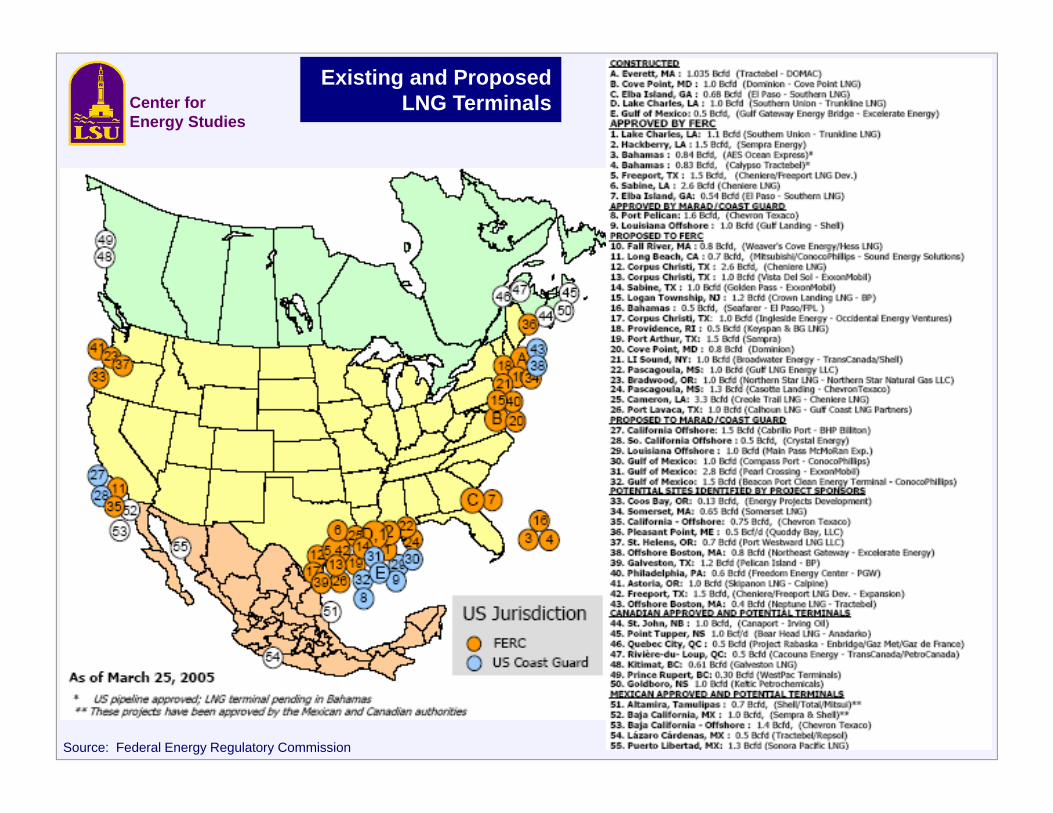
Existing and ProposedLNG Terminals
Source: Federal Energy Regulatory Commission
Center for Energy Studies
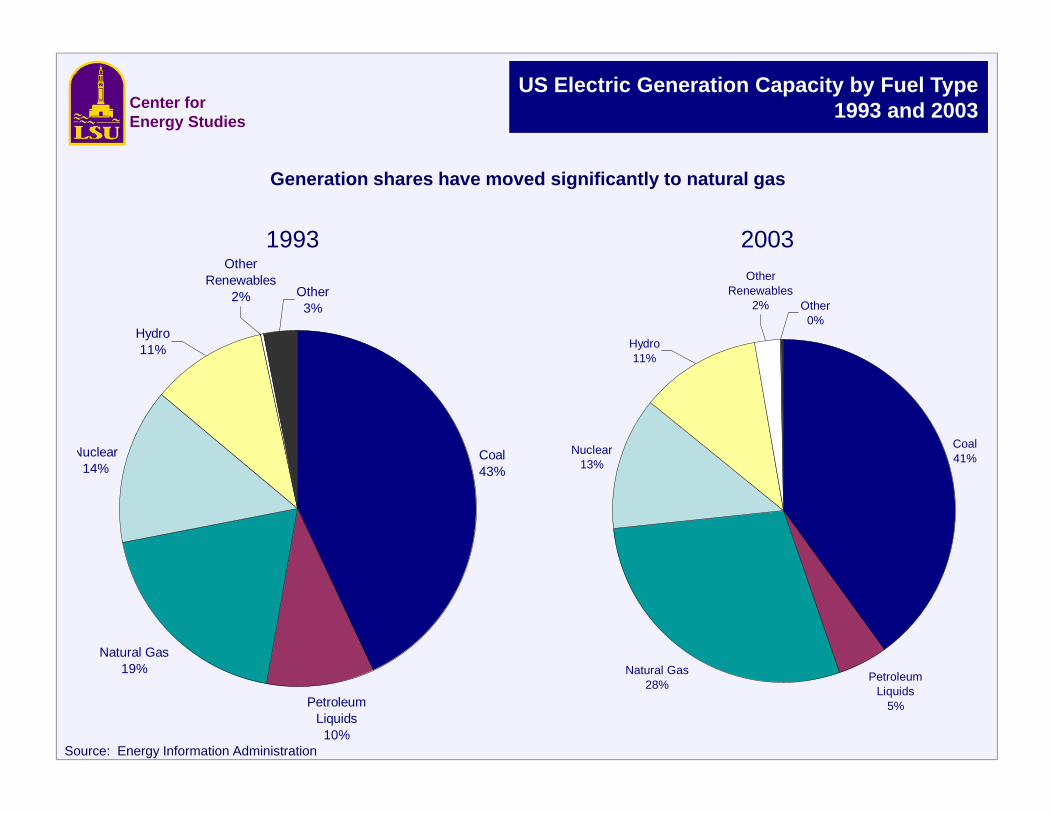
US Electric Generation Capacity by Fuel Type1993 and 2003
Coal43%
Natural Gas19%
Nuclear14%
Petroleum Liquids
10%
Other Renewables
2% Other3%
Hydro11%
Coal41%
Petroleum Liquids
5%
Natural Gas28%
Nuclear13%
Other Renewables
2% Other0%
Hydro11%
1993 2003
Source: Energy Information Administration
Center for Energy Studies
Generation shares have moved significantly to natural gas
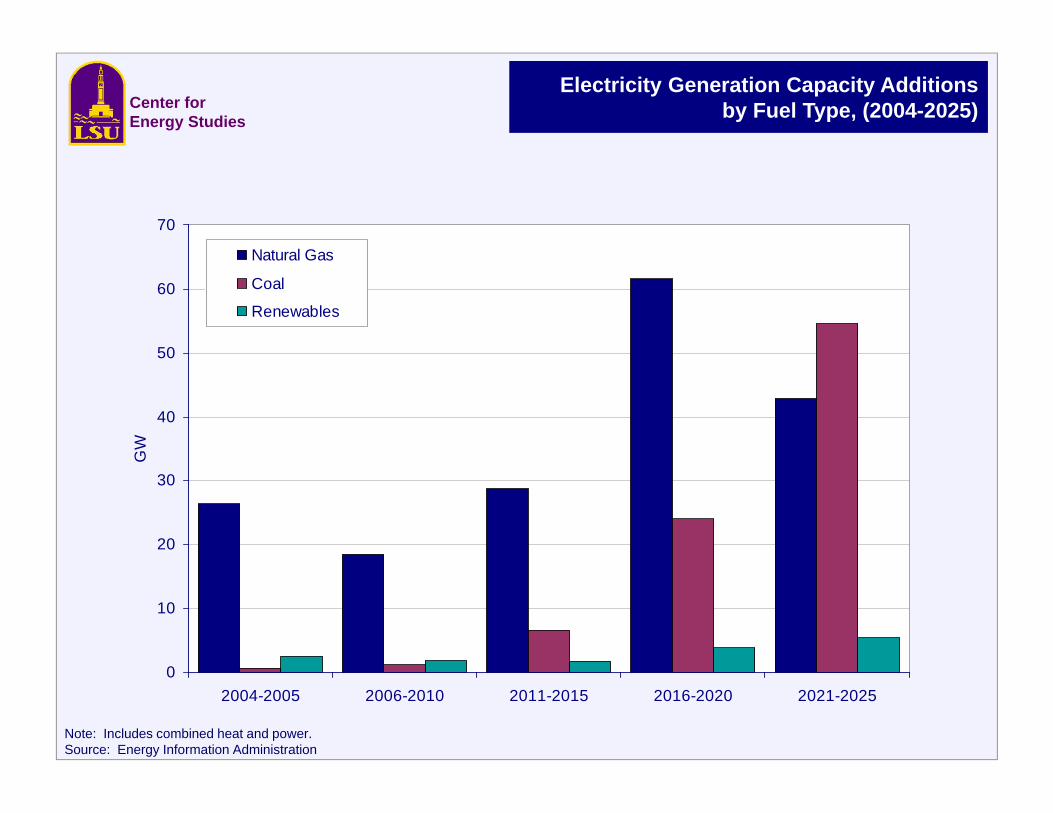
Electricity Generation Capacity Additionsby Fuel Type, (2004-2025)Center for
Energy Studies
0
10
20
30
40
50
60
70
2004-2005 2006-2010 2011-2015 2016-2020 2021-2025
GW
Natural Gas
Coal
Renewables
Note: Includes combined heat and power.Source: Energy Information Administration
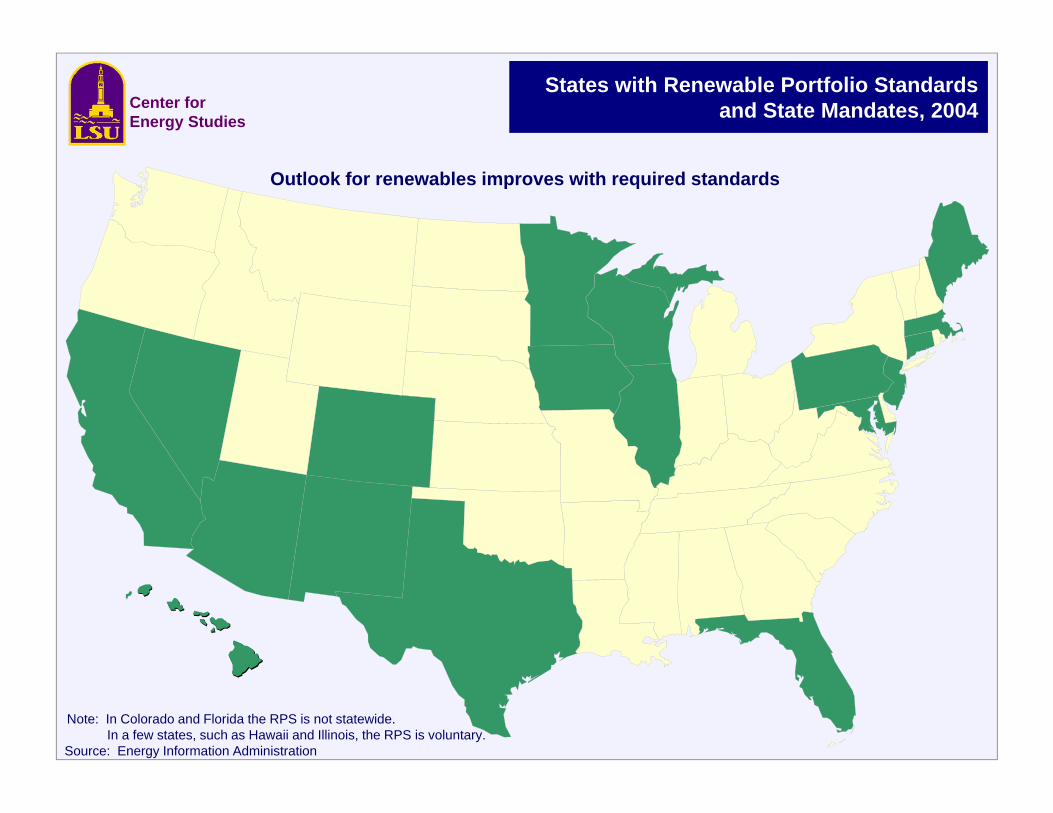
States with Renewable Portfolio Standardsand State Mandates, 2004
Source: Energy Information Administration
Note: In Colorado and Florida the RPS is not statewide. In a few states, such as Hawaii and Illinois, the RPS is voluntary.
Center for Energy Studies
Outlook for renewables improves with required standards
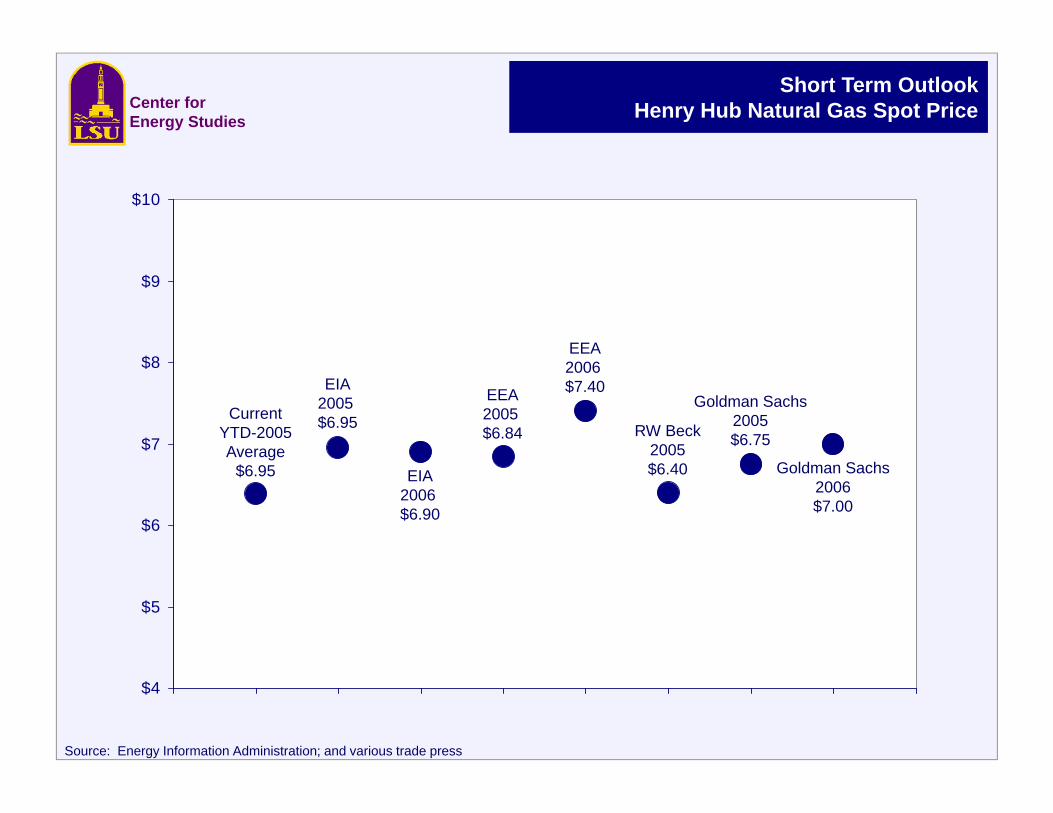
Short Term OutlookHenry Hub Natural Gas Spot Price
$4
$5
$6
$7
$8
$9
$10
0 1 2 3 4 5 6 7 8 9
EIA2005 $6.95
EIA2006 $6.90
CurrentYTD-2005Average
$6.95
EEA2006 $7.40
RW Beck2005$6.40
Goldman Sachs2005$6.75
Goldman Sachs2006$7.00
EEA2005 $6.84
Center for Energy Studies
Source: Energy Information Administration; and various trade press
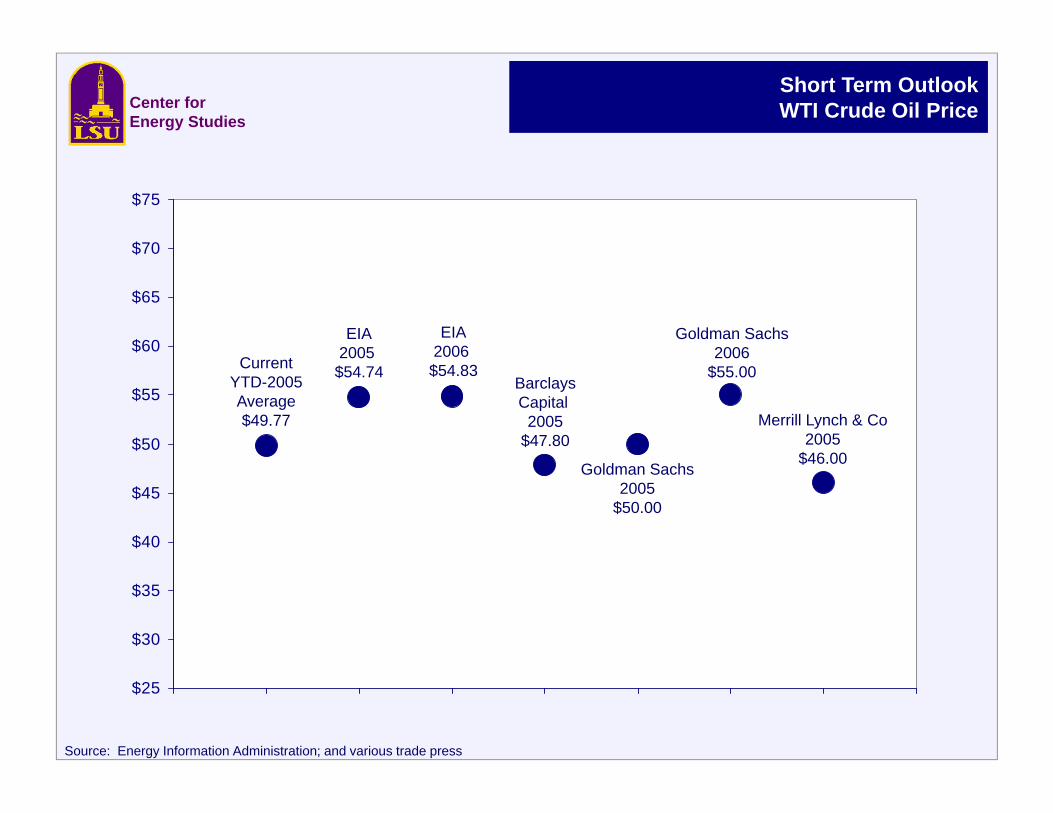
Short Term OutlookWTI Crude Oil Price
$25
$30
$35
$40
$45
$50
$55
$60
$65
$70
$75
0 1 2 3 4 5 6 7 8
EIA2005
$54.74
EIA2006
$54.83CurrentYTD-2005Average$49.77
BarclaysCapital
2005$47.80
Goldman Sachs2005
$50.00
Goldman Sachs2006
$55.00
Center for Energy Studies
Merrill Lynch & Co2005
$46.00
Source: Energy Information Administration; and various trade press
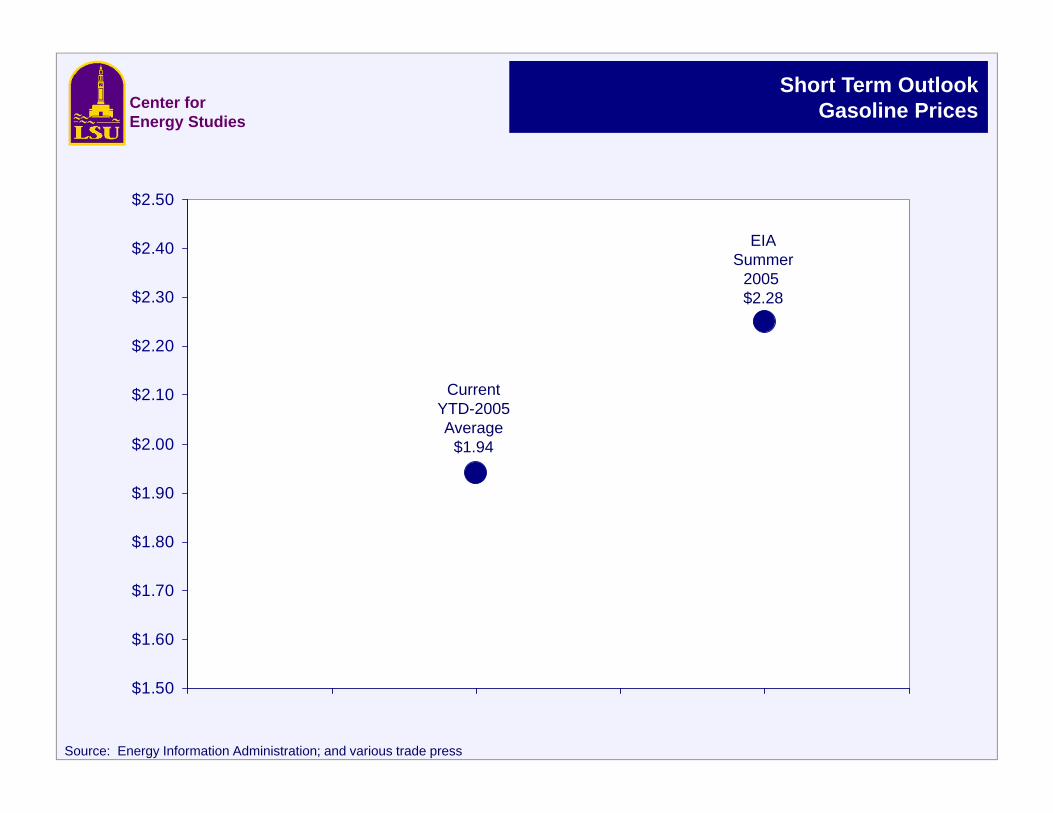
Short Term OutlookGasoline Prices
$1.50
$1.60
$1.70
$1.80
$1.90
$2.00
$2.10
$2.20
$2.30
$2.40
$2.50
0 0.5 1 1.5 2 2.5
EIASummer
2005 $2.28
CurrentYTD-2005Average
$1.94
Center for Energy Studies
Source: Energy Information Administration; and various trade press
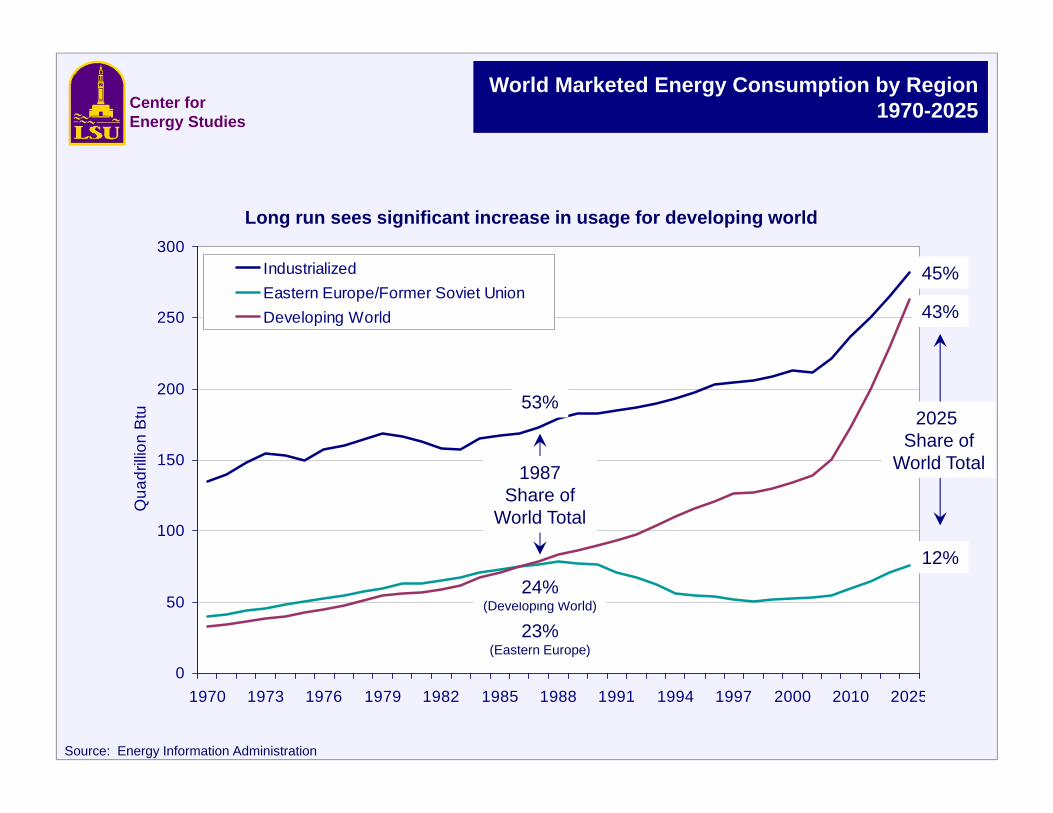
World Marketed Energy Consumption by Region1970-2025
0
50
100
150
200
250
300
1970 1973 1976 1979 1982 1985 1988 1991 1994 1997 2000 2010 2025
Qua
drilli
on B
tu
IndustrializedEastern Europe/Former Soviet UnionDeveloping World
45%
43%
12%
2025 Share of
World Total
Center for Energy Studies
53%
(Developing World)
23%(Eastern Europe)
1987Share of
World Total
24%
Long run sees significant increase in usage for developing world
Source: Energy Information Administration
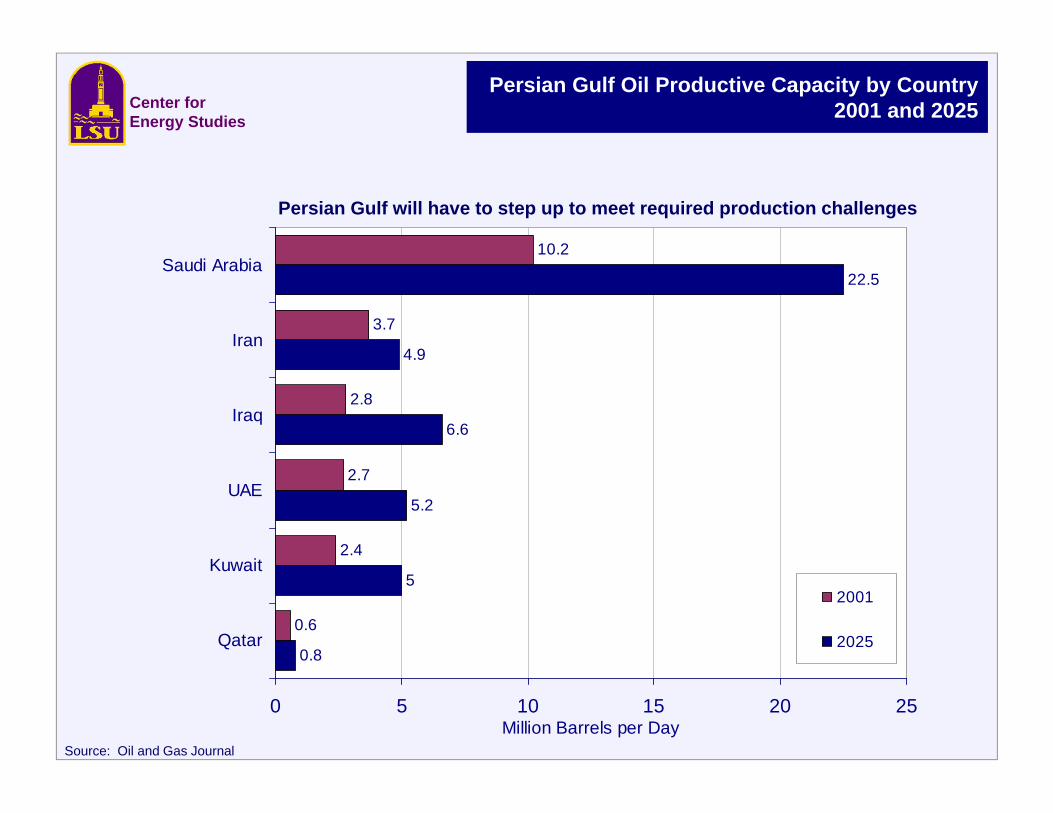
Persian Gulf Oil Productive Capacity by Country2001 and 2025
Source: Oil and Gas Journal
0.8
5
5.2
6.6
4.9
22.5
0.6
2.4
2.7
2.8
3.7
10.2
0 5 10 15 20 25
Qatar
Kuwait
UAE
Iraq
Iran
Saudi Arabia
Million Barrels per Day
2001
2025
Center for Energy Studies
Persian Gulf will have to step up to meet required production challenges
0
5
10
15
20
25
30
1970 1975 1980 1985 1990 1995 2000 2005 2010 2015 2020 2025
Milli
on B
arre
ls p
er D
ay
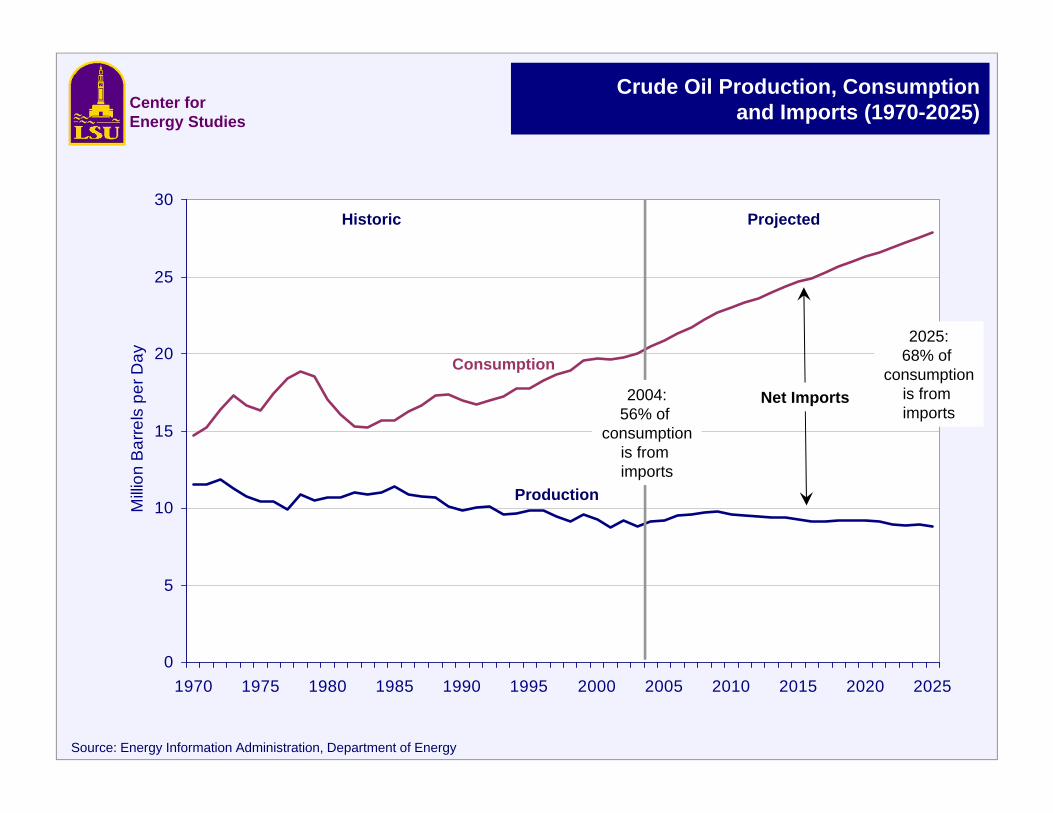
Source: Energy Information Administration, Department of Energy
Crude Oil Production, Consumptionand Imports (1970-2025)
Consumption
Production
Historic Projected
Center for Energy Studies
Net Imports2004:56% of
consumptionis from imports
2025:68% of
consumptionis from imports
0
5
10
15
20
25
30
1970 1975 1980 1985 1990 1995 2000 2005 2010 2015 2020 2025
Tcf
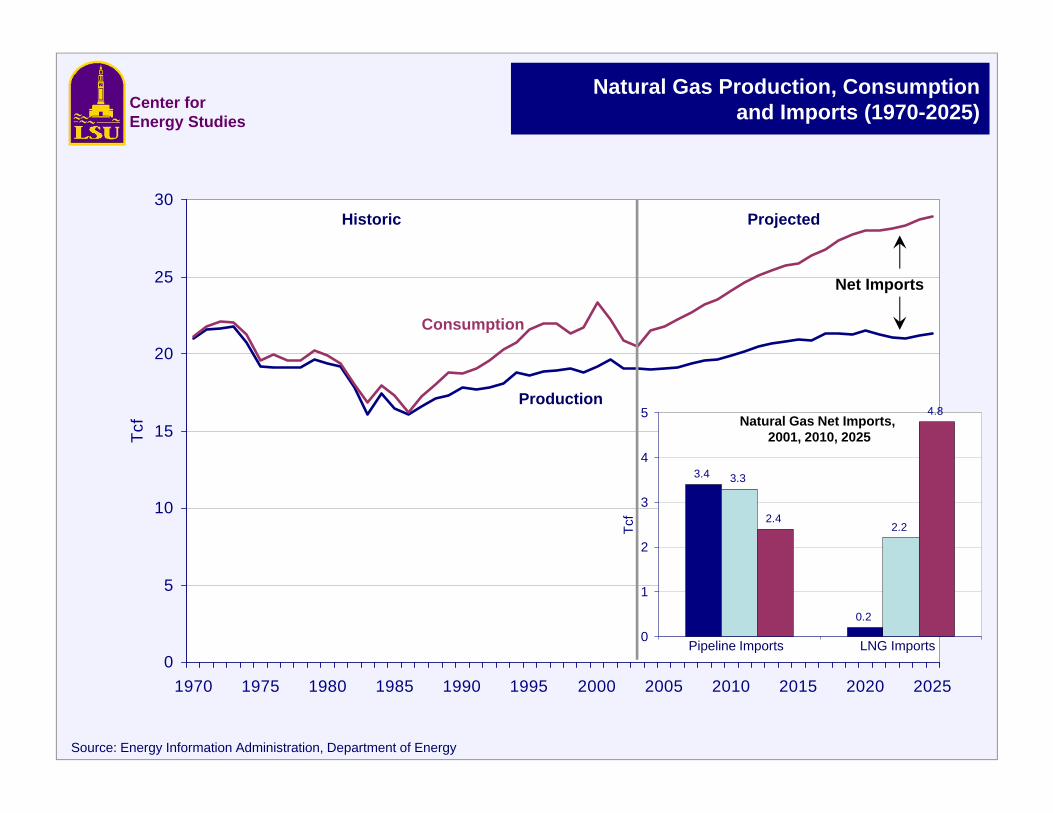
Source: Energy Information Administration, Department of Energy
Natural Gas Production, Consumptionand Imports (1970-2025)
Consumption
Production
Historic Projected
Net Imports
3.4
0.2
3.3
2.22.4
4.8
0
1
2
3
4
5
Tcf
Pipeline Imports LNG Imports
Natural Gas Net Imports, 2001, 2010, 2025
Center for Energy Studies
Center for Energy Studies
• Continued high prices in near term
• Developed world will rely on imports more heavily
• Continued demand will put increased pressure on global energy markets
• US dependence on foreign energy will increase
• Overall problem in real terms is not severe but we are nearing the pressure point
Conclusions