Embed Size (px)
Citation preview

NSW Housing Outlook
The Outlook for the Housing
Industry in New South Wales
Harley Dale
HIA Chief Economist
HIA Industry Outlook Breakfast – Sydney
March 2011

NSW Housing Outlook
It’s (apparently) all about Europe

NSW Housing Outlook
What’s going on in Europe and what’s is got to do with
us?
• Europe is already back in recession.
• ‘Think’ Australia circa 1990 but with unemployment already at 10% (or in Spain’s case 22%).
• Europe is China’s largest trading partner (25 – 30% of exports).
• China’s net exports are at a more than two year low and manufacturing activity was falling sharply.
• Monetary policy (interest rates) is at its tightest for ten years, but ...
• ... the Chinese retail sector appears okay and fixed internal investment is still growing at over 20%.
• Remember, China takes 50% of the world’s steel.
• There is ample room to move to stimulate domestic demand and ...
• ... there is a change in leadership later this year.
• The most likely outcome is that Europe ‘muddles through’ and China is okay.

NSW Housing Outlook
The Australian Economy – too much focus on the
aggregate
• Economic growth is okay, but patchy and …
• … as HIA predicted from late 2010, nowhere near what was originally forecast.
-2.0
-1.0
0.0
1.0
2.0
3.0
4.0
5.0
6.0
Dec
-90
Dec
-91
Dec
-92
Dec
-93
Dec
-94
Dec
-95
Dec
-96
Dec
-97
Dec
-98
Dec
-99
Dec
-00
Dec
-01
Dec
-02
Dec
-03
Dec
-04
Dec
-05
Dec
-06
Dec
-07
Dec
-08
Dec
-09
Dec
-10
Dec
-11
% c
hang
e
Gross Domestic ProductSource: ABS 5206
Qtrly Annual

NSW Housing Outlook
HIA National Outlook, December 2010
• “(Official) economic growth rate forecasts for Australia in
2011 are too high ...”
• In terms of the resources boom mark II:-
• “… there may be little else to drive economic activity and we
will need a quick reversal in monetary policy settings and
potentially a revamping of some fiscal stimulus elements.”
NSW Housing Outlook
Interest rate relief appears to have been short-lived

NSW Housing Outlook
Interest rates are not going according to plan
• Interest rates fell in late 2011, but the banks dithered and businesses lost out.
• Banks lifting interest rates in 2012 changes the entire landscape.
2.00
3.00
4.00
5.00
6.00
7.00
8.00
9.00
10.00
11.00
Mar
-09
Apr
-09
May
-09
Jun-
09
Jul-0
9
Aug
-09
Sep
-09
Oct
-09
Nov
-09
Dec
-09
Jan-
10
Feb-
10
Mar
-10
Apr
-10
May
-10
Jun-
10
Jul-1
0
Aug
-10
Sep
-10
Oct
-10
Nov
-10
Dec
-10
Jan-
11
Feb-
11
Mar
-11
Apr
-11
May
-11
Jun-
11
Jul-1
1
Aug
-11
Sep
-11
Oct
-11
Nov
-11
Dec
-11
Jan-
12
*Feb
-12
Mar
-12
% In
tere
st R
ate
Interest Rates, Australia
Discounted Variable Mortgage Rate RBA Cash Rate Small Business Variable Term Loan
Source: RBA

NSW Housing Outlook
Consumers are feeling slightly better but still nervous
75
80
85
90
95
100
105
110
115
120
125
Feb-94 Feb-96 Feb-98 Feb-00 Feb-02 Feb-04 Feb-06 Feb-08 Feb-10 Feb-12
Inde
x
Consumer ConfidenceSource: Westpac-Melbourne Institute

NSW Housing Outlook
The NSW economy – a mixed bag like everywhere else
NSW ECONOMY
INDICATOR UPDATE
Gross State Product Steady
Interest rate outlook Steady/deteriorated
Manufacturing Steady
Unemployment Steady
Detached houses Deteriorated
Multi-units Improved
Renovations Deteriorated

NSW Housing Outlook
Housing indicators – up and down
8.6%
5.8%
-0.1%
-4% -4% -3.4%
-11.8%
0.9% 0.9%
-3.0%
-5.0%
-15.0%
-10.0%
-5.0%
0.0%
5.0%
10.0%
Land sales(Sydney)
Land prices(Sydney)
New homelending
Approvals -detached
Approvals -'total'
New homesales
Alts & adds Detachedhouse prices
(Sydney)
Multi-unitprices
(Sydney)
Detachedhouse prices
(regionalNSW)
Multi-unitprices
(regionalNSW)
% c
hang
e
Housing Indicators - Latest update for NSW Source: ABS, rpdata.com, HIA Economics

NSW Housing Outlook
The employment market is ‘okay’
-4.0
-3.0
-2.0
-1.0
0.0
1.0
2.0
3.0
4.0
5.0
6.0
3.0
4.0
5.0
6.0
7.0
8.0
9.0
10.0
11.0
12.0
Jan-
92
Jan-
93
Jan-
94
Jan-
95
Jan-
96
Jan-
97
Jan-
98
Jan-
99
Jan-
00
Jan-
01
Jan-
02
Jan-
03
Jan-
04
Jan-
05
Jan-
06
Jan-
07
Jan-
08
Jan-
09
Jan-
10
Jan-
11
Jan-
12
Per
cen
t
Per
cen
t
New South Wales' Labour MarketSource: ABS Labour Force
U/e rate (LHS) Annual Employment Growth Rate (RHS)
NSW Housing Outlook
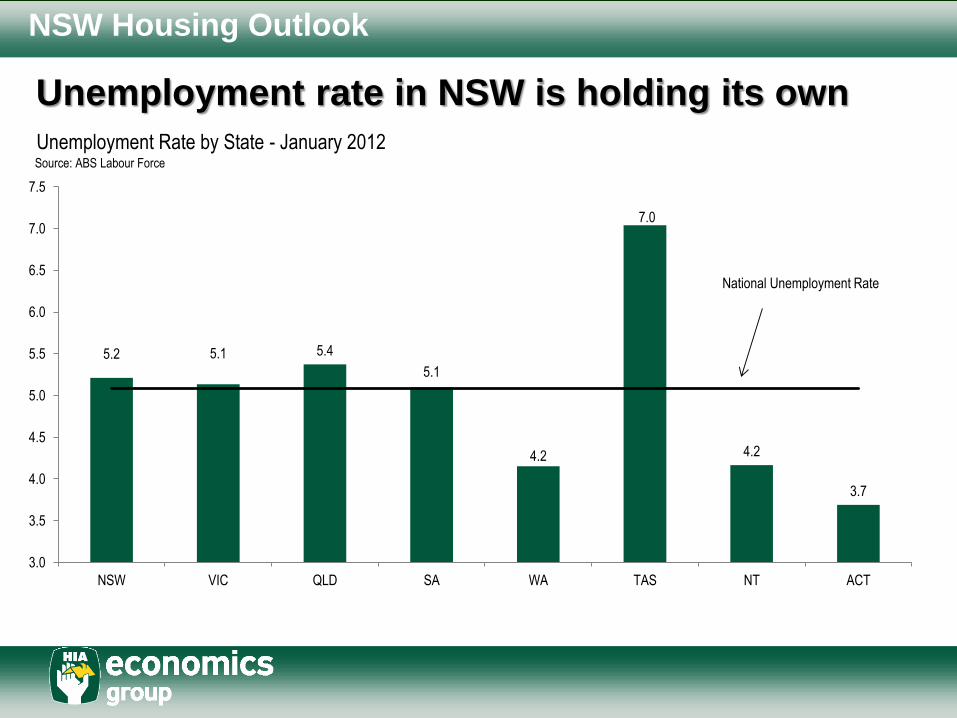
Unemployment rate in NSW is holding its own
5.2 5.1 5.4
5.1
4.2
7.0
4.2
3.7
3.0
3.5
4.0
4.5
5.0
5.5
6.0
6.5
7.0
7.5
NSW VIC QLD SA WA TAS NT ACT
Unemployment Rate by State - January 2012Source: ABS Labour Force
National Unemployment Rate

NSW Housing Outlook
Housing is the key to a
healthy NSW economy
NSW Housing Outlook
New Home Building
NSW Housing Outlook
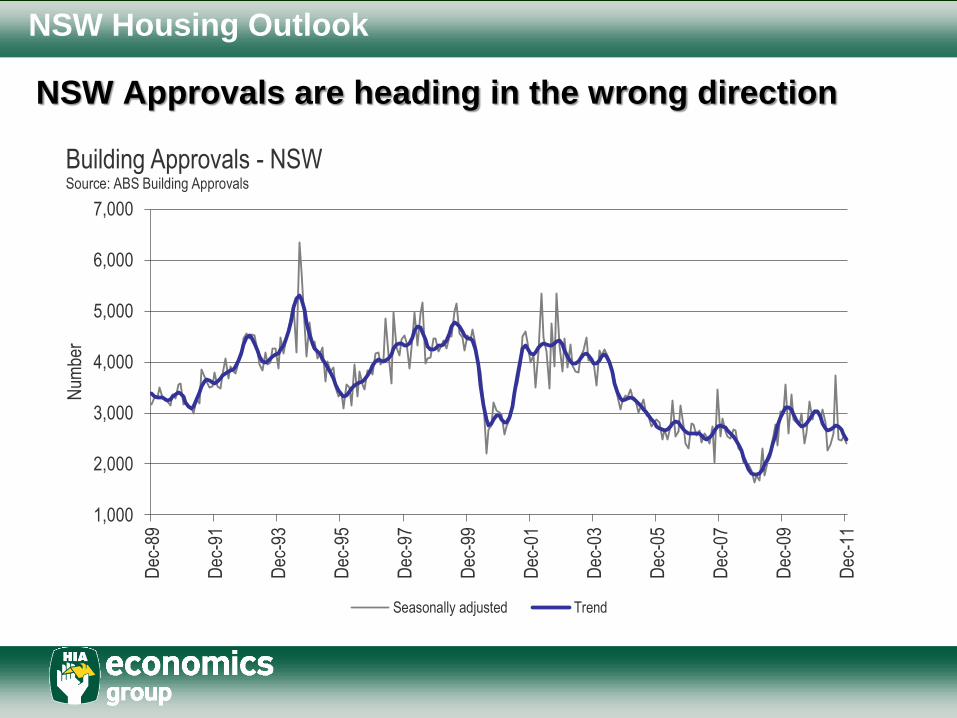
NSW Approvals are heading in the wrong direction
1,000
2,000
3,000
4,000
5,000
6,000
7,000
Dec
-89
Dec
-91
Dec
-93
Dec
-95
Dec
-97
Dec
-99
Dec
-01
Dec
-03
Dec
-05
Dec
-07
Dec
-09
Dec
-11
Num
ber
Building Approvals - NSWSource: ABS Building Approvals
Seasonally adjusted Trend

NSW Housing Outlook
Housing Affordability is improving and …
30.0
35.0
40.0
45.0
50.0
55.0
60.0
65.0
70.0
75.0
D06 M07 J07 S07 D07 M08 J08 S08 D08 M09 J09 S09 D09 M10 J10 S10 D10 M11 J11 S11 D11
HOUSING AFFORDABILITY INDEX, NSW
SYDNEY REST OF NSW
Sou
rce:
HIA
-Com
mon
wea
lthB
ank
Affo
rdab
ility
Rep
ort
HOUSING AFFORDABILITY INDEX, NSW

NSW Housing Outlook
… first home buyers are re-emerging and …
5.0%
10.0%
15.0%
20.0%
25.0%
30.0%
35.0%
40.0%
1000
2000
3000
4000
5000
6000
7000
Dec
-04
Mar
-05
Jun-
05
Sep
-05
Dec
-05
Mar
-06
Jun-
06
Sep
-06
Dec
-06
Mar
-07
Jun-
07
Sep
-07
Dec
-07
Mar
-08
Jun-
08
Sep
-08
Dec
-08
Mar
-09
Jun-
09
Sep
-09
Dec
-09
Mar
-10
Jun-
10
Sep
-10
Dec
-10
Mar
-11
Jun-
11
Sep
-11
Dec
-11
NSW First Home BuyersSource ABS Housing Finance
First home buyers - Dwellings financed (no.) Proportion

NSW Housing Outlook
... the trade-up buyer market has improved
6,846
33,060
11,194
35,337
0
5,000
10,000
15,000
20,000
25,000
30,000
35,000
40,000
FHB Non-FHB
Num
ber
of lo
ans
NSW First Home Buyer versus Non-First Home Buyer Loans - NSWSource: ABS Housing Finance
3mths to Dec 10 3mths to Dec 11
% change +64%
% change: +7%

NSW Housing Outlook
How are the regions faring?
Population growth 2009-10 Residential lot sales* NSW Building approvals** Ranking
Sydney 1.7 -9 -9 2
South Eastern 1.5 -25 13 1
Mid-North Coast 1.3 -36 -10 7
Illawarra 1.3 -32 -4 4
Hunter 1.2 -11 8 3
Central West 1.1 5 -12 5=
Richmond-Tweed 1.0 -51 -57 11
Northern 1.0 -42 3 9
Murrumbidgee 0.8 -41 -7 10
North Western 0.8 50 -38 8
Murray 0.7 -15 22 5=
*Annual % change - 6 mnths to Sep 2011
**Annual % change - December qtr 2011

NSW Housing Outlook
Housing prices, new housing,
and renovations activity

NSW Housing Outlook
Guess what? No housing crash
-0.9%
-6.8% -6.8%
-5.3%
-4.3%
-2.2%-2.5%
-4.3%
0.9%
-3.6%
-6.5%
-1.1%
-4.2%
-2.6%
-1.4% -1.5%
-10.0%
-8.0%
-6.0%
-4.0%
-2.0%
0.0%
2.0%
Sydney Melbourne Brisbane Adelaide Perth Darwin Canberra AustralianCapitals
Change in home values - year on year, December 2011Source: RP Data, Rismark International
Houses Units

NSW Housing Outlook
Dwelling prices – NSW regional centres
-2.2%
-4.7%
2.0%
15.7%
-5.5%
1.2%
-8.4%-10.2%
5.7%
-2.9%
20.8%
5.9%
2.1%
4.3%
-15.0%
-10.0%
-5.0%
0.0%
5.0%
10.0%
15.0%
20.0%
25.0%
Albury Armidale Bathurst Broken Hill Coffs Harbour Dubbo Lismore Maitland Orange Queanbeyan Tamworth Wagga Wagga Wollongong Sydney
Change in dwelling values - Annual change, 12 months to December 2011Source: Australian Property Investor, RP Data-Rismark
12 month % change

NSW Housing Outlook
Renovations activity has ‘re-disappointed’ and …
5,000
6,000
7,000
8,000
9,000
10,000
11,000
Dec
.198
9
Dec
.199
1
Dec
.199
3
Dec
.199
5
Dec
.199
7
Dec
.199
9
Dec
.200
1
Dec
.200
3
Dec
.200
5
Dec
.200
7
Dec
.200
9
Dec
.201
1
$ m
illio
n (m
ovin
g an
nual
tota
l)
Renovations Investment in New South Wales - Moving Annual TotalSource: ABS State Final Demand

NSW Housing Outlook
… major alts and adds haven’t done much
0
50,000
100,000
150,000
200,000
250,000
Dec
-04
Mar
-05
Jun-
05
Sep
-05
Dec
-05
Mar
-06
Jun-
06
Sep
-06
Dec
-06
Mar
-07
Jun-
07
Sep
-07
Dec
-07
Mar
-08
Jun-
08
Sep
-08
Dec
-08
Mar
-09
Jun-
09
Sep
-09
Dec
-09
Mar
-10
Jun-
10
Sep
-10
Dec
-10
Mar
-11
Jun-
11
Sep
-11
Dec
-11
The NSW Renovations and Additions MarketMonthly Lending and Monthly Council Approvals ($000)
Lending for Alts and Adds Value of Council Approved Alts and Adds

NSW Housing Outlook
NSW VIC QLD SA WA TAS NT ACT Aust
2003/04 (a) 9,741 6,424 6,358 1,934 3,078 684 204 376 28,799
2004/05 (a) 9,592 6,191 6,702 1,958 3,249 666 294 335 28,987
2005/06 (a) 8,962 5,842 7,159 1,956 3,255 695 322 354 28,545
2006/07 (a) 8,284 6,095 7,845 2,130 3,515 711 261 328 29,169
2007/08 (a) 8,262 6,639 7,565 1,829 4,244 769 202 367 29,877
2008/09 (a) 7,957 6,583 7,152 2,011 3,945 790 209 301 28,948
2009/10 (a) 8,263 6,338 7,363 2,026 4,536 751 254 392 29,923
2010/11 (a) 8,265 6,381 6,836 1,914 4,727 738 254 435 29,550
2011/12 8,004 6,495 7,349 1,956 4,557 799 243 431 29,835
2012/13 8,238 6,423 7,333 1,979 4,655 781 252 423 30,084
% change
2004/05 (a) -2% -4% 5% 1% 6% -3% 44% -11% 1%
2005/06 (a) -7% -6% 7% 0% 0% 4% 10% 6% -2%
2006/07 (a) -8% 4% 10% 9% 8% 2% -19% -7% 2%
2007/08 (a) 0% 9% -4% -14% 21% 8% -23% 12% 2%
2008/09 (a) -4% -1% -5% 10% -7% 3% 3% -18% -3%
2009/10 (a) 4% -4% 3% 1% 15% -5% 22% 30% 3%
2010/11 0% 1% -7% -6% 4% -2% 0% 11% -1%
2011/12 -3% 2% 8% 2% -4% 8% -4% -1% 1%
2012/13 3% -1% 0% 1% 2% -2% 4% -2% 1%
(a) = actual
HOUSING RENOVATIONS FORECAST: by state and territoryValue of investment, $ million, Chain Volume Measure
Source HIA Economics December 2011
The outlook for renovations is reasonable

NSW Housing Outlook
The outlook and what needs
to be done

NSW Housing Outlook
A recovery in new housing starts in 2012/13?
45.70
39.40
32.88
29.7431.49
23.62
31.87 30.8929.51
33.84
0.00
5.00
10.00
15.00
20.00
25.00
30.00
35.00
40.00
45.00
50.00
2003/04 (a) 2004/05 (a) 2005/06 (a) 2006/07 (a) 2007/08 (a) 2008/09 (a) 2009/10 (a) 2010/11 (a) 2011/12 2012/13
Tho
usan
d dw
ellin
gs c
omm
ence
d
NSW Housing Starts ForecastsSource: HIA Economics Group
Forecast
NSW Housing Outlook
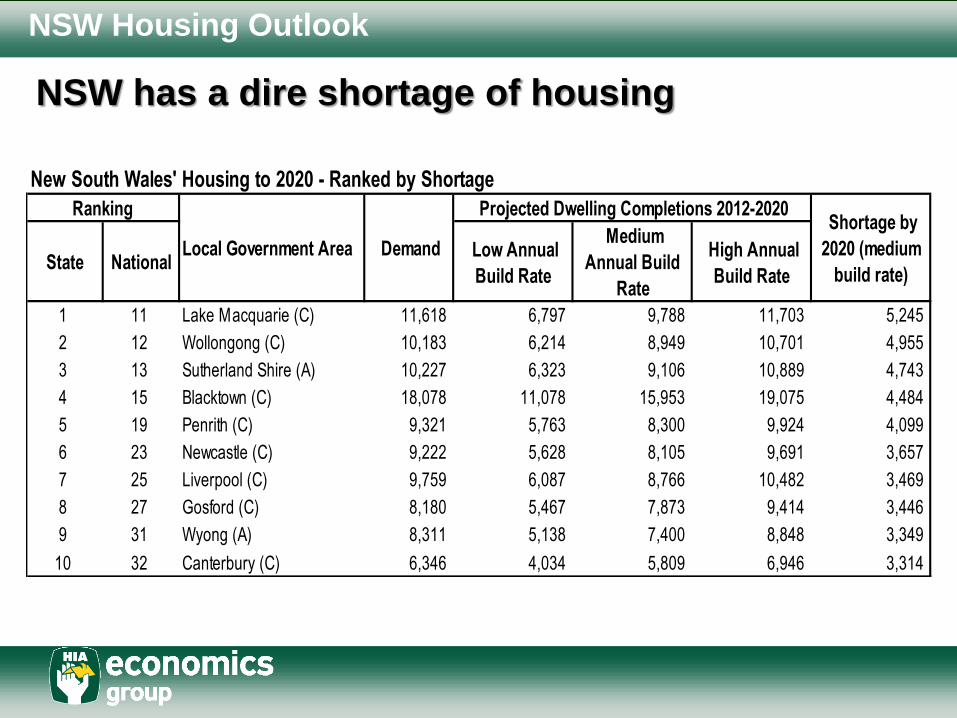
NSW has a dire shortage of housing
State National Low Annual
Build Rate
Medium
Annual Build
Rate
High Annual
Build Rate
1 11 Lake Macquarie (C) 11,618 6,797 9,788 11,703 5,245
2 12 Wollongong (C) 10,183 6,214 8,949 10,701 4,955
3 13 Sutherland Shire (A) 10,227 6,323 9,106 10,889 4,743
4 15 Blacktown (C) 18,078 11,078 15,953 19,075 4,484
5 19 Penrith (C) 9,321 5,763 8,300 9,924 4,099
6 23 Newcastle (C) 9,222 5,628 8,105 9,691 3,657
7 25 Liverpool (C) 9,759 6,087 8,766 10,482 3,469
8 27 Gosford (C) 8,180 5,467 7,873 9,414 3,446
9 31 Wyong (A) 8,311 5,138 7,400 8,848 3,349
10 32 Canterbury (C) 6,346 4,034 5,809 6,946 3,314
New South Wales' Housing to 2020 - Ranked by Shortage
Ranking
Local Government Area Demand
Projected Dwelling Completions 2012-2020 Shortage by
2020 (medium
build rate)

NSW Housing Outlook
So, what can be done?
• In December 2010 HIA Economics was the first group in Australia to point out that interest rates might need to fall in 2011 and that everybody was too bullish on the economy.
• In February 2011 this message was conveyed in person to the PM’s office and the need for assistance to residential building was conveyed.
• In March 2011 the same message was delivered to the Federal Treasurer’s office and a set of polices was provided to Commonwealth Treasury.
• HIA continued to communicate, in person and at arms-length, with the Treasurer and with Commonwealth Treasury.
• HIA also held two meetings with the Australian Bankers Association with regard to the lack of available finance for residential development.

NSW Housing Outlook
There needs to be a focus on taxation reform
• An independent report provides compelling evidence that:-
– New housing is one of the most heavily taxed sectors of the Australian economy.
– Among Australia’s 27 largest industrial sectors (> $10billion), the residential building sector is the second most heavily taxed sector.
– Including direct, indirect, and hidden taxes the tax on new housing is estimated at 44 per cent of a new house in Sydney, 38 per cent in Melbourne, and 36 per cent in Brisbane.
– Model simulations show that most of the burden of taxation falls on home buyers.
– Many of the taxes on housing are economically inefficient, ranging in value from $45,300 on a new apartment in Melbourne to $141,500 on a new house in Sydney.

NSW Housing Outlook
Total taxes on new houses and apartments
New homes New apartments
Sydney M elbourne Brisbane Sydney M elbourne Brisbane
Direct 75 422 63 312 55 170 73 694 55 607 52 238
Hidden/ambiguous 106 276 45 398 56 346 51 331 28 545 46 718
Indirect 86 180 75 071 79 265 84 598 73 058 72 504
Total 267 879 183 781 190 781 209 623 157 210 171 460
Data source: TheCIE 2011.
NSW Housing Outlook
Some wider findings
• The total taxes collected by governments for a new house is 44 per cent ($268,000) of the purchase price of a new home in Sydney.
• While Sydney houses yielded the highest figure, the other figures were also high.
• However, the tax burden of housing was found to be considerably higher in Sydney:-
– For houses the tax burden is 46 per cent higher in Sydney than in Melbourne; 40 per cent higher than in Brisbane.
– For apartments the tax burden is 33 per cent higher in Sydney than in Melbourne; 22 per cent higher than in Brisbane.

NSW Housing Outlook
Thank you for your time this
morning
Harley Dale
Chief Economist
HOUSING INDUSTRY ASSOCIATION
http://economics.hia.com.au