Embed Size (px)
Citation preview
The oxidation of sewage sludge in the liquid water phase atelevated temperatures and pressures : wet-air oxidationCitation for published version (APA):Ploos V Amstel, J. J. A. (1971). The oxidation of sewage sludge in the liquid water phase at elevatedtemperatures and pressures : wet-air oxidation. Eindhoven: Technische Hogeschool Eindhoven.https://doi.org/10.6100/IR114081
DOI:10.6100/IR114081
Document status and date:Published: 01/01/1971
Document Version:Publisher’s PDF, also known as Version of Record (includes final page, issue and volume numbers)
Please check the document version of this publication:
• A submitted manuscript is the version of the article upon submission and before peer-review. There can beimportant differences between the submitted version and the official published version of record. Peopleinterested in the research are advised to contact the author for the final version of the publication, or visit theDOI to the publisher's website.• The final author version and the galley proof are versions of the publication after peer review.• The final published version features the final layout of the paper including the volume, issue and pagenumbers.Link to publication
General rightsCopyright and moral rights for the publications made accessible in the public portal are retained by the authors and/or other copyright ownersand it is a condition of accessing publications that users recognise and abide by the legal requirements associated with these rights.
• Users may download and print one copy of any publication from the public portal for the purpose of private study or research. • You may not further distribute the material or use it for any profit-making activity or commercial gain • You may freely distribute the URL identifying the publication in the public portal.
If the publication is distributed under the terms of Article 25fa of the Dutch Copyright Act, indicated by the “Taverne” license above, pleasefollow below link for the End User Agreement:www.tue.nl/taverne
Take down policyIf you believe that this document breaches copyright please contact us at:[email protected] details and we will investigate your claim.
Download date: 17. May. 2020
THE OXIDATION OF SEWAGE SLUDGE IN THE LIQUID WATER PHASE
AT ELEVATED TEMPERATURES AND PRESSURES
(WET-AIR OXIDATION)
Fl t,;l-IT WATER
'POLLUTION NOW
J.J.A. PLOOS VAN AMSTEL
THE OXIDATION OF SEWAGE SLUDGE IN THE LIQUID WATER PHASE
AT ELEVATED TEMPERATURES AND PRESSURES
(WET-AIR OXIDATION)
PROEFSCHRIFT
TER VERKRIJGING VAN DE GRAAD VAN DOCTOR IN DE
.TECHNISCHE WETENSCHAPPEN AAN DE TECHNISCHE HO
GESCHOOL TE EINDHOVEN, OP GEZAG VAN DE RECTOR
MAGNIFICUS, PROF.DR.IR.A.A.TH.M.VAN TRIER,VOOR
EEN COMMISSIE UIT DE SENAAT IN HET OPENBAAR TE
VERDEDIGEN OP VRIJDAG 2 APRIL 1971 TE 16 UUR
DOOR
JOHANNES JACOBUS ASUERUS
PLOOS VAN AMSTEL
GEBOREN TE EINDHOVEN
DIT PROEFSCHRIFT IS GOEDGEKEURD DOOR DE PROMOTOR
PROF. DR. K. RIETEMA
CO-REFERENT
PROF. DRS. H.S. VAN DER BAAN
AAN OE KOMMUNE NUENEN
EN IN HET BIJZONOER AAN
PRINSES LISELORELEI
ACKNOWLEDGMENT
The thesis in this make-up would not have been completed but
for the contribution of many whom I would like to thank here.
I will mention in particular Mr. J. Bos for his interest in
the project and for his advice and assistance in the research
of the literature.
Thanks are also due to Mr. W.C. Koolmees who advised on the
design and construction of the apparatus, and to Messrs. P.A.
Hoskens and A.H. van der Stappen, who constructed and put to
gether the equipment.
Furthermore I am indebted to Messrs A.W.C.M.van Alphen, F.C.M.
van de Berg, C.G.M. de Boer, F.H.J. Bukkems, P.J.A.M. Derks,
H. van Gool, G. Groen, c. van de Moesdijk, P.J.T. Samuels ' H.J.C. Slegers, F.C.R.M. Smits, H.P.E. van de Venne and P. van
Zutphen, who carried out most of the experiments.
Almost all technical drawings have been made by Mr.J.Boonstra,
the remainder by Mr.Klein Wassink. Mrs. D.M.Vermeltfoort typed
the text which was edited by Miss G.M. Kurten. I would like to
thank both ladies and both gentlemen for the accuracy with
which they carried out their work.
I am very grateful to Mr. H.J.A. van Beckum, who made this
thesis readable by correcting the language and to Ton Smits,
the famous artist,who made this thesis digestible by his witty
cartoons.
I wish to thank in particular the directors of the Architekten
en Ingenieurs Bureau of the N.V. Philips' Gloeilampenfabrieken
for the assistence offered during the final stages of this
work.
Finally, I include in my acknowledgement my wife and also
Mr. J. Waterman for their encouragement during the last weeks
of the preparation of the thesis.
VI
CONTENTS
SUMMARY
1. TREATMENT AND DISPOSAL OF SEWAGE
2.
1.1. INTRODUCTION
1. 2. WASTE WATER TREATMENT
1.3. SEWAGE SLUDGES
1.4. SEWAGE SLUDGE TREATMENT AND DISPOSAL
THE WET-AIR OXIDATION PROCESS
2.1. EVOLUTION OF THE PROCESS
2.2. OXIDATION "ROUTES"
2.3. INFLUENCE OF PROCESS PARAMETERS
2.4. END PRODUCTS
2.5. COST OF PROCESS
2.6. LITERATURE REVIEUWS
2.7. CONCLUSIONS
x
1
1
2
3
5
8
8
9
10
13
13
14
14
3. THE OXIDATION OF A GLUCOSE SOLUTION AS A MODEL SLUDGE 15
3.1. PRELIMINARY EXPERIMENTS
3.1.1. Apparatus and experimental details
3.1.2. Thermal treatment and its influence on
the oxidation
3.1.3. Influence of shaker frequency
3.1.4. Homogeneous oxidation of glucose
3.1.5. The maximum conversion
15
15
16
19
21
23
VII
3.1.6. Mathematical description of conversion
rate
3.2. CONTINUOUS FLOW EXPERIMENTS
3.2.1. Apparatus and experimental details
3.2.2. Influence of temperature
3.2.3. Influence of COD concentration in the
24
25
25
27
feed and oxygen pressure 29
3.3. THEORETICAL ANALYSIS OF RESULTS AND DISCUSSION 30
3.3.1. Introduction
3.3.2. Model for the macro kinetics
3.3.3. Model for the micro kinetics
3.3.4. Speculations on the order of magnitude
30
32
36
of kinetic data 40
4. THE DISSOLUTION OF SLUDGE
4.1. APPARATUS AND EXPERIMENTAL DETAILS
4.2. THE HYDROLYSIS OF SLUDGE PARTICLES
4.2.1. The rate of hydrolysis of activated
sludge
46
46
47
47
4.2.2. The rate of hydrolysis of primary sludge 51
4.2.3. Repeated-hydrolysis 53
4.3. INFLUENCE OF CONCENTRATION AND OF OPERATING
CONDITIONS ON [cmax] 54
5. THE OXIDATION OF PRIMARY SLUDGE 57
5.1. PRELIMINARY BATCH EXPERIMENTS
5.2. SEMI-BATCH EXPERIMENTS
57
59
VIII
5.2.1. Apparatus and Experimental details 60
5.2.2. Model for oxidation in a semi~batch system 62
5.2.3. Results and discussion 66
6. THE OXIDATION OF ACTIVATED SLUDGE
6 .1.
6.2.
6.3.
6.4.
EXTENSION OF THE MODEL
APPARATUS AND EXPERIMENTAL DETAILS
EXPERIMENTS WITH SLUDGES OF DIFFERENT ORIGINS FURTHER EXPERIMENTS WITH EINDHOVEN SLUDGE
6.4.1. Influence of temperature
74
74
76
77
79
79
6.4.2. Evaluation of kinetic data and discussion 81
6.4.3. Influence of pressure 86
7. GENERAL DISCUSSION AND CONCLUSIONS 89
7 .1.
7.2.
7.3.
COMPARISON BETWEEN MODEL SLUDGE AND OTHER SLUDGES
7.1.1.
7.1.2.
Reaction orders
Locus of oxidation and diffusion
limitation
7.1.3. Reaction rate constants
7.1.4. Effect of dissolution
7.1.5. Sludges of different origins
ANOMALOUS PHENOMENA
CALCULATIONS OF THE SIZE OF COMMERCIAL REACTORS
REFERENCES
NOMENCLATURE
SAMENVATTING
LEVENSBESCHRIJVING
89
89
90
90
92
93
93
94
102
107
110
113
IX
SUMMARY
Wet-air oxidation is a method of sewage sludge treatment by
which the sludge is oxidised in a liquid water phase in the 0 presence of air at temperatures of about 200-300 c and pres-
sures of 40-120 atm. From an analysis of the literature on the
subject it became clear that this process had apparently been
developed empirically and that only little insight into the
fundamental aspects was present.
Because of the attractiveness of wet-air oxidation, a research
project was carried out in which a process engineering ap
proach was applied.
First the oxidation of a glucose solution as a model sludge
was investigated with semi-batch and continuous flow experi
ments at about 200°c and 50 atm.It followed from these experi
ments that the oxidation of the model sludge was fast compared
with diffusion of oxygen. This caused the oxidation to take
place within the diffusion layer around the gas bubbles. The
chemical reaction rate can be described as first order in or
ganic matter and zero order in oxygen, while the reaction rate -1 0
constant is about 2 sec at 200 c.
A model is presented for the conversion in the continuous flow
reactor, including combined reaction and diffusion, mixing and
convection. This model gives a fair description of the influ
ence of process parameters on the conversion and of the con
centration profiles in the reactor.
At the high temperatures applied in practice real sludges
partly pass into solution by hydrolysis. Owing to this, simul
taneous oxidation of hydrolised sludge and sludge particles
takes place.
In order to understand the contribution of the oxidation of
hydrolised sludge to the total conversion rate, the hydrolysis
of sludge was investigated with batch experiments.
x
The effect of hydrolysis on the overall conversion rate was
studied, using primary sludge. Oxidation experiments were
carried out at 230°c and 100 atrn with sludge as such, with
hydrolised sludge and with a suspension of the solid residue
of hydrolysis.
From these investigations it was concluded that hydrolysis
does not influence the overall conversion rate, since hydro
lised sludge and solid sludge have almost the same reactivity.
The oxidation of activated and primary sludge proceeds more
slowly than the oxidation of the model sludge, and the conver
sion takes mainly place in the bulk of the sludge. The degree
of diffusion limitation of oxygen, or the extent to which the
conversion rate is reduced by oxygen transfer depends on temp
erature. At 180°c mass transfer can be neglected, while at
290°c the conversion rate is largely determined by the rate of
mass transfer.
A model for the oxidation of sludges is presented.The starting
point of this model is that in the sludge two groups of com
ponents can be distinguished which differ in reactivity and
which are oxidised simultaneously, while furthermore a third
group is present which is completely inactive. Experiments
have shown that activated sludge consists for about 65% of
more reactive matter, 25% of less reactive matter and 10% of
inactive matter. The chemical reaction rate was described as
first order in organic matter and first order in oxygen (at
relatively high oxygen pressures, the reaction becomes zero
order in oxygen). Mass transfer is also included in the model.
It was found that this model provides a fair description of
the experimental findings. The effect of temperature on the
reaction rate constants of both oxidisable groups in activated
sludge can be described by Arrhenius' law,while the activation
energy is about 23 kcal/mol for both groups. At 255°c the re
action rate constants are 250 and 20 m3/kg h, respectively.
XI
On the ground of the results of the research the size of a
commercial reactor was calculated. Depending on the amount of
surplus oxygen, the required residence time in a plug flow re
actor operated in co-current was two to three times as long as
in a plug flow reactor operated in counter-current, while the
required residence time in a reactor in which the liquid was
completely mixed, was 6 to 12 times as long as in a counter
current reactor.
In practice, a co-current reactor is applied, in which the
mixing state will be somewhere between completely mixed and
plug flow, which will require a residence time of about five
times that in the counter-current plug flow reactor. For prac
tical reasons, however, the co-current reactor applied in com
mercial installations, will probably remain more attractive.
XII
-
~,,, '
Chapter 1 TREATMENT AND DISPOSAL OF SEWAGE
1.1. INTRODUCTION
For many centuries sewage has been discharged into streams, lakes and ponds, and even now this is a very normal procedure. In these natural waters micro-organisms consume the discharged
contaminations, while at the same time the solids of the sew
age settle, both mechanisms resulting in natural purificat.ion. In order to avoid pollution of natural waters, the discharge
of sewage should balance the natural purification capacity of
the receiving water. When the flow of waste water exceeds this
capacity, the contaminations in the waste water must be reduced by a suitable treatment.
In general, the pollution of natural waters is objectionable
for the possible hazard to public health and safety.Of a lesser consequence, but still very real, is the aesthetic aspect of the deterioration of surface water. Before long this aspect
1
will also weigh more heavily, because the increasing amount
of leisure time and wealth imply increased recreation at, on
and in the water (1, 2, 3).
For the reduction of contaminations in the waste water a varie
ty of waste water treatment processes is available ( 1, 2, 4,
5, 6, 7). Such a treatment generally results in a flow of more
or less clean water and in a second small flow containing con
centrated suspended impurities known as sewage sludge. In the
present procedures the sewage sludge undergoes a further treat
ment towards a form suitable for one or another method of fi
nal disposal, like dumping or soil conditioning (11, 33, 34,
35, 36).
1.2. WASTE WATER TREATMENT
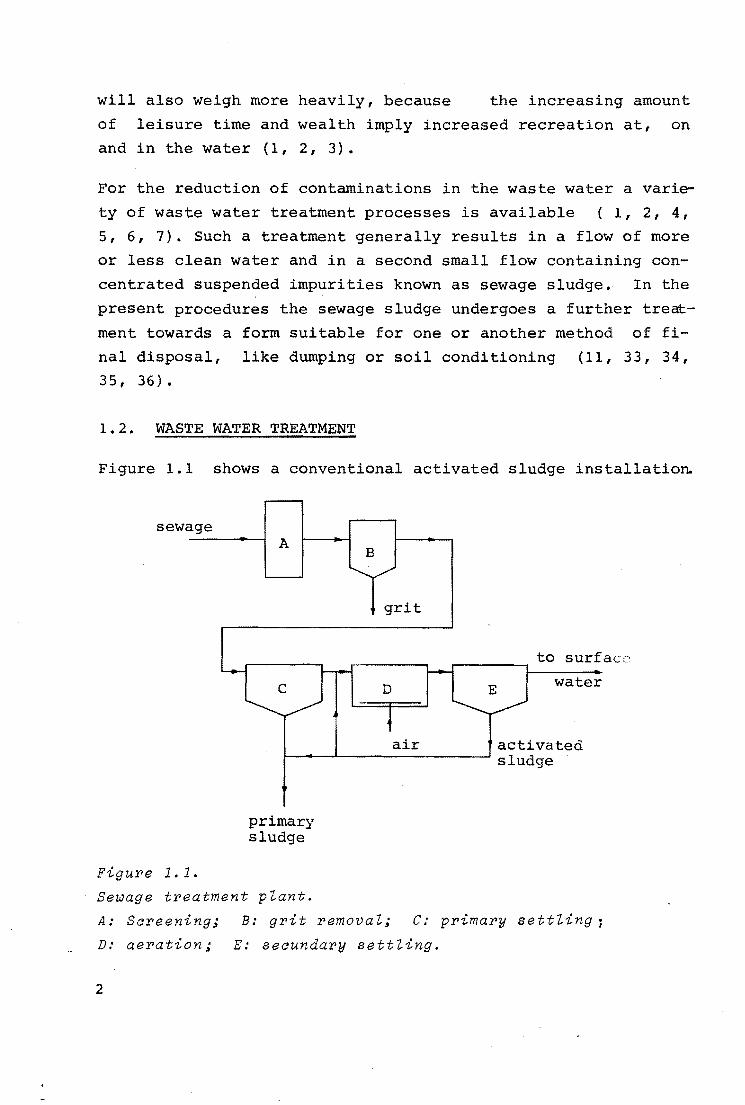
Figure 1.1 shows a conventional activated sludge installation.
sewage
Figure 1.1.
A B
grit
D
to surf ace
water
air activated 1----~'--~~~~~~~--' sludge
primary sludge
Sewage treatment plant.
A: Sereening; B: grit removal; C: primary settling;
D: aeration; E: seeundary settling.
2
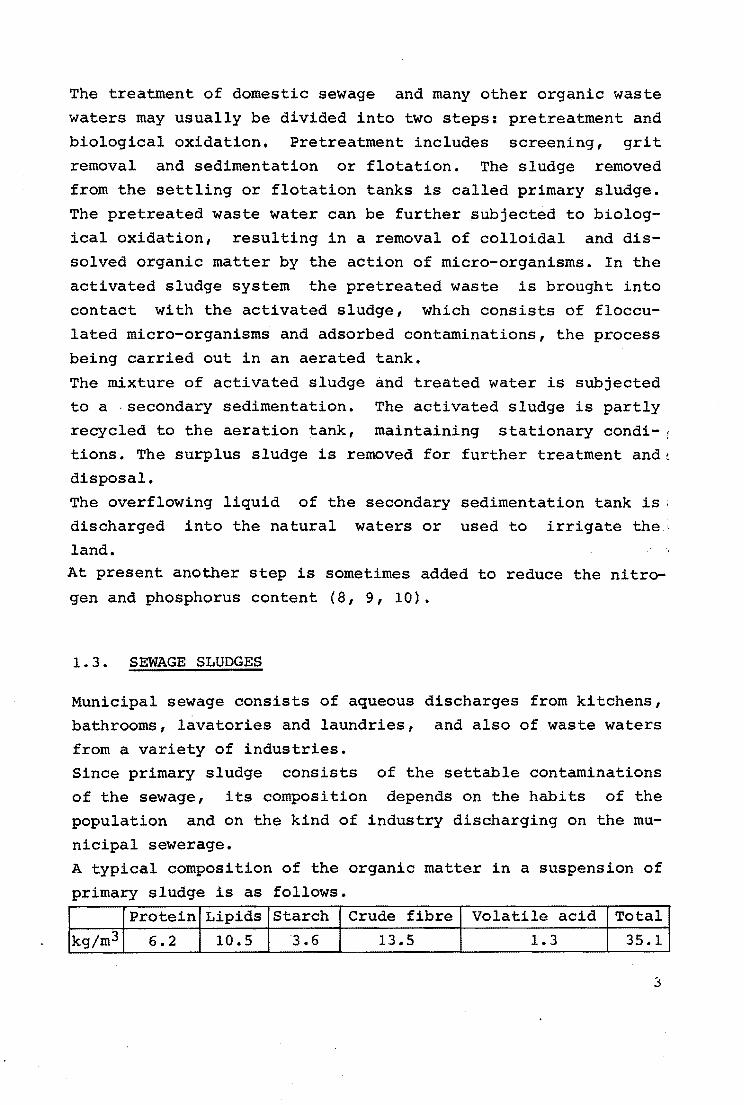
The treatment of domestic sewage and many other organic waste
waters may usually be divided into two steps: pretreatment and
biological oxidation. Pretreatment includes screening, grit removal and sedimentation or flotation. The sludge removed
from the settling or flotation tanks is called primary sludge.
The pretreated waste water can be further subjected to biological oxidation, resulting in a removal of colloidal and dis
solved organic matter by the action of micro-organisms. In the
activated sludge system the pretreated waste is brought into
contact with the activated sludge, which consists of floccu
lated micro-organisms and adsorbed contaminations, the process being carried out in an aerated tank.
The mixture of activated sludge and treated water is subjected
to a .secondary sedimentation. The activated sludge is partly recycled to the aeration tank, maintaining stationary condi- 1
tions. The surplus sludge is removed for further treatment andi disposal.
The overflowing liquid of the secondary sedimentation tank is . discharged into the natural waters or used to irrigate the .
land. At present another step is sometimes added to reduce the nitro
gen and phosphorus content (8, 9, 10).
1.3. SEWAGE SLUDGES
Municipal sewage consists of aqueous discharges from kitchens,
bathrooms, lavatories and laundries, and also of waste waters
from a variety of industries. Since primary sludge consists of the settable contaminations of the sewage, its composition depends on the habits of the population and on the kind of industry discharging on the mu
nicipal sewerage. A typical composition of the organic matter in a suspension of
primary sludge is as follows.
Protein Lipids Starch Crude fibre Volatile acid Total
kg/m3 6.2 10.5 3.6 13.5 1.3 35.1
3
Deviations from these figures have to be expected. The amount
of inorganic matter in primary sludge is also subject to vari
ations and may differ from plant to plant. The primary sludge
of Eindhoven contains an amount of inorganic matter of about
20 kg/m3.
The composition and physical properties of the sludge have a
great influence on the selection of the sewage sludge treat
ment procedure.
Activated sludge arises spontaneously in an activated sludge
installation from the micro-organisms present in the waste
water. It consists of flocculated bacteria, protozoa, etc.
and adsorbed material.
The chemical composition is about
C118H170051N17p
The bacteria have a diameter of 0.5 to 1.5µ and are seldom
longer than 10µ.
Their slimy skin causes them to be grouped together into tenu
ous flocks which may have characteristic dimensions of 20 to
100µ.
The concentration of organic contaminations in sewage and sew
age sludge is often characterised by the biological oxygen de
mand (BOD). This is the amount of oxygen which is consumed per
unit volume by the action of micro-organisms on the contamina
tions (77). In general the BOD is expressed in mg/1.
Another characterisation of the concentration which will be
used in this thesis is the chemical oxygen demand (COD).
The COD is the amount of oxygen necessary per unit volume for
oxidation with a dichromate-sulfuric acid mixture under stand
ard conditions (77). In general the COD is also expressed in
mg/1. However, in this thesis practical units are used, so the
COD is expressed in kg/m3.
Since the break-down by the dichromate-sulfuric acid mixture
in general proceeds further than by the action of the micro
organisms, the COD is higher than the BOD. The relation be-
4
tween BOD and COD will frequently vary.For domestic waste wat
er Hunter <i27) reports that
COD ::::: 2 BOD
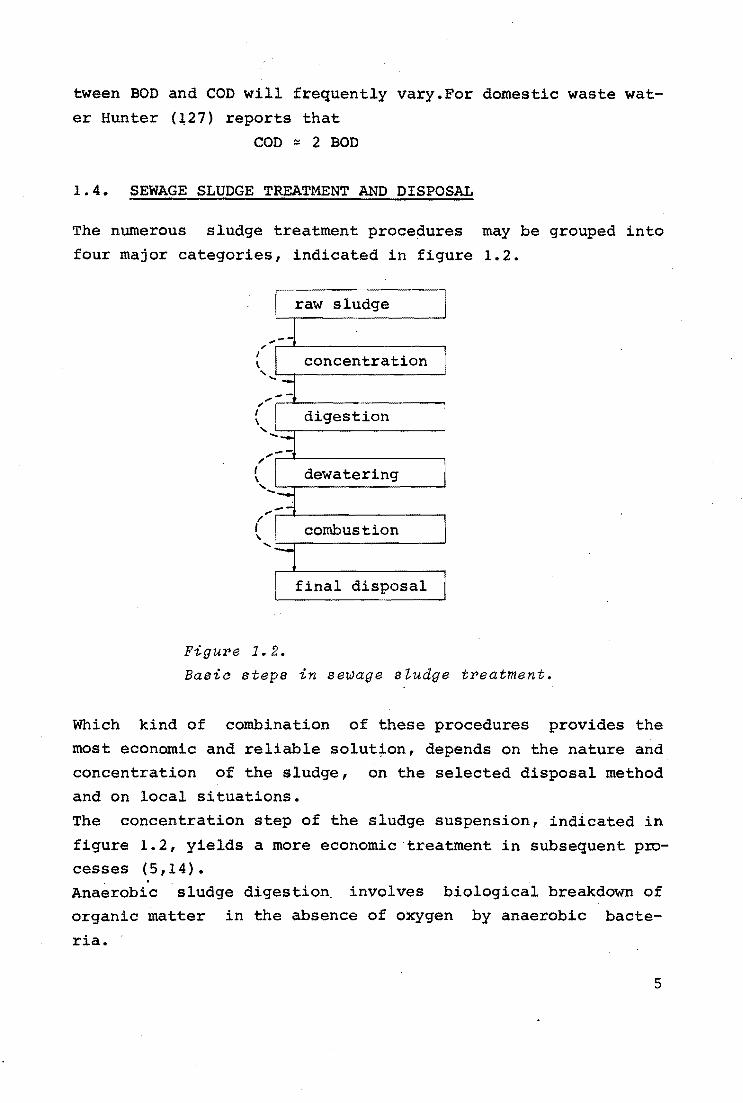
1.4. SEWAGE SLUDGE TREATMENT AND DISPOSAL
The numerous sludge treatment procedures may be grouped into
four major categories, indicated in figure 1.2.
raw sludge
,--concentration
digestion
dewatering
combustion
final disposal
Figure 1.2.
Basic steps in sewage sZudge treatment.
Which kind of combination of these procedures provides the
most economic and reliable solut~on, depends on the nature and concentration of the sludge, on the selected disposal method and on local situations.
The concentration step of the sludge suspension, indicated in
figure 1.2, yields a more economic treatment in subsequent p:rocesses ( 5, 14) • Anaerobic sludge digestion. involves biological breakdown of organic matter in the absence of oxygen by anaerobic bacte-
ria.
5
Dewatering by filtration, centrifuging or by the use of drying
beds, results in a sludge of a more or less solid state. How
ever, flocculation agents have to be added (15, 16, 17, 18).
Increase of filtration rate can also be obtained by heating
the sludge for half an hour at 180-200°c and 10-15 atmospheres,
resulting in the disappearance of the colloidal structure (13,
21, 22, 23, 119).
This heat treatment process produces a sludge with an offen
sive smell, which, however, disappears when air is also fed to
the reactor, resulting in partial oxidation (2, 4, 15).
Combustion reduces the volume of the solids. The final product
is a mineral and odourless ash.
Two groups of combustion processes can be distinguished:
(i) without previous dewatering (20, 26, 27, 28, 38),
e.g. the wet-air oxidation process;
(ii) with previous dewatering and heat drying (20, 29, 30),
e.g. combustion in a fluidised bed.
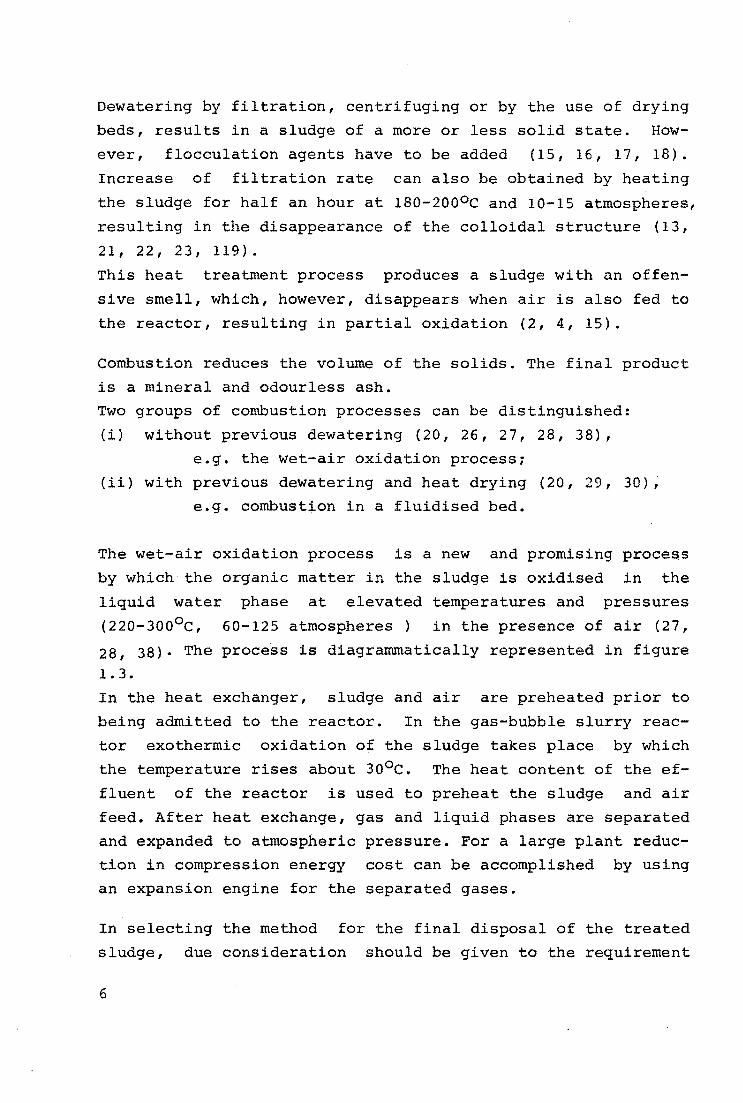
The wet-air oxidation process is a new and promising process
by which the organic matter in the sludge is oxidised in the
liquid water phase at elevated temperatures and pressures
(220-300°c, 60-125 atmospheres ) in the presence of air (27,
28, 38)· The process is diagrammatically represented in figure
1.3.
In the heat exchanger, sludge and air are preheated prior to
being admitted to the reactor. In the gas-bubble slurry reac
tor exothermic oxidation of the sludge takes place by which
the temperature rises about 30°c. The heat content of the ef
fluent of the reactor is used to preheat the sludge and air
feed. After heat exchange, gas and liquid phases are separated
and expanded to atmospheric pressure. For a large plant reduc
tion in compression energy cost can be accomplished by using
an expansion engine for the separated gases.
In selecting the method for the final disposal of the treated
sludge, due consideration should be given to the requirement
6
sludge pump
sludge
Figure 1.3.
eactor
expansion engin
stack gas
air
compressor
oxidised sludge
Wet-air oxidation process.
that public heal th or safety· shall not be impaired and no new
pollution problem is generated.
When modern treatment procedures like wet-air oxidation are
applied, the final disposal of the sterile inorganic ashes
will give no problems.
7
Chapter 2
0 l
-
THE WET-AIR OXIDATION PROCESS
2.1. EVOLUTION OF THE PROCESS
The history of wet-air oxidation starts in 1912 when
Strehlenert (41) patents a method for the treatment of spent
sulfite liquor from paper mills with compressed air at 180°c.
In later versions of the process the oxidation of the paper
mill effluent is performed at temperatures ranging from 230 -
330°c. This method was first patented in Sweden in 1949 by
Cederquist (42, 44, 45); his process has not been applied in
practice (46).
Independently, Zinunermann patented nearly the same process(43)
in the U.S.A. in 1950. This patent was followed by many others
for a diversity of operating conditions and process perform
ances (e.g. 47/69). The development and promotion of his pro
cess was carried out by the ZIMPRO (ZIMmermann PROcess) divi
sion of Sterling Drug. The first conunercial installation for
the oxidation of spent sulfite liquor, had to be shut down
8
after a short time because of corrosion (70, 71, 72). Till
February 1969, 18 other installations were sold (73). The
largest installation is located near Chicago and has a capac
ity of 200 tons of dry sludge per day.
A patent for a system of wet-air oxidation in a deep shaft ex
tending into the earth was awarded to Bauer (112). The depth
of the shaft was made sufficient to provide the required high
pressure.
The first patents claimed nearly complete oxidation and atten
tion was focussed on paper mill effluent. Attention was changed to sewage sludge and the advised degree of oxidation was gradually reduced. Nowadays 5-20% oxidation
is applied at relatively low temperatures of 180 - 200°c, with the prime object of obtaining a better drainable sludge so
that the original combustion process is transformed into a conditioning process prior to dewatering.
However, owing to the attractive possibilities of the orig·inal combustion version and owing to the fact that this process has
never been approached in a process-engineering manner, we carried out an investigation of the high temperature version,
which is embodied in this thesis.
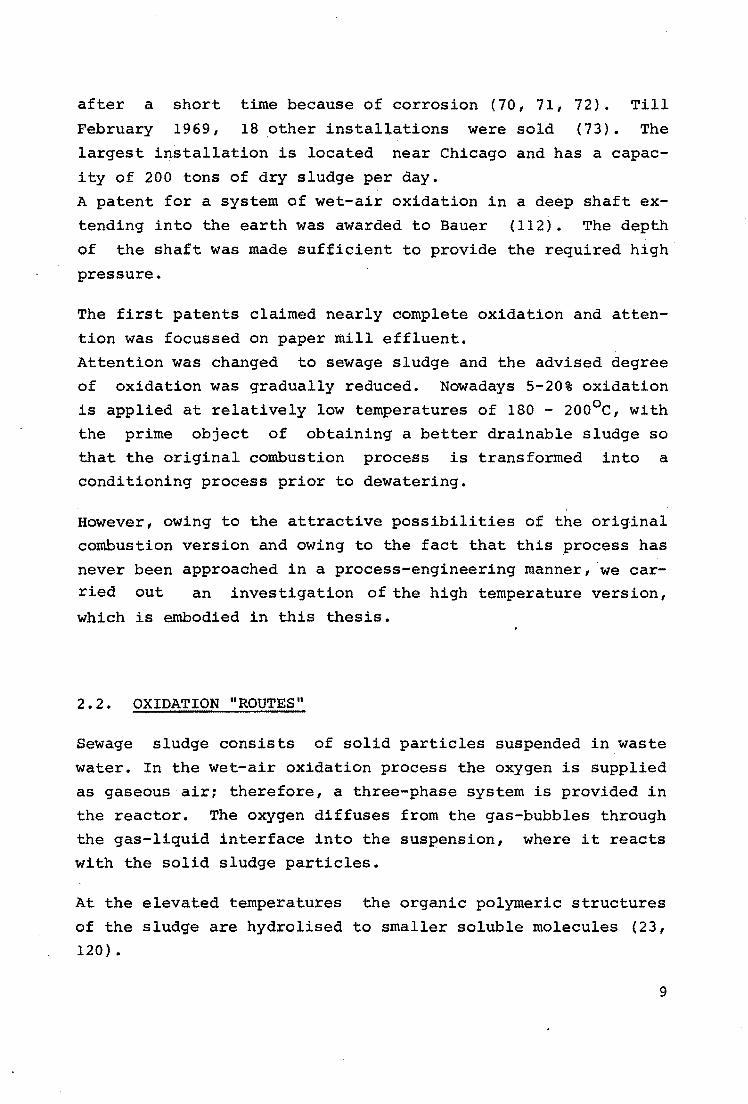
2.2. OXIDATION "ROUTES"
Sewage sludge consists of solid particles suspended in waste
water. In the wet-air oxidation process the oxygen is supplied
as gaseous air; therefore, a three-phase system is provided in
the reactor. The oxygen diffuses from the gas-bubbles through the gas-liquid interface into the suspension, where it reacts with the solid sludge particles.
At the elevated temperatures the organic polymeric structures
of the sludge are hydrolised to smaller soluble molecules (23, 120).
9
Teletzke (75) observed the formation of free amino acids, free
fatty acids and lower sugar molecules.
Hurwitz ( 76 ) presents data from which it follows that the
fraction of organic material which is dissolved increases rap
idly with temperature and approaches 1 at 260°c.
As a result of this dissolution the oxidation of sewage sludge
can proceed via the solid particles as well as via the dis
solved matter.
Takamatsu (129) assumed that the oxidation only proceeds
through dissolved matter, but he did not prove this experimen
tally.
In this respect it can be referred to a patent of a system of
wet-air oxidation in which the sludge is first hydrolised as
far as possible. After settling of the solid residue which
takes place under the high temperature and pressure, only the
sludge solution is oxidised (114).
By the wet-air oxidation volatile products like acetic acid
might be generated. Oxidation of volatile products only takes
place in the liquid; in the gas phase no oxidation was ever
observed at the applied conditions (70,74).
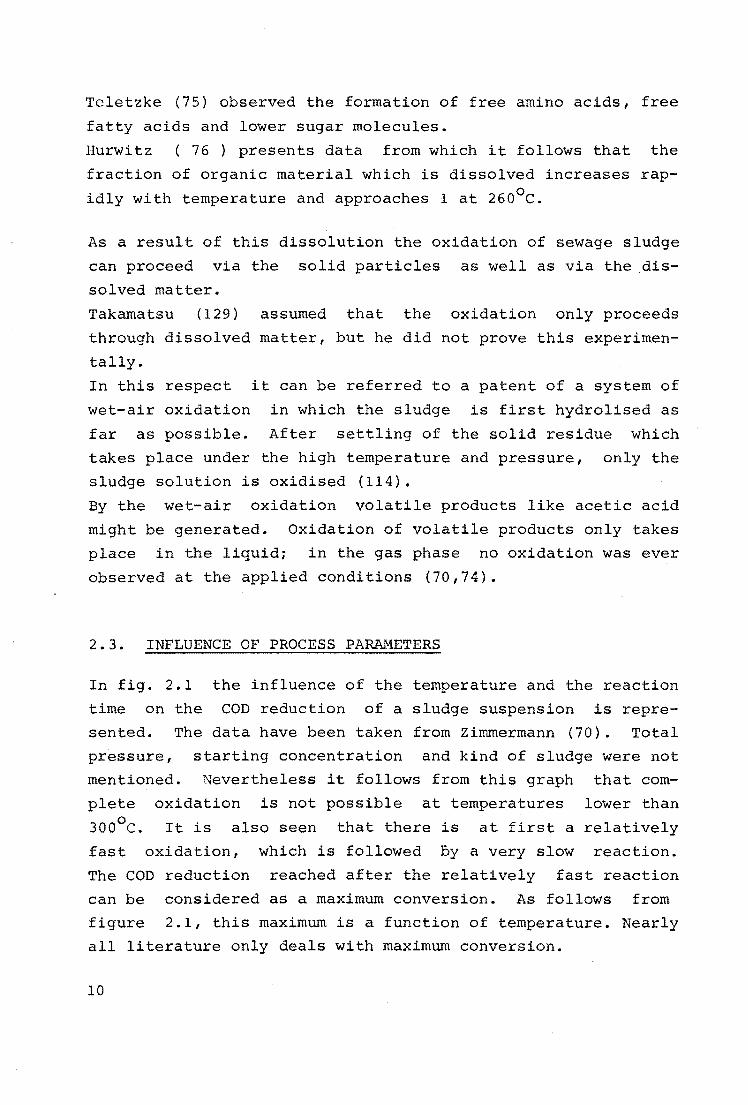
2.3. INFLUENCE OF PROCESS PARAMETERS
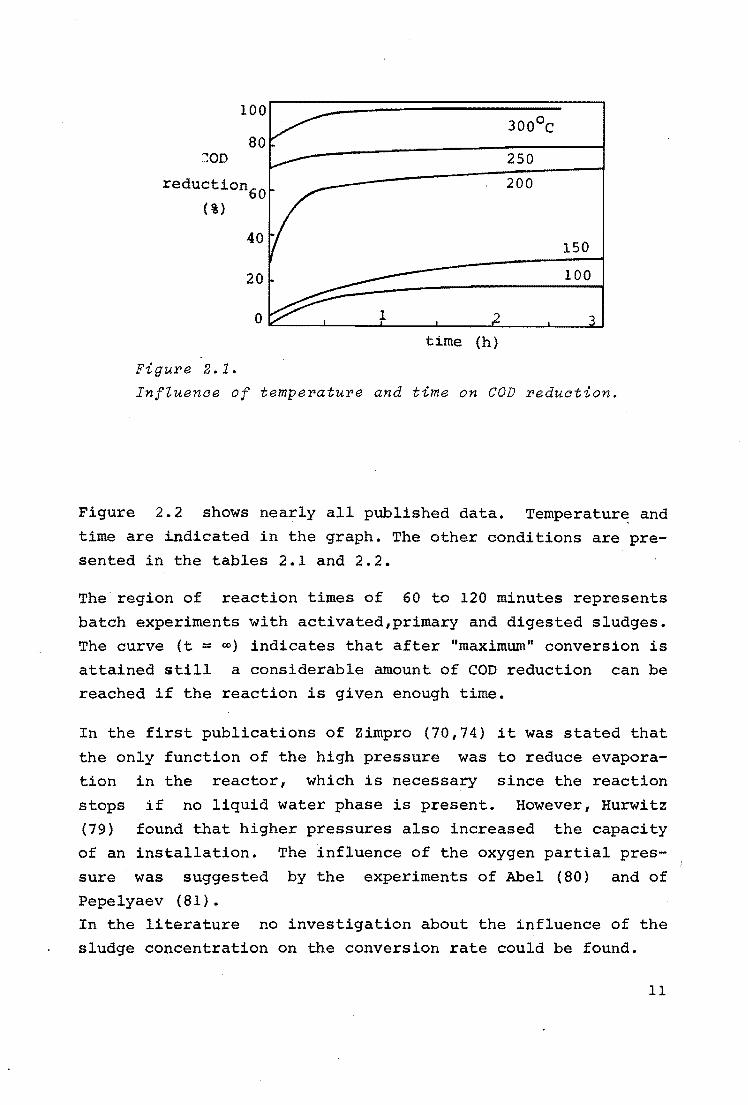
In fig. 2.1 the influence of the temperature and the reaction
time on the COD reduction of a sludge suspension is repre
sented. The data have been taken from Zimmermann (70). Total
pressure,
mentioned.
starting concentration and kind of sludge were not
Nevertheless it follows from this graph that com-
plete
3oo0 c. fast
oxidation is not possible at temperatures lower than
It is also seen that there is at first a relatively
oxidation, which is followed ny a very slow reaction.
The COD reduction reached after the relatively fast reaction
can be considered as a maximum conversion. As follows from
figure 2.1, this maximum is a function of temperature. Nearly
all literature only deals with maximum conversion.
10
ioor-~-:::::::==================:---i
80 ~OD
reduction60
(%)
40
20
Figure 2.1.
time (h)
3oo0 c 250
200
150
100
InfZuenae of temperature and time on COD reduation.
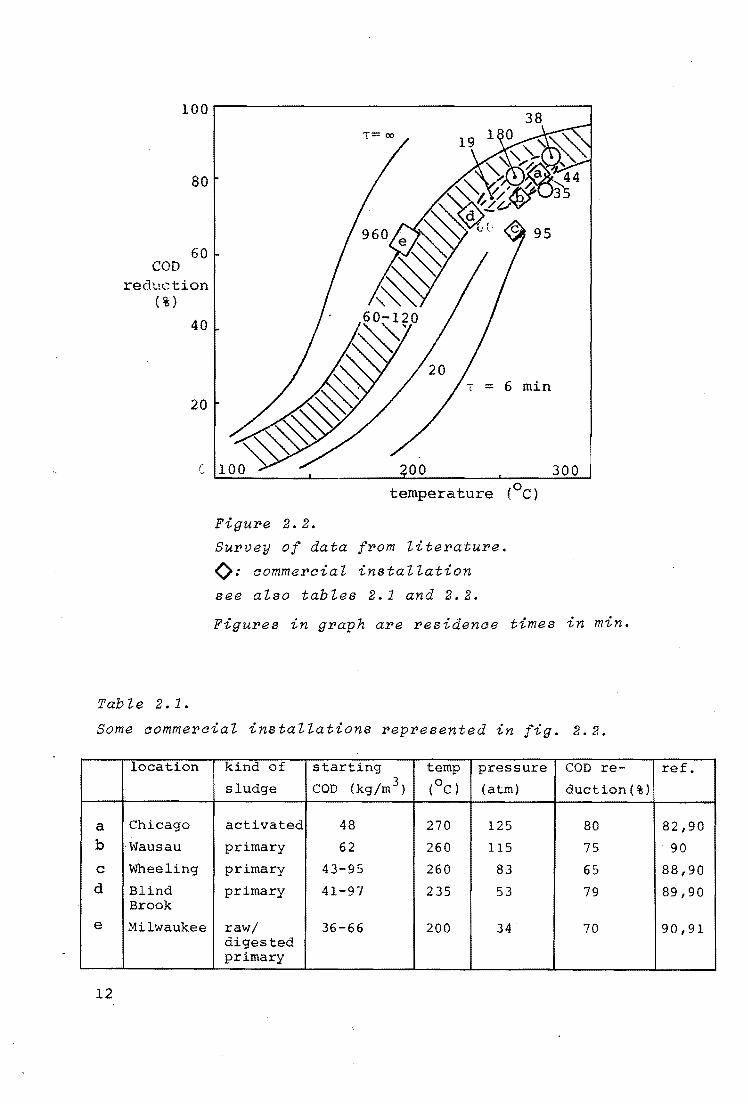
Figure 2.2 shows nearly all published data. Temperature: and
time are indicated in the graph. The other conditions are pre
sented in the tables 2.1 and 2.2.
The region of reaction times of 60 to 120 minutes represents
batch experiments with activated,primary and digested sludges.
The curve (t = 00 ) indicates that after "maximum" conversion is
attained still a considerable amount of COD reduction can be
reached if the reaction is given enough time.
In the first publications of Zimpro (70,74) it was stated that
the only function of the high pressure was to reduce evapora
tion in the reactor, which is necessary since the reaction
stops if no liquid water phase is present. However, Hurwitz
(79) found that higher pressures also increased the capacity
of an installation. The influence of the oxygen partial pres-
sure was suggested by the experiments of Abel (80) and of
Pepelyaev (81).
In the literature no investigation about the influence of the
sludge concentration on the conversion rate could be found.
11
80
60 COD
rec11.lction ( % )
40
20
c
Tab le 2. 1.
temperature (0 c)
Figure 2. 2.
Survey of data from literature.
(): aommeroial installation
see also tables 2.1 and 2.2.
Figures in graph are residenae times in min.
Some aommeroial installations represented in fig. 2.2.
location kind of starting temp pressure COD re-
sludge COD (kg/m3 ) (OC) (atm) duction(%)
a Chicago activated 48 270 125 80 b ·Wausau primary 62 260 115 75
c Wheeling primary 43-95 260 83 65 d Blind primary 41-97 235 53 79
Brook
e Milwaukee raw/ 36-66 200 34 70 digested primary
12
ref.
82,90
90
88,90
89,90
90,91
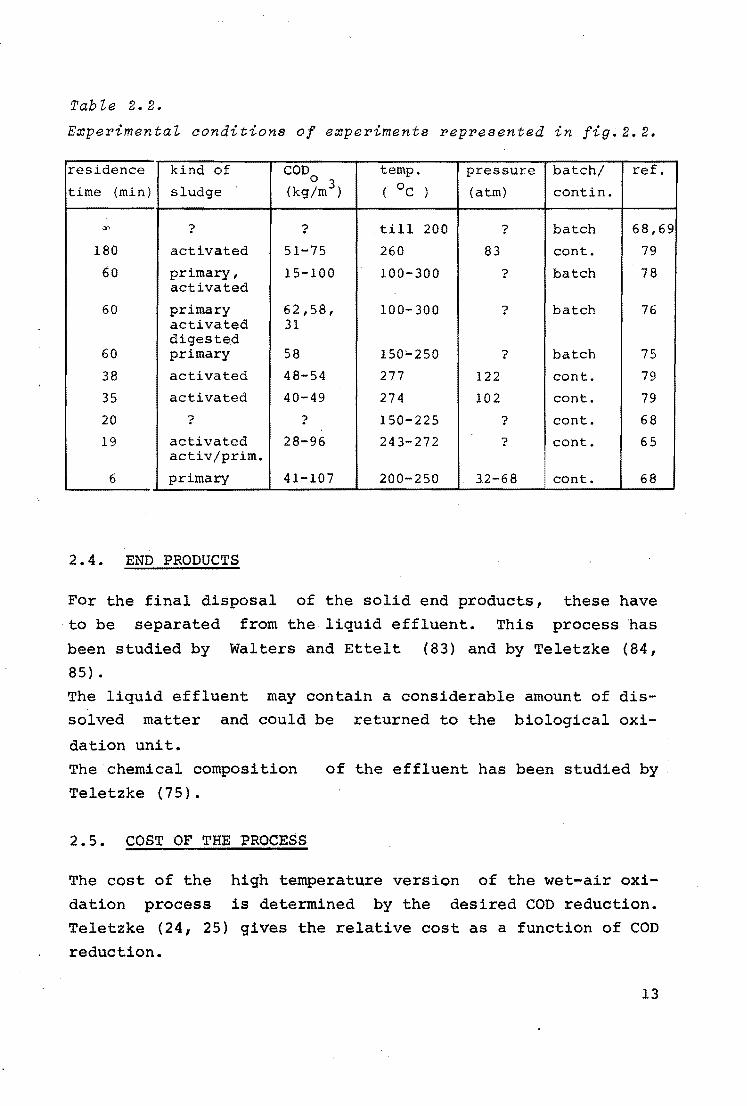
Tabie 2.2.
Experimentai conditions of experiments represented in fig.2.2.
residence kind of COD temp. pressure batch/ ref.
time (min) sludge 0 3
( OC ) (atm) contin. (kg/m )
"' ? ? till 200 ? batch 68,69
180 activated 51-75 260 83 cont. 79
60 primary, 15-100 100-300 ? batch 78 activated
60 primary 62,58, 100-300 ? batch 76 activated 31 digested
60 primary 58 150'-250 ? batch 75
38 activated 48-54 277 122 cont. 79
35 activated 40-49 274 102 cont. 79
20 ? ? 150-225 ? cont. 68
19 activated 28-96 243-272 ? cont. 65 activ/prim.
6 primary 41-107 200-250 32-68 cont. 68
2.4. END PRODUCTS
For the final disposal of the solid end products, these have
·to be separated from the liquid effluent. This process has
been studied by Walters and Ettelt (83) and by Teletzke (84,
85) •
The liquid effluent may contain a considerable amount of dis
solved matter and could be returned to the biological oxi
dation unit.
The chemical composition
Teletzke (75).
2 • 5 • COST OF THE PROCESS
of the effluent has been studied by .
The cost of the high temperature version of the wet-air oxi
dation process is determined by the desired COD reduction.
Teletzke (24, 25) gives the relative cost as a function of COD
reduction.
13
The absolute cost presented in the literature shows a consid
erable scatter. For the Chicago installation Goldstein (82)
reports $23 per ton dry sludge, which does not include inter
est on capital investment. Five years later, Dalton (32) mentions $50 per ton for the
same installation. He also refers to cost of other sludge
treatment processes at the Chicago sewage plant.
2.6. LITERATURE REVIEWS
In the literature a great many reviews on wet-air oxidation
have appeared in several languages. In English, e.g. refs.
(92)/(97), (111); in German, e.g. refs. (98)/(102); in Polish ,
e.g. refs. (103, 104); in Dutch, ref. (105); in Swedish,ref.
(106). Some additional experimental data can be found in refs.
(107, 108, 109).
2.7. CONCLUSIONS
From the literature it follows that the wet-air oxidation of
sludge is influenced by the temperature
Quantitative influences are not published.
and the pressure.
Quite clear is the
effect of temperature on the maximum conversion; however, the
rate by which this is achieved is unknown. Furthermore, no information was found concerning
(i) The kinetics of the reaction.
(ii) The influence of oxygen transfer from the gas phase into
the suspension.
(iii) The dissolution of solid sludge particles,which may have
an effect on the oxidation rate by, e.g., different stabilities of solid and hydrolised, dissolved sludge.
(iv) The influence of mixing in the reactor.
Without knowledge of or insight into these factors, a proper
design of a wet-air oxidation process cannot be expected. Only
after realisation of such a design can a fair comparison of
cost with conventional sludge treatment procedures be made.
14
Chapter 3 THE OXIDA1.ION OF A GLUCOSE
SOLUTION AS A MODEL SLUDGE
In order to obtain insight into the general behaviour of wetair oxidations, the research project was started with the oxi
dation in a two-phase gas-liquid system of a model sludge for
which a solution of glucose was selected, glucose being repre
sentative of the group of carbohydrates.
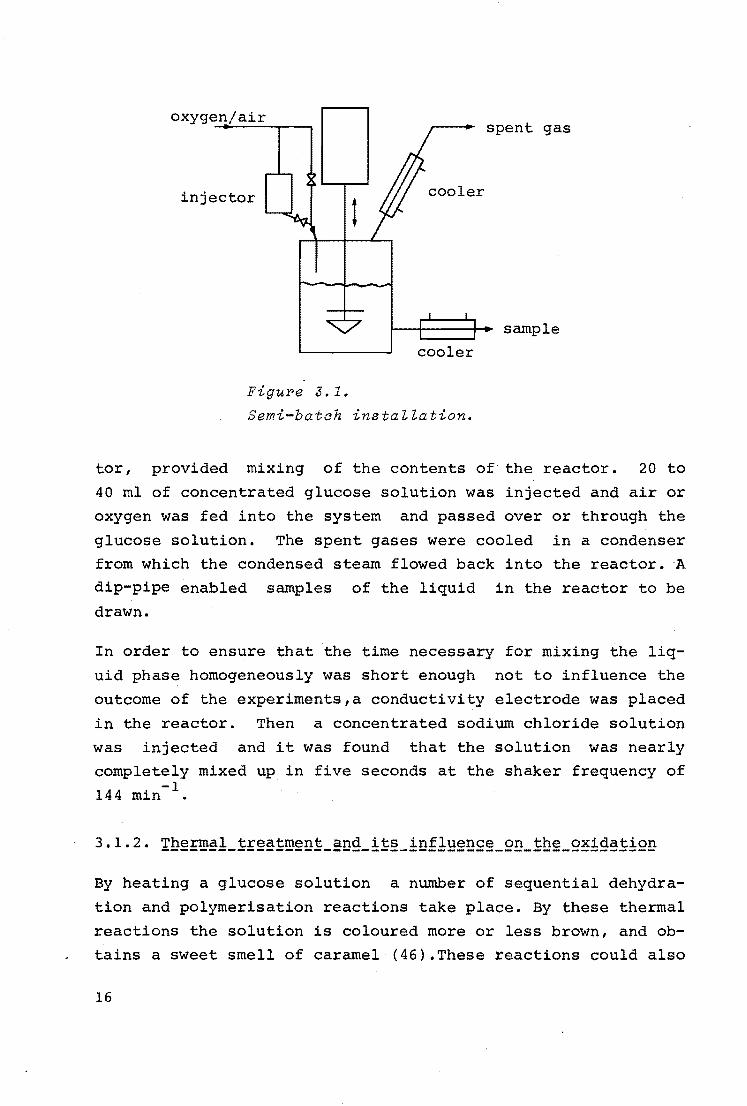
3.1. PRELIMINARY EXPERIMENTS
Semi-batch experiments were carried out in a one-litre elec
trically heated autoclave which is diagrammatically shown in
figure 3.1. For each experiment about half a litre of water
was heated in the reactor to the desired reaction temperature.
A vertically moving agitator (shaker), placed inside the reac-
15
oxygen/air spent gas
injector cooler
t
sample
cooler
Figure 3.1.
Semi-batoh installation.
tor, provided mixing of the contents of the reactor. 20 to
40 ml of concentrated glucose solution was injected and air or
oxygen was fed into the system and passed over or through the
glucose solution. The spent gases were cooled in a condenser
from which the condensed steam flowed back into the reactor. A
dip-pipe enabled samples of the liquid in the reactor to be
drawn.
In order to ensure that the time necessary for mixing the liq
uid phase homogeneously was short enough not to influence the
outcome of the experiments,a conductivity electrode was placed
in the reactor. Then a concentrated sodium chloride solution
was injected and it was found that the solution was nearly
completely mixed up in five seconds at the shaker frequency of
144 min- 1 .
By heating a glucose solution a number of sequential dehydra
tion and polymerisation reactions take place. By these thermal
reactions the solution is coloured more or less brown, and ob
tains a sweet smell of caramel (46).These reactions could also
16
take place during oxidation experiments and oxidation could
proceed directly from glucose as well as via thermal reaction
products.
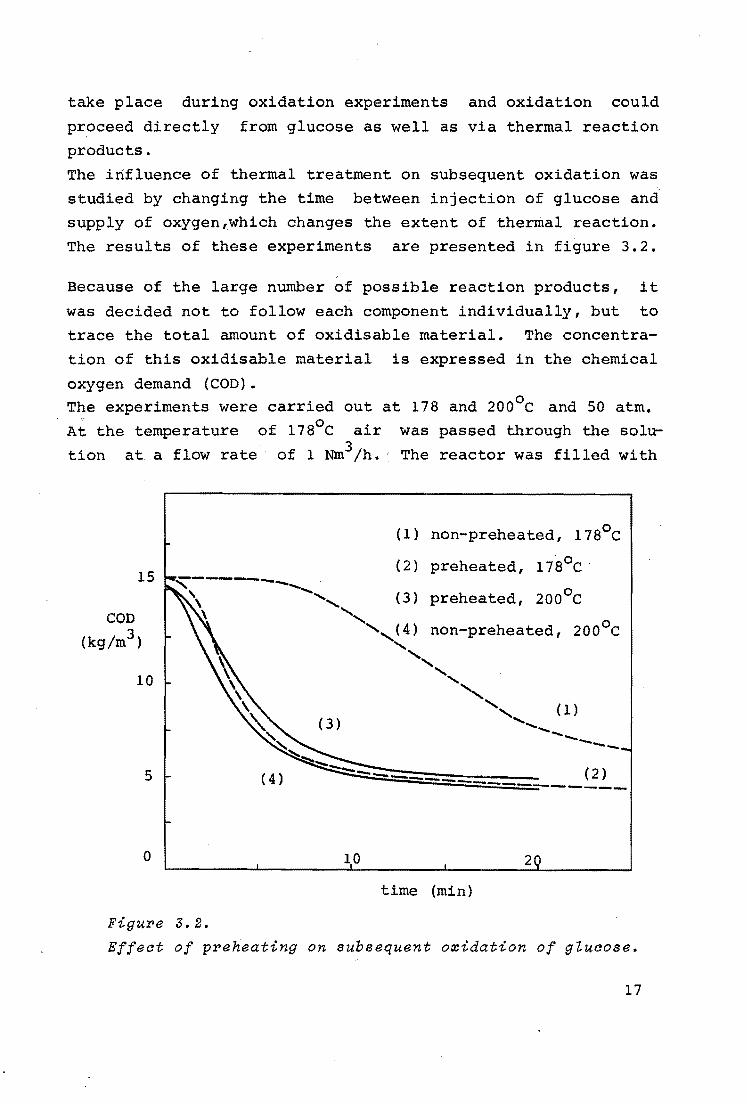
The influence of thermal treatment on subsequent oxidation was
studied by changing the time between injection of glucose and
supply of oxygen 1.which changes the extent of thermal reaction.
The results of these experiments are presented in figure 3.2.
Because of the large number of possible reaction products, it
was decided not to follow each component individually, .but to
trace the total amount of oxidisable material. The concentra
tion of this oxidisable material is expressed in the chemical
oxygen demand (COD). The experiments were carried out at 178 and 200°c and 50 atm.
At the temperature of 178°c air was passed through the solu
tion at. a flow rate of 1 Nm3 /h. · The reactor was filled with
15
COD
(kg/m3)
10
5
0
(1) non-preheated, 178°c
(2) preheated, 178°c · '-------...... <
' -......, (3) preheated, 200°c \ ........ , \ ' ', ( 4) non-preheated, 200°c
....... , ....... ,
' ...................
............ (1) (3) .... _ -----
(4)
10 2
time (min)
Figu'I'e 3.2.
Effeat of p'I'eheating on subsequent o::cidation of gluaose.
17
500 ml water enabling the shaker to force gas bubbles into the
solution from the gas space above it (see 3.1.3.). The total -1 pressure was always 50 atm and the shaker frequency 144 min •
In the experiment belonging to curve (1), the temperature was
178°c and air was admitted to the reactor immediately after
the injection of glucose. The curve indicates that it takes
several minutes before noticeable oxidation takes place. Ap
parently, active material has first to be formed.
The experiment of curve (2) was carried out at the same tem
perature, but now the glucose solution was heated for 10 mi
nutes in the absence of air so that only thermal reaction *)
took place. Then air was admitted and now, as follows from
curve (2), the oxidation started nearly immediately.
This could be understood by assuming that the active material
is formed by thermal reaction. The active material could be a
catalyst for the oxidation of glucose and other thermal reac
tion products, but it is also possible that we are dealing
with a consecutive reaction, which would mean that thermal re
action products are more reactive than glucose. De Wilt (122)
has shown that the oxidation of glucose in alkaline solutions
at about 60°c proceeds through enolate ions, generated from
glucose by thermal reactions, which makes the last mechanism
most likely to occur in our case.
The experiment at 178°c with non-preheated glucose was repeated with pure oxygen passed over the solu.tion at 50 atm, a
shaker frequency of 144 min- 1 ,and a gas flow rate of 0.6 Nm3/h.
The reactor was now filled with more than 650 ml water, so
that no bubbles were forced into the solution (see 3.1.3.),
resulting in a much lower gas-liquid interfacial area compared
with the above described experiments. The curve obtained coin
cides nearly completely with curve (1). So, also with pure ox
ygen, a "lag-phase" is obtained.
*) By thermal reaction we mean those reactions which take
place without the influence of oxygen.
18
Curve (3) represents the experiment with non-preheated glucose
at 200°c. Oxygen was passed over the solution at a flow rate
of 0.6 Nm3/h, the reactor being filled with more than 650 ml
water. At this temperature oxidation seems to start almost
immediately. By preheating at this temperature for 10 minutes,
the subsequent oxidation, indicated by curve (4), proceeds
more slowly compared with the non-preheated glucose.
At 200°c thermal reactions will have proceeded further than at
178°c, so, apparently some thermal reaction is necessary for
rapid oxidation; however, too much thermal reaction decreases
the rate of oxidation. This could be explained by assuming
that the generated active material is degraded by further
thermal reaction.
When the solution was preheated for over one hour at 200°c,
almost all glucose was converted into a carbon-like product
which was deposited on the reactor wall and the shaker.
From figure 3.2 it follows also that complete oxidation is not
reached at the selected temperatures, but a maximum conversion
is obtained. Since only a slight difference occurred in
maximum conversion for a preheated glucose solution and a non-
preheated one, this maximum conversion can only partly be in
fluenced by thermal reaction products. Apparently, it is
mainly determined by oxidation products, which resist further
oxidation under the experimental conditions.
In order to get an impression of the influence of the shaker
frequency on the gas dispersion, model experiments at room
temperature were carried out in a glass vessel of the same di
mensions as the autoclave, the glucose solution being replaced
by hexane, which at room temperature has a viscosity and sur
face tension near those of water at 200°c.
It was observed that the gas dispersion was strongly inf lu-
19
enced by the liquid level in the reactor. At high levels, when
the upper blade of the shaker was completely submerged in the
liquid as well as the gas-inlet, only a very small fractional
gas hold-up (less than 0.01) was observed, which originated
from the bubbles passing through the liquid.
At lower liquid levels, when the shaker passed through the
gas-liquid interface, a large amount of gas phase was forced
into the solution as bubbles resulting in a gas hold-up of a
bout 0.11 at a shaker frequency of 144 min- 1 • At low frequen
cies all bubbles escaped from the liquid between two shaker
cycles. The observed average bubble diameter {db) seemed to be
independent of the shaker frequency and was 2 to 3 mm.However,
the average number of bubbles in the liquid increased with the
shaker frequency, resulting in an increase of the average gas--1 liquid interface. At the maximum frequency of 144 min and a
liquid volume of 600 ml, the fractional gas hold-up {£) was
0.11. Consequently the specific surface area of the bubbles,
6£ ab = d'
b
was about 270 m- 1
When changing the liquid level, it was observed that for liq
uid hold-ups larger than about 650 ml the shaker was complete
ly submerged during shaking.
So, by applying a liquid hold-up exceeding 650 ml a relatively
low specific surface area must be expected.
The influence of the shaker frequency on the oxidation rate
was determined also at 200°c and 50 atm with an air flow of l
Nm3/h. The liquid hold-up was 500 ml so that according to the
model experiments it must be expected that air had been forced
into the solution. The results are shown in figure 3.3.
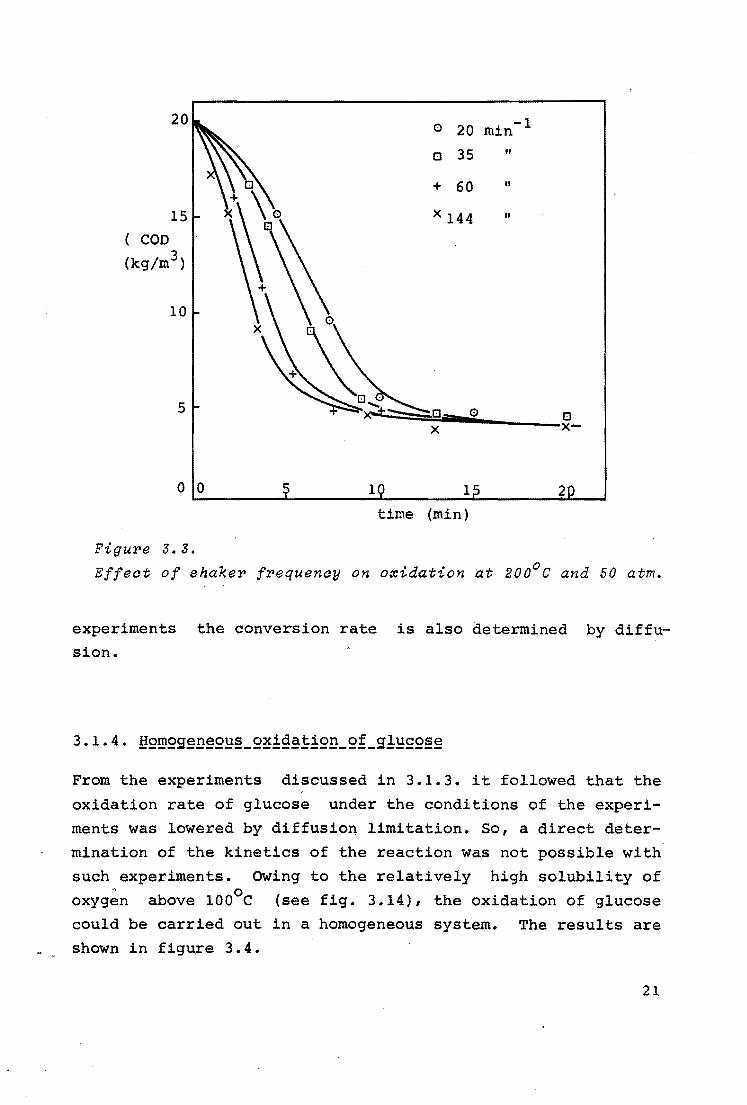
It follows from this graph that the shaker frequency influ
ences the conversion rate. This indicates that the latter de
pends on the gas-liquid interface, which means that in these
20
20 0 20 min-l
c:l 35 II
+ 60 II
15 x 144 II
( COD
(kg/m3)
10
5
0 0 1 1 2
time (min)
Figure 3.3.
Effeat of shaker frequency on o~idation at 200°c and 50 atm.
experiments the conversion rate is also determined by dif fusion.
From the experiments discussed in 3.1.3. it followed that the
oxidation rate of glucose under the conditions of the experi
ments was lowered by diffusion limitation. so, a direct deter
mination of the kinetics of the reaction was not possible with
such experiments. owing to the relatively high solubility of
oxygen above l00°c (see fig. 3.14), the oxidation of glucose
could be carried out in a homogeneous system. The results are
shown in figure 3.4.
21
0.6·
COD (kg/m3)
0.2
0
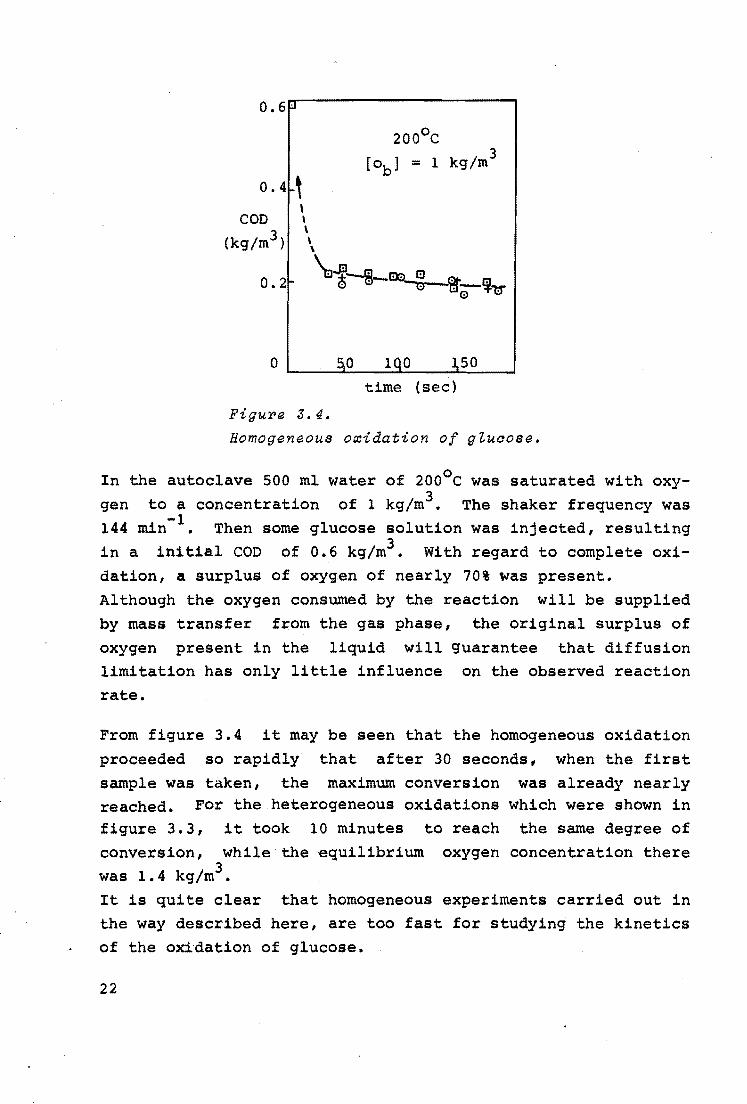
Figure J.4.
200°c
[ob] = 1 kg/m 3
50
time (sec)
Homogeneous o~idation of gZuaose.
In the autoclave 500 ml water of 200°c was saturated with oxygen to a concentration of 1 kg/m3• The shaker frequency was 144 min-1 • Then some glucose solution was injected, resulting in a initial COD of 0.6 kg/m3 • With regard to complete oxidation, a surplus of oxyg.en of nearly 70% was present. Although the oxygen consumed by the reaction will be supplied by mass transfer from the gas phase, the original surplus of
oxygen present in the liquid will guarantee that diffusion limitation has only little influence on the observed reaction rate.
From figure 3.4 it may be seen that the homogeneous oxidation
proceeded so rapidly that after 30 seconds, when the first sample was taken, the maximum conversion was already nearly reached. For the heterogeneous oxidations which were shown in figure 3.3, it took 10 minutes to reach the same degree of conversion, while the equilibrium oxygen concentration there was 1. 4 kg/m3• It is quite clear that homogeneous experiments carried out in the way described here, are too fast for studying the kinetics of the oxidation of glucose.
22
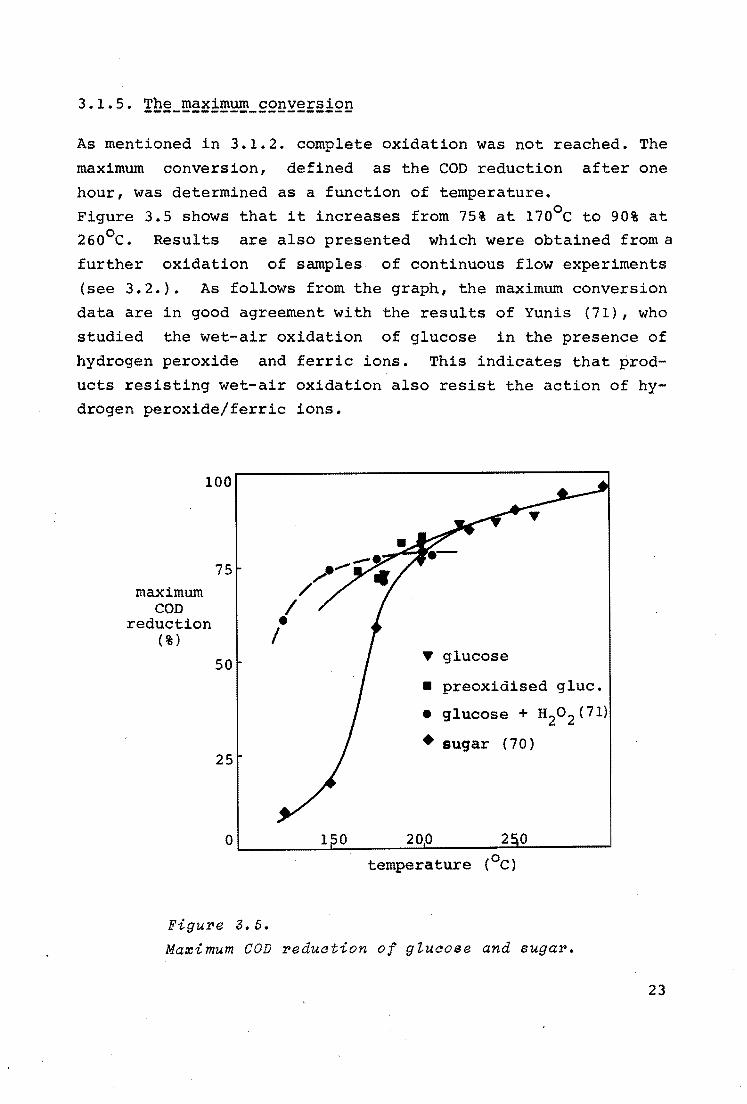
As mentioned in 3.1.2. complete oxidation was not reached. The
maximum conversion, defined as the COD reduction after one
hour, was determined as a function of temperature.
Figure 3.5 shows that it increases from 75% at 170°c to 90% at 26o0 c. Results are also presented which were obtained from a
further oxidation of samples of continuous flow experiments
(see 3.2.). As follows from the graph, the maximum conversion
data are in good agreement with the results of Yunis (71), who
studied the wet-air oxidation of glucose in the presence of
hydrogen peroxide and ferric ions. This indicates that prod
ucts resisting wet-air oxidation also resist the action of hydrogen peroxide/ferric ions.
100
maximum COD
reduction (%)
75
50
25
FiguPe 3.5.
T glucose
• preoxidised glue.
• glucose+ H20 2 (71)
• sugar (70)
temperature (0 c)
Ma~imum COD Peduation of gtuaose and sugaP.
23
From the preceeding sections it followed that complete oxida-o tion was not reached even at a temperature of 260 c. It was
found from the continuous flow experiments that the amount of
coo that could be removed, the "effective" coo [c], is a pa
rameter by which the overall conversion rate per unit volume
can be described with a half order in effective coo. For the
semi-batch experiments this results in
- d£~l =constant* [c]~
Integration of eq. (3.1), using the boundary condition
t = O, [c] = [c0],
results in
[c ]~ - [c]~ =constant* t 0
By introducing y = 1s1 this transforms into [co]
1 - YJ..z = constant *t
[ c ] J..z 0
(3.1)
(3.2)
(3.3)
Since this description does not include generation of the ac-
·tive matter, it may only be applied after the "lag-phase".
In figure 3.6 the results of the experiments discussed in
3.1.2. are plotted as 1 - y~ against time. This results in
straight lines up to 80% of the maximum conversion.
The deviation at higher conversions might be the result of the
formation of rather stable oxidation products.
Figure 3.6 also shows that when preheating for 10 minutes in
the absence of oxygen at 200°c, the subsequent oxidation · pro
ceeds more slowly compared with a non-preheated solution.
Finally it follows from this graph that 10 minutes preheating
at 178°c results in a higher conversion rate compared with
non-preheated glucose.
24
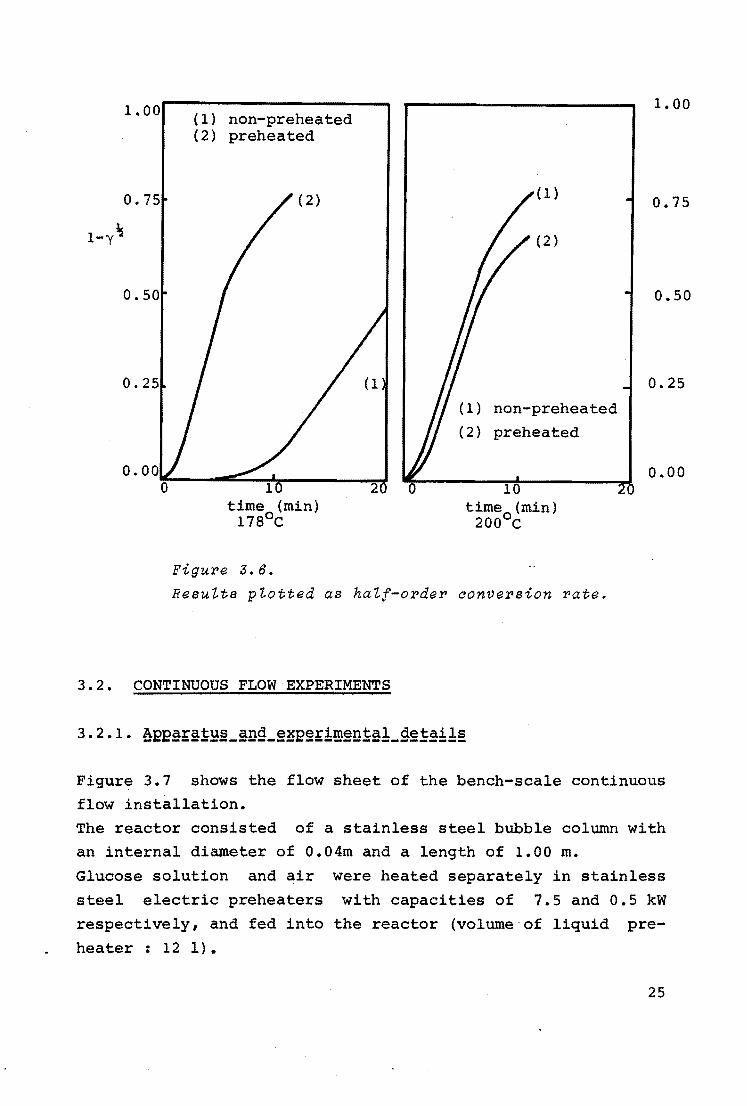
1. 00
l-y15
(1) non-preheated (2) preheated
time (min) 178°c
Figure 3.6.
( 1)
(2)
non-preheated (2) preheated
10 time
0(min)
200 c
Results plotted as half-order aonversion rate.
3.2. CONTINUOUS FLOW EXPERIMENTS
1. 00
0.75
a.so
0.25
o.oo
Figure 3.7 shows the flow sheet of the bench-scale continuous flow installation.
The reactor consisted of a stainless steel bubble column with an internal diameter of 0.04m and a length of 1.00 m.
Glucose solution and air
steel electric preheaters
respectively, and fed into
heater : 12 1).
were heated separately in stainless
with capacities of 7.5 and 0.5 kW
the reactor (volume of liquid pre-
25
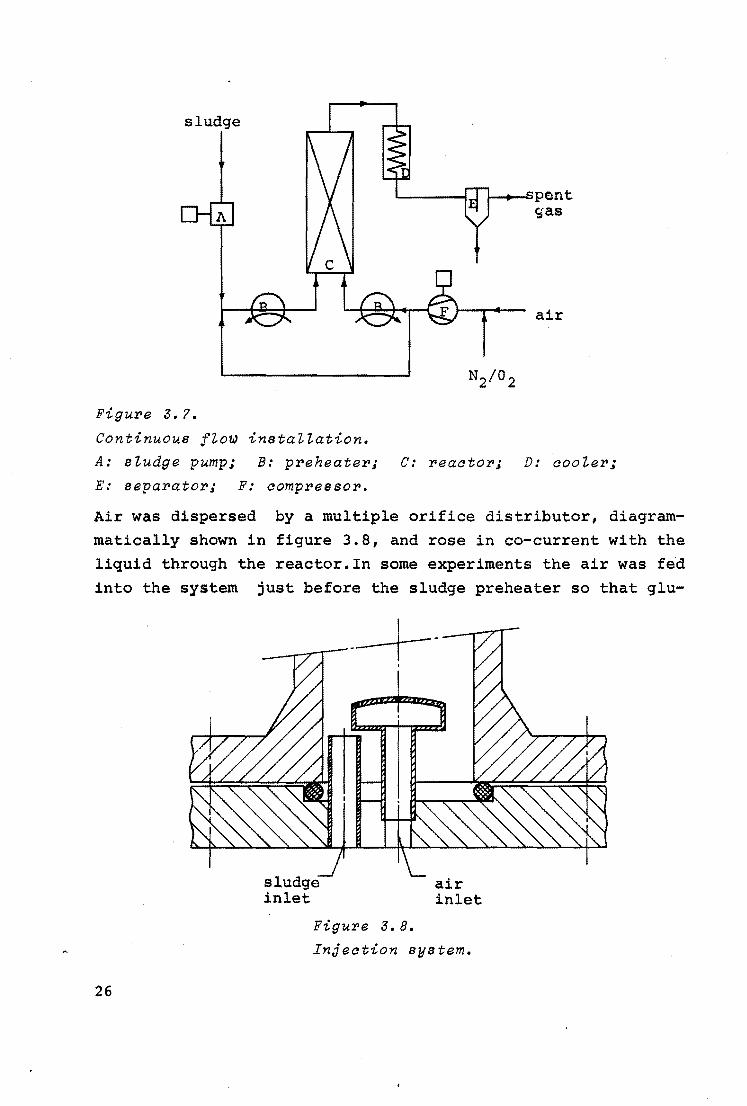
sludge
Figure 3.?.
Continuous fto~ instaiiation.
i--.,_~pen t gas
air
A: studge pump; B: preheater; C: reaator; D: aooier;
E: separator; F: ao~pressor.
Air was dispersed by a multiple orifice distributor, diagrammatically shown in figure 3.8, and rose in co-current with the liquid through the reactor.In some experiments the air was fed
into the system just before the sludge preheater so that glu-
26
sludge inlet
air inlet
Figure 3.8.
Injeation system.
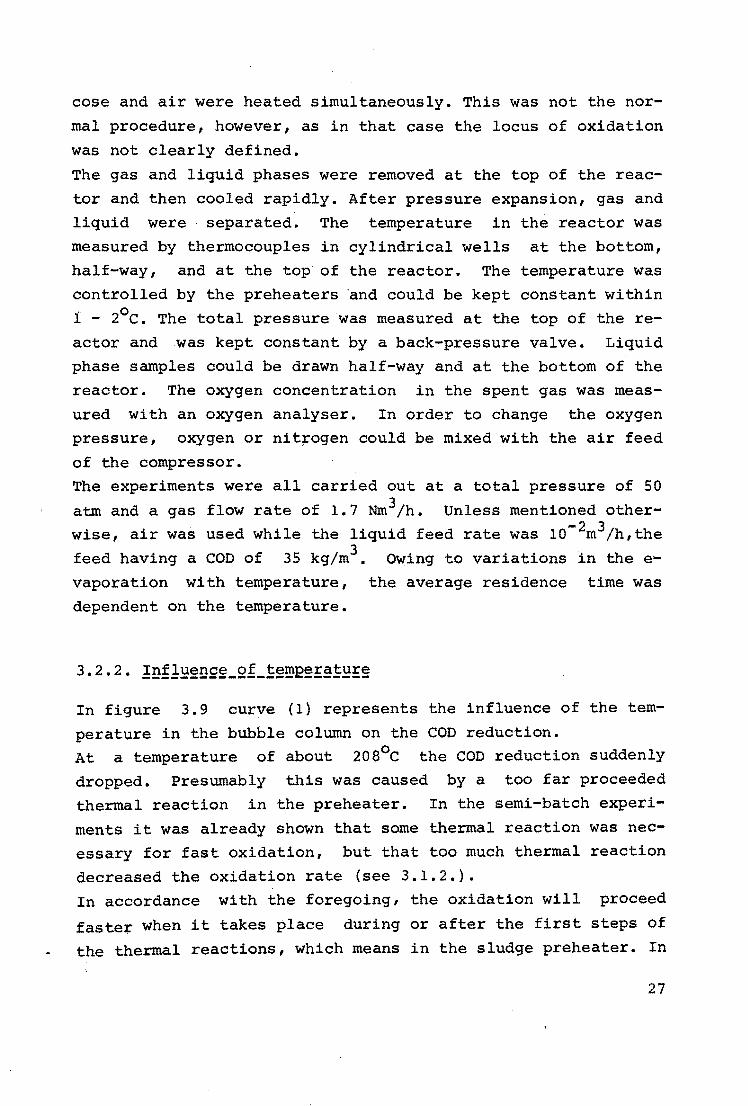
cose and air were heated simultaneously. This was not the nor
mal procedure, however, as in that case the locus of oxidation
was not clearly defined.
The gas and liquid phases were removed at the top of the reac
tor and then cooled rapidly. After pressure expansion, gas and liquid were separated. The temperature in the reactor was
measured by thermocouples in cylindrical wells at the bottom, half-way, and at the top of the reactor. The temperature was
controlled by the preheaters and could be kept constant within ' 0 1 - 2 c. The total pressure was measured at the top of the re-
actor and was kept constant by a back-pressure valve. Liquid
phase samples could be drawn half-way and at the bottom of the reactor. The oxygen concentration in the spent gas was measured with an oxygen analyser. In order to change the oxygen pressure, oxygen or nitrogen could be mixed with the air feed
of the compressor. The experiments were all carried out at a total pressure of 50
atm and a gas flow rate of 1.7 Nm3/h. Unless mentioned otherwise, air was used while the liquid feed rate was l0- 2m3/h,the
feed having a COD of 35 kg/m3 • owing to variations in theevaporation with temperature, the average residence time was
dependent on the temperature.
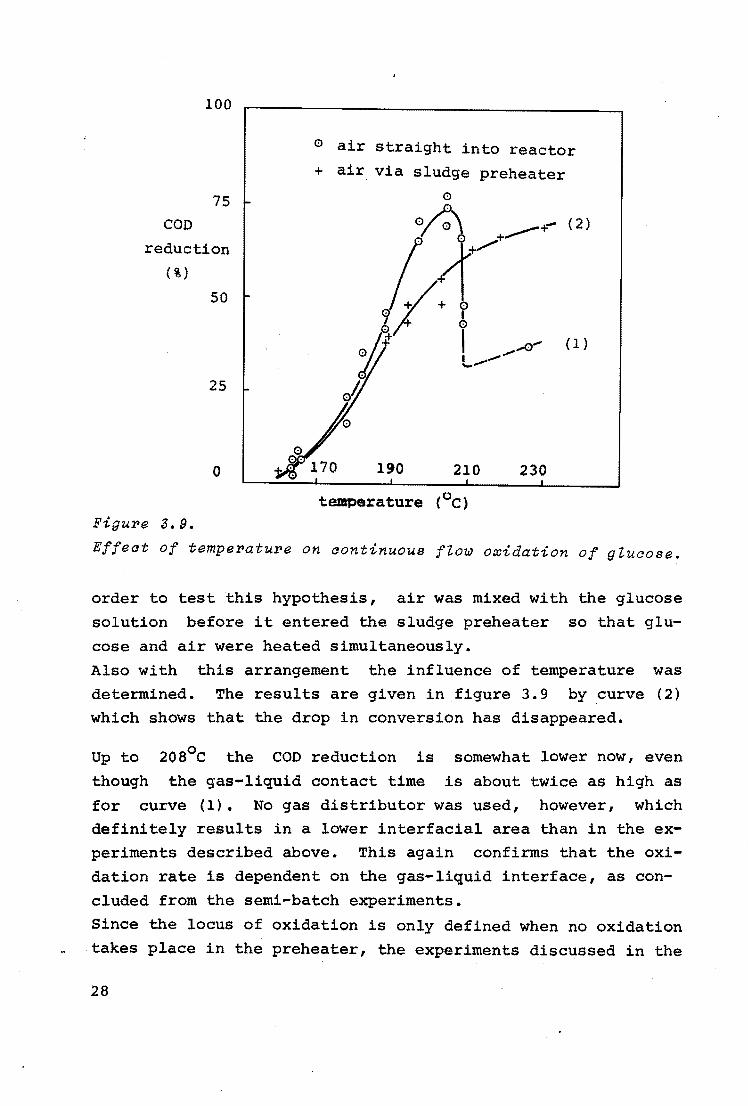
In figure 3.9 curve (1) represents the influence of the tem
perature in the bubble column on the COD reduction. At a temperature of about 2oa0 c the COD reduction suddenly dropped. Presumably this was caused by a too far proceeded thermal reaction in the preheater. In the semi-batch experi
ments it was already shown that some thermal reaction was necessary for fast oxidation, but that too much thermal reaction
decreased the oxidation rate (see 3.1.2.). In accordance with the foregoing, the oxidation will proceed
faster when it takes place during or after the first steps of
the thermal reactions, which means in the sludge preheater. In
27
100
0 air straight into reactor + air via sludge preheater
75 0
COD ~+- (2)
reduction
.~: '.'.!-,.........+
(%)
50 0
I b I A" (1)
I --.__.
25 oh
0 190 210 230
temperature (0 c) Figure 3. 9.
Effect of temperature on continuous ftow oxidation of gtucose.
order to test this hypothesis, air was mixed with the glucose
solution before it entered the sludge preheater so that glu
cose and air were heated simultaneously.
Also with this arrangement the influence of temperature was
determined. The results are given in figure 3.9 by curve (2)
which shows that the drop in conversion has disappeared.
Up to
though
2os0 c the COD reduction is
the gas-liquid contact time
somewhat lower now, even
is about twice as high as
for curve (1). No gas distributor was used, however, which
definitely results in a lower interfacial area than in the ex
periments described above. This again confirms that the oxi
dation rate is dependent on the gas-liquid interface, as con
cluded from the semi-batch experiments.
Since the locus of oxidation is only defined when no oxidation
takes place in the preheater, the experiments discussed in the
28
following were always carried out in such a way that air and
glucose were heated separately.
3.2.3. ~n!1Y~n£~_g£_£QQ~22n2~n~=2s!2n_!n_sh~-£~~§_2n§_g~yg~u
E=~!!Y=~
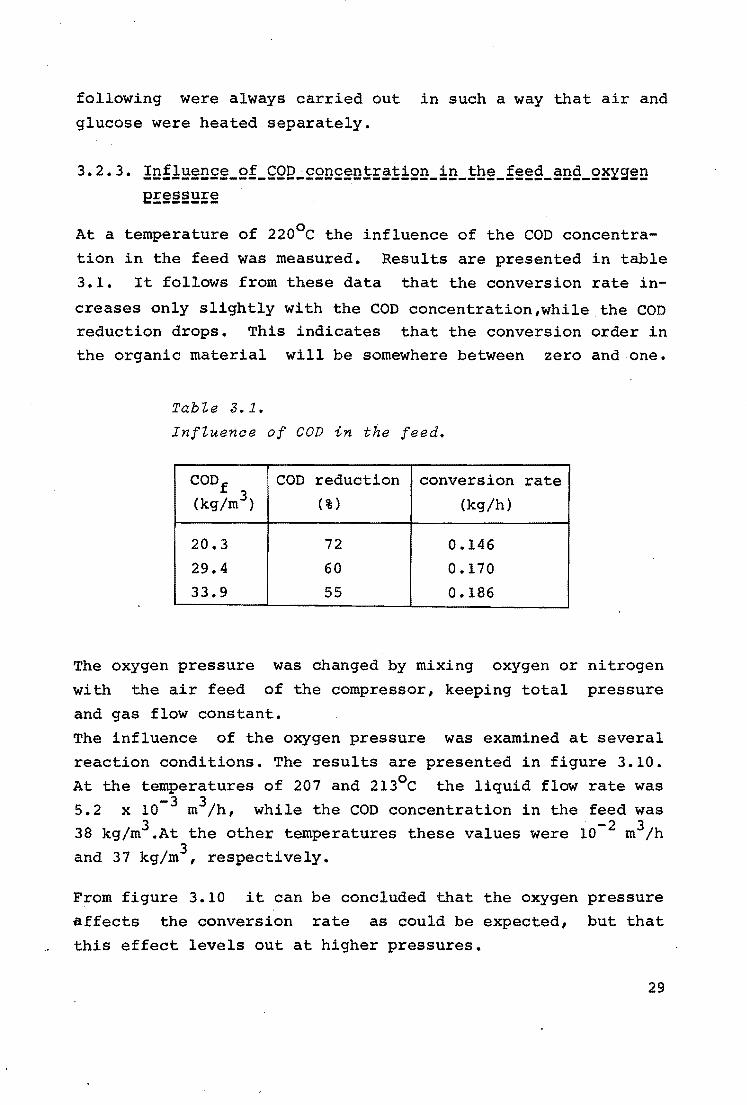
At a temperature of 220°c the influence of the COD concentra
tion in the feed was measured. Results are presented in table 3.1. It follows from these data that the conversion rate in
creases only slightly with the COD concentration,while the COD reduction drops. This indicates that the conversion order in the organic material will be somewhere between zero and one.
TabZe 3.1.
InfZuenoe of COD in the feed.
CODf COD reduction conversion rate (kg/m3 ) (%) (kg/h)
20.3 72 0.146
29.4 60 0.170
33.9 55 0.186
The oxygen pressure
with the air feed
was changed by mixing oxygen or nitrogen
of the compressor, keeping total pressure
and gas flow constant.
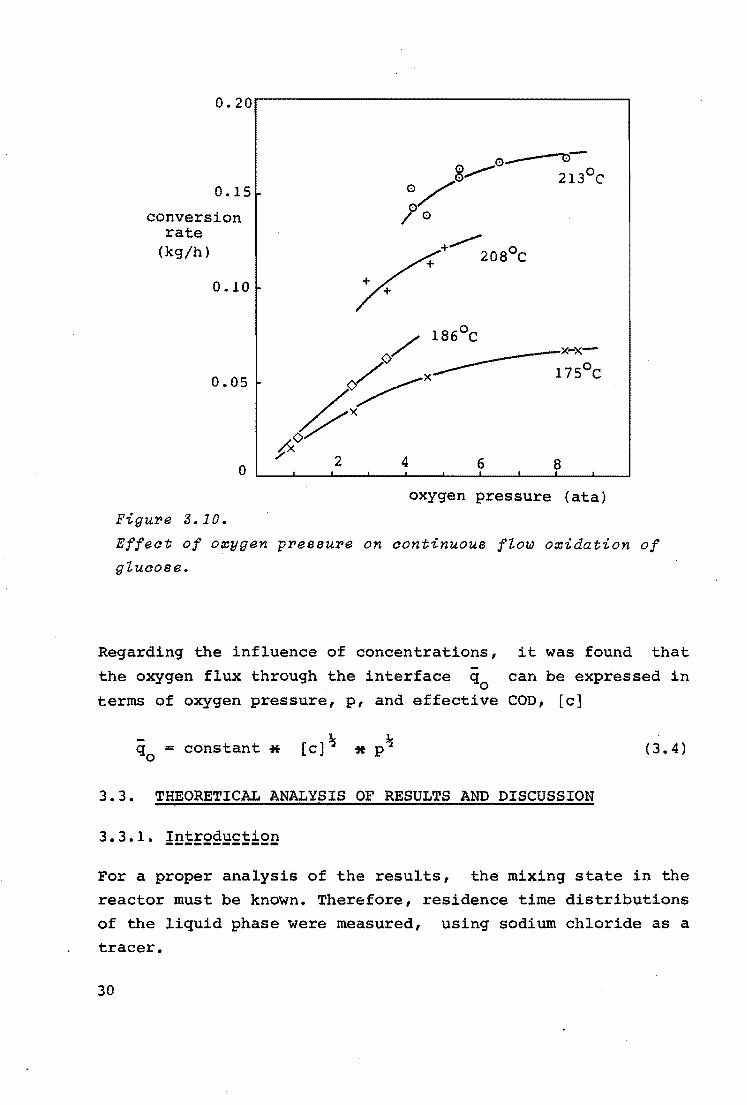
The influence of the oxygen pressure was examined at several
reaction conditions. The results are presented in figure 3.10.
At the temperatures of 207 and 213°c the liquid flow rate was 5.2 x 10⁻³ m3/h, while the COD concentration in the feed was
3 . -2 3 38 kg/m .At the other temperatures these values were 10 m /h and 37 kg/m3 , respectively.
From figure 3.10 it can be concluded that the oxygen pressure
affects the conversion rate as could be expected, but that this effect levels out at higher pressures.
29
0. 15 .
conversion rate
(kg/h)
0. IO ·
o.os
0
Figure 3.10. oxygen pressure (ata)
Effect of oxygen pressure on continuous flow oxidation of glucose.
Regarding the influence of concentrations, it was found that -the oxygen flux through the interface q
0 can be expressed in
terms of oxygen pressure, p, and effective COD, [c]
constant * [ c] ?..i (3.4)
3.3. THEORETICAL ANALYSIS OF RESULTS AND DISCUSSION
For a proper analysis of the results, the mixing state in the
reactor must be known. Therefore, residence time distributions
of the liquid phase were measured, using sodium chloride as a
tracer.
30
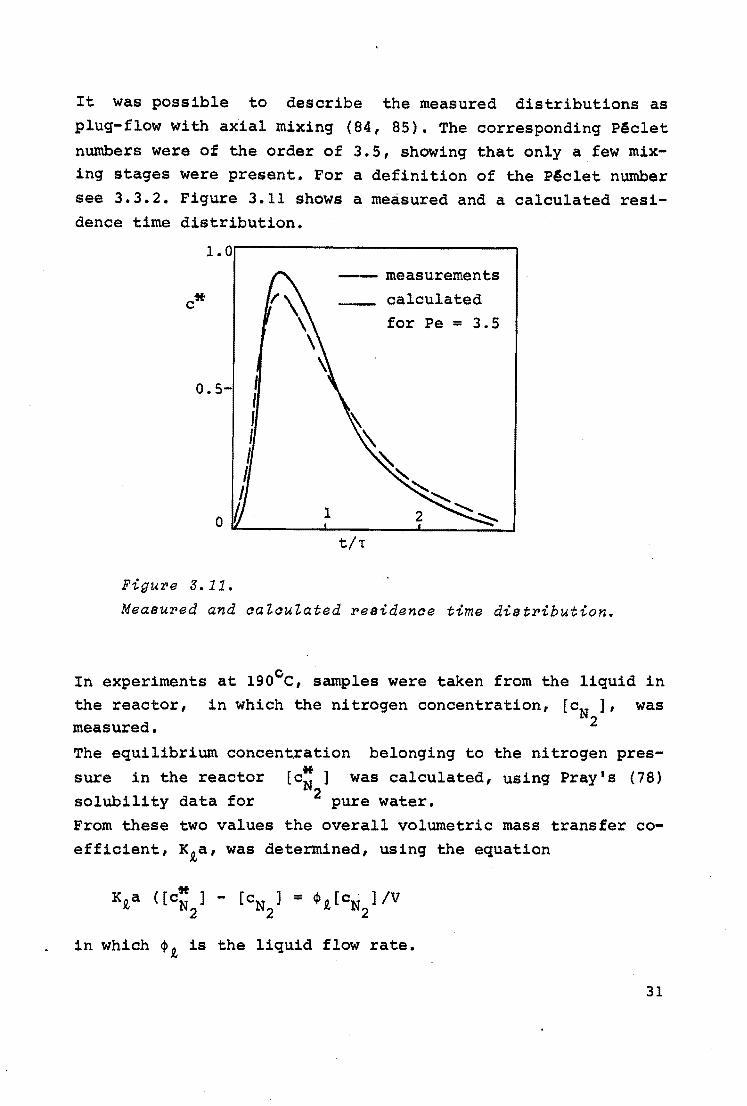
It was possible to describe the measured distributions as plug-flow with axial mixing (84, 85). The corresponding Pc§clet numbers were of the order of 3.5, showing that only a few mixing stages were present. For a definition of the PAclet number see 3.3.2. Figure 3.11 shows a measured and a calculated residence time distribution.
c*
o.s-
~~ measurements calculated for Pe = 3. 5
1 2 0 --~~~~--~~~~..__~~~---'
t/t
Figure 5.11.
Measured and aaZauZated residenae time distribution.
In experiments at 190°c, samples were taken from the liquid in the reactor, in which the nitrogen concentration, [cN ], was
2 measured.
The equilibrium concent.ration belonging to the nitrogen pres-
* sure in the reactor [cN ] was calculated, using Pray's (78) solubility data for 2 pure water. From these two values the overall volumetric mass transfer coefficient, K1a, was determined, using the equation
in which ~t is the liquid flow rate.
31
A mean value for Kia of 4.1 x 10⁻² sec- 1 was found. Using this
value for the physical absorption rate of oxygen, and assuming
zero oxygen concentration in the liquid, the maximum physical
absorption rate of oxygen was calculated to be 50 g/h.
Since the observed conversion rate was 145 g/h, the oxidation must take place mainly within the diffusion layer around the
gas bubbles.
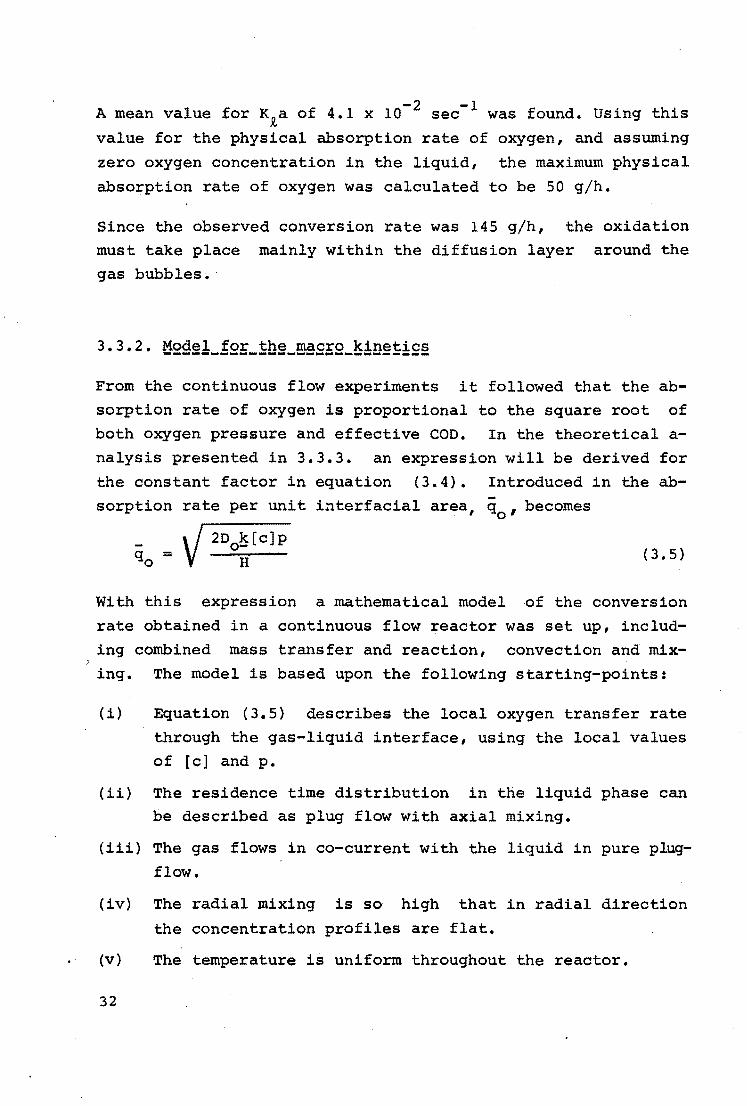
3.3.2. Model for the macro kinetics ----------------------------From the continuous flow experiments it followed that the absorption rate of oxygen is proportional to the square root of
both oxygen pressure and effective coo. In the theoretical a
nalysis presented in 3.3.3. an expression will be derived for
the constant factor in equation (3.4). Introduced in the absorption rate per unit interfacial area, q
0, becomes
= v 2D0~[c]p (3.5)
With this expression a mathematical model of the conversion
rate obtained in a continuous flow reactor was set up, includ
ing combined mass transfer and reaction, convection and mix
ing. The model is based upon the following starting-points:
(i) Equation (3.5) describes the local oxygen transfer rate
through the gas-liquid interface, using the local values of [c] and p.
{ii) The residence time distribution in the liquid phase can be described as plug flow with axial mixing.
(iii) The gas flows in co-current with the liquid in pure plug
flow.
{iv) The radial mixing is so high that in radial direction
the concentration profiles are flat.
{v) The temperature is uniform throughout the reactor.
32
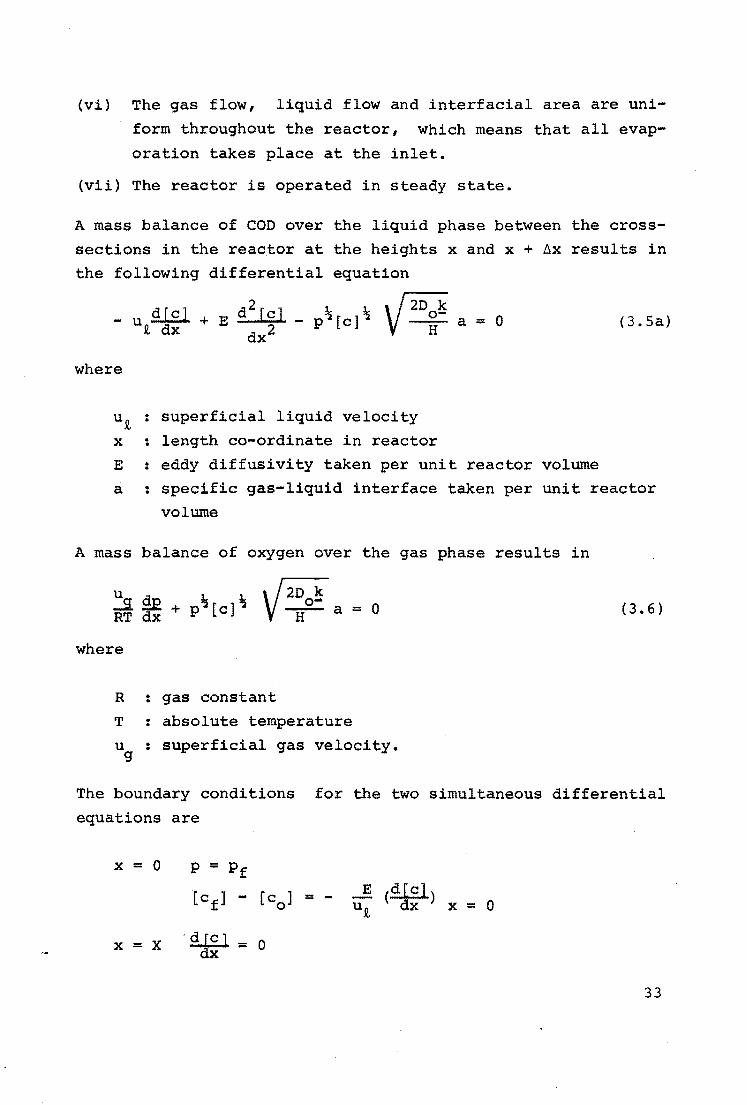
(vi) The gas flow, liquid flow and interfacial area are uni
form throughout the reactor, which means that all evap
oration takes place at the inlet.
(vii) The reactor is operated in steady state.
A mass balance of COD over the liquid phase between the cross
sections in the reactor at the heights x and x + ~x results in
the following differential equation
d r,..l d2 [C] L L ~ - u .::..i..£..i.. + E - - - p~[c]~ a= 0 JI, dx dx2
(3.Sa)
where
UR, . superficial liquid velocity .
x . length co-ordinate in reactor . E : eddy diffusivity taken per unit reactor volume
a • specific gas-liquid interface taken per unit reactor . volume
A mass balance of oxygen over the gas phase results in
u f!l_o k ....S: ~ + p~[c]~ --St: a = 0 RT dx H (3.6)
where
R gas constant
T absolute temperature
u superficial gas velocity. g
The boundary conditions for the two simultaneous differential
equations are
x = 0 p = pf
[cf] [co] E (fil.£1) - =
UR, dx x = 0
x = x -aJ~J = 0
33
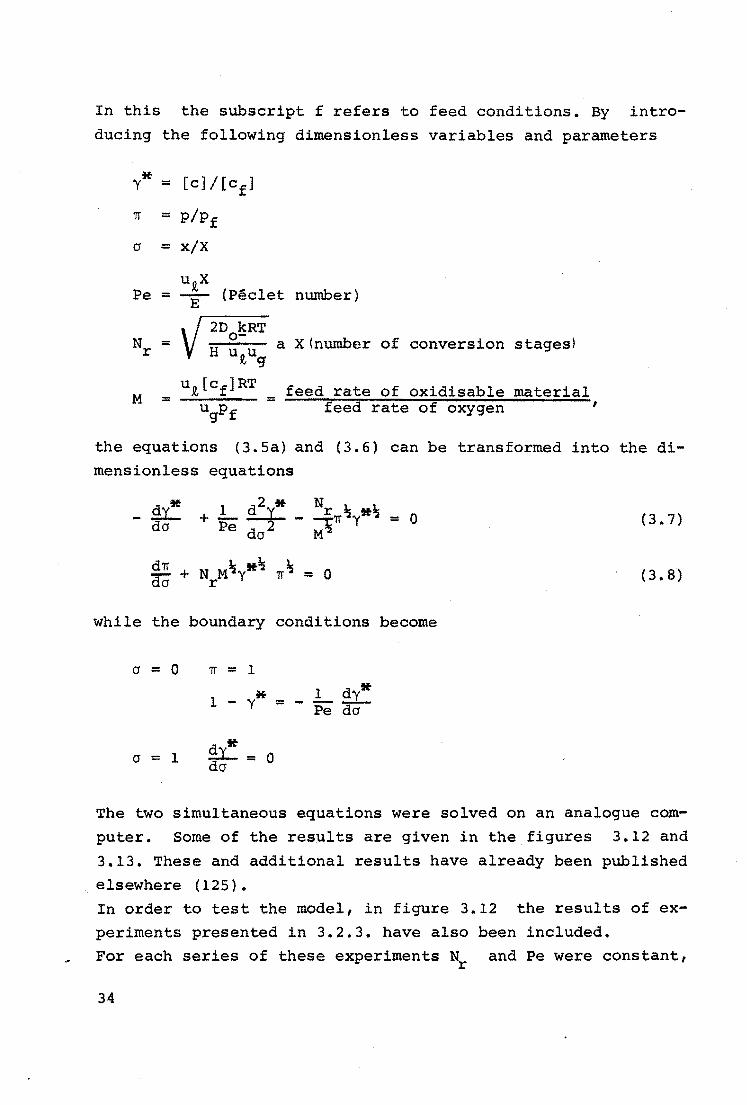
In this the subscript f refers to feed conditions. By intro
ducing the following dimensionless variables and parameters
* [c]/[cf] y = 1T = p/pf
a = x/X
Pe UR,X
(Peclet nwnber) = E 2D kRT
Nr o- a X(number of conversion stages) = H U.v,Ug
M uR.[cf]RT feed rate of oxidisable material = = ,
ugpf feed rate of oxygen
the equations (3.Sa) and (3.6) can be transformed into the dimensionless equations
dy* + L d2~* - ~1T~YR~ = 0 (3.7) do Pe do M
d1T + N M~yR~ 1T ~ = 0 ( 3. 8) da r
while the boundary conditions become
o = 0 1T = 1
l * L dy., - y = Pe do
o = 1 dy* do = 0
The two simultaneous equations were solved on an analogue com
puter. Some of the results are given in the figures 3.12 and
3.13. These and additional results have already been published
elsewhere (125). In order to test the model, in figure 3.12 the results of ex
periments presented in 3.2.3. have also been included. For each series of these experiments Nr and Pe were constant,
34
100
75
conversion
(%)
50
25
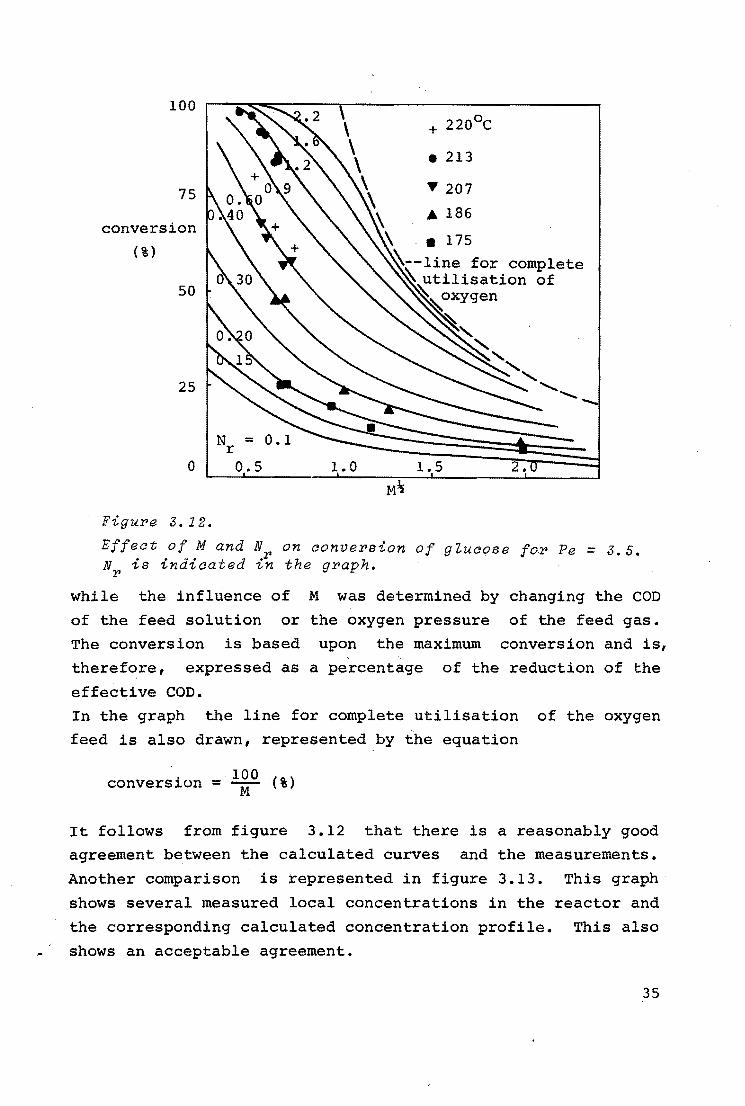
Figure 3. 12.
Effeat of M and N NP is indicated i~
+ 220°C
• 213
y 207
• 186
on aonvePsion of gZuaose foP Pe= 3.5. the gPaph.
while the influence of M was determined by changing the COD
of the feed solution or the oxygen pressure of the feed gas.
The conversion is based upon the maximum conversion and is,
therefore, expressed as a percentage of the reduction of the
effective COD.
In the graph the line for complete utilisation of the oxygen
feed is also drawn, represented by the equation
conversion = lOO (%) M
It follows from figure 3.12 that there is a reasonably good
agreement between the calculated curves and the measurements.
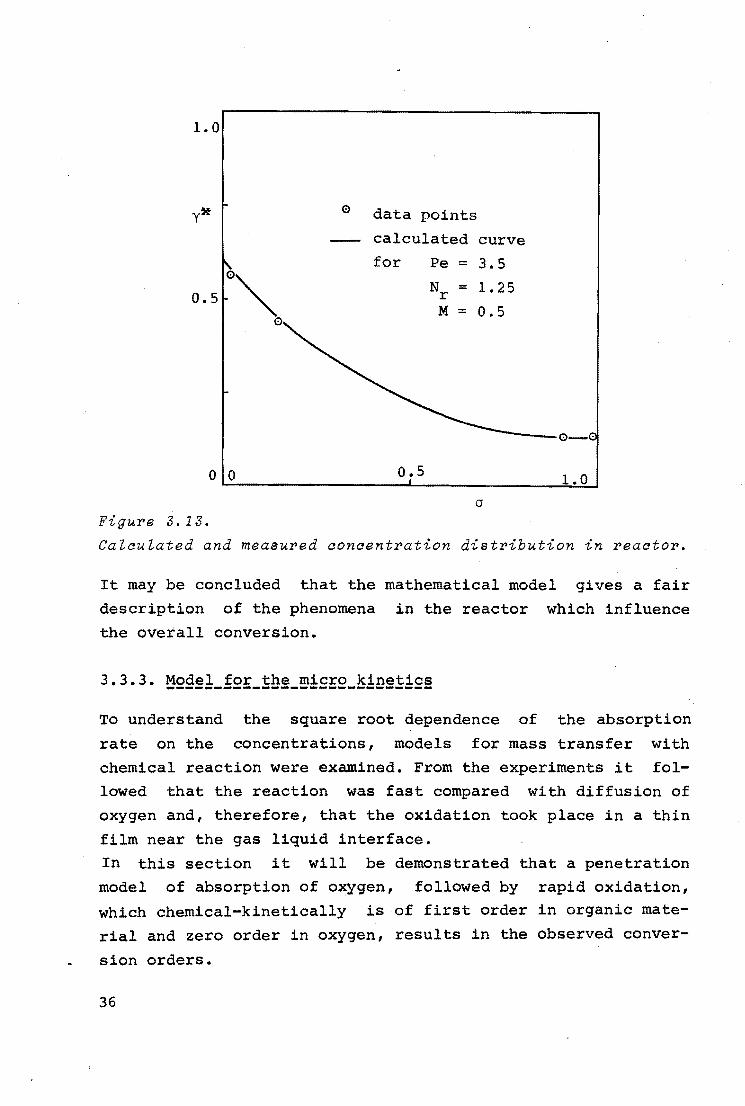
Another comparison is represented in figure 3.13. This graph
shows several measured local concentrations in the reactor and
the corresponding calculated concentration profile. This also
shows an acceptable agreement.
35
1.0
y* 0 data points
calculated curve
for Pe = 3.5
0"" Nr = 1. 25 0.5
M = 0.5 0
0 0 0.5 1.0
a Figure 3. 13.
Calculated and measured concentration distribution in reactor.
It may be concluded that the mathematical model gives a fair
description of the phenomena in the reactor which influence
the overall conversion.
3.3.3. Model for the micro kinetics ----------------------------To understand the square root dependence of the absorption
rate on the concentrations, models for mass transfer with
chemical reaction were examined. From the experiments it fol
lowed that the reaction was fast compared with diffusion of
oxygen and, therefore, that the oxidation took place in a thin
film near the gas liquid interface.
In this section it will be demonstrated that a penetration
model of absorption of oxygen, followed by rapid oxidation,
which chemical-kinetically is of first order in organic mate
rial and zero order in oxygen, results in the observed conver
sion orders.
36
The physical picture on which this penetration model is based
is that at a time zero a liquid element is contacted with an
air bubble. During a time T penetration of oxygen and oxi
dation takes place. Then the element is replaced by another
one and the process starts again. The absorption of oxygen in
the element followed by the chemical reaction is mathemati
cally represented by
( 3. 9)
where D0
is the diffusivity of oxygen in the liquid, [oJ the
oxygen concentration and B the reaction term.
For a reaction which is zero order in oxygen and first order
in reactant present in the liquid, B is given by
B = ~[c] (3.10)
where ~ is the first order reaction rate constant and [c] the
concentration of the reactant. The concentration [c] is de
scribed by the equation
= llil at + R (3.11)
in which Dr is the diffusivity of the reactant in the liquid.
At time zero the initial concentration of organic material is
uniformly equivalent to [ch]' the concentration of reactant in
the bulk of the .liquid. Because of reaction, reduction of the
concentration of organic material will occur which will be
most pronounced at the interface,since the reaction penetrates
from the interface inwards. In the lapse of time T the quan
tity of organic matter which has disappeared per unit volume
f the liquid in the neighbourhood of the surf ace is smaller
than ~T [ch]. The quantity present at time zero is [ch]. A
sufficient condition that the variation of [c] may be ignored
during lapse of time T is that
37
or
kT << 1 (3.12)
This condition is unnecessarilly stringent since suppletion by diffusion is neglected.
Particularly this is the case when
D (cb]>>D [o.] r o J.
or
Because of the relatively low solubility of oxygen (78) the
left hand term is of the order of 20, which means that condi
tion (3.12) definitely is too stringent and can be transferred
into
1sT < 1. (3.13)
If condition(3.13) is fulfilled [c] may be considered constant
during time Tat the value [cb]. By this the reaction term in
equation (3.9) is a constant. An analogous differential equa
tion was solved numerically by Astarita (90).A stationary con
centration profile of oxygen will eventually be obtained which
is nearly reached when
(3.14)
If this condition is fulfilled, the time derivative in equa
tion (3.9) can be neglected, and if, in addition, (3.13) is
also fulfilled, equations (3.9) and (3.10) are reduced to
38
[c] = constant = [cb]
2 Do d [o] = k[c ]
dz2 - b •
.(3.15)
(3.16)
The steady state concentration profile is extending between
the interface and a distance o where [o] = O. So, the boundary
conditions are
z = 0 [o] = constant = [oi]
z = o : [o] = Q,
The value of o can be obtained from a mass balance. Because of the steady state the amount of oxygen passing through the interface per unit time equals the amount of oxygen which disappears by oxidation in the layer between z = o and z = o • So,
- D (fil2.l) o dz z = o
The solution of (3.16) with the boundary conditions is
2 19..L = 1 - r; 12+ L [o.] 2
1
in which
r; = z
(3.17)
(3.18)
From this it follows that the steady state absorption rate of oxygen per unit interfacial area, qo,s' equals
fil.21 -qo,s = - D v 20 o!s [Cb] [ O i] • 0 ( dz )z=o - (3.19)
If the gas-phase resistance can be neglected, [oi] is related to the oxygen pressure p by
(3.20)
39
where H is the Henry coefficient. For pure water at elevated
temperatures and pressures Pray has shown that the Henry coef
ficient is only dependent on temperature (78).
Assuming that the organic material does not influence the
Henry coefficient, equation (3.23) can be transformed into
(3.21)
This is the steady state absorption rate for e + 00 • In general
the average absorption rate during the time of contact is
given by
and depends on e. From Astarita's data (90) q0
was calculated.
The results are shown in figure 3.15 where the per cent devia
tion of q0
from the steady state absorption rate q0
,s is given
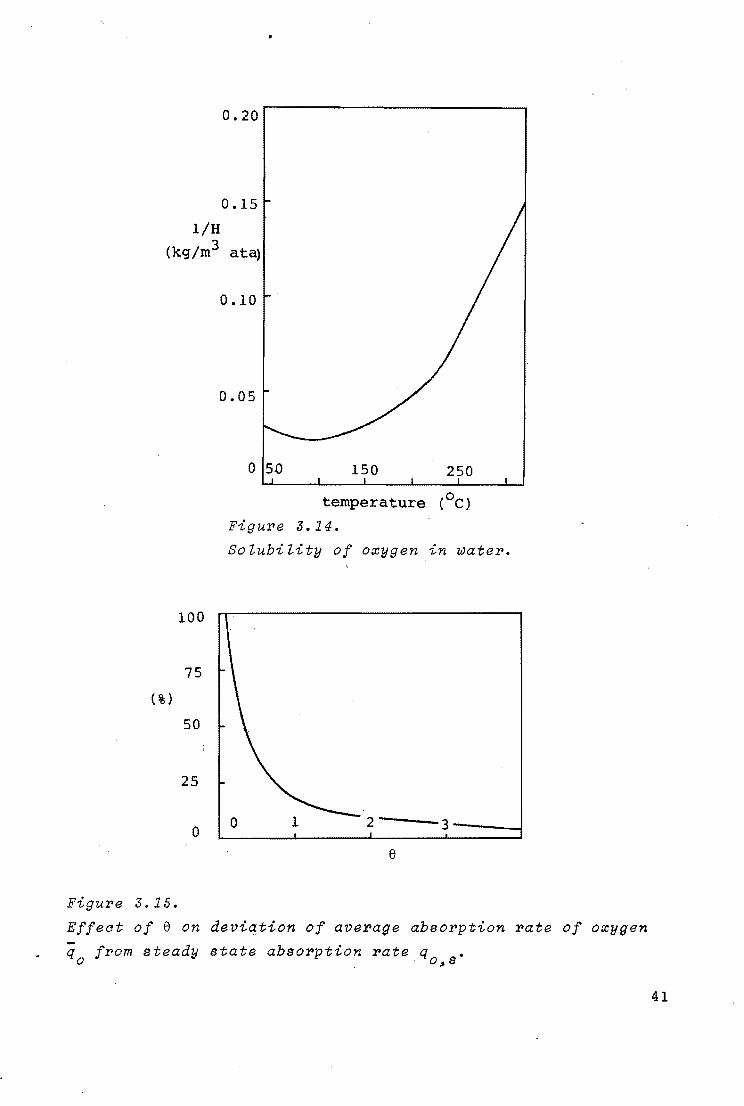
as a function of e. It follows from the graph that even when a
Steady State COnCentratiOn profile iS established (e~o.4) I the
average absorption rate is still 40% above the steady state absorption rate which is given by equation(3.19) .If we allow a
deviation of 10%,the criterion for a steady absorption rate is
e ~ 2. (3.22)
This combined with condition (3.13) finally results in
< 1 • (3.23)
For an evaluation of the reaction rate constant ~ and the di
mensionless contact time e from the experimental results, the
gas-liquid interfacial area a and the contact time T must be
known.
40
0.20
0.15
l/H (kg/m3 ata)
100
75
(%)
50
25
0
Figure 3.15.
0.10
0.05
0 5.0 150 250
temperature (0 c}
Figure 3.14.
SoZubiZity of oxygen in water.
2---3----1
e
Effect of e on deviation of average absorption rate of oxygen
q from steady state absorption rate q • 0 . . o,s
41
The gas-liquid interfacial area in the continuous reactor can
be calculated from the gas fraction E (0.20 at 190°c), evalu
ated from the residence time distributions, and the average
bubble diameter db (16 mm at 190°c). The bubble diameter was
estimated from bubble frequencies, evaluated from conductivity
measurements inside the bubble column.
The specific surface area in the continuous flow reactor
defined by
6£ ac = db
a , c
equals 75- 1 • From the physical absorption measurements dis
cussed in 3.3.1. it followed that
-4 So the overall mass transfer coefficient K1 = 5.5 x 10 m/sec.
This is also the value of the liquid-side mass transfer coef
ficient k 1 , if the gas-phase resistance is neglected.
According to Higbie's theory (118), k 1 is related to T by
k = 2 ,G_ 1 v n:r· (3.24)
The diffusivity is calculated from the tabulated dependence of
the viscosityµ on temperature (128), assuming
Dµ = T
constant.
-8 2 With the value of D0
of 2.3 x 10 m /sec and the calculated
value of k1
it follows from equation (3.24) that T ~ 0.1 sec.
Now we have calculated a and T for the continuous flow exper
iments. For the semi-batch experiments we have to do the same,
but the values will be only estimations since the physical ab
sorption rate was not measured in this system.
42
In the semi-batch experiments which were used for the evalua
tion of k oxygen was passed over the solution. The available
area would be about two to three times the cross-section of
the reactor (A), because the surface would be somewhat dis
turbed by the shaking action. Since the liquid hold-up (V) was
0.650 x 10⁻³ m3 the specific surface area per unit liquid vol
ume (ab} is assumed to be
a -b -2.5 A = 20 m-1
v
The shaker moved every 0.4 sec. Therefore it was assumed that
the contact time T was of the order of 0.4 sec.
The actual value of T will also depend on the physical con
stants of the solution, like viscosity, surface tension, and
density.
Because the order of magnitude of the gas-liquid interfacial
area and of the contact time are determined, the reaction rate
constant k can be estimated.
After calculating ~' the condition
(3.23)
must be checked. If this condition is fulfilled, equation
(3.19) may be applied.
In the computations it was assumed that the Henry coefficient
and the diffusivity of oxygen in water were independent of the
dissolved organic material. Figure 3.14 shows the reciprocal
Henry coefficient and its dependence on the temperature. The
data were taken from Pray (78) and Battino (113).
Table 3.2 shows the results of evaluations from semi-batch exo
periments with non-preheated glucose at 178 and 200 C and from ·o continuous flow experiments at 178, 190 and 200 C. It follows
from this table that condition (3.23) is only fulfilled in the
43
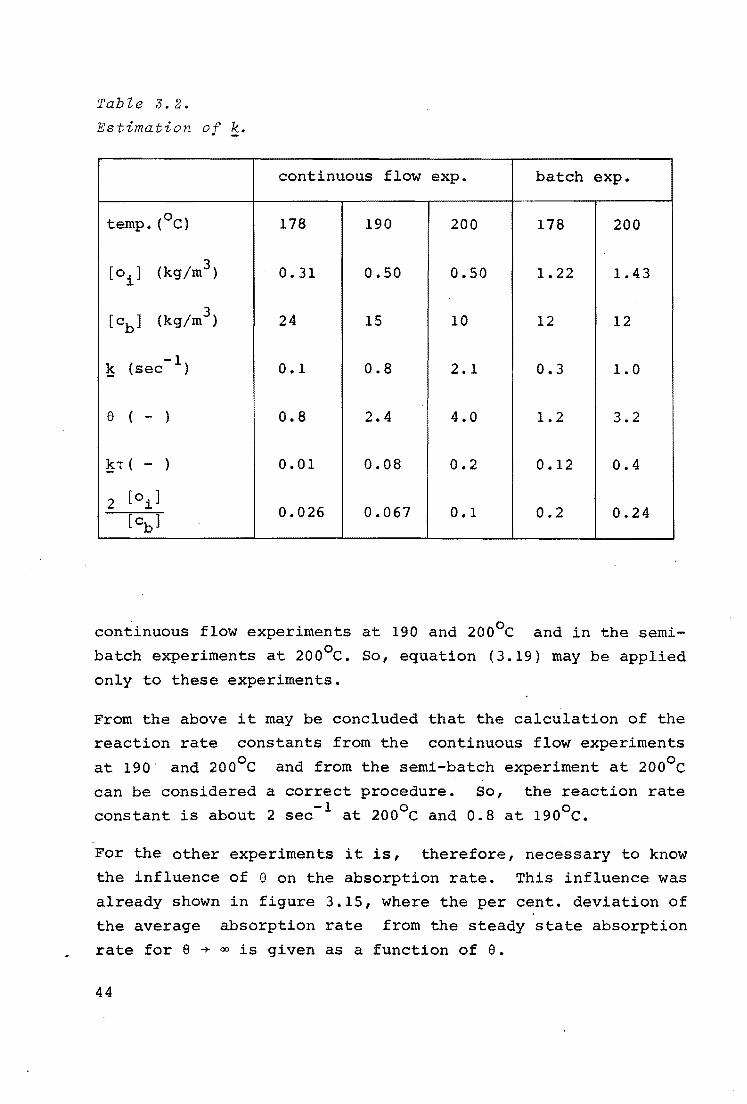
Table J.2.
Estimation of k.
0 temp. ( C)
[ 0. ] 1
(kg/m3 )
[cb] (kg/m3 )
ls -1 (sec )
a ( - )
~T( - )
2 [oi]
[cb]
continuous flow
178 190
0.31 a.so
24 15
0.1 0.8
0.8 2.4
0.01 0.08
0.026 0.067
exp. batch exp.
200 178 200
o.so 1. 22 1.43
10 12 12
2.1 0.3 1.0
4.0 1.2 3.2
0.2 0.12 0.4
0.1 0.2 0.24
continuous flow experiments at 190 and 200°c and in the semi
batch experiments at 200°c. So, equation (3.19) may be applied
only to these experiments.
From the above it may be concluded that the calculation of the
reaction rate constants from the continuous flow experiments
at 190 and 200°c and from the semi-batch experiment at 200°c
can be considered a correct procedure. So, the reaction rate
constant is about 2 sec- 1 at 200°c and 0.8 at 190°c.
For the other experiments it is, therefore, necessary to know
the influence of e on the absorption rate. This influence was
already shown in figure 3.15, where the per cent. deviation of
the average absorption rate from the steady state absorption
rate for e + oo is given as a function of e.
44
It follows that the absorption rate decreases appreciably with
e as long as e < 2. Since 8 contains [cb]/[oi], e will also
depend on M which is
Therefore, in the case of continuous flow experiments at low
temperatures, where e < 1, it is to be expected that with de
creasing values of M the conversion increases more than is
predicted with the model for the macro kinetics, based upon
equation (3.19}.
As may be seen from figure 3.12 the experiments at 175 and
186°c seem to confirm this conclusion.
45
f f I
• ' I I
I I I I r I • I 1 I 1 • I I I
I I I
1 I I - ..... ., "",_.. .............
Chapter 4 THE DISSOLUTION OF SLUDGE
In chapter 2 it was stated that sludge particles dissolve at
elevated temperatures by hydrolysis. Consequently, wet-air ox-:
idation may proceed through direct oxidation of sludge parti
cles and through oxidation of hydrolysis products. In order to
understand the contribution of oxidation of hydrolysis prod
ucts to the total oxidation rate, the degree to which the
sludge can be hydrolised into soluble products and the rate of
hydrolysis were studied.
4.1. APPARATUS AND EXPERIMENTAL DETAILS
Experiments were carried out in two batch-wise operated cylin-·
drical stainless steel reactors with volumes of 22 ml (~23x25 ·•
mm) and 52 ml (~34x38 mm).Each reactor was closed with a swiv-:
el. A thermocouple was attached to this swivel, and by closing,
46
the reactor, the thermocouple was placed inside. The normal
procedure was to fill the reactor with 15 ml of sludge and
then to heat the reactor in a glycerine bath of 60 - 90°c.
above the desired temperature, which latter was reached in
about 20 seconds. In order to secure a good heat transfer from
the oil bath into the reactor, and to keep the sludge parti-.
cles in suspension, the reactor was shaken with a flask-shaker
in vertical direction at a frequency of about 1000 min- 1 • When
the desired temperature was reached, the reactor was moved
over to a thermostat filled with Nassa oil. After the desired
residence time in the thermostat the reactor was cooled in a
water bath to 75°c, which took 15 seconds. The reactor was
opened and the contents were filtered on a heated Buchner fun
nel.
Experiments were carried out with primary and activated sludge,
which had been obtained from the sewage works at Eindhoven.
The raw primary sludge contained much fibrous matter; fibres
with a length of 3 to 5 cm were observed. The fibrous nature
of this sludge made it impossible to take reproducible.charges
for the reactor. In order to overcome this difficulty, the 0 sludge was frozen with liquid nitrogen (-196 C) and was ground
in a marl mill. By means of a microscope it was found that the
grinding resulted in pieces with a length of 0.1 to 1 mm. The
sludges were stored at -20°c. No effect of freezing, grinding
and storage on the outcome of the dissolution experiments was
observed.
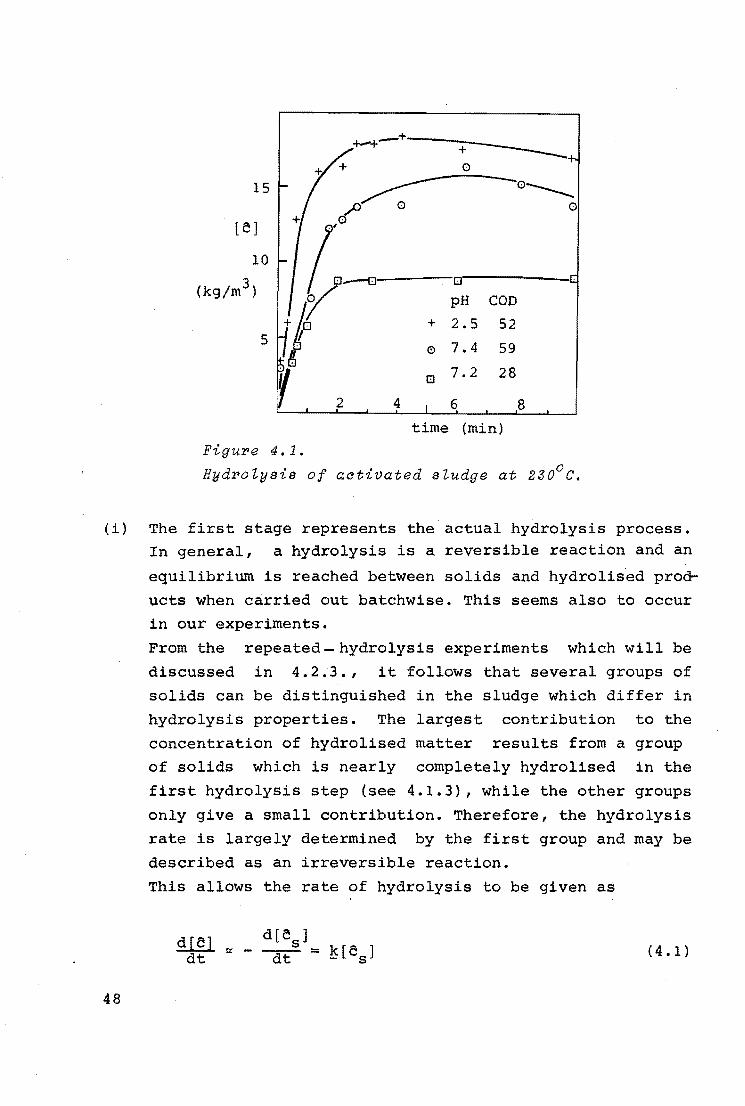
4. 2. THE HYDROLYSIS OF SLUDGE PARTICLES
Figure 4.1 shows characteristic examples of the course of the
hydrolysis process of activated sludge at 230°c. The COD of
the hydrolised matter,[c], is indicated as a function of time.
It follows from this figure that the curves can be divided in
to two stages:
47
15
[C:J
10
(kg/m3 ) CJ
pH COD
+ 2.5 52 5 7.4 59 0
l!I 7.2 28
2 4 6 8
time (min)
Figure 4.1.
HydroZysis of activated sludge at 2J0°c.
(i) The first stage represents the actual hydrolysis process.
48
In general, a hydrolysis is a reversible reaction and an
equilibrium is reached between solids and hydrolised prod
ucts when carried out batchwise. This seems also to occur
in our experiments.
From the repeated- hydrolysis experiments which will be
discussed in 4.2.3., it follows that several groups of
solids can be distinguished in the sludge which differ in
hydrolysis properties. The largest contribution to the
concentration of hydrolised matter results from a group
of solids which is nearly completely hydrolised in the
first hydrolysis step (see 4.1.3), while the other groups
only give a small contribution. Therefore, the hydrolysis
rate is largely determined by the first group and may be
described as an irreversible reaction.
This allows the rate of hydrolysis to be given as
d rAAl d[C:s] ~ k_[cs] dt ~ - dt = (4.1)
in which [e] is the COD of the hydro,lised matter, [csJ the
COD of the first mentioned group of solids, and ~ the
rate constant of the hydrolysis process. Since
[e J ~ [c J - [cJ s max ( 4. 2)
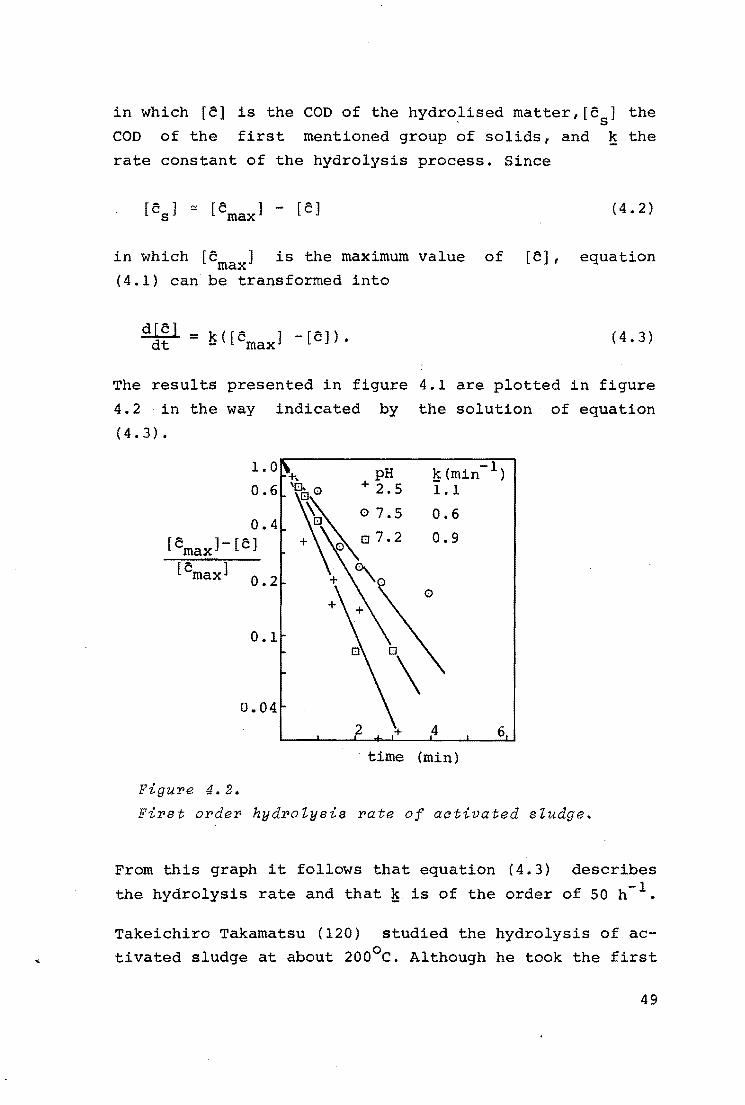
in which [c ] is the maximum value of [c], equation max (4.1) can be transformed into
~ = k([e J -[cJ). dt - max (4.3)
The results presented in figure 4.1 are plotted in figure
4.2 in the way indicated by the solution of equation
(4.3).
1.0
0.6
0.4 [cmax]-[c]
[cmaxl 0.2
0.1
0.04
Figure 4.2.
+, pH 'G.o +2.5
8
~o7.S
8
+ 0 7 .2 0
°\0
2 +
~ (min- 1 ) 1.1
0.6
0.9
0
4 6
time (min)
First order hydrolysis rate of aativated sludge.
From this graph it follows that equation (4.3) describes
the hydrolysis rate and that~· is of the order of SO h-l.
Takeichiro Takamatsu (120) studied the hydrolysis of ac
tivated sludge at about 200°c. Although he took the first
49
sample after 10 minutes, he could calculate from his data
that the hydrolysis rate constant had to be larger than
36 h- 1 . This is of the order of magnitude of our value.
(ii) In the second sta.ge the concentration of hydrolised mate
rial is constant or decreases slightly.
Takeichiro Takamatsu (120) found a constant level of the
COD of the hydrolised matter, while Brooks (23) observed
a small decrease. Brooks demonstrated that the hydrolised
material was again partly converted to the solid state.
The micro-organisms in activated sludge have dimensions of the
order of 1 - S µ. Because of their slimy skins the organisms
agglomerate into loose and porous structures with dimensions
of SO to 100 µ, known as flocks.
The rate constant associated wi.th the transfer of hydrolised
sludge from the outer surface of the flocks into the bulk of
the continuous water phase equals kfaf, in which kf is the
mass transfer coefficient on the outside of the flock and af
is the specific outer surface.
If we assume uniform spherical flocks with diameter df' then
the value of kf for these small flocks is given by
Sh
where Dr is the diffusivity of the hydrolised material and Sh
the Sherwood number. With the following characteristic values:
df = 60 x 10-6 m (87) and Dr= 10-8 m2/sec (diffusivity of sug
ar molecules in water under experimental conditions), it fol
lows that
-4 kf ~ 3.3 x 10 m/sec.
The suspension contains 4 volume per cent. of solids and the
flocks consist for at least 60% of water (87). Therefore, the
so
volume fraction of flocks (ef) is larger than 0.10. The spe
cific outer surface is given by
Thus, -1 -1 kfaf ~ 3.3 sec = 11,900 h •
Owing to the small dimension and the loose and porous struc
ture of the flock, the rate constant of physical transport in
side, will also be of the order of 11,900 h- 1 •
Since the experimentally determined rate constant of the hy
drolysis process is of the order of 50 h- 1 , the process must
be limited by chemical reaction inside or on the surface of
the solids.
The reaction~limited hydrolysis implies that the concentra
tion of hydrolised matter inside the flock is uniform and
equals the concentration in the bulk of the liquid in which
the flocks are suspended,[c]. When the reaction is interpreted
as a homogeneous reaction this further implies that the rate
of hydrolysis can be described by
In this, ~h is the hydrolysis rate constant and Es is the vol
ume fraction of solids in the flock.
The experiments showed that
Using the characteristic values for Ef ~ 0.1 and Es ~ 0.4 it -1 follows that ~h ~ 12,000 h •
The hydrolysis rate of primary sludge was determined at 200°c
51
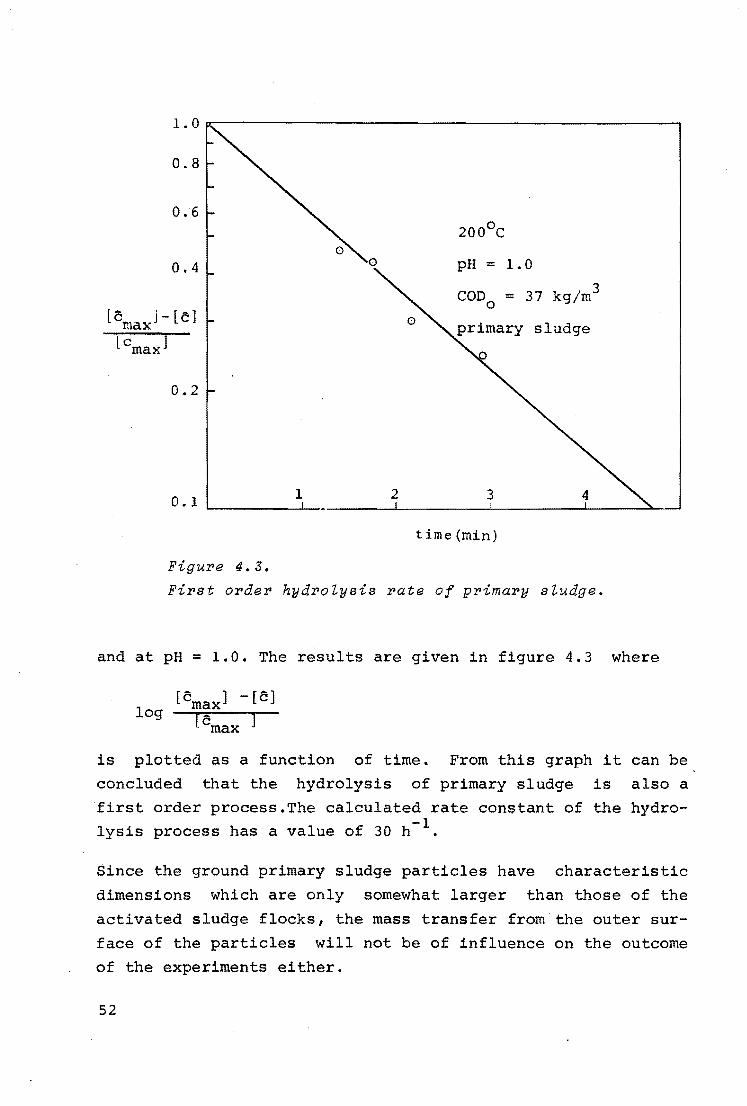
0.8
0.6 200°c
0.4 0 pH = 1.0
COD0
= 37 kg/m3
le J-lcl max
0.2
l 2 3 4 0.1 ""-~~~-----'--~~~--&.~~~~~"--~~~~--~~------'
time(min)
Figure 4.3.
FiPBt OPder hydrolysis Pate of primary sludge.
and at pH = 1.0. The results are given in figure 4.3 where
[cmax] -[c] log [c ]
max
is plotted as a function of time. From this graph it can be
concluded that the hydrolysis of primary sludge is also a
first order process~The calculated rate constant of the hydro
lysis process has a value of 30 h- 1 .
Since the ground primary sludge particles have characteristic
dimensions which are only somewhat larger than those of the
activated sludge flocks, the mass transfer from the outer sur
face of the particles will not be of influence on the outcome
of the experiments either.
52
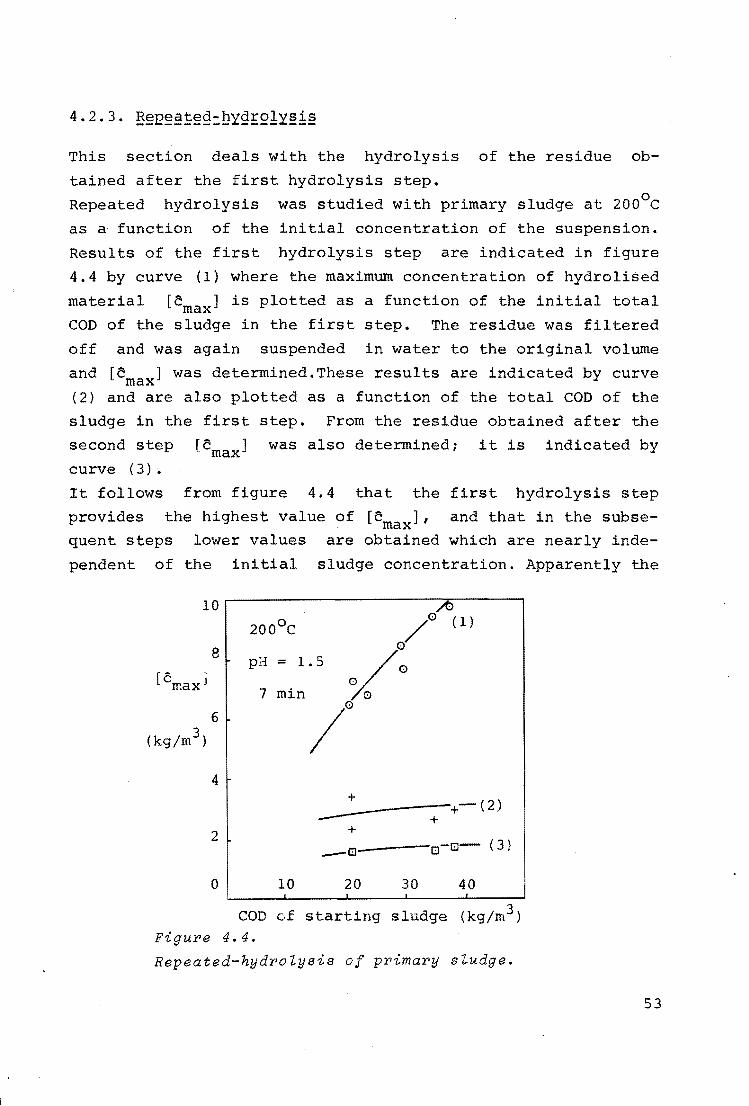
This section deals with the hydrolysis of the residue ob
tained after the first hydrolysis step.
Repeated hydrolysis was studied with primary sludge at 200°c
as a function of the initial concentration of the suspension.
Results of the first hydrolysis step are indicated in figure
4.4 by curve (1) where the maximum concentration of hydrolised
material [emax] is plotted as a function of the initial total
COD of the sludge in the first step. The residue was filtered
off and was again suspended in water to the original volume
and [e ] was determined.These results are indicated by curve max {2) and are also plotted as a function of the total COD of the
sludge in the first step. From the residue obtained after the
second step [emax] was also determined; it is indicated by
curve ( 3).
It follows from figure 4.4 that the first hydrolysis step
provides the highest value of [emax]' and that in the subse
quent steps lower values are obtained which are nearly inde
pendent of the initial sludge concentration. Apparently the
10
200°C
8
0
0/ pa= 1.5 /
7 min ~ 0
(1)
[cmaxj
/0 4
+ ----------:-+ - ( 2)
2 +
-t:l t:l-1::]- ( 3)
0 10 20 30 40
COD of starting sludge (kg/m3 ) Figure 4.4.
Repeated-hydrolysis of primary sludge.
53
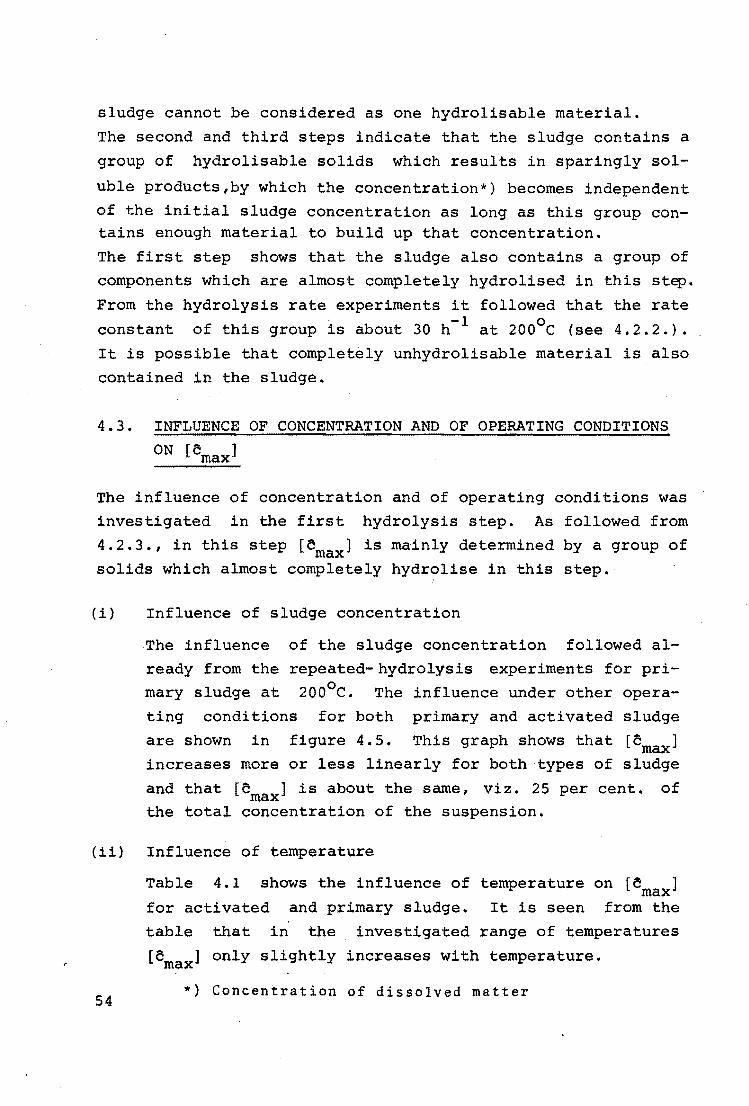
sludge cannot be considered as one hydrolisable material.
The second and third steps indicate that the sludge contains a
group of hydrolisable solids which results in sparingly sol-
uble products,by which the concentration*) becomes independent
of the initial sludge concentration as long as this group contains enough material to build up that concentration.
The first step shows that the sludge also contains a group of components which are almost completely hydrolised in this step.
From the hydrolysis rate experiments it followed that the rate
constant of this group is about 30 h-l at 200°c (see 4.2.2.).
It is possible that completely unhydrolisable material is also
contained in the sludge.
4.3. INFLUENCE OF CONCENTRATION AND OF OPERATING CONDITIONS
ON [cmax]
The influence of concentration and of operating conditions was
investigated in the first hydrolysis step. As followed from
4.2.3., in this step [cmax] is mainly determined by a group of solids which almost completely hydrolise in this step.
(i) Influence of sludge concentration
The influence of the sludge concentration followed al
ready from the repeated- hydrolysis experiments for pri
mary sludge at 200°c. The influence under other opera
ting conditions for both primary and activated sludge
are shown in figure 4.5. This graph shows that [cmax] increases more or less linearly for both types of sludge
and that [cmax] is about the same, viz. 25 per cent. of the total concentration of the suspension.
(ii) Influence of temperature
54
Table 4. l shows the i.nfluence of temperature on [ cmax]
for activated and primary sludge. It is seen from the
table that in the investigated range of temperatures
[cmaxl only slightly increases with temperature.
*) Concentration of dissolved matter
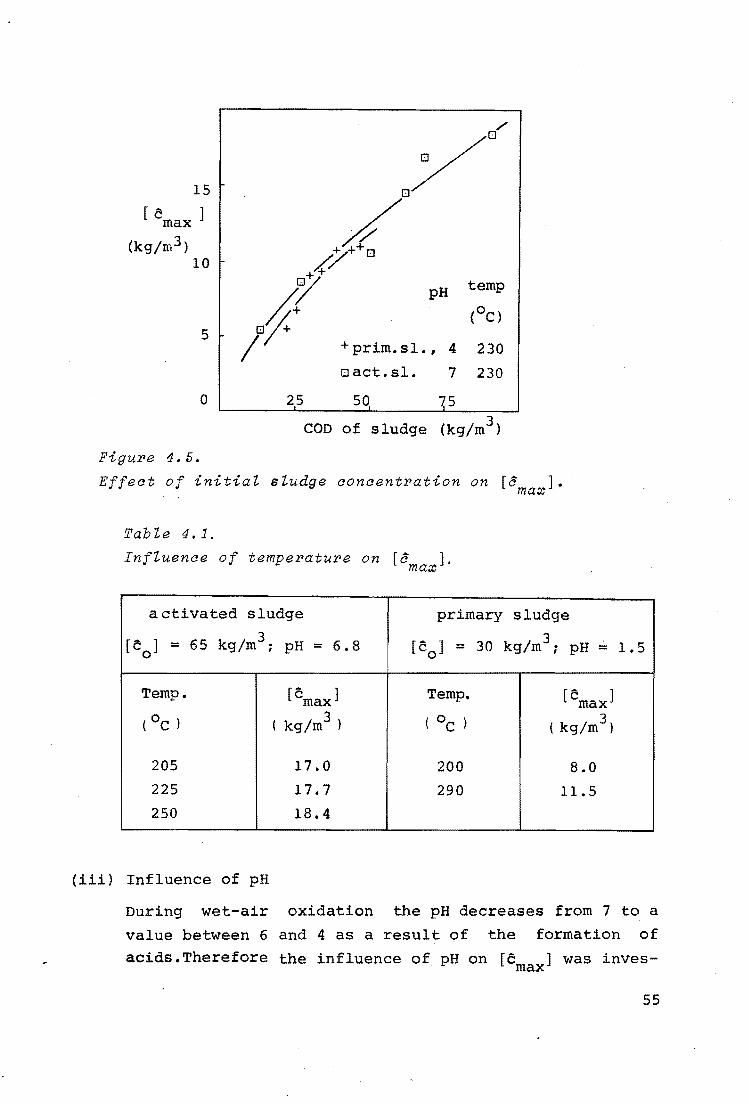
15
[ cmax ]
(kg/m3) 10
5 ...
0
Figur>e 4. 5.
pH
+prim.sl., 4
oact.sl. 7
25 so 7,5
temp
(OC)
230
230
COD of sludge (kg/m3 )
Effect of initial sludge concentr>ation on [a ]. max
Tab le 4. 1.
Influence of temper>atur>e on [a ]. max
activated sludge primary sludge
[co] = 65 kg/m\ pH = 6.8 [co] = 30 3 kg/m ; pH= 1.5
Temp. [cmax] Temp. [cmax]
( oc ) ( kg/m3 ) ( oc ) 3 ( kg/m )
205 17.0 200 8.0
225 17.7 290 11. 5
250 18.4
(iii) Influence of pH
During wet-air oxidation the pH decreases from 7 to a
value between 6 and 4 as a result of the formation of
acids.Therefore the influence of pH on [c ] was inves-max
55
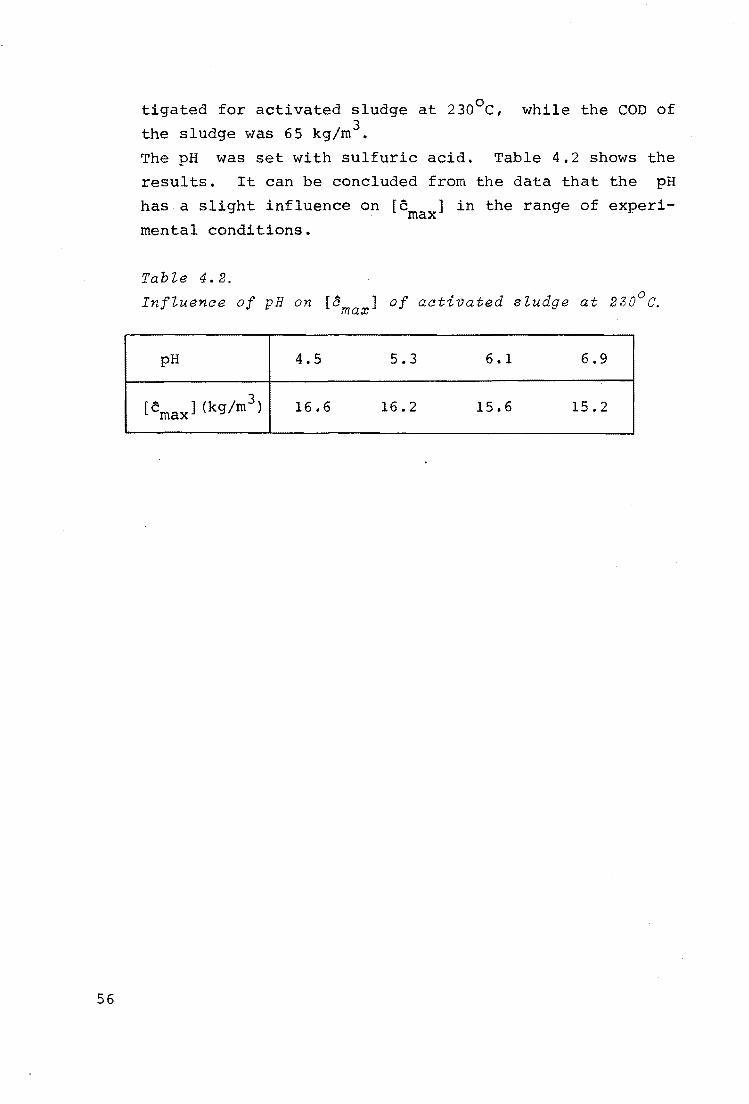
56
tigated for activated sludge at 230°c, while the COD of
the sludge was 65 kg/m3 •
The pH was set with sulfuric acid. Table 4.2 shows the
results. It can be concluded from the data that the pH
has a slight influence on [cmax] in the range of experi
mental conditions.
Tab'le 4.2.
Inf'luenae of pH on [8 J of activated s'ludge at 230°~ ma.x
pH 4.5 5.3 6.1 6.9
[cmaxl (kg/m3) 16.6 16.2 15.6 15.2
' •
Chapter 6 THE OXIDATION OF PRIMARY SLUDGE
5.1. PRELIMINARY BATCH EXPERIMENTS
Preliminary batch experiments were performed with primary
sludge in the 52 ml reactor, described in 4.1. The reactor was
charged with 15 ml of ground sludge and pure oxygen.
The pH was set with sulfuric acid at 4. The repoJ."'lted oxygen
pressures were measured at room temperature before the exper-3 iment. At a partial pressure of 25 atm, 90 kg of oxygen per m
of sludge suspension was present.
The charged reactor was preheated, kept at 230°c in the ther
mostat, and cooled, as described in 4.1.
Figure 5. L shows· the influence of the oxygen partial pressure
on the conversion for several sludge concentrations after a
reaction time of 3 min. It follows from this graph that there
is a "critical" pressure~
57
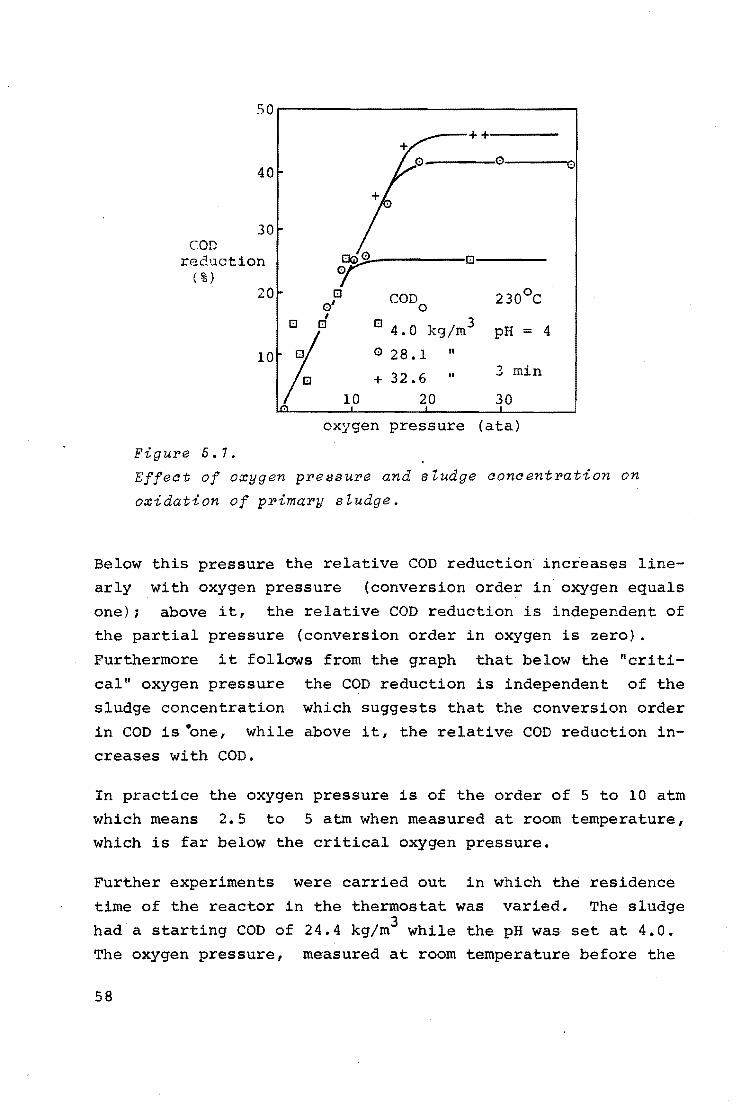
40
30 COD
reduction (%)
20
10
Figure 6.1.
--++----
---~~0--~~0
r ['J
['J COD 230°c 0' 0 I
0 4. O kg/m3 ['J ['J pH = 4
j 0 28 .1 II
+ 32. 6 II 3 min .
10 20 30
oxygen pressure (a ta)
Effect of oxygen pressure and siudge concentration on
oxidation of primary siudge.
Below this pressure the relative COD reduction increases line
arly with oxygen pressure (conversion order in oxygen equals
one); above it, the relative COD reduction is independent of
the partial pressure (conversion order in oxygen is zero) .
Furthermore it follows from the graph that below the "criti
cal" oxygen pressure the COD reduction is independent of the
sludge concentration which suggests that the conversion order
in COD is one, while above it, the relative COD reduction in
creases with COD.
In practice the oxygen pressure is of the order of 5 to 10 atm
which means 2.5 to 5 atm when measured at room temperature,
which is far below the critical oxygen pressure.
Further experiments were carried out in which the residence
time of the reactor in the thermostat was varied. The sludge
had a starting COD of 24.4 kg/m3 while the pH was set at 4.0.
The oxygen pressure, measured at room temperature before the
58
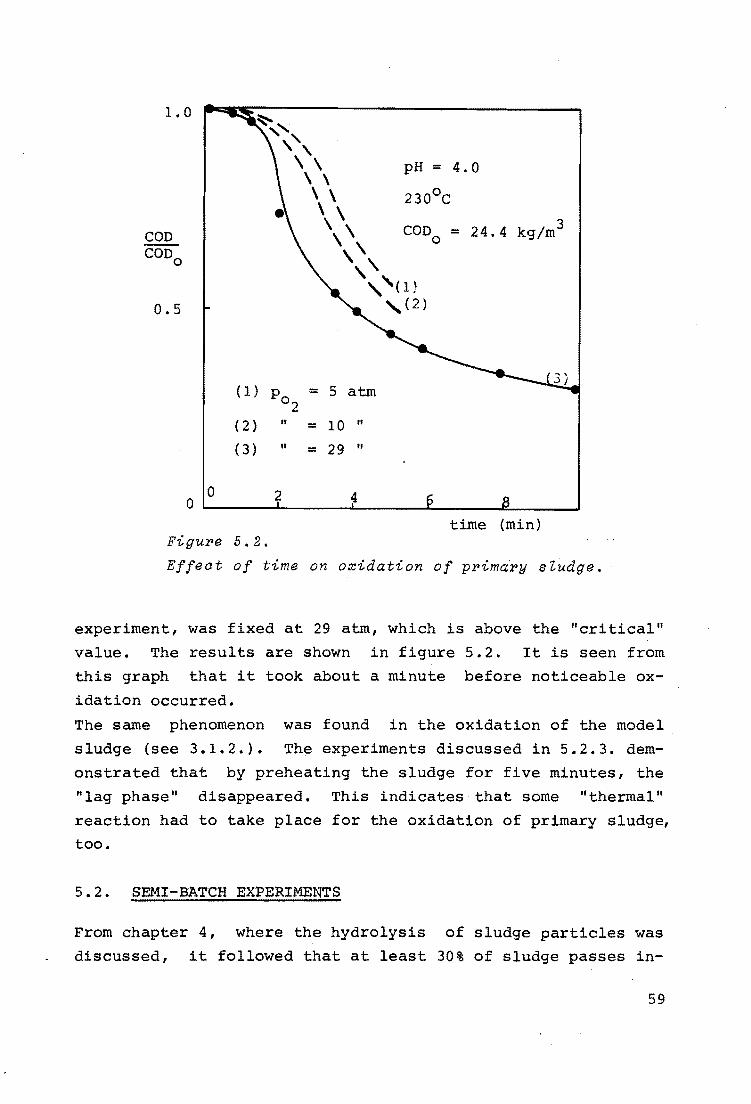
1. 0 ~ ,, ,, ,,,
pH = 4. 0 \ \ \ \ 230°c \ \
COD \ \ COD0
= 24.4 kg/m3
\ \ COD0 \ \
' ',(1)
0.5 '(2)
( l) Po = 5 atm 2
( 2) " = 10 II
( 3) II = 29 II
0 2 4 0 time (min)
Figure 5. 2.
Effect of time on oxidation of primal>y sZudge.
experiment, was fixed at 29 atm, which is above the "critical"
value. The results are shown in figure 5.2. It is seen from
this graph that it took about a minute before noticeable ox
idation occurred.
The same phenomenon was found in the oxidation of the model
sludge (see 3.1.2.). The experiments discussed in 5.2.3. dem
onstrated that by preheating the sludge for five minutes, the
"lag phase" disappeared. This indicates that some "thermal"
reaction had to take place for the oxidation of primary sludge,
too.
5.2. SEMI-BATCH EXPERIMENTS
From chapter 4, where the hydrolysis of sludge particles was
discussed, it followed that at least 30% of sludge passes in-
59
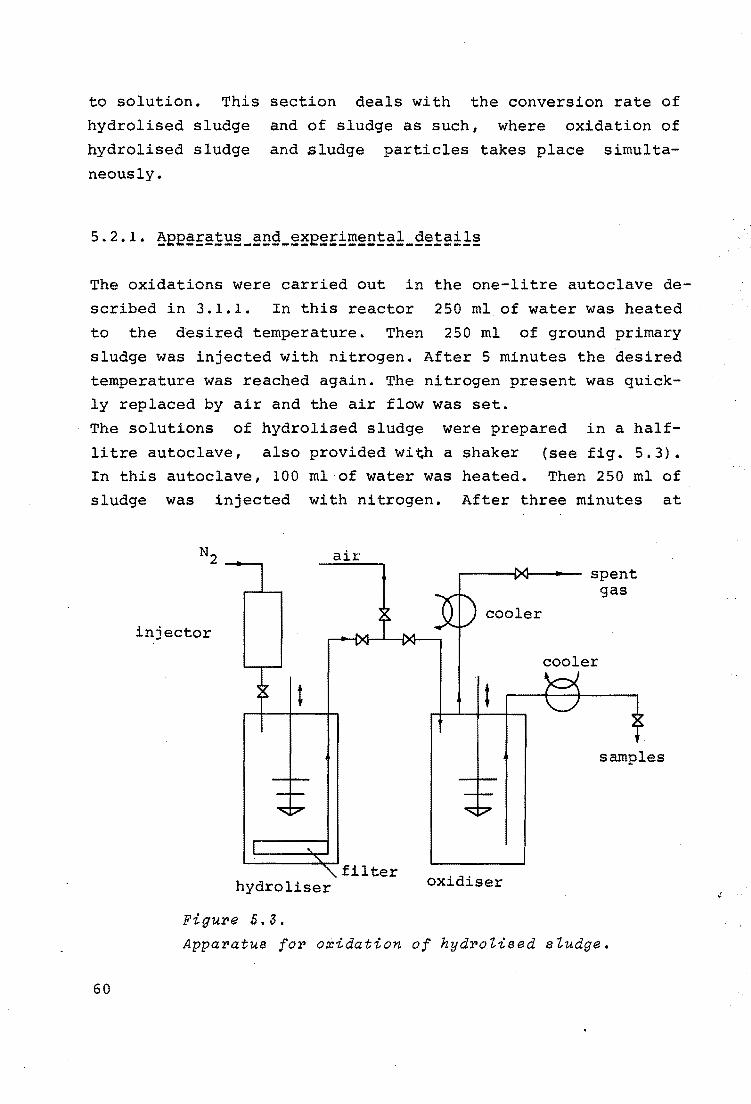
to solution. This section deals with the conversion rate of
hydrolised sludge and of sludge as such, where oxidation of
hydrolised sludge and sludge particles takes place simulta
neously.
The oxidations were carried out in the one-litre autoclave de
scribed in 3.1.1. In this reactor 250 ml of water was heated
to the desired temperature. Then 250 ml of ground primary
sludge was injected with nitrogen. After 5 minutes the desired
temperature was reached again. The nitrogen present was quick
ly replaced by air and the air flow was set.
The solutions of hydrolised sludge were prepared in a half
li tre autoclave, also provided with a shaker (see fig. 5.3).
In this autoclave, 100 ml of water was heated. Then 250 ml of
sludge was injected with nitrogen. After three minutes at
60
air
injector
filter hydroliser
Figure 5.3.
cooler
oxidiser
spent gas
cooler
samples
Apparatus for o~idation of hydroZised sludge.
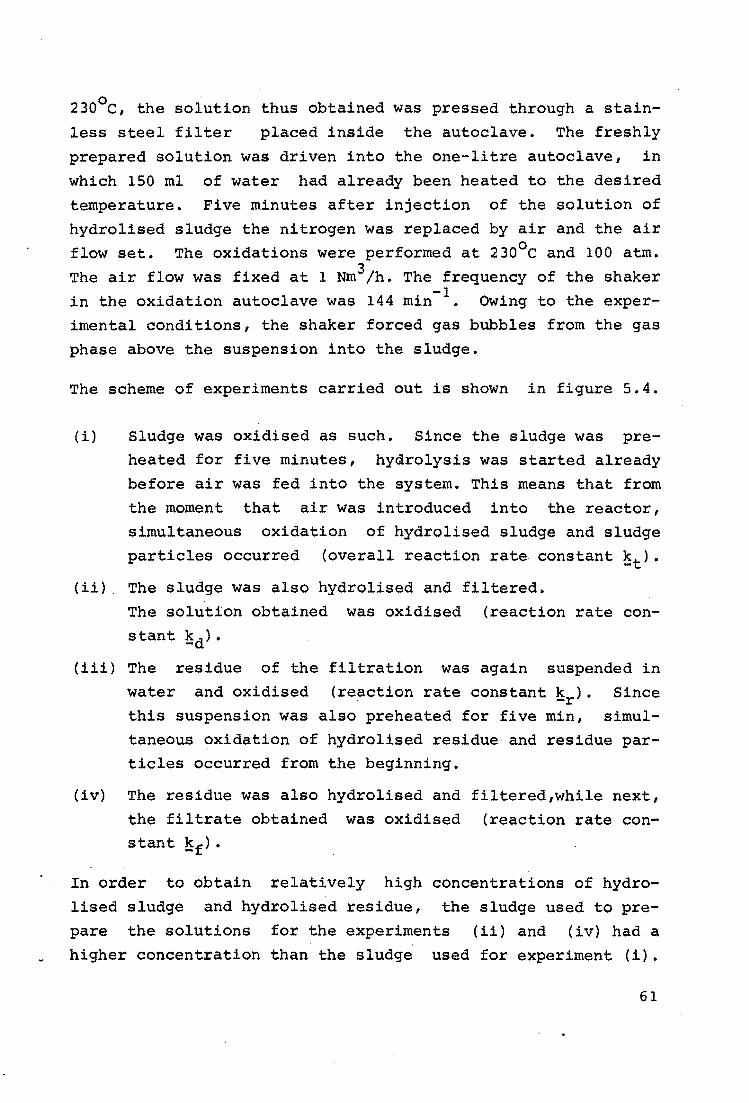
230°c, the solution thus obtained was pressed through a stain
less steel filter placed inside the autoclave. The freshly
prepared solution was driven into the one-litre autoclave, in
which 150 ml of water had already been heated to the desired
temperature. Five minutes after injection of the solution of
hydrolised sludge the nitrogen was replaced by air and the air
flow set. The oxidations were performed at 230°c and 100 atm.
The air flow was fixed at 1 Nm3/h. The frequency of the shaker
in the oxidation autoclave was 144 min- 1 • Owing to the exper
imental conditions, the shaker forced gas bubbles from the gas
phase above the suspension into the sludge.
The scheme of experiments carried out is shown in figure 5.4.
(i) Sludge was oxidised as such. Since the sludge was pre
heated for five minutes, hyGrolysis was started already
before air was fed into the system. This means that from
the moment that air was introduced into the reactor, simultaneous oxidation of hydrolised sludge and sludge
particles occurred (overall reaction rate constant ~t).
(ii) . The sludge was also hydrolised and filtered.
The solution obtained was oxidised (reaction rate con
stant ~d).
(iii) The residue of the filtration was again suspended in
water and oxidised (reaction rate constant k ). Since . -r this suspension was also preheated for five min, simul-
taneous oxidation of hydrolised residue and residue particles occurred from the beginning.
(iv) The residue was also hydrolised and filtered,while next,
the filtrate obtained was oxidised (reaction rate con
stant !sf) •
In order to obtain relatively high concentrations of hydro
lised sludge and hydrolised residue, the sludge used to pre
pare the solutions for the experiments (ii) and (iv) had a
higher concentration than the sludge used for experiment (i) •
61
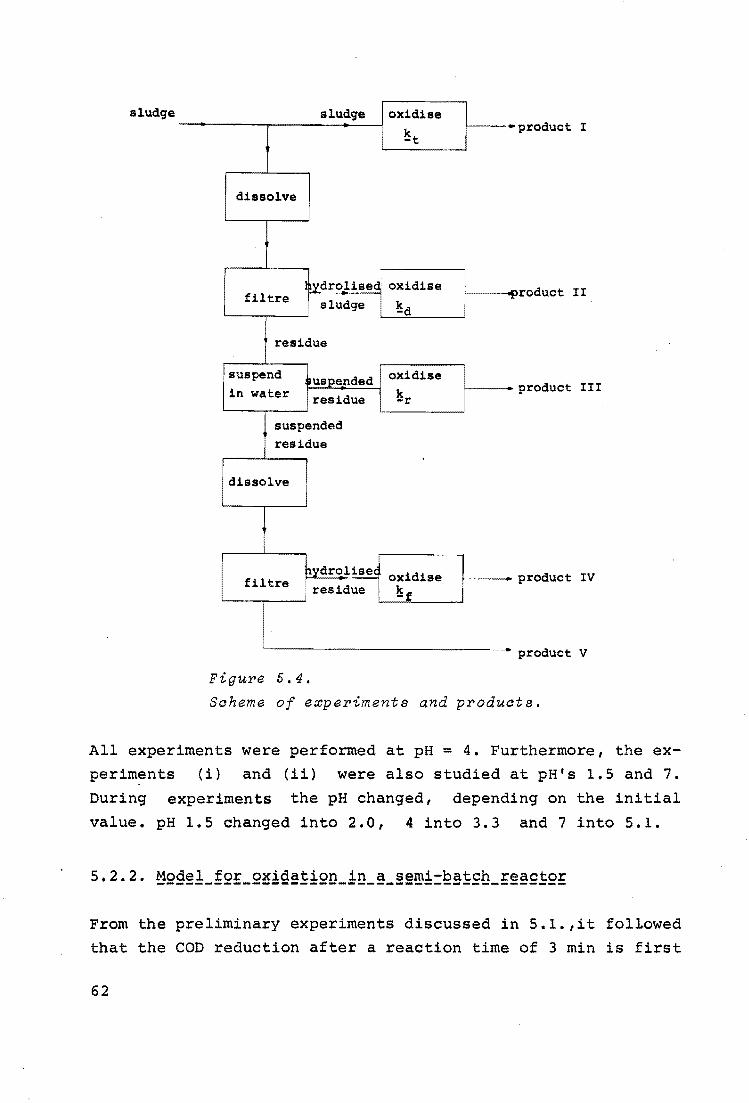
sludge sludge oxidise
~t •product I
dissolve
,vdrolised oxidise filtre ! sludge ~d
.product II
residue
!suspend suspended oxidise lin water residue ~r
product III
suspended residue
dissolve
ovdrolise1 oxidise
I .. filtre residue !sf product IV
·- product v
Figure 5.4.
Soheme of experiments and produote.
All experiments were performed at pH= 4. Furthermore, the ex
perim~nts (i) and (ii) were also studied at pH's 1.5 and 7.
During experiments the pH changed, depending on the initial
value. pH 1.5 changed into 2.0, 4 into 3.3 and 7 into 5.1.
From the preliminary experiments discussed in 5.1.,it followed
that the COD reduction after a reaction time of 3 min is first
62
order in sludge concentration and first order in oxygen pres
sure at the oxygen pressures applied in practice and also in
our further investigation.
Since the maximum COD reduction generally is less than 100%,
the conversion rate cannot be fully described by the assump
tion of a first order in the total COD. By the oxidation of
glucose (Chapter 3) the effective COD was introduced, being
the actual COD minus the COD at the point where the conver
sion rate is nearly zero.
The starting point of the model discussed now is the assump
tion that the chemical kinetics of the oxidation are described
by the following rate equation (g).
in which k is the second order reaction rate constant, [c] the
effective COD and [ob] the oxygen concentration in the bulk.
The conversion rate is partly limited by the transport of ox
ygen from the gas phase into the suspension. It is assumed
that the gas phase and the suspension are completely mixed.
It should be remembered that the gas bubbles in the suspension
originate from the gas phase above it.
When neglecting the gas phase resistance for mass transfer,
the oxygen pressure at the gas-liquid interface (pi) becomes
identical with that in the spent gas (pe).
The following mass balances were obtained, in which ¢0
x is the
amount of oxygen passing through the gas-liquid interface per
unit time and per unit reactor volume, and which is given by
¢ = k a ( [ o1. ] - [ob]) ( 1-e ) ox t
where [o.] is the oxygen concentration at the interface which 1
is related to p. with the Henry coefficient H by 1 .
= p /H. e
63
E is the gas fraction, based on the total reactor volume.
The mass balance over the sludge phase leads to
where
k[c] [o ] = - £1£1 - b dt
The mass balance over the gas phase is
This can be written as
in which G is the total volumetric gas flow under reaction
conditions, v is the volume of the reactor and pf is the ox
ygen partial pressure in the gas feed, after saturation with
steam.
Introducing the dimensionless concentrations and pressure
Y = lsL [ C ] I
0 I p =
where [c0
] is [c] at zero time, and eliminating
mass balances, the following equations are found
- .£y = K l"ly dt 2,...
~ = K~ [ K2py - Kl (n-p) ]
d1T 1 - dt = Ks [ Kl (n-p) - K4 (1-n) ]
64
¢ from the ox
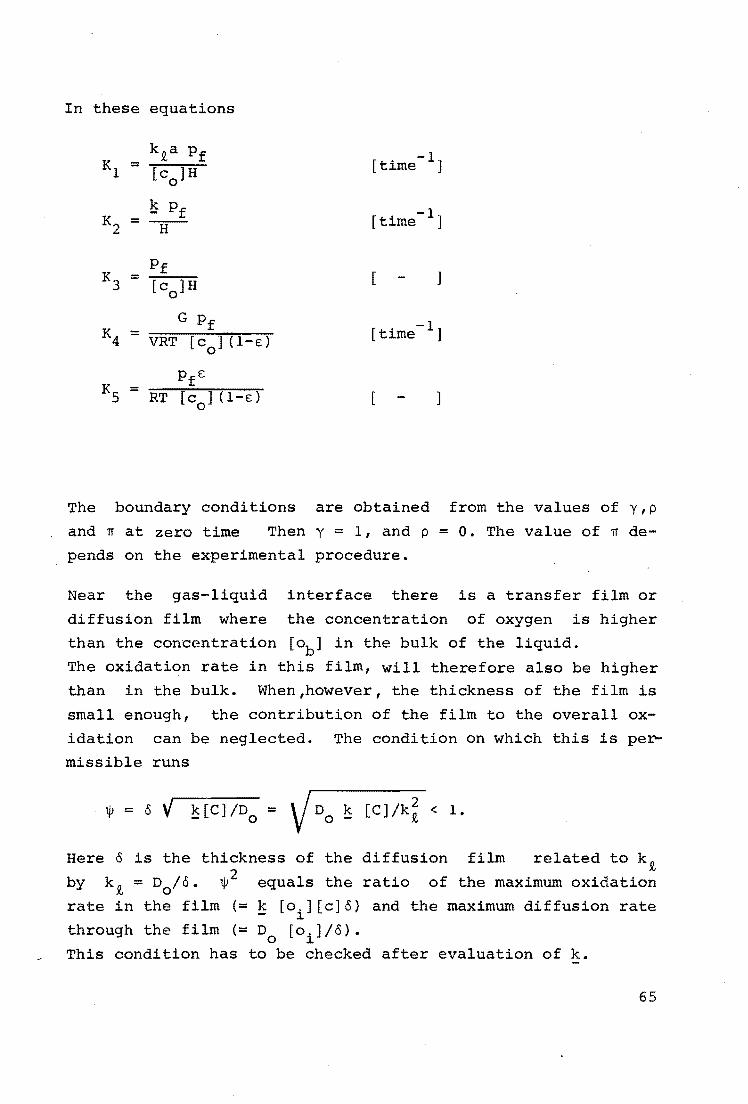
In these equations
Kl kta pf -1 = [time ] [c ] H
0
K2 !s pf -1 = -H- [time ]
K3 Pf
= [c0
]H
K4 G pf -1 = [time ] VRT [c ) (1-e:)
0
KS pfE
= [co] (1-e:) RT
The boundary conditions are obtained from the values of y,p
and TI at zero time Then y = 1, and p = 0. The value of TI de
pends on the experimental procedure.
Near the gas-liquid interface there is a transfer film or
diffusion film where the concentration of oxygen is higher
than the concentration [ob] in the bulk of the liquid.
The oxidation rate in this film, will therefore also be higher
than in the bulk. When,however, the thickness of the film is
small enough, the contribution of the film to the overall ox
idation can be neglected. The condition on which this is per
missible runs
k[C)/D = - 0
2 k [CJ /kt < 1. t/J = 6 v Here 6 is the thickness of the diffusion film related to kt
by kt = D0/6. t/J 2 equals the ratio of the maximum oxidation
rate in the film(= k [o.][c]6) and the maximum diffusion rate - l.
through the film (= D [o.]/6). 0 1
This condition has to be checked after evaluation of k.
65
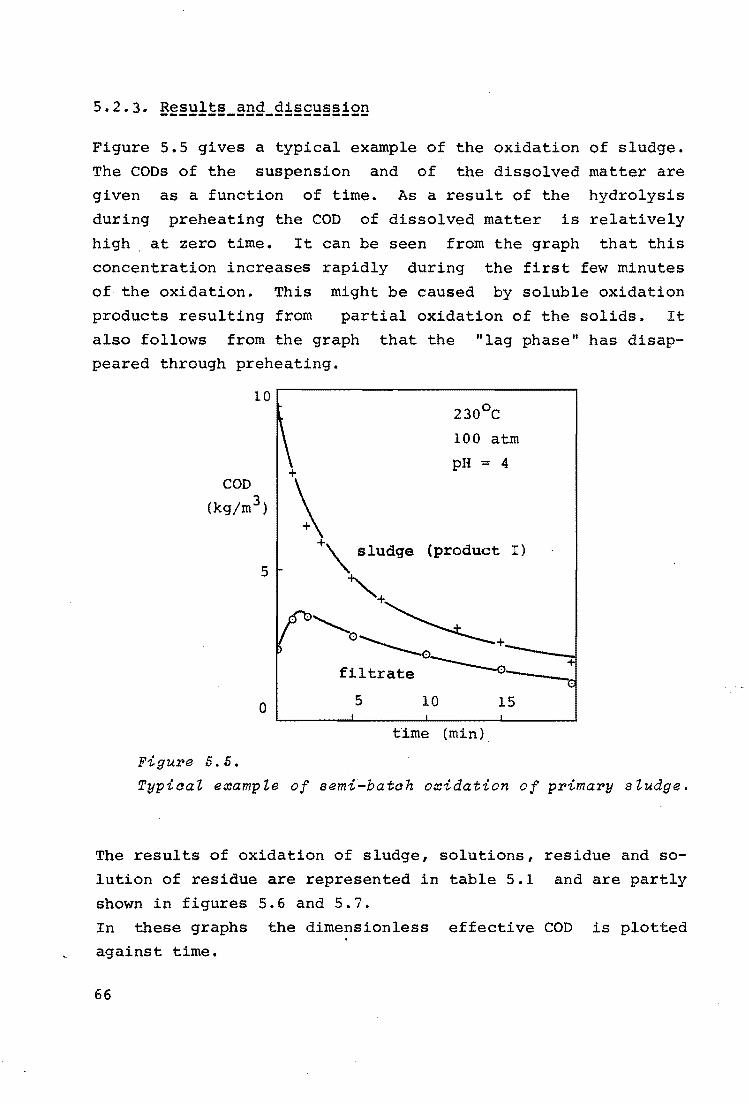
Figure 5.5 gives a typical example of the oxidation of sludge.
The CODs of the suspension and of the dissolved matter are
given as a function of time. As a result of the hydrolysis
during preheating the COD of dissolved matter is relatively
high at zero time. It can be seen from the graph that this
concentration increases rapidly during the first few minutes
of the oxidation. This might be caused by soluble oxidation
products resulting from partial oxidation of the solids. It
also follows from the graph that the "lag phase" has disap
peared through preheating.
10
COD
(kg/m3 )
5
0
Figure S.S.
+\ +
230°c
100 atm
pH = 4
\sludge {product I)
'+. r~~+ filtrate ~-~---
5 10 15
time (min)
Typical example of semi-batch oxidation of primary sludge.
The results of oxidation of sludge, solutions, residue and so
lution of residue are represented in table 5.1 and are partly
shown in figures 5.6 and 5.7.
In these graphs the dimensionless effective COD is plotted
against time.
66
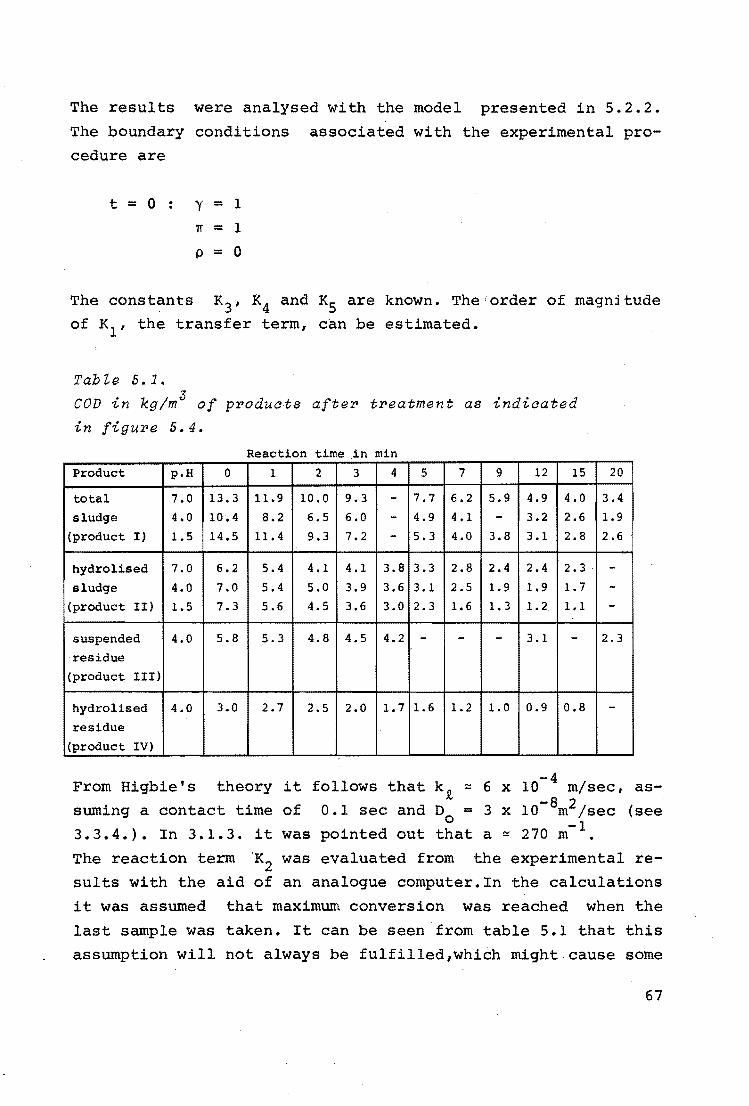
The results were analysed with the model presented in 5.2.2.
The boundary conditions associated with the experimental procedure are
t = 0 y = 1
7f = 1
p = 0
The constants K3 , K4 and K5 are known. The,order of magnjtude
of K1 , the transfer term, can be estimated.
Table 5.1.
COD in kg/m 3 of pPodua~s afteP tPeatment as indiaated
in figuPe 5.4.
Reaction time in min
Product p.H 0 1 2 3 4 5
total 7.0 13.3 11.9 10.0 9.3 - 7.7
sludge 4.0 10.4 8.2 6.5 6.0 - 4.9
(product I) 1.5 14.5 11. 4 9.3 7.2 - 5.3
hydrolised 7.0 6.2 5.4 4.1 4.1 3.8 3.3
sludge 4.0 7.0 5.4 5.0 3.9 3.6 3.1
(product II) 1.5 7.3 5.6 4.5 3.6 3.0 2.3
suspended 4.0 5.8 5.3 4.8 4.5 4.2 -residue
(product III)
hydrolised 4.0 3.0 2.7 2.5 2.0 1. 7 1.6
residue
(product IV)
From Higbie's theory it follows that
suming a contact time of 0.1 sec and 3.3.4.). In 3.1.3. it was pointed out
7 9 12 15 20
6.2 5.9 4.9 4.0 3.4
4.1 - 3.2 2.6 1.9
4.0 3.8 3.1 2.8 2.6
2.8 2.4 2.4 2. 3 . -2.5 1. 9 1.9 1. 7 -1.6 1. 3 1.2 1.1 -- - 3.1 - 2.3
1.2 1.0 0.9 0.8 -
k R, 6 -4
c:: x 10 m/sec, -8 2
Do = 3 x 10 m /sec that a c:: 270 m- 1 •
as-
(see
The reaction term 'K2 was evaluated from the experimental results with the aid of an analogue computer.In the calculations
it was assumed that maximum conversion was reached when the
last sample was taken. It can be seen from table 5.1 that this
assumption will not always be fulfilled,which might cause some
67
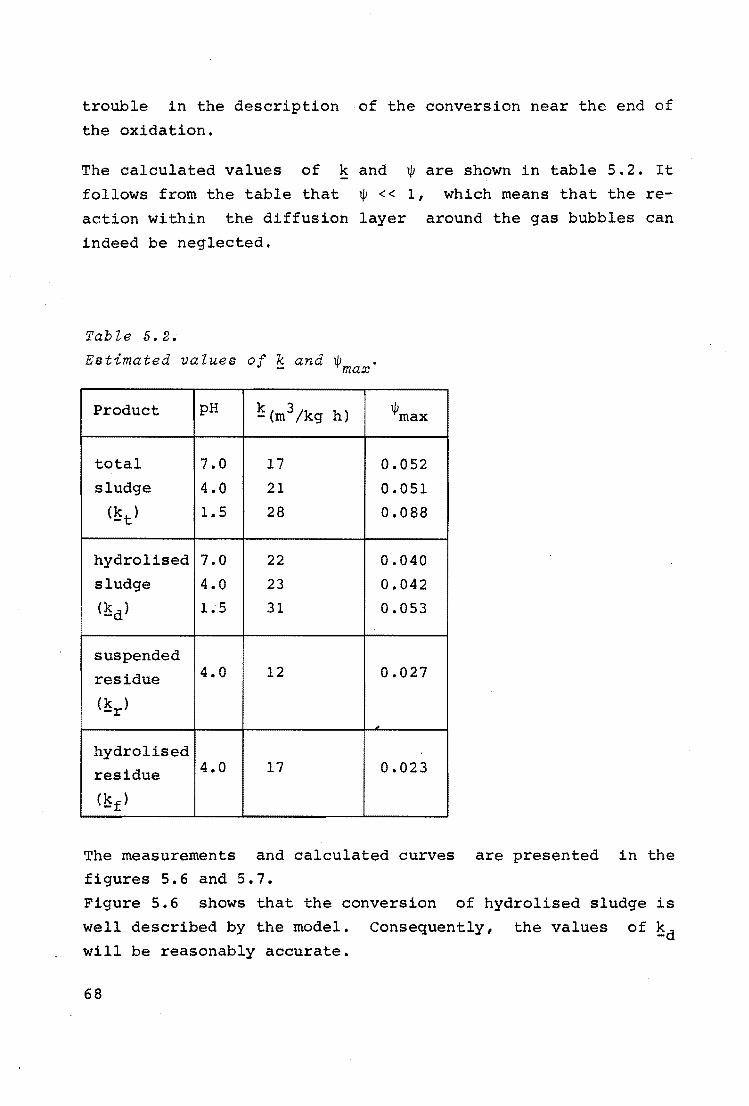
trouble in the description of the conversion near the end of
the oxidation.
The calculated values of k and w are shown in table 5.2. It
follows from the table that w << 1, which means that the re
action within the diffusion layer around the gas bubbles can
indeed be neglected.
Table 5.2.
Estimated values of k and ¢ • - max
Product pH ~(m3 /kg h) ¢max
total 7.0 17 0.052
sludge 4.0 21 0.051
(!st) 1.5 28 0.088
hydrolised 7.0 22 0.040
sludge 4.0 23 0.042
(~d) 1.5 31 0.053
suspended
residue 4.0 12 0.027
(~r)
hydrolised
residue 4.0 17 0.023
(}Sf)
The measurements and calculated curves are presented in the
figures 5.6 and 5.7.
Figure 5.6 shows that the conversion of hydrolised sludge is
well described by the model. Consequently, the values of ~d
will be reasonably accurate.
68
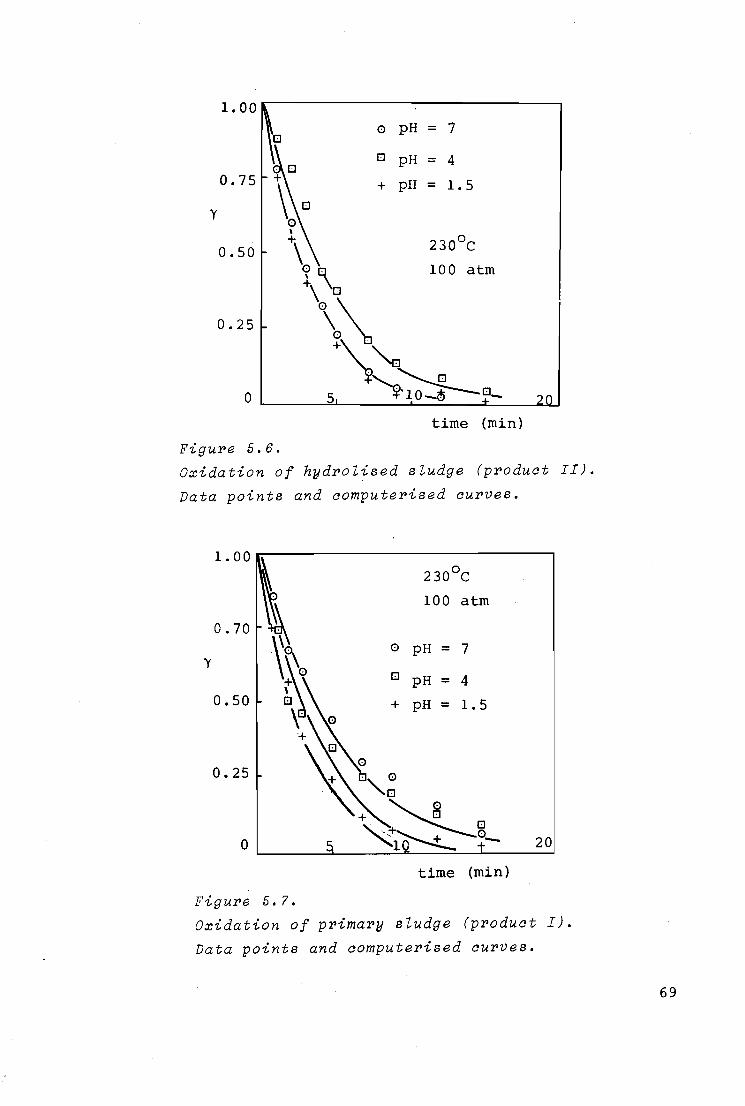
1.00 0 pH = 7
0
0 pH = 4 0.75 + pII = 1. 5
y
' 0.50 +\ 230°c
Oo 100 atm ·\ \0
0.25 \\ +\""'
0 5 ~~0-time (min)
Figure 5. 6.
Oxidation of hydrolised sludge (product II).
Data points and computerised curves.
0.70
y
0.50
0.25
0
Figure 5.?.
230°c
100 atm
0 pH = 7
O pH = 4
+ pH = 1. 5
time (min)
20
Oxidation of primary sludge (product I).
Data points and computerised curves.
69
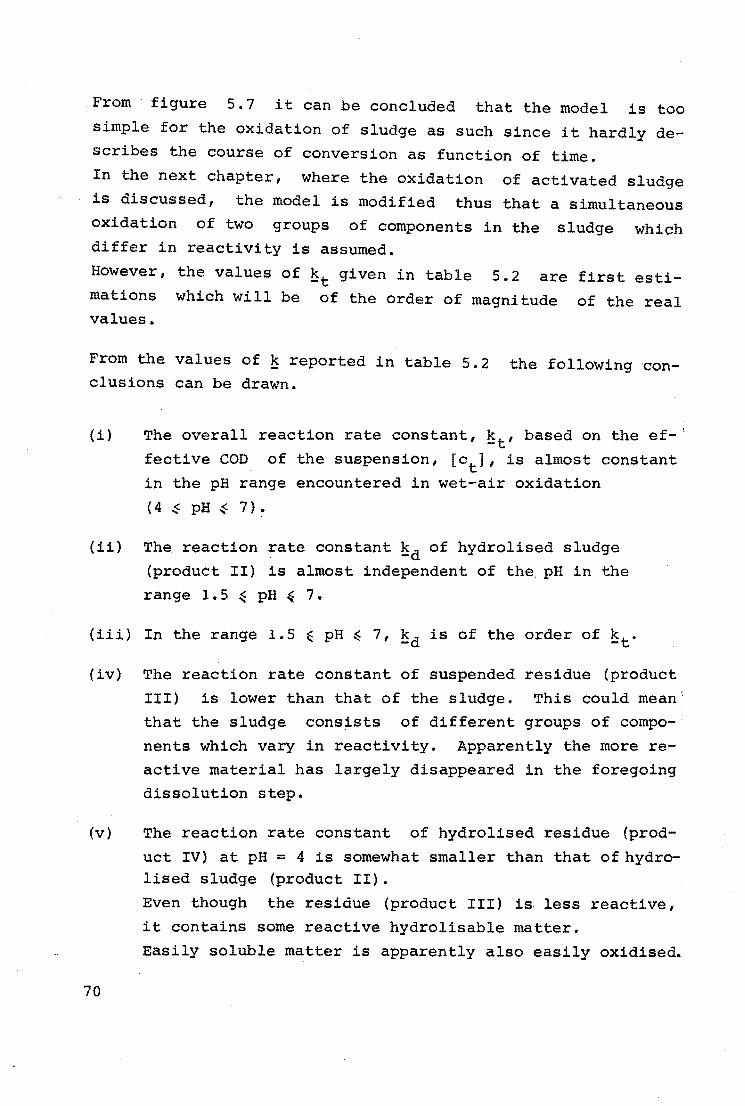
From figure 5.7 it can be concluded that the model is too
simple for the oxidation of sludge as such since it hardly de
scribes the course of conversion as function of time.
In the next chapter, where the oxidation of activated sludge
is discussed, the model is modified thus that a simultaneous
oxidation of two groups of components in the sludge which
differ in reactivity is assumed.
However, the values of ~t given in table 5.2 are first esti
mations which will be of the order of magnitude of the real values.
From the values of ~ reported in table 5.2 the following conclusions can be drawn.
(i) The overall reaction rate constant, ~t' based on the ef-'
fective COD of the suspension, [ct], is almost constant
in the pH range encountered in wet-air oxidation
( 4 ~ pH {- 7).
(ii) The reaction rate constant ~d of hydrolised sludge
(product II) is almost independent of the. pH in the
range 1.5 ~ pH ' 7.
(iii) In the range 1.5 E pH~ 7, ~dis cf the order of ~t·
(iv) The reaction rate constant of suspended residue (product
III) is lower than that of the sludge. This could mean;
that the sludge consists of different groups of compo
nents which vary in reactivity. Apparently the more re
active material has largely disappeared in the foregoing
dissolution step.
(v) The reaction rate constant of hydrolised residue (prod
uct IV) at pH= 4 is somewhat smaller than that of hydrolised sludge (product II).
70
Even though the residue (product III) is less reactive,
it contains some reactive hydrolisable matter.
Easily soluble matter is apparently also easily oxidised.
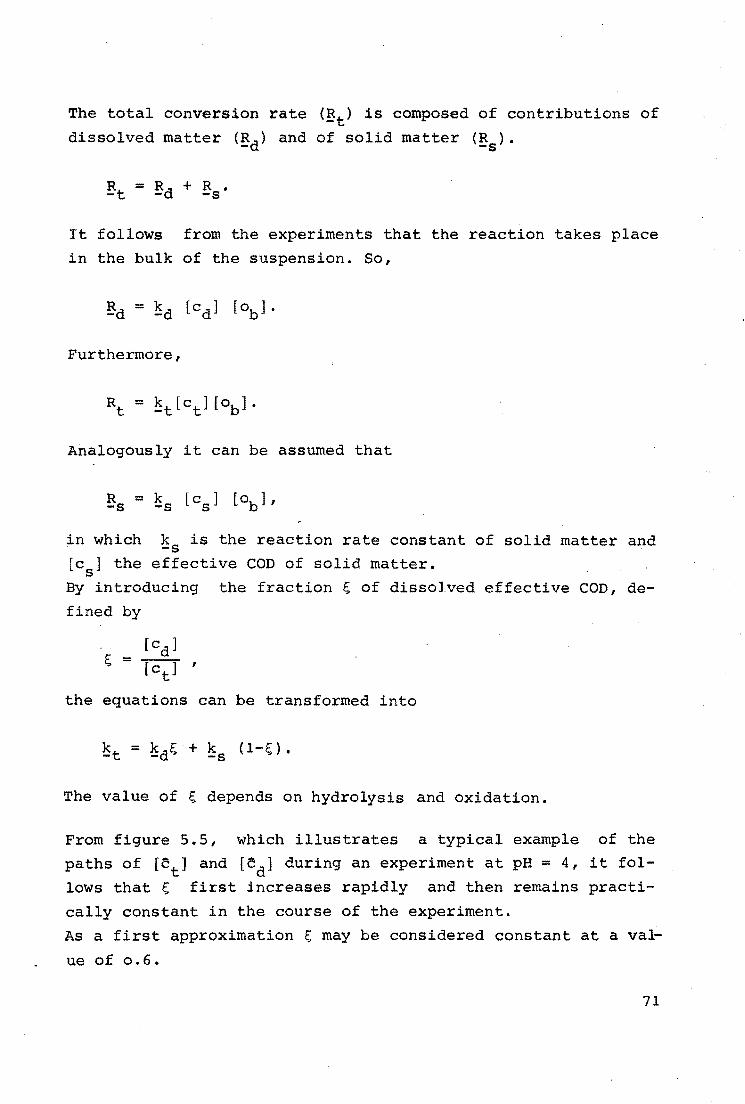
The total conversion rate (gt) is composed of contributions of
dissolved matter <gd) and of solid matter (gs).
It follows from the experiments that the reaction takes place
in the bulk of the suspension. So,
Furthermore,
Analogously it can be assumed that
R = k [cs] [ob] , -s -s
in which ~s is the reaction rate constant of solid matter and [cs] the effective COD of solid matter.
By introducing the fraction ~ of dissolved effective COD, de
fined by
[cd] ~ = TCT I
t
the equations can be transformed into
The value of ~ depends on hydrolysis and oxidation.
From figure 5.5, which illustrates a typical example of the
paths of [at) and [ad] during an experiment at pH = 4, it fol
lows that ~ first increases rapidly and then remains practi
cally constant in the course of the experiment.
As a first approximation ~ may be considered constant at a val
ue of o.6.
71
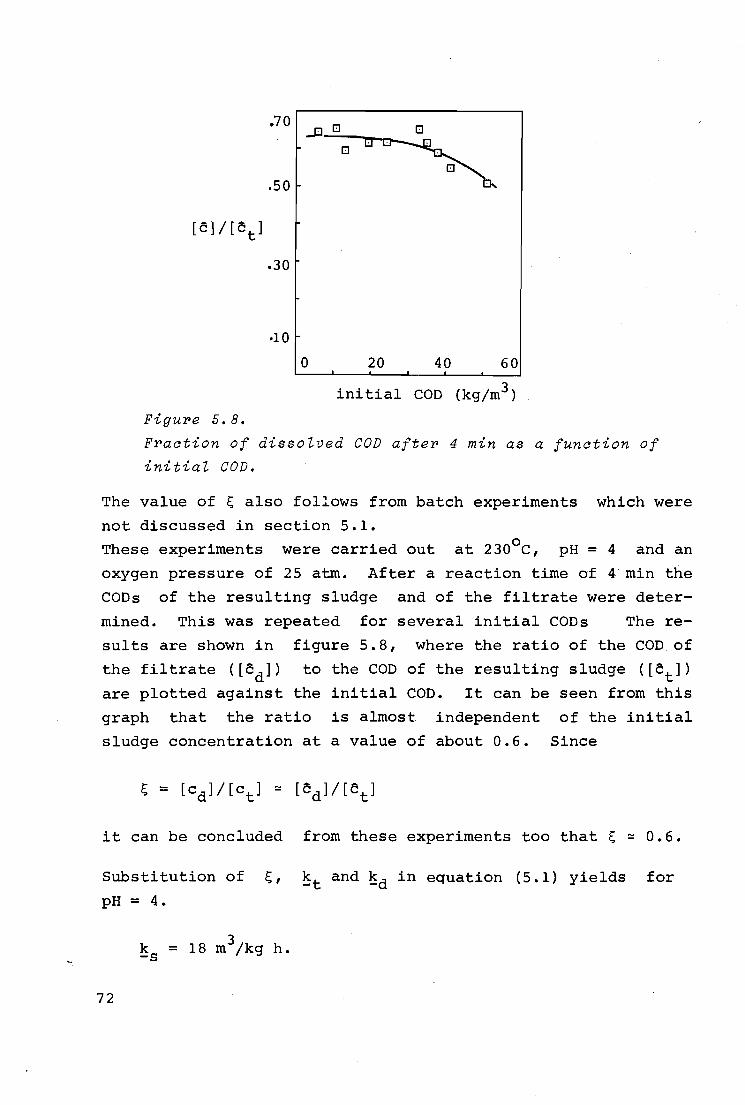
.70 0 0
JJ--· 0-~· 0 .
0 ., .so
.30
·10
0 20 40 60
initial COD {kg/m3 )
Figure 5. 8.
Fraction of dissolved COD after 4 min as a function of
initial COD.
The value of ~ also follows from batch experiments which were
not discussed in section 5.1.
These experiments were carried out at 230°c, pH = 4 and an
oxygen pressure of 25 atm. After a reaction time of 4· min the
CODs of the resulting sludge and of the filtrate were deter-
mined. This was repeated for several initial CODs The re-
sults are shown in figure 5.8, where the ratio of the COD of
the filtrate {[cd]) to the COD of the resulting sludge {[ct])
are plotted against the initial COD. It can be seen from this
graph that the ratio is almost independent of the initial
sludge concentration at a value of about 0.6. Since
it can be concluded from these experiments too that ~ ~ 0.6.
Substitution of ~' ~t and ~d in equation {5.1) yields for
pH = 4.
72
k = 18 m3/kg h. -s
This shows that the hydrolised sludge is somewhat more reac
tive than solid sludge, but is not strongly deviating from it.
It can be concluded that to describe the total conversion rate
at least at pH = 4, and probably also at the other pH's it is
not necessary to take the hydrolysis into account as a sepa
rate reaction step.
73
Chapter 6 THE OXIDATION OF ACTIVATED SLUDGE
The experimental results of the oxidation of activated sludge (see e.g. figures 6.2 and 6.3) were analYsed with the conversion model presented in chapter 5. It was found that it was
not possible to describe the complete curves with one reaction rate constant. The oxidation of primary sludge, discussed in
chapter 5, suggested already that more than one reaction rate
constant is necessary for a fair description of the conversion. Therefore,the model was extended to the simultaneous oxidation of two groups of components which differ in reactivity.
6.1. EXTENSION OF THE MODEL
The total concentration [e] of the sludge is supposed to be
the sum of the concentrations [a], [b] and [c00], which are the
concentrations of a more reactive group, of a less reactive group, and of a non-reactive group,respectively.
74
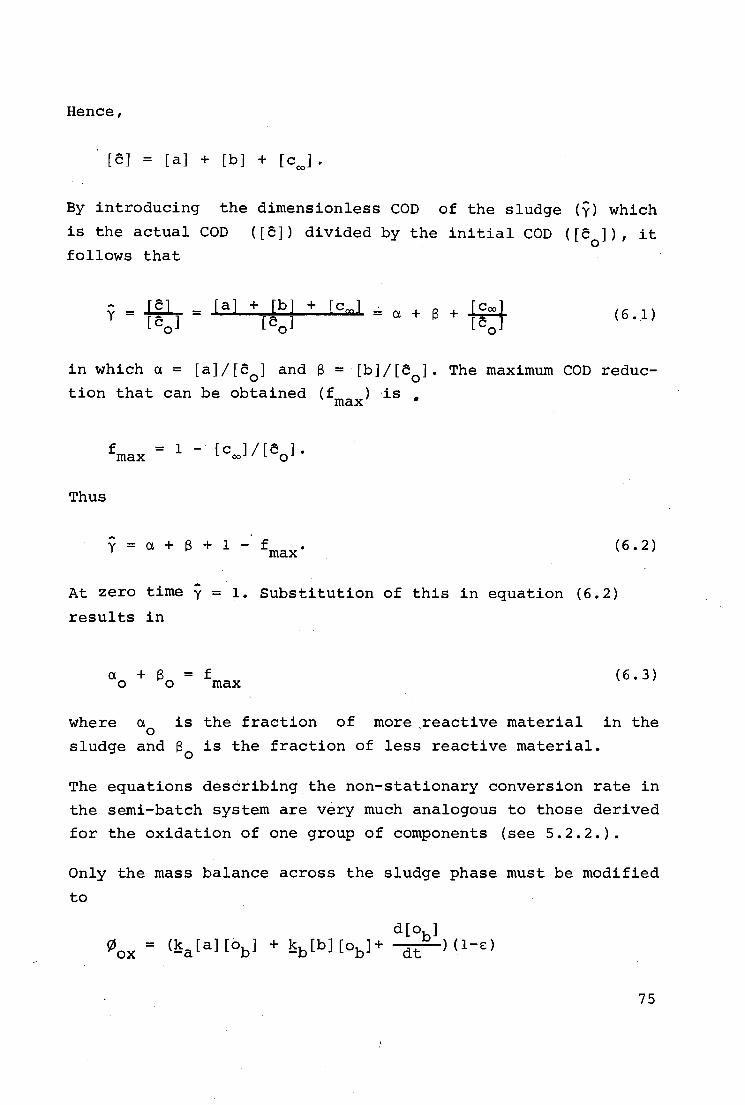
Hence,
[c] = [a] + [b] + [c ] • 00
By introducing the dimensionless COD of the sludge (y) which
is the actual COD ([c]) divided by the initial COD ([c ]) , it 0
follows that
( 6 • 1)
in which a = [a]/[c0
] and B = [b]/[c0]. The maximum COD reduc
tion that can be obtained (f ) is max •
Thus
-y = a + B + 1 - f max ( 6. 2)
-At zero time y = 1. Substitution of this in equation (6.2)
results in
a + B = f o o max
where a 0
is the fraction of more .reactive material
sludge and B0
is the fraction of less reactive material.
( 6 • 3)
in the
The equations describing the non-stationary conversion rate in
the semi-batch system are very much analogous to those derived
for the oxidation of one group of components (see 5.2.2.).
Only the mass balance across the sludge phase must be modified
to
75
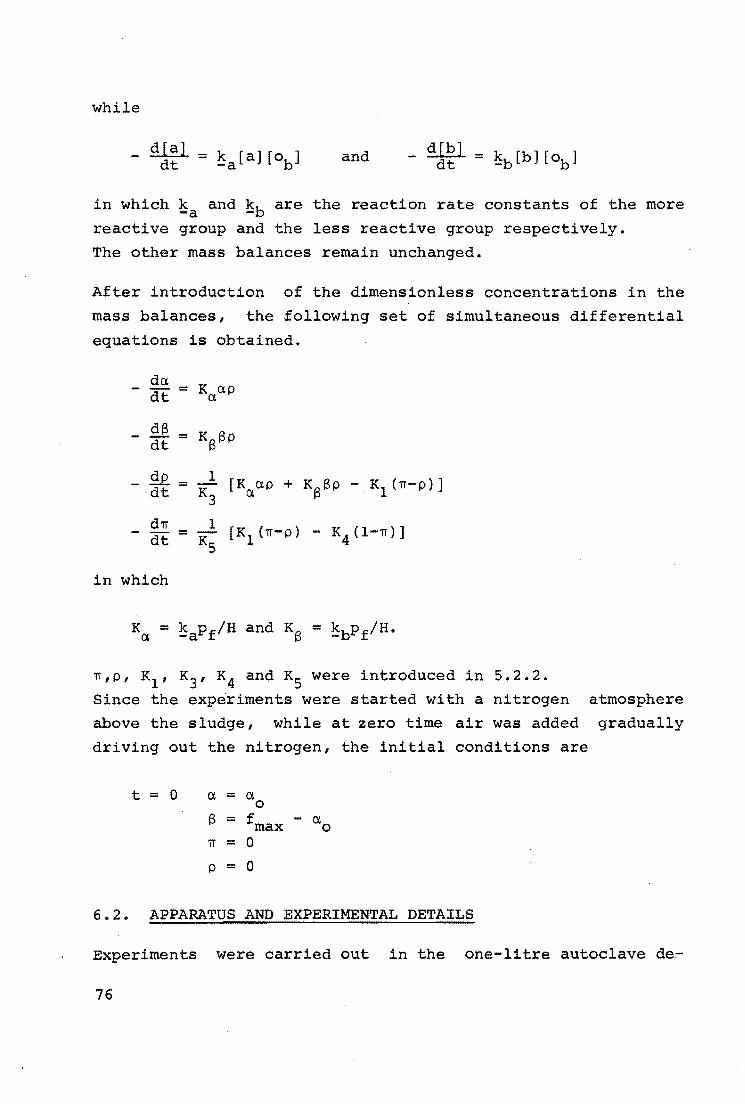
while
- ~ = k [a] [o ] dt -a b and
in which ~a and ~b are the reaction rate constants of the more reactive group and the less reactive group respectively.
The other mass balances remain unchanged.
After introduction of the dimensionless concentrations in the
mass balances, the following set of simultaneous differential
equations is obtained.
da. K a.p = dt (.l
- df3 = Kf3f3p dt
2:12. l (K(.la.p + Kf3f3p - Kl (TI-p)] = dt K3
dTI l (Kl (TI-p) -K(l-TI)] = dt KS 4
in which
TI,p, K1 , K3 , K4 and K5 were introduced in 5.2.2.
Since the experiments were started with a nitrogen
above the sludge, while at zero time air was added
driving out the nitrogen, the initial conditions are
t = 0 a. = a. 0
f3 = f max - a.o TI = 0
p = 0
6.2. APPARATUS AND EXPERIMENTAL DETAILS
atmosphere
gradually
Experiments were carried out in the one-litre autoclave de~
76
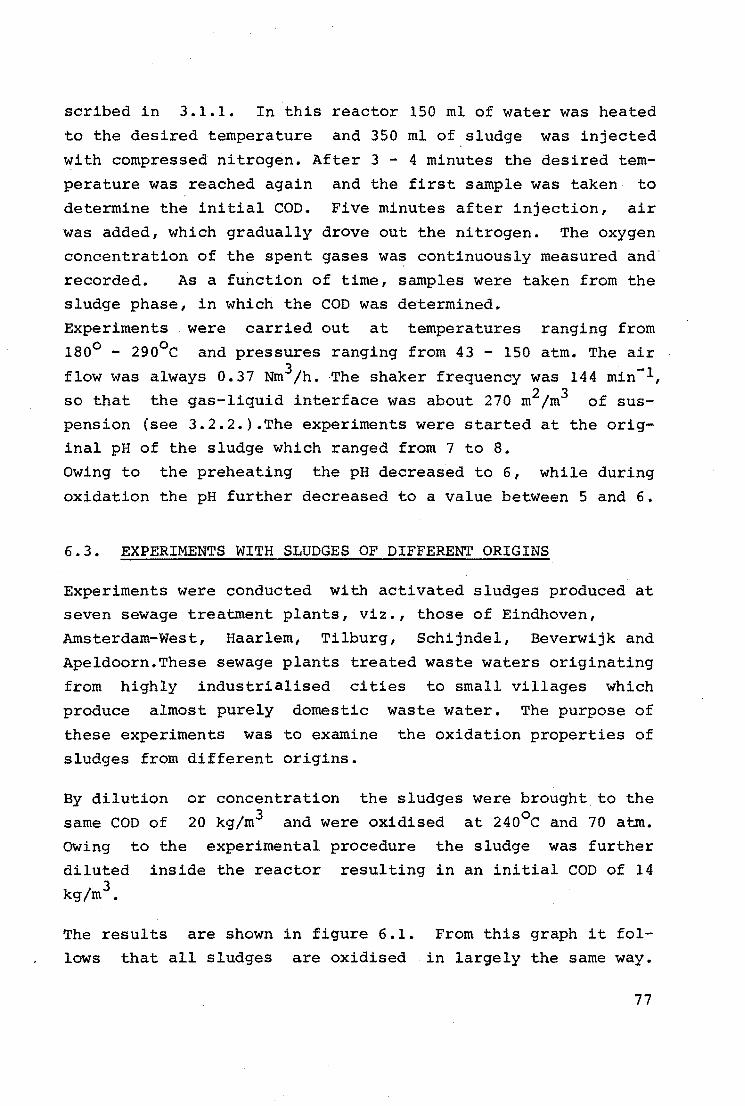
scribed in 3.1.1. In this reactor 150 ml of water was heated
to the desired temperature and 350 ml of sludge was injected
with compressed nitrogen. After 3 - 4 minutes the desired tern-
perature was reached again
determine the initial COD.
was added, which gradually
and the first sample was taken to
Five minutes after injection, air
drove out the nitrogen. The oxygen concentration of the spent gases was continuously measured and·
recorded. As a function of time, samples were taken from the sludge phase, in which the COD was determined.
Experiments were carried out at temperatures ranging from
180° - 290°c and pressures ranging from 43 - 150 atm. The air
flow was always 0 . 3 7 Nm 3 /h. ·The shaker frequency was 14 4 min -1,
so that the gas-liquid interface was about 270 m2/m3 of suspension {see 3.2.2.).The experiments were started at the original pH of the sludge which ranged from 7 to 8.
Owing to the preheating the pH decreased to 6, while during
oxidation the pH further decreased to a value between 5 and 6.
6.3. EXPERIMENTS WITH SLUDGES OF DIFFERENT ORIGINS
Experiments were conducted with activated sludges produced at seven sewage treatment plants, viz., those of Eindhoven,
Amsterdam-West, Haarlem, Tilburg, Schijndel, Beverwijk and
Apeldoorn.These sewage plants treated waste waters originating
from highly industrialised cities to small villages which produce almost purely domestic waste water. The purpose of
these experiments was to examine the oxidation properties of
sludges from different origins.
By dilution
same COD of
or concentration the sludges were brought to the
20 kg/m3 and were oxidised at 240°c and 70 atm. owing to the experimental procedure the sludge was further
diluted inside the reactor resulting in an initial COD of 14
kg/m3 •
The results are shown in figure 6.1. From this graph it follows that all sludges are oxidised in largely the same way.
77
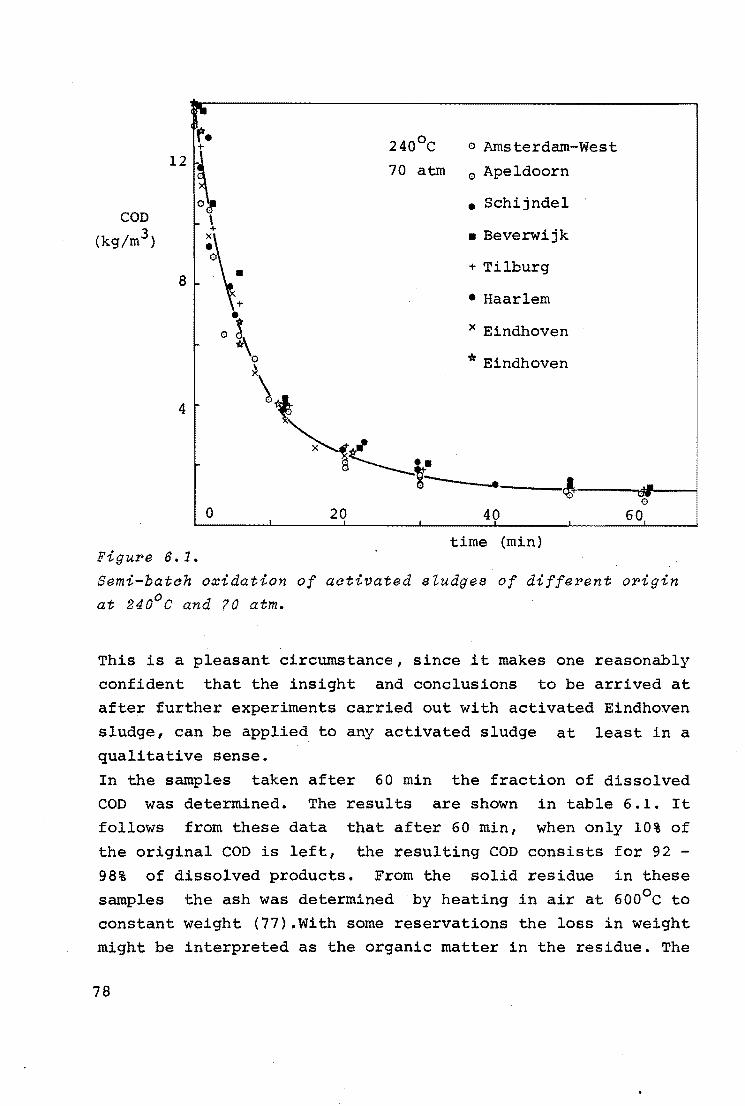
d'11
240°c o Amsterdam-West
70 atm 0 Apeldoorn
COD
(kg/m3 )
4
Figure 6. 1.
0 ' I
• Schijndel
• Beverwijk
+ Tilburg
• Haarlem
x Eindhoven
* Eindhoven
40
time (min}
Semi-batch o~idation of activated sludges of different origin at 240°c and 70 atm.
This is a pleasant circumstance, since .it makes one reasonably
confident that the insight and conclusions to be arrived at
after further experiments carried out with activated Eindhoven
sludge, can be applied to any activated sludge at least in a
qualitative sense.
In the samples taken after 60 min
COD was determined. The results
the fraction of dissolved
are shown in table 6.1. It
follows from these data that after 60 min, when only 10% of
the original COD is left, the resulting COD consists for 92 -
98% of dissolved products. From the solid residue in these
samples the ash was determined by heating in air at 600°c to
constant weight (77).With some reservations the loss in weight
might be interpreted as the organic matter in the residue. The
78
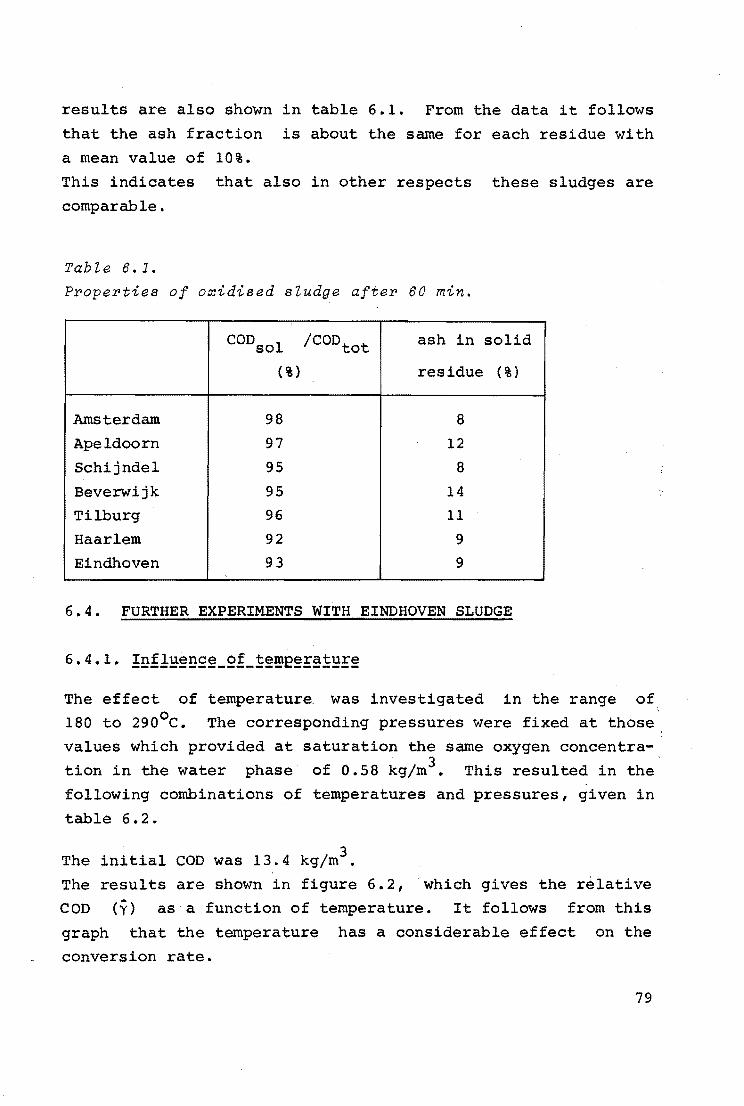
results are also shown in table 6.1. From the data it follows
that the ash fraction is about the same for each residue with
a mean value of 10%.
This indicates that also in other respects these sludges are
comparable.
TabZe 6.1.
Properties of oxidised sZudge after 60 min.
COD sol /COD tot ash in solid
(%) residue (%)
Amsterdam 98 8
Apeldoorn 97 12
Schijndel 95 8
Beverwijk 95 14
Tilburg 96 11
Haarlem 92 9
Eindhoven 93 9
6.4. FURTHER EXPERIMENTS WITH EINDHOVEN SLUDGE
The effect of temperature was investigated in the range of 180 to 290°c. The corresponding pressures were fixed at those
values which provided at saturation the same oxygen concentra
tion in the water phase of 0.58 kg/m3• This resulted in the following combinations of temperatures and pressures, given in
table 6.2.
initial COD was 13.4 kg/m3 . The
The COD
results are shown in figure 6.2, which gives the relative (y) as a function of temperature. It follows from this
graph that the temperature has a considerable effect on the
conversion rate.
79
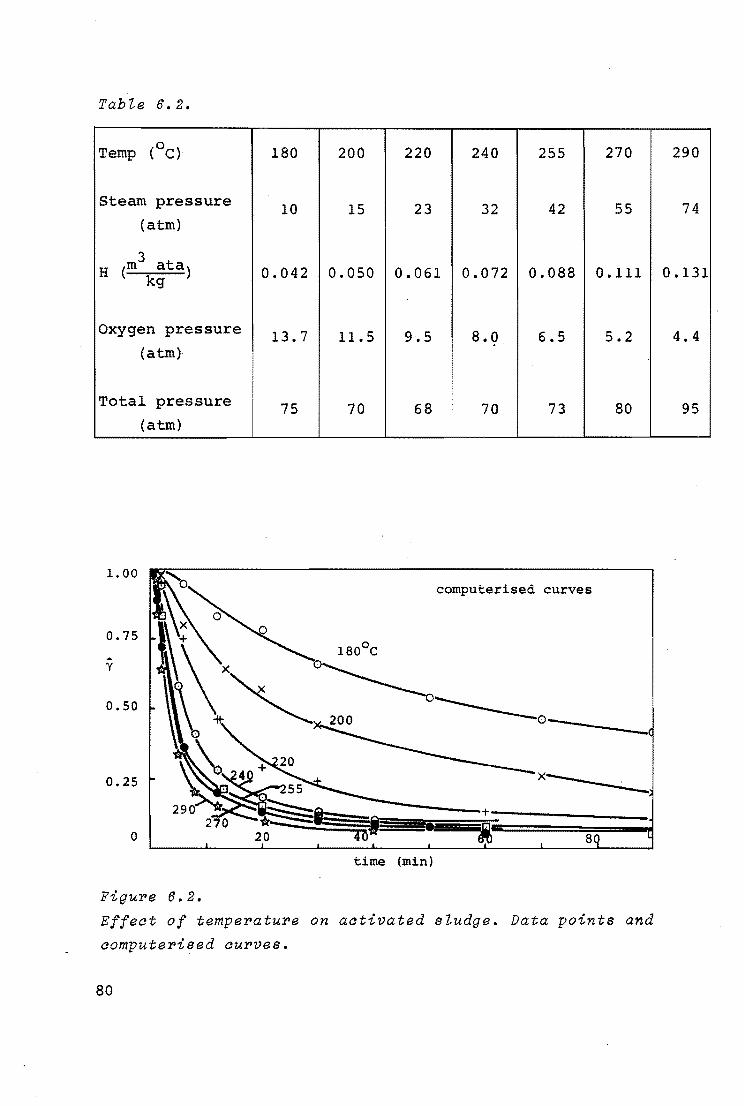
Tab Ze 6. 2.
Temp (oC) 180 200 220 240 255 270
Steam pressure 10 15 23 32 42 55
(atm)
3 H (m ata) 0.042 0.050 0.061 0.072 0.088 0.111 kg
Oxygen pressure 13.7 11.5 9.5 8.0 6.5 5.2 (atm)
Total pressure 75 70 68 70 73 80 (atm)
•
1.00 computerised curves
o.75
y
0.50
0.25
0 40 • i 8
time (min)
Figure 6.2.
Effect of temperature on activated sZudge. Data points and
computerised curves.
80
290
74
0.131
4.4
95
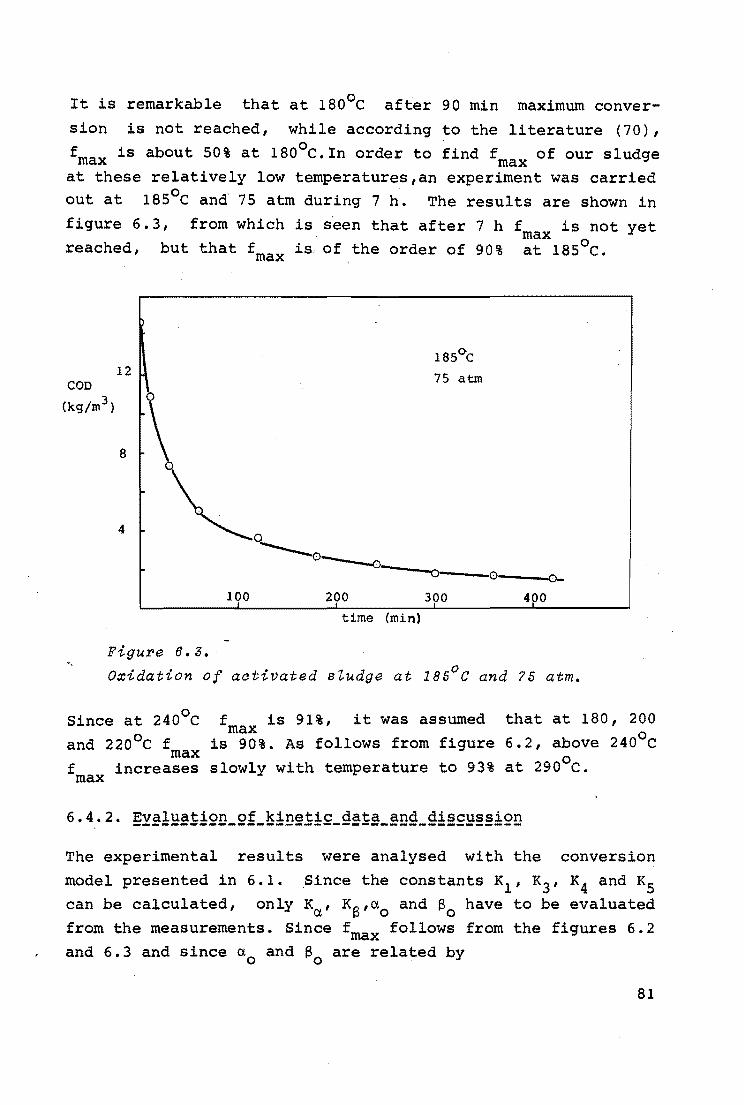
It is remarkable that at 180°c after 90 min maximum conver
sion is not reached, while according to the literature (70),
fma is about 50% at 180°c.In order to find f of our sludge x max at these relatively low temperatures,an experiment was carried out at 185°c and 75 atm during 7 h. The results are shown in
figure 6.3, from which is seen that after 7 h fmax is not yet
reached, but that fmax is of the order of 90% at iss0 c.
COD
(kg/m3 )
12
8
4
Figure 6. 3.
100
185°C
75 atm
-o'---o'---0-200 300 400
time (min)
Oxidation of aativated sZudge at 185°c and ?5 atm.
Since at 240°c f is 91%, it was assumed max and 220°c fmax is 90%. As follows from figure
fmax increases slowly with temperature to 93%
that at 180, 200
6.2, above 240°c
at 290°c.
6.4.2. Evaluation of kinetic data and discussion -----------------------------------------The experimental results were analysed with the conversion
model presented in 6 .1. .Since the constants K1 , K3 , K4 and K5 can be calculated, only Ka' K8 ,a
0 and 8
0 have to be evaluated
from the measurements. Since fmax follows from the figures 6.2 and 6.3 and since a
0 and 8
0 are related by
81
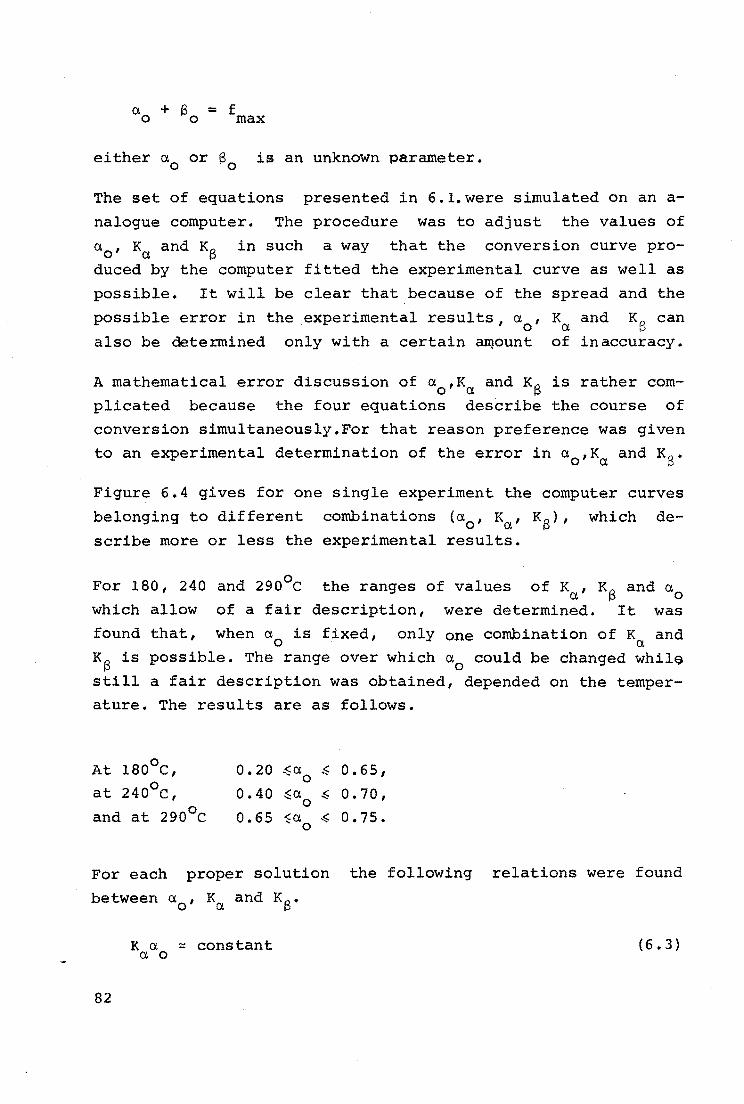
a + B = f o o max
either a0
or B0
is an unknown parameter.
The set of equations presented in 6.1.were simulated on an a
nalogue computer. The procedure was to adjust the values of
a0
, Ka and KS in such a way that the conversion curve pro
duced by the computer fitted the experimental curve as well as
possible. It will be clear that because of the spread and the
possible error in the experimental results, a , K and KB can o a also be determined only with a certain an)Ount of inaccuracy.
A mathematical error discussion of a0
,Ka and KB is rather com
plicated because the four equations describe the course of
conversion simultaneously.For that reason preference was given
to an experimental determination of the error in a0
,Ka and KB.
Figure 6.4 gives for one single experiment the computer curves
belonging to different combinations (a0
, Ka, KS), which de
scribe more or less the experimental results.
For 180, 240 and 290°c the ranges of values of Ka, KB and a0
which allow of a fair description, were determined. It was
found that, when a0
is fixed, only one combination of Ka and
KS is possible. The range over which a0
could be changed while
still a fair description was obtained, depended on the temper
ature. The results are as follows.
At 180°c, 0.20 ~a ~ 0.65, at 240°c,
0 0.40 ~a ~ 0.70,
290°c 0
and at 0.65 ~a ~ 0.75. 0
For each proper solution the following relations were found
between a , K and K0 • o a µ
82
R a ~ constant a o
(6.3)
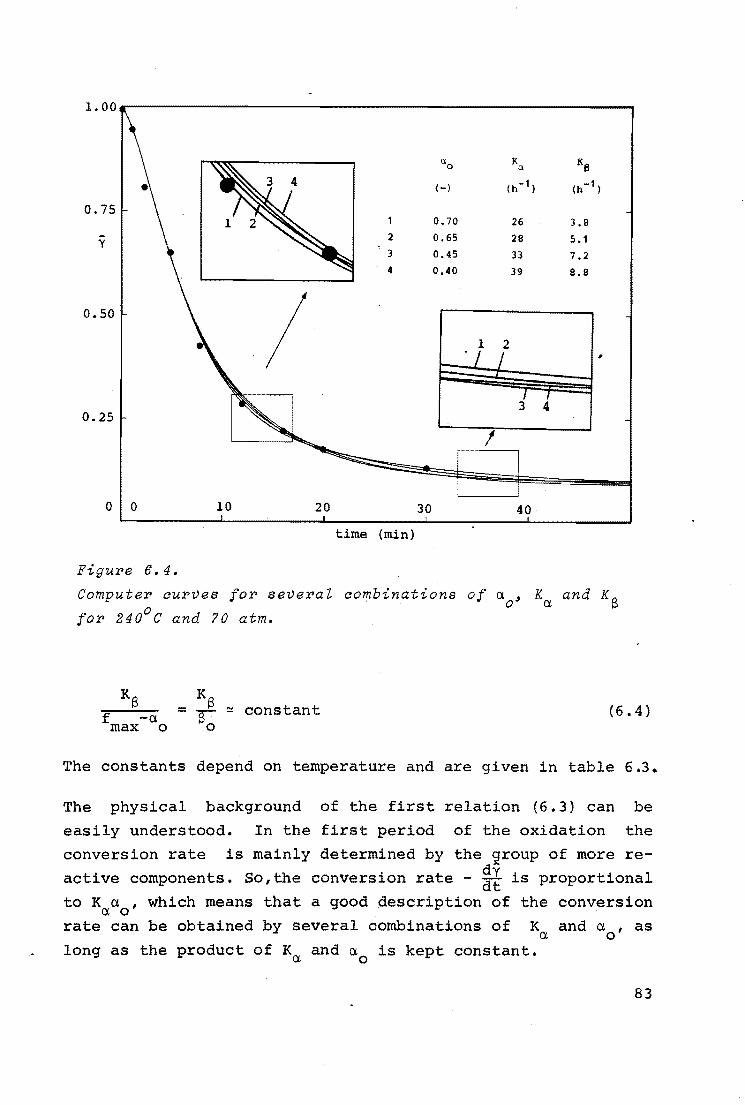
CXO K Ka ex
(-) (h-1) (h-1)
0.75 0.70 26 3,8 . 2 0.65 28 5.1 y
3 0.45 33 7,2 4 0,40 39 8.8
1 2
- . I I - . I I
3 4
0 0 10 20 30 40
time (min)
Figure 6.4.
Computer aurves for severai aombinations of a , K and K0 o a µ
for 240°C and 70 atm.
constant (6. 4)
The constants depend on temperature and are given in table 6.3.
The physical background of the first relation (6.3) can be
easily understood. In the first period of the oxidation the
conversion rate is mainly determined by the group of more re-d-
active components. So,the conversion rate - d~ is proportional
to K a , which means that a good description of the conversion a o
rate can be obtained by several combinations of K and a , as a o
long as the product of Ka and a0
is kept constant.
83
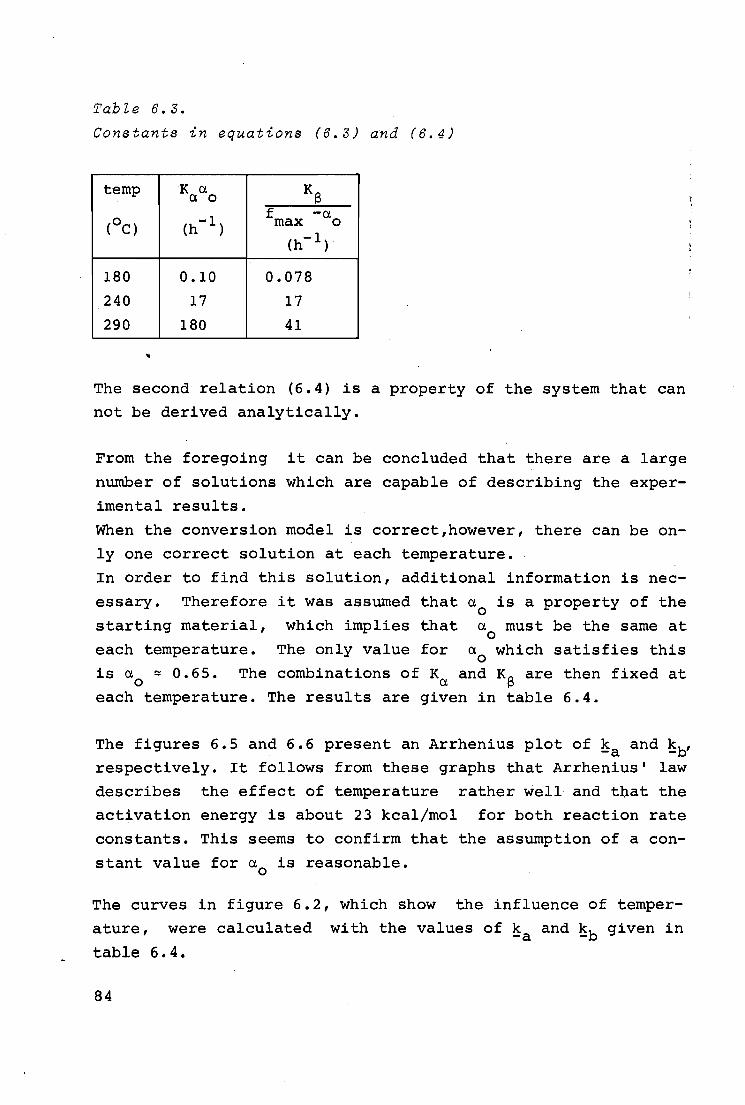
Table 6.3.
Constants in equations (6.3) and (6.4)
temp Ka Cl. 0 KS
(OC) (h -1) f max -a 0
(h-1)
180 0.10 0.078
240 17 17
290 180 41
..
The second relation (6.4) is a property of the system that can
not be derived analytically.
From the foregoing it can be concluded that there are a large
number of solutions which are capable of describing the exper
imental results.
When the conversion model is correct,however, there can be on
ly one correct solution at each temperature.
In order to find this solution, additional information is nec
essary. Therefore it was assumed that a is a property of the 0
starting material, which implies that a must be the same at 0
each temperature. The only value for a0
which satisfies this
is a0
~ 0.65. The combinations of Ka and KS are then fixed at
each temperature. The results are given in table 6.4.
The figures 6.5 and 6.6 present an Arrhenius plot of ~a and ~b'
respectively. It follows from these graphs that Arrhenius' law
describes the effect of temperature rather well and that the
activation energy is about 23 kcal/mol for both reaction rate
constants. This seems to confirm that the assumption of a con
stant value for a0
is reasonable.
The curves in figure 6.2, which show the influence of temper
ature, were calculated with the values of ~a and ~b given in
table 6.4.
84
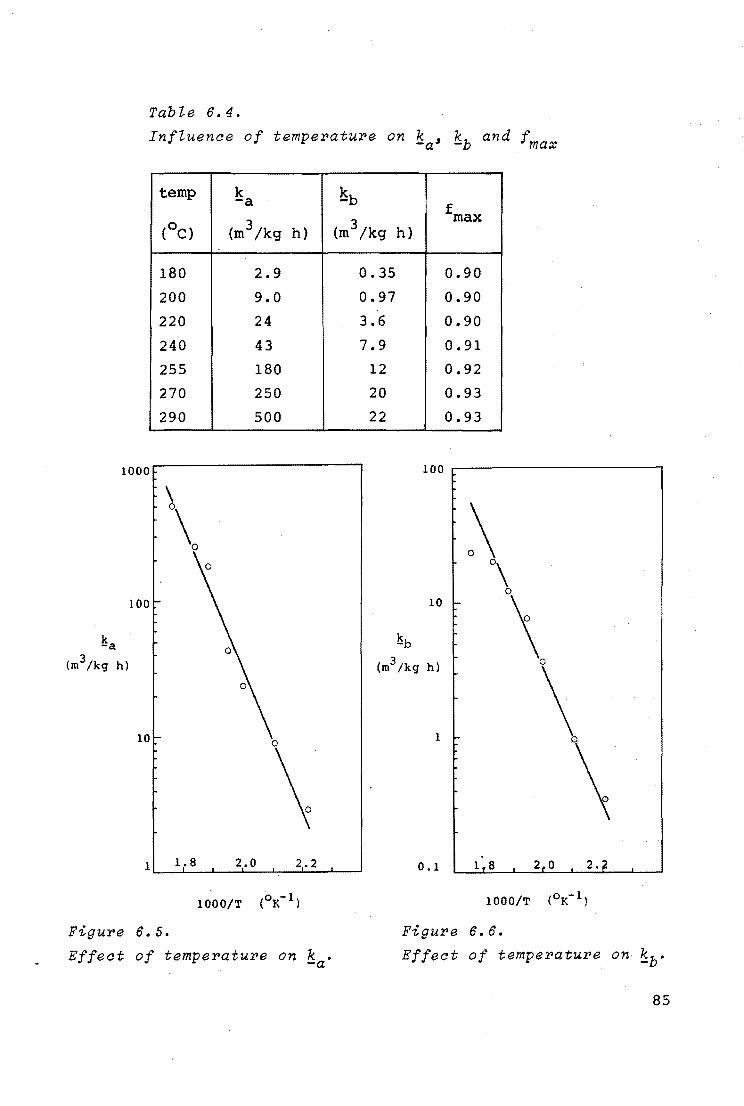
Table 6.4.
Influence of temperature on k • kb and f -a- - ma:r:
temp k ~b -a f max
(oC) (m3 /kg h) (m3 /kg h)
180 2.9 0.35 0.90
200 9.0 0.97 0.90
220 24 3.6 0.90
240 43 7.9 0.91
255 180 12 0.92
270 250 20 0.93
290 500 22 0.93
1000 100
\
\ \ 0
0\
0 100 10
\ ~a ~b
(rn3 /kg h) (rn
3 /kg h) 0
\ 10 0 1
\ \ 1 1.8 2.0 2.2 0.1 1 8 2 0 2.
1000/T (oK-1) 1000/T (oK-1)
Figure 6. 5. Figure 6. 6.
Effect of temperature on k . -a Effect of temperature on ~b·
85
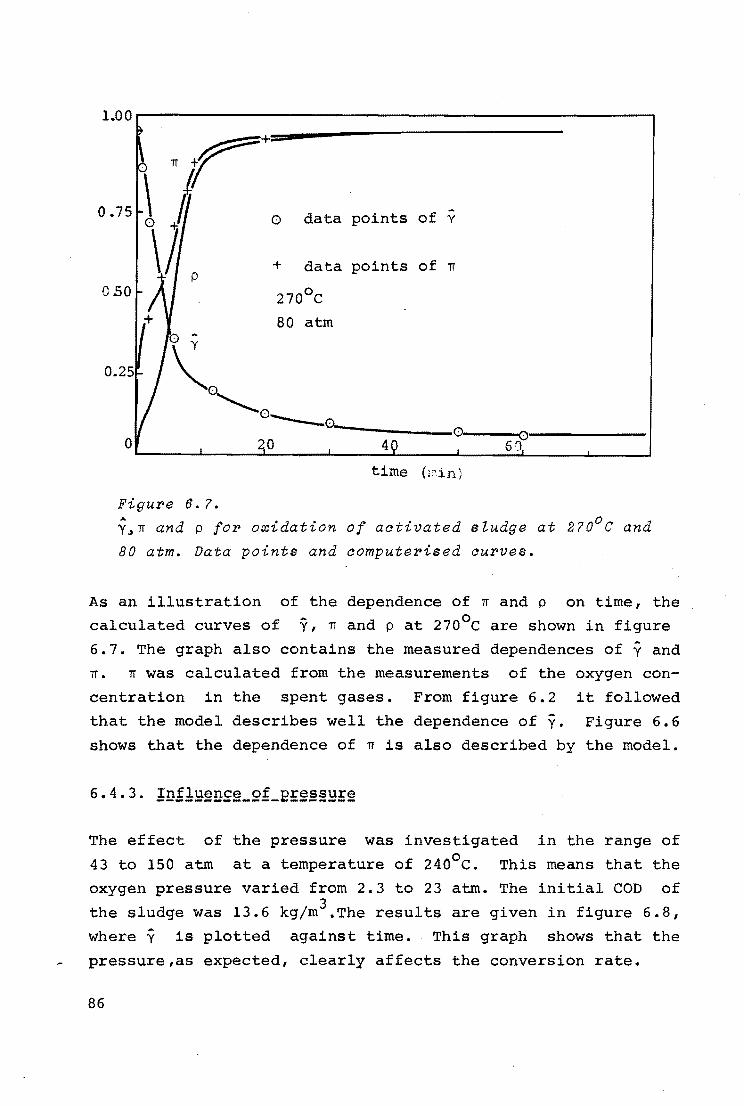
1.00
·r+ 0 .75 \ t points of -
o\li 0 data y
+ data points of TI p
0 50 270°c
80 atm
0.25 \ 0
"' 0----0 0 0 0 0 4 6CI
time {I:>in}
Figure 6. ? •
y,TI and p for oxidation of aativated sludge at 2?0°c and
BO atm. Data points and aomputerised aurves.
As an illustration of the dependence of TI and p on time, the - 0 calculated curves of y, TI and p at 270 c are shown in figure
6.7. The graph also contains the measured dependences of y and
TI. TI was calculated from the measurements of the oxygen con
centration in the spent gases. From figure 6.2 it followed
that the model describes well the dependence of y. Figure 6.6
shows that the dependence of TI is also described by the model.
The effect of the pressure was investigated in the range of
43 to 150 atm at a temperature of 240°c. This means that the
oxygen pressure varied from 2.3 to 23 atm. The initial COD of
the sludge was 13.6 kg/m3 .The results are given in figure 6.8,
where y is plotted against time. This graph shows that the
pressure,as expected, clearly affects the conversion rate.
86
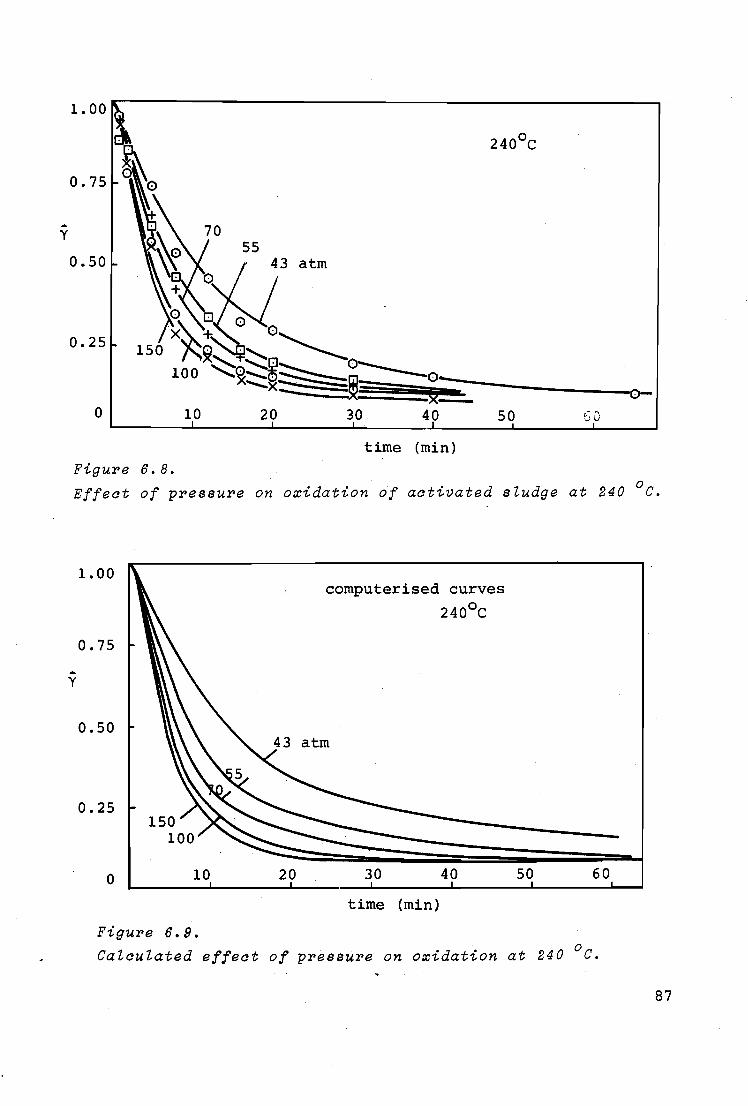
-y
1. 00
0.7S
a.so
0.2S
0 10 20
Figure 6. 8.
Eff eat of pressure on
1.00
0.7S
-y
a.so
0.2S
0 10
Figure 6.9.
240°c
30 40 so time (min)
oxidation of aativated sludge
20
computerised curves
240°c
30 40
time (min)
so
60
at 240
60
Calaulated effeat of pressure on oxidation at 240 °c.
o-
0 c.
87
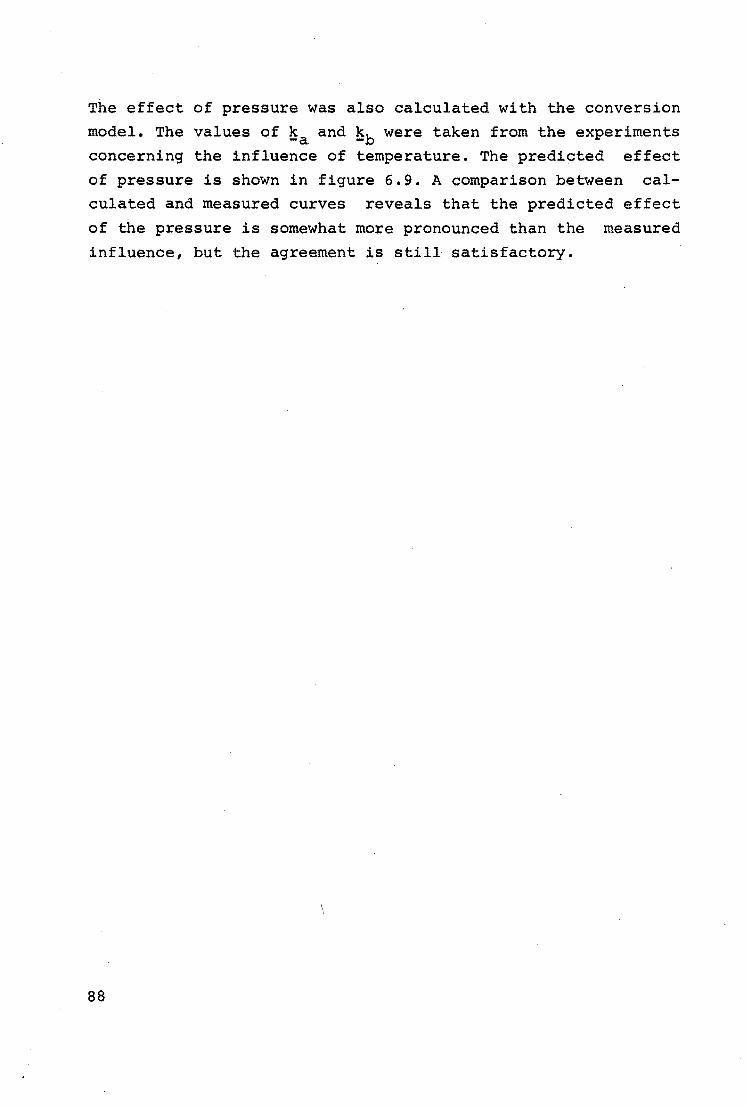
The effect of pressure was also calculated with the conversion
model. The values of lsa and lsb were taken from the experiments concerning the influence of temperature. The predicted effect
of pressure is shown in figure 6.9. A comparison between calculated and measured curves reveals that the predicted effect
of the pressure is somewhat more pronounced than the measured
influence, but the agreement is still satisfactory.
88
9 •
J) '7
e 8 .. 10 ~
Chapter 7 GENERAL DISCUSSION AND CONCLUSIONS
7.1. COMPARISON BETWEEN MODEL SLUDGE AND OTHER SLUDGES
As regards to the oxidation of glucose it was found that the·
results obtained were in fair agreement with the assumption
that the chemical reaction orders of glucose oxidation were
zero for oxygen and one for glucose.
In the case of oxidation of primary sludge it was found that
at oxygen partial pressures as applied in practice the chemi-~
cal reaction orders of the oxidation were equal to one for:·
both oxygen and organic matter.
Only at higher partial pressures of oxygen the chemical re
action order for oxygen decreased to zero.
89
No special research was devoted to the reaction orders of ac
tivated sludge. It was asswned that the orders were the same
as those of primary sludge. From an investigation of the in-·
fluence of the total pressure it was shown that this was a
good asswnption. The experimental results could be well de
scribed with a mathematical model, starting from the above.
mentioned orders (see 6. S.) •
Under the same reaction conditions the model sludge of glucose
had a very high conversion rate, while the conversion rates of
activated and primary sludges were practically the same but
much lower.
A comparison of the physical absorption rate with the chemical
absorption rate of oxygen showed that the oxidation of glucose
was so fast that it took place inside the diffusion layer a
round the air bubbles (see 3. 3. 1.) • As a consequence of this
diffusion limitation the partial chemical reaction orders of
zero in oxygen
into partial
oxidation of
and of one in organic material both converted
conversion orders of one half (see 3.3.3.). The
activated
slowly and conversion
and primary sludges proceeded more
took mainly place in the bulk of the
suspension.
The degree of diffusion limitation of oxygen or the extent to
which the conversion rate was reduced by oxygen transfer, de
pended on temperature. At 180°c mass transfer limitation could
be neglected, while at 290°c the conversion rate was largely .
determined by the rate of mass transfer.
From the experimental results the reaction rate constants were
calculated. The rate constants for the oxidation of glucose ·
are presented in table 7.1.
90
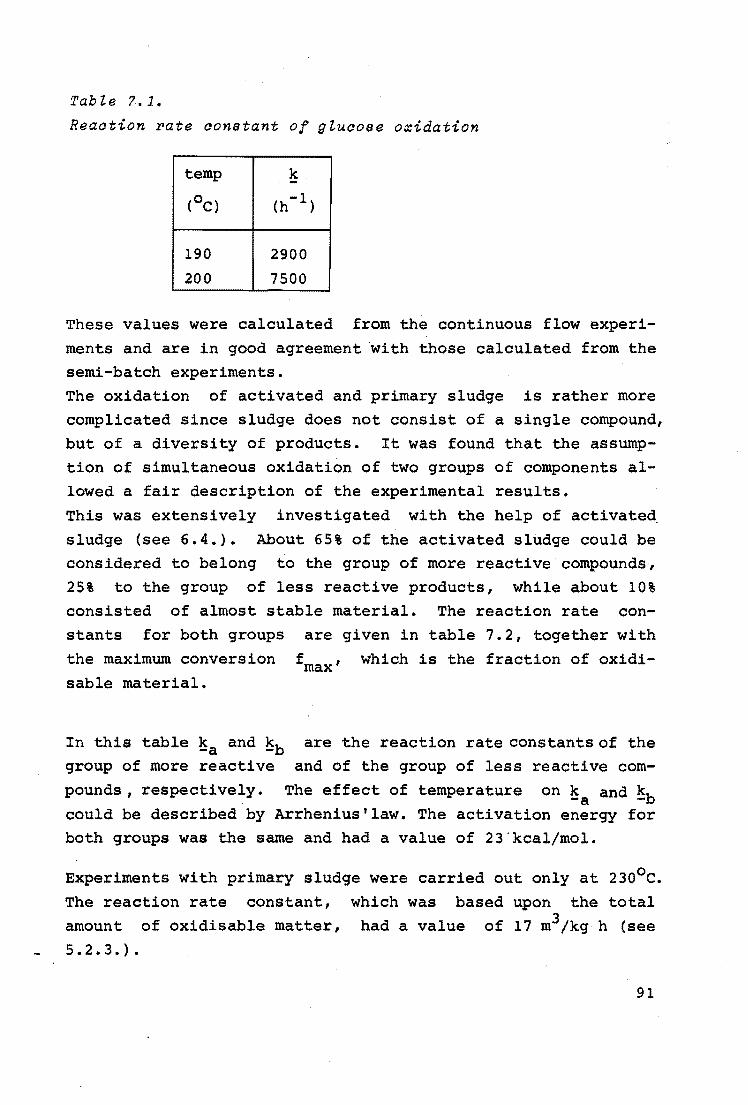
Tab"le ( .. 1.
Reaation rate aonstant of g"luaose oxidation
temp k
(OC) (h-1)
190 2900
200 7500
These values were calculated from the continuous flow experi
ments and are in good agreement ·with those calculated from the
semi-batch experiments. The oxidation of activated and primary sludge is rather more complicated since sludge does not consist of a single compound,
but of a diversity of products. It was found that the assump
tion of simultaneous oxidation of two groups of components al
lowed a fair description of the experimental results.
This was extensively investigated with the help of activated.
sludge (see 6.4.). About 65% of the activated sludge could be
considered to belong to the group of more reactive compounds·, 25% to the group of less reactive products, while about 10%
consisted of almost stable material. The reaction rate con
stants for both groups are given in table 7.2, together with
the maximum conversion fmax' which is the fraction of oxidisable material.
In this table Isa and !sb are the reaction rate constants of the group of more reactive and of the group of less reactive com
pounds, respectively. The effect of temperature on ~a and ~b could be described by Arrhenius'law. The activation energy for both groups was the same and had a value of 23'kcal/mol.
Experiments with primary sludge were carried out only at 230°c.
The reaction rate constant, which was based upon the total
amount of oxidisable matter, had a value of 17 m3/kg h (see
5.2.3.).
91
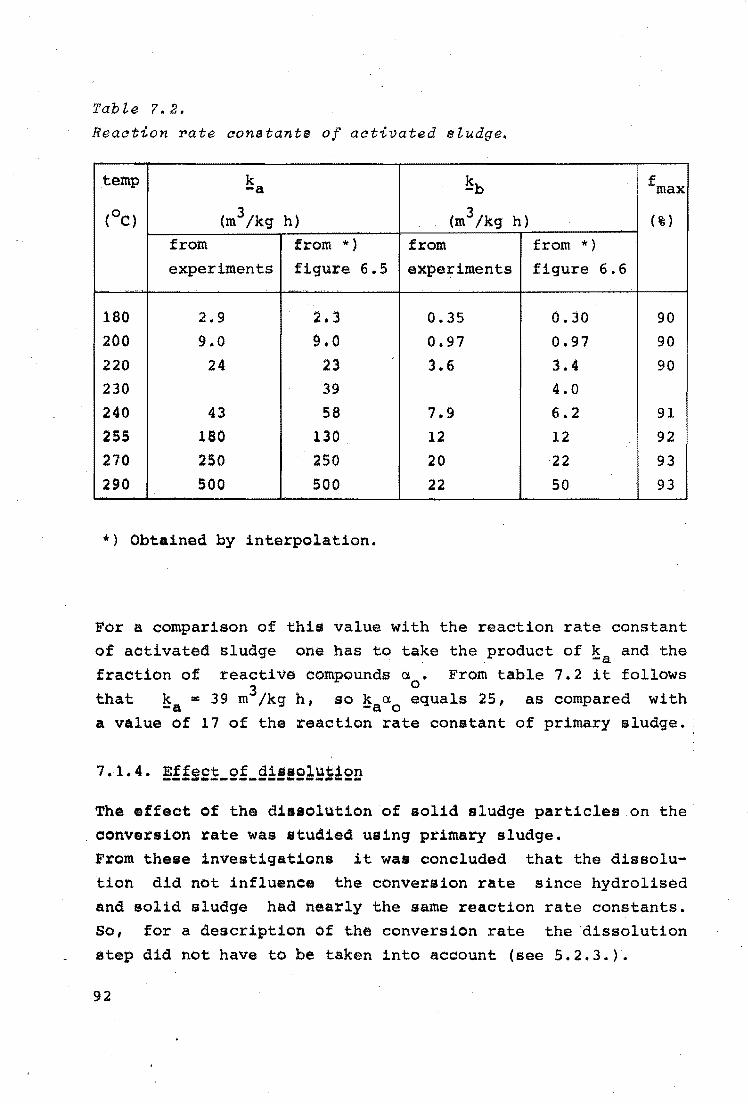
Tab Le ?. 2.
Reaation rate aonatante of aativated eiudge.
temp k ~b f max -a
{oC) {m3 /kg h) {m3/kg h) {%)
from from *) from from *)
experiments figure 6.5 experiments figure 6.6 . -·
180 2.9 2.3 0.35 0.30 90
200 9.0 9.0 0.97 0.97 90
220 24 23 3.6 3.4 90
230 39 4.0
240 43 58 7.9 6.2 91
255 180 130 12 12 92
270 250 250 20 22 93
290 500 500 22 50 93
*) Obtained by interpolation.
For a comparison of this value with the reaction rate constant
of activated sludge one has to take the product of ~a and the fraction of reactive compounds a • From table 7.2 it follows
3 0 that ~a = 39 m /kg h, so ~aao equals 25, as compared with a value of 17 of the reaction rate constant of primary sludge.
7 .,1. 4. Effect of dis111olution -------------~----~--
The effect of the dissolution of solid sludge particles on the conversion rate was studied using primary sludge.
From these investigations it was concluded that the dissolu
tion did not influence the conversion rate since hydrolised
and solid sludge had nearly the same reaction rate constants.
So, for a description of the conversion rate the dissolution
step did not have to be taken into account {see 5.2.3.).
92
Experiments with a diversity of activated sludges showed that
the sludge produced at the sewage treatment plant of Eindhoven
which was used in most of the experiments, had almost the same
oxidation properties as the other sludges. Although this does.
not necessarily mean that ~a' ~band a0
always have the same.
values, it does mean that the conception of the two groups of
different reactivity can be applied also to other sludges than
that of Eindhoven.
7.2. ANOMALOUS PHENOMENA
Although the study of sludges of different origins showed that
activated sludges generally have the same oxidation proper-
ties, the activated (and also the
Eindhoven in the autwnn of 1969
it was before or afterwards. The
• primary) sludge produced at.
was much more reactive than
conversion rate in the· semi-
that the reaction took place mainly t'
batch reactor was so high
within the diffusion layer 0 ,.
around the gas bubbles. At 235 C
the initial conversion rate could be described with a reaction
rate constant of the order of 30,000 m3/kg h.
Since both activated and primary sludges had these high reac
tion rate constants, it was assumed that they resulted from an
activator in the waste water of Eindhoven. It might be that
this activator had been discharged for some time by one of the
many galvanic industries of Eindhoven.
Analysis of the waste water of Eindhoven revealed that the
concentrations of copper, chromium, zinc, lead, nickel and
cadmium during this period were the. same as before and after
this period (126). So the activator could not be one of these
elements. From experiments with cobalt we found that it could
not be this element either.
This sludge had some more anomalous properties. One of these
was that when applying a large gas-liquid interfacial area,
resulting in a high c.onversion rate, fmax was 15-20% lower
93
than for a small interfacial area (low conversion rate) (121,
124) •
Another anomalous phenomenon was that when this sludge was ox
idised in a continuously operated stirred tank reactor (=CSTR),
the high conversion rate was not observed while the reaction
rate constant was of the order of magnitude of "normal" sludge
(121, 123). Semi-batch experiments with mixtures of fresh
sludge and sludge oxidised in the CSTR did not show the high
conversion rate either. From this it was concluded that in the
CSTR compounds were generated which counteract the effect of
the activator (inhibition).
Semi-batch experiments were also carried out with mixtures of
fresh sludge and sludge oxidised in the semi-batch reactor
during several reaction times. Again, the high conversion rate
was observed. From this it might be concluded that the genera
tion of the inhibitor was caused by the mixing, owing to which
all reaction products are present at the same time and place,
which was not the case in the semi-batch reactor. The genera
tion of the inhibitor might proceed through a combination of
products which were not present at the same time in the semi
batch reactor.
Although these phenomena are not yet understood,it may be con
cluded that compounds exist which accelerate the conversion
rate considerably. When these compounds are present, the con
tinuous oxidation should be carried out in a reactor with on
ly a small spread in residence time (nearly plugf low) , since
mixing provides conditions in which products are generated
counteracting the effect of the activator.
7.3. CALCULATION OF THE SIZE OF COMMERCIAL REACTORS
In this section the size of a reactor for wet-air oxidation
is calculated, based upon the results of our research. It was
assumed that a reduction of the effective COD of 90% had to be
obtained. Since the maximum conversion is about 90%,the reduc
tion of the total COD should be 81%.
94
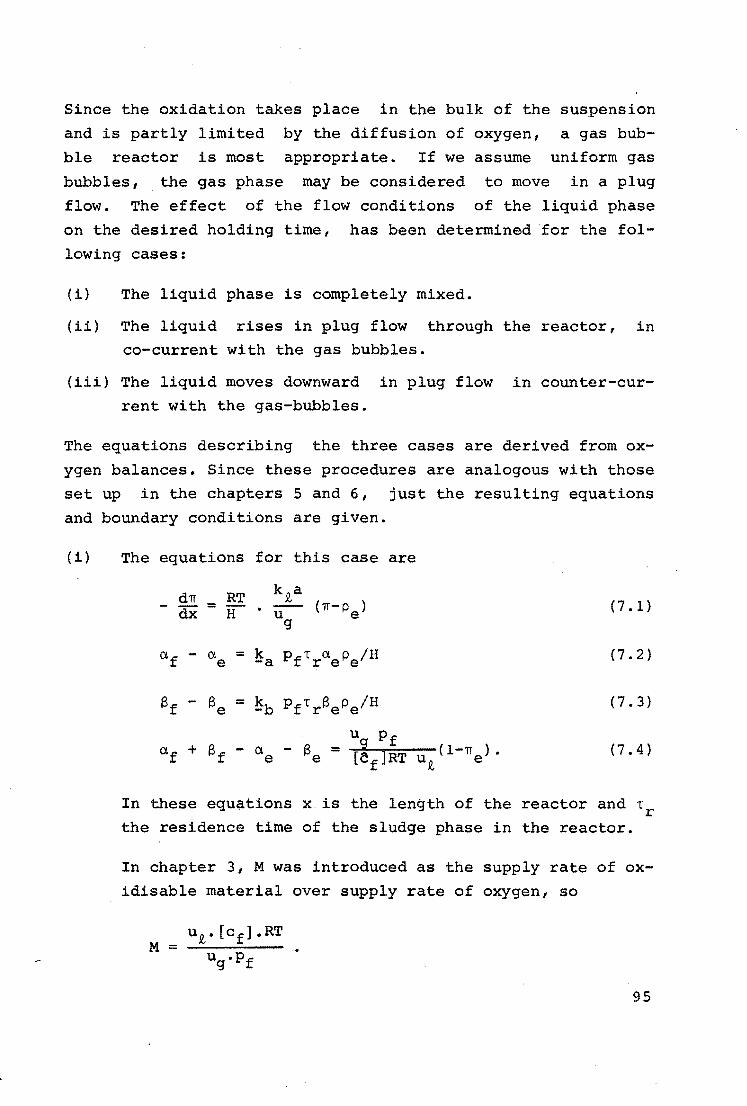
Since the oxidation takes place in the bulk of the suspension
and is partly limited by the diffusion of oxygen, a gas bub
ble reactor is most appropriate. If we assume uniform gas
bubbles, the gas phase may be considered to move in a plug
flow. The effect of the flow conditions of the liquid phase
on the desired holding time, has been determined for the fol
lowing cases:
(i) The liquid phase is completely mixed.
(ii) The liquid rises in plug flow through the reactor, in
co-current with the gas bubbles.
(iii) The liquid moves downward in plug flow in counter-cur
rent with the gas-bubbles.
The equations describing the three cases are derived from ox
ygen balances. Since these procedures are analogous with those
set up in the chapters 5 and 6, just the resulting equations
and boundary conditions are given.
(i} The equations for this case are
d1T RT kQ,a ( 1T- p ) - dx =
H u e (7. 1} g
a. - a. = k Pf T a. p /H f e -a re e (7. 2)
13 - Be = ~b PfTr13ePe/H f ( 7. 3)
a.f + 13 - a. - 13 = uS Pf
u (l-1T ). f e e [cf ]RT Q, e ( 7. 4)
In these equations x is the length of the reactor and Tr
the residence time of the sludge phase in the reactor.
In chapter 3, M was introduced as the supply rate of ox
idisable material over supply rate of oxygen, so
M =
95
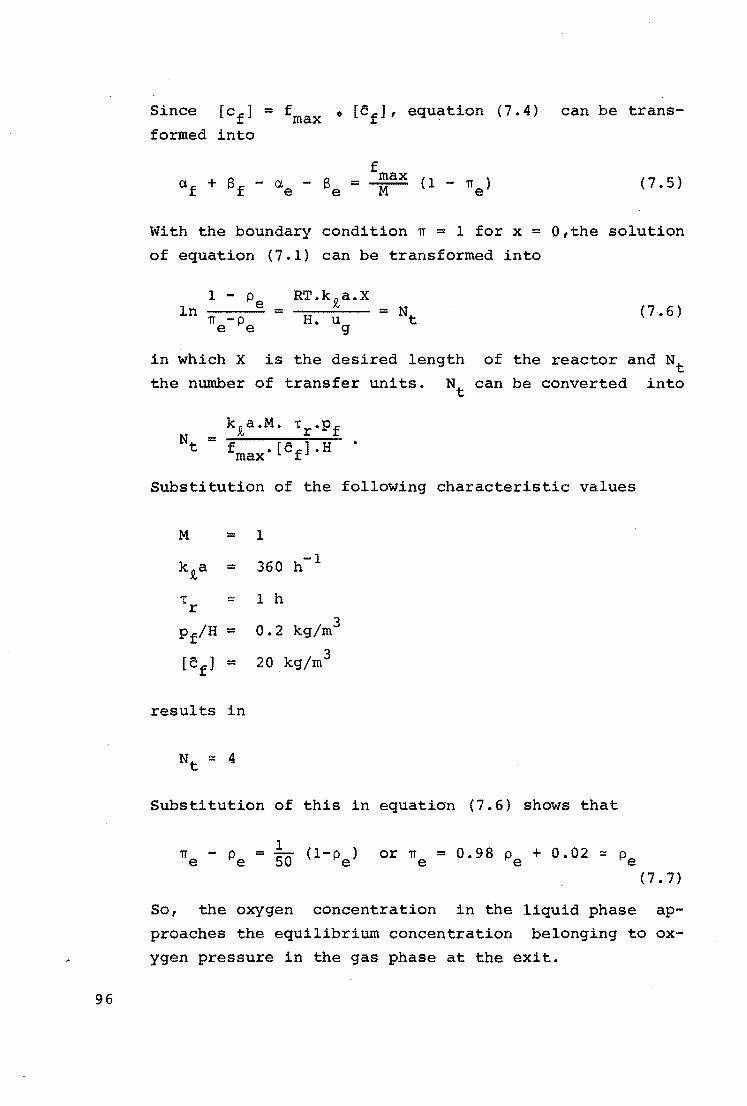
96
Since [cf]= fmax o [cf], equation (7.4) can be trans
formed into
f a + S - a - S = max (1 - TI )
f f e e zr- e (7.5)
With the boundary condition TI = l for x = 0,the solution
of equation (7.1) can be transformed into
l - p ln e =
TI -p e e (7.6)
in which X is the desired length of the reactor and Nt
the number of transfer units. Nt can be converted into
Substitution of the following characteristic values
M =
kta =
T = r
Pf/H =
Cc l = f
results in
N = 4 t
l
360 h -1
l h
0.2 kg/m3
20 kg/m3
Substitution of this in equation (7.6) shows that
So, the oxygen concentration in the liquid phase ap
proaches the equilibrium concentration belonging to ox
ygen pressure in the gas phase at the exit.
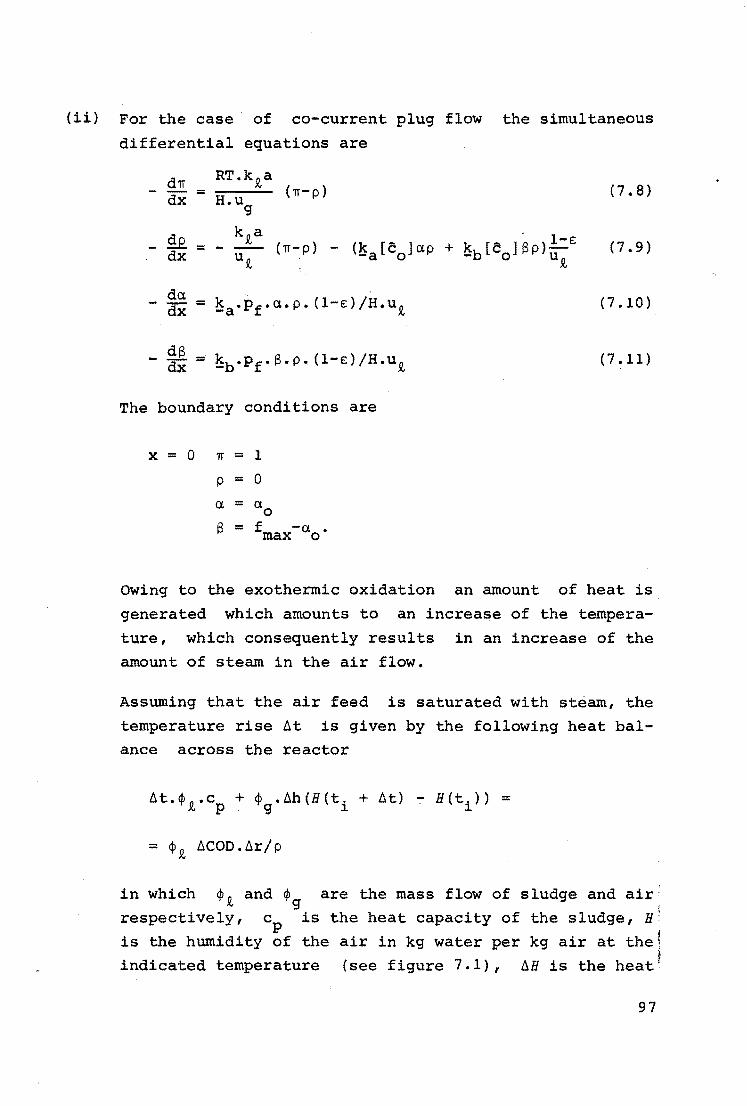
(ii) For the case · of co-current plug flow the simultaneous
differential equations are
dTI RT.k.R,a ( TI-p) = dx H.ug
- 2..e. k.R,a
(TI-p) <Jsa[co]a.p = - -- -dx UJ(,
The boundary conditions are
X = 0 TI = l
p = 0
a. = a.a Q = f _,.. µ max ... o.
(7.8}
+ Jsb[co]Sp)~-£ .!(,
(7.9)
(7.10)
(7.11)
owing to the exothermic oxidation an amount of heat is
generated which amounts to an increase of the tempera
ture, which consequently results in an increase of the
amount of steam in the air flow.
Assuming that the air feed is saturated with steam, the
temperature rise 6t is given by the following heat balance across the reactor
in which ¢.!(,and ¢g are the mass flow of sludge and air. \
respectively, cp is the heat capacity of the sludge, H:
is the humidity of the air in kg water per kg air at the indicated temperature (see figure 7.1), 6H is the heat
97
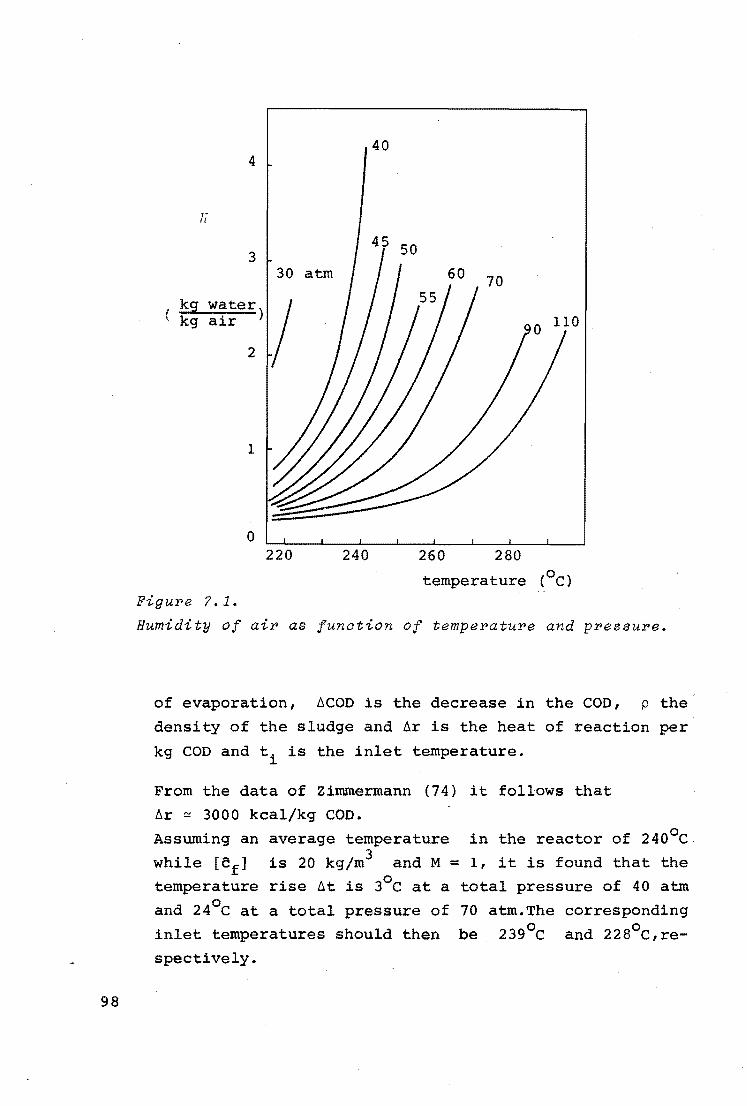
98
40 4
3 30 atm
water) I air
2
kg kg
1
0 220 240 260 280
temperature (0 c) Figure 7.1.
Humidity of air as funation of temperature and pressure.
of evaporation, 6COD is the decrease in the COD, p the
density of the sludge and 6r is the heat of reaction per
kg COD and ti is the inlet temperature.
From the data of Zimmermann (74) it follows that
6r ~ 3000 kcal/kg COD.
Assuming an average temperature
while [cf] is 20 kg/m3 and M = temperature rise 6t is 3°c at a
and 24°c at a total pressure of
inlet temperatures should then
spectively.
in the reactor of 240°c
1, it is found that the
total pressure of 40 atm
70 atm.The corresponding
be 239°c and 228°c,re-
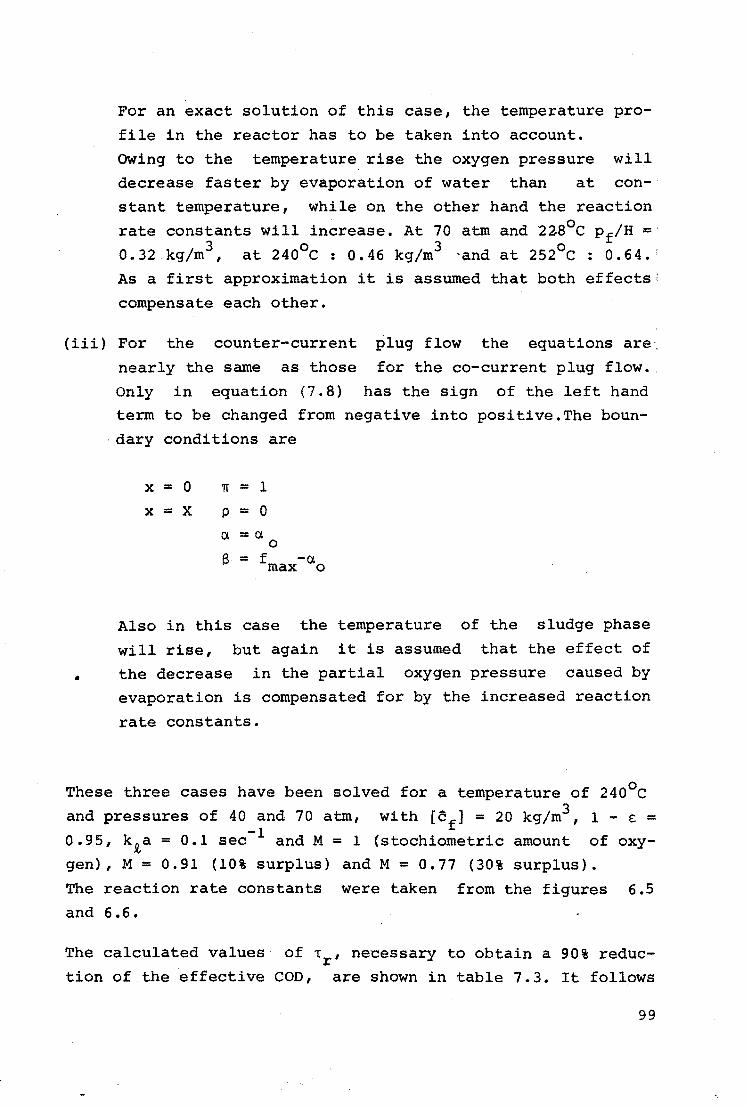
For an exact solution of this case, the temperature pro
file in the reactor has to be taken into account.
owing to the temperature rise the oxygen pressure will
decrease faster by evaporation of water than at con
stant temperature, while on the other hand the reaction
rate constants will increase. At 70 atm and 22.8°c pf/H =· 3 0 3 0 ' 0.32 kg/m , at 240 C : 0.46 kg/m ·and at 252 C : 0.64. ·
As a first approximation it is assumed that both effects!
compensate each other.
(iii) For the counter-current plug flow the equations are.
nearly the same as those for the co-current plug flow •.
Only in equation (7.8) has the sign of the left hand
term to be changed from negative into positive.The boun-
•
· dary conditions are
x = 0
x = x 'JT = 1
p = 0
Ct = Ct 0
f3 = f -a max o
Also in this case the temperature of the sludge phase
will rise, but again it is assumed that the effect of
the decrease in the partial oxygen pressure caused by
evaporation is compensated for by the increased reaction
rate constants.
These three cases have been solved for a temperature of 24o0 c and pressures of 40 and 70 atm, with [cf] = 20 kg/m3 , 1 - c: = 0.95, kia = 0.1 sec-1 and M = 1 (stochiometric amount of oxy
gen), M = 0.91 (10% surplus) and M = 0.77 (30% surplus).
The reaction rate constants were taken from the figures 6.5
and 6.6.
The calculated values of Tr' necessary to obtain a 90% reduc
tion of the effective COD, are shown in table 7.3. It follows
99
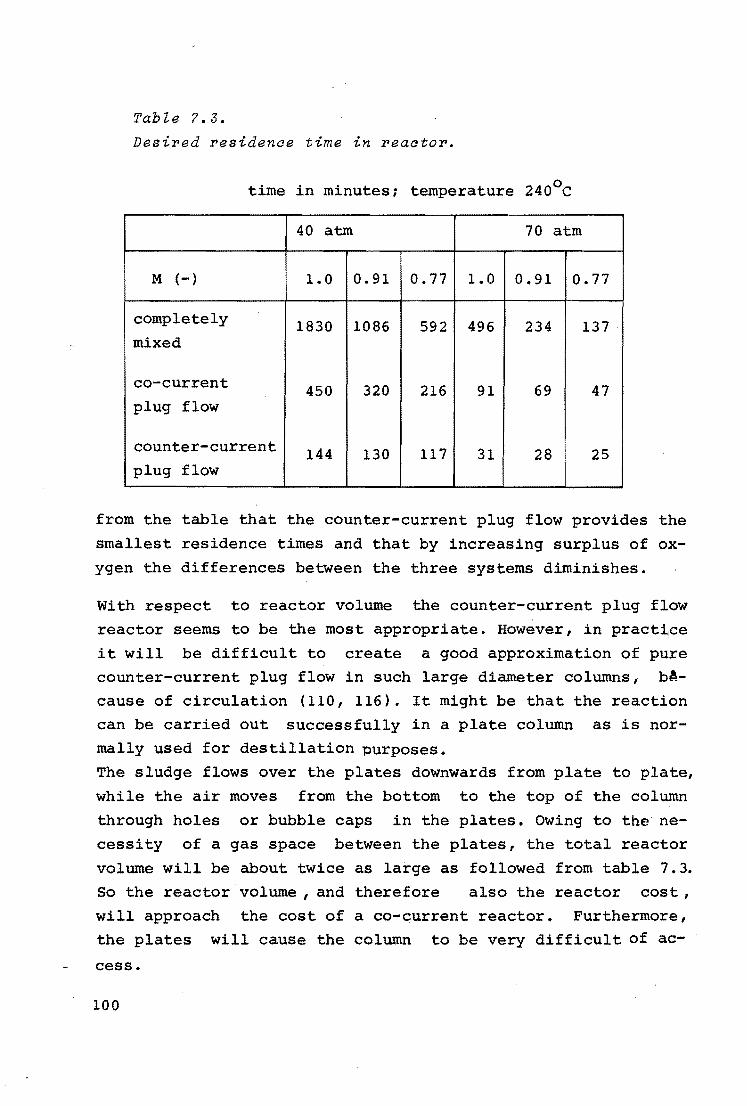
Table 7.3.
Desired residence time in reaator.
time in minutes; temperature 240°c
40 atm 70 atm
M (-) 1.0 0.91 0.77 1.0 0.91 0.77
completely 1830 1086 592 496 234 137 mixed
co-current 450 320 216 91 69 47 plug flow
counter-current 144 130 117 31 28 25 plug flow
from the table that the counter-current plug flow provides the
smallest residence times and that by increasing surplus of ox
ygen the differences between the three systems diminishes.
With respect to reactor volume the counter-current plug flow
reactor seems to be the most appropriate. However, in pract~ce
it will be difficult to create a good approximation of pure counter-current plug flow in such large diameter columns, b~
cause of circulation (110, 116). It might be that the reaction can be carried out successfully in a plate column as is nor
mally used for destillation purposes. The sludge flows over the plates downwards from plate to plate,
while the air moves from the bottom to the top of the column
through holes or bubble caps in the plates. Owing to the ne
cessity of a gas space between the plates, the total reactor
volume will be about twice as large as followed from table 7.3.
So the reactor volume , and therefore also the reactor cost ,
will approach the cost of a co-qurrent reactor. Furthermore, the plates will cause the column to be very difficult of ac
cess.
100
The use of packing will also provide the desired system, but
then the packing will take a large amount of reactor volume by
which the total reactor volume will approach that of the co
current system. Furthermore fouling might occur, resulting in a choking up of the reactor.
From these considerations it can be inferred that even though
the counter-current plug flow reactor requires the shortest
residence time, in practice a co-current reactor will be most
appropriate.
Finally it can be concluded that the calculated required res
idence time for such a reactor is of the order of magnitude of the residence time applied in practice.
101
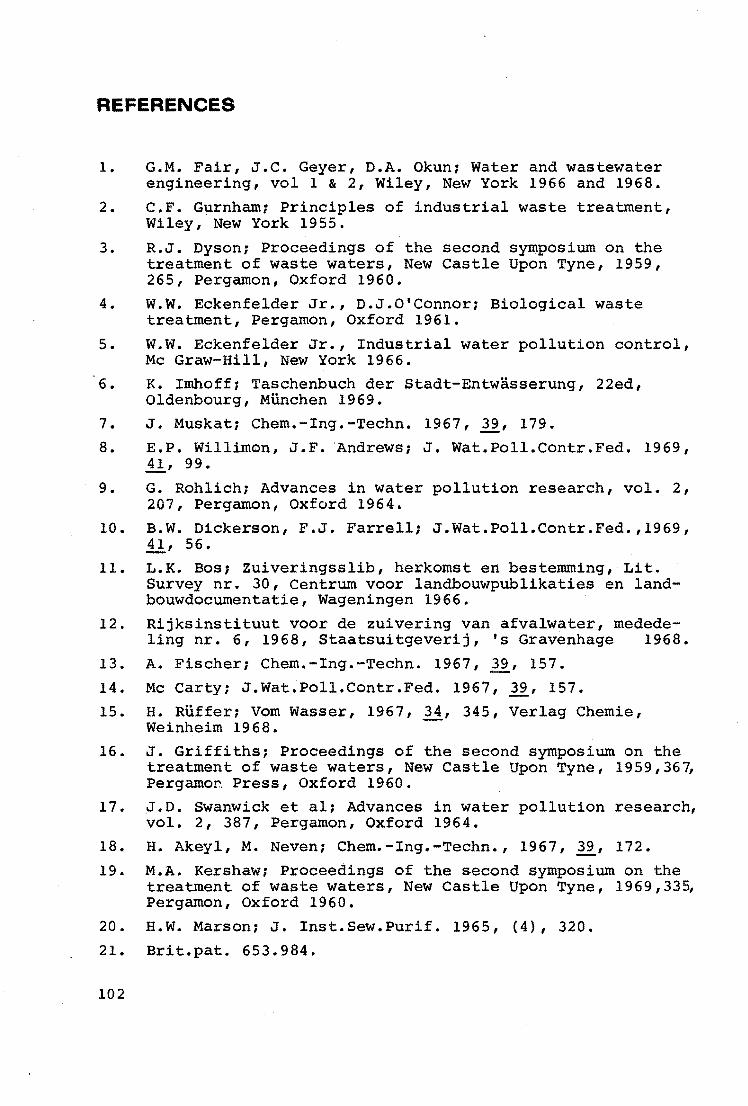
REFERENCES
1. G.M. Fair, J.C. Geyer, D.A. Okun; Water and wastewater engineering, vol l & 2, Wiley, New York 1966 and 1968.
2. C.F. Gurnham; Principles of industrial waste treatment, Wiley, New York 1955.
3. R.J. Dyson; Proceedings of the second symposium on the treatment of waste waters, New Castle Upon Tyne, 1959, 265, Pergamon, Oxford 1960.
4. W.W. Eckenfelder Jr., D.J.0 1 Connor; Biological waste treatment, Pergamon, Oxford 1961.
5. W.W. Eckenfelder Jr., Industrial water pollution control, Mc Graw-Hill, New York 1966.
6. K. Imhoff; Taschenbuch der Stadt-Entwasserung, 22ed, Oldenbourg, Milnchen 1969.
7. J. Muskat; Chem.-Ing.-Techn. 1967, 39, 179.
8. E.P. Willimon, J.F. Andrews; J. Wat.Poll.Contr.Fed. 1969, !!_, 99.
9. G. Rohlich; Advances in water pollution research, vol. 2, 207, Pergamon, Oxford 1964.
10. B.W. Dickerson, F.J. Farrell; J.Wat.Poll.Contr.Fed.,1969, !!_, 56. .
11. L.K. Bos; Zuiveringsslib, herkomst en besternrning, Lit. Survey nr. 30, Centrum voor landbouwpublikaties en landbouwdocumentatie, Wageningen 1966.
12. Rijksinstituut voor de zuivering van afvalwater, medede-ling nr. 6, 1968, Staatsuitgeverij, 's Gravenhage 1968.
13. A. Fischer; Chem.-Ing.-Techn. 1967, 39, 157.
14. Mc Carty; J.Wat.Poll.Contr.Fed. 1967, 39, 157.
15. H. Rilffer; Vom Wasser, 1967, .2_!, 345, Verlag Chemie, Weinheim 1968.
16. J. Griffiths; Proceedings of the second symposium on the treatment of waste waters, New Castle Upon Tyne, 1959,36~ Pergamon. Press, Oxford 1960.
17. J.D. Swanwick et al; Advances in water pollution research, vol. 2, 387, Pergamon, Oxford 1964.
18. H. Akeyl, M. Neven; Chem.-Ing.-Techn., 1967, 39, 172.
19. M.A. Kershaw; Proceedings of the second symposium on the treatment of waste waters, New Castle Upon Tyne, 1969,33~ Pergamon, Oxford 1960.
20. H.W. Marson; J. Inst.Sew.Puri£. 1965, (4), 320.
21. Brit.pat. 653.984.
102
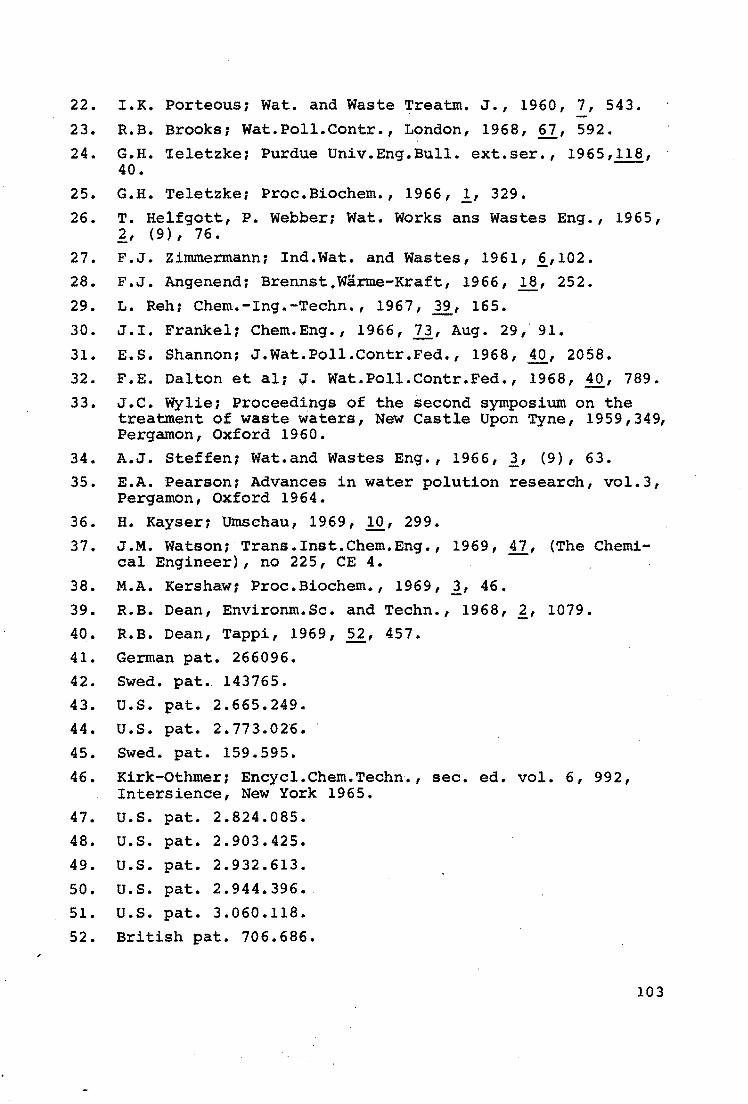
22.
23.
24.
I.K.
R.B. G.H.
Porteous; Wat. and Waste Treatm. J., 1960, 7, 543.
Brooks; Wat.Poll.Contr., London, 1968, 67, 592.
~eletzke; Purdue Univ.Eng.Bull. ext.ser., 1965,118, 40.
25. G.H. Teletzke; Proc.Biochem., 1966, li 329.
26. T. Helfgott, P. Webber; Wat. Works ans Wastes Eng., 1965, _£, (9), 76.
27. F.J. Zimmermann; Ind.Wat. and Wastes, 1961, ~,102.
28. F.J. Angenend; Brennst.Warme-Kraft, 1966, ~' 252. 29. L. Reh; Chem.-Ing.-Techn., 1967, 12_, 165.
30. J.I. Frankel; Chem.Eng., 1966, 73, Aug. 29, 91.
31. E.S. Shannon; J.Wat.Poll.Contr.Fed., 1968, !Q_, 2058.
32. F.E. Dalton et al; J. Wat.Poll.Contr.Fed., 1968, 40, 789.
33. J.C. Wylie; Proceedings of the second symposium on the treatment of waste waters, New Castle Upon Tyne, 1959,349, Pergamon, Oxford 1960.
34. A.J. Steffen; Wat.and Wastes Eng., 1966, li (9), 63. 35. E.A. Pearson; Advances in water polution research, vol.3,
Pergamon, Oxford 1964.
36. H. Kayser; Umschau, 1969, .!.Q., 299.
37. J.M. Watson; Trans.Inst.Chem.Eng., 1969, 47, (The Chemi-cal Engineer), no 225, CE 4.
38. M.A. Kershaw: Proc.Biochem., 1969, li 46.
39. R.B. Dean, Environm.Sc. and Techn., 1968, _£, 1079. 40. R.B. Dean, Tappi, 1969, 52, 457. 41. German pat. 266096.
42. Swed. pat. 143765. 43. U.S. pat. 2.665.249.
44. U.S. pat. 2.773.026.
45. Swed. pat. 159.595.
46. Kirk-Othmer; Encycl.Chem.Techn., sec. ed. vol. 6, 992, Intersience, New York 1965.
47. U.S. pat. 2.824.085. 48. u.s. pat. 2.903.425.
49. U.S. pat. 2.932.613.
50. U.S. pat. 2.944.396. 51. U.S. pat. 3.060.118.
52. British pat. 706.686.
103
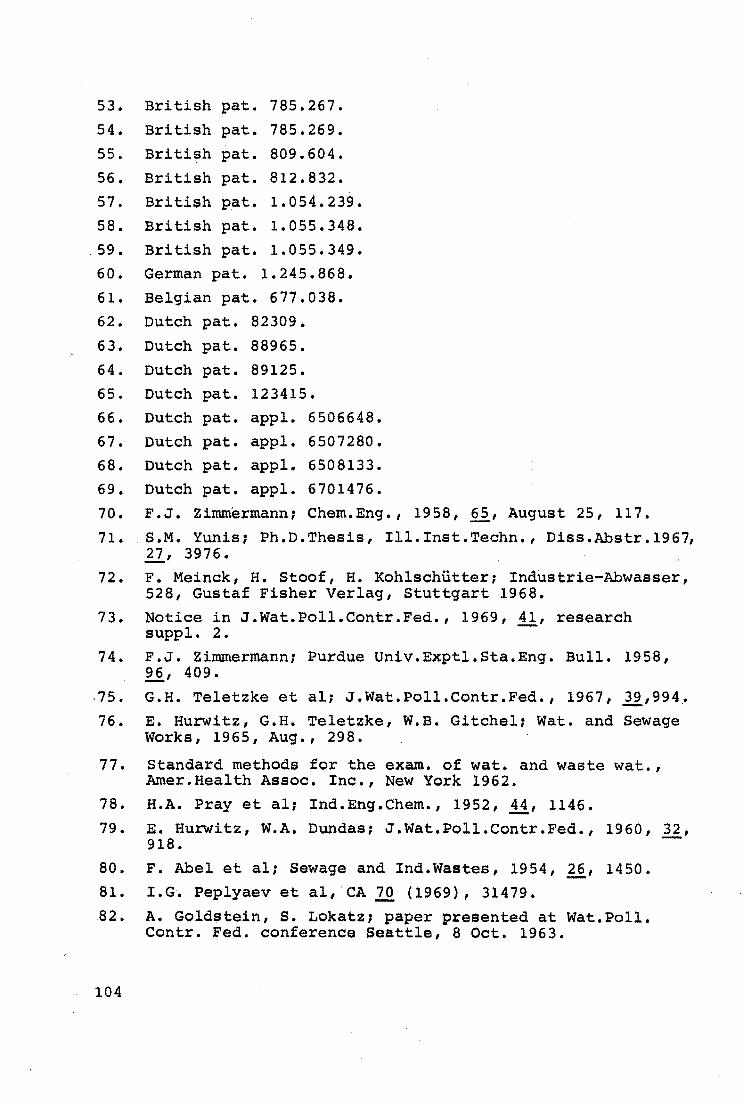
53.
54.
55.
56. 57.
58.
British
British
British I
British
British
British
pat. 785.267.
pat. 785.269.
pat. 809.604.
pat. 812.832.
pat. 1.054.239.
pat • 1.055.348.
. 59. British pat. 1.055.349.
60. German pat. 1.245.868.
61. Belgian pat. 677.038. 62. Dutch pat. 82309.
63. Dutch pat. 88965.
64. 65.
66.
67. 68.
69.
Dutch Dutch
Dutch Dutch Dutch
Dutch
pat. pat.
pat. pat. pat.
pat.
89125. 123415. appl. 6506648.
appl. 6507280. appl. 6508133. appl. 6701476.
70. F.J. Zimmermann; Chem.Eng., 1958, §..?_,August 25, 117.
71. S.M. Yunis; Ph.D.Thesis, Ill.Inst.Techn., Diss.Al:Jstr.1967, !:1 .. .t 3976.
72. F. Meinck, H. Stoof, H. Kohlschiitter; Industrie-Al:Jwasser, 528, Gustaf Fisher Verlag, Stuttgart 1968.
73. Notice in J.Wat.Poll.Contr.Fed., 1969, 41, research suppl. 2. ~
74. F.J. Zimmermann; Purdue Univ.Exptl.Sta.Eng. Bull. 1958, 96, 409 •
. 75. G.H. Teletzke et al; J.Wat.Poll.Contr.Fed., 1967, 39,994.
76. E. Hurwitz, G.H. Teletzke, W.B. Gitchel; Wat. and Sewage Works, 1965, Aug., 298.
77. Standard methods for the exam. of wat. and waste wat., Amer.Health Assoc. Inc., New York 1962.
78. H.A. Pray et al; Ind.Eng.Chem., 1952, !ii 1146.
79. E. Hurwitz, W.A. Dundas; J.Wat.Poll.Contr.Fed., 1960, 32, 918.
80. F. Abel et al; Sewage and Ind.Wastes, 1954, .£§_, 1450. 81. I.G. Peplyaev et al, CA 70 (1969), 31479.
82. A. Goldstein, S. Lokatz; paper presented at Wat.Poll. Contr. Fed. conference Seattle, 8 Oct. 1963.
104
83. W.R. Walters, G. Ettelt; Purdue Univ.Eng.Bull.Ext. Ser. 1965, 118, 551.
84. P.V. Danckwerts; Chem.Eng.Sci. 1953, £, 1.
85. E.T. v.d. Laan; Chem.Eng.Sci. 1957, 21 187.
86. G.H. Teletzke; Chem.Eng.Prog.1964, 60, (1), 33.
87. J. Muel~er et al; Biotechn. and Bio.Eng. 1968, 1.Q., 331.
88. J.B. Mc Kinley; Wat.Works and Wastes Eng. 1965, £, (9) ,97.
89. J.C. Harding, G.E. Griffin; J.Wat.Poll.Contr.Fed., 1965, 37, 1134.
90. G. Astarita, G. Marrucci; I.E.C. Fund. 1963, £, 4.
91. R.W. Nicholson et al; The American City, 1966, .§.!., 97.
92. F.J. Zimmermann, D.G. Diddams; Tappi 1960, ~' 710.
93. G.H. Teletzke; paper presented at 39th annual conference of Water Pollution Control Federation, Kansas City, 1966.
94. R.H. Bogan; J. Sani.Eng.Div., .1959, July, SA 4J 13.
95. E. Guccione; Chem.Eng., 1964, May 25, 118.
96. N. Seegert; Vattenhygien, 1965, £1 47.
97. E. Hurwitz; Advances in water pollution research, vol. 2, 411, Pergamon, Oxford 1964.
98. E. Schmidt; Ber.Abw. Techn.Verein., 1957, ~' 78.
99. H. Lohman, A. Tilly; Chem.-Ing.-Techn., 1965, 37, 913.
100. E.W. Schoeffel, N. Seegert; Wasser, Luft, Betrieb, 1966, 8, 541.
101. Stauffer; Aufbereitungstechnik, 1967, ~' 286.
102. R. Randolf; Wasserwirtsch.-Wassertechn., 1963, 8, 10,342.
103. s. Lerczynski; Przem.Chem., 1967, 46, 2.
104. L. Gromski; Przem.Chem. 1967, !§.i_ 191.
105. R. Vrijburg; Water, 1966, 50, 313.
106. B. Brunes et al; Svensk Papperstidning, 1955, 58, 332.
107. K.N. Cederquist; Svensk Papperstidning, 1958, .§.!, 38.
108. K.N. Cederquist; Svensk Papperstidning, 1955, 58, 154.
109. K.N. Cederquist, P. Bering; Acta.Polytechn.Chem.Met.Ser. 1952, .~.' 5.
110. G.D. Towell et al ; A.I.Ch.E., Chem. Eng. Symp. Series
no • 1 O , 19 6 5 . 111. R.S. Burd; Water pollution control research series,
publ. WP-20-4, A study of sludge handling and disposal, 275.
112. U.S. Patent 3.449.247.
105
113. P. Battino; Chem.Rev. 1966,.§.§_, 395.
114. Dutch pat. appl. 6917974.
115. K.M. Guthrie; Chem. Engin. 1969,~ March 24, 114.
116. J-B. Wijffels; Ph.D. Thesis, University of Technology, Eindhoven 1970.
117. R.H. Perry; Chemical Engineers Handbook, fourth edition, McGraw-Hill, New York 1963.
118. R. Higbie; Trans. A.I.Ch.E. 1935, l!_, 365.
119. R.B. Brooks; Wat.Poll.Contr. London, 1970, .§..2_, 92.
120. Takeichiro Takamatsu,et al, Wat. Research, 1970, ii 33.
121. J.J.A. Ploos van Amstel; Internal publication, University of Technology, Eindhoven 1970.
122. H.G.J. de Wilt; Ph.D. Thesis, University of Technology, Eindhoven 1969.
123. C.G.M. de Boer; Internal publication, University of Technology, Eindhoven 1970.
124. H.P.E. v.d. Venne, F.C.M. v.d. Berg; Internal publication University of Technology, Eindhoven 1970.
125. J.J.A. Ploos van Amstel, K. Rietema; Chem. - Ing. - Techn. 1970, !£, 981.
126. H.J. Eggink, Private communication.
127. J.V. Hunter, H. Heukelekian; J. Wat.Poll.Contr.Fed. 1965,
]]_, 1142. 128. u. Grigull; Die grundgesetze der WarmeUbertragung, dritte
auflage, Springer 1963.
129. T. Takamatsu et al; Paper II-32 presented at the 5th
international Water Pollution Research Conference 1970.
106
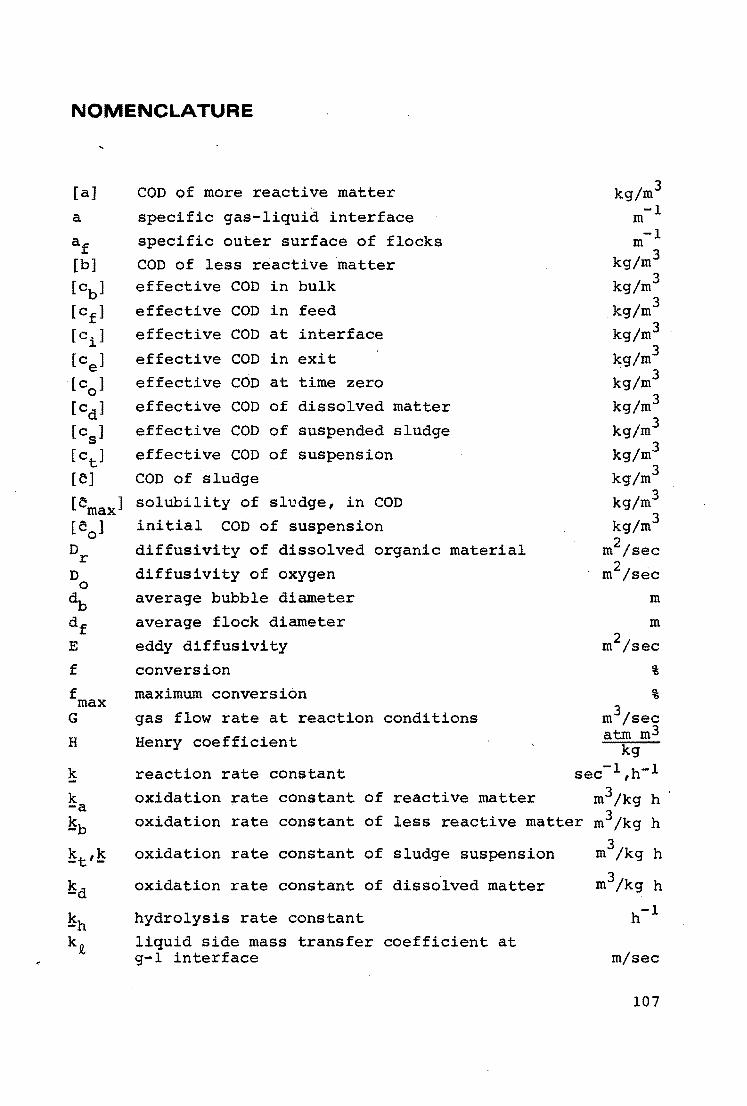
NOMENCLATURE
[a]
a
af [b]
[cb]
[cf]
[ci]
[ce]
[co]
[cd]
[cs]
[ct]
[e]
[emaxl
(eo]
Dr
D 0
db
df E
f
f max
G
H
COD of more reactive matter
specific gas-liquid interface
specific outer surf ace of flocks
COD of less reactive matter effective COD in bulk
effective COD in feed
effective COD at interface
effective COD in exit
effective COD at time zero
effective COD of dissolved matter
effective COD of suspended sludge
effective COD of suspension
COD of sludge
solubility of sludge, in COD
initial COD of suspension
diffusivity of dissolved organic material
diffusivity of oxygen
average bubble diameter
average flock diameter
eddy diffusivity
conversion
maximum conversion
gas flow rate at reaction conditions
Henry coefficient
kg/m3
-1 m -1 m
kg/m3
kg/m3
kg/m3
kg/m3
kg/m3
kg/m3
kg/m3
kg/m3
kg/m3
kg/m3
kg/m3
kg/m3
m2/sec 2; . m sec
m
m
m2/sec
%
%
m3/sec atm m3
kg
k reaction rate constant sec-1 ,h-l
k oxidation rate constant of reactive matter m3/kg h · -a ~b oxidation rate constant of less reactive matter m3/kg h
oxidation rate constant of sludge suspension
oxidation rate constant of dissolved matter
hydrolysis rate constant
liquid side mass transfer coefficient at g-1 interface m/sec
107
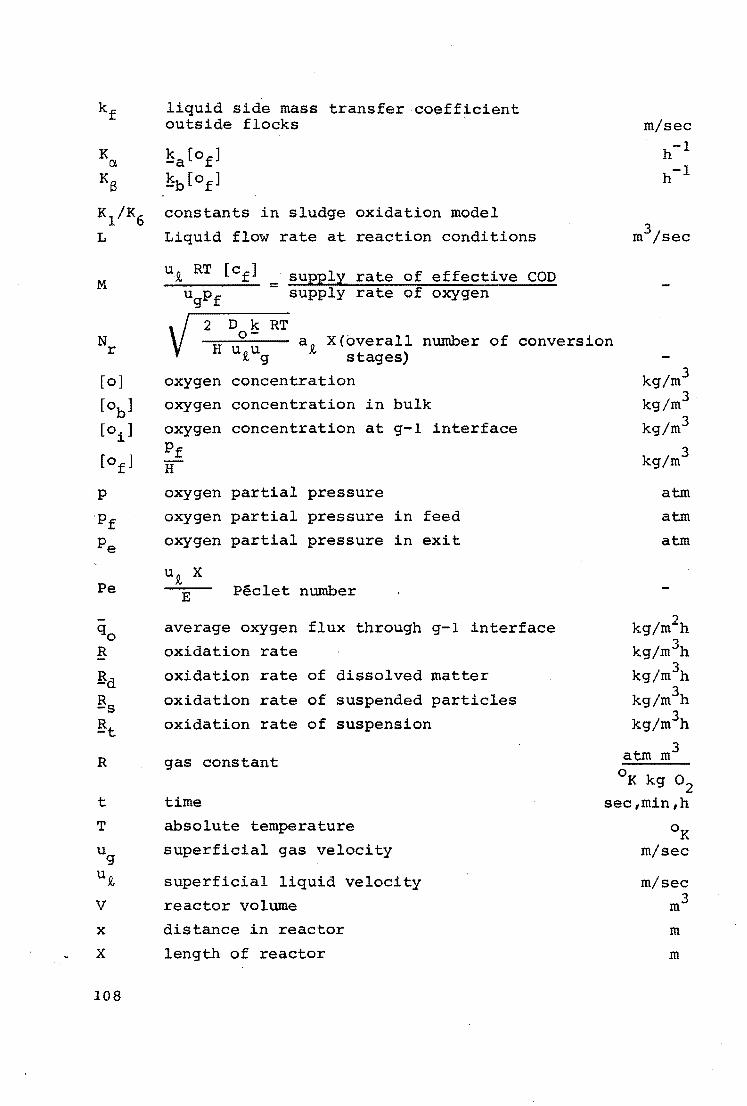
M
N r
[ 0]
[ob]
[oi]
[of]
p
Pf
Pe
Pe
x
x
108
liquid side mass transfer coefficient outside flocks
constants in sludge oxidation model
Liquid flow rate at reaction conditions
u~ RT [cf] _ supply rate of effective COD ugpf - supply rate of oxygen
m/sec -1
h -1
h
m3/sec
V 2 D k RT o- aa X(overall number of conversion H u~ug N stages)
oxygen concentration
oxygen concentration in bulk
oxygen concentration at g-1 Pf H oxygen partial pressure
oxygen partial pressure in
oxygen partial pressure in
UR, X
E Peclet number
average oxygen flux through
oxidation rate
oxidation rate of dissolved
interface
feed
exit
g-1 interface
matter
oxidation rate of suspended particles
oxidation rate of suspension
gas constant
time
absolute temperature
superficial gas velocity
superficial liquid velocity
reactor volume
distance in reactor
length of reactor
kg/m3
kg/m3
kg/m3
3 kg/m
atm
atm
atm
kg/m2h
kg/m3h
kg/m3h
kg/m3h
kg/m3h
atm m3
OK kg 02
sec,min,h
OK m/sec
m/sec m3
m
m
z
a 0
s y
y*
-y
e:
p
a
T
e
<Pox
distance from interface
[a]/[e0
]
fraction of reactive matter in sludge
[b]/[c0
]
[c]/[c0
]
[c]/[cf] [c]/[e
0]
gas fraction in reactor
volume fraction of flocks in suspension
volume fraction solids in flock
p/pf
[ob]/[of] x/X
m
residence time of liquid element at g-1 interface sec
average residence time of sludge in reactor sec,min
conversion rate
109
SAMENVATTING
Natte oxidatie is een methode van slibverwerking waarbij het
·slib in de aanwezigheid van lucht in de vloeibare waterfase
geoxideerd wordt bij temperaturen van 200-300°c en drukken van
40-120 atm.Uit een literatuurstudie bleek dat dit proces langs
empirische weg was ontwikkeld en dat inzicht in de achtergrond
van de natte oxidatie nauwelijks aanwezig was •
Vanwege de aantrekkelijkheid van het proces werd een proces
kundig gericht onderzoek uitgevoerd, hetgeen in dit proef
schrift beschreven is.
Allereerst werd de oxidatie van een glucose oplossing als mo
del slib onderzocht met semi-batch en continue proeven bij om
streeks 200°c en 50 atm. Uit deze experimenten bleek dat de
oxidatie van het model slib snel was vergeleken met de diffu
sie van zuurstof, waardoor de reaktie zich in de diffusie
grenslaag rond de gasbellen afspeelt. De chemische reaktie
snelheid kan beschreven worden als eerste orde in organisch
materiaal en nulde orde in zuurstof, terwijl de reaktie snel
heidskonstante ongeveer 2 sec-l is bij 200°c. Een model wordt
gepresenteerd voor de conversie in de continue reaktor, dat
zowel gekombineerde reaktie en diffusie inhoudt, als menging
en konvektie.
Dit model geeft een akseptabele beschrijving van zowel de in
vloed van de proces parameters als van de koncentratieprof ie
len in de reaktor.
Bij de verhoogde temperaturen (ca 240°c) gaat het slib ten ge
volge van hydrolyse gedeeltelijk in oplossing, waardoor zowel
oxidatie van gehydroliseerd slib als van slib deeltjes op
treedt.
Om de bijdrage van de oxidatie van gehydroliseerd slib tot de
totale oxidatie snelheid te kennen werd de hydrolyse van slib
met batch experimenten onderzocht.
110
Het effect van de hydrolyse op de . overall oxidatie snelheid
werd bestudeerd aan de hand van primair slib. Oxidatie experi
menten werden uitgevoerd bij 230°c en 100 atm met slib als zo
danig met oplossingen van gehydroliseerd slib en met een sus
pensie van het vaste residu dat na de hydrolyse overblijft.
Het blijkt dat de hydrolyse de overall oxidatie snelheid niet
beinvloedt omdat gehydroliseerd slib en slibdeeltjes vrijwel
dezelfde reaktiviteit hebben.
De oxidatie van aktief en primair slib verliep langzamer dan
de oxidatie van het model slib, en de omzetting vond voorna
melijk in de bulk van het slib plaats. De mate van diffusie
limitering door zuurstof, ofwel de mate waarin de omzettings
snelheid door zuurstoftransport wordt afgeremd, hangt af van ·de temperatuur. Bij 180°c kan de weerstand voor massa trans-port verwaarloosd worden, terwijl bij 290°c de omzettings
snelheid grotendeels door massa transport bepaald wordt.
Een model voor de oxidatie van slib wordt gepresenteerd. Het
uitgangspunt van dit model is dat in het slib twee groepen van
komponenten onderscheiden kunnen worden die verschillen in reaktivi tei t en die simultaan geoxideerd worden, terwijl nog een
derde, volledig inactieve groep, eveneens aanwezig is.
Experimenteel is vastgesteld dat aktief slib voor ca 65% uit
reaktief materiaal bestaat, voor 25% uit minder reaktief ma
teriaal terwijl 10% volledig inaktief is. De chemische reak
tiesnelheid wordt beschreven als eerste orde in organisch ma
teriaal en als eerste orde in zuurstof (bij relatief hoge zuurstof drukken wordt de reaktie nulde orde in zuurstof).
Massa transport is ook in het model begrepen. Dit model geeft
een zeer akseptabele beschrijving van de experimentele resul
taten. Het effect van de temperatuur op de snelheidskonstan-
ten van de twee groepen van oxideerbare komponenten
slib kan met de wet van Arrhenius beschreven worden, de aktiveringsenergie voor beide groepen ongeveer 23
bedraagt.
in aktief
terwijl
kcal/mol
111
Bij 2ss0 c ziJn de reaktie snelheids konstanten respectieve
lijk 250 en 20 m3/kg h.
Gebaseerd op de resultaten van dit onderzoek werden de afme
tingen van een kommerciele sektor berekend. Afhankelijk van de
overmaat zuurstof, is de benodigde verblijftijd voor een prop
stroom reaktor, bedreven in gelijkstroom, twee tot drie maal
groter dan in een in tegenstroom bedreven propstroom reaktor.
De benodigde verblijftijd in een reaktor met een ideaal ge
mengde vloeistof f ase is 6 tot 12 maal groter dan in de tegen
stroom reaktor. In de praktijk wordt een gelijkstroom reaktor
toegepast waarin de mengtoestand tussen propstroom en ideaal
gemengd ligt, waardoor een verblijftijd van ca 5 maal de ver
blijftijd in een in tegenstroom bedreven propstroom reaktor
nodig zal zijn. Op praktische gronden zal echter de gelijk
stroom reaktor waarschijnlijk toch aantrekkelijker blijven.
112
LEVENSBESCHRIJVING
De schrijver van dit proefschrift werd in oktober 1943
te Eindhoven geboren.
Na het behalen van het HBS-B diploma in 1961 ving hij aan met
zijn studie voor scheikundig ingenieur aan de Technische Hoge
school te Eindhoven. Vanaf 1962 tot aan het einde van zijn
studie was hij student-assistent op het laboratorium voor al
gemene chemie en op het laboratorium voor fysische technologie.
Na een afstudeerperiode onder leiding van Prof .Dr. K. Rietema,
hoogleraar in de fysische technologie, werd de studie in mei
1967 afgesloten. In mei 1967 vond tevens zijn benoeming plaats
als wetenschappelijk medewerker aan het laboratorium voor
fysische technologie, waar het in dit proefschrift beschreven
onderzoek verricht werd.
Eind 1970 trad hij als milieuhygienist in dienst van het ar
chi tecten en ingenieursbureau van de N.V. Philips'Gloeilampen
fabrieken.
113
STELLINGEN
1. De mono-nitrering van tolueen in het twee-fasen systeem
tolueen-nitreerzuur verloopt bij lage zwavelzuur concen
traties hoofdzakelijk in de organische fase, terwijl bij
hogere zwavelzuur concentraties de reaktie zich hoofdzake
lijk in de zuurfase afspeelt.
K.J. Jacobs; Afstudeer rapport, T.H. Eindhoven 1966.
P. van Galen; Afstudeer rapport, T.H. Eindhoven 1969.
2. Bij de mono-nitrering van tolueen in de organische fase
(lage zwavelzuur concentraties) wordt het aktieve nitre
rings agens alleen in de zuurfase gevormd.
Deze nitrerings agens ontleedt onder invloed van water.
3. Voor het stoftransport tussen gas- en vloeistoffase in een
trickle kolom kan voor laminaire stromings condities de
volgende relatie afgeleid worden voor de weerstand in de
vloeistoffase.
Sh = 0.63 Re 1 1 3Go 1 16 sc~
4. Voor het digitaal of analoog oplossen van concentratie
verdelingen in procesapparatuur waarin de mengtoestand ge
karakteriseerd wordt door propstroom met axiale menging,
biedt het ten aanzien van de stabiliteit van de oplossing
grote voordelen om de ingangsrandvoorwaarde te vervangen
door een "overall" massabalans.
5. Yunis, die de oxidatie van glucose bij ca iso0 c bestudeerd
heeft, veronderstelt conversiesnelheden gemeten te hebben.
Hij heeft echter slechts de maximale conversie gemeten.
Zijn konklusies zijn dan ook onjuist.
M.S. iunis; Thesis, Ill. Inst. of Techn. Chicago 1967.
6. Het is zeer twijfelachtig of het model dat Takamatsu geeft
voor de hydrolyse van aktief slib bij verhoogde temperatuur
met de werkelijkheid overeen stemt. Het hierop gebaseerde model voor de natte oxidatie is niet in overeenstemming met het model dat in dit proefschrift gepresenteerd wordt.
T. Takamatsu et al; Wat. Res. 1970, ii 33. T. Takamatsu et al; Paper II - 32 presented at the 5th
international Water Pollution Research Conference, 1970.
7. De verontreinigingen in het afvalwater van de aardappel
meelindustrie zijn goed te oxideren in de vloeibare waterfase bij verhoogde temperatuur en druk. De reaktiesnel
heids konstanten zijn ongeveer een faktor 10 groter dan
die voor aktief slib.
J. Oomen enc. Trentelman; Praktikum verslag,
T.H. Eindhoven, 1970.
8. Schieten op het wipje zonder het jobje getuigt van de ware
schuttersgeest.
J.A. Jolles; De Schuttersgilden in Noord-Brabant
Handboek Hinderwet XXII - 4; oktober 1970.
9. Het is onduidelijk waarom bij het schieten op de vogel al
leen het gebruik van rookzwak buskruit is toegestaan.
Handboek Hinderwet XXII - 7; oktober 1970.
10. Tot onze kultuur behoort karnaval, het feest waarbij af
stand genomen wordt van de komplikaties van onze kultuur.
Nuenen, 2 april 1971. J.J.A. Ploos van Amstel.