Embed Size (px)
Citation preview

The Partner for Success
Annual Report 2012Year ended March 31, 2012
Zuken Inc.
2-25-1 Edahigashi, Tsuzuki-ku,Yokohama, Kanagawa 224-8585, Japan
Tel: +81-45-942-1511Fax: +81-45-942-1599
http://www.zuken.com/
Zuken Inc.

European and North American markets
Asian markets
Financial Section
Consolidated Subsidiaries andOverseas Locations
Corporate Information
151617
4142
Remarks in connection with future prospects: The plans and business forecasts indicated in this booklet are based on information that can be used at the present time, and they include latent risks and uncertain elements. It should be understood, therefore, that the actual content and results of our business activities may differ considerably from the forecasts presented herein due to changes in the various factors employed as the basis for these forecasts.
Consolidated Financial Highlights
Message from the CEO
Message from the COO
Feature
Overview by area
Japanese market
2379
1314
I N D E X
Conditions in the manufacturing industry sector have undergone enormous change over the past few years. As the Japanese, U.S. and European markets have matured and seen slower growth, adapting manufacturing activities to environments in emerging markets has become a high priority for monozukuri.The key points in addressing this concern are how to shift from manufacturing emphasizing quality and functionality, to manufacturing that delivers the products in line with local needs, at an appropriate cost, and quickly.Doing this requires that relevant information is made visible across organizational boundaries, costs are cut while maintaining quality, and products are refined or polished to achieve competitiveness in target markets. These activities must be carried out via the design and manufacturing processes. And to achieve this, it is important to create a mechanism of delivering monozukuri bearing in mind a global division of labor and taking full advantage of IT.Zuken incorporates 3D and other cutting-edge technologies in IT solutions to achieve and develop this goal. We support customers’ monozukuri activities through a global network.
The Chinese characters “Zu” and “Ken,” as rendered by Takuya Takahashi. These characters appeared in a TV commercial in Japan. While still only three years of age, Takuya was named the Grand Prix winner in calligraphy at the Festival International Montréal en Arts. He created the official rendering for Tohoku Rokkon Festival held in May 2012, in Chinese characters. And for the Rio+20 United Nations Conference on Sustainable Development, held in June 2012 in Rio de Janeiro, he created a beautiful rendering of the conference's theme for an event held to highlight disaster recovery efforts in the Tohoku district of Japan. With imaginative flair, he rendered the character “zu,” which means “making it visible” and “ken,” which means “perfecting.”
Zuken responds to the technological demands of companies across the globesupporting monozukuri with IT solutions
Making it visible Perfecting
For the Year:Net salesOperating income (loss)Net income (loss)At Year-End:Total assetsTotal shareholders’ equity (Note 2)
Per Share of Common Stock:Net income (loss) (Note 3)Total net assetsCash dividends applicable to the period
Financial RatioOperating income ratioPrice earnings ratioShareholders’ equity ratioCurrent ratio
2012201220112009
Yen U.S. dollars
2008
Millions of yen
Thousands ofdollars
(Note 1)
. . . . . . . . . . . . . . . . . . . . . . . . . . . . . . . . . . . . . . . . . . . .. . . . . . . . . . . . . . . . . . . . . . . .
. . . . . . . . . . . . . . . . . . . . . . . . . . . . . . . .
. . . . . . . . . . . . . . . . . . . . . . . . . . . . . . . . . . . . . . . .. . . . . . . . . . .
. . . . . . . . . . . . . . . . . . . .. . . . . . . . . . . . . . . . . . . . . . . . . . . . . . . . . . .
. . . . . . . . . . . . . . . . . . . . . . . . . .. . . . . . . . . . . . . . . . . . . . . . . . . . . . . . .
. . . . . . . . . . . . . . . . . . . . . . .. . . . . . . . . . . . . . . . . . . . . . . . . . . . . . . . . . . . . . .
Notes: 1. For the convenience of the reader, the f inancial highlights described above have been presented in Japanese yen and also in U.S. dollars by arithmetically translating all Japanese yen amounts at ¥82 to US$1, the exchange rate in effect at March 31, 2012. 2. Total shareholders’ equity in the above table represents the total of shareholders’ equity and valuation and translation adjustments in the consolidated balance sheets. 3. Net income per share is computed based upon the weighted-average number of shares of common stock outstanding during each f iscal year.
¥ 22,0192,8391,757
37,68628,157
67.861,087.37
12
12.914.674.7
405.0
2010
¥ 17,099(373)
(91)
36,35027,765
(3.59)1,099.39
14
(2.2)(192.2)
76.4500.6
¥ 19,8471,4601,214
35,53427,913
47.021,105.23
14
7.412.878.6
506.5
%
$ 222,62210,76821,573
466,707340,658
0.92814.6
0.293
¥ 18,255883
1,769
38,27027,934
76.071,201.29
24
4.88.8
73.0401.8
¥ 17,969225291
35,78026,480
11.631,138.74
14
1.355.574.0
426.4
2008
2009
2010
2011
2012
22,019
19,847
Net sales (Millions of yen)
2008
2009
2010
2011
2012
28,157
27,913
27,765
26,480
Total assets (Millions of yen)
2008
2009
2010
2011
2012
2,839
1,460
225
-373
Operating income (loss) (Millions of yen)
2008
2009
2010
2011
2012
1,214
-91
291
Net income (loss) (Millions of yen)
Total shareholders’ equity (Millions of yen)
2008
2009
2010
2011
2012
12
14
14
24
14
149
78
18
71
18
0
0
0
0
0 40 80 120 160
5,000 10,000 15,000 20,000 25,0001,000-1,000 2,000
1,000-1,000 2,000
5,000 10,000 15,000 20,000
17,099
18,255
17,969
1,757
(Yen / %) Trends in dividends and payout ratios (non-consolidated)
Trends in dividends Payout ratios
883 27,934
1,769
2008
2009
2010
2011
2012
37,686
35,534
38,270
35,780
36,350
0 10,000 20,000 30,000
Takuya Takahashi – CalligrapherBorn in the city of Kurihara, Miyagi Prefecture, Japan in February 1999. Now resides in the city of Morioka, Iwate Prefecture.
Consolidated Financial HighlightsZUKEN Inc. and Consolidated SubsidiariesYears ended March 31, 2008, 2009, 2010, 2011 and 2012
1 2ZUKEN Inc. ANNUAL REPORT 2012

Over the course of the fiscal year under review, economic conditions
generally reflected a mild recovery underpinned by growth in China,
India and other emerging countries. With serious fiscal and financial
concerns in Europe, however, the future remains uncertain.
Key customers in the electronics and automobile-related manu-
facturing industries have achieved gradual recovery from the effects
of the Great East Japan Earthquake and devastating floods in Thai-
land. Nevertheless, with the ongoing strength of the yen, and con-
cerns about weakness in overseas economies, these industries main-
tained a high degree of caution with regard to capital investment. A
notable positive highlight was seen in our new industrial equipment
manufacturing business, which saw healthy results due to expanding
overseas demand and demand related to disaster recovery efforts.
Within this context, the Zuken Group undertook the initia-
tives described here with the ultimate goal of being “the partner
for success” for our customers.
Electronics industry marketFocusing on customers in the electronics industry, we embarked on a
simultaneous global introduction of an electrical design system we
have positioned as a new core product. This new product applies the
latest software technology to achieve outstanding performance and
a whole new level of operability.
Industrial equipment marketIn the field of industrial equipment manufacturing, we focused on
expanding sales of a product that shares 3D data for design and
manufacturing. This product uses cutting-edge technology to
reduce design and manufacturing data volumes, thereby enabling
the detailed sharing of data among organizational units and open-
ing the door to the overall optimization of design and manufactur-
ing processes.
Global market In this area of our operations, we worked to increase our sales of
wiring design systems for the manufacture of transportation and
industrial equipment, mainly in the United States and Europe. In
addition, to sustain our global business growth, we aggressively
pursued measures aimed at strengthening our organization and
securing and developing human resources.
As a result of efforts briefly described above, we recorded net sales
of ¥18,255 million, up 1.6% YoY; operating income of ¥883 million,
up 291.7% YoY; and net income of ¥1,769 million, up 508.6% YoY.
Our performance in all three areas, therefore, surpassed levels
achieved for the prior fiscal year.
Positive economic indicators include ongoing disaster recovery
efforts in Japan and Thailand, and signs of a mild economic recov-
ery. The overall picture, however, remains unpredictable due to eco-
nomic crises in Europe and slowing growth in emerging econo-
mies. Given this, the Zuken Group will seek to further expand its
operations by pursuing its business activities with even greater
One is an electrical design system we launched on a worldwide basis
during the fiscal year under review. We developed this product by
melding advanced design concepts and cutting-edge technology,
to update monozukuri for the demands of a new era. The other prod-
uct builds a common monozukuri foundation by enabling the overall
optimization of design and manufacturing processes through the
sharing of 3D data.
Rising to the demands of intensifying competition and evolv-
ing market conditions in the digital home electrical appliance and
automobile-related manufacturing industries requires the global-
ization of design and manufacturing. Furthermore, in the field of
energy to support manufacturing at companies of all types.
A solid business framework will be key to this effort. The Zuken
Group has led the world in establishing of a system for supporting
manufacturing with packaged software. We have also developed
close customer relationships through maintenance agreements and
firmly established a business model on a foundation of stable profit-
ability. In our global business, we offer products and technical
services to manufacturing companies throughout the world via our
global network.
Underlying all of this is the Zuken Group’s solid business frame-
work. Two new products will make this framework even stronger.
industrial machinery, where the adoption of IT is expected to
spread rapidly, manufacturers are attempting to build systems
that are instantly competitive by pursuing the simultaneous
adoption of IT in both design and infrastructure construction.
Identifying the diverse needs of such customers individually,
and flexibly applying our rich business framework to the task of
addressing them, we support monozukuri throughout the world,
and expand and grow our businesses by offering solutions that
are unique to the Zuken Group. Through business initiatives such
as those described here, we aim to achieve net sales of ¥19,000
million, operating income of ¥920 million, and net income of ¥650
million in our 37th business year.
As described above, changes in the monozukuri environment
have only increased the need for solutions offered by the Zuken
Group. We must not, however, forget our roots. Going forward, it is
essential that we accentuate even more firmly activities based on
our corporate philosophy, which is to “Establish a vibrant corpo-
rate culture founded upon soundness, vigor and dignity”. Looking
forward to our 37th business term, financial soundness and dignity
founded on corporate ethics will remain as important as ever.
Added emphasis, however, will be placed on vigor in proactively
advancing initiatives, and achieving tangible results with solid
proposals that are up to the challenges of the increasingly rapid
pace of change in monozukuri.
Paying returns to shareholders is one of our highest manage-
ment priorities. We therefore exercise great care in determining
the optimal level of shareholder returns to pay in light of factors
including our business performance and operating conditions.
For the fiscal year under review, we have decided to pay not only
the ordinary dividend of ¥7 per share but, in addition, a special
dividend of ¥10 per share to commemorate our 35th anniversary
and reflect our extraordinary income. The term-end dividend will
therefore come to ¥17 per share. Combined with the interim divi-
dend of ¥7 per share, the annual dividend will be ¥24 per share.
Excluding the special dividend, we intend to again pay a regular
dividend of ¥14 per share (an interim dividend of ¥7 per share and
a term-end dividend of ¥7 per share) for our 37th business term, in
accordance with our policy of paying stable returns.
Going forward, the continued understanding and support of
our shareholders will be greatly appreciated.
The quickening pace of change in the monozukuri environment makes Zuken’ssolutions ever more important.
Makoto KanekoPresident and Representative Director
New-market initiatives paying off with higher sales and profits
Strengthening our business framework and offering new global solutions throughout the world
Message from the CEO
Sales by product
Circuit boarddesign solutions
17.9%Client services 38.4%
IT solutions 17.8%
Circuit designand IC solutions
25.8%
¥18,254,880,000(US$222,620,487) (year ended March 2012)
Sales by region
Japan 72.8%
Europe 17.2%
Asia 5.8%
North America 4.2%
¥18,254,880,000(US$222,620,487)(year ended March 2012)
Others 0.1%
3 4ZUKEN Inc. ANNUAL REPORT 2012

Over the course of the fiscal year under review, economic conditions
generally reflected a mild recovery underpinned by growth in China,
India and other emerging countries. With serious fiscal and financial
concerns in Europe, however, the future remains uncertain.
Key customers in the electronics and automobile-related manu-
facturing industries have achieved gradual recovery from the effects
of the Great East Japan Earthquake and devastating floods in Thai-
land. Nevertheless, with the ongoing strength of the yen, and con-
cerns about weakness in overseas economies, these industries main-
tained a high degree of caution with regard to capital investment. A
notable positive highlight was seen in our new industrial equipment
manufacturing business, which saw healthy results due to expanding
overseas demand and demand related to disaster recovery efforts.
Within this context, the Zuken Group undertook the initia-
tives described here with the ultimate goal of being “the partner
for success” for our customers.
Electronics industry marketFocusing on customers in the electronics industry, we embarked on a
simultaneous global introduction of an electrical design system we
have positioned as a new core product. This new product applies the
latest software technology to achieve outstanding performance and
a whole new level of operability.
Industrial equipment marketIn the field of industrial equipment manufacturing, we focused on
expanding sales of a product that shares 3D data for design and
manufacturing. This product uses cutting-edge technology to
reduce design and manufacturing data volumes, thereby enabling
the detailed sharing of data among organizational units and open-
ing the door to the overall optimization of design and manufactur-
ing processes.
Global market In this area of our operations, we worked to increase our sales of
wiring design systems for the manufacture of transportation and
industrial equipment, mainly in the United States and Europe. In
addition, to sustain our global business growth, we aggressively
pursued measures aimed at strengthening our organization and
securing and developing human resources.
As a result of efforts briefly described above, we recorded net sales
of ¥18,255 million, up 1.6% YoY; operating income of ¥883 million,
up 291.7% YoY; and net income of ¥1,769 million, up 508.6% YoY.
Our performance in all three areas, therefore, surpassed levels
achieved for the prior fiscal year.
Positive economic indicators include ongoing disaster recovery
efforts in Japan and Thailand, and signs of a mild economic recov-
ery. The overall picture, however, remains unpredictable due to eco-
nomic crises in Europe and slowing growth in emerging econo-
mies. Given this, the Zuken Group will seek to further expand its
operations by pursuing its business activities with even greater
One is an electrical design system we launched on a worldwide basis
during the fiscal year under review. We developed this product by
melding advanced design concepts and cutting-edge technology,
to update monozukuri for the demands of a new era. The other prod-
uct builds a common monozukuri foundation by enabling the overall
optimization of design and manufacturing processes through the
sharing of 3D data.
Rising to the demands of intensifying competition and evolv-
ing market conditions in the digital home electrical appliance and
automobile-related manufacturing industries requires the global-
ization of design and manufacturing. Furthermore, in the field of
energy to support manufacturing at companies of all types.
A solid business framework will be key to this effort. The Zuken
Group has led the world in establishing of a system for supporting
manufacturing with packaged software. We have also developed
close customer relationships through maintenance agreements and
firmly established a business model on a foundation of stable profit-
ability. In our global business, we offer products and technical
services to manufacturing companies throughout the world via our
global network.
Underlying all of this is the Zuken Group’s solid business frame-
work. Two new products will make this framework even stronger.
industrial machinery, where the adoption of IT is expected to
spread rapidly, manufacturers are attempting to build systems
that are instantly competitive by pursuing the simultaneous
adoption of IT in both design and infrastructure construction.
Identifying the diverse needs of such customers individually,
and flexibly applying our rich business framework to the task of
addressing them, we support monozukuri throughout the world,
and expand and grow our businesses by offering solutions that
are unique to the Zuken Group. Through business initiatives such
as those described here, we aim to achieve net sales of ¥19,000
million, operating income of ¥920 million, and net income of ¥650
million in our 37th business year.
As described above, changes in the monozukuri environment
have only increased the need for solutions offered by the Zuken
Group. We must not, however, forget our roots. Going forward, it is
essential that we accentuate even more firmly activities based on
our corporate philosophy, which is to “Establish a vibrant corpo-
rate culture founded upon soundness, vigor and dignity”. Looking
forward to our 37th business term, financial soundness and dignity
founded on corporate ethics will remain as important as ever.
Added emphasis, however, will be placed on vigor in proactively
advancing initiatives, and achieving tangible results with solid
proposals that are up to the challenges of the increasingly rapid
pace of change in monozukuri.
Paying returns to shareholders is one of our highest manage-
ment priorities. We therefore exercise great care in determining
the optimal level of shareholder returns to pay in light of factors
including our business performance and operating conditions.
For the fiscal year under review, we have decided to pay not only
the ordinary dividend of ¥7 per share but, in addition, a special
dividend of ¥10 per share to commemorate our 35th anniversary
and reflect our extraordinary income. The term-end dividend will
therefore come to ¥17 per share. Combined with the interim divi-
dend of ¥7 per share, the annual dividend will be ¥24 per share.
Excluding the special dividend, we intend to again pay a regular
dividend of ¥14 per share (an interim dividend of ¥7 per share and
a term-end dividend of ¥7 per share) for our 37th business term, in
accordance with our policy of paying stable returns.
Going forward, the continued understanding and support of
our shareholders will be greatly appreciated.
Aiming to win even greater trust andrecognition as a true partner
President and Representative Director
Message from the CEO
Zuken using IT Solutions to support monozukuri throughout the world
Cash dividends applicable to the period
25
10
15
20
0
5
(Yen)
2007
10.00
2008
12.00
2009
14.00
2010
14.00
2011
14.00
2012
24.00
Auto-mobiles
Aviation-related
products
Electric/electrical
parts
Broadcastequipment
Industrialequipment
Automotiveequipment
Precisionequipment
TelecommunicationsequipmentAiming to be the Partner for Success
Digital homeappliances
Agriculturalequipment
Socialinfrastructure
Medicalequipment and
devices
Constructionequipment
Transportationequipment
Printingequipment
5 6ZUKEN Inc. ANNUAL REPORT 2012

Globally. With speed.Moving forward with the development ofnew products and new markets
Greater concentration on new productsand new market initiatives
For the fiscal year under review, we set our sights on introducing
major new products in both design solutions and monozukuri
infrastructure solutions, and achieved our goals in both areas.
Businesses depending on these strategic solutions are heading
toward their moment of truth. The following is a discussion of the
organizational strategies, financial strategies, and other solution-
related matters that will be key concerns in our 37th year of operations.
(1) CR-8000: Achieve global market leadershipCR-8000 leads the world in performance and functionality and has
become the focus of considerable attention among electronics
manufacturers throughout the world. Early adopters have praised its
ability to work with the latest mounting technology, processing
speed and usability, to name just a few characteristics. Given the abil-
ity to migrate design assets over from the best-selling system CR-5000
as is, users are easily able to make the move to CR-8000. When this
happens, we become the world’s PCB CAD system provider of choice.
(2) PreSight: Using processing speed to dominate a heated marketThe market for the monozukuri common infrastructure construction
offered by PreSight is intensely competitive. PreSight is quickly gaining
attention for its innovative 3D solutions applying data compression and
other cutting-edge IT technologies unique to Zuken. We are striving to
further enhance the solution’s value, with the ultimate aim of revamping
the monozukuri environment from a management perspective. We
hope to make our 37th year of operations a year in which we come to
dominate this intensely competitive market by aggressively pursuing
sophisticated, well-conceived activities in both development and sales.
(3) Industrial equipment market: greater leveraging of market position through organizational strengtheningIn the industrial equipment market, developments related to Pre-
Sight and cabling design systems – including E3.series, which has
sold very well in Europe – are accelerating. Meanwhile, in Japan, the
marketing and sales structure for cabling design systems has been
integrated into the PreSight Business Unit to develop sales opportu-
nities in new markets. Through these measures, we will bring an even
higher level of dynamism to our pursuit of sales of PreSight products,
which incorporate mechanical design and cabling design systems.
(4) Overseas market development: further strengthening our support capabilities Having strengthened our organization, we are set to concentrate
on expanding CR-8000 sales in the United States and Europe,
while maintaining our focus on promoting E3.series sales in Asia.
We will also work to expand our business in Asia, where the elec-
tronics manufacturing industry is growing with exceptional
speed. We will do this by further enhancing our sales and support
systems, and providing products and services serving the needs
of both Japanese and local customers, in a timely manner.
(5) Active investment: judicious use of M&A and strategic partnerships to expand solutionsRelying on in-house development to supply all of the peripheral
technologies needed to address the broad range of issues manu-
facturers face carries the risk of missing opportunities. It is neces-
sary, therefore, to make investments that buy technology and time.
We have diligently kept our finances in sound condition and are
prepared to make the necessary investments. Going forward, we
will judiciously engage in M&A and strategic partnerships that will
increase our ability to rapidly grasp customer needs and new devel-
opments in monozukuri, and respond with appropriate solutions.
Though market conditions are improving, a look at economies
across the world shows that there are still more than a few reasons
to be concerned.
It is times like these, however, that demand the construction of
next-generation monozukuri environments that respond to key issues.
The more challenging the issues faced by customers, the greater the
need for our products and services. Moving forward, everyone at the
Zuken Group, with confidence and pride in our solutions and potential,
will, with vigor and positive action, rise to the challenge of solving the
issues our customers face, and produce solid results as a trusted partner.
United in the pursuit of shared goals
Jinya KatsubeCOO and Representative Director
Message from the COO
Priorities for our 37th year of operations
CR-8000: Achieve global market leadership
PreSight: Use processing speed to dominate a heated market
Industrial equipment market: Greater leveraging of market position through organizational strengthening
Overseas market development: Further strengthening of support capabilities
Active investment: Judicious use of M&A and strategic partnerships to expand solutions
123
4
5
7 8ZUKEN Inc. ANNUAL REPORT 2012
COO and Representative Director

Supporting companies wantingto move forwardKariya When we announced CR-8000, many asked why we
would do so amid such dire economic conditions. Well, conditions
were also heading downward when we announced CR-5000.
During economic slowdowns, many companies undertake
changes in their business models or manufacturing processes.
Supporting those efforts means that product announcements
take place when economic conditions are bad or worsening.
Okubo It appears that CR-8000 makes it possible to undertake
concurrent design, or to design semiconductors, packages or PCBs,
without having to set up separate design activities. In other words,
it seems to enable a manufacturing approach that is more efficient.
I think that characteristic is highly compatible with the close coordi-
nation for which Japanese culture has received so much praise
from others around the world, and I believe it could result in the
emergence of a new strength of Japanese manufacturing.
Kariya Not only in Japan. Application of CR-8000 concurrent
design and coordinated design functions has the potential to
create new monozukuri strengths wherever they are applied.
Furthering monozukuriby eliminating boundariesKariya Streamlining, emphasis on cost competitiveness,
specialization, and other factors have resulted in the dividing up
of monozukuri work, and that has resulted in boundaries between
electrical and mechanical designers, and between equipment
manufacturers and EMSs, to give just a couple of examples. These
boundaries, I believe, are hindrances to progress in monozukuri.
Zuken wants to get rid of all of these hindrances with CR-8000.
Because that entails process reform, it isn't simple. At Zuken,
though, we are inviting manufacturers to remove all the boundar-
ies at once, and to adopt a new way to organize design work –
one that fits our times – and create a new manufacturing process.
Okubo Eliminating boundaries is critical. Having said that,
though, even if the strengths of CR-8000 can be understood at a
theoretical level, there may be a substantial number of engineers
who feel some resistance to it at a gut level.
Kariya Now is the time to reassess and revamp entire manufac-
turing processes, and the ability to bring forward examination and
testing means the ability to handle more work. This may be particu-
larly true in the business-to-consumer (B2C) field, where streamlin-
ing and division of labor have been pursued to a high degree.
Okubo From a different perspective, there is less resistance in
the area of business-to-business (B2B) infrastructure work.
Kariya I think there would be less resistance to CR-8000 in
areas where there is less of a division of labor. And even in B2C, we
expect that engineers will be surprised at the possibilities CR-8000
offers, once they use it. We think that by fusing top-down and
bottom-up approaches it will become a major force for change.
Furthermore, we are hopeful that it will help to improve manufac-
turing on a global basis by promoting the development of
stronger relationships between Japanese manufacturers and their
counterparts overseas.
Okubo I have high expectations for Zuken. And in my position
as Editor-in-Chief of an industry magazine, I would like to do all I
can to benefit all monozukuri industries.
could not be adequately
covered through vertical
integration. We then began
a phased introduction of
next-generation tools such
as System Planner, a concept
design tool, and Design Gateway, a new circuit design tool. In 2011,
when we perfected Design Force, a circuit board design tool, we
had all the pieces needed for a next-generation platform. At that
point, we had developed an environment allowing equipment,
module and device manufacturers to collaborate in product
development, and introduced it in the form of CR-8000.
Okubo What are the key characteristics of Design Force?
Kariya Design Force is the most effective electronic design
automation (EDA) system available today. Over the past 10 years,
mechanical design CAD systems have been updated with the
latest hardware and 3D graphics technologies. Electrical design
CAD systems, on the other hand, are still using old architecture
that engineers in their 40s or 50s would be comfortable with. But
it doesn't inspire young engineers who play 3D computer games
and our expert users of iPhones and iPads.
Okubo So, inspiring young engineers is a part of Zuken’s
development aims. There is definitely a sense that the younger
generation is comfortable working with a user interfaces applying
high-speed graphics and a touchpad. And CR-8000 offers strong
links to PDM/PLM systems and other engineering IT infrastructure
environments, doesn’t it?
Kariya In the 2000s, we had a lot of users telling us they wanted
EDA and IT infrastructure to be linked. Over the past 10 years, there
have been significant advances in IT infrastructure for managing
design and manufacturing data, but it can’t be said that integral
connections to electrical CAD systems have been included in all
cases. Seeing that that would stand in the way of overall manufactur-
ing optimization, we provided in CR-8000 a framework for linking to
IT infrastructure. Furthermore, responding to the increasing complex-
ity of electronic equipment manufacturing, we became the first in
the industry to enable design and testing of entire systems, ranging
from semiconductors, to IC packages and PCBs.
Issues confronting monozukuri todayOkubo Foreign semiconductor manufacturers have told me
that though they still have great expectations for the Japanese
market, Japanese equipment manufacturers seem to have lost
confidence. They have also said that there are growing expecta-
tions for equipment manufacturers to come up with new ideas.
Kariya Twenty to 30 years ago, demand for Zuken products
came overwhelmingly from Japanese equipment manufacturers.
More recently, though, that demand has been displaced by
demand from Japanese module and device manufacturers. And
at the same time, we have seen increasing demand from equip-
ment manufacturers in the United States, Europe, and other parts
of Asia. This seems to suggest a high level of confidence among
domestic module and device manufacturers, global competitive-
ness in component technologies, and the creation of added value.
Meanwhile, it appears that equipment manufacturers are still
going after overseas markets aggressively.
Okubo Module and device manufacturers are doing well,
aren’t they.
Kariya I think what we’re seeing is that products have reached
their limits in terms of downsizing and packing more components
into tighter spaces, and that that is driving the need to focus on
the practicality of component technologies in implementing new
ideas. When vertical integration was the norm in manufacturing, it
was enough to focus on implementing your own ideas from the
component technology level. Now, however, there isn’t enough
time or money to do that and outside cooperation is a must. That’s
especially true in the area of consumer products.
Okubo When it comes to device manufacturers, the breadth of
bases that need to be covered definitely appears to have widened,
especially recently. Among other things competitors need to be
well-versed in materials and to be service-oriented. The center of
gravity in innovation has shifted away from equipment manufactur-
ers and toward module and device manufacturers. Does Zuken’s new
CR-8000 product reflect this trend?
CR-8000 made for current demandsKariya The concept behind CR-5000, an earlier version released in
1994, was vertical integration. From around the year 2000, however,
we started to hear from customers that they wanted things that
Conversation
Monozukuri that overcomes boundariesAmid unfavorable economic conditions, one might assume a bleak future for monozukuri industry. Countless monozukuri companies, however, have had a history of overcoming similar crises time and time again.
We invited Satoshi Okubo, Editor-in-Chief of Nikkei Electronics – Japan’s leading technology magazine providing the latest information for devel-opers and designers – to discuss critical manufacturing challenges and solutions with Kazuhiro Kariya, a Zuken Inc. Director and Chief Techni-cal officer.
Satoshi OkuboEditor-in-Chief of Nikkei Electronics,
Nikkei Business Publications
Kazuhiro KariyaDirector and Chief Technical Officer,
Zuken Inc.
After graduating from Osaka University’s School of Engineering Science in 1991, Mr. Okubo took a position at Fujitsu, where he continued to work until 2000, when he joined Nikkei Business Publications. Serving first as a member of the editorial staff of Nikkei Electronics, he later became the Editor -in-Chief of Nikkei Microdevices and Deputy Editor-in-Chief of Nikkei Electronics, before taking on his current position in 2012. During his career, Mr. Okubo has covered areas including displays, light-emitting devices, devices employing new materials and their applications, and vehicle-mounted electronic devices.
Mr. Kariya joined Zuken in 1986 and served as CR-5000 Project Leader and Leader of the Global Engineering and Technology Center before taking on his current position in 2005. Overseeing global product develop-ment and technical support, Mr. Kariya concentrates on making the most of strengths in development teams based in Japan, the United Kingdom and Germany, and bringing to market the latest IT solutions.
Feature
10ZUKEN Inc. ANNUAL REPORT 20129

Offering cutting-edge mounting technology, we use the latest graphics technology from the world of computer games to render complex board structures in ways that are immediately comprehensible. We have also created a work environment that uses the touch panel technology popular-ized in smartphones to allow engineers to interact intuitively with their work and reflect their ideas directly in designs.
Any more, it is not uncommon for designs created in Japan to be turned into products overseas by an electronics manu-facturing service (EMS) and shipped to locations through-out the world. To optimize this global division of labor, CR-8000 offers an environment that supports the secure exchange of data between various locations over networks built to the latest specifications. CR-8000 overcomes national boundaries to optimize monozukuri work.
With increasing product sophistication and diversification making design work ever-more complex, communication and collaboration among design experts in various fields is now essential. CR-8000 is the first design suite to eliminate boundaries separating these experts and enable collaborative design work on semiconductors, semicon-ductor packages, and PCBs. CR-8000 offers an immediate increase in design efficiency.
Supporting companies wantingto move forwardKariya When we announced CR-8000, many asked why we
would do so amid such dire economic conditions. Well, conditions
were also heading downward when we announced CR-5000.
During economic slowdowns, many companies undertake
changes in their business models or manufacturing processes.
Supporting those efforts means that product announcements
take place when economic conditions are bad or worsening.
Okubo It appears that CR-8000 makes it possible to undertake
concurrent design, or to design semiconductors, packages or PCBs,
without having to set up separate design activities. In other words,
it seems to enable a manufacturing approach that is more efficient.
I think that characteristic is highly compatible with the close coordi-
nation for which Japanese culture has received so much praise
from others around the world, and I believe it could result in the
emergence of a new strength of Japanese manufacturing.
Kariya Not only in Japan. Application of CR-8000 concurrent
design and coordinated design functions has the potential to
create new monozukuri strengths wherever they are applied.
Furthering monozukuriby eliminating boundariesKariya Streamlining, emphasis on cost competitiveness,
specialization, and other factors have resulted in the dividing up
of monozukuri work, and that has resulted in boundaries between
electrical and mechanical designers, and between equipment
manufacturers and EMSs, to give just a couple of examples. These
boundaries, I believe, are hindrances to progress in monozukuri.
Zuken wants to get rid of all of these hindrances with CR-8000.
Because that entails process reform, it isn't simple. At Zuken,
though, we are inviting manufacturers to remove all the boundar-
ies at once, and to adopt a new way to organize design work –
one that fits our times – and create a new manufacturing process.
Okubo Eliminating boundaries is critical. Having said that,
though, even if the strengths of CR-8000 can be understood at a
theoretical level, there may be a substantial number of engineers
who feel some resistance to it at a gut level.
Kariya Now is the time to reassess and revamp entire manufac-
turing processes, and the ability to bring forward examination and
testing means the ability to handle more work. This may be particu-
larly true in the business-to-consumer (B2C) field, where streamlin-
ing and division of labor have been pursued to a high degree.
Okubo From a different perspective, there is less resistance in
the area of business-to-business (B2B) infrastructure work.
Kariya I think there would be less resistance to CR-8000 in
areas where there is less of a division of labor. And even in B2C, we
expect that engineers will be surprised at the possibilities CR-8000
offers, once they use it. We think that by fusing top-down and
bottom-up approaches it will become a major force for change.
Furthermore, we are hopeful that it will help to improve manufac-
turing on a global basis by promoting the development of
stronger relationships between Japanese manufacturers and their
counterparts overseas.
Okubo I have high expectations for Zuken. And in my position
as Editor-in-Chief of an industry magazine, I would like to do all I
can to benefit all monozukuri industries.
could not be adequately
covered through vertical
integration. We then began
a phased introduction of
next-generation tools such
as System Planner, a concept
design tool, and Design Gateway, a new circuit design tool. In 2011,
when we perfected Design Force, a circuit board design tool, we
had all the pieces needed for a next-generation platform. At that
point, we had developed an environment allowing equipment,
module and device manufacturers to collaborate in product
development, and introduced it in the form of CR-8000.
Okubo What are the key characteristics of Design Force?
Kariya Design Force is the most effective electronic design
automation (EDA) system available today. Over the past 10 years,
mechanical design CAD systems have been updated with the
latest hardware and 3D graphics technologies. Electrical design
CAD systems, on the other hand, are still using old architecture
that engineers in their 40s or 50s would be comfortable with. But
it doesn't inspire young engineers who play 3D computer games
and our expert users of iPhones and iPads.
Okubo So, inspiring young engineers is a part of Zuken’s
development aims. There is definitely a sense that the younger
generation is comfortable working with a user interfaces applying
high-speed graphics and a touchpad. And CR-8000 offers strong
links to PDM/PLM systems and other engineering IT infrastructure
environments, doesn’t it?
Kariya In the 2000s, we had a lot of users telling us they wanted
EDA and IT infrastructure to be linked. Over the past 10 years, there
have been significant advances in IT infrastructure for managing
design and manufacturing data, but it can’t be said that integral
connections to electrical CAD systems have been included in all
cases. Seeing that that would stand in the way of overall manufactur-
ing optimization, we provided in CR-8000 a framework for linking to
IT infrastructure. Furthermore, responding to the increasing complex-
ity of electronic equipment manufacturing, we became the first in
the industry to enable design and testing of entire systems, ranging
from semiconductors, to IC packages and PCBs.
Issues confronting monozukuri todayOkubo Foreign semiconductor manufacturers have told me
that though they still have great expectations for the Japanese
market, Japanese equipment manufacturers seem to have lost
confidence. They have also said that there are growing expecta-
tions for equipment manufacturers to come up with new ideas.
Kariya Twenty to 30 years ago, demand for Zuken products
came overwhelmingly from Japanese equipment manufacturers.
More recently, though, that demand has been displaced by
demand from Japanese module and device manufacturers. And
at the same time, we have seen increasing demand from equip-
ment manufacturers in the United States, Europe, and other parts
of Asia. This seems to suggest a high level of confidence among
domestic module and device manufacturers, global competitive-
ness in component technologies, and the creation of added value.
Meanwhile, it appears that equipment manufacturers are still
going after overseas markets aggressively.
Okubo Module and device manufacturers are doing well,
aren’t they.
Kariya I think what we’re seeing is that products have reached
their limits in terms of downsizing and packing more components
into tighter spaces, and that that is driving the need to focus on
the practicality of component technologies in implementing new
ideas. When vertical integration was the norm in manufacturing, it
was enough to focus on implementing your own ideas from the
component technology level. Now, however, there isn’t enough
time or money to do that and outside cooperation is a must. That’s
especially true in the area of consumer products.
Okubo When it comes to device manufacturers, the breadth of
bases that need to be covered definitely appears to have widened,
especially recently. Among other things competitors need to be
well-versed in materials and to be service-oriented. The center of
gravity in innovation has shifted away from equipment manufactur-
ers and toward module and device manufacturers. Does Zuken’s new
CR-8000 product reflect this trend?
CR-8000 made for current demandsKariya The concept behind CR-5000, an earlier version released in
1994, was vertical integration. From around the year 2000, however,
we started to hear from customers that they wanted things that
!
Mechanicaldesigner
PCB designer Semiconductor package designer
Semiconductordesigner
Concept
Design
PrototypeVolumeproduction
Inspection
Shipment
Next-generation work environment
incorporating touchpad and
other technologies
Speedy 3D rendering
High-speed data processing
Suited to cutting-edge mountinging technology
User interacting with the CR-8000 touchpad interface
Creative space for engineers
Latest mounting technology eliminates boundary-separating ideas1
Division of labor on a global scale
Overcoming national boundaries at all stages, from design to manufacturing3
Collaborative design environment
Eliminating boundaries separatingdesign experts2
Engineers are confronted by many boundaries in performing monozukuri-related work. CR-8000 offers a next-generation monozukuri process that eliminates all of those boundaries and
allows engineers to make the most of their creative capabilities.
Toward boundary-free manufacturing
Eliminating all design and manufacturing boundaries and promoting true global monozukuri
Feature
11 12ZUKEN Inc. ANNUAL REPORT 2012
making the most ofmanufacturing capabilities

ASIA
EUROPE
AMERICA
ZUKEN Inc.
ZUKEN TAIWAN Inc.
ZUKEN Inc. Beijing Rep. Office
ZUKEN Inc. Shenzhen Rep. Office
ZUKEN SINGAPORE Pte. Ltd.
ZUKEN (SHANGHAI) TECHNICAL CENTER Co., Ltd.
ZUKEN KOREA Inc.
ZUKEN S.r.l.
ZUKEN S.A.
ZUKEN GmbH(Sales Office Benelux)
ZUKEN Ltd.ZUKEN UK Ltd.ZUKEN Group Ltd.
ZUKEN GmbH(European Headquarters)(EMC Technology Center)ZUKEN E3 GmbH
ZUKEN USA Inc.
Sales office
Though the domestic market in Japan remained very cautious
about capital investment during the fiscal year under review, the
division of labor in monozukuri, particularly in the area of digital
home electrical appliances in Japan and other Asian countries, took
on even greater momentum. Meanwhile, the adoption of
monozukuri-related IT gained momentum in the field of industrial
equipment – a promising new market.
In our 37th year of operations, we will advance initiatives aimed
at using CR-8000 Design Force to build a next-generation electrical
design environment. As part of that effort, we will establish Modul-
eStation, a new website (refer to the diagram, right) that will allow
designers to download complete data on module components,
greatly simplifying this ordinarily troublesome task. With this data in
hand, designers will be free to use it with CR-8000 and other design,
analysis, and testing tools. For non-consumer industries, we will
make the Zuken Group an even more essential presence through
initiatives like the offering of DS-2 packaged products tailored to the
needs of particular industries and the introduction of a service that
will provide end-of-life (EOL) component information.
Among monozukuri-based solutions, sales of the visual BOM
product introduced last year have steadily grown. High praise has
been received in particular for the use of 3D data and BOM
together in the upstream processes of cost planning and product
configuration. On a different front, XVL Studio Z has enjoyed
increasingly rapid adoption by a wide range of companies because
of its display speed aided by data compression, and the addition of
various testing functions to its offerings. Moving forward, we will
expand and enhance solutions for searching, designing, assessing,
and communicating to gain even greater market penetration.
As engineering becomes ever more complicated amid the globaliza-
tion of manufacturing, the Zuken Group solutions are acclaimed for
their ability to lighten incidental work and smooth communications
that have a tendency to break down. Now, and in the future, the
Zuken Group is committed to supporting Japan’s manufacturing
industries by developing monozukuri environments that facilitate the
exercise of human creativity.
Promoting module design with CR-8000 and ModuleStation
Searching, designing, assessing, communicating: further enhancement of solutions Advancing IT solutions to make the most of
creative ability
Japanese market
Providing optimal solutions for the electronic products, industrial equipment, and other new marketsThe Zuken Group, working through group companies to accurately grasp the needs of markets in North America,
Europe, and Japan and other parts of Asia, provides solutions to electronics and a wide range of other manufactur-ers. The products we announced during the fiscal year under review – the CR-8000 next-generation electronic equip-ment design system, PreSight and DS-2 systems comprising a monozukuri foundation, and E3.series cabling design system – have all won high acclaim. Having been adopted by global leaders in various industries, these products are now helping these companies achieve the optimal monozukuri they seek.
Providing solutions to customers throughoutthe world as the best possible monozukuri partner
Overview by area
Diagram of module content applicationwith ModuleStation
Component referenceinformation
Concept designsupport environment Circuit board design CADCircuit design CAD
Transmission line analysis EMC testing
Various dataconversions
Data for variousdesign projects
Download necessary content all at once
Use as-is
Zuken has developed an integrated process that begins with the acquisition of module component data and extends through the use of various tools for design work.
Zuken module download site
13 14ZUKEN Inc. ANNUAL REPORT 2012
European and North American markets
Reflecting upon the success of 2011-2012The outlook in the western market is very positive; our overall
business has been growing and achieving higher revenue and
profitability than ever before. With the effects of the global economic
downturn behind us, the European market is recovering well,
particularly in Germany and France.
North America is Zuken’s largest growth area, and we are seeing
the results of an aggressive growth plan, with revenue up by almost
one third compared to the previous financial year. This has been
strengthened by major new customers in both the PCB design and
wire harness areas.
We have also had success in expanding outside our traditional
geographic areas, with our business channel in Russia bearing fruit in
the Russian aircraft industry.
Strategic new customers in the automotive, industrial, and
communications industries show our continued strength. Diversifica-
tion across key industries such as automotive, industrial, mobile
communications, transportation and machinery protects us against
slow periods in individual industries.
Outlook for 2012-2013 and beyondWe expect to see continued growth in the coming year, and will
continue to focus on our core areas.
In strategic terms, with the additional capabilities of CR-8000,
we are expanding our PCB layout and IC packaging presence by
capturing system planning and system engineering business.
Helping companies achieve overall cost savings by optimizing the
early stages of the design cycle is high on our agenda.
Zuken’s unique position in the market with System Planner – part
of CR-8000 – is a key element in this strategy. It is the only product
planning solution for electronic design available today. We expect to
reach important new customers, as well as increase our presence
among existing customers as they adopt this new environment.
Cable, fluid, and wire harness design forms nearly half of our
business, and it will continue to expand globally. We are increasing
the emphasis on industry-focused solutions across a broad set of
industries, from machinery to transportation to plant design. This will
bring more productivity to our existing users and broaden our
appeal to new customers.
Strengthening our data management (ePLM) presence with new
products, and expanded sales and marketing efforts, will support our
entire electronic and electrical design portfolio.
Strategic diversification achievedcontinual success in an economic downturn
During the fiscal year under review, business conditions in the ASEAN
countries were strong, and European companies were particularly
strong buyers of EDA solutions and client services. Meanwhile, in East
Asia, orders from local companies generally trended lower. However,
with China bucking the trend with strong results, sales for the region
were up substantially for the year. Conditions and business perfor-
mance for particular markets are discussed in greater detail below.
ChinaIn China, business performance remained solid, despite impacts from
the European financial crisis, and sales rose by 62%. Going forward,
we will enhance sales and support systems to expand business with
not only Japanese companies, but also local companies. To tap into
demand for cabling design systems, we will concentrate on E3.series
business during the 37th year of operations and aggressively work to
expand sales channels via sales representatives.
Taking a long-term perspective, we have been working to
develop partners in academia. One result was holding an introduc-
tory course on how to use CR-5000 at the University of Electronic
Science and Technology of China (UESTC) – one of China’s key higher
education institutions.
TaiwanIn Taiwan, we have entered into business discussions with multiple
ODM*1 companies and are progressing toward a stage that looks
very promising for business. We will also work to promote business
relationships built on collaboration involving both Taiwanese and
Chinese companies.
South KoreaIn South Korea, which is highly dependent on exports and where
there have been strict controls on capital investment, there are high
expectations for CR-8000. Considering also the strong interest in the
XVL Studio Z design review environment, business performance is
expected to rise going forward.
ASEAN RegionThe ASEAN region is characterized by breadth in terms of geography
and products handled. Customers there include not only Japanese
but also United States, European, and local companies. Sales rose 16%
on the year, with E3.series posting an explosive growth of 57%. Plans
for the future include initiatives targeting India’s enormous market.
Asian markets
Ongoing solid performance in Chinamoving ahead to invigorate all of Asia with CR-8000 and E3.series
*1 ODM: Original design manufacturer. A company offering ODM services, designs and manufactures products that will be sold under the brand of a client company.
Overview by area
At the CPCA Show, held at the Shanghai World Expo Exhibition and Convention Center, Zuken gave presentations on three different topics. The presentation on CR-8000 attracted a large audience representing many regions of China. The level of interest received has greatly increased our hopes for future business.
March 13-15, 2012, Shanghai
CPCA*2 Show
As part of our long-term efforts to develop partners in academia, Zuken held an introductory course on how to use CR-5000. The course was given in Sichuan Province at the University of Electronic Science and Technology of China, one of China’s key higher education institutions. Through CR-5000, we aim to contribute to research and education in the field of advanced electronics and to the development of electronics engineers.
November 3, 2011, Sichuan Province
CR-5000 Introductory Course
*2 CPCA: China Printed Circuit Association. An organization for China’s printed circuit board industry. The CPCA is equivalent to the JPCA in Japan.
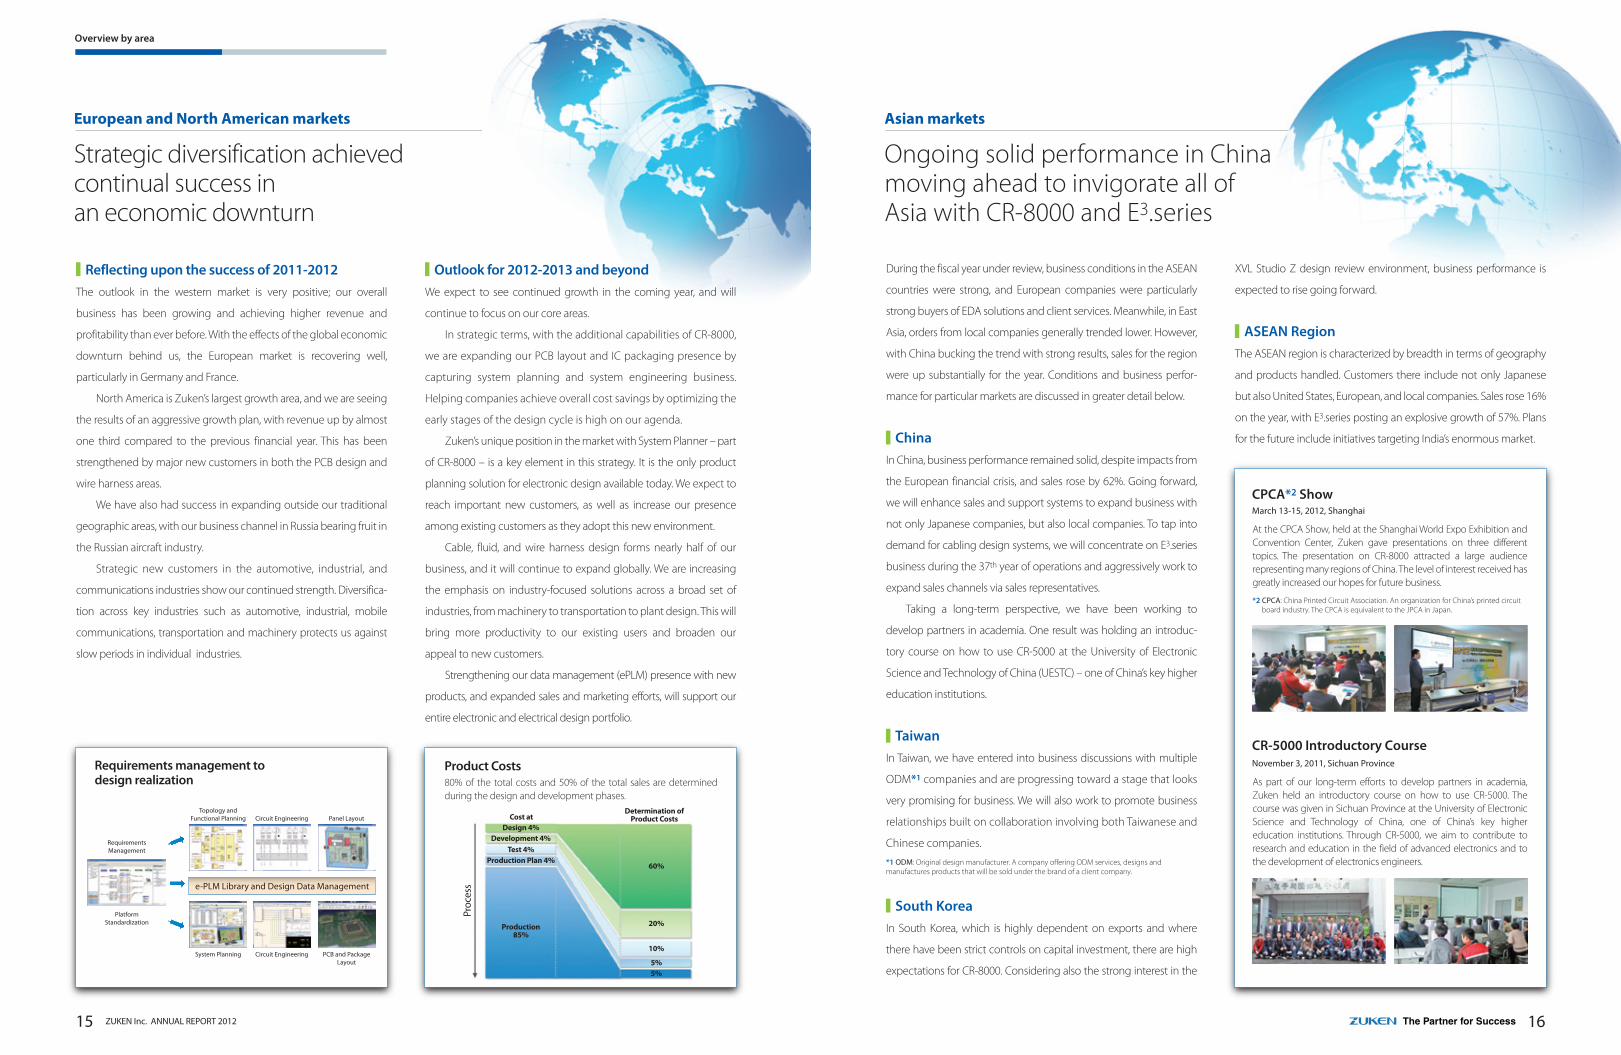
Product CostsRequirements management todesign realization 80% of the total costs and 50% of the total sales are determined
during the design and development phases.
1615 ZUKEN Inc. ANNUAL REPORT 2012
Proc
ess
Cost atDetermination of
Product CostsDesign 4%
Development 4%Test 4%
Production Plan 4%
Production85%
60%
20%
10%
5%5%
Topology andFunctional Planning Circuit Engineering Panel Layout
System Planning
PlatformStandardization
RequirementsManagement
Circuit Engineering PCB and PackageLayout
e-PLM Library and Design Data Management

ZUKEN Inc. ANNUAL REPORT 201217 18
ZUKEN Inc. and Consolidated Subsidiaries
Management’s Discussion and AnalysisFinancial Section
Zuken Inc. and Consolidated Subsidiaries Years ended March 31
Management’s Discussion and Analysis ····································· 18
Consolidated Balance Sheets ···························································· 23
Consolidated Statements of Income ············································ 25
Consolidated Statements of Comprehensive Income ······· 26
Consolidated Statements of Changes in Net Assets ··········· 27
Consolidated Statements of Cash Flows ···································· 28
Notes to Consolidated Financial Statements ·························· 29
Independent Auditors’ Report ·························································· 40
Notes: 1. For the convenience of the reader, the above six-year summary is presented in Japanese yen and also in US dollars by arithmetically translating all Japanese yen amounts at ¥82 to US$1, the exchange rate in effect at March 31, 2012.
2. Total shareholders’ equity in the above table represents the total of shareholders' equity and valuation and translation adjustments in the consolidated balance sheets. 3. Net income (loss) per share is computed based upon the weighted-average number of shares of common stock outstanding during each fiscal year. 4. Diluted net income per share for fiscal 2007 is not presented because the Company had no potential common stock equivalents with a dilutive effect for the year ended
March 31, 2007. 5. Diluted net income per share for fiscal 2010 is not presented because the Company recorded net loss, though it had potential common stock equivalents. 6. Diluted net income per share for fiscal 2012 is not presented because the Company had no potential common stock equivalents for the year ended March 31, 2012.
Millions of yen
Thousands of U.S. dollars
(Note 1)
2007 2008 2009 2010 2011 2012 2012
For the Year:Net sales ············································································································ ¥19,163 ¥22,019 ¥19,847 ¥17,099 ¥17,969 ¥18,255 $222,622Cost of sales ···································································································· 4,629 5,370 4,740 4,511 4,841 4,759 58,037Selling, general and administrative expenses ··························· 12,145 13,810 13,647 12,961 12,903 12,613 153,817Operating income (loss) ········································································· 2,389 2,839 1,460 (373) 225 883 10,768 Income(loss) before income taxes and minority interests ·············· 2,475 2,602 1,657 (195) 346 3,386 41,293 Net income (loss) ························································································· 1,442 1,757 1,214 (91) 291 1,769 21,573
At Year-End:Total assets ······································································································ ¥36,689 ¥37,686 ¥35,534 ¥36,350 ¥35,780 ¥38,270 $466,707Total shareholders' equity (Note 2) ·················································· 26,032 28,157 27,913 27,765 26,480 27,934 340,658
Yen U.S. dollars
Per Share of Common Stock:Net income (loss) (Note 3) ····································································· ¥ 55.70 ¥ 67.86 ¥ 47.02 ¥ (3.59) ¥ 11.63 ¥ 76.07 $ 0.928 Diluted net income (Note 4) ································································ − 67.71 46.88 − 11.21 − −Cash dividends applicable to the period ····································· 10.00 12.00 14.00 14.00 14.00 24.00 0.293
CONSOLIDATED SIX-YEAR SUMMARY
Operating ResultsResults for the consolidated fiscal year under review reflected
solid performances in sales of information management solutions,
mainly in the industrial machinery manufacturing and other new
markets, and sales of wiring design systems for transportation and
industrial machinery in the U.S. and European markets. Solid results
in these areas overcame the effects of ongoing yen appreciation,
fears of economic downturns in overseas markets, and the cautious
stance of the Zuken Group customers toward capital investment.
As a result, net sales came to ¥18,255 million (up 1.6% YoY). Gross
profit rose to ¥13,496 million (up 2.8% YoY) because of the increase
in net sales and lower cost of sales. Selling, General and Adminis-
trative Expenses fell to ¥12,613 million (down 2.2% YoY) following
efforts to hold expenses down. Operating income rose to ¥883 mil-
lion (up 291.7% YoY). The above-mentioned results exceeded the
level achieved in the previous fiscal year.
Net other income (Other income minus Other expenses)
amounted to ¥2,503 million. The breakdown of Other income
were interest and divided income of ¥36 million, gain on sales of
subsidiaries and affiliates’ stocks of ¥2,632 million, amortization
of negative goodwill of ¥50 million, gain on sales of investment
securities of ¥40 million and equity in gain of affiliated companies
of ¥12 million.
Other expenses were loss on insurance cancellation of ¥112
million, loss on sales of investment securities of ¥80 million, for-
eign exchange loss of ¥67 million and loss on valuation of invest-
ment securities of ¥66 million.
As a result of the foregoing, net income before income taxes
and minority interests of ¥3,386 million was posted, along with
net income for the term under review after deducting current and
deferred income taxes and minority interest of ¥1,769 million(up
508.6% YoY). Net income per share was ¥76.07 (compared with
¥11.63 YoY).
Financial PositionTotal assets at the end of the consolidated fiscal year under review
were ¥38,270 million, up ¥2,490 million (up 7.0% YoY). Current
assets increased by ¥3,344 million, to ¥27,606 million (up 13.8%
YoY), and fixed assets (property and equipment, at cost and in-
vestments and other non-current assets) decreased by ¥854 mil-
lion, to ¥10,664 million (down 7.4% YoY). The increase in current
assets was due principally to a ¥3,701 million rise in cash and cash
equivalents resulting from short-term investments of proceeds
from the sale of subsidiaries and affiliates’ stocks. Property and
equipment decreased by ¥158 million due to depreciation. In-
vestments and other non-current assets decreased by ¥1,207 mil-
lion due to factors such as the sale of shares of an affiliate, reversal
of insurance reserves, while other intangible assets increased by
¥511 million mainly because of goodwill related to the purchase
of additional equity of a consolidated subsidiary.
Total liabilities at the end of the consolidated fiscal year under
review increased by ¥1,180 million, to ¥9,899 million (up 13.5%
YoY). Current liabilities increased by ¥1,181 million, to ¥6,871 mil-
lion (up 20.7% YoY). Long-term liabilities at the end of the fiscal year
were nearly the same from the last fiscal year, at ¥3,028 million. The
increase in current liabilities was due principally to a ¥1,127 million
increase in income taxes payable stemming from higher income
before income taxes and minority interests.
Net assets at the end of the consolidated fiscal year under
review amounted to ¥28,371 million, up ¥1,310 million from the
previous consolidated fiscal year. Shareholders’ equity increased
by ¥1,443 million, to ¥27,862 million, primarily because of the re-
cording of ¥1,769 million in net income and subsequent increase
of ¥1,443 million in retained earnings. Accumulated other com-
prehensive income increased by ¥11 million as valuation gains on
other investment securities increased net unrealized holding gains
on securities by ¥53 million, and because of a ¥43 million decline in
the foreign currency translation adjustments account for overseas
consolidated subsidiaries. Minority interests decreased by ¥144 mil-
lion, to ¥437 million due to an increase in losses posted by some
consolidated subsidiaries and the exclusion of a subsidiary from
consolidation following the sale of its shares. As a result, the share-
holders’ equity ratio decreased by 1.0 percentage point from 74.0%
at the end of the previous consolidated fiscal year, to 73.0%.
Analysis of Shareholders’ Equity Resources andCash LiquidityAs recorded in Cash and Cash Equivalents in the Consolidated
Overview of Fiscal 2012

ZUKEN Inc. ANNUAL REPORT 201219 20
Management’s Discussion and Analysis
Statements of Cash Flows, the Zuken Group’s balance of funds at
the end of the fiscal year under review increased by ¥3,701 million
from the end of the previous fiscal year to ¥12,463 million. As such,
the Zuken Group considers its liquidity to be at a sufficient level.
Funds providing the operating capital necessary for the
Zuken Group to conduct its future business activities and carry
out capital investments are obtained from operating activities
and internal funds.
In terms of fund management, the Zuken Group gives the
utmost consideration to security, while paying particular heed to
such factors as credit exposure and interest rates. The Zuken Group
therefore invests in financial instruments considered to have the
least loss potential.
Turning to the financial status of the Zuken Group, net cash
provided by operating activities came to ¥1,467 million (up ¥510
million YoY). Major factors behind this increase included net in-
come of ¥1,769 million (up ¥1,478 million YoY) and depreciation
and amortization of ¥730 million (up ¥43 million YoY). These more
than offset uses of cash including a gain on sale of stocks of sub-
sidiaries and affiliates of ¥2,632 million (up ¥2,631 million YoY).
Net cash provided by investing activities came to ¥2,627 mil-
lion (decrease of ¥238 million from previous year ). The main fac-
tors contributing to this increase included a ¥428 million decrease
in time deposits (increase of ¥74 million from previous year) and
¥3,220 million in proceeds from the sale of affiliate shares (up
¥3,216 million YoY). The main factors contributing to this decrease
included the expenditure of ¥665 million on the acquisition of
tangible and intangible fixed assets (up ¥156 million YoY) and ¥632
million for the purchase of subsidiaries equity.
Net cash used in financing activities came to ¥332 mil-
lion (down ¥1,499 million YoY). This increase was mainly due
to the payment of ¥326 million cash dividends paid (down
¥28 million YoY).
OutlookDespite gradual recoveries from last year’s earthquake disaster
and flooding, the economic environment is likely to remain un-
certain because of a worsening of the economic crisis in Europe
and concerns about slowing growth in emerging economies.
Against that background, the Zuken Group will strive to more
proactively pursue its business activities and further expand its
operations, so we can offer optimal solutions to all businesses in
the field of manufacturing.
Factors in the Zuken Group’s operations and accounting that
have the potential to exert a significant influence on investors’
decisions include, but are not limited to, those set out below.
Forward-looking statements in the text are based on the
judgment of the Zuken Group’s management as of March 31,
2012, the end of the fiscal year under review.
(1) Operating in a circumscribed marketThe core business of the Zuken Group is the provision of solutions
that increase the efficiency of product design and manufactur-
ing primarily to the electronics and automobile manufacturing
industries. This means that the group’s performance may some-
times be affected by business conditions in such manufacturing
industries and by trends in capital investment. The Group is striv-
ing to expand its operations by tackling promising new markets
and technological domains. However, if performance and capital
investment in the electronics and automobile manufacturing
industries remain weak, it is possible that the performance of the
Zuken Group will be affected.
(2) Developing solutionsTo provide the optimum solutions for its customers’ needs, the
Zuken Group must develop new products that reflect the lat-
est trends and technologies while remaining committed to
strengthening its own capabilities. The Group must focus on
improvements in quality and ensure thoroughgoing quality
control, employing systems that prevent defects and ensure
swift response and correction should defects emerge. However,
if development does not proceed according to plan, we run
the risk of losing opportunities or delaying the development of
businesses. When there is a major defect in a new product, not
only do we bear the burden of remedying it and making good
our guarantee against defects, we also run the risk of losing the
confidence of our customers.
(3) Intellectual property rightsAs the Zuken Group develops and extends its solutions business
using computer technology and IT, maintaining the security of
copyrights, patents, trademarks, and other intellectual property
has become extremely important. At the same time, because
obtaining such protections requires an investigation by govern-
ment organizations, it is not a foregone conclusion that they will
be forthcoming. The Zuken Group exercises due care to guard
against infringement on third-party intellectual property rights
during the course of its product development operations, but
in actual practice the research required to ensure that Zuken
Group products do not infringe on the intellectual property
rights of any other company can be very arduous. If the Zuken
Group were to infringe on the intellectual property rights of a
third party in its products, technology, or trademarks, there is a
risk that payment of royalties or damages might be required, or
that we could be ordered to stop using patented technology.
(4) Alliances with capable partner firmsTo build a solid business base and move into new businesses, the
Zuken Group has forged long-term product development and
marketing ties with many capable partner firms. However, there is
a risk that these ties could be broken if these partner firms suffer
bankruptcy, are acquired, or change their strategic objectives. If a
number of alliances or important alliances are dissolved, it could
have an effect on the performance of the Zuken Group.
(5) Establishing and acquiring subsidiaries, and forging capital tiesTo expand and reinforce businesses, the Zuken Group establishes
subsidiaries and affiliates as needed, establishes capital ties with
friendly firms, and acquires capable firms. However, there is always a
risk that such measures may not have the anticipated effect on per-
formance, or that the cost burden could balloon. In addition, if the
performance or financial position of subsidiaries or affiliates deterio-
rates, it could have an effect on the Zuken Group’s performance.
(6) Expansion of overseas operationsThe Zuken Group is developing businesses in the United States,
and in various countries in Europe and Asia. When operating in
overseas markets, a company faces risks in connection with:●Sudden change in political or economic environments●Changes in exchange rates●Unforeseen changes in statutes or regulations●Difficulty securing human resources●Terrorism, war, infectious diseases or other social unrest.
Any of these poses a risk of affecting the performance of the
Zuken Group.
(7) Safeguarding of industrial secrets and personal informationIn the course of the Zuken Group’s systems development, consult-
ing, inspection and support operations, the Group personnel has
access to customers’ design data, information on new products,
and other industrial secrets. The Group is also in possession of large
volumes of personal information on customers, shareholders and
employees. To safeguard this information, the Zuken Group is de-
ploying internal information systems, entering into non-disclosure
agreements, formulating internal regulations and guidelines, and
conducting thorough employee training in information manage-
ment. However, in the unlikely event of a leak of industrial secrets
or personal information, the Zuken Group could become liable for
damages and could suffer harm to its reputation. This could affect
the performance of the Zuken Group.
(8) Liabilities and expenses for severance and retirement benefitsZuken and certain consolidated subsidiaries within the Group ad-
opted unfunded defined benefit plans for employees’ severance
and retirement, while certain consolidated subsidiaries overseas
adopted unfunded defined benefit plans for pension plans. In
the event of changes in calculation methods for liabilities and
expenses for severance and retirement benefits, deteriorations
in the performance of pension fund management or changes
in legal systems and accounting standards regarding severance
and retirement benefits, the Group’s liabilities and expenses may
increase. Should the liabilities and expenses exceed the Com-
pany’s reserves for them, the Group’s overall performance will be
adversely affected.Note: The fixed benefit-type pension system in place at subsidiaries operating in the United
Kingdom was frozen and changed to a defined contribution pension plan from April 2007 onward. Thus, the above-mentioned risks with regard to fixed benefit-type pension plans at these U.K. subsidiaries are items associated with retirement benefit expenses for service prior to freezing the former pension system.
Business Risks and Other Risks

ZUKEN Inc. ANNUAL REPORT 201221 22
Management’s Discussion and Analysis
(9) Natural disastersThe Zuken Group is engaged in business activities in Japan and
a number of other countries. The Group is exercising due care in
its preparations for natural disasters, but the risk of a major earth-
quake, fire or other catastrophe at a business facility causing sig-
nificant destruction cannot be eliminated. In such an occurrence,
operations at business locations affected could be halted perma-
nently or temporarily, resulting in significant monetary losses and
affecting the performance of the Zuken Group.
Important management agreements, etc.(1) On August 8, 2011, Zuken Inc. (the Company) entered into a
tender offer agreement with Arrow Chip One Stop Holdings GK
(Arrow) in which the Company agreed to sell, under the terms of
the tender offer agreement, all of the 8,240 common shares in
Chip One Stop, Inc. (Chip One Stop) to Arrow. The tender offer ex-
pired on September 20, 2011, and Arrow, on September 21, 2011,
submitted a Tender Offer Report indicating its intention to ac-
quire all shares offered in response to its tender offer. As a result,
Chip One Stop is no longer an affiliate in which the Company has
an equity interest.
(2) The Company’s Board of Directors, in a board meeting held on
January 23, 2012, passed a resolution to transfer all of the Company’s
shares of Inventure Inc. (Inventure), a consolidated subsidiary, to Ni-
hon Synopsys GK, the Japanese subsidiary of Synopsys, Inc. (US). On
January 24, 2012, the Company entered into an agreement to trans-
fer its shareholdings to Nihon Synopsys GK. As a result, Inventure is
no longer a subsidiary of the Company.
(1) Fundamental approach to corporate governanceCorporate governance allows for a quick and flexible response to
dramatic changes in the business environment. Legal, appropri-
ate and highly sound corporate activities are the underpinnings
of corporate governance.
(2) The Company’s internal organizationZuken uses a corporate auditor system and has built an effective
corporate governance system, centered on its Board of Directors,
corporate auditors and Board of Corporate Auditors, which is suit-
able for the scope of its operations and the type of businesses in
which the Company engages. As of June 28, 2012, the Company’s
management structure was composed of eight directors and four
corporate auditors (including three outside auditors).
The Board of Directors formulates fundamental management
policies and pinpoints important issues, analyzes and makes deci-
sions regarding legal and regulatory concerns as well as on items
contained in the Articles of Incorporation, and provides oversight
for directors in the course of their managerial duties. Each corpo-
rate auditor and the Board of Corporate Auditors audit directors’
execution of duties and the entire operations of the Company.
The Board of Directors and Board of Corporate Auditors each
have monthly meetings scheduled and convene additional meet-
ings as circumstances dictate, where their vigorous discussions
lead to flexible decision making. The boards conduct rigorous
management oversight and audits.
The following chart provides a graphic representation of the
Company’s corporate governance system.
(3) Status of internal audits and audits by corporate and in-dependent auditors
As set forth in the audit policy and audit plan established by the
Board of Corporate Auditors, each corporate auditor and the
Board of Corporate Auditors attend important meetings and
perform rigorous audits through such methods as Groupwide
investigations into management and business operations and
the holding of hearings. Corporate Auditor Takashi Sano, a Certi-
fied Public Accountant (CPA), has sufficient knowledge related to
finance and accounting.
Zuken has established an Internal Audit Division under
the direct supervision of the president to act as its internal
auditing organization. The Internal Audit division performs
periodic internal audits of accounts and operations based on
the audit policy set out in an audit planning document. The
division then reports and gives explanations on audit results
to corporate auditors while discussing and exchanging views
with them as required. The close collaboration between the
Internal Audit Division and corporate auditors facilitates ef-
fective auditing operations.
Zuken has a contractual relationship with KPMG AZSA LLC as
Zuken’s independent auditor. Accordingly, KPMG AZSA LLC con-
ducts rigorous and fair audits of the Company’s financial state-
ments from an independent standpoint.
Tetsuya Yamamoto and Toru Nojima, Designated and En-
gagement Partners and Certified Public Accountants of KPMG
AZSA LLC, conducted Zuken’s accounting audit. The accounting
audit duties for Zuken were aided by six CPAs and five assistants.
The independent auditors report on and give explanations of
audit results at biannual Board of Corporate Auditors’ meetings,
where issues including business risks and other risks are exam-
ined and discussed. In addition, the independent auditor and the
corporate auditor set up forums for opinion exchanges and delib-
erations on an as-needed basis. Through these initiatives, Zuken is
working to secure sound audit systems.
(4) Status of internal control and risk management system provisions
Zuken advances business operations in keeping with its corporate
philosophy that aims for the “establishment of a vibrant corporate
culture founded upon soundness, vigor and dignity”. Under this
corporate philosophy, together with its fundamental policies on
corporate governance, the Group has established and continues
to strengthen its internal controls and risk management systems.
To this end, Zuken implements initiatives that include:● Enforcement of thorough compliance through the establish-
ment and dissemination of regulations and guidelines, em-
ployee training programs, periodic internal audits, maintaining
a system to exclude anti-social elements and other measures,● Appropriate safekeeping of documents and information per-
taining to the execution of its business in accordance with in-
house regulations and guidelines,● Effective, timely evaluations and reviews of business and
other risks, and promotion of risk management systems
through the establishment and dissemination of regulations
and guidelines, employee training programs, periodic inter-
nal audits and other measures,● Ensuring efficient business operations by facilitating flexible de-
cision making at Board of Directors’ meetings, clarifying authority
in and responsibility for the execution of business in accordance
with in-house regulations, and conducting scheduled reporting
and investigation of business progress and performance,● Establishment of Groupwide internal control systems, including
the formulation of regulations for managing subsidiaries and
affiliates and the collaborative setting up of internal control sys-
tems that are suitable to each subsidiary and affiliate in terms
of the scope of their operations and types of businesses, and● Creation of ideal auditing environments through the establish-
ment of a Board of Corporate Auditors’ Office that assists corpo-
rate auditors in their duties, the formation of lines of communi-
cation between directors and employees to corporate auditors,
regular provision of forums for discussion with the representa-
tive director(s), and collaboration with independent auditors
and internal audit departments.
Through these efforts, the Zuken Group will continue working
to upgrade corporate governance through more active and
stronger efforts in both the operational and managerial realms
as well as through the reinforcement of other management
organizations.
Status of Corporate Governance
General Shareholders’ Meeting
Board of Directors
Representative Director(s)
Independent Auditor(s)
Appointment/dismissal
Accounting audit Audit
Report/discussion
Appointment/dismissal
Directors
Collaboration
Direct supervision ofthe president
Internal audit
Direction/instruction
Report
Appointment/dismissalAppointment/dismissal
CollaborationCollaboration
Supervision/appointment/dismissalSupervision/appointment/dismissal
Corporate Auditors
Board of Corporate Auditors
Internal Audit DivisionGeneral Managers of Each Department
Business Departments/Subsidiaries and Aff iliates

ZUKEN Inc. ANNUAL REPORT 201223 24
ZUKEN Inc. and Consolidated SubsidiariesAs of March 31, 2011 and 2012
Consolidated Balance Sheets
Millions of yen
Thousands of U.S. dollars
(Note 1)
ASSETS 2011 2012 2012
Current Assets:Cash and cash equivalents (Notes 1 and 2) ·········································································································· ¥ 8,762 ¥12,463 $151,988 Time deposits (Note 2) ······················································································································································· 518 82 1,000 Marketable securities (Notes 1, 2 and 3) ················································································································· 8,766 8,699 106,085 Trade notes and accounts receivable (Note 2) ··································································································· 4,768 4,719 57,549
Less-Allowance for doubtful receivables ······································································································· (36) (36) (439)Inventories (Note 1):
Merchandise and Finished goods ····················································································································· 103 170 2,073 Work in process, supplies and raw materials ······························································································ 64 77 939
Deferred tax assets (Notes 1 and 4) ··························································································································· 338 410 5,000 Other current assets ···························································································································································· 979 1,022 12,463
Total current assets ··································································································································· 24,262 27,606 336,658
Property and Equipment, at Cost (Note 1):Land ······························································································································································································· 3,054 3,010 36,707 Buildings and structures ··················································································································································· 9,048 8,999 109,744 Furniture, fixtures, and equipment ····························································································································· 1,966 1,853 22,598 Lease assets ··············································································································································································· 18 14 171
14,086 13,876 169,220 Less-Accumulated depreciation ························································································································· (7,293) (7,241) (88,305)
Net property and equipment ············································································································· 6,793 6,635 80,915
Investments and Other non-current Assets:Investment securities (Notes 1, 2 and 3) ················································································································· 1,070 907 11,061 Investment in affiliated companies (Notes 1 and 2) ························································································ 677 − −Goodwill (Note 1) ·································································································································································· 582 1,039 12,671 Other intangible fixed assets (Note 1) ······················································································································ 690 744 9,073 Deferred tax assets (Notes 1 and 4) ··························································································································· 772 722 8,805 Other ····························································································································································································· 946 634 7,731
Less-Allowance for doubtful receivables ······································································································· (12) (17) (207)Total investments and other non-current assets ··································································· 4,725 4,029 49,134 Total assets ····················································································································································· ¥35,780 ¥38,270 $466,707
The accompanying notes to the consolidated financial statements are an integral part of these balance sheets.
Millions of yen
Thousands of U.S. dollars
(Note 1)
LIABILITIES AND NET ASSETS 2011 2012 2012
Current Liabilities:Accounts payable (Note 2) ············································································································································· ¥ 1,675 ¥ 1,575 $ 19,207 Accrued expenses ································································································································································ 1,221 1,178 14,366 Income taxes payable (Notes 1 and 4) ···················································································································· 350 1,477 18,012 Advances received ······························································································································································ 2,329 2,494 30,415 Deferred tax liabilities (Notes 1 and 4) ···················································································································· 1 − −Other current liabilities ····················································································································································· 114 147 1,793
Total current liabilities ···························································································································· 5,690 6,871 83,793
Long-term Liabilities:Deferred tax liabilities (Notes 1 and 4) ···················································································································· 49 6 73 Severance and retirement plan (Notes 1 and 5)
Employees ······································································································································································· 2,782 2,852 34,781 Other long-term liabilities ··············································································································································· 198 170 2,073
Total long-term liabilities ······················································································································ 3,029 3,028 36,927
Net Assets (Note 6):Shareholders’ equity (Note 6):
Common stock:Authorized-86,525,700 shares at March 31, 2011 and 2012Issued-23,267,169 shares at March 31, 2011 and23,267,169 shares at March 31, 2012 ····································································································· 10,117 10,117 123,378
Capital surplus ······························································································································································· 8,658 8,658 105,585 Retained earnings ······················································································································································· 7,656 9,099 110,964 Less-Treasury common stock, at cost:
13,601 shares at March 31, 2011 and13,901 shares at March 31, 2012 ··············································································································· (12) (12) (147)
Accumulated other comprehensive income:Net unrealized holding gain on securities (Notes 1, 2 and 3) ··································································· 237 290 3,537 Deferred gains or losses on hedges ························································································································· (1) − −Foreign currency translation adjustments (Note 1) ························································································ (175) (218) (2,659)
Minority interests ································································································································································· 581 437 5,329 Total net assets ··········································································································································· 27,061 28,371 345,987 Total liabilities and net assets ············································································································ ¥35,780 ¥38,270 $466,707

ZUKEN Inc. ANNUAL REPORT 201225 26
ZUKEN Inc. and Consolidated SubsidiariesYears ended March 31, 2011 and 2012
Consolidated Statements of Comprehensive IncomeZUKEN Inc. and Consolidated SubsidiariesYears ended March 31, 2011 and 2012
Consolidated Statements of Income
Millions of yen
Thousands of U.S. dollars
(Note 1)
2011 2012 2012
Net Sales (Note 1) ·································································································································································· ¥17,969 ¥18,255 $222,622 Cost of Sales ·············································································································································································· 4,841 4,759 58,037
Gross profit ······································································································································································ 13,128 13,496 164,585 Selling, General and Administrative Expenses (Notes 1 and 8) ························································· 12,903 12,613 153,817
Operating income ······················································································································································ 225 883 10,768 Other Income (Expenses):
Interest and dividend income ······································································································································ 78 36 439 Gain on sales of subsidiaries and affiliates' stocks ·························································································· · 1 2,632 32,098 Amortization of negative goodwill ··························································································································· 50 50 610 Gain on sales of investment securities ···················································································································· 136 40 488 Equity in gain of affiliated companies ····················································································································· 77 12 146 Loss on insurance cancellation ···································································································································· − (112) (1,366)Loss on sales of investment securities ························································································································· (15) (80) (975)Foreign exchange loss ······················································································································································ (153) (67) (817)Loss on valuation of investment securities ·········································································································· (5) (66) (805)Loss on adjustment for changes of accounting standard for asset retirement obligations ··········· (46) − −Special retirement expenses ········································································································································· (23) − −Other, net ·················································································································································································· 21 58 707
Total ··································································································································································· 121 2,503 30,525 Income before income taxes and minority interests ·························································· 346 3,386 41,293
Provision for Income Taxes (Notes 1 and 4):Current ··············································································································································································· 411 1,692 20,634 Deferred ············································································································································································ (98) (71) (865)Income taxes (Notes 1 and 4) ······························································································································ 313 1,621 19,769 Income before minority interests ····················································································································· 33 1,765 21,524
Minority Interests in income ······································································································································· (258) (4) (49)Net income ····································································································································································· ¥ 291 ¥ 1,769 $ 21,573
U.S. dollars(Note 1)
Per Share of Common Stock (Note 1):Net income ·············································································································································································· ¥ 11.63 ¥ 76.07 $ 0.928 Diluted net income ····························································································································································· 11.21 − −Cash dividends applicable to the period ·············································································································· 14.00 24.00 0.293
The accompanying notes to the consolidated financial statements are an integral part of these statements.
Yen
Millions of yen
Thousands of U.S. dollars
(Note 1)
2011 2012 2012
Income before minority interest ······························································································································ ¥ 33 ¥1,765 $21,524 Other comprehensive income:
Net unrealized holding gain on securities ············································································································ 67 53 646 Foreign currency translation adjustments ··········································································································· 42 (33) (402) Share of other comprehensive income of associates
accounted for using equity method ··················································································································· (0) 0 0Total other comprehensive income ················································································································ 109 20 244
Comprehensive income ·················································································································································· ¥142 ¥1,785 $21,768
Comprehensive income attribute to:Comprehensive income attribute to owners of the parent ······································································ ¥407 ¥1,780 $21,707Comprehensive income attribute to minority interests ·············································································· (265) 5 61
The accompanying notes to the consolidated financial statements are an integral part of these statements.

ZUKEN Inc. ANNUAL REPORT 201227 28
ZUKEN Inc. and Consolidated SubsidiariesYears ended March 31, 2011 and 2012
Consolidated Statements of Cash FlowsZUKEN Inc. and Consolidated SubsidiariesYears ended March 31, 2011 and 2012
Consolidated Statements of Changes in Net Assets
Millions of yen
Thousands of U.S. dollars
(Note 1)
2011 2012 2012
Cash Flows from Operating Activities:Net income ·············································································································································································· ¥ 291 ¥ 1,769 $ 21,573 Adjustments to reconcile net income to net cash provided by operating activities:
Depreciation and amortization ·························································································································· 687 730 8,902 Loss(gain) on sales of investment securities ······························································································ (121) 41 500 Gain on sales of stocks of subsidiaries and affiliates ·············································································· (1) (2,632) (32,098)Loss on valuation of investment securities ································································································· 5 66 805 Equity in gain of affiliated companies ············································································································ (77) (12) (146)Loss on insurance cancellation ·························································································································· − 112 1,366 Other, net ········································································································································································· (230) (10) (122)
Changes in assets and liabilities: Increase in trade notes and accounts receivable ···················································································· (702) (71) (866)Increase(decrease) in trade accounts payable ·························································································· 447 (26) (317)Increase in accrued expenses and income taxes ···················································································· 66 1,101 13,427 Increase in provision for retirement benefits ····························································································· 183 95 1,159 Other, net ········································································································································································· 409 304 3,707
Net cash provided by operating activities ················································································ 957 1,467 17,890 Cash Flows from Investing Activities:
Decrease(increase) in time deposits, net ··············································································································· (74) 428 5,220 Expenditures for property and equipment ·········································································································· (147) (291) (3,549)Expenditures for intangible fixed assets ················································································································ (362) (374) (4,561)Purchase of marketable securities ····························································································································· (3,995) (1,999) (24,378)Proceeds from redemption of marketable securities ···················································································· 4,023 2,000 24,390 Purchase of investment securities ····························································································································· (250) (11) (134)Proceeds from sale and redemption of investment securities ································································ 621 112 1,366 Purchase of subsidiaries equity ··································································································································· − (632) (7,707)Proceeds from sales of stocks of subsidiaries and affiliates ······································································· 4 3,220 39,268 Proceeds from cancellation of insurance funds ································································································ − 170 2,073 Other, net ·················································································································································································· (59) 4 49
Net cash provided by (used in) investing activities ··············································································· (239) 2,627 32,037 Cash Flows from Financing Activities:
Purchase of treasury common stock ························································································································ (1,337) (0) (0)Purchase of treasury common stock of subsidiaries in consolidation ················································ (132) − −Cash dividends paid ··························································································································································· (354) (326) (3,976)Other, net ·················································································································································································· (8) (6) (73)
Net cash used in financing activities ············································································································· (1,831) (332) (4,049)Effect of Exchange Rate Changes on Cash and Cash Equivalents ················································· (90) (61) (744)Net Increase(Decrease) in Cash and Cash Equivalents ··········································································· (1,203) 3,701 45,134 Cash and Cash Equivalents at Beginning of Year ························································································ 9,965 8,762 106,854 Cash and Cash Equivalents at End of Year ········································································································ ¥8,762 ¥12,463 $151,988 Supplemental Disclosures of Cash Flow Information:
Cash paid during the period for: Interest ··············································································································································································· ¥ (1) ¥ (0) $ (0)Income taxes ·································································································································································· (343) (579) (7,061)
The accompanying notes to the consolidated financial statements are an integral part of these statements.
Millions of yen
Commonstock
Capitalsurplus
Retained earnings
Treasury common
stock
Net unrealized
holding gain on
securities
Deferred gains or
losses on hedges
Foreign currency
translation adjustments
Minority interests
Total net assets
Beginning Balance at April 1, 2010 ·························· ¥10,117 ¥8,658 ¥11,944 ¥(2,900) ¥166 ¥− ¥(220) ¥933 ¥28,698 Net income ················································································ 291 291Cash dividends paid ····························································· (354) (354)Purchase of treasury common stock ·························· (1,337) (1,337)Retirement of treasury common stock ····················· (4,225) 4,225 −Net changes of net unrealized holding gain
on securities ········································································· 71 71Net changes of deferred losses on hedges ··········· (1) (1)Adjustments from foreign currency translation
of foreign currency financial statements ············ 45 45Decrease in minority interests ······································· (352) (352)
Ending Balance at March 31, 2011 10,117 8,658 7,656 (12) 237 (1) (175) 581 27,061
Beginning Balance at April 1, 2011 ·························· 10,117 8,658 7,656 (12) 237 (1) (175) 581 27,061Net income ················································································ 1,769 1,769Cash dividends paid ····························································· (326) (326)Net changes of net unrealized holding gain
on securities ········································································· 53 53Net changes of deferred gains on hedges ············· 1 1Adjustments from foreign currency translation
of foreign currency financial statements ················ (43) (43)Decrease in minority interests ······································· (144) (144)
Ending Balance at March 31, 2012 ¥10,117 ¥8,658 ¥ 9,099 ¥ (12) ¥290 ¥− ¥(218) ¥437 ¥28,371
Thousands of U.S. dollars (Note 1)
Commonstock
Capitalsurplus
Retained earnings
Treasury common
stock
Net unrealized
holding gain on
securities
Deferred gains or
losses on hedges
Foreign currency
translation adjustments
Minority interests
Total net assets
Beginning Balance at April 1, 2011 ··························$123,378 $105,585 $ 93,366 $(147) $2,890 $(12) $(2,134) $7,085 $330,011Net income ················································································ 21,573 21,573Cash dividends paid ····························································· (3,975) (3,975)Net changes of net unrealized holding gain
on securities ········································································· 647 647Net changes of deferred gains on hedges ············· 12 12Adjustments from foreign currency translation
of foreign currency financial statements ············ (525) (525)Decrease in minority interests ······································· (1,756) (1,756)
Ending Balance at March 31, 2012 $123,378 $105,585 $110,964 $(147) $3,537 $ − $(2,659) $5,329 $345,987The accompanying notes to the consolidated financial statements are an integral part of these statements.

ZUKEN Inc. ANNUAL REPORT 201229 30
ZUKEN Inc. and Consolidated Subsidiaries
Notes to Consolidated Financial Statements
(e) Revenue RecognitionSales are recorded upon installation of a system and the ac-ceptance thereof by customers. Advances received from customers for maintenance services are treated as deferred revenue until earned.
(f) Cash and Cash EquivalentsIn preparing the consolidated statements of cash flows, cash on hand, readily available deposits, and short-term highly liquid investments with maturities not exceeding three months at the time of purchase are considered to be cash and cash equivalents.
(g) Marketable Securities and Investment SecuritiesSecurities are classified into one of the following categories based on management’s intent in holding them: (i) Held-to maturity debt securities, (ii) Available-for-sale securities (marketable), and (iii) Available-for-sale securities (non-marketable). (i) Held-to-maturity debt securities are stated at amortized cost. (ii) Available-for-sale securities (marketable) are stated at fair value, with any unrealized holding gain or loss, net of the applicable taxes, presented as a separate component of net assets. (iii) Available-for-sale securities (non-marketable) are stated at cost by the moving-average method. Debt securities due within one year are presented as current and all other securities are presented as non-current in the accompanying consolidated balance sheets. With respect to investments in limited business partnerships or similar types of partnerships (regarded as marketable securities under Article 2-2 of the Japanese Securities and Exchange Law), the net amount equivalent to the level of equity based on the most recently available financial statements for the reporting date specified in the partnership agreement is used. (h) InventoriesFinished goods and work in process are stated at specific identifi-cation cost. Merchandise and raw materials are stated at cost, de-termined principally by the moving-average method. Supplies are stated at cost, determined principally by the last purchase price method. Inventories with lower profitability are written down to net realizable value at March 31.
(i) DepreciationAs for the Company and its domestic consolidated subsidiaries, depreciation is principally computed by the declining-balance method or straight-line method to buildings and, for its overseas consolidated subsidiaries, is principally computed by the straight-
line method at rates based on the estimated useful lives of indi-vidual assets which range as follows:
Buildings and structures: 3 years to 60 years Furniture, fixtures and equipment: 2 years to 20 years
Ordinary maintenance and repairs are charged to income as in-curred and major renewals and improvements are capitalized. Property and equipment capitalized under finance lease ar-rangements is depreciated over the estimated useful lives or the lease term of the respective assets.
(j) GoodwillGoodwill is amortized using the straight-line method within 15 years. Prior to the year ended March 31, 2011, negative goodwill is amortized using the straight line method within 5 years.
(k) Other Intangible Fixed AssetsOther intangible fixed assets represent principally the production costs for the master product and the costs of purchased software, which are amortized using the straight-line method over a period of up to 3 years and 5 years, respectively, in accordance with esti-mated useful lives.
(l) Severance and Retirement PlansThe Company and certain subsidiaries have unfunded defined benefit plans for employees’ severance and retirement. The amount of the severance and retirement cost is determined on the basis of length of service and basic pay rate at the time of ter-mination or retirement. Some overseas subsidiaries also have un-funded defined contribution plans for severance and retirement plans. (Some overseas subsidiaries have funded defined benefit plans for pension plans.) Under the Japanese accounting standard for employees’ retirement benefits, the liabilities and expenses for severance and retirement benefits are determined based on the amounts actuarially calculated using certain assumptions. The Company provides an allowance for employees’ severance and retirement benefits based on the estimated amounts of projected benefit obligations and the fair value of plan assets at the balance sheet date. Actuarial gains/losses are recognized in consolidated state-ments of income using the straight-line method over five years commencing the following period.
The following is a summary of the significant accounting and reporting policies adopted by ZUKEN Inc. (“Zuken” or the “Com-pany”) and its subsidiaries in the preparation of the accompany-ing consolidated financial statements.
(a) Nature of OperationsEstablished in 1976, Zuken Inc. offers automation and efficiency solutions encompassing everything from design through actual production. Our customers include manufacturers across a broad range of fields throughout the world. In the field of EDA, a specialty since our establishment, we are one of the world’s leading provid-ers of PCB/MCM/HIC design software and have become the effec-tive standard setter. Today, our operations have grown to include mechanical design software and solutions that use 3D technology to make manufacturing more efficient through the use of visual information. We also offer a PLM platform that helps to boost oper-ating profits throughout the product life cycle. Our PLM platform is enjoying growing support among leading manufactures through-out the world as a solution that keeps them up to date with accel-erating globalization. Zuken began offering solutions internation-ally early in its history and, as a group, now has a sales and support network spanning 10 countries.
(b) Basis of Presenting the Consolidated Financial StatementsThe accompanying consolidated financial statements have been prepared in accordance with the provisions set forth in the Japa-nese Securities and Exchange Law and its related accounting regulations, and in conformity with accounting principles gener-ally accepted in Japan (“Japanese GAAP”), which are different in certain respects as to application and disclosure requirements of International Financial Reporting Standards. The accounts of overseas subsidiaries are prepared in ac-cordance with either International Financial Reporting Standards or United States generally accepted accounting principles, with adjustments for the specified 5 items as applicable. The accompanying consolidated financial statements have been restructured and translated into English from the consolidated financial statements of the Company prepared in accordance with Japanese GAAP and filed with the appropri-
ate Local Finance Bureau of the Ministry of Finance as required by the Securities and Exchange Law. Some supplementary information included in the statutory Japanese language con-solidated financial statements, but not required for fair pre-sentation, is not presented in the accompanying consolidated financial statements. The translation of the Japanese yen amounts into US dollars is included solely for the convenience of readers outside Japan, using the prevailing exchange rate at March 31, 2012, which was ¥82 to US$ 1. The convenience translations should not be con-strued as representations that the Japanese yen amounts have been, could have been, or could in the future be, converted into US dollars at this or any other rate of exchange.
(c) Principles of Consolidation and Accounting for Investments in Affiliated CompaniesThe accompanying consolidated financial statements include the accounts of the Company and its majority-owned subsidiaries. The fiscal year-ends of three subsidiaries are the end of February. The fiscal year-end of a subsidiary is the end of December. Sig-nificant transactions between January and March were reflected in the consolidated financial statements. All significant intercom-pany balances and transactions have been eliminated. Investments in which the Company has significant influence or ownership of more than 20% but less than or equal to 50% are accounted for under the equity method. The excess cost of investments in subsidiaries and affili-ated companies over their equity in the net assets at the date of acquisition is generally being amortized on a straight-line basis within 15 years.
(d) Translation of Foreign AccountsForeign currency receivables and payables are translated at year-end exchange rates and resulting exchange gains or losses are recognized in earnings currently. All asset and liability accounts of foreign subsidiaries and affiliates are translated into Japanese yen at year-end ex-change rates and all income and expense accounts are trans-lated at the average of the exchange rates in effect during each fiscal period. Retained earnings are translated at the his-torical rates. Foreign currency translation adjustments result-ing from translation of foreign currency financial statements were presented separately in the accumulated gains (losses) from revaluation and translation adjustments and minority in-terests in the consolidated balance sheets.
1.Nature of Operations and Significant Accounting and Reporting Policies

ZUKEN Inc. ANNUAL REPORT 201231 32
Notes to Consolidated Financial Statements
(m) Income TaxesIncome taxes in the accompanying consolidated statements of in-come comprise corporate tax, inhabitant taxes, and enterprise tax. Under the Japanese accounting standard for income taxes, the provision for income taxes is computed based on the income be-fore income taxes and minority interests included in the consolidat-ed statements of income. The asset and liability approach is used to recognize deferred tax assets and liabilities for the expected future tax consequences of temporary differences between the carrying amounts of assets and liabilities for financial reporting purposes and the amounts used for income tax purposes.
(n) Derivative Financial InstrumentsThe Company and its subsidiaries have no derivative financial instruments of any significance, which include foreign exchange forward contracts, foreign currency option contracts, and interest rate and currency swap agreements.
(o) Research and DevelopmentResearch and development costs are charged to income as in-curred. Total amounts charged to income were ¥2,997 million in fiscal 2011 and ¥2,616 million (US$ 31,902 thousand) in fiscal 2012, respectively.
(p) LeasesAssets acquired by lessees in finance lease transaction are record-ed in Lease assets. Certain immaterial or short-term finance leases are accounted for as operating leases.
(q) Per Share of Common StockNet income (loss) and cash dividends per share are based on the weighted average number of outstanding shares of common stock, if any, as retroactively adjusted for the free share distribu-tion and stock splits. Cash dividends per share shown in the accompanying con-solidated statements of income have been presented on an ac-crual basis and include, in each fiscal period, dividends approved by the shareholders after such fiscal period-end but applicable to the fiscal period then ended.
(r) Appropriation of Retained EarningsThe appropriation of retained earnings reflected in the accompa-nying consolidated financial statements has been recorded after approval by the shareholders, as required under the Japanese Corporate Law.
(s) Change in Accounting PoliciesAccounting standards for asset retirement obligationsEffective April 1, 2010, the Company and its consolidated domes-tic subsidiaries adopted “Accounting Standards for Asset Retire-ment Obligations” (Accounting Standards Board of Japan (“ASBJ”) Statement No.18 on March 31, 2008) and “Guidance on Account-ing Standards for Assets Retirement Obligations” (ASBJ Guidance No.21 on March 31, 2008). As a result of adopting these standards, operating income decreased by ¥5 million (US$ 60 thousand), and income before income taxes and minority interests decreased by ¥57 million for the fiscal year ended March 31, 2011.
Accounting standard for presentation of comprehensive incomeEffective March 31, 2011, the Company adopted “Accounting Standard for Presentation of Comprehensive Income” (ASBJ State-ment No.25 on June 30, 2010). As a result of the adoption of this standard, the Company has presented the consolidated statement of comprehensive income in the consolidated financial statements for the fiscal year ended March 31, 2011.
Accounting standard for accounting changes and error correctionsThe Company adopted “Accounting Standard for Accounting Changes and Error Corrections” (ASBJ Statement No.24, issued on December 4, 2009) and “Guidance on Accounting Standard for Accounting Changes and Error Corrections” (ASBJ Guidance No.24, issued on December 4, 2009) for accounting changes and corrections of prior period errors which are made from the fiscal year beginning on April 1, 2011.
(t) ReclassificationsCertain prior year amounts have been reclassified to conform to the fiscal 2012 presentation. These changes had no impact on previ-ously reported results of operations or shareholders’ equity.
2. Financial Instruments
(a) Fair values of financial instruments as of March 31, 2011 and 2012 were summarized as follows: The financial instruments, whose fair value were difficult to measure, were not included in the below and were summarized in (b).
Millions of yen
2011 Book value Fair value Difference
(1) Cash and cash equivalents and time deposits ······································································································· ¥9,280 ¥9,280 ¥ −(2) Trade notes and accounts receivable ··························································································································· 4,768 4,768 −(3) Marketable and investment securities ························································································································ 9,305 9,306 1(4) Investment in affiliated companies ······························································································································· 677 551 (126)(5) Accounts payable ····································································································································································· 1,675 1,675 −
Millions of yen
2012 Book value Fair value Difference
(1) Cash and cash equivalents and time deposits ······································································································· ¥12,545 ¥12,545 ¥ −(2) Trade notes and accounts receivable ··························································································································· 4,719 4,719 −(3) Marketable and investment securities ························································································································ 9,256 9,256 (0)(4) Accounts payable ····································································································································································· 1,575 1,575 −
Thousands of U.S. dollars
2012 Book value Fair value Difference
(1) Cash and cash equivalents and time deposits ······································································································· $152,988 $152,988 $ −(2) Trade notes and accounts receivable ··························································································································· 57,549 57,549 −(3) Marketable and investment securities ························································································································ 112,878 112,878 (0)(4) Accounts payable ····································································································································································· 19,207 19,207 −
(b) The financial instruments, whose fair value were difficult to measure, as of March 31, 2011 and 2012, were summarized as follows:Millions of yen
2011 Book value
Unlisted stocks ··················································································································································································· ¥322Investments in partnership ························································································································································ 209
Millions of yen
2012 Book value
Unlisted stocks ··················································································································································································· ¥266Investments in partnership ························································································································································ 84
Thousands of U.S. dollars
2012 Book value
Unlisted stocks ··················································································································································································· $3,244Investments in partnership ························································································································································ 1,024

ZUKEN Inc. ANNUAL REPORT 201233 34
3. Marketable Securities and Investment Securities
Marketable securities and investment securities at March 31, 2011 and 2012 consist of the following:Millions of yen
2011 Book value Gross unrealized gains Gross unrealized losses Fair value
Held-to-maturity marketable securities:Government bonds ···················································································· ¥1,996 ¥1 ¥− ¥1,997
¥1,996 ¥1 ¥− ¥1,997
Millions of yen
2011 Acquisition cost Gross unrealized gains Gross unrealized losses Book value
Available-for-sale securities:Marketable securities:Debt securities including investment trusts ······························· ¥6,700 ¥ − ¥ − ¥6,700Other ···················································································································· 70 − − 70
¥6,770 ¥ − ¥ − ¥6,770Investment securities:Marketable equity securities ································································· ¥ 111 ¥408 ¥11 ¥ 508Non-marketable equity securities ····················································· 322 0 − 322Investment funds ························································································· 139 − − 139Corporate bond ···························································································· 98 3 − 101
¥ 670 ¥411 ¥11 ¥1,070
Millions of yen
2012 Book value Gross unrealized gains Gross unrealized losses Fair value
Held-to-maturity marketable securities:Government bonds ···················································································· ¥1,999 ¥− ¥0 ¥1,999
¥1,999 ¥− ¥0 ¥1,999
Thousands of U.S. dollars
2012 Book value Gross unrealized gains Gross unrealized losses Fair value
Held-to-maturity marketable securities:Government bonds ···················································································· $24,378 $− $0 $24,378
$24,378 $− $0 $24,378
Millions of yen
2012 Acquisition cost Gross unrealized gains Gross unrealized losses Book value
Available-for-sale securities:Marketable securities:Debt securities including investment trusts ······························· ¥6,700 ¥ − ¥− ¥6,700
¥6,700 ¥ − ¥− ¥6,700Investment securities:Marketable equity securities ································································· ¥ 106 ¥458 ¥7 ¥ 557Non-marketable equity securities ····················································· 266 − 0 266Investment funds ························································································· 84 − 0 84
¥ 456 ¥458 ¥7 ¥ 907
Thousands of U.S. dollars
2012 Acquisition cost Gross unrealized gains Gross unrealized losses Book value
Available-for-sale securities:Marketable securities: Debt securities including investment trusts ······························· $81,707 $ − $ − $81,707
$81,707 $ − $ − $81,707Investment securities:Marketable equity securities ································································· $ 1,293 $5,585 $85 $ 6,793Non-marketable equity securities ····················································· 3,244 − 0 3,244Investment funds ························································································· 1,024 − 0 1,024
$ 5,561 $5,585 $85 $11,061
(c) The maturities of the financial instruments as of March 31, 2011 and 2012 were as follows:
Millions of yen
2011 Due within 1 year 1 to 5 years 5 to 10 years Over 10 years
Cash and cash equivalents and time deposits ·········································································· ¥9,280 ¥− ¥− ¥−
Trade notes and accounts receivable ······························································································ 4,766 2 − −
Marketable and investment securities:
Held-to-maturity debt securities:
(1) Government bonds ··················································································································· 2,000 − − −
Available for sales securities:
(2) Corporate bonds ························································································································· − 100 − −
Millions of yen
2012 Due within 1 year 1 to 5 years 5 to 10 years Over 10 years
Cash and cash equivalents and time deposits ·········································································· ¥12,545 ¥− ¥− ¥−
Trade notes and accounts receivable ······························································································ 4,719 − − −
Marketable and investment securities:
Held-to-maturity debt securities:
(1) Government bonds ··················································································································· 2,000 − − −
Available for sales securities:
(2) Corporate bonds ························································································································· − − − −
Thousands of U.S. dollars
2012 Due within 1 year 1 to 5 years 5 to 10 years Over 10 years
Cash and cash equivalents and time deposits ·········································································· $152,988 $− $− $−
Trade notes and accounts receivable ······························································································ 57,549 − − −
Marketable and investment securities:
Held-to-maturity debt securities:
(1) Government bonds ··················································································································· 24,390 − − −
Available for sales securities:
(2) Corporate bonds ························································································································· − − − −
Notes to Consolidated Financial Statements

ZUKEN Inc. ANNUAL REPORT 201235 36
5. Severance and Retirement Plans
As explained in Note 1(l), the liabilities and expenses for severance and retirement benefits are determined based on the amounts ob-tained by actuarial calculation. Under the Japanese accounting standard, small domestic subsidiaries are allowed to provide accrued sever-ance and retirement costs at the amount required had all employees retired at the balance sheet date. Certain overseas subsidiaries have defined contribution plans. (Some overseas subsidiaries have unfunded defined benefit plans for pension plans.) The liabilities for severance and retirement benefits recognized in the consolidated balance sheet, severance cost, and actual assump-tions consist of the following:
Millions of yenThousands of
U.S. dollars
2011 2012 2012
Liabilities for severance and retirement benefits:Projected benefit obligation ·························································································································································· ¥5,538 ¥5,813 $70,890Plan assets at fair value ······································································································································································ (2,553) (2,562) (31,244)Unfunded projected benefit obligation ································································································································· 2,985 3,251 39,646Unamortized actuarial loss ····························································································································································· (203) (399) (4,866)Accrued severance and retirement cost ·························································································································· ¥2,782 ¥2,852 $34,780
Severance cost:Service cost ······························································································································································································· ¥ 251 ¥ 244 $ 2,975Interest costs on projected benefit obligation ··················································································································· 215 204 2,488Expected return on plan assets ···················································································································································· (139) (145) (1,768)Amortization of actuarial gain ······················································································································································ 89 46 561Other ············································································································································································································· 66 65 793Severance and retirement benefit expenses ··············································································································· ¥ 482 ¥ 414 $ 5,049
Actuarial assumptions:Discount rate ··························································································································································································· 2.0%-5.4% 2.0%-5.0%Expected return on assets ······························································································································································· 6.0% 6.3%
6. Net Assets
Japanese Corporate Law (“the Law”) provides that the entire amount paid for new shares is required to be designated as common stock. However a company may, by a resolution of the Board of Directors, designate an amount not exceeding one half of the price of the new shares as additional paid-in capital, which is included in capital surplus. Under the Law, in cases where dividend distribution of surplus is made, the smaller of an amount equal to 10% of the dividend or the ex-cess, if any, of 25% of common stock over the total of additional paid-in capital and legal earnings reserve must be set aside as additional paid-in-capital or legal earnings reserve. Legal earnings reserve is included in retained earnings in the accompanying consolidated balance sheets. Under the Law, legal earning reserve and additional paid in capital could be used to eliminate or reduce a deficit or could be capital-ized by resolution of the shareholders’ meeting. Additional paid-in capital and legal earnings reserve may not be distributed as dividends. However, all additional paid-in-capital and all legal earnings reserve may be transferred to other capital surplus and retained earnings, respectively, which are potentially available for dividends. The maximum amount that the Company can distribute as dividends is calculated based on the non-consolidated financial state-ments of the Company in accordance with laws and regulations. At the General Shareholders’ Meeting held on June 29, 2012, the shareholders resolved cash dividends amounting to ¥395 million ($ 4,817 thousand), was to shareholders on record as of March 31, 2012.
4. Income Taxes
The Company and its subsidiaries are subject to a number of income taxes, which, in aggregate, indicate a statutory rate in Japan of ap-proximately 40.6% for the years ended March 31, 2011 and 2012. A reconciliation of the Japanese statutory income tax rate and the effec-tive income tax rate as a percentage of income taxes is as follows:
2011 2012Statutory tax rate ······························································································································································································································ 40.6% 40.6%
Effect of adjustment of gain on sale of affiliated company's securities ······························································································· − 6.0Tax rate changes due to tax reform ············································································································································································ − 4.2Effect on amortization of goodwill ············································································································································································· 9.8 1.2Non-tax deductible expense ·························································································································································································· 10.4 1.1Valuation allowance ············································································································································································································· 51.5 -2.3Tax credits for R&D ················································································································································································································· -22.5 -2.2Differences in tax rates of overseas subsidiaries ················································································································································· -12.5 -1.5Other ·············································································································································································································································· 13.2 0.8
Effective tax rate ································································································································································································································ 90.5% 47.9%
Following the promulgation on December 2, 2011 of the "Act for Partial Revision of the Income Tax Act, etc. for the Purpose of Creating Taxation System Responding to Changes in Economic and Social Structures" (Act No.114 of 2011) and the "Act on Special Securing Fi-nancial Resources Necessary to Implement Measures for Reconstruction following the Great East Japan Earthquake" (Act No.117 of 2011), Japanese corporation tax rates will be reduced and the special reconstruction corporation tax, a surtax for reconstruction funding after the Great East Japan Earthquake, will be imposed for the fiscal years beginning on or after April 1, 2012. In line with these revisions, the Com-pany changed the statutory tax rate to calculate deferred tax assets and liabilities from 40.6% to 38.0% for temporary differences which are expected to reverse during the period from the fiscal year beginning on April 1, 2012 to the fiscal year beginning on April 1, 2014. Similarly, the Company changed the statutory tax rate to calculate deferred tax assets and liabilities from 40.6% to 35.6% for temporary differences which are expected to reverse from the fiscal years beginning on or after April 1, 2015. As a result of this change, net deferred tax assets (after deducting deferred tax liabilities) decreased by ¥118 million ($1,439 thousand), income taxes - deferred and net unrealized holding gains on securities increased by ¥141 million ($1,720 thousand) and ¥23 million ($280 thousand), respectively.
Significant components of the Company's deferred tax assets and liabilities as of March 31, 2011 and 2012 are as follows:
Millions of yenThousands of
U.S. dollars2011 2012 2012
Deferred tax assets:(Current) Excess bonuses accrued ············································································································································· ¥ 259 ¥ 232 $ 2,829
Unearned revenue ·························································································································································· 149 181 2,208 Enterprise taxes accrued ············································································································································· 36 108 1,317 Accrued expense ····························································································································································· 67 63 768 Other ······················································································································································································· 51 51 622
562 635 7,744 Valuation allowance ······················································································································································ (216) (217) (2,646)
346 418 5,098 (Non-Current) Net loss carry forwards ················································································································································ 2,264 1,796 21,903
Retirement benefits ······················································································································································· 1,133 1,078 13,146 Other ······················································································································································································· 329 278 3,390
3,726 3,152 38,439 Valuation allowance ······················································································································································ (2,788) (2,267) (27,646)
938 885 10,793 Total deferred tax assets ·············································································································································· ¥1,284 ¥1,303 $15,891
Deferred tax liabilities:(Current) Other ······················································································································································································· ¥ (9) ¥ (8) $ (98)(Non-Current) Undistributed earnings of overseas subsidiaries ························································································· (44) (2) (24)
Net unrealized holding gains on securities ···································································································· (162) (161) (1,964) Other ······················································································································································································· (9) (6) (73)
(215) (169) (2,061) Total deferred tax liabilities ········································································································································ (224) (177) (2,159) Net deferred tax assets (liabilities) ························································································································ ¥1,060 ¥1,126 $13,732
Notes to Consolidated Financial Statements

ZUKEN Inc. ANNUAL REPORT 201237 38
Millions of yen
2012 Japan Europe&USA Asia TotalAdjustment
amount
Appropriated amount in the consolidated financial statement
Sales to third parties ·································································· ¥13,655 ¥3,883 ¥717 ¥18,255 ¥ − ¥18,255 Intersegment sales or transfers ·········································· 590 316 89 995 (995) −Total sales ························································································· 14,245 4,199 806 19,250 (995) 18,255
Segment profit ·············································································· ¥ 603 ¥ 83 ¥172 ¥ 858 ¥ 25 ¥ 883 Segment assets ············································································ ¥16,394 ¥4,452 ¥927 ¥21,773 ¥16,497 ¥38,270 Depreciation and amortization ·········································· 544 90 7 641 (11) 630 Amortization of goodwill ······················································· − 150 − 150 − 150 Increase amount of tangible fixed assets and
intangible fixed assets ························································· 525 124 16 665 − 665
Thousands of U.S. dollars
2012 Japan Europe&USA Asia TotalAdjustment
amount
Appropriated amount in the consolidated financial statement
Sales to third parties ·································································· $166,524 $47,354 $ 8,744 $222,622 $ − $222,622 Intersegment sales or transfers ·········································· 7,195 3,854 1,085 12,134 (12,134) −Total sales ························································································· 173,719 51,208 9,829 234,756 (12,134) 222,622
Segment profit ·············································································· $ 7,354 $ 1,012 $ 2,097 $ 10,463 $ 305 $ 10,768 Segment assets ············································································ $199,927 $54,292 $11,305 $265,524 $201,183 $466,707 Depreciation and amortization ·········································· 6,634 1,098 85 7,817 (134) 7,683 Amortization of goodwill ······················································· − 1,829 − 1,829 − 1,829 Increase amount of tangible fixed assets and
intangible fixed assets ························································· 6,403 1,512 195 8,110 − 8,110
1. Contents of adjustments are as follows. i ) Adjustment amount in segment profit includes amount ¥25 million (US$ 305 thousand) eliminated for inter-segment transactions. ii ) Adjustment amount in segment assets includes amount ¥-1,750 million (US$ -21,341 thousand) eliminated for inter-segment trans-
actions and corporate assets ¥18,247 million (US$ 222,524 thousand). Corporate assets are mainly deposits, securities and long term investment securities.
iii) Adjustment amount of depreciation and amortization includes ¥-11 million (US$ -134 thousand) eliminated for inter-segment trans-actions.
2. Segment profit is adjusted with operating income in the consolidated statements of income.
9. Business Combinations
Transactions under common control(a) Outline of the transactionThe Company and its subsidiary acquired additional shares of Zuken E3 GmbH to make it a wholly owned subsidiary. The purpose of trans-action was to enable more speedy and more efficient decision making.
(b) Outline of accounting methods adoptedThe Company accounted for the transaction as a transaction under common control in accordance with the Accounting Standard for Business Combinations (ASBJ Statement No.21, issued on December 26, 2008) and its accompanying Revised Guidance on Accounting Standard for Busi-ness Combinations and Accounting Standard for Business Divestitures (ASBJ Guidance No.10, issued on December 26, 2008).
7. Leases
The Company and its subsidiaries have cancelable and noncancelable long-term lease agreements, principally for office space, machinery and computer equipment. Rental and lease expenses were ¥448 million in fiscal 2011 and ¥388 million (US$ 4,731 thousand) in fiscal 2012.
8. Reportable segments
1. General information about reportable segmentsReportable segments of the company is based on the company's components from which financial information can be obtained sepa-rately, so that the President can judge how to distribute management resources and to evaluate its performance. The company is engaged in solution business of research and development, manufacturing and sales related to processes from design to production in manufacturing industries and related client services especially in electronics industries. In the domestic market, the Company and its affiliated companies are in charge and in overseas, each sales subsidiary which is an in-dependent management unit in each country is in charge in Europe (mainly UK, Germany, France) and USA, Asia (Korea, Singapore, China, Taiwan). The subsidiary in USA is under the management of the German subsidiary. Therefore, the company consists of segments based on the sales structure. Reportable segments are divided into 3, namely Japan, Europe&USA and Asia. Each reported segment is engaged in solution business of research and development, manufacturing and sales re-lated to processes from design to production in manufacturing industries and related client services specially in electronics industries.
2. Basis of measurement about reportable segments profit or loss, segment assets and other material itemsFinancial treatment for the reported business segment can be identified as "Nature of Operations and Significant Accounting and Reporting Policies". Segment profit(or loss) is corresponding to operating income(loss) of the consolidated statements of income. Intersegment sales or transfers are based on market price.
3. Information about reportable segments profit or loss, segment assets and other material itemsReportable segments as of and for the fiscal years ended March 31, 2011 and 2012 are as follows:
Millions of yen
2011 Japan Europe&USA Asia TotalAdjustment
amount
Appropriated amount in the consolidated financial statement
Sales to third parties ·································································· ¥13,362 ¥3,828 ¥ 779 ¥17,969 ¥ − ¥17,969 Intersegment sales or transfers ·········································· 597 296 51 944 (944) −Total sales ························································································· 13,959 4,124 830 18,913 (944) 17,969
Segment profit (or loss) ··························································· ¥ 76 ¥ (78) ¥ 219 ¥ 217 ¥ 8 ¥ 225 Segment assets ············································································ ¥17,269 ¥4,277 ¥1,937 ¥23,483 ¥12,297 ¥35,780 Depreciation and amortization ·········································· 521 88 6 615 (11) 604 Amortization of goodwill ······················································· 11 122 − 133 − 133 Investment on companies accounted
for using equity method ···················································· 677 − − 677 − 677 Increase amount of tangible fixed assets and
intangible fixed assets ························································· 419 127 9 555 − 555
Notes to Consolidated Financial Statements

ZUKEN Inc. ANNUAL REPORT 201239 40
(c) Additional acquisition of subsidiary’s shares i ) Acquisition cost and breakdown Cash and cash equivalents : € 5,427 thousand ii ) Amount of goodwill : ¥581 million(US$ 7,085 thousand) iii) Reason for its recognition Goodwill was recognized as a result of the difference between the amount of the additional acquisition cost and the decrease in the
minority interest.
Business divestiture(a) Name of the transferee; business description of the separated business; principal reason for carrying out the business divestiture; date of business divestiture; overview of the business divestiture including its legal form. i ) Name of the transferee Nihon Synopsys G.K. ii ) Business description of the separated business Research and development, manufacture, sales and support service of semi-conductor IP and ASICs iii) Principal reason for carrying out the business divestiture Inventure Inc. has semi-conductor IP as main products and the sales has steadily increased in the domestic market over the years.
Synopsys Inc., a parent company of Nihon Synopsys G.K. to which the Company transferred shares of Inventure Inc., is a world leader in electronic design automation software for IC design and has around 70 offices located in North America, Europe and Asia. While Synopsys Inc. and the Company have been in cooperative business relations, Synopsys Inc. approached the Company to request the transfer of shares of Inventure Inc., which was a consolidated subsidiary of the Company. It was expected for Inventure Inc. to accelerate its development activities of semi-conductor IP by being affiliated with Synopsys Inc. which was a world leader of semi-conductor software. The transfer price reflected the future enterprise value of Inventure Inc. Therefore, the Company decided that all shares of Inventure Inc. were to be transferred to Nihon Synopsys G.K., which is an affiliated company of Synopsys Inc. in Japan.
iv) Date of business divestiture February 6, 2012 v ) Overview of the business divestiture including its legal form All the stocks of Inventure Inc., which was a consolidated subsidiary of the Company, were transferred to Synopsys G.K.
(b) Summary of accounting procedure i ) Profit from the transfers : ¥1,509 million(US$ 18,402 thousand) (The amount is recorded as “Gain on sales of subsidiaries and affiliates’ stocks” in Other Income of Consolidated Statements of Income.) ii ) Appropriate book value of assets and liabilities of the business
Millions of yenThousands of
U.S. dollars
Current assets ······································································································································································································································ ¥383 $4,671 Fixed assets ··········································································································································································································································· 28 341
Total assets ·································································································································································································································· ¥411 $5,012 Current liabilities ································································································································································································································ ¥170 $2,073Long-term liabilities ························································································································································································································· 24 293
Total liabilities ···························································································································································································································· ¥194 $2,366
iii) Accounting procedure The difference between the book value of Inventure Inc. and the consideration less the commissions is recorded as “Gain on sales
of subsidiaries and affiliates’ stocks” in Other Income of Consolidated Statements of Income.(c) Name of segment the business was included in Japan
(d) Overview of sales, profit of the separated business included in consolidated results for the year ended March 31, 2012 were as folloows:
Millions of yenThousands of
U.S. dollars
Net sales ·················································································································································································································································· ¥455 $5,549 Operating income ···························································································································································································································· 46 561
Notes to Consolidated Financial Statements

BUSINESS LOCATIONS IN JAPAN
Head Off ice, Sales and R&D Center2-25-1 Edahigashi, Tsuzuki-ku,Yokohama, Kanagawa 224-8585Tel: +81-45-942-1511
Center Minami Off iceZuken Center Minami Building,32-11 Chigasaki-Chuou, Tsuzuki-ku,Yokohama, Kanagawa 224-8580Tel: +81-45-942-1300
Shin-Yokohama Off iceZuken Shin-Yokohama Building,3-1-1 Shin-Yokohama, Kouhoku-ku,Yokohama, Kanagawa 222-8505Tel: +81-45-473-6868
Kansai Regional Off iceDoujima Avanza,1-6-20 Doujima,Kita-ku, Osaka 530-0003Tel: +81-6-6343-1141
Nagoya Regional Off iceNagoya Intercity, 1-11-11 NishikiNaka-ku, Nagoya, Aichi 460-0003Tel: +81-52-222-3131
OVERSEAS CONSOLIDATED SUBSIDIARIES AND REPRESENTATIVE OFFICES
ZUKEN EAO/EUROPE
■ UNITED KINGDOMZUKEN Ltd.Development of EDA solutionsCapital: GBP8,550,000Proportion of stock held: 100%
ZUKEN UK Ltd.Sales of EDA solutionsCapital: GBP1,954,000Proportion of stock held: 100%
ZUKEN Group Ltd.Overall control of U.K. operationsCapital: GBP9,910,000Proportion of stock held: 100%Zuken Technology Centre, 1500, Aztec West Almondsbury, Bristol. BS32 4RFUnited KingdomTel: +44-1454 -207800
■ GERMANYZUKEN GmbHDevelopment of EDA solutionsProduct salesCapital: EUR639,000Proportion of stock held: 100%
(European Headquarters)Airport Business Centre,Am Soeldnermoos 17,D-85399 Hallbergmoos, GermanyTel: +49-89-607696-00
(EMC Technology Center)Am Hoppenhof 32aPaderborn D-33104 GermanyTel: +49-5251-150-600
ZUKEN E3 GmbHDevelopment and sales of wireharness design softwareCapital: EUR150,000Proportion of stock held: 100%Lämmerweg 55, D-89079 Ulm,GermanyTel: +49-7305-9309-0
(Off ice Hannover)Podbielskistrasse 333Hannover D-30659 GermanyTel: +49-511- 85959489
(Office Vertriebsburo Schweiz)Vertriebsburo SchweizHintermattlistrase 1-5Magenwil CH-5506 SwitzerlandTel: +41-56/437-08-90
■ FRANCE ZUKEN S.A.Sales of EDA solutionsCapital: EUR1,287,000Proportion of stock held: 100%Bâtiment Theta 2,3 avenue du Canada,ZAC de Courtaboeuf,91974 Les Ulis Cédex,France Tel: +33-1-69-29-48-00
■ ITALY ZUKEN S.r.l.Sales of EDA solutionsCapital: EUR65,000Proportion of stock held: 100%Strada 2-Palazzo C4, 20090Milano F iori, Assago, Milan, ItalyTel: +39-02-575-921
■ NETHERLANDS ZUKEN GmbH(Sales Office Benelux)Kerkplein 1, 6075 HA Herkenbosch, NetherlandsTel: +31-475-520998
ZUKENEAO/NORTH AMERICA
■ UNITED STATESZUKEN USA Inc.Sales of EDA solutionsCapital: USD9,000,000Proportion of stock held: 100%238 Littleton Road Suite 100, Westford, MA, 01886, U.S.A.Tel: +1-978-692-4900
ASIA
■ SOUTH KOREAZUKEN KOREA Inc.Sales of EDA solutionsCapital: KRW500,000,000Proportion of stock held: 100%DongNamYuHwa Bldg 3F 1001-10, Daechi-Dong, KangNam-ku, Seoul, 135-280, South KoreaTel: +82-2-564-8031
■ SINGAPORE ZUKEN SINGAPORE Pte. Ltd.Sales of EDA solutionsCapital: SGD1,250,000Proportion of stock held: 100%152 Beach Road, #22-05 GatewayEast, Singapore 189721Tel: +65-6392-5855
■ CHINA ZUKEN (SHANGHAI)TECHNICAL CENTER Co., Ltd.EDA solution consulting andmaintenanceCapital: CNY1,655,000Proportion of stock held: 100%Room 1106, No.555 Nanjing West Road, Shanghai 200041, People’s Republic of ChinaTel: +86-21-3218-1784, +86-21-3218-1786
ZUKEN Inc. Beijing Rep.Off iceRoom 1310, Air China Plaza No. 36,Xiao Yun Road, Chao Yang District,Beijing 100027,People’s Republic of ChinaTel: +86-10-8447-5076, +86-10-6467-3569
ZUKEN Inc. Shenzhen Rep. Off iceRoom 705, International CultureBuilding, No. 3039, ShennanzhongRoad, Shenzhen, Guangdong518033, People’s Republic of ChinaTel: +86-755-8329-7510 +86-755-8329-7541 +86-755-8329-7542
■ TAIWANZUKEN TAIWAN Inc.Sales of EDA solutionsCapital: TWD15,000,000Proportion of stock held: 100%11F., No. 6, Sec. 2, Nanjing E. Rd., Taipei 104, TaiwanTel: +886-2-2562-7227
DOMESTIC CONSOLIDATED SUBSIDIARIES
Zuken Elmic Inc.Development of the middlewarelibraries essential to embedded systemdevelopment, software developmentand support, and the developmentand sale of hardwareCapital: JPY1,202,036,000Proportion of stock held:40.4%(Listed on the Tokyo Stock ExchangeMOTHERS Section)Head Off iceZuken Shin-Yokohama Bldg., 3-1-1, Shin-Yokohama, Kouhoku-ku, Yokohama, Kanagawa 222-8505Tel: +81-45-624-8111
Zsas (Zuken Support and Service) Inc.Outsourcing and personnel agency inthe EDA and IT solution f ieldsCapital: JPY147,700,000Proportion of stock held: 100%Zuken Shin-Yokohama Building,3-1-1 Shin-Yokohama, Kouhoku-ku,Yokohama, Kanagawa 222-8505Tel: +81-45-471-2334
Zuken NetWave Inc.Sales of and consulting fornetwork systemsCapital: JPY150,000,000Proportion of stock held: 86.1%Zuken Shin-Yokohama Building,3-1-1 Shin-Yokohama, Kouhoku-ku,Yokohama, Kanagawa 222-8505Tel: +81-45-473-6821
CAD Lab. Inc.3D mechanical design CAD consultingCapital: JPY50,000,000Proportion of stock held: 100%Zuken Center Minami Building,32-11 Chigasaki-Chuou, Tsuzuki-ku,Yokohama, Kanagawa 224-8580Tel: +81-45-948-5806
Head Off ice, Sales and R&D Center
2-25-1 Edahigashi, Tsuzuki-ku, Yokohama,Kanagawa 224-8585, JapanTel: +81-45-942-1511 Fax: +81-45-942-1599http://www.zuken.com/
Date of Establishment
December 17, 1976
Number of Employees
484 (Consolidated: 1,205)
Common Stock
Authorized: 86,525,700 sharesIssued: 23,267,169 sharesNumber of shareholders: 12,909
Paid-in Capital
¥10,117,065,000
Stock Listing
Tokyo Stock Exchange (Ticker Code: 6947)
Independent Auditor
KPMG AZSA LLC
Shareholder Registry Administrator
Mitsubishi UFJ Trust and Banking Corporation1-4-5, Marunouchi, Chiyoda-ku, Tokyo 100-8212
Account-keeping Institution of Special Accounts
Sumitomo Mitsui Trust Bank, Limited1-4-1, Marunouchi, Chiyoda-ku, Tokyo 100-8233
Board of Directors (As of June 28, 2012)
Makoto KanekoPresident andRepresentative Director
Jinya KatsubeCOO andRepresentative Director
Toshihiro ShimauchiSenior ManagingDirector
Yasuo UenoManaging Director
Kazuhiro KariyaDirector
Yoshikazu SomaDirector
Takeo OsawaDirector
Gerhard LipskiDirector
Principal Shareholders
Shareholding ratio is calculated excluding treasury stock (13,901 stocks).
ZUKEN Inc.
Makoto Kaneko
Kaneko Makoto Holdings Co., Ltd.
The Master Trust Bank of Japan, Ltd. (trust account)
Morgan Stanley & Co. LLC
Japan Trustee Services Bank, Ltd. (trust account)
Nippon Life Insurance Company
Fusao Wada
Mineko Kaneko
State Street Bank and Trust Company 505044
Japan Trustee Services Bank, Ltd. (trust account 9G)
4,500
3,240
1,123
1,010
915
803
690
580
485
376
19.35
13.93
4.83
4.34
3.93
3.45
2.97
2.49
2.08
1.61
Name Number of shares held(Thousands)
Percentage of shares held
Note: Following an April 1, 2012 merger, The Chuo Mitsui Trust and Banking Company, Limited merged to Sumitomo Mitsui Trust Bank, Limited.
Note: Since May 2012, the representative office in the Netherlands has been operating as a sales office of ZUKEN GmbH, Zuken’s European headquarters.
(Yen)
Stock Price Data
1,000
800
600
400
0 2010/102010/4 2011/4 2011/10 2012/3
ZUKEN Inc. ANNUAL REPORT 201241 42
Corporate Information (As of March 31, 2012)Consolidated Subsidiaries and Overseas Locations (As of March 31, 2012)

The Partner for Success
Annual Report 2012Year ended March 31, 2012
Zuken Inc.
2-25-1 Edahigashi, Tsuzuki-ku,Yokohama, Kanagawa 224-8585, Japan
Tel: +81-45-942-1511Fax: +81-45-942-1599
http://www.zuken.com/
Zuken Inc.


![The Best Partner for Your Success - Dynamics Automation · · 2018-01-18The Best Partner for Your Success MITSUBISHI CNC BNP-A1200-M[ENG] ... to the highest accuracy and productivity](https://img.pdfslide.net/doc/110x75/5aef09977f8b9ac62b8cd933/the-best-partner-for-your-success-dynamics-best-partner-for-your-success-mitsubishi.jpg)


![The Best Partner for Your Success - MITSUBISHI …dl.mitsubishielectric.com/dl/fa/document/catalog/cnc/bn… · · 2014-10-20The Best Partner for Your Success MITSUBISHI CNC BNP-A1200-S[ENG]](https://img.pdfslide.net/doc/110x75/5aef09977f8b9ac62b8cd926/the-best-partner-for-your-success-mitsubishi-dl-2014-10-20the-best-partner.jpg)