Embed Size (px)
Citation preview
A Forrester Total Economic Impact™
Study Commissioned By Microsoft
July 2019
The Partner Opportunity Assessment For Azure Service Providers
A Total Economic Impact™ Partner Opportunity Analysis
Table Of Contents Executive Summary 1
Azure Partner Revenue And Margin Opportunities 1
Azure Partner Investments 4
Azure Partner Business Outcomes 5
TEI Framework And Methodology 6
Journey Of The Azure Customer 7
Analysis 10
Key Partner Challenges 10
Shaping A Successful Azure Practice 11
Composite Partner Organization 13
Financial Analysis 15
Professional Services: Strategy And Assessments 16
Professional Services: Migration Execution 17
Professional Services: Refactoring And Rearchitecting 19
Professional Services: Cloud-Native Application Development 20
Azure Managed Services 22
Value-Added IP Licenses 24
Azure Consumption Resell 25
Flexibility 26
Analysis Of Investments 28
Nondelivery Operational Staffing Expenses 28
Research And Development Expenses 29
Training Expenses 30
Marketing Expenses 32
General and Administrative Expenses 33
Financial Summary 34
Microsoft Partner Programs for Azure: Overview 35
Appendix A: Total Economic Impact 36
Appendix B: Deal Calculations 37
Appendix C: Endnotes 39
Project Director:
David Park
ABOUT FORRESTER CONSULTING
Forrester Consulting provides independent and objective research-based
consulting to help leaders succeed in their organizations. Ranging in scope from a
short strategy session to custom projects, Forrester’s Consulting services connect
you directly with research analysts who apply expert insight to your specific
business challenges. For more information, visit forrester.com/consulting.
© 2019, Forrester Research, Inc. All rights reserved. Unauthorized reproduction
is strictly prohibited. Information is based on best available resources.
Opinions reflect judgment at the time and are subject to change. Forrester®,
Technographics®, Forrester Wave, RoleView, TechRadar, and Total Economic
Impact are trademarks of Forrester Research, Inc. All other trademarks are the
property of their respective companies. For additional information, go to
forrester.com.
1 | The Partner Opportunity Assessment For Azure Service Providers
Executive Summary
The partner business landscape for cloud migration, modernization, and
next generation managed services has continued to evolve as
businesses become increasingly mature in their cloud journeys. Helping
customers get out of their data centers, while still expected, is no longer
by itself enough. Customers now recognize that cloud use cases extend
beyond simply cost savings and that partners play a critical role in helping
them unlock these benefits. In responding to this demand, many partners
have started building and offering their services around Microsoft Azure
due to its robust breadth of capabilities for both infrastructure-as-a-
service (IaaS) and platform-as-a-service (PaaS) deployments. This study
examines the experiences of partners that have built and scaled their
Azure practices while offering a range of both professional and managed
services to drive their customers’ cloud transformation journeys from start
to finish.
Microsoft commissioned Forrester Consulting to conduct a Total
Economic Impact™ (TEI) study to identify the business opportunity and
return on investment (ROI) Azure partners may realize by developing or
expanding their practice areas to include Azure services across the
customer engagement life cycle. The purpose of this study is to provide
partners with a framework to evaluate the potential business opportunity
for partners building an Azure practice by delivering end-to-end migration,
modernization, and next generation managed services, including strategy
and assessment, migration execution, refactoring and rearchitecting,
cloud-native application development, managed services, value-added IP
licensing, and billing and business support while reselling Azure
consumption.
To better understand the revenue streams, investments, and risks
associated with an Azure services practice, Forrester interviewed 14
partners with multiple years of experience delivering migration,
modernization, and next generation managed services through Azure. To
illustrate the financial impact and subsequent partner business opportunity
for Azure service providers, Forrester aggregated the characteristics of
these 14 partners to create a single composite organization.
Azure Partner Revenue And Margin Opportunities
The composite partner organization captured the following Azure services
revenue streams, which are representative of those experienced by the
companies interviewed:
› Azure professional services. Interviewed partners offered professional
services to cover every stage of their customers’ cloud journeys, from
strategy workshops and technical assessments to help customers
understand which workloads should be migrated to Azure and when, to
executing the migrations, to modernizing or building new applications to
take advantage of the cloud-native benefits of Azure. Partners typically
delivered multiple professional services engagements per customer as
they continued to embed themselves in their customers’ transformation
efforts. Over our three-year analysis, Azure professional services totaled
75% of the composite partner organization’s total gross profits.
› Azure managed services. Once customers had successfully migrated
to their desired deployments on Azure, they needed to ensure that their
workloads were optimized for factors such as cost, performance, and
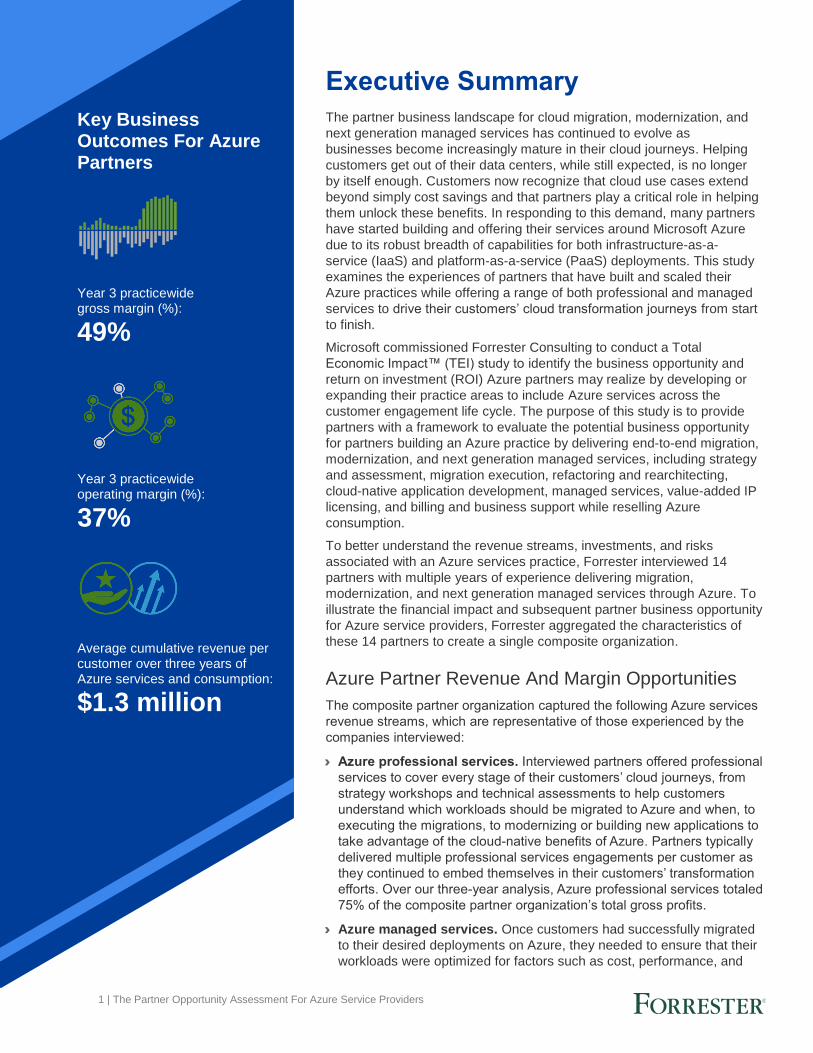
Key Business Outcomes For Azure Partners
Year 3 practicewide gross margin (%):
49%
Year 3 practicewide operating margin (%):
37%
Average cumulative revenue per customer over three years of Azure services and consumption:
$1.3 million
2 | The Partner Opportunity Assessment For Azure Service Providers
security. Partners developed tiered managed services offerings to tackle
each of these needs, and some even offered DevOps managed services
or application managed services to further abstract the need for their
customers to actively manage their cloud environments. Partners looked
to extend managed services agreements to their existing professional
services customers to deepen their relationships and gradually shift from
one-time to recurring cash flows. Over our three-year analysis, Azure
managed services made up 13% of the composite partner organization’s
total gross profits.
› Value-added IP licenses. Partners differentiated themselves from their
competitors by building out horizontally or vertically aligned practice
areas and offering customers specific use case-driven solutions built on
or leveraging the Azure platform. These solutions included anything from
custom industry-driven monitoring solutions to real-time consumption
analytics and optimization tools. Value-added IP offerings addressed
very niche markets, and partners found that these solutions often had
few, if any, natural competitors. Consequently, gross margins for value-
added IP licenses were typically the highest among Azure partner
services. Over our three-year analysis, value-added IP licenses
amounted to 6% of the composite partner organization’s total gross
profits.
› Azure consumption resell and business support. Successful
partners looked at distributing and reselling Azure consumption as more
than simply providing basic business support, such as handling billing
and invoicing. Instead, these partners used their reseller platforms to
become the central point for their customers’ Azure subscriptions and
ultimately glean valuable data around which to build and offer their
professional and managed services. Nonetheless, resellers did receive a
cut of their customers’ Azure consumption, which, over our three-year
analysis, made up 6% of the composite partner organization’s total gross
profits.
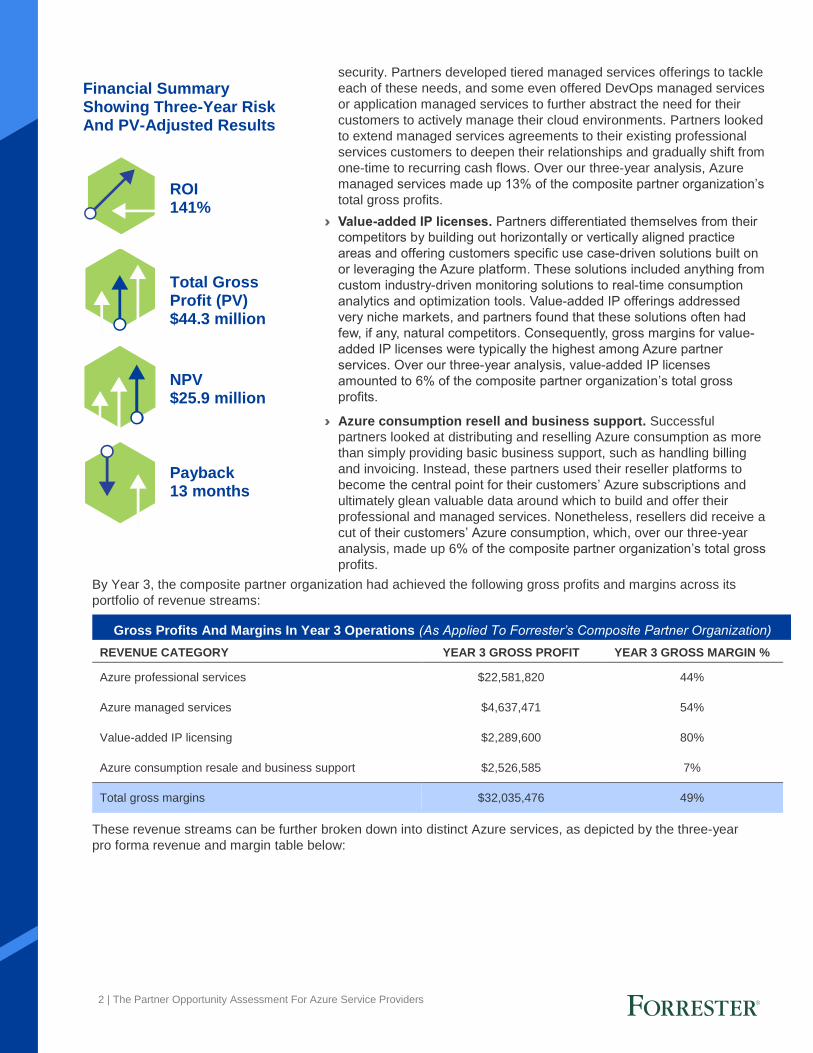
By Year 3, the composite partner organization had achieved the following gross profits and margins across its
portfolio of revenue streams:
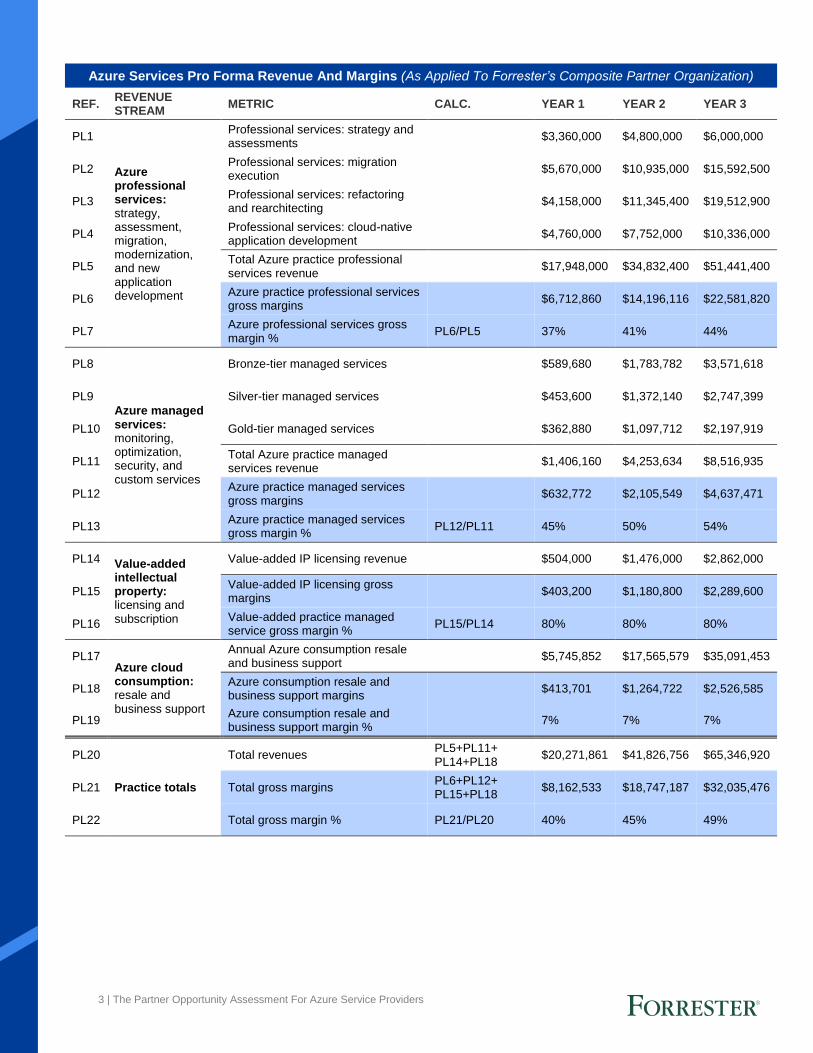
These revenue streams can be further broken down into distinct Azure services, as depicted by the three-year
pro forma revenue and margin table below:
Gross Profits And Margins In Year 3 Operations (As Applied To Forrester’s Composite Partner Organization)
REVENUE CATEGORY YEAR 3 GROSS PROFIT YEAR 3 GROSS MARGIN %
Azure professional services $22,581,820 44%
Azure managed services $4,637,471 54%
Value-added IP licensing $2,289,600 80%
Azure consumption resale and business support $2,526,585 7%
Total gross margins $32,035,476 49%
Financial Summary Showing Three-Year Risk And PV-Adjusted Results
ROI 141%
Total Gross Profit (PV) $44.3 million
NPV $25.9 million
Payback 13 months
3 | The Partner Opportunity Assessment For Azure Service Providers
Azure Services Pro Forma Revenue And Margins (As Applied To Forrester’s Composite Partner Organization)
REF. REVENUE STREAM
METRIC CALC. YEAR 1 YEAR 2 YEAR 3
PL1
Azure professional services: strategy, assessment, migration, modernization, and new application development
Professional services: strategy and assessments
$3,360,000 $4,800,000 $6,000,000
PL2 Professional services: migration execution
$5,670,000 $10,935,000 $15,592,500
PL3 Professional services: refactoring and rearchitecting
$4,158,000 $11,345,400 $19,512,900
PL4 Professional services: cloud-native application development
$4,760,000 $7,752,000 $10,336,000
PL5 Total Azure practice professional services revenue
$17,948,000 $34,832,400 $51,441,400
PL6 Azure practice professional services gross margins
$6,712,860 $14,196,116 $22,581,820
PL7 Azure professional services gross margin %
PL6/PL5 37% 41% 44%
PL8
Azure managed services: monitoring, optimization, security, and custom services
Bronze-tier managed services $589,680 $1,783,782 $3,571,618
PL9 Silver-tier managed services $453,600 $1,372,140 $2,747,399
PL10 Gold-tier managed services $362,880 $1,097,712 $2,197,919
PL11 Total Azure practice managed services revenue
$1,406,160 $4,253,634 $8,516,935
PL12 Azure practice managed services gross margins
$632,772 $2,105,549 $4,637,471
PL13 Azure practice managed services gross margin %
PL12/PL11 45% 50% 54%
PL14 Value-added intellectual property: licensing and subscription
Value-added IP licensing revenue $504,000 $1,476,000 $2,862,000
PL15 Value-added IP licensing gross margins
$403,200 $1,180,800 $2,289,600
PL16 Value-added practice managed service gross margin %
PL15/PL14 80% 80% 80%
PL17 Azure cloud consumption: resale and business support
Annual Azure consumption resale and business support
$5,745,852 $17,565,579 $35,091,453
PL18 Azure consumption resale and business support margins
$413,701 $1,264,722 $2,526,585
PL19 Azure consumption resale and business support margin %
7% 7% 7%
PL20
Practice totals
Total revenues PL5+PL11+ PL14+PL18
$20,271,861 $41,826,756 $65,346,920
PL21 Total gross margins PL6+PL12+ PL15+PL18
$8,162,533 $18,747,187 $32,035,476
PL22 Total gross margin % PL21/PL20 40% 45% 49%
4 | The Partner Opportunity Assessment For Azure Service Providers
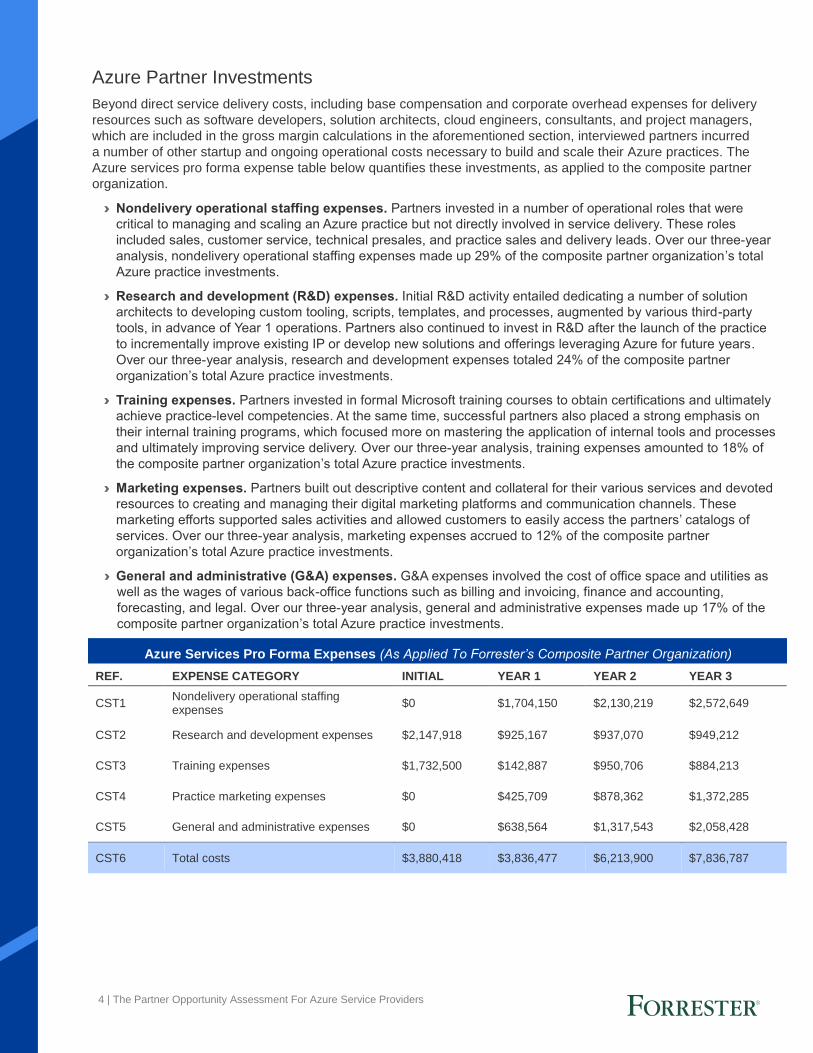
Azure Partner Investments
Beyond direct service delivery costs, including base compensation and corporate overhead expenses for delivery
resources such as software developers, solution architects, cloud engineers, consultants, and project managers,
which are included in the gross margin calculations in the aforementioned section, interviewed partners incurred
a number of other startup and ongoing operational costs necessary to build and scale their Azure practices. The
Azure services pro forma expense table below quantifies these investments, as applied to the composite partner
organization.
› Nondelivery operational staffing expenses. Partners invested in a number of operational roles that were
critical to managing and scaling an Azure practice but not directly involved in service delivery. These roles
included sales, customer service, technical presales, and practice sales and delivery leads. Over our three-year
analysis, nondelivery operational staffing expenses made up 29% of the composite partner organization’s total
Azure practice investments.
› Research and development (R&D) expenses. Initial R&D activity entailed dedicating a number of solution
architects to developing custom tooling, scripts, templates, and processes, augmented by various third-party
tools, in advance of Year 1 operations. Partners also continued to invest in R&D after the launch of the practice
to incrementally improve existing IP or develop new solutions and offerings leveraging Azure for future years.
Over our three-year analysis, research and development expenses totaled 24% of the composite partner
organization’s total Azure practice investments.
› Training expenses. Partners invested in formal Microsoft training courses to obtain certifications and ultimately
achieve practice-level competencies. At the same time, successful partners also placed a strong emphasis on
their internal training programs, which focused more on mastering the application of internal tools and processes
and ultimately improving service delivery. Over our three-year analysis, training expenses amounted to 18% of
the composite partner organization’s total Azure practice investments.
› Marketing expenses. Partners built out descriptive content and collateral for their various services and devoted
resources to creating and managing their digital marketing platforms and communication channels. These
marketing efforts supported sales activities and allowed customers to easily access the partners’ catalogs of
services. Over our three-year analysis, marketing expenses accrued to 12% of the composite partner
organization’s total Azure practice investments.
› General and administrative (G&A) expenses. G&A expenses involved the cost of office space and utilities as
well as the wages of various back-office functions such as billing and invoicing, finance and accounting,
forecasting, and legal. Over our three-year analysis, general and administrative expenses made up 17% of the
composite partner organization’s total Azure practice investments.
Azure Services Pro Forma Expenses (As Applied To Forrester’s Composite Partner Organization)
REF. EXPENSE CATEGORY INITIAL YEAR 1 YEAR 2 YEAR 3
CST1 Nondelivery operational staffing expenses
$0 $1,704,150 $2,130,219 $2,572,649
CST2 Research and development expenses $2,147,918 $925,167 $937,070 $949,212
CST3 Training expenses $1,732,500 $142,887 $950,706 $884,213
CST4 Practice marketing expenses $0 $425,709 $878,362 $1,372,285
CST5 General and administrative expenses $0 $638,564 $1,317,543 $2,058,428
CST6 Total costs $3,880,418 $3,836,477 $6,213,900 $7,836,787
5 | The Partner Opportunity Assessment For Azure Service Providers
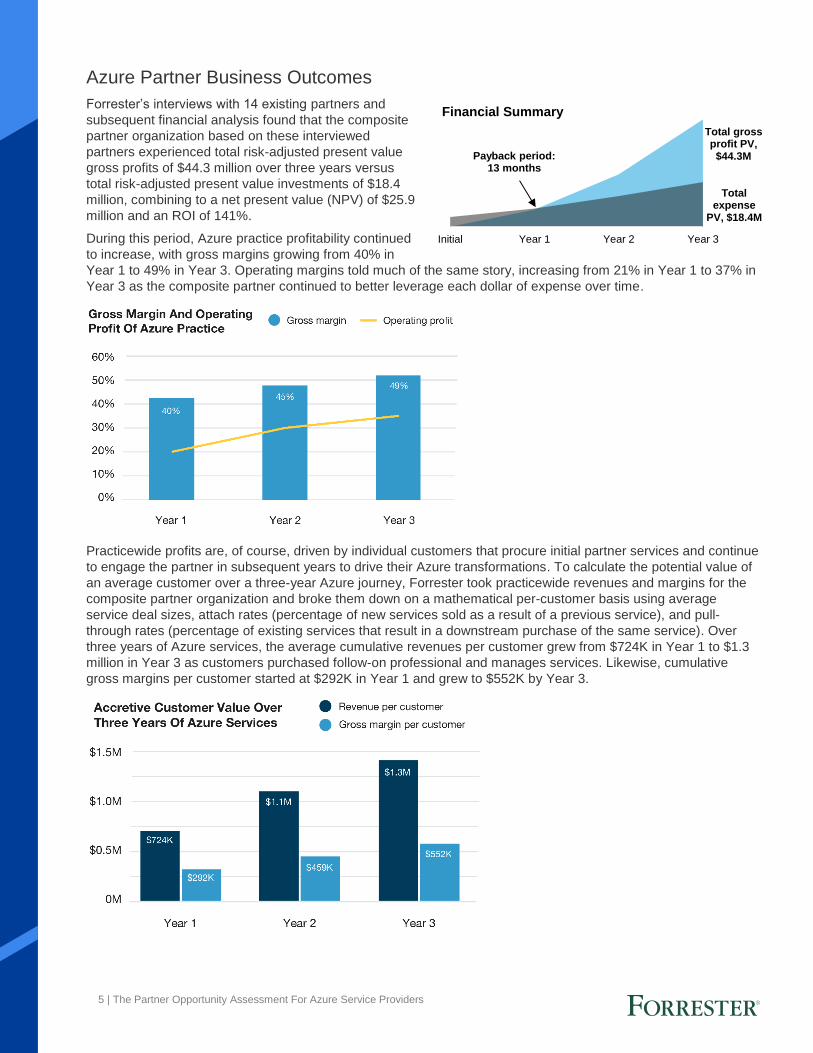
Azure Partner Business Outcomes
Forrester’s interviews with 14 existing partners and
subsequent financial analysis found that the composite
partner organization based on these interviewed
partners experienced total risk-adjusted present value
gross profits of $44.3 million over three years versus
total risk-adjusted present value investments of $18.4
million, combining to a net present value (NPV) of $25.9
million and an ROI of 141%.
During this period, Azure practice profitability continued
to increase, with gross margins growing from 40% in
Year 1 to 49% in Year 3. Operating margins told much of the same story, increasing from 21% in Year 1 to 37% in
Year 3 as the composite partner continued to better leverage each dollar of expense over time.
Practicewide profits are, of course, driven by individual customers that procure initial partner services and continue
to engage the partner in subsequent years to drive their Azure transformations. To calculate the potential value of
an average customer over a three-year Azure journey, Forrester took practicewide revenues and margins for the
composite partner organization and broke them down on a mathematical per-customer basis using average
service deal sizes, attach rates (percentage of new services sold as a result of a previous service), and pull-
through rates (percentage of existing services that result in a downstream purchase of the same service). Over
three years of Azure services, the average cumulative revenues per customer grew from $724K in Year 1 to $1.3
million in Year 3 as customers purchased follow-on professional and manages services. Likewise, cumulative
gross margins per customer started at $292K in Year 1 and grew to $552K by Year 3.
Total gross profit PV, $44.3M
Total expense
PV, $18.4M
Initial Year 1 Year 2 Year 3
Financial Summary
Payback period:13 months
6 | The Partner Opportunity Assessment For Azure Service Providers
TEI Framework And Methodology
From the information provided in the interviews, Forrester has constructed
a Total Economic Impact™ (TEI) framework for those organizations
building out a Microsoft Azure Partner practice.
The objective of the framework is to identify the investments, revenues,
flexibility, and risk factors that affect the investment decision. Forrester took
a multistep approach to evaluate the partner business impact of a Microsoft
Azure practice:
DUE DILIGENCE Interviewed Microsoft stakeholders and Forrester analysts to gather data relative to Azure practices.
PARTNER INTERVIEWS Interviewed 14 partner organizations selling Azure services and solutions to obtain data with respect to revenues, investments, and risks.
COMPOSITE ORGANIZATION Designed a composite partner organization based on characteristics of the interviewed partners.
FINANCIAL MODEL FRAMEWORK Constructed a financial model representative of the interviews using the TEI methodology and risk-adjusted the financial model based on issues and concerns of the interviewed organizations.
CASE STUDY Employed four fundamental elements of TEI in modeling the business impact of building an Azure practice: revenues, investments, flexibility, and risks. Given the increasing sophistication that enterprises have regarding ROI analyses related to IT investments, Forrester’s TEI methodology serves to provide a complete picture of the total economic impact of purchase decisions. Please see Appendix A for additional information on the TEI methodology.
DISCLOSURES
Readers should be aware of the following:
This study is commissioned by Microsoft and delivered by Forrester Consulting.
It is not meant to be used as a competitive analysis.
Forrester makes no assumptions as to the potential ROI that other partner
organizations will receive. Forrester strongly advises that readers use their own
estimates within the framework provided in the report to determine the
appropriateness of an investment in a Microsoft Azure practice.
Microsoft reviewed and provided feedback to Forrester, but Forrester maintains
editorial control over the study and its findings and does not accept changes to
the study that contradict Forrester’s findings or obscure the meaning of the
study.
Microsoft provided the partner names for the interviews but did not participate
in the interviews.
7 | The Partner Opportunity Assessment For Azure Service Providers
Journey Of The Azure Customer
ASSESSING THE JOURNEY OF CUSTOMERS THAT HAVE MIGRATED TO OR
MODERNIZED WORKLOADS FOR MICROSOFT AZURE
Interviewed Respondents
For this study, Forrester conducted a quantitative survey of 282 IT and operations decision makers.
Firmographics. Forrester conducted the survey with respondents from companies in the United States, Canada, Australia, Germany, France, Japan, and China. Companies within the United States were required to have 1,000 or more employees, while companies outside of the US were required to have 500 or more employees. Of those surveyed, the main industries that emerged were technology (software vendor), manufacturing and materials, financial services and/or insurance, retail, and healthcare. Companies with annual revenue reaching from $1M to $5B and above were surveyed, with the largest number of respondents falling between $500M to $999M (18%), $1B to $5B (34%), and $5B and above (13%).
Demographics. All respondents were manager-level or higher within the IT department at their organizations, spread across technology management, technology infrastructure and operations, software/application development and delivery, enterprise architect (EA), and DevOps. All possess knowledge and procurement of cloud computing architecture, strategy, implementation, decision authority/influence around cloud migration efforts in their companies, and public/private/hybrid cloud architectures. Of those surveyed, the following roles were present: enterprise architects, cloud software engineers, solution architects, infrastructure engineers, and cloud operations managers. Finally, all respondents were required to have migrated at least one of the following workloads to Azure: apps on Windows Server, SQL Server, apps on Linux (RHEL, SUSE), or open source database (e.g., PostgreSQL, MySQL, MariaDB, NoSQL, CosmosDB).
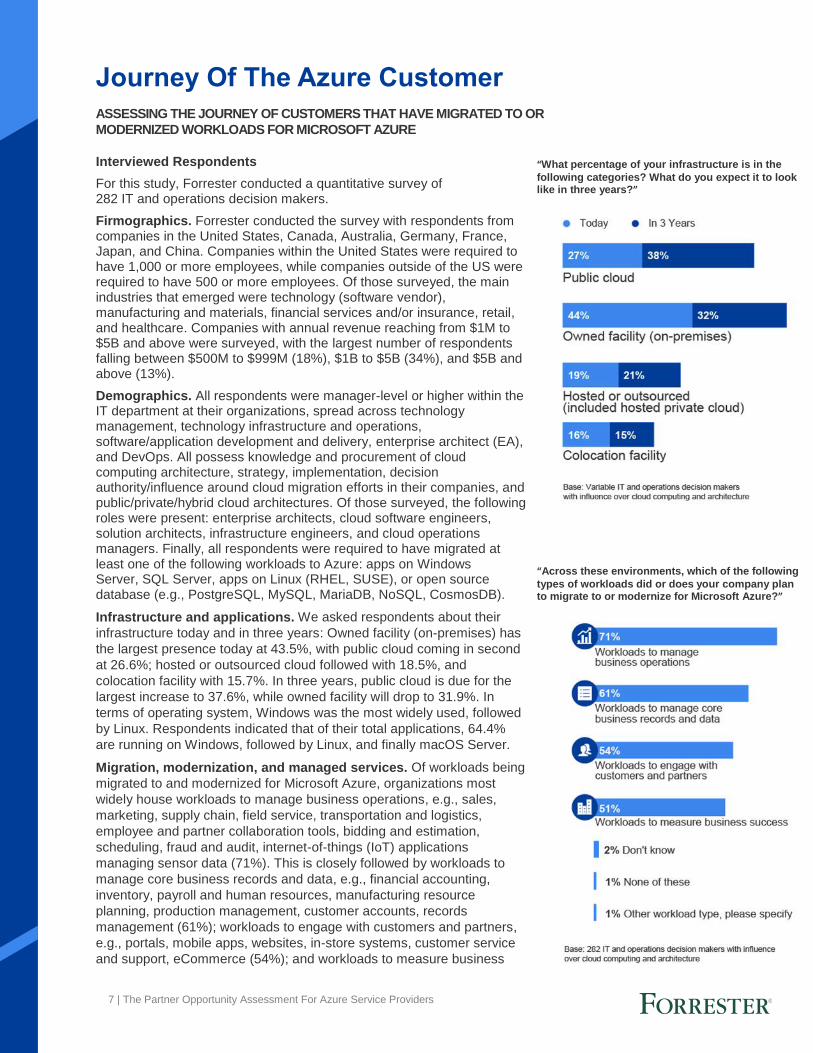
Infrastructure and applications. We asked respondents about their
infrastructure today and in three years: Owned facility (on-premises) has
the largest presence today at 43.5%, with public cloud coming in second
at 26.6%; hosted or outsourced cloud followed with 18.5%, and
colocation facility with 15.7%. In three years, public cloud is due for the
largest increase to 37.6%, while owned facility will drop to 31.9%. In
terms of operating system, Windows was the most widely used, followed
by Linux. Respondents indicated that of their total applications, 64.4%
are running on Windows, followed by Linux, and finally macOS Server.
Migration, modernization, and managed services. Of workloads being
migrated to and modernized for Microsoft Azure, organizations most
widely house workloads to manage business operations, e.g., sales,
marketing, supply chain, field service, transportation and logistics,
employee and partner collaboration tools, bidding and estimation,
scheduling, fraud and audit, internet-of-things (IoT) applications
managing sensor data (71%). This is closely followed by workloads to
manage core business records and data, e.g., financial accounting,
inventory, payroll and human resources, manufacturing resource
planning, production management, customer accounts, records
management (61%); workloads to engage with customers and partners,
e.g., portals, mobile apps, websites, in-store systems, customer service
and support, eCommerce (54%); and workloads to measure business
“What percentage of your infrastructure is in the
following categories? What do you expect it to look like in three years?”
“Across these environments, which of the following
types of workloads did or does your company plan to migrate to or modernize for Microsoft Azure?”
8 | The Partner Opportunity Assessment For Azure Service Providers
success, e.g., business
analysis and reporting, big
data and advanced
analytics, business
performance analysis
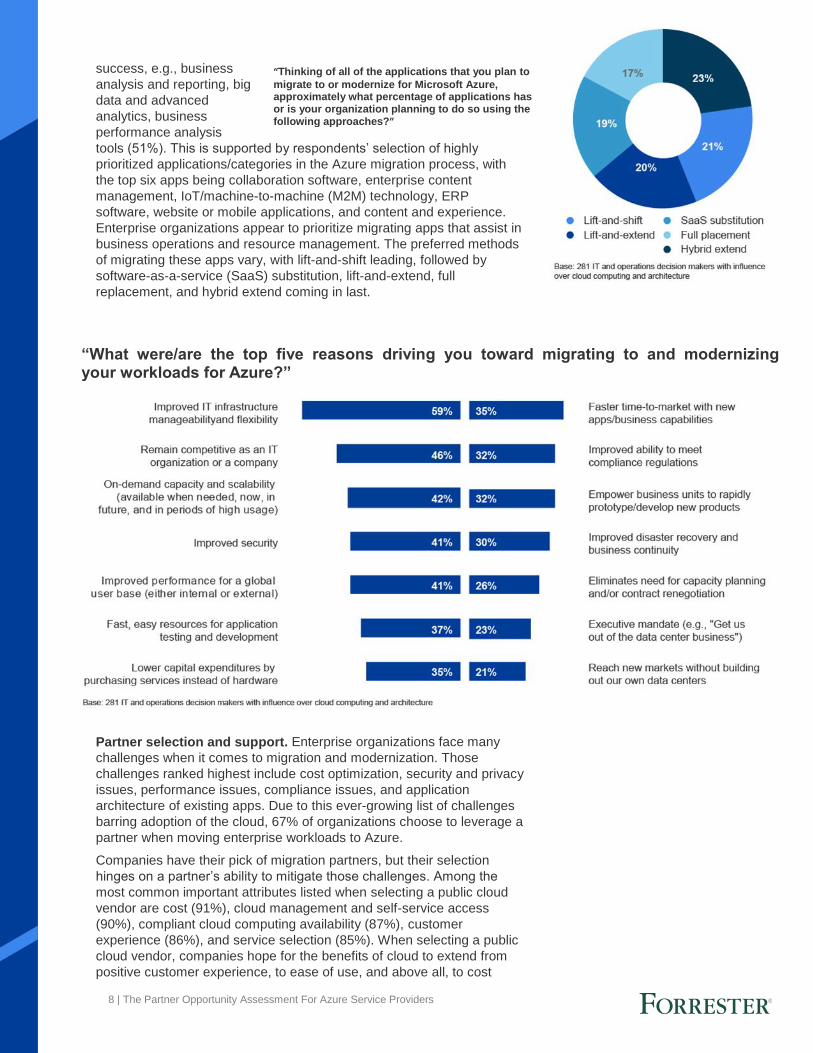
tools (51%). This is supported by respondents’ selection of highly
prioritized applications/categories in the Azure migration process, with
the top six apps being collaboration software, enterprise content
management, IoT/machine-to-machine (M2M) technology, ERP
software, website or mobile applications, and content and experience.
Enterprise organizations appear to prioritize migrating apps that assist in
business operations and resource management. The preferred methods
of migrating these apps vary, with lift-and-shift leading, followed by
software-as-a-service (SaaS) substitution, lift-and-extend, full
replacement, and hybrid extend coming in last.
Partner selection and support. Enterprise organizations face many
challenges when it comes to migration and modernization. Those
challenges ranked highest include cost optimization, security and privacy
issues, performance issues, compliance issues, and application
architecture of existing apps. Due to this ever-growing list of challenges
barring adoption of the cloud, 67% of organizations choose to leverage a
partner when moving enterprise workloads to Azure.
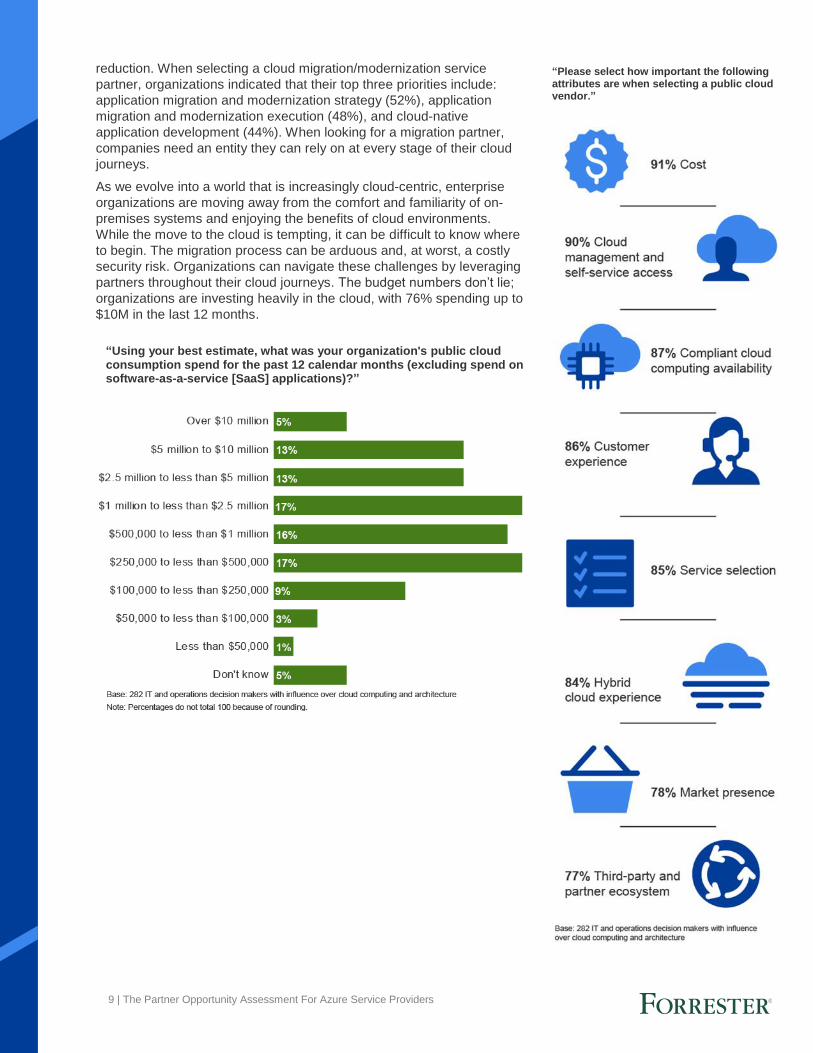
Companies have their pick of migration partners, but their selection
hinges on a partner’s ability to mitigate those challenges. Among the
most common important attributes listed when selecting a public cloud
vendor are cost (91%), cloud management and self-service access
(90%), compliant cloud computing availability (87%), customer
experience (86%), and service selection (85%). When selecting a public
cloud vendor, companies hope for the benefits of cloud to extend from
positive customer experience, to ease of use, and above all, to cost
“What were/are the top five reasons driving you toward migrating to and modernizing your workloads for Azure?”
“Thinking of all of the applications that you plan to
migrate to or modernize for Microsoft Azure, approximately what percentage of applications has or is your organization planning to do so using the following approaches?”
9 | The Partner Opportunity Assessment For Azure Service Providers
reduction. When selecting a cloud migration/modernization service
partner, organizations indicated that their top three priorities include:
application migration and modernization strategy (52%), application
migration and modernization execution (48%), and cloud-native
application development (44%). When looking for a migration partner,
companies need an entity they can rely on at every stage of their cloud
journeys.
As we evolve into a world that is increasingly cloud-centric, enterprise
organizations are moving away from the comfort and familiarity of on-
premises systems and enjoying the benefits of cloud environments.
While the move to the cloud is tempting, it can be difficult to know where
to begin. The migration process can be arduous and, at worst, a costly
security risk. Organizations can navigate these challenges by leveraging
partners throughout their cloud journeys. The budget numbers don’t lie;
organizations are investing heavily in the cloud, with 76% spending up to
$10M in the last 12 months.
“Using your best estimate, what was your organization's public cloud consumption spend for the past 12 calendar months (excluding spend on software-as-a-service [SaaS] applications)?”
“Please select how important the following attributes are when selecting a public cloud vendor.”
10 | The Partner Opportunity Assessment For Azure Service Providers
Analysis
For this study, Forrester conducted 14 interviews with existing Azure
partners with experience building and scaling an Azure practice by
delivering end-to-end migration, modernization, and next generation
managed services. Forrester interviewed a diverse set of Azure
partners, including Azure expert managed service providers (MSPs),
application development shops, and system integrators (SIs).
Key Partner Challenges
Interviewed partners grappled with a number of common challenges and
complexities in building and scaling their Azure practices:
› Customers are increasingly mature in their cloud journeys. As
businesses and enterprises continue to gain a richer understanding of
the potential of cloud computing, conversations around the cloud are
moving beyond the topic of cost savings to now unlocking unique cloud
use cases, such as those leveraging AI, machine learning (ML), or IoT.
At the same time, these conversations no longer just involve IT.
Because of the evolution of PaaS as well as the role of partners in
helping abstract the complexity of the cloud, technical know-how is no
longer a prerequisite to becoming involved in, or even procuring, cloud
services. Consequently, partners are finding that cloud budgets and
decision makers are increasingly found in the lines of businesses
rather than IT. The implication for partners is a fundamental shift in the
type of practice-level investments made, the breadth of services
offered, and the way they pitch and position their services to
customers, all with a greater emphasis on delivering business
outcomes.
› IaaS is now just the first of many steps. Just a few years ago,
partners could create and effectively scale their practices by solely
offering lift-and-shift services to the cloud across a variety of
workloads. Today, customers see the lift-and-shift as just the initial
piece of a broader transformation journey. Customers expect partners
to be able to drive this transformation for them from front to end,
allowing them to move the right workloads to the cloud at the right
time, while optimizing each workload for the most effective deployment
model and architectural framework. For partners, it is therefore
increasingly important to be well-rounded across both IaaS and PaaS
deployments, particularly if the partner expects to retain the customer
beyond the initial migration stage.
“Infrastructure is just one piece
of the puzzle. The spinning of
VMs on Azure versus another
cloud provider is not the
exciting piece. The exciting
piece is getting them on Azure,
continuing to optimize their
environment, and looking at
what could become more
native on Azure so we can
start leveraging Azure services
beyond just the infrastructure
side of things.”
Chief strategy officer,
North America Azure partner
“The drivers of cloud
transformation are now coming
from the business side, not
from IT. There’s an exciting
opportunity to leverage
services on Azure beyond just
the infrastructure side, and
we’re just scratching the
surface of it.”
Chief technology officer,
North America Azure partner
11 | The Partner Opportunity Assessment For Azure Service Providers
› Deal characteristics are changing. In light of a rapidly changing
cloud landscape, customers are taking a much more piecemeal
approach to their migrations in favor of maintaining business agility.
Many interviewed partners have begun to deliver their professional
services engagements in a shorter timeframe to demonstrate some
quick wins and gain approval to start the next phase of the migration.
Others have opted to perform some professional services, such as
technical assessments, for free as part of presales efforts to identify
areas where they could immediately add value. Forrester believes that
these presales services are a critical part of securing migration and
modernization deals.1 Finally, partners have noticed an increased
demand for innovative services, such as application modernization or
cloud-native application development. One partner commented,
“Because of digital transformation, our projects have gone from two- to
four-year engagements to now six to 12 months, and we’re needing to
do much more innovative work.”
› New services require a new skill set. Given the changing dynamics
across customers, services, and deal characteristics noted above,
interviewed partners needed to ensure that they had the right talent in
place to build their Azure practices around. The convergence of
Windows, SQL, Linux, and open source workloads in migration deals,
for instance, meant that practice engineers, architects, and developers
needed to be well-versed in multiple workloads. One partner
described: “We don’t find very many projects where it’s just one of
those workloads (Windows, SQL, Linux, open source). Most of our
projects include at least three, if not all of those.” Lastly, partners found
that it was not enough to just hire the right skill sets. Without an
adequate investment in internal training programs, partners could not
effectively create and maintain deep expertise in practice focus areas,
such as building unique customer-facing IP or delivering services
around targeted horizontals, verticals, or usage of emerging
technologies on Azure.
Shaping A Successful Azure Practice
In light of the aforementioned challenges, successful partners made
strategic decisions around the types of practice-level investments made,
services offered, and go-to-market approaches used to ensure continued
growth of their Azure practices. Interviewed partners shared the following
best practices:
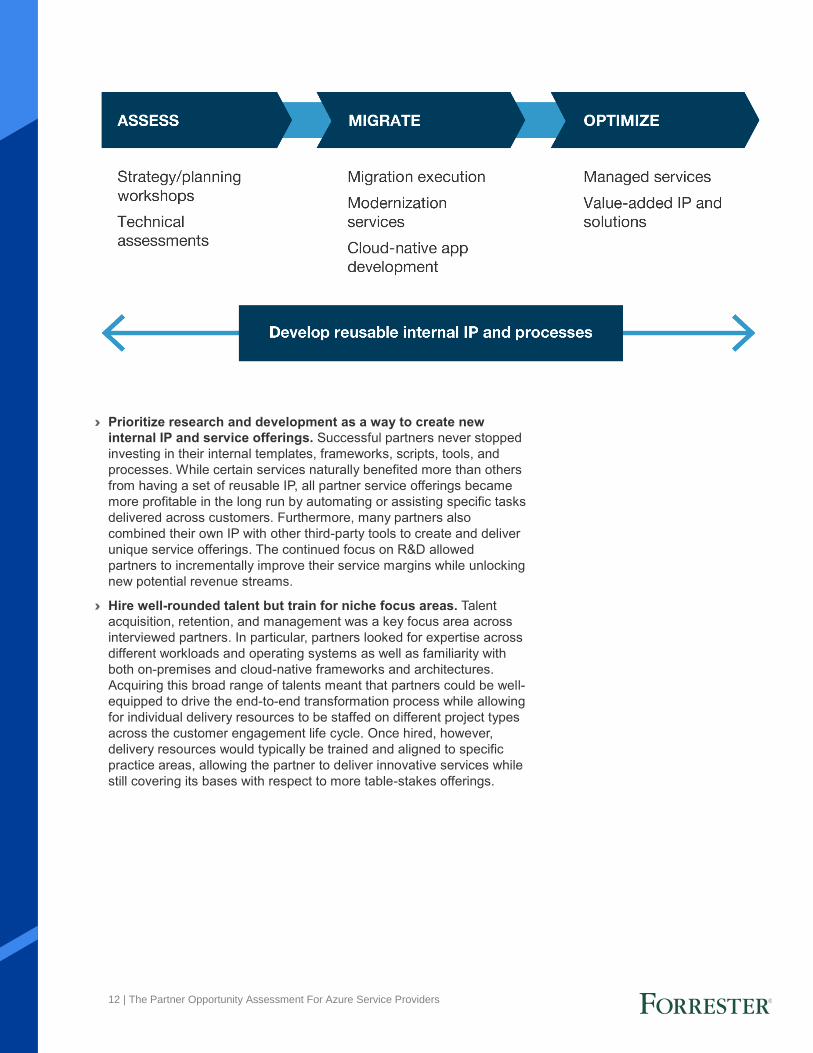
› Own the full customer engagement life cycle. Today’s customers
expect partners to be able to provide them with a comprehensive
portfolio of services as they make their journeys to the cloud whereas
in the past, customers were more willing to procure services with
multiple partners for disparate needs. While interviewed partners built
and offered expertise in various areas, almost all partners offered
some degree of services across the three stages of the customer
engagement life cycle depicted in the chart below: 1) assess; 2)
migrate; and, 3) optimize. In doing so, partners boosted win rates,
raised overall retention, and achieved pull-through revenues across
different professional and managed services, ultimately improving
practice-level operating margins over time.
“We don’t find very many
projects where it’s just one of
those workloads (Windows,
SQL, Linux, open source).
Most of our projects include at
least three, if not all of those.”
Infrastructure practice lead,
North America Azure partner
“Because of digital
transformation, our projects
have gone from two- to four-
year engagements to now six
to 12 months, and we’re
needing to do much more
innovative work.”
Managing director,
EMEA Azure partner
12 | The Partner Opportunity Assessment For Azure Service Providers
› Prioritize research and development as a way to create new
internal IP and service offerings. Successful partners never stopped
investing in their internal templates, frameworks, scripts, tools, and
processes. While certain services naturally benefited more than others
from having a set of reusable IP, all partner service offerings became
more profitable in the long run by automating or assisting specific tasks
delivered across customers. Furthermore, many partners also
combined their own IP with other third-party tools to create and deliver
unique service offerings. The continued focus on R&D allowed
partners to incrementally improve their service margins while unlocking
new potential revenue streams.
› Hire well-rounded talent but train for niche focus areas. Talent
acquisition, retention, and management was a key focus area across
interviewed partners. In particular, partners looked for expertise across
different workloads and operating systems as well as familiarity with
both on-premises and cloud-native frameworks and architectures.
Acquiring this broad range of talents meant that partners could be well-
equipped to drive the end-to-end transformation process while allowing
for individual delivery resources to be staffed on different project types
across the customer engagement life cycle. Once hired, however,
delivery resources would typically be trained and aligned to specific
practice areas, allowing the partner to deliver innovative services while
still covering its bases with respect to more table-stakes offerings.
13 | The Partner Opportunity Assessment For Azure Service Providers
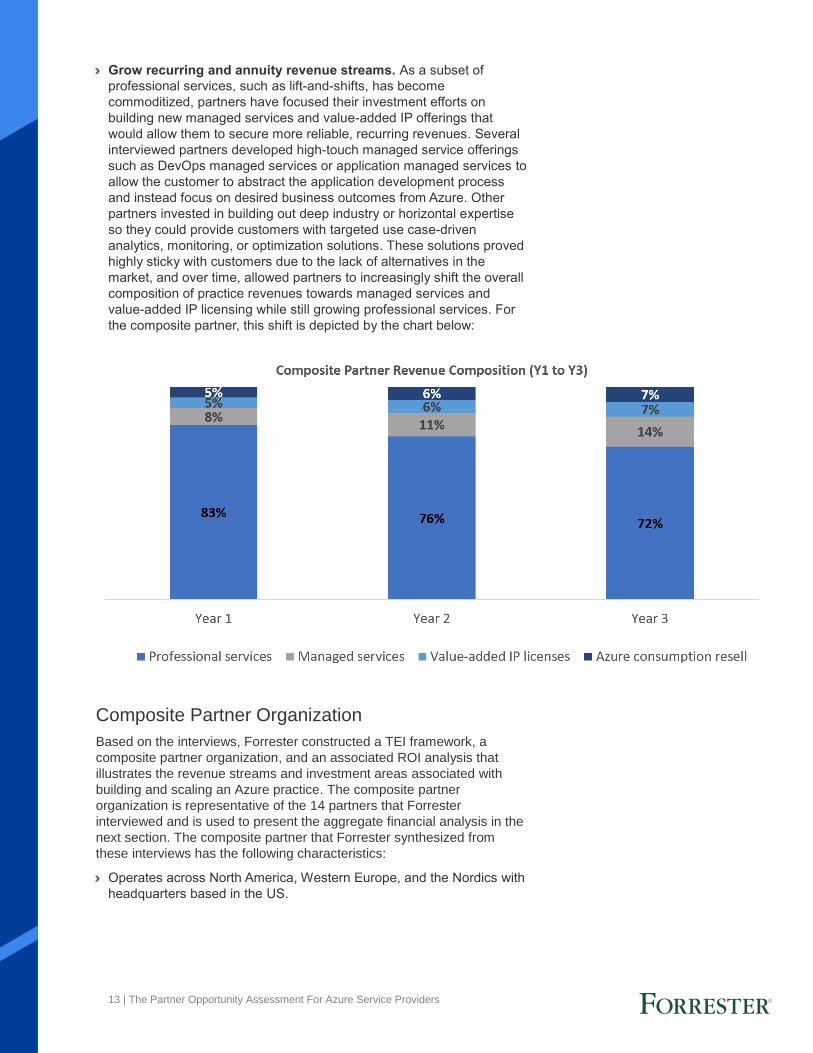
› Grow recurring and annuity revenue streams. As a subset of
professional services, such as lift-and-shifts, has become
commoditized, partners have focused their investment efforts on
building new managed services and value-added IP offerings that
would allow them to secure more reliable, recurring revenues. Several
interviewed partners developed high-touch managed service offerings
such as DevOps managed services or application managed services to
allow the customer to abstract the application development process
and instead focus on desired business outcomes from Azure. Other
partners invested in building out deep industry or horizontal expertise
so they could provide customers with targeted use case-driven
analytics, monitoring, or optimization solutions. These solutions proved
highly sticky with customers due to the lack of alternatives in the
market, and over time, allowed partners to increasingly shift the overall
composition of practice revenues towards managed services and
value-added IP licensing while still growing professional services. For
the composite partner, this shift is depicted by the chart below:
Composite Partner Organization
Based on the interviews, Forrester constructed a TEI framework, a
composite partner organization, and an associated ROI analysis that
illustrates the revenue streams and investment areas associated with
building and scaling an Azure practice. The composite partner
organization is representative of the 14 partners that Forrester
interviewed and is used to present the aggregate financial analysis in the
next section. The composite partner that Forrester synthesized from
these interviews has the following characteristics:
› Operates across North America, Western Europe, and the Nordics with
headquarters based in the US.
14 | The Partner Opportunity Assessment For Azure Service Providers
› Offers its customers a broad portfolio of services around Azure,
including business support through reselling agreements, migration,
modernization, and innovation professional and next generation
managed services, and value-added IP licensing for targeted use
case-driven solutions. Additionally, the partner holds competencies
across Windows, SQL Linux, and other open
source workloads.
› Total Azure practice revenues started at $20
million in Year 1 and grew to over $65 million in
Year 3 as the partner organically acquired new
customers, deepened relationships with existing
customers, and continued to focus on incremental
margin improvement. Similarly, the partner
serviced 28 net-new customers in Year 1, growing
to 50 net-new customers by Year 3.
› Prior to starting an Azure practice, the partner
already had an existing practice to offer its customers services and
solutions around a different cloud platform. Over time, the partner
recognized the demand for Azure services, particularly given factors
such as the number of Microsoft enterprise workloads that customers
were using and the increasing prevalence of multicloud deployments.
› Y1 to Y3 revenues: $20M to $65M
› Y1 to Y3 new customers: 28 to 50
› Competencies across Windows,
Linux, and open source workloads
15 | The Partner Opportunity Assessment For Azure Service Providers
Financial Analysis
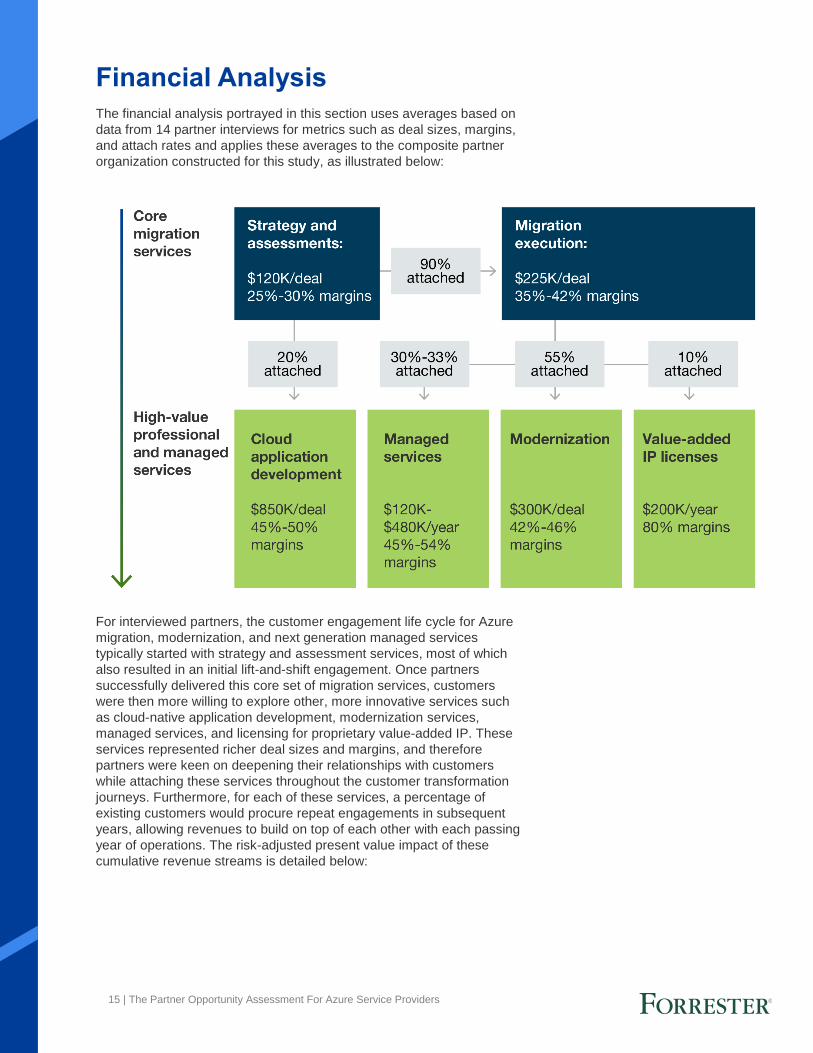
The financial analysis portrayed in this section uses averages based on
data from 14 partner interviews for metrics such as deal sizes, margins,
and attach rates and applies these averages to the composite partner
organization constructed for this study, as illustrated below:
For interviewed partners, the customer engagement life cycle for Azure
migration, modernization, and next generation managed services
typically started with strategy and assessment services, most of which
also resulted in an initial lift-and-shift engagement. Once partners
successfully delivered this core set of migration services, customers
were then more willing to explore other, more innovative services such
as cloud-native application development, modernization services,
managed services, and licensing for proprietary value-added IP. These
services represented richer deal sizes and margins, and therefore
partners were keen on deepening their relationships with customers
while attaching these services throughout the customer transformation
journeys. Furthermore, for each of these services, a percentage of
existing customers would procure repeat engagements in subsequent
years, allowing revenues to build on top of each other with each passing
year of operations. The risk-adjusted present value impact of these
cumulative revenue streams is detailed below:
16 | The Partner Opportunity Assessment For Azure Service Providers
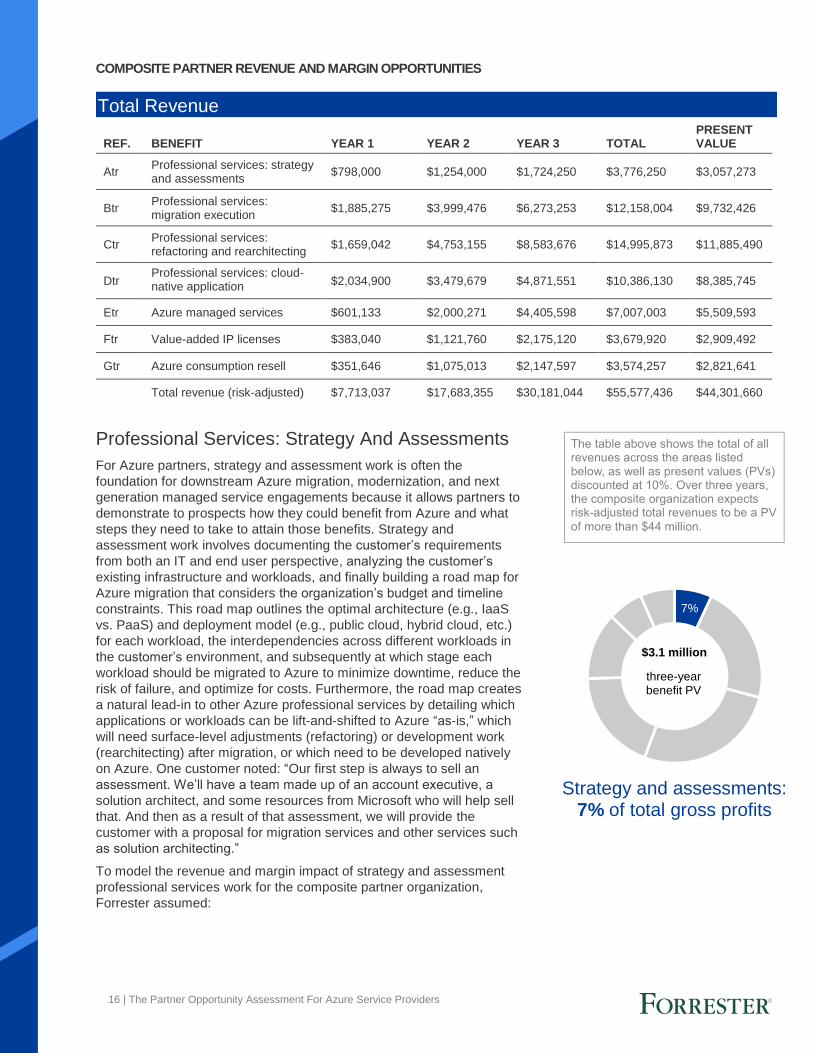
The table above shows the total of all revenues across the areas listed below, as well as present values (PVs) discounted at 10%. Over three years, the composite organization expects risk-adjusted total revenues to be a PV
of more than $44 million.
7%
three-year benefit PV
$3.1 million
Strategy and assessments: 7% of total gross profits
COMPOSITE PARTNER REVENUE AND MARGIN OPPORTUNITIES
Professional Services: Strategy And Assessments
For Azure partners, strategy and assessment work is often the
foundation for downstream Azure migration, modernization, and next
generation managed service engagements because it allows partners to
demonstrate to prospects how they could benefit from Azure and what
steps they need to take to attain those benefits. Strategy and
assessment work involves documenting the customer’s requirements
from both an IT and end user perspective, analyzing the customer’s
existing infrastructure and workloads, and finally building a road map for
Azure migration that considers the organization’s budget and timeline
constraints. This road map outlines the optimal architecture (e.g., IaaS
vs. PaaS) and deployment model (e.g., public cloud, hybrid cloud, etc.)
for each workload, the interdependencies across different workloads in
the customer’s environment, and subsequently at which stage each
workload should be migrated to Azure to minimize downtime, reduce the
risk of failure, and optimize for costs. Furthermore, the road map creates
a natural lead-in to other Azure professional services by detailing which
applications or workloads can be lift-and-shifted to Azure “as-is,” which
will need surface-level adjustments (refactoring) or development work
(rearchitecting) after migration, or which need to be developed natively
on Azure. One customer noted: “Our first step is always to sell an
assessment. We’ll have a team made up of an account executive, a
solution architect, and some resources from Microsoft who will help sell
that. And then as a result of that assessment, we will provide the
customer with a proposal for migration services and other services such
as solution architecting.”
To model the revenue and margin impact of strategy and assessment
professional services work for the composite partner organization,
Forrester assumed:
Total Revenue
REF. BENEFIT YEAR 1 YEAR 2 YEAR 3 TOTAL PRESENT VALUE
Atr Professional services: strategy and assessments
$798,000 $1,254,000 $1,724,250 $3,776,250 $3,057,273
Btr Professional services: migration execution
$1,885,275 $3,999,476 $6,273,253 $12,158,004 $9,732,426
Ctr Professional services: refactoring and rearchitecting
$1,659,042 $4,753,155 $8,583,676 $14,995,873 $11,885,490
Dtr Professional services: cloud-native application development
$2,034,900 $3,479,679 $4,871,551 $10,386,130 $8,385,745
Etr Azure managed services $601,133 $2,000,271 $4,405,598 $7,007,003 $5,509,593
Ftr Value-added IP licenses $383,040 $1,121,760 $2,175,120 $3,679,920 $2,909,492
Gtr Azure consumption resell $351,646 $1,075,013 $2,147,597 $3,574,257 $2,821,641
Total revenue (risk-adjusted) $7,713,037 $17,683,355 $30,181,044 $55,577,436 $44,301,660
17 | The Partner Opportunity Assessment For Azure Service Providers
Impact risk is the risk that the business or technology needs of the organization may not be met by the investment, resulting in lower overall total revenues. The greater the uncertainty, the wider the potential range of outcomes for benefit estimates.
› Each new customer needed a single migration strategy and
assessment engagement. The composite partner then created a road
map as an output of each engagement, revealing any additional
professional services work or migration activity needed in subsequent
years.
› The average deal size per strategy and assessment engagement was
$120,000. Across partner interviewees, deal sizes ranged from
$30,000 on the low end to $200,000 on the high end, depending on the
size, deployment characteristics, and complexity of the customer’s
environment, as well as the resources and time needed to deliver the
engagement on the partner side. Typically, strategy and assessment
engagements involved a small team of between one to three technical
delivery resources and lasted anywhere from one to six weeks.
› Average strategy and assessment gross margins ranged from 25% in
Year 1 to 30% in Year 3 as partners accumulated experience and
continued to invest in reusable templates and processes to reduce
direct delivery costs.
Strategy and assessment project revenues and gross margins varied
widely across partners due to differences in factors such as pricing
models (e.g., fixed vs. variable), competitive pressures, and the degree
to which processes, such as technical workload assessments, could be
automated. Additionally, some partners opted to partially or entirely
absorb the cost of strategy and assessment work as a presales activity
to gain an entryway into other, more profitable Azure services.
To account for these variances, Forrester adjusted this gross profit
category downward by 5%, yielding a three-year risk-adjusted total PV of
$3,057,273.
Professional Services: Migration Execution
Following a strategy and assessment engagement, organizations have a
clear path to digitally transforming their workloads on Azure. However,
before committing to more complex and often more expensive projects
involving refactoring or rearchitecting of applications to perform optimally
in the cloud, organizations typically look to lift-and-shift workloads to IaaS
first to “proof-of-concept” certain benefits, such as the cost savings
potential of migrating to Azure. At the same time, organizations
Strategy And Assessments: Calculation Table
REF. METRIC CALC. YEAR 1 YEAR 2 YEAR 3
A1 Number of strategy sessions and migration planning assessments completed
28 40 50
A2 Average strategy and assessments deal size $120,000 $120,000 $120,000
A3 Total strategy and assessments revenues A1*A2 $3,360,000 $4,800,000 $6,000,000
A4 Average strategy and assessments gross margin
25.00% 28.50% 30.25%
At Professional services: strategy and assessments
A3*A4 $840,000 $1,320,000 $1,815,000
Risk adjustment ↓5%
Atr Professional services: strategy and assessments (risk-adjusted)
$798,000 $1,254,000 $1,724,250
“Our first step is always to sell
an assessment. We’ll have a
team made up of an account
executive, a solution architect,
and some resources from
Microsoft who will help sell
that. And then as a result of
that assessment, we will
provide the customer with a
proposal for migration services
and other services such as
solution architecting.”
VP of market development,
North America Azure partner
18 | The Partner Opportunity Assessment For Azure Service Providers
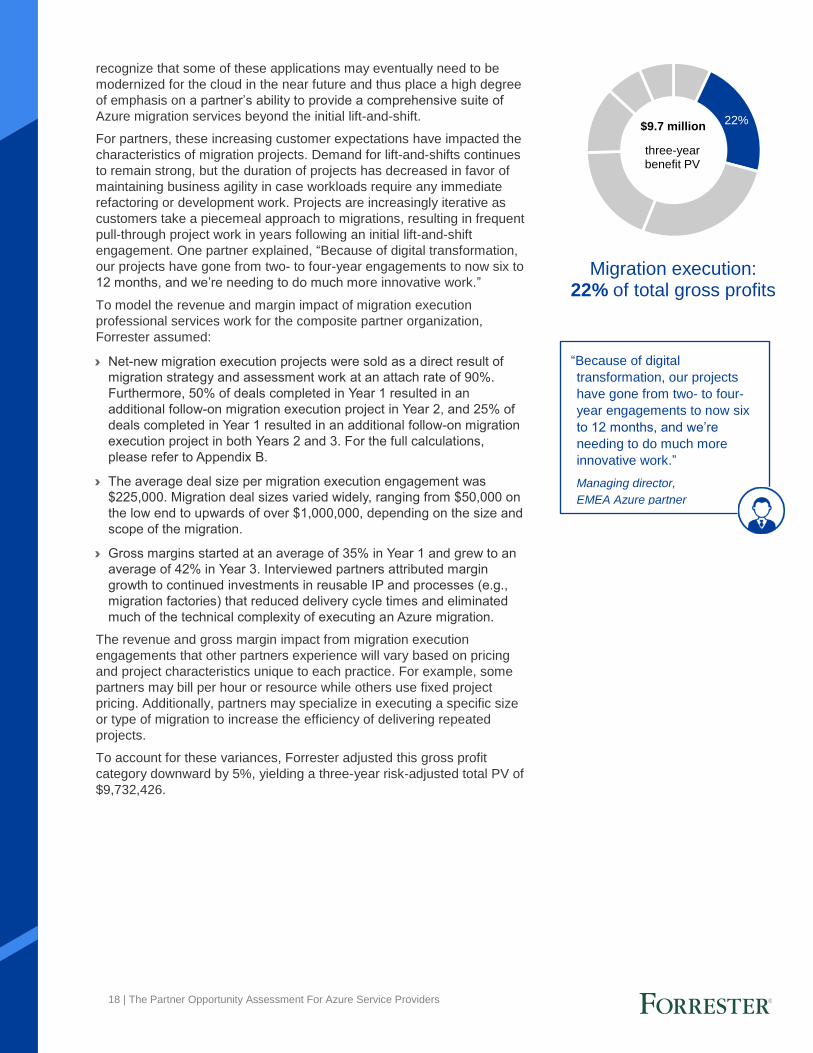
Migration execution: 22% of total gross profits
22%
three-year benefit PV
$9.7 million
recognize that some of these applications may eventually need to be
modernized for the cloud in the near future and thus place a high degree
of emphasis on a partner’s ability to provide a comprehensive suite of
Azure migration services beyond the initial lift-and-shift.
For partners, these increasing customer expectations have impacted the
characteristics of migration projects. Demand for lift-and-shifts continues
to remain strong, but the duration of projects has decreased in favor of
maintaining business agility in case workloads require any immediate
refactoring or development work. Projects are increasingly iterative as
customers take a piecemeal approach to migrations, resulting in frequent
pull-through project work in years following an initial lift-and-shift
engagement. One partner explained, “Because of digital transformation,
our projects have gone from two- to four-year engagements to now six to
12 months, and we’re needing to do much more innovative work.”
To model the revenue and margin impact of migration execution
professional services work for the composite partner organization,
Forrester assumed:
› Net-new migration execution projects were sold as a direct result of
migration strategy and assessment work at an attach rate of 90%.
Furthermore, 50% of deals completed in Year 1 resulted in an
additional follow-on migration execution project in Year 2, and 25% of
deals completed in Year 1 resulted in an additional follow-on migration
execution project in both Years 2 and 3. For the full calculations,
please refer to Appendix B.
› The average deal size per migration execution engagement was
$225,000. Migration deal sizes varied widely, ranging from $50,000 on
the low end to upwards of over $1,000,000, depending on the size and
scope of the migration.
› Gross margins started at an average of 35% in Year 1 and grew to an
average of 42% in Year 3. Interviewed partners attributed margin
growth to continued investments in reusable IP and processes (e.g.,
migration factories) that reduced delivery cycle times and eliminated
much of the technical complexity of executing an Azure migration.
The revenue and gross margin impact from migration execution
engagements that other partners experience will vary based on pricing
and project characteristics unique to each practice. For example, some
partners may bill per hour or resource while others use fixed project
pricing. Additionally, partners may specialize in executing a specific size
or type of migration to increase the efficiency of delivering repeated
projects.
To account for these variances, Forrester adjusted this gross profit
category downward by 5%, yielding a three-year risk-adjusted total PV of
$9,732,426.
“Because of digital
transformation, our projects
have gone from two- to four-
year engagements to now six
to 12 months, and we’re
needing to do much more
innovative work.”
Managing director,
EMEA Azure partner
19 | The Partner Opportunity Assessment For Azure Service Providers
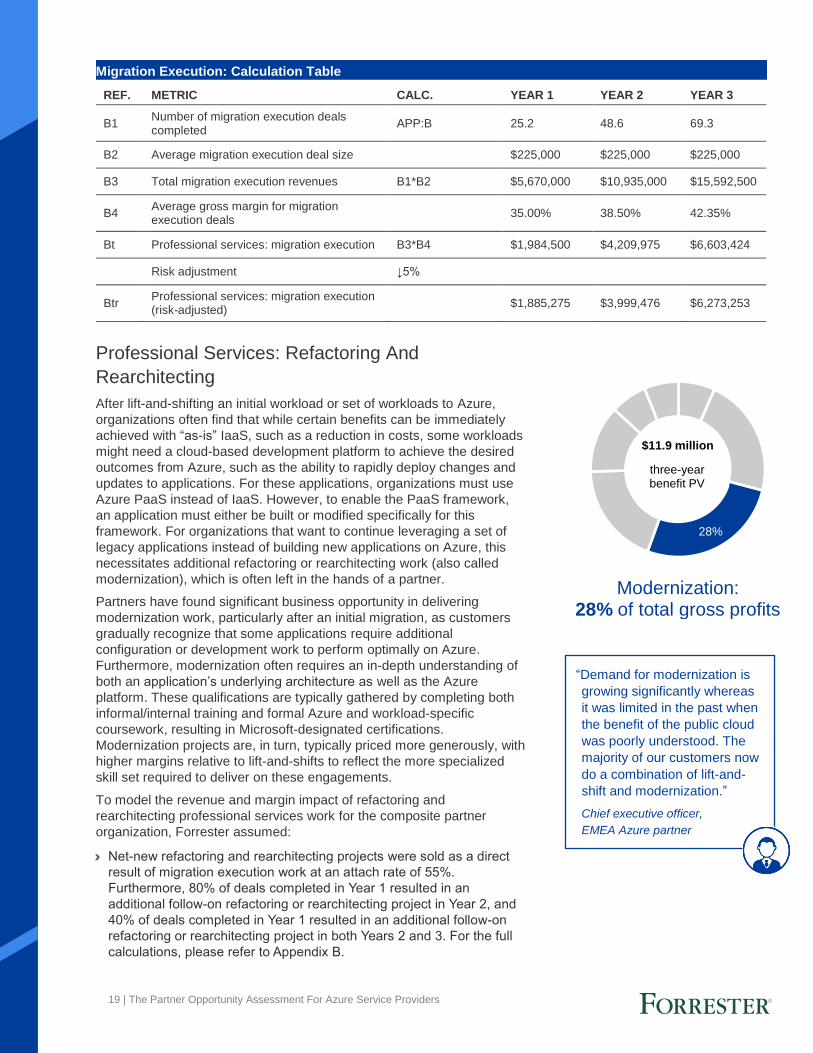
Modernization: 28% of total gross profits
28%
three-year benefit PV
$11.9 million
Professional Services: Refactoring And
Rearchitecting
After lift-and-shifting an initial workload or set of workloads to Azure,
organizations often find that while certain benefits can be immediately
achieved with “as-is” IaaS, such as a reduction in costs, some workloads
might need a cloud-based development platform to achieve the desired
outcomes from Azure, such as the ability to rapidly deploy changes and
updates to applications. For these applications, organizations must use
Azure PaaS instead of IaaS. However, to enable the PaaS framework,
an application must either be built or modified specifically for this
framework. For organizations that want to continue leveraging a set of
legacy applications instead of building new applications on Azure, this
necessitates additional refactoring or rearchitecting work (also called
modernization), which is often left in the hands of a partner.
Partners have found significant business opportunity in delivering
modernization work, particularly after an initial migration, as customers
gradually recognize that some applications require additional
configuration or development work to perform optimally on Azure.
Furthermore, modernization often requires an in-depth understanding of
both an application’s underlying architecture as well as the Azure
platform. These qualifications are typically gathered by completing both
informal/internal training and formal Azure and workload-specific
coursework, resulting in Microsoft-designated certifications.
Modernization projects are, in turn, typically priced more generously, with
higher margins relative to lift-and-shifts to reflect the more specialized
skill set required to deliver on these engagements.
To model the revenue and margin impact of refactoring and
rearchitecting professional services work for the composite partner
organization, Forrester assumed:
› Net-new refactoring and rearchitecting projects were sold as a direct
result of migration execution work at an attach rate of 55%.
Furthermore, 80% of deals completed in Year 1 resulted in an
additional follow-on refactoring or rearchitecting project in Year 2, and
40% of deals completed in Year 1 resulted in an additional follow-on
refactoring or rearchitecting project in both Years 2 and 3. For the full
calculations, please refer to Appendix B.
Migration Execution: Calculation Table
REF. METRIC CALC. YEAR 1 YEAR 2 YEAR 3
B1 Number of migration execution deals completed
APP:B 25.2 48.6 69.3
B2 Average migration execution deal size $225,000 $225,000 $225,000
B3 Total migration execution revenues B1*B2 $5,670,000 $10,935,000 $15,592,500
B4 Average gross margin for migration execution deals
35.00% 38.50% 42.35%
Bt Professional services: migration execution B3*B4 $1,984,500 $4,209,975 $6,603,424
Risk adjustment ↓5%
Btr Professional services: migration execution (risk-adjusted)
$1,885,275 $3,999,476 $6,273,253
“Demand for modernization is
growing significantly whereas
it was limited in the past when
the benefit of the public cloud
was poorly understood. The
majority of our customers now
do a combination of lift-and-
shift and modernization.”
Chief executive officer,
EMEA Azure partner
20 | The Partner Opportunity Assessment For Azure Service Providers
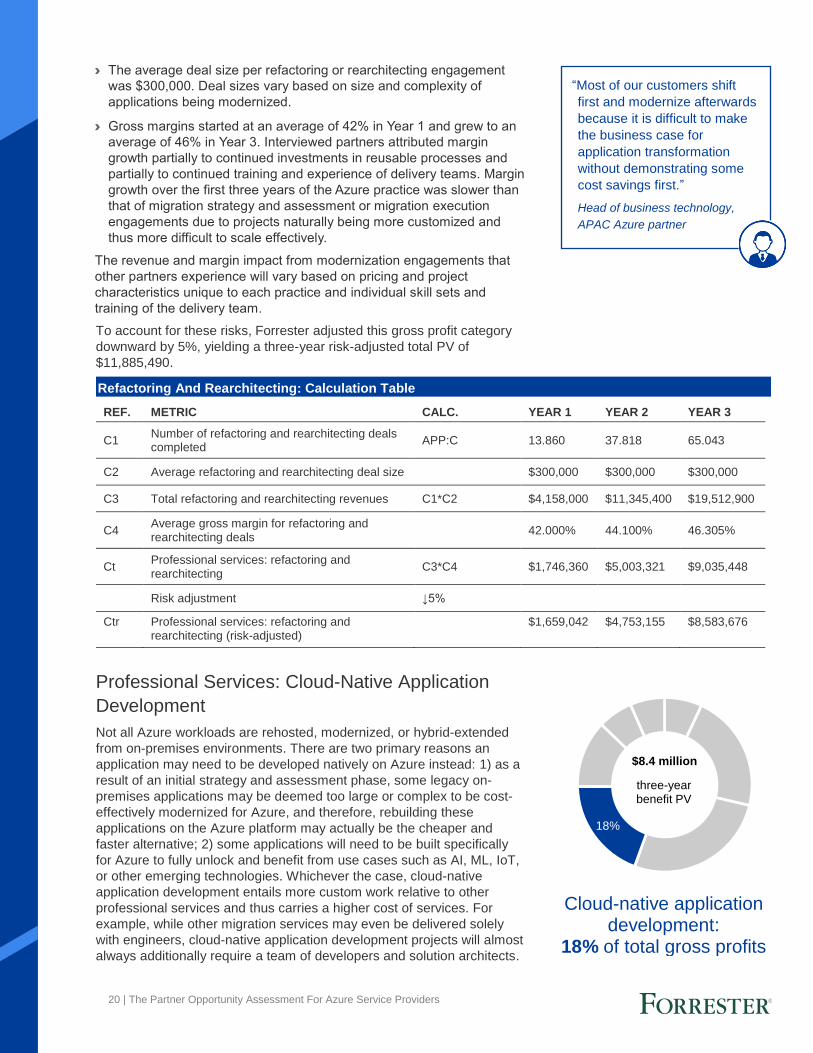
18%
three-year benefit PV
$8.4 million
Cloud-native application development:
18% of total gross profits
› The average deal size per refactoring or rearchitecting engagement
was $300,000. Deal sizes vary based on size and complexity of
applications being modernized.
› Gross margins started at an average of 42% in Year 1 and grew to an
average of 46% in Year 3. Interviewed partners attributed margin
growth partially to continued investments in reusable processes and
partially to continued training and experience of delivery teams. Margin
growth over the first three years of the Azure practice was slower than
that of migration strategy and assessment or migration execution
engagements due to projects naturally being more customized and
thus more difficult to scale effectively.
The revenue and margin impact from modernization engagements that
other partners experience will vary based on pricing and project
characteristics unique to each practice and individual skill sets and
training of the delivery team.
To account for these risks, Forrester adjusted this gross profit category
downward by 5%, yielding a three-year risk-adjusted total PV of
$11,885,490.
Professional Services: Cloud-Native Application
Development
Not all Azure workloads are rehosted, modernized, or hybrid-extended
from on-premises environments. There are two primary reasons an
application may need to be developed natively on Azure instead: 1) as a
result of an initial strategy and assessment phase, some legacy on-
premises applications may be deemed too large or complex to be cost-
effectively modernized for Azure, and therefore, rebuilding these
applications on the Azure platform may actually be the cheaper and
faster alternative; 2) some applications will need to be built specifically
for Azure to fully unlock and benefit from use cases such as AI, ML, IoT,
or other emerging technologies. Whichever the case, cloud-native
application development entails more custom work relative to other
professional services and thus carries a higher cost of services. For
example, while other migration services may even be delivered solely
with engineers, cloud-native application development projects will almost
always additionally require a team of developers and solution architects.
Refactoring And Rearchitecting: Calculation Table
REF. METRIC CALC. YEAR 1 YEAR 2 YEAR 3
C1 Number of refactoring and rearchitecting deals completed
APP:C 13.860 37.818 65.043
C2 Average refactoring and rearchitecting deal size $300,000 $300,000 $300,000
C3 Total refactoring and rearchitecting revenues C1*C2 $4,158,000 $11,345,400 $19,512,900
C4 Average gross margin for refactoring and rearchitecting deals
42.000% 44.100% 46.305%
Ct Professional services: refactoring and rearchitecting
C3*C4 $1,746,360 $5,003,321 $9,035,448
Risk adjustment ↓5%
Ctr Professional services: refactoring and rearchitecting (risk-adjusted)
$1,659,042 $4,753,155 $8,583,676
“Most of our customers shift
first and modernize afterwards
because it is difficult to make
the business case for
application transformation
without demonstrating some
cost savings first.”
Head of business technology,
APAC Azure partner
21 | The Partner Opportunity Assessment For Azure Service Providers
Reflecting this higher cost of services, partners sold cloud-native
application projects at a significant premium to other professional
services engagements. Consequently, these projects were mostly
procured by large enterprises as part of broader technology adoption or
transformational efforts. One partner described: “We had a large
customer come to us looking to build a brand-new asset management
product leveraging IoT. First, they just wanted us to do a feasibility study
to see if IoT would be a good fit. But once we proved that it could work,
they then asked us for the whole gamut, including building, deploying,
and operationalizing the solution using Azure.” Finally, partners found
that cloud-native application work often led to application or DevOps
managed services arrangements, since customers’ internal teams would
have had limited to no experience managing the new applications
themselves. In fact, one interviewed partner asserted that this end-to-end
application development and management work might even become an
expected service in the near horizon. This partner said: “The future is
application portfolio management. You’re going to need to be able to go
to a customer and say, ‘I could build you five or six additional revenue
streams and I can also manage and continue to drive all of those going
forward.’”
To model the revenue and margin impact of cloud-native application
development services for the composite partner organization, Forrester
assumed:
› Net-new cloud-native application development projects were sold as a
direct result of initial strategy and assessment work at an attach rate of
20%. Furthermore, 20% of deals completed in Year 1 resulted in an
additional follow-on cloud-native application development project in
Year 2, and 10% of deals completed in Year 1 resulted in an additional
follow-on cloud-native application development project in both Years 2
and 3. For the full calculations, please refer to Appendix B.
› The average deal size per cloud-native application development
engagement was $850,000. Deal sizes varied significantly, with smaller
projects starting at $200,000 to larger projects reaching well into the
millions.
› Gross margins started at an average of 45% in Year 1 and grew to an
average of 50% in Year 3. Interviewed partners attributed margin
growth to continued training and experience of delivery teams. Margin
growth over the first three years of the Azure practice was slower than
that of migration strategy and assessment or migration execution
engagements due to projects naturally being more customized and
thus more difficult to scale effectively.
The revenue and margin impact from cloud-native application development engagements that other partners experience will vary based on pricing and project characteristics unique to each practice and individual skill sets and training of the delivery team.
To account for these risks, Forrester adjusted this gross profit category
downward by 5%, yielding a three-year risk-adjusted total PV of
$8,385,745.
“We had a large customer
come to us looking to build a
brand-new asset management
product leveraging IoT. First,
they just wanted us to do a
feasibility study to see if IoT
would be a good fit. But once
we proved that it could work,
they then asked us for the
whole gamut, including
building, deploying, and
operationalizing the solution
using Azure.”
Cofounder,
North America Azure partner
“For every dollar of migration
revenue, we’ll get $8 of AI
application development
revenue.”
AVP of partner ecosystems,
Global Azure partner
22 | The Partner Opportunity Assessment For Azure Service Providers
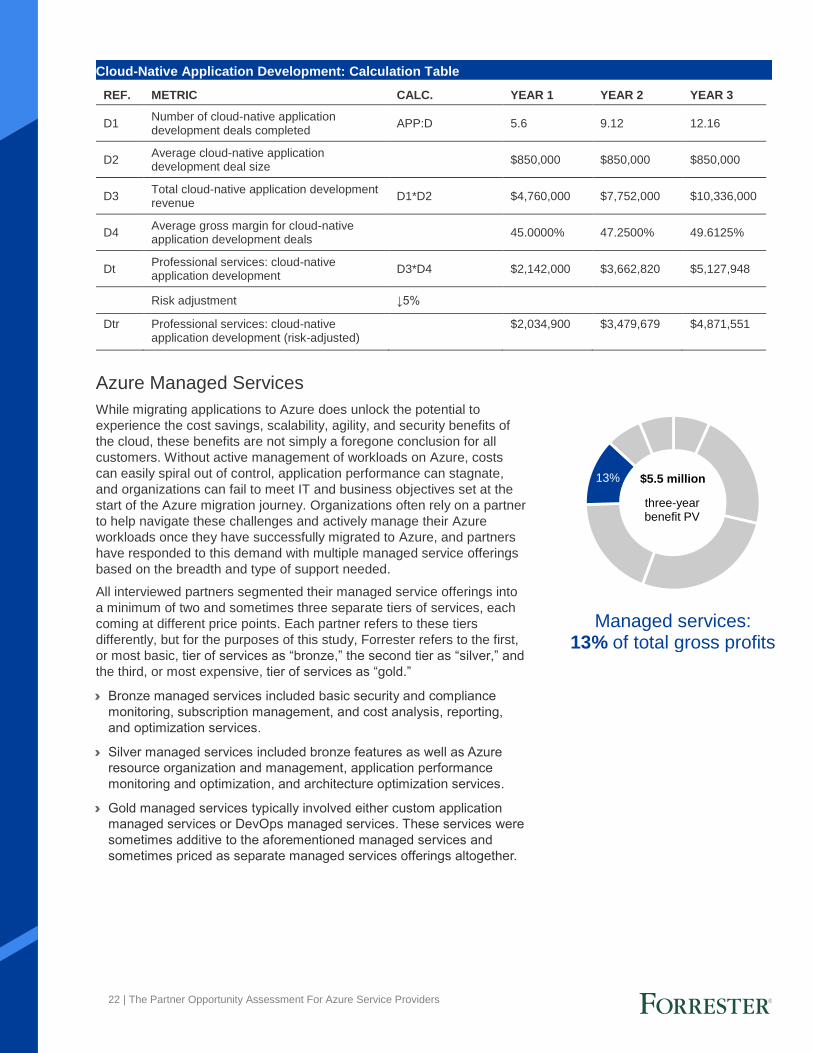
13%
three-year benefit PV
$5.5 million
Managed services: 13% of total gross profits
Azure Managed Services
While migrating applications to Azure does unlock the potential to
experience the cost savings, scalability, agility, and security benefits of
the cloud, these benefits are not simply a foregone conclusion for all
customers. Without active management of workloads on Azure, costs
can easily spiral out of control, application performance can stagnate,
and organizations can fail to meet IT and business objectives set at the
start of the Azure migration journey. Organizations often rely on a partner
to help navigate these challenges and actively manage their Azure
workloads once they have successfully migrated to Azure, and partners
have responded to this demand with multiple managed service offerings
based on the breadth and type of support needed.
All interviewed partners segmented their managed service offerings into
a minimum of two and sometimes three separate tiers of services, each
coming at different price points. Each partner refers to these tiers
differently, but for the purposes of this study, Forrester refers to the first,
or most basic, tier of services as “bronze,” the second tier as “silver,” and
the third, or most expensive, tier of services as “gold.”
› Bronze managed services included basic security and compliance
monitoring, subscription management, and cost analysis, reporting,
and optimization services.
› Silver managed services included bronze features as well as Azure
resource organization and management, application performance
monitoring and optimization, and architecture optimization services.
› Gold managed services typically involved either custom application
managed services or DevOps managed services. These services were
sometimes additive to the aforementioned managed services and
sometimes priced as separate managed services offerings altogether.
Cloud-Native Application Development: Calculation Table
REF. METRIC CALC. YEAR 1 YEAR 2 YEAR 3
D1 Number of cloud-native application development deals completed
APP:D 5.6 9.12 12.16
D2 Average cloud-native application development deal size
$850,000 $850,000 $850,000
D3 Total cloud-native application development revenue
D1*D2 $4,760,000 $7,752,000 $10,336,000
D4 Average gross margin for cloud-native application development deals
45.0000% 47.2500% 49.6125%
Dt Professional services: cloud-native application development
D3*D4 $2,142,000 $3,662,820 $5,127,948
Risk adjustment ↓5%
Dtr Professional services: cloud-native application development (risk-adjusted)
$2,034,900 $3,479,679 $4,871,551
23 | The Partner Opportunity Assessment For Azure Service Providers
Given the commoditization of migration execution work, partners
continued to place a heavy emphasis on growing their managed services
businesses, particularly due to the ability to provide recurring revenues,
allowing the size of managed services portfolios to organically multiply
over time. Consequently, for the majority of interviewed partners,
managed services had an increasing attach rate from migration deals as
partners continued to invest heavily in building out and selling their
managed service offerings.
To model the revenue and margin impact of Azure managed services for the composite partner organization, Forrester assumed:
› Managed service deals were sold as a direct result of migration
execution work at an attach rate ranging from 30% in Year 1 to 33% in
Year 3. Managed services customers renewed their contracts in Years
2 and 3, making the value of managed services accretive over the
three-year period analyzed for this study. For the full calculations,
please refer to Appendix B.
› Given the lower price point and organizations’ initial emphasis on cost
reduction on Azure, bronze managed services were the most popular
level of managed services, with an overall 65% of managed services
customers opting for this tier. Silver and gold managed services were
sold less frequently with an overall 25% and 10% of managed services
customers opting for silver and gold managed services, respectively.
› The average monthly fee for bronze, silver, and gold Azure managed
services was $10,000, $20,000, and $40,000, respectively. Fees varied
from partner to partner based on individual pricing and services
offered, but typically grew at 2x for every incremental tier up.
› Gross margins started at an average of 45% in Year 1 and grew to an
average of 54% in Year 3. Interviewed partners attributed margin
growth to continued investments in scripting, tooling, and reusable IP
and processes, allowing for increased automation, particularly for
bronze- and silver-level managed services.
The revenue and margin impact from Azure managed services that other
partners experience will vary widely based on individual pricing and
services offered. Partners adopted numerous different approaches to
pricing their managed services offerings, often using multiple approaches
across their services portfolios. For example, for bronze and silver
managed services, most partners opted to charge their customers on a
percentage of Azure consumption, by number or virtual machines, or at a
fixed monthly rate. On the other hand, gold managed services were more
often billed per application or hourly by resource, reflecting a greater
degree of custom work required for these services.
To account for these risks, Forrester adjusted this gross profit category
downward by 5%, yielding a three-year risk-adjusted total PV of
$5,509,593.
“We’ll generally sell an
assessment first, and then
propose a migration deal. If we
sell the migration deal, we’ll
then add a managed service
pitch when the migration is
complete. Most customers
want some kind of support
throughout the process, so we
find that we’re pretty
successful in attaching these
services.”
Cofounder,
EMEA Azure partner
“We offer customers three
levels of managed services.
The first is cost optimization,
including measuring and
monitoring; level two is
architecture optimization and
resource management; and
level three is customized,
higher-value services,
including some work around
Azure DevOps.”
VP of market development,
North America Azure partner
24 | The Partner Opportunity Assessment For Azure Service Providers
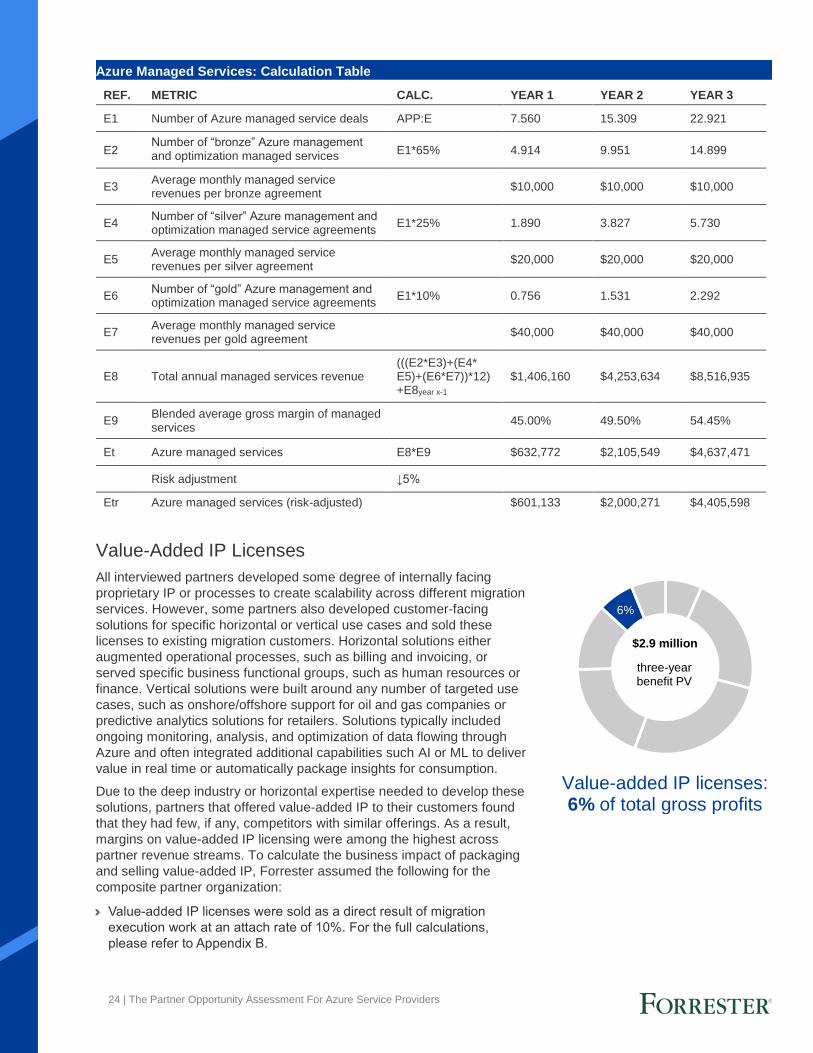
6%
three-year benefit PV
$2.9 million
Value-added IP licenses: 6% of total gross profits
Value-Added IP Licenses
All interviewed partners developed some degree of internally facing
proprietary IP or processes to create scalability across different migration
services. However, some partners also developed customer-facing
solutions for specific horizontal or vertical use cases and sold these
licenses to existing migration customers. Horizontal solutions either
augmented operational processes, such as billing and invoicing, or
served specific business functional groups, such as human resources or
finance. Vertical solutions were built around any number of targeted use
cases, such as onshore/offshore support for oil and gas companies or
predictive analytics solutions for retailers. Solutions typically included
ongoing monitoring, analysis, and optimization of data flowing through
Azure and often integrated additional capabilities such AI or ML to deliver
value in real time or automatically package insights for consumption.
Due to the deep industry or horizontal expertise needed to develop these
solutions, partners that offered value-added IP to their customers found
that they had few, if any, competitors with similar offerings. As a result,
margins on value-added IP licensing were among the highest across
partner revenue streams. To calculate the business impact of packaging
and selling value-added IP, Forrester assumed the following for the
composite partner organization:
› Value-added IP licenses were sold as a direct result of migration
execution work at an attach rate of 10%. For the full calculations,
please refer to Appendix B.
Azure Managed Services: Calculation Table
REF. METRIC CALC. YEAR 1 YEAR 2 YEAR 3
E1 Number of Azure managed service deals APP:E 7.560 15.309 22.921
E2 Number of “bronze” Azure management and optimization managed services agreements
E1*65% 4.914 9.951 14.899
E3 Average monthly managed service revenues per bronze agreement
$10,000 $10,000 $10,000
E4 Number of “silver” Azure management and optimization managed service agreements
E1*25% 1.890 3.827 5.730
E5 Average monthly managed service revenues per silver agreement
$20,000 $20,000 $20,000
E6 Number of “gold” Azure management and optimization managed service agreements
E1*10% 0.756 1.531 2.292
E7 Average monthly managed service revenues per gold agreement
$40,000 $40,000 $40,000
E8 Total annual managed services revenue (((E2*E3)+(E4* E5)+(E6*E7))*12)+E8year x-1
$1,406,160 $4,253,634 $8,516,935
E9 Blended average gross margin of managed services
45.00% 49.50% 54.45%
Et Azure managed services E8*E9 $632,772 $2,105,549 $4,637,471
Risk adjustment ↓5%
Etr Azure managed services (risk-adjusted) $601,133 $2,000,271 $4,405,598
25 | The Partner Opportunity Assessment For Azure Service Providers
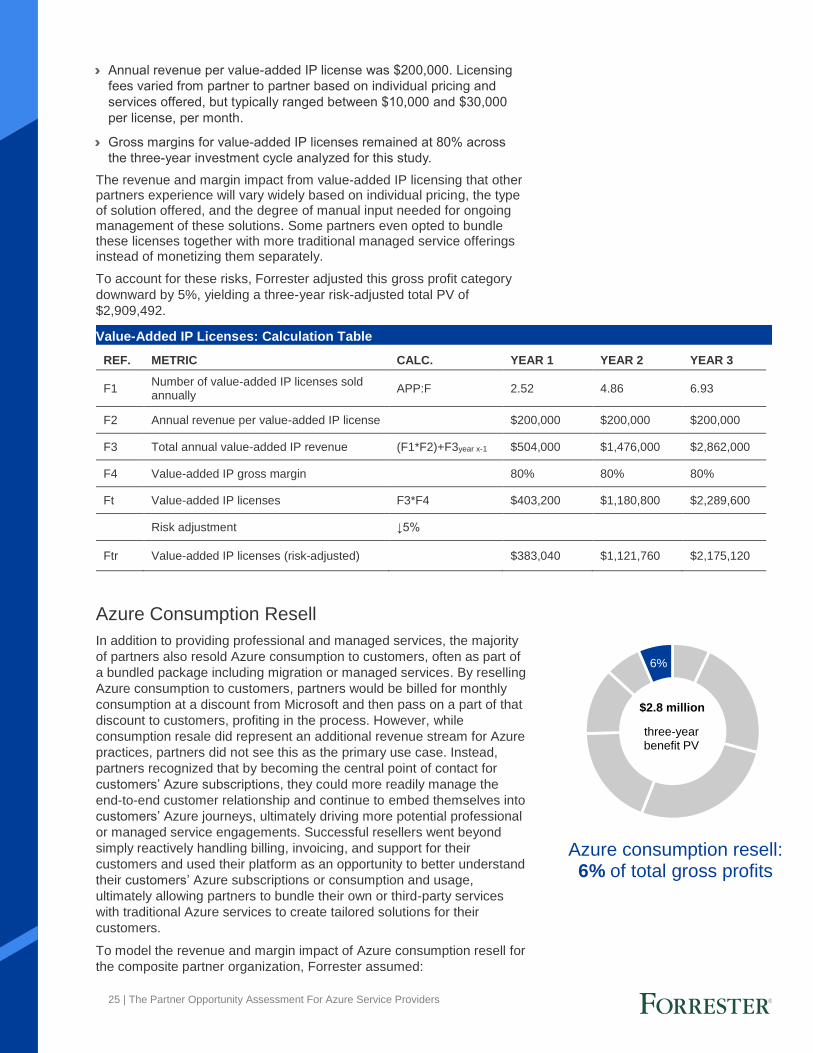
6%
three-year benefit PV
$2.8 million
Azure consumption resell: 6% of total gross profits
› Annual revenue per value-added IP license was $200,000. Licensing
fees varied from partner to partner based on individual pricing and
services offered, but typically ranged between $10,000 and $30,000
per license, per month.
› Gross margins for value-added IP licenses remained at 80% across
the three-year investment cycle analyzed for this study.
The revenue and margin impact from value-added IP licensing that other partners experience will vary widely based on individual pricing, the type of solution offered, and the degree of manual input needed for ongoing management of these solutions. Some partners even opted to bundle these licenses together with more traditional managed service offerings instead of monetizing them separately.
To account for these risks, Forrester adjusted this gross profit category
downward by 5%, yielding a three-year risk-adjusted total PV of
$2,909,492.
Azure Consumption Resell
In addition to providing professional and managed services, the majority
of partners also resold Azure consumption to customers, often as part of
a bundled package including migration or managed services. By reselling
Azure consumption to customers, partners would be billed for monthly
consumption at a discount from Microsoft and then pass on a part of that
discount to customers, profiting in the process. However, while
consumption resale did represent an additional revenue stream for Azure
practices, partners did not see this as the primary use case. Instead,
partners recognized that by becoming the central point of contact for
customers’ Azure subscriptions, they could more readily manage the
end-to-end customer relationship and continue to embed themselves into
customers’ Azure journeys, ultimately driving more potential professional
or managed service engagements. Successful resellers went beyond
simply reactively handling billing, invoicing, and support for their
customers and used their platform as an opportunity to better understand
their customers’ Azure subscriptions or consumption and usage,
ultimately allowing partners to bundle their own or third-party services
with traditional Azure services to create tailored solutions for their
customers.
To model the revenue and margin impact of Azure consumption resell for
the composite partner organization, Forrester assumed:
Value-Added IP Licenses: Calculation Table
REF. METRIC CALC. YEAR 1 YEAR 2 YEAR 3
F1 Number of value-added IP licenses sold annually
APP:F 2.52 4.86 6.93
F2 Annual revenue per value-added IP license $200,000 $200,000 $200,000
F3 Total annual value-added IP revenue (F1*F2)+F3year x-1 $504,000 $1,476,000 $2,862,000
F4 Value-added IP gross margin 80% 80% 80%
Ft Value-added IP licenses F3*F4 $403,200 $1,180,800 $2,289,600
Risk adjustment ↓5%
Ftr Value-added IP licenses (risk-adjusted) $383,040 $1,121,760 $2,175,120
26 | The Partner Opportunity Assessment For Azure Service Providers
› All customers were sourced via direct Cloud Solution Provider (CSP)
agreement, meaning the partner handled billing, invoicing, and support
in addition to client management.
› Azure consumption resell was bundled together with migration
execution deals, allowing the partner to be the main point of contact
once customers had migrated to Azure.
› Average margins for cloud consumption resell were 7%. Given a CSP
discount of 15% on Azure consumption, partners typically kept
anywhere from 2% to 10% of the margin, passing on the remainder of
the discount onto their customers.
Margins on Azure consumption resell will vary by partner depending on
the type of licensing they support (e.g., EA vs. CSP), the percentage of
any Microsoft discounts on consumption partners decide to pass on to
their customers, and customers’ overall monthly Azure consumption
levels.
To account for these risks, Forrester adjusted this gross profit category
downward by 15%, yielding a three-year risk-adjusted total PV of
$2,821,641.
Flexibility
The value of flexibility is clearly unique to each partner, and the measure
of its value varies across partner organizations. There are multiple
scenarios in which a partner might choose to invest in a Microsoft Azure
practice and later realize additional revenue and margin opportunities,
including:
› Building out vertical or horizontal capabilities. As demand for
customized services continues to rise, partners recognize that the
more tailored their services are, the higher their potential win rates and
delivery margins could be. Some partners have explicitly attributed the
success of their Azure practices to mastering a particular niche. Said
one partner: “If you want to increase margins, you need to be providing
a very specific service. For example, we provide solutions to monitor
and analyze data such as temperature exclusively for the oil and
mining industry. We’re probably one of the only partners that offers
something like this.”
Azure Consumption Resell: Calculation Table
REF. METRIC CALC. YEAR 1 YEAR 2 YEAR 3
G1 Total annual Azure consumption $5,745,852 $17,565,579 $35,091,453
G2 Average gross margin on Azure consumption
7.2% 7.2% 7.2%
Gt Azure consumption resell G1*G2 $413,701 $1,264,722 $2,526,585
Risk adjustment ↓15%
Gtr Azure consumption resell (risk-adjusted) $351,646 $1,075,013 $2,147,597
“If you want to increase
margins, you need to be
providing a very specific
service. For example, we
provide solutions to monitor
and analyze data such as
temperature exclusively for the
oil and mining industry. We’re
probably one of the only
partners that offers something
like this.”
Senior director, global alliances
Global Azure partner
27 | The Partner Opportunity Assessment For Azure Service Providers
Flexibility, as defined by TEI, represents an investment in additional capacity or capability that could be turned into business benefit for a future additional investment. This provides an organization with the "right" or the ability to engage in future initiatives but not the obligation to do so.
› Deepening existing customer relationships. The Azure platform
enables resellers to analyze data such as customer subscriptions and
cloud consumption over time. Equipped with this knowledge, partners
can upsell additional managed services or proprietary solutions to help
customers optimize cloud costs, improve workload performance,
strengthen their security posture, and more, increasing stickiness in
the process. One partner said, “Customers are always looking to
improve their existing environment, which is why a huge chunk of our
business comes from existing customers.”
Flexibility would also be quantified when evaluated as part of a specific
project (described in more detail in Appendix A).
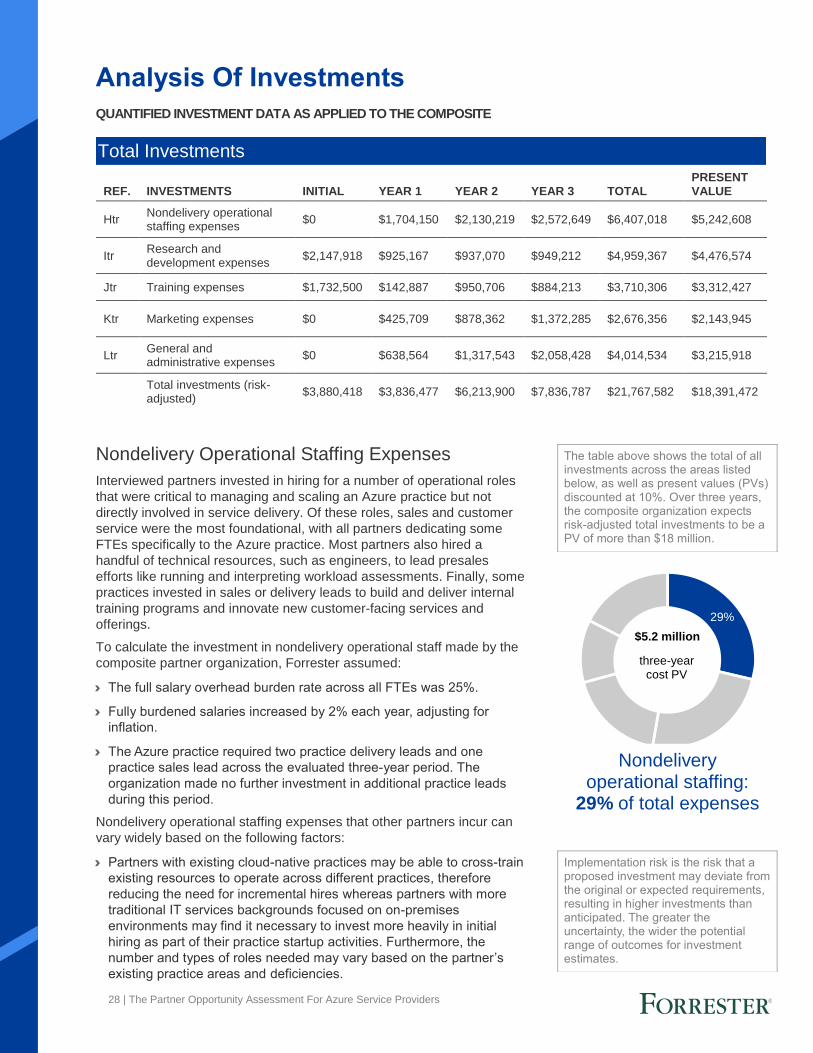
28 | The Partner Opportunity Assessment For Azure Service Providers
The table above shows the total of all investments across the areas listed below, as well as present values (PVs) discounted at 10%. Over three years, the composite organization expects risk-adjusted total investments to be a PV of more than $18 million.
Implementation risk is the risk that a proposed investment may deviate from the original or expected requirements, resulting in higher investments than anticipated. The greater the uncertainty, the wider the potential range of outcomes for investment estimates.
29%
three-year cost PV
$5.2 million
Nondelivery operational staffing:
29% of total expenses
Analysis Of Investments
QUANTIFIED INVESTMENT DATA AS APPLIED TO THE COMPOSITE
Nondelivery Operational Staffing Expenses
Interviewed partners invested in hiring for a number of operational roles
that were critical to managing and scaling an Azure practice but not
directly involved in service delivery. Of these roles, sales and customer
service were the most foundational, with all partners dedicating some
FTEs specifically to the Azure practice. Most partners also hired a
handful of technical resources, such as engineers, to lead presales
efforts like running and interpreting workload assessments. Finally, some
practices invested in sales or delivery leads to build and deliver internal
training programs and innovate new customer-facing services and
offerings.
To calculate the investment in nondelivery operational staff made by the
composite partner organization, Forrester assumed:
› The full salary overhead burden rate across all FTEs was 25%.
› Fully burdened salaries increased by 2% each year, adjusting for
inflation.
› The Azure practice required two practice delivery leads and one
practice sales lead across the evaluated three-year period. The
organization made no further investment in additional practice leads
during this period.
Nondelivery operational staffing expenses that other partners incur can
vary widely based on the following factors:
› Partners with existing cloud-native practices may be able to cross-train
existing resources to operate across different practices, therefore
reducing the need for incremental hires whereas partners with more
traditional IT services backgrounds focused on on-premises
environments may find it necessary to invest more heavily in initial
hiring as part of their practice startup activities. Furthermore, the
number and types of roles needed may vary based on the partner’s
existing practice areas and deficiencies.
Total Investments
REF. INVESTMENTS INITIAL YEAR 1 YEAR 2 YEAR 3 TOTAL PRESENT VALUE
Htr Nondelivery operational staffing expenses
$0 $1,704,150 $2,130,219 $2,572,649 $6,407,018 $5,242,608
Itr Research and development expenses
$2,147,918 $925,167 $937,070 $949,212 $4,959,367 $4,476,574
Jtr Training expenses $1,732,500 $142,887 $950,706 $884,213 $3,710,306 $3,312,427
Ktr Marketing expenses $0 $425,709 $878,362 $1,372,285 $2,676,356 $2,143,945
Ltr General and administrative expenses
$0 $638,564 $1,317,543 $2,058,428 $4,014,534 $3,215,918
Total investments (risk-adjusted)
$3,880,418 $3,836,477 $6,213,900 $7,836,787 $21,767,582 $18,391,472
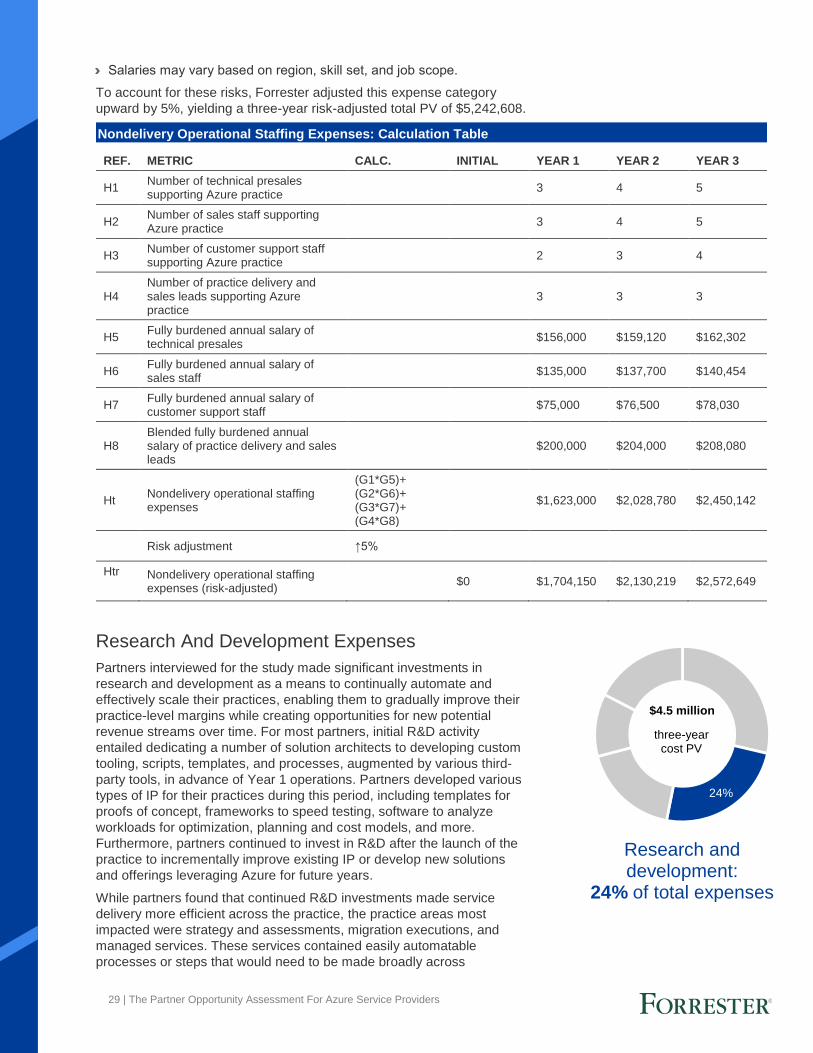
29 | The Partner Opportunity Assessment For Azure Service Providers
Research and development:
24% of total expenses
24%
three-year cost PV
$4.5 million
› Salaries may vary based on region, skill set, and job scope.
To account for these risks, Forrester adjusted this expense category
upward by 5%, yielding a three-year risk-adjusted total PV of $5,242,608.
Research And Development Expenses
Partners interviewed for the study made significant investments in
research and development as a means to continually automate and
effectively scale their practices, enabling them to gradually improve their
practice-level margins while creating opportunities for new potential
revenue streams over time. For most partners, initial R&D activity
entailed dedicating a number of solution architects to developing custom
tooling, scripts, templates, and processes, augmented by various third-
party tools, in advance of Year 1 operations. Partners developed various
types of IP for their practices during this period, including templates for
proofs of concept, frameworks to speed testing, software to analyze
workloads for optimization, planning and cost models, and more.
Furthermore, partners continued to invest in R&D after the launch of the
practice to incrementally improve existing IP or develop new solutions
and offerings leveraging Azure for future years.
While partners found that continued R&D investments made service
delivery more efficient across the practice, the practice areas most
impacted were strategy and assessments, migration executions, and
managed services. These services contained easily automatable
processes or steps that would need to be made broadly across
Nondelivery Operational Staffing Expenses: Calculation Table
REF. METRIC CALC. INITIAL YEAR 1 YEAR 2 YEAR 3
H1 Number of technical presales supporting Azure practice
3 4 5
H2 Number of sales staff supporting Azure practice
3 4 5
H3 Number of customer support staff supporting Azure practice
2 3 4
H4 Number of practice delivery and sales leads supporting Azure practice
3 3 3
H5 Fully burdened annual salary of technical presales
$156,000 $159,120 $162,302
H6 Fully burdened annual salary of sales staff
$135,000 $137,700 $140,454
H7 Fully burdened annual salary of customer support staff
$75,000 $76,500 $78,030
H8 Blended fully burdened annual salary of practice delivery and sales leads
$200,000 $204,000 $208,080
Ht Nondelivery operational staffing expenses
(G1*G5)+ (G2*G6)+ (G3*G7)+ (G4*G8)_
$1,623,000 $2,028,780 $2,450,142
Risk adjustment ↑5%
Htr Nondelivery operational staffing expenses (risk-adjusted)
$0 $1,704,150 $2,130,219 $2,572,649
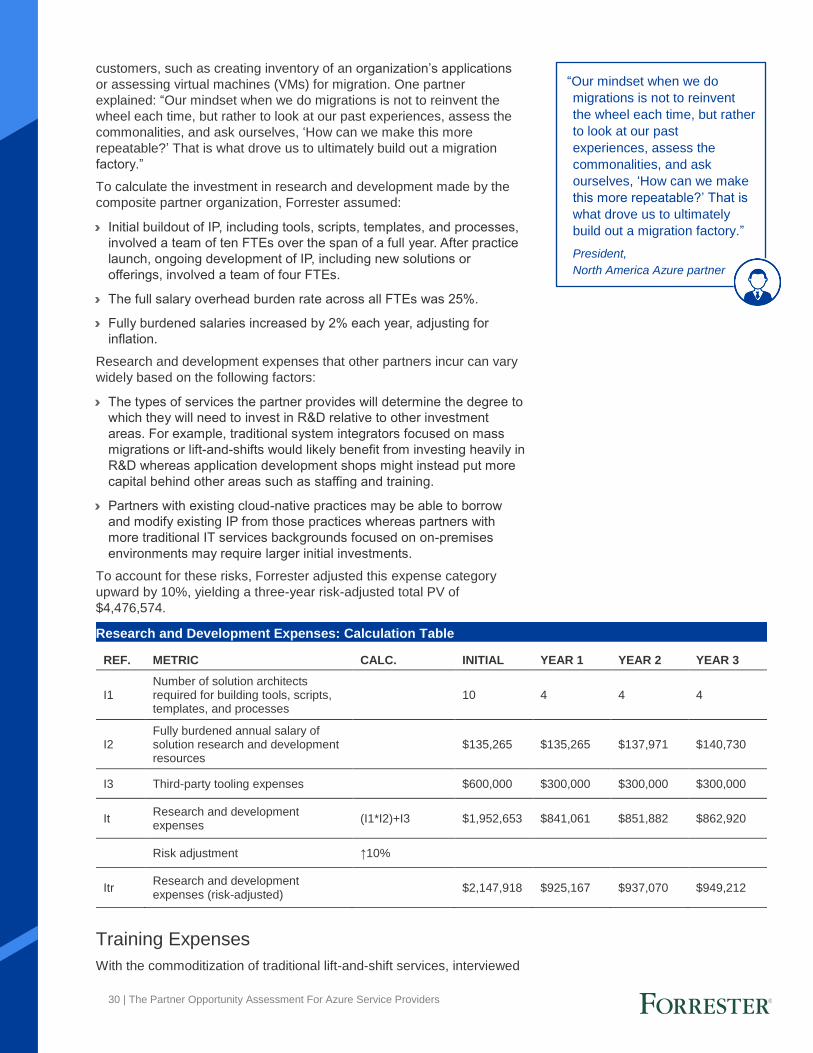
30 | The Partner Opportunity Assessment For Azure Service Providers
customers, such as creating inventory of an organization’s applications
or assessing virtual machines (VMs) for migration. One partner
explained: “Our mindset when we do migrations is not to reinvent the
wheel each time, but rather to look at our past experiences, assess the
commonalities, and ask ourselves, ‘How can we make this more
repeatable?’ That is what drove us to ultimately build out a migration
factory.”
To calculate the investment in research and development made by the
composite partner organization, Forrester assumed:
› Initial buildout of IP, including tools, scripts, templates, and processes,
involved a team of ten FTEs over the span of a full year. After practice
launch, ongoing development of IP, including new solutions or
offerings, involved a team of four FTEs.
› The full salary overhead burden rate across all FTEs was 25%.
› Fully burdened salaries increased by 2% each year, adjusting for
inflation.
Research and development expenses that other partners incur can vary
widely based on the following factors:
› The types of services the partner provides will determine the degree to
which they will need to invest in R&D relative to other investment
areas. For example, traditional system integrators focused on mass
migrations or lift-and-shifts would likely benefit from investing heavily in
R&D whereas application development shops might instead put more
capital behind other areas such as staffing and training.
› Partners with existing cloud-native practices may be able to borrow
and modify existing IP from those practices whereas partners with
more traditional IT services backgrounds focused on on-premises
environments may require larger initial investments.
To account for these risks, Forrester adjusted this expense category
upward by 10%, yielding a three-year risk-adjusted total PV of
$4,476,574.
Training Expenses
With the commoditization of traditional lift-and-shift services, interviewed
Research and Development Expenses: Calculation Table
REF. METRIC CALC. INITIAL YEAR 1 YEAR 2 YEAR 3
I1 Number of solution architects required for building tools, scripts, templates, and processes
10 4 4 4
I2 Fully burdened annual salary of solution research and development resources
$135,265 $135,265 $137,971 $140,730
I3 Third-party tooling expenses $600,000 $300,000 $300,000 $300,000
It Research and development expenses
(I1*I2)+I3 $1,952,653 $841,061 $851,882 $862,920
Risk adjustment ↑10%
Itr Research and development expenses (risk-adjusted)
$2,147,918 $925,167 $937,070 $949,212
“Our mindset when we do
migrations is not to reinvent
the wheel each time, but rather
to look at our past
experiences, assess the
commonalities, and ask
ourselves, ‘How can we make
this more repeatable?’ That is
what drove us to ultimately
build out a migration factory.”
President,
North America Azure partner
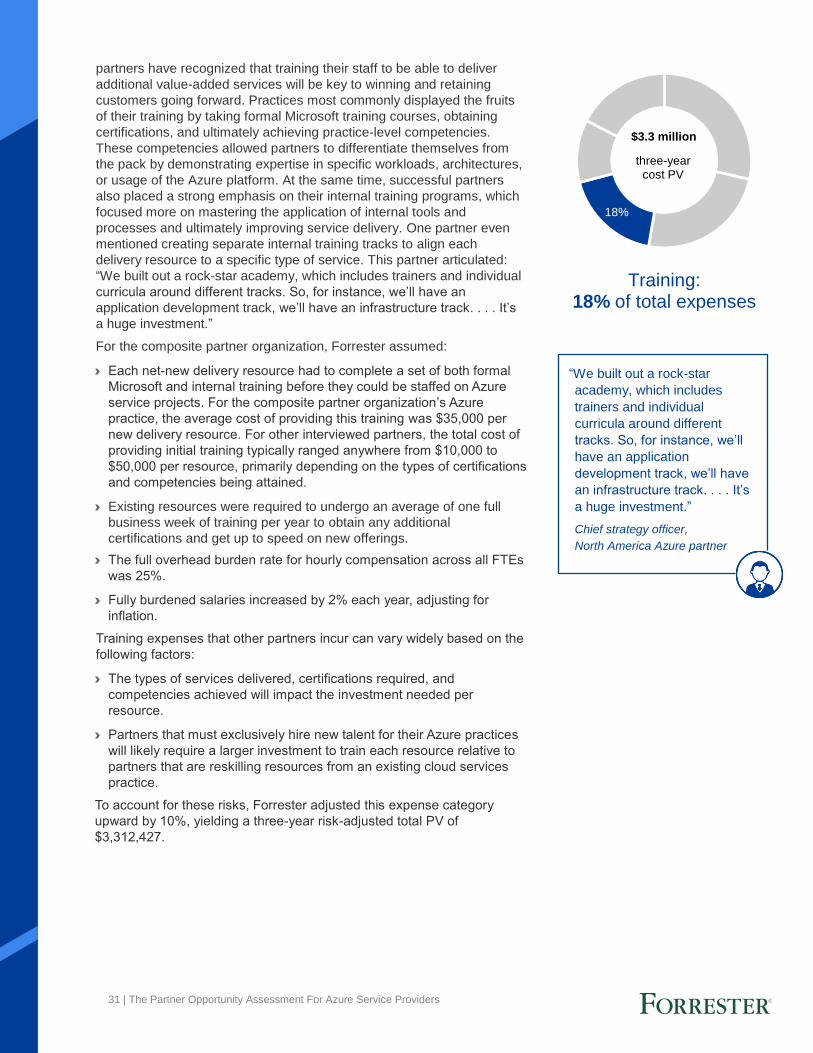
31 | The Partner Opportunity Assessment For Azure Service Providers
Training: 18% of total expenses
18%
three-year cost PV
$3.3 million
partners have recognized that training their staff to be able to deliver
additional value-added services will be key to winning and retaining
customers going forward. Practices most commonly displayed the fruits
of their training by taking formal Microsoft training courses, obtaining
certifications, and ultimately achieving practice-level competencies.
These competencies allowed partners to differentiate themselves from
the pack by demonstrating expertise in specific workloads, architectures,
or usage of the Azure platform. At the same time, successful partners
also placed a strong emphasis on their internal training programs, which
focused more on mastering the application of internal tools and
processes and ultimately improving service delivery. One partner even
mentioned creating separate internal training tracks to align each
delivery resource to a specific type of service. This partner articulated:
“We built out a rock-star academy, which includes trainers and individual
curricula around different tracks. So, for instance, we’ll have an
application development track, we’ll have an infrastructure track. . . . It’s
a huge investment.”
For the composite partner organization, Forrester assumed:
› Each net-new delivery resource had to complete a set of both formal
Microsoft and internal training before they could be staffed on Azure
service projects. For the composite partner organization’s Azure
practice, the average cost of providing this training was $35,000 per
new delivery resource. For other interviewed partners, the total cost of
providing initial training typically ranged anywhere from $10,000 to
$50,000 per resource, primarily depending on the types of certifications
and competencies being attained.
› Existing resources were required to undergo an average of one full
business week of training per year to obtain any additional
certifications and get up to speed on new offerings.
› The full overhead burden rate for hourly compensation across all FTEs
was 25%.
› Fully burdened salaries increased by 2% each year, adjusting for
inflation.
Training expenses that other partners incur can vary widely based on the
following factors:
› The types of services delivered, certifications required, and
competencies achieved will impact the investment needed per
resource.
› Partners that must exclusively hire new talent for their Azure practices
will likely require a larger investment to train each resource relative to
partners that are reskilling resources from an existing cloud services
practice.
To account for these risks, Forrester adjusted this expense category
upward by 10%, yielding a three-year risk-adjusted total PV of
$3,312,427.
“We built out a rock-star
academy, which includes
trainers and individual
curricula around different
tracks. So, for instance, we’ll
have an application
development track, we’ll have
an infrastructure track. . . . It’s
a huge investment.”
Chief strategy officer,
North America Azure partner
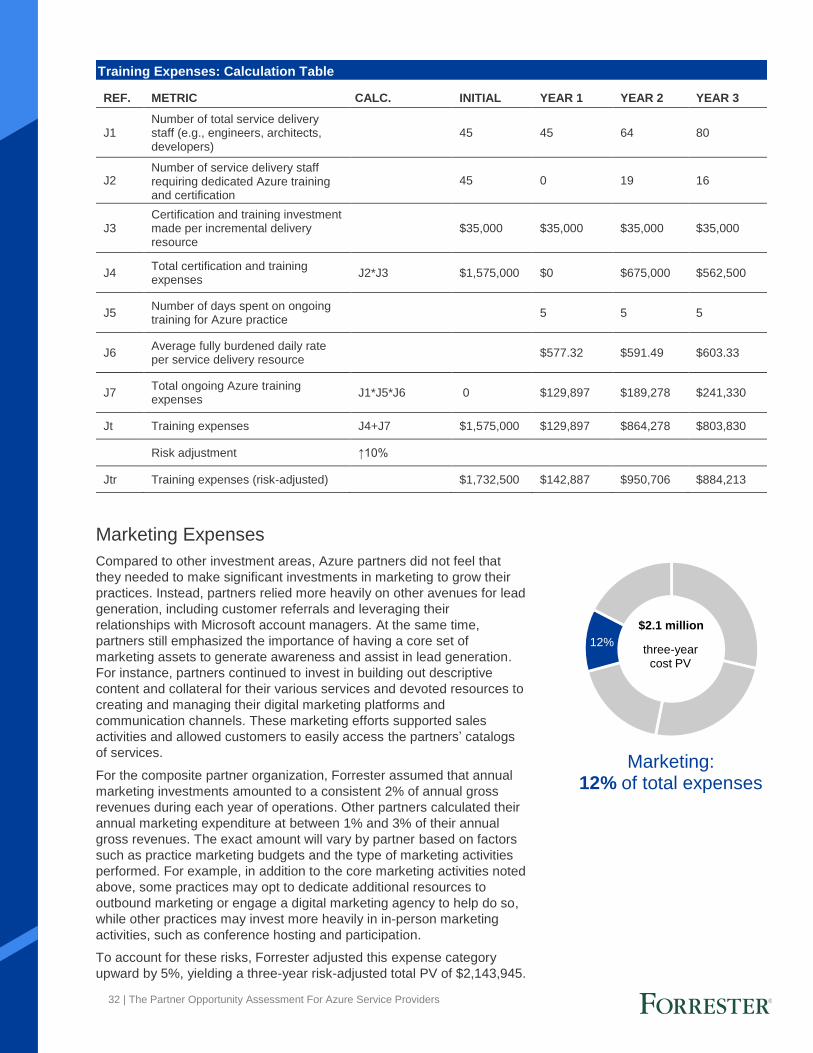
32 | The Partner Opportunity Assessment For Azure Service Providers
12%three-year
cost PV
$2.1 million
Marketing: 12% of total expenses
Marketing Expenses
Compared to other investment areas, Azure partners did not feel that
they needed to make significant investments in marketing to grow their
practices. Instead, partners relied more heavily on other avenues for lead
generation, including customer referrals and leveraging their
relationships with Microsoft account managers. At the same time,
partners still emphasized the importance of having a core set of
marketing assets to generate awareness and assist in lead generation.
For instance, partners continued to invest in building out descriptive
content and collateral for their various services and devoted resources to
creating and managing their digital marketing platforms and
communication channels. These marketing efforts supported sales
activities and allowed customers to easily access the partners’ catalogs
of services.
For the composite partner organization, Forrester assumed that annual
marketing investments amounted to a consistent 2% of annual gross
revenues during each year of operations. Other partners calculated their
annual marketing expenditure at between 1% and 3% of their annual
gross revenues. The exact amount will vary by partner based on factors
such as practice marketing budgets and the type of marketing activities
performed. For example, in addition to the core marketing activities noted
above, some practices may opt to dedicate additional resources to
outbound marketing or engage a digital marketing agency to help do so,
while other practices may invest more heavily in in-person marketing
activities, such as conference hosting and participation.
To account for these risks, Forrester adjusted this expense category
upward by 5%, yielding a three-year risk-adjusted total PV of $2,143,945.
Training Expenses: Calculation Table
REF. METRIC CALC. INITIAL YEAR 1 YEAR 2 YEAR 3
J1 Number of total service delivery staff (e.g., engineers, architects, developers)
45 45 64 80
J2 Number of service delivery staff requiring dedicated Azure training and certification
45 0 19 16
J3 Certification and training investment made per incremental delivery resource
$35,000 $35,000 $35,000 $35,000
J4 Total certification and training expenses
J2*J3 $1,575,000 $0 $675,000 $562,500
J5 Number of days spent on ongoing training for Azure practice
5 5 5
J6 Average fully burdened daily rate per service delivery resource
$577.32 $591.49 $603.33
J7 Total ongoing Azure training expenses
J1*J5*J6 0 $129,897 $189,278 $241,330
Jt Training expenses J4+J7 $1,575,000 $129,897 $864,278 $803,830
Risk adjustment ↑10%
Jtr Training expenses (risk-adjusted) $1,732,500 $142,887 $950,706 $884,213
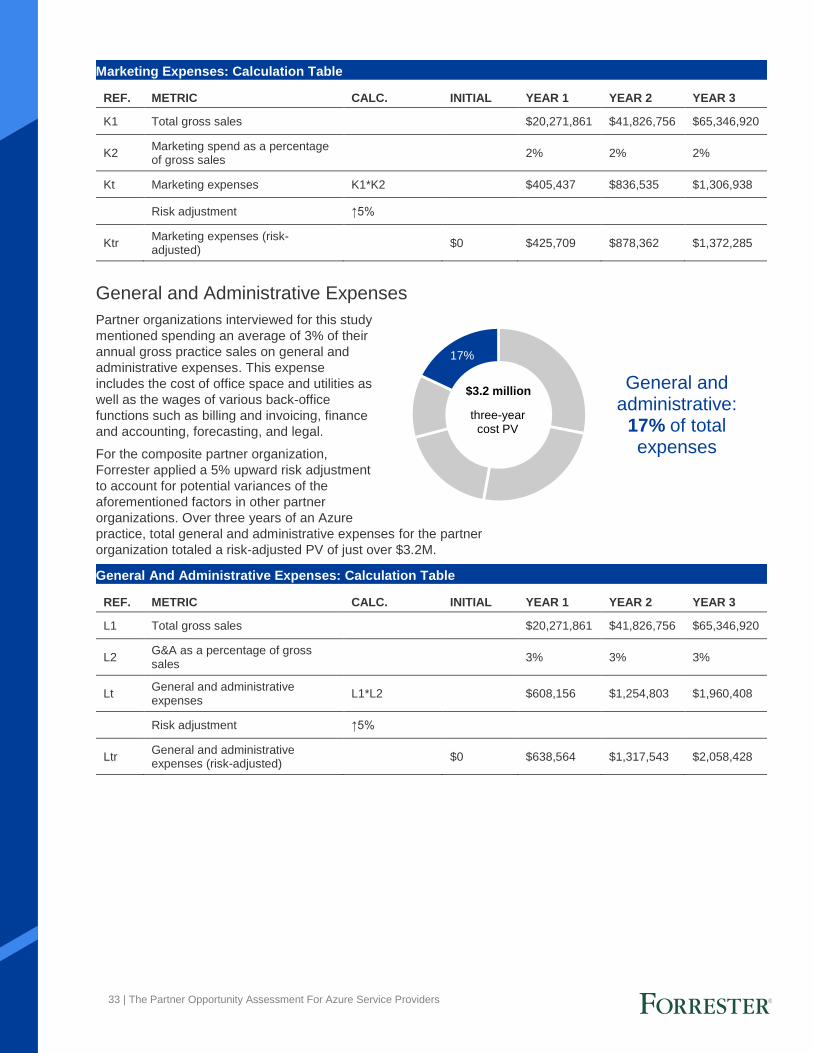
33 | The Partner Opportunity Assessment For Azure Service Providers
General and administrative:
17% of total expenses
General and Administrative Expenses
Partner organizations interviewed for this study
mentioned spending an average of 3% of their
annual gross practice sales on general and
administrative expenses. This expense
includes the cost of office space and utilities as
well as the wages of various back-office
functions such as billing and invoicing, finance
and accounting, forecasting, and legal.
For the composite partner organization,
Forrester applied a 5% upward risk adjustment
to account for potential variances of the
aforementioned factors in other partner
organizations. Over three years of an Azure
practice, total general and administrative expenses for the partner
organization totaled a risk-adjusted PV of just over $3.2M.
Marketing Expenses: Calculation Table
REF. METRIC CALC. INITIAL YEAR 1 YEAR 2 YEAR 3
K1 Total gross sales $20,271,861 $41,826,756 $65,346,920
K2 Marketing spend as a percentage of gross sales
2% 2% 2%
Kt Marketing expenses K1*K2 $405,437 $836,535 $1,306,938
Risk adjustment ↑5%
Ktr Marketing expenses (risk-adjusted)
$0 $425,709 $878,362 $1,372,285
General And Administrative Expenses: Calculation Table
REF. METRIC CALC. INITIAL YEAR 1 YEAR 2 YEAR 3
L1 Total gross sales $20,271,861 $41,826,756 $65,346,920
L2 G&A as a percentage of gross sales
3% 3% 3%
Lt General and administrative expenses
L1*L2 $608,156 $1,254,803 $1,960,408
Risk adjustment ↑5%
Ltr General and administrative expenses (risk-adjusted)
$0 $638,564 $1,317,543 $2,058,428
17%
three-year cost PV
$3.2 million
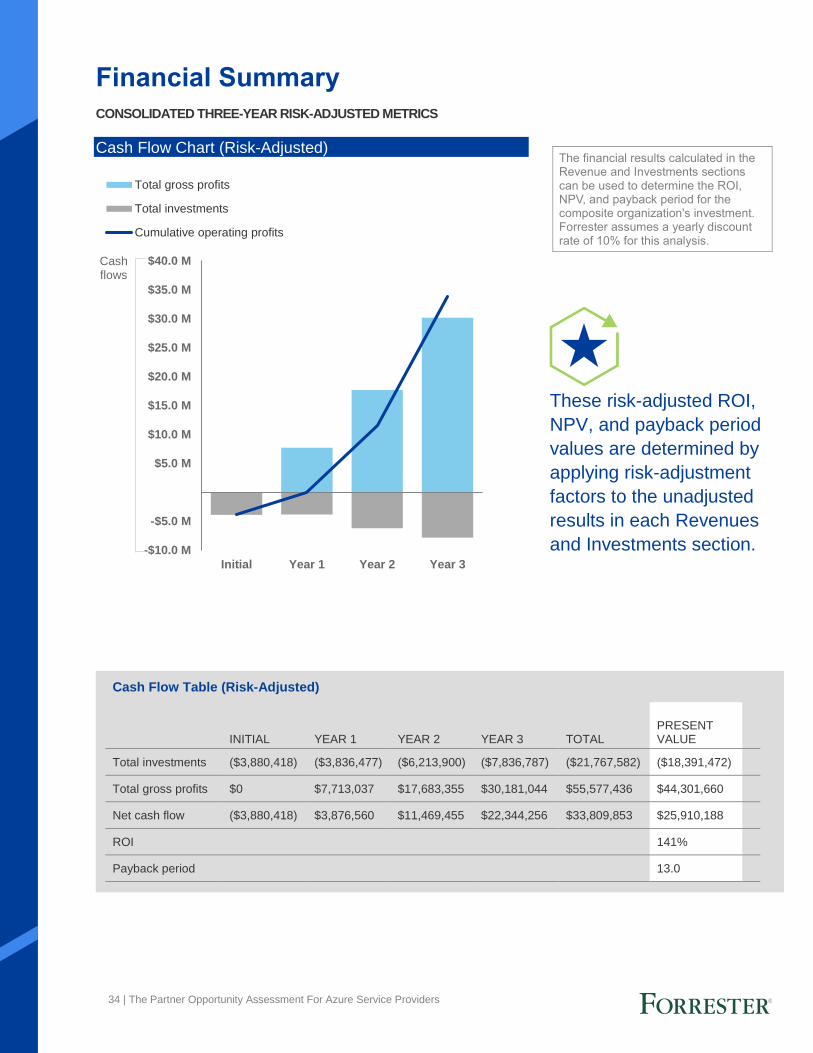
34 | The Partner Opportunity Assessment For Azure Service Providers
The financial results calculated in the Revenue and Investments sections can be used to determine the ROI, NPV, and payback period for the composite organization's investment. Forrester assumes a yearly discount rate of 10% for this analysis.
Financial Summary
CONSOLIDATED THREE-YEAR RISK-ADJUSTED METRICS
Cash Flow Chart (Risk-Adjusted)
-$10.0 M
-$5.0 M
$5.0 M
$10.0 M
$15.0 M
$20.0 M
$25.0 M
$30.0 M
$35.0 M
$40.0 M
Initial Year 1 Year 2 Year 3
Cashflows
Total gross profits
Total investments
Cumulative operating profits
These risk-adjusted ROI,
NPV, and payback period
values are determined by
applying risk-adjustment
factors to the unadjusted
results in each Revenues
and Investments section.
Cash Flow Table (Risk-Adjusted)
INITIAL YEAR 1 YEAR 2 YEAR 3 TOTAL PRESENT VALUE
Total investments ($3,880,418) ($3,836,477) ($6,213,900) ($7,836,787) ($21,767,582) ($18,391,472)
Total gross profits $0 $7,713,037 $17,683,355 $30,181,044 $55,577,436 $44,301,660
Net cash flow ($3,880,418) $3,876,560 $11,469,455 $22,344,256 $33,809,853 $25,910,188
ROI 141%
Payback period 13.0
35 | The Partner Opportunity Assessment For Azure Service Providers
Microsoft Partner Programs for Azure: Overview
The following information is provided by Microsoft. Forrester has not validated any claims and does not endorse
Microsoft or its offerings.
About Microsoft Azure
Microsoft (Nasdaq “MSFT” @microsoft) enables digital transformation for the era of an intelligent cloud and an
intelligent edge. Its mission is to empower every person and every organization on the planet to achieve more.
Microsoft Azure is an ever-expanding set of cloud computing services to help your organization meet its business
challenges. With Azure, your business or organization has the freedom to build, manage, and deploy
applications on a massive, global network using your preferred tools and frameworks, backed by Microsoft’s
$1B+ investment in security R&D and 3,500 cyber security experts designed to make Azure the most trusted
cloud platform.
For more information on Azure please visit https://azure.microsoft.com.
Microsoft Partner Programs for Azure
The Microsoft Partner Network gives you the widest range of products in the industry as well as program options
to differentiate your business, go to market, and sell your solutions.
The Azure Expert MSP badge is awarded to only the most high-fidelity cloud managed service providers on
Azure, intended to give customers confidence when selecting a partner to help them meet their digital
transformation goals. Azure Expert MSPs must meet a stringent set of requirements, including verified proof of
excellence in customer delivery and technical expertise, and the successful completion of an independent audit
of their managed services, people, processes, and technology. More information on the Azure Expert MSP
program can be found on https://aka.ms/JoinAzureExpertMSP.
Azure advanced specializations provide a customer-facing label that proves a partner organization has met
Microsoft’s highest standards of service delivery for specific scenarios such as migration, application
modernization, container services, and more. Azure advanced specializations help increase partner visibility
through priority discoverability and proactive positioning to Microsoft sellers and customers. More information on
advanced specializations can be found on https://aka.ms/AdvancedSpecializations.
For more details about Microsoft partner programs and to view the full list of Microsoft Partner Network
membership tiers and benefits, please visit: https://partner.microsoft.com.
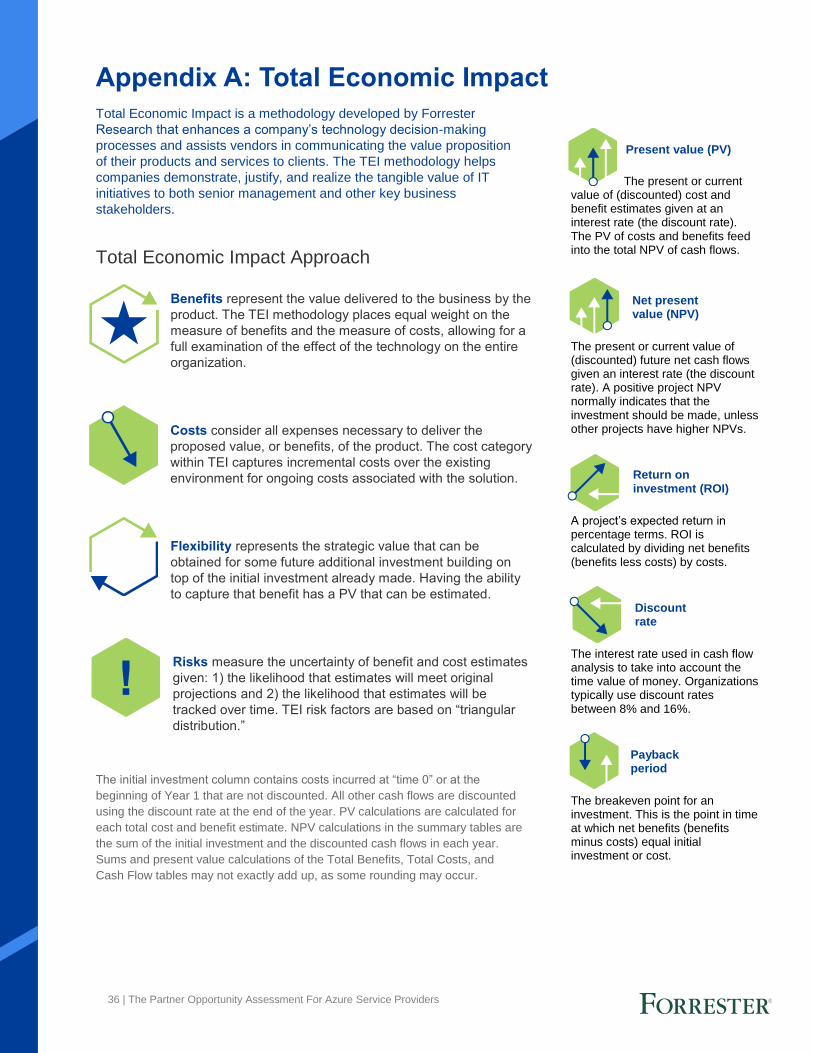
36 | The Partner Opportunity Assessment For Azure Service Providers
Appendix A: Total Economic Impact
Total Economic Impact is a methodology developed by Forrester
Research that enhances a company’s technology decision-making
processes and assists vendors in communicating the value proposition
of their products and services to clients. The TEI methodology helps
companies demonstrate, justify, and realize the tangible value of IT
initiatives to both senior management and other key business
stakeholders.
Total Economic Impact Approach
Benefits represent the value delivered to the business by the
product. The TEI methodology places equal weight on the
measure of benefits and the measure of costs, allowing for a
full examination of the effect of the technology on the entire
organization.
Costs consider all expenses necessary to deliver the
proposed value, or benefits, of the product. The cost category
within TEI captures incremental costs over the existing
environment for ongoing costs associated with the solution.
Flexibility represents the strategic value that can be
obtained for some future additional investment building on
top of the initial investment already made. Having the ability
to capture that benefit has a PV that can be estimated.
Risks measure the uncertainty of benefit and cost estimates
given: 1) the likelihood that estimates will meet original
projections and 2) the likelihood that estimates will be
tracked over time. TEI risk factors are based on “triangular
distribution.”
The initial investment column contains costs incurred at “time 0” or at the
beginning of Year 1 that are not discounted. All other cash flows are discounted
using the discount rate at the end of the year. PV calculations are calculated for
each total cost and benefit estimate. NPV calculations in the summary tables are
the sum of the initial investment and the discounted cash flows in each year.
Sums and present value calculations of the Total Benefits, Total Costs, and
Cash Flow tables may not exactly add up, as some rounding may occur.
Present value (PV)
The present or current value of (discounted) cost and benefit estimates given at an interest rate (the discount rate). The PV of costs and benefits feed into the total NPV of cash flows.
Net present value (NPV)
The present or current value of (discounted) future net cash flows given an interest rate (the discount rate). A positive project NPV normally indicates that the investment should be made, unless other projects have higher NPVs.
Return on investment (ROI)
A project’s expected return in percentage terms. ROI is calculated by dividing net benefits (benefits less costs) by costs.
Discount rate
The interest rate used in cash flow analysis to take into account the time value of money. Organizations typically use discount rates between 8% and 16%.
Payback period
The breakeven point for an investment. This is the point in time at which net benefits (benefits minus costs) equal initial investment or cost.
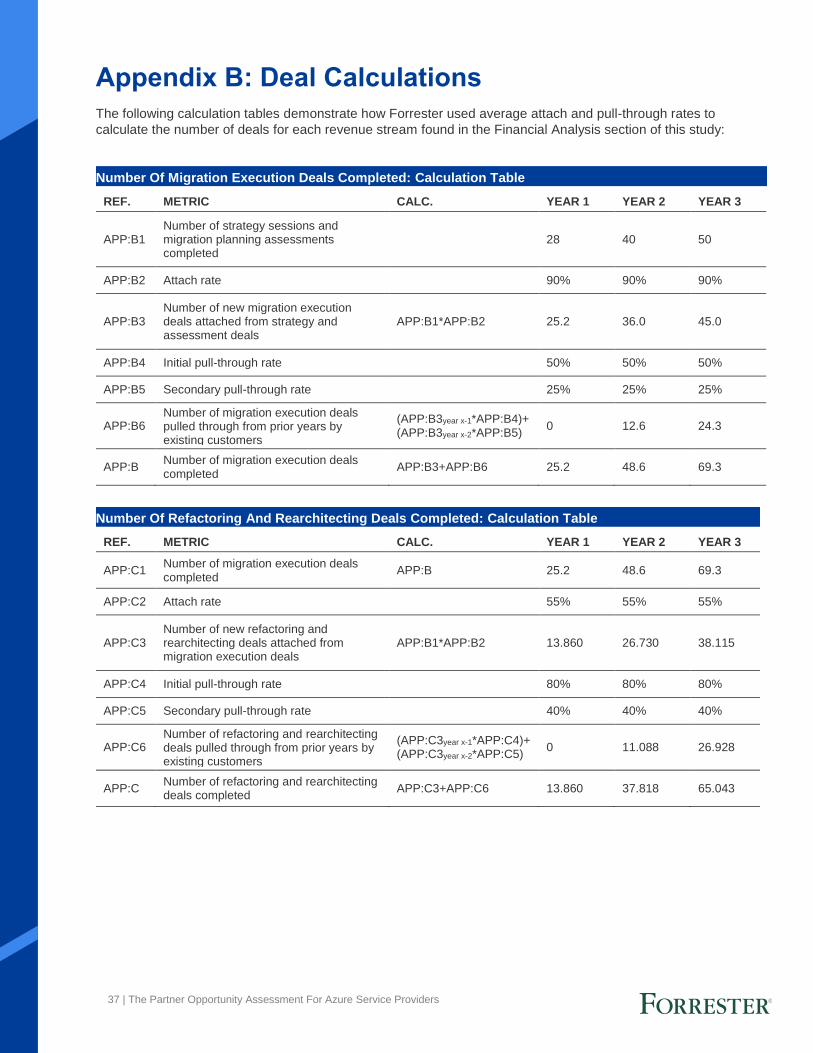
37 | The Partner Opportunity Assessment For Azure Service Providers
Appendix B: Deal Calculations
The following calculation tables demonstrate how Forrester used average attach and pull-through rates to
calculate the number of deals for each revenue stream found in the Financial Analysis section of this study:
Number Of Migration Execution Deals Completed: Calculation Table
REF. METRIC CALC. YEAR 1 YEAR 2 YEAR 3
APP:B1 Number of strategy sessions and migration planning assessments completed
28 40 50
APP:B2 Attach rate 90% 90% 90%
APP:B3 Number of new migration execution deals attached from strategy and assessment deals
APP:B1*APP:B2 25.2 36.0 45.0
APP:B4 Initial pull-through rate 50% 50% 50%
APP:B5 Secondary pull-through rate 25% 25% 25%
APP:B6 Number of migration execution deals pulled through from prior years by existing customers
(APP:B3year x-1*APP:B4)+ (APP:B3year x-2*APP:B5)_
0 12.6 24.3
APP:B Number of migration execution deals completed
APP:B3+APP:B6 25.2 48.6 69.3
Number Of Refactoring And Rearchitecting Deals Completed: Calculation Table
REF. METRIC CALC. YEAR 1 YEAR 2 YEAR 3
APP:C1 Number of migration execution deals completed
APP:B 25.2 48.6 69.3
APP:C2 Attach rate 55% 55% 55%
APP:C3 Number of new refactoring and rearchitecting deals attached from migration execution deals
APP:B1*APP:B2 13.860 26.730 38.115
APP:C4 Initial pull-through rate 80% 80% 80%
APP:C5 Secondary pull-through rate 40% 40% 40%
APP:C6 Number of refactoring and rearchitecting deals pulled through from prior years by existing customers
(APP:C3year x-1*APP:C4)+ (APP:C3year x-2*APP:C5)_
0 11.088 26.928
APP:C Number of refactoring and rearchitecting deals completed
APP:C3+APP:C6 13.860 37.818 65.043
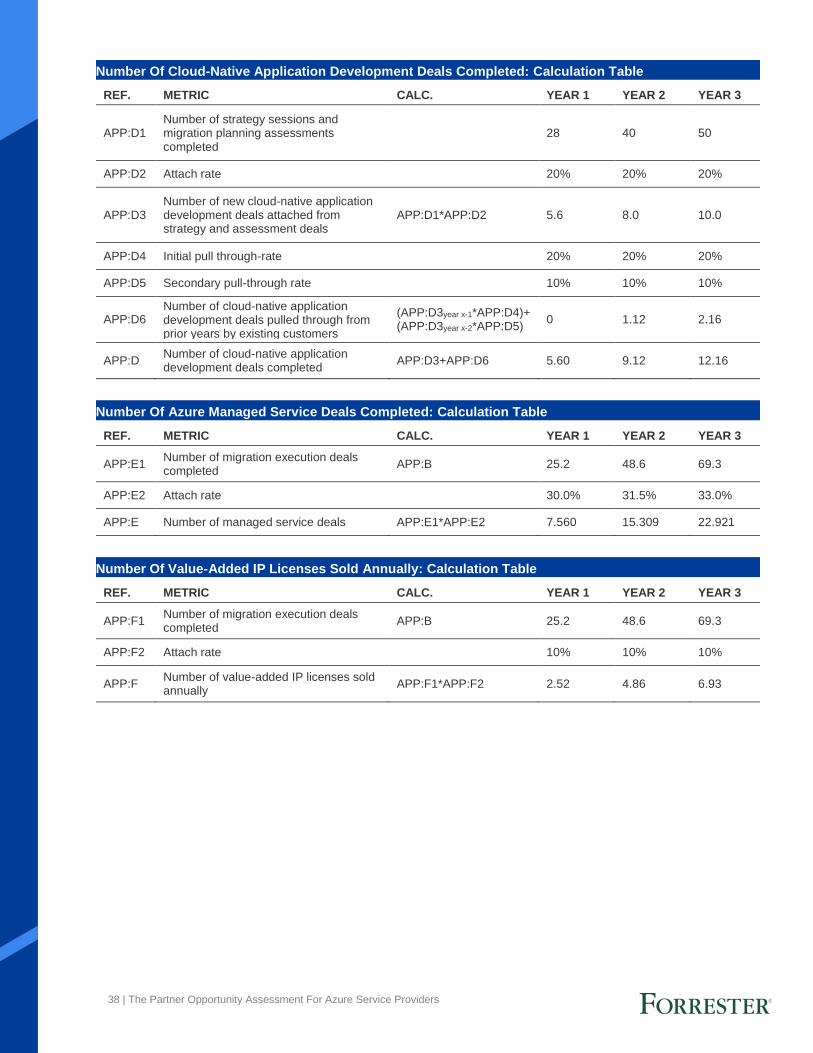
38 | The Partner Opportunity Assessment For Azure Service Providers
Number Of Cloud-Native Application Development Deals Completed: Calculation Table
REF. METRIC CALC. YEAR 1 YEAR 2 YEAR 3
APP:D1 Number of strategy sessions and migration planning assessments completed
28 40 50
APP:D2 Attach rate 20% 20% 20%
APP:D3 Number of new cloud-native application development deals attached from strategy and assessment deals
APP:D1*APP:D2 5.6 8.0 10.0
APP:D4 Initial pull through-rate 20% 20% 20%
APP:D5 Secondary pull-through rate 10% 10% 10%
APP:D6 Number of cloud-native application development deals pulled through from prior years by existing customers
(APP:D3year x-1*APP:D4)+ (APP:D3year x-2*APP:D5)_
0 1.12 2.16
APP:D Number of cloud-native application development deals completed
APP:D3+APP:D6 5.60 9.12 12.16
Number Of Azure Managed Service Deals Completed: Calculation Table
REF. METRIC CALC. YEAR 1 YEAR 2 YEAR 3
APP:E1 Number of migration execution deals completed
APP:B 25.2 48.6 69.3
APP:E2 Attach rate 30.0% 31.5% 33.0%
APP:E Number of managed service deals APP:E1*APP:E2 7.560 15.309 22.921
Number Of Value-Added IP Licenses Sold Annually: Calculation Table
REF. METRIC CALC. YEAR 1 YEAR 2 YEAR 3
APP:F1 Number of migration execution deals completed
APP:B 25.2 48.6 69.3
APP:F2 Attach rate 10% 10% 10%
APP:F Number of value-added IP licenses sold annually
APP:F1*APP:F2 2.52 4.86 6.93

39 | The Partner Opportunity Assessment For Azure Service Providers
Appendix C: Endnotes
1 Source: “Use Modernization And Migration Services To Speed Your Cloud Migration,” Forrester Research, Inc., June 4, 2019.


![[Azure App Service] Introducción a Azure WebJobs](https://img.pdfslide.net/doc/110x75/58ed2c471a28ab67088b45c9/azure-app-service-introduccion-a-azure-webjobs.jpg)