Embed Size (px)
Citation preview

The Path to Strategic Investments in West Coast EstuariesPacific Marine and Estuarine Fish Habitat Partnership Nursery Assessment
Lisa A. DeBruyckere, PMEP CoordinatorPhoto credit: Tillamook Estuaries Partnership

PMEP Priorities• Protect, enhance and
restore:• Juvenile fish habitat in
nearshore marine and estuary habitats
• Tidal wetland-intertidal-subtidal-nearshore connectivity; and
• Water quality and quantity in estuaries and nearshore marine environments. Spatial and Temporal Analysis of Fish Assemblages in
Tidal Estuarine Habitats in the South Slough and Coos Estuary (Oregon). Photo credit: Bree Yednock.

Three Inter-related West Coast Assessments
PMEP Nursery Habitat Assessment
• Build an online database of existing data on juvenile fish presence, abundance & distribution.
• Characterize nursery roles of estuaries for focal group of 15 spp.
• Improve knowledge of habitat requirements of these species to improve management.
NFHP National Estuary Assessment
• Assess threats to fish habitats across the United States.
• Provide national perspective on prioritizing habitat restoration and protection.
Nearshore Forage Fish Assessment
• Determine whether nearshore restoration actions can ameliorate habitat conditions for forage fish stocks.
• Improve our understanding of anthropogenic impacts on forage fish, and potential effects on recreational fisheries caused by changing food supply.
• Support prioritization of restoration and protection actions that have the greatest benefits to the food chain of recreational fishes.

PMEP’s Overall GoalWork with partners to:
• Enhance ecological function and resilience of West Coast estuaries.
• Objective 1 : Create a prioritization scheme to guide conservation and restoration actions supporting fish habitat functions in West Coast estuaries
• Objective 2: Measure the effectiveness of the scheme and adapt the scheme to meet new needs as they arise. Juvenile Hood Canal summer chum, federally listed as
Threatened, will benefit from additional rearing habitat in Tarboo Bay. Photo credit: NW Watershed Institute. Restoration
of salt marsh shoreline within the Dabob Bay Natural Area (Washington). Photo credit: Lowell Jons

Lessons Learned in the Application of CMECS to Oregon Estuary Habitats
Andy Lanier1, Tanya Haddad1, Laura Brophy2, Patty Snow11Oregon Coastal Management Program - Oregon Department of Land Conservation
and Development2Greenpoint Consulting Inc.
CERF Conference, November 12, 2015

Digital Resources: • Data was compiled into an estuary specific data catalog through
an extensive survey of Agency partners, and online resources. • The information was evaluated for it’s utility to discern habitat
features related to any of the CMECS components or settings.
Use Criteria: Data Set extent must cover the entire study area.
2007-2009
LiDAR
2011 ShoreZone
Photographs
2009 High-Resolution
Orthophotos
2009-2011 Dikes and
Levees Inventory
2014National Wetland Inventory
NRCS SoilsCCAP vegetationAnd many more…

CMECS – woohoo!
Digital Coast

• Released June 2012
• CMECS offers a standard framework and common terminology for describing natural and human influenced ecosystems from the upper tidal reaches of estuaries to the deepest portions of the ocean
CMECS

CMECS Untangled
Cinamon Moffet, OCMP
SubstrateComponent
GeoformComponent
BioticComponent
Water Column Component
• Simplifying the CMECS options to those most applicable in Oregon was a big step• We used this diagram to organize the hunt for relevant data
Diagram created with Cmap software: http://cmap.ihmc.us/
BiogeographicSetting
Aquatic Setting

Substrate Component
Describes the origin and composition of estuary substrates
Substrate Origin:• Geologic• Biogenic• Anthropogenic
Alsea Bay EstuaryTernary Diagrams for Gravel-Sand-Mud and Sand-Silt-Clay.and for Sand-Silt-Clay, adapted from Folk (1954). Image: K. Ford.

• Tectonic• Physiographic• Geoform level I• Geoform level II
Geoform Component
Describes the major geomorphic and structural characteristics of the coast.
There are 4 sub-components that can be used alone or in combination:
Nehalem Estuary

Biotic Component
A hierarchical classification that identifies:
• composition of coastal attached biota and benthos
• composition of floating and suspended biota
Siletz Bay Estuary
Example:Biotic Setting: Benthic/Attached Biota
Biotic Class: Emergent WetlandBiotic Subclass: Emergent Tidal Marsh
Biotic Group: Freshwater Tidal MarshBiotic Communities: Deschampsia
caespitosa

Comprehensive GIS data of Oregon’s estuaries (excludes the Columbia River):
– CMECS Habitat Layers• CMECS layers for 4 out of 5 components,
across all of our targeted geographies
– Online Estuary Planning Atlas Tool (http://coastalatlas.net/estuarymaps/)
– Significantly improved the footprint of mapping in individual estuaries.
• We tackled CMECS and survived!
Results
• Excited to start our CMECS phase II
• Revisit these high quality site-specific data that were passed over in phase I,
• work with data stewards to create CMECS crosswalks to bring in important missing data
Next Steps

• Flyer:http://www.coastalatlas.net/documents/cmecs/1pager_CMECS_Flyer.pdf
• Core GIS Methods Document:: http://www.coastalatlas.net/documents/cmecs/EPSM_CoreGISMethods.pdf
• GIS layers http://www.coastalatlas.net/cmecs
• Interactive Map: http://coastalatlas.net/estuarymaps/
Oregon Project Data Links

An inventory and classification of U.S. West Coast estuaries:
A foundation for research, restoration, and conservation
Walter N. HeadyCoastal Marine
Ecologist
Kevin O’Connor, Jennifer Kassakian, Kate Doiron, Charles Endris, Daniel Hudgens, Ross P.
Clark, Jena Carter, and Mary G. Gleason

209285
40
California: n = 534
Washington: n = 47
38
72
59
11
Oregon: n = 72
2
An Inventory and Classification of West Coast Estuaries

Master Inventory of CA Coastal Confluencesn = 572
Natural CA Coastal Confluencesn = 534
1: “Urban drains”n = 34
2: True lagoons & depressions n = 10
Fluvial CA Coastal Confluencesn = 524
CA Coast Estuaries for Nursery Assessmentn = 184
3: Unidentified streams n = 112
&4: Confluences lacking NWI
n = 59
5: Confluence + marsh plain < 0.4 hectare polygon
n = 169
Fluvial CA Coastal Confluencesn = 353
6: Harbors n = 4
Subsample confluences of probable nursery value

18
131
35
Embayment/Bay
Riverine
Sound
Lagoonal
Washington: n = 47
38
72
59
11
Oregon: n = 72
2
California: n = 184
CMECS
Assessment of Nursery Function of West Coast Estuaries

7313
43571
664
98
48
1554
38
Embayment/Bay
Riverine
Sound
Lagoonal
Washington: 7,927 km2
Oregon: 680 km2
California: 1,640 km2
CMECS
Assessment of Nursery Function of West Coast Estuaries

1273
571604
7313
10,247 km2
Area
Embayment/Bay
Riverine
Sound
Lagoonal
CMECS
Assessment of Nursery Function of West Coast Estuaries
115142
39
7
n = 303
Count

Our Progress to DateState of Knowledge Report
• Information on juvenile nursery requirements of 15 focal species
• Juveniles of 11 of the 15 focal species were documented in 113 of 303 estuaries (15 of the 113 were smaller estuaries – less than 100 ha)
• All four estuary classes (lagoonal, riverine, embayment and sound) are import systems for juvenile of some or all of the 15 focal species.
• Four important estuarine subclasses used by 11 of 15 focal species:
• Estuarine coastal subtidal, tidal channel/creek, slough, and lagoon

Dungeness crabBay shrimpLeopard sharkBat rayGreen sturgeonChinook salmonCoho salmonSteelhead troutCalifornia halibutEnglish soleStarry flounderBrown rockfishStaghorn sculpinShiner perchPacific herring
Invertebrates
Elasmobranchs
Anadromous fish
Flatfish
Other
15 Focal Species

Conclusions• Documented presence of juveniles in many systems
- 113 estuaries for 15 focal species- www.pacificfishhabitat.org/products
• Juveniles use the full diversity of estuary types and natural habitats available on the West Coast
• Demonstrated nursery value of estuaries for some species- faster growth, higher survival, higher contribution
• Knowledge gaps for smaller systems and species of lower economic value
• Numerous threats to estuarine nursery function, but not as much information as one would expect
• SOK report useful for informing management at many scalesGeodatabase shows
potential nursery extent in estuaries

Building a Spatial Framework for Informing Fish Habitat Protection & Restoration in West Coast Estuaries
Van Hare1, Brett Holycross1, Kiira Sitarii1, Laura Brophy2, HirooImaki3, Walter Heady4 and Matthew Levey5

Mapping the extent of West Coast tidal wetlands using extreme water level data and LIDAR
Van Hare1 Brett Holycross1 Laura Brophy2,3 Hiroo Imaki4
1Pacific States Marine Fisheries Commission2Estuary Technical Group, Institute for Applied Ecology3Marine Resource Management Program, College of Earth, Ocean, and Atmospheric Sciences, Oregon State Univ.4NOAA NMFS

Why are we doing this?
Provide improved spatial data on estuary habitats to support west coast fish assessments, including:
• Evaluation of condition/impacts• Evaluation and prioritization of restoration
and conservation opportunities

What’s our general approach?
Map full spatial extent of estuaries• Including all tidal wetlands to head of tide• Including freshwater tidal zone, “surge plain”• Definition of “tidal wetland” = inundation due
to tidal forces at least 1X/yrMap current and historic tidal wetlands
• Historic wetland mapping informs restoration planning
• “Historic” = pre-European settlement

Conclusions
The new West Coast tidal wetland maps: • Greatly improve and expand our understanding of
West Coast estuaries• Provide comprehensive coverage with improved
accuracy and suitability for restoration planning• Have been positively reviewed by experts, and match
very closely to historic wetland maps• Provide a solid base layer for West-coast-scale
analysis of wetland losses, restoration and conservation opportunities

• Finalization of spatial data• Final review• Classification of habitats• Release of products
Next steps

Our Progress to DatePrioritization Scheme
• Goal: Enhance ecological function and resilience of West Coast estuaries.
• Objective 1 : Create a prioritization scheme to guide conservation and restoration actions supporting fish habitat functions in West Coast estuaries
• Objective 2: Measure the effectiveness of the scheme and adapt the scheme to meet new needs as they arise. Juvenile Hood Canal summer chum, federally listed as
Threatened, will benefit from additional rearing habitat in Tarboo Bay. Photo credit: NW Watershed Institute. Restoration
of salt marsh shoreline within the Dabob Bay Natural Area (Washington). Photo credit: Lowell Jons

Setting Priorities Across Coastal Landscapes: A review of prioritization methods for estuary restoration and protection
John Bragg, South Slough National Estuarine Research ReserveKiira Siitari, Pacific States Marine Fisheries Commission

Goals
Overall Project Goal:
Create a prioritization scheme to guide conservation and restoration actions
supporting fish habitat functions in West Coast estuaries.
Key First Step:
Review, compile and summarize past methods and literature for setting ecological priorities for
restoration and habitat protection within estuaries.
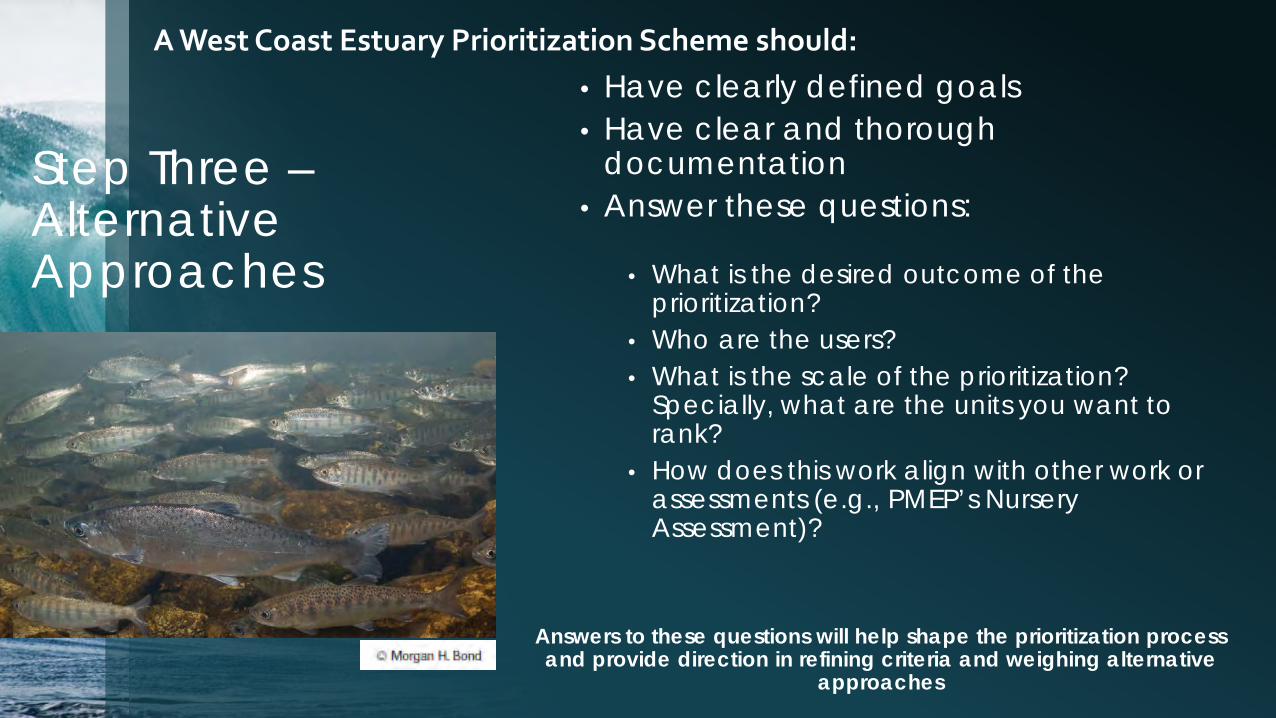
Step Three –Alternative Approaches
• Have clearly defined goals • Have clear and thorough
documentation• Answer these questions:
• What is the desired outcome of the prioritization?
• Who are the users?• What is the scale of the prioritization?
Specially, what are the units you want to rank?
• How does this work align with other work or assessments (e.g., PMEP’s Nursery Assessment)?
Answers to these questions will help shape the prioritization process and provide direction in refining criteria and weighing alternative
approaches
A West Coast Estuary Prioritization Scheme should:

Organizing the Prioritization WorkThe DPSIR Model
Conceptual DPSIR model linking drivers and pressures to the ecosystem state, impacts to ecosystem components, and adaptive feedback for response actions (Ruckelshaus et al. 2008).

Incorporating the DPSIR Model for the PMEP Nursery Assessment
Drivers
• Climate• Land Use• Tectonics• Humans
Pressures
• Development• Aquaculture• Pollution• Fish Barriers• Ocean
acidification• Sea Level Rise• Hydrological
Alteration
State
• Landform Stability• Littoral Drift• Sediment Budget• Habitat
Connectivity• Tidal
flow/Inundation Extent/Frequency
• Soil Condition
Impact
• Habitat Structure• Shoreline
Armoring (H)• Loss of Large
Woody Debris (H)• Hydrology
• Loss of Tidal and Floodplain Connectivity (H)
• Changes to Freshwater Flow (H)
• Loss of Salt/Freshwater Mixing (M)

ClimateLand UseTectonicsHuman population
DRIVERSDevelopmentWater diversionsAquaculturePollutionOil rigsFish barriersFishingCommercial shippingAgricultureOcean acidificationSea Level RiseHydrological Alteration
PRESSURES STATES IMPACTSNutrient levelsLandform stabilityWater qualityTidal flow/inundation extent/frequencySediment budgetWave exposureLittoral driftPrey availabilityFish diversity/abundanceBenthic invertebratesSoil conditionRiparian conditionShoreline conditionLandscape array of habitatsHabitat connectivitySubstrate conditionEstuarine/tidal channel morphologyDesignated protected areasFreshwater inflowVulnerabilityInvasive speciesSystem engineersSeismic/tectonic regime
Pollution/Water qualityWater/sediment quality degradationContaminationMicroplastics
Substrate/soil changesAlterations to sediment regime, sedimentation patternLand surface subsidenceSubsurface flow alterationSubstrate modificationsChanges to below ground organic matter productionAlterations to bioturbation
Habitat structureChannel degradationVegetation loss/damage/alterationShoreline armoringLoss of large woody debris
Landscape geomorphologyChanges in habitat extent/diversity/connectivitySalinity regime changesEstuary morphology changesChanges to tide range/tidal prismCoastal subsidence/uplift
Biological communitiesChanges in fish/invertebrate diversity and abundanceAltered food websIncreases in algal and dinoflagellate bloomsLoss of salmon-derived nutrients
HydrologyLoss of tidal and floodplain connectivityChanges to freshwater inflowChanges to salt/freshwater mixing


Nursery Functions of West Coast Estuaries: Data Assessment for Juveniles of 15 Focal Fish
and Crustacean Species
Jason Toft, Stuart Munsch, Jeff CordellUniversity of Washington, School of Aquatic and Fishery Sciences
Kiira Siitari, Van Hare, Brett HolycrossPacific States Marine Fisheries Commission
Lisa DeBruyckerePacific Marine and Estuarine Fish Habitat Partnership
Correigh GreeneNorthwest Fisheries Science Center, National Marine Fisheries Service

Objectives
Synthesize the available data into a common format allowing for:
(1) Creation of maps displaying species location, average frequency of occurrence, and average catch per unit effort (CPUE).
(2) Comparison of the data, using the best quality portions of the dataset, to presumed habitat impacts measured by estuarine stressor scores.

Data Call (Tier 1 and Tier 2) 34 sampling programs across 47 estuaries, with over 468,000 individual records. Juvenile life-stages of the focal species, years 1990-2014.
Data variability and constraints: 1. Data coverage2. Gear types3. Metrics of
abundance4. Temporal
frequency of sampling
5. Spatial precision

Estuaries
47 estuaries total
20 estuaries: modelling analysis

Gear Type by Region
Otter Trawl
Beach Seine

Species by Gear Type

Maps
Example of good data coverage

Maps
Example of poor data coverage

Recommendations (Habitat)
• Standard habitat classification categories should be used so that labeling of sampled habitats are consistent (CMECS).
• Major habitat types (emergent tidal marshes, tidal flats, seagrass beds) and species with rich datasets (Chinook salmon, coho salmon, Pacific herring, and English sole), would be best suited for analyzing broad-scale habitat patterns in shallow waters.
• Improved spatial data of sampling locations along with current and historic habitat types and habitat losses would allow future data synthesis efforts to accomplish more precise analyses and habitat linkages.

Recommendations (Stressors)
• Chinook salmon, coho salmon, Pacific herring, and English sole: Most impacted by estuarine stressors, largest benefit from restoration efforts (*shallow water, beach seines, data limitations).
• Future analysis: Isolate effects of individual vs cumulative estuarine stressors, and conduct concurrent fish sampling with updating of stressors to illustrate dynamic trends.
• Acquiring specific measures of nursery function that target changes due to anthropogenic modifications, restoration actions, and sea level rise, will help us to predict the potential for improving and maintaining nursery functions given climate change scenarios.

Our Progress to DatePMEP Nursery Assessment Report
Objectives:
Synthesize the available data into a common format allowing for:
(1) Creation of maps displaying species location, average frequency of occurrence, and average catch per unit effort (CPUE).
(2) Comparison of the data, using the best quality portions of the dataset, to presumed habitat impacts measured by estuarine stressor scores.