Embed Size (px)
Citation preview

The Pedagogical Use of ICTs for Teaching and Learning within Grade Eight Mathematics in South African Schools
Verona Cassim
The Pedagogical Use of ICTs for Teaching and Learning within Grade Eight Mathematics in South African Schools
V. CASSIM
STUDENTNUMBER: 13173391
Dissertation submitted in the fulfillment of the requirements for the degree Master of
Education at the Potchefstroom campus of the North-West University
Supervisor: Professor A.S. Blignaut
Co-supervisor: Professor H.D. Nieuwoudt
Assistant supervisor Mr. C.J. Els
November 2010

i
Acknowledgements
To God all the glory, for providing me with the strength, health and ability to do everything to
the best of my ability.
I wish to express heartfelt thanks and gratitude to the following persons and institutions for
their assistance and professional support:
• Professor Seugnet Blignaut, my supervisor, whose guidance and insight turned my
studies into the most rewarding experience. Thank you for playing an important role in
my growth process and for going the extra mile. It has been an amazing journey and,
know, that I shall treasure all that you have taught me so far
• Professor Hercules Nieuwoudt (North-West University, Potchefstroom Campus, Faculty
of Education Sciences), my co-supervisor, for his encouragement, support and
guidance. Thank you for making time in your busy schedule when I visited the campus
• Dr. Suria Ellis (Statistical Services of the North West University Potchefstroom) for
assisting me with the correlations of my statistics
• Mr. Christo Els, special thanks to for his assistance with the interpretation of my data
and giving sound advice to best represent my data
• Mrs Hettie Sieberhagen, for the language editing of my dissertation
• Mrs Magdel Kamffer, thank you for acting as liaison between myself and the University
• To the IEA and SITES 2006 for the use of the data.
Thank you to my family for encouraging and believing in me.
ii
Abstract
Information and communication technology (ICT) has become part of education as it has, in
many cases, become the mode of choice of communication with people in all spheres of life.
It provides teachers with the opportunity to access information from a vast array of resources
that assists them in their teaching practices. Education in South Africa is constantly
transforming to new requirements from the National Department of Education (NDoE). The
fundamentals of Outcomes Based Education are lifelong learning and the development of 21st
century skills that allow learners to use information for different contexts. ICT enables
teachers and learners to access computer systems to develop skills, interact with their peers,
colleagues, and the global society. Even though teachers know the value of ICT in teaching
and learning, the pedagogical use of ICT in South African schools remains limited. In the
SITES 2006, South African teachers acknowledged that they were enthusiastic to explore
new ways to make teaching and learning more interesting, but that they encountered many
barriers that hinder the pedagogical use of ICT for mathematics. This research has
determined that the teachers’ ICT pedagogical knowledge contributed towards more effective
teaching and learning practices of mathematics in South African schools. The study also
describes how insufficient ICT pedagogical knowledge affected teachers’ confidence to
explore ICT tools. This study followed a secondary data analysis (SDA) of the Second
International Information Technology in Education Study of 2006 (SITES 2006) data from the
640 participating mathematics teachers in South Africa. The correlated data describes the
technological pedagogical content knowledge (TPCK) of mathematics teachers while making
use of ICT. Continuous professional teacher development is required to focus on the
attainment of information technology pedagogical knowledge to further the use of ICT on the
teaching of Mathematics. The study also indicates that South Africa lags far behind the other
22 countries that participated in SITES 2006.
Keywords:
Mathematics education; information and communication technology; technological
pedagogical content knowledge (TPCK); SITES 2006; e-Education policy; continuous
professional teacher development (CPTD); secondary data analysis (SDA).
iii
Table of Contents
Acknowledgements ................................................................................................................................... i
Abstract ..................................................................................................................................................... ii
Table of Contents .................................................................................................................................... iii
List of Figures .......................................................................................................................................... ix
List of Tables ............................................................................................................................................ x
List of Addenda ....................................................................................................................................... xv
List of Acronyms .................................................................................................................................... xvi
Chapter One Introduction to the study
1.1 Introduction ............................................................................................................................... 1
1.2 Background and problem statement ........................................................................................ 1
1.3 Purpose of the research ........................................................................................................... 5
1.4 Research design and methodology ......................................................................................... 6
1.5 Clarification of important terminology ....................................................................................... 6
1.6 Layout of the chapters .............................................................................................................. 7
Chapter Two Literature Review
2.1 Introduction ............................................................................................................................... 8
2.2 Philosophy of mathematics education ..................................................................................... 8
2.2.1 Mathematics education in South Africa .................................................................................... 9
2.2.2 The link between philosophical views and mathematics education ......................................... 9
2.2.3 Mathematics teaching and learning ....................................................................................... 11
2.2.3.1 Mathematics policy ................................................................................................................. 11
2.2.3.2 The standing of South African mathematics towards other systems ..................................... 11
2.2.4 Resources for mathematics ................................................................................................... 12
2.3 ICT as a mode of instruction .................................................................................................. 13
2.3.1 Pedagogical use of ICT .......................................................................................................... 13
2.3.2 ICT infrastructure ................................................................................................................... 15
2.3.3 Benefits of ICT in mathematics teaching and learning .......................................................... 16
2.4 Policies on ICT ....................................................................................................................... 18
2.4.1 e-Education White Paper ....................................................................................................... 18
2.4.1.1 e-Education White Paper recommendation ........................................................................... 19
2.5 Implementation of ICT ............................................................................................................ 20
2.5.1 South African implementation model ..................................................................................... 20
2.5.2 Implementation status of ICT in South African schools ......................................................... 20
2.5.3 Barriers to ICT implementation .............................................................................................. 21
iv
2.5.3.1 Extrinsic barriers .................................................................................................................... 21
2.5.3.2 Intrinsic barriers ...................................................................................................................... 22
2.5.3.3 Managing of barriers .............................................................................................................. 22
2.6 Managing of ICT ..................................................................................................................... 23
2.6.1 System management ............................................................................................................. 23
2.6.2 School management .............................................................................................................. 24
2.6.3 Classroom management ........................................................................................................ 24
2.7. ICT training and professional development of teachers ........................................................ 25
2.7.1 Professional teacher development ......................................................................................... 25
2.7.2 Required teacher professional development of teachers for implementation of ICT ............. 25
2.7.3 Current status of ICT CPTD in South Africa schools ............................................................. 26
2.8 Strategies for supporting teacher professional development ................................................. 27
2.8.1 External enabling strategies ................................................................................................... 28
2.8.2 School enabling strategies ..................................................................................................... 28
2.8.3 Teacher strategies ................................................................................................................. 29
2.9 Summary ................................................................................................................................ 30
Chapter Three Overview of the SITES modules 3.1 Introduction ............................................................................................................................. 32
3.2 SITES Module 1 ..................................................................................................................... 32
3.2.1 Study design and methodology .............................................................................................. 32
3.2.2 Conceptual framework and research questions ..................................................................... 33
3.2.3 Design of the survey instruments ........................................................................................... 33
3.2.4 Findings .................................................................................................................................. 34
3.2.4.1 Curriculum and pedagogy ...................................................................................................... 34
3.2.4.2 Infrastructure .......................................................................................................................... 34
3.2.4.3 Staff development .................................................................................................................. 36
3.2.4.4 Management and organisation............................................................................................... 36
3.3 SITES Module 2 ..................................................................................................................... 37
3.3.1 Study design and methodology .............................................................................................. 37
3.3.2 Conceptual framework and research questions ..................................................................... 38
3.3.3 Findings .................................................................................................................................. 38
3.3.3.1 ICT and innovative classroom practices ................................................................................ 39
3.3.3.2 ICT and the curriculum ........................................................................................................... 39
3.3.3.3 School context, sustainability and transferability of innovation .............................................. 40
3.3.3.4 Local and national ICT policies .............................................................................................. 41
3.4 SITES 2006 ............................................................................................................................ 41
3.4.1 Study design and methodology .............................................................................................. 42
3.4.2 Conceptual framework and research questions ..................................................................... 42
3.4.3 Design of the survey instruments ........................................................................................... 43
v
3.4.4 General information ................................................................................................................ 44
3.4.5 The teachers’ questionnaire .................................................................................................. 44
3.4.5.1 Information about the target class .......................................................................................... 44
3.4.5.2 Curriculum goal orientation .................................................................................................... 44
3.4.5.3 Pedagogical practice orientations .......................................................................................... 45
3.4.5.4 Learner practice orientations.................................................................................................. 47
3.4.5.5 Learning resources ................................................................................................................ 49
3.4.5.6 Outcomes assessment and ICT use ...................................................................................... 49
3.4.5.7 ICT using pedagogical orientations of mathematics and science teachers ........................... 50
3.4.5.8 Extent and perceived impacts of ICT on teaching and learning ............................................ 50
3.4.5.9 Teachers’ perceived impact of ICT on self ............................................................................. 51
3.4.5.10 Teachers’ perceived impact of ICT use on learners .............................................................. 53
3.4.6 Additional component to the teacher’s questionnaire ............................................................ 53
3.4.6.1 Pedagogical practices, ICT and content ............................................................................... 54
3.4.6.2 Pedagogical practices with ICT use contributed to changes in learners’ outcomes .............. 54
3.4.6.3 Initiating agent of teaching and learning actions .................................................................... 56
3.4.7 The school questionnaire ....................................................................................................... 57
3.4.8 National context questionnaire ............................................................................................... 57
3.4.8.1 Demographics ........................................................................................................................ 58
3.4.8.2 Structure of educational systems ........................................................................................... 58
3.4.8.3 Pedagogy ............................................................................................................................... 58
3.4.8.4 Use of Information and communications technologies .......................................................... 60
3.4.9 Perceptions of school principals about the presence of lifelong learning and
pedagogy in schools .............................................................................................................. 63
3.4.10 Conditions at school level ...................................................................................................... 64
3.4.10.1 Vision ...................................................................................................................................... 64
3.4.10.2 Infrastructure .......................................................................................................................... 65
3.4.10.3 Technical and pedagogical support ....................................................................................... 65
3.4.10.4 Staff development .................................................................................................................. 67
3.4.10.5 Leadership development priorities ......................................................................................... 67
3.4.10.6 Organisation and management of ICT in schools .................................................................. 69
3.4.11 School principals, perceptions of lifelong learning pedagogy ................................................ 70
3.4.12 Conclusion and reflections on South Africa’s ICT pedagogical status .................................. 71
Chapter Four Research Design and Methodology
4.1 Introduction ............................................................................................................................. 73
4.2 Secondary data analysis ........................................................................................................ 73
4.3 Study population for this secondary data analysis ................................................................. 74
4.4 Ethical consideration for SDA ................................................................................................ 74
4.5 Variables ................................................................................................................................ 75
vi
4.6 Statistical procedures for SDA ............................................................................................... 75
4.7 Summary ................................................................................................................................ 76
Chapter Five Results and Discussion
5.1 Introduction ............................................................................................................................. 77
5.2 Pedagogical use of ICT in grade 8 mathematics classrooms in South African
schools ................................................................................................................................... 77
5.2.1 General use of ICT ................................................................................................................. 78
5.2.1.2 Summary of general use of ICT ............................................................................................. 79
5.2.2 The pedagogical use of ICT ................................................................................................... 80
5.2.2.1 Summary of the confident pedagogical use of ICT ................................................................ 82
5.2.3 Learners’ competence with operating skills ........................................................................... 82
5.2.3.1 Summary of competence with operating skills ....................................................................... 84
5.2.4 Impact of ICT .......................................................................................................................... 85
5.2.4.1 Summary of the impact of ICTs on teachers .......................................................................... 87
5.2.5 Barriers of ICT use for teaching and learning ........................................................................ 87
5.2.5.1 Summary of the barriers ......................................................................................................... 89
5.3 Knowledge of the pedagogical use of ICTs in grade 8 mathematics ..................................... 88
5.3.1 Correlation with curriculum goals ........................................................................................... 89
5.3.2 Correlation with teacher practices .......................................................................................... 89
5.3.2.1 Correlations with extended projects ....................................................................................... 89
5.3.2.2 Correlation with teacher lectures............................................................................................ 90
5.3.2.3 Correlations with teacher practices (model making skills and procedures,
discovering principles and concepts, and processing and analyzing data) indicating
no significant correlations ....................................................................................................... 91
5.3.2.4 Correlations with teacher practices (ICT teaching activities) ................................................. 92
5.3.3 Correlation with impact of ICT use ......................................................................................... 93
5.3.3.1 Correlations with ICT skills ..................................................................................................... 93
5.3.3.2 Correlations with new teaching methods ............................................................................... 94
5.3.3.3 Correlations with individualised feedback .............................................................................. 95
5.3.3.4 Correlations with incorporating new ways of organising learners’ learning ........................... 96
5.3.3.5 Correlations with monitoring learners’ learning ...................................................................... 97
5.3.3.6 Correlations with availability of resources .............................................................................. 98
5.3.3.7 Correlations with collaboration with colleagues ..................................................................... 99
5.3.3.8 Correlations with collaboration with peers outside their schools ........................................... 99
5.3.3.9 Correlations with administrative tasks .................................................................................. 100
5.3.3.10 Correlations with increase in workload ................................................................................ 101
5.3.3.11 Correlations with work pressure ........................................................................................... 102
5.3.3.12 Correlation with becoming less effective as a teacher ......................................................... 103
5.3.4 Correlation with impact of ICT use on learners .................................................................... 103
vii
5.3.4.1 Correlations with learners’ subject matter knowledge ......................................................... 104
5.3.4.2 Correlations with learners’ learning motivation .................................................................... 105
5.3.4.3 Correlations with impact of learners’ information handling skills ......................................... 106
5.3.4.4 Correlation with impact on learners’ problem solving skills ................................................. 106
5.3.4.5 Correlations with learners’ self-directed learning skills ........................................................ 107
5.3.4.6 Correlations with impact on learners’ collaborative skills ..................................................... 108
5.3.4.7 Correlations with impact on learners’ communication skills ................................................. 109
5.3.4.8 Correlations with impact on learners ICT skills .................................................................... 110
5.3.4.9 Correlations with impact on learning at own pace ............................................................... 111
5.3.4.10 Correlations with impact on learners’ assessment results ................................................... 112
5.3.5 Correlation with confidence in the pedagogical use of ICT .................................................. 113
5.3.6 Correlations with enhancing ICT in teaching and learning .................................................. 114
5.3.7 Correlations with barriers in using ICT ................................................................................. 115
5.3.7.1 Correlations with ICT-related skills....................................................................................... 115
5.3.7.2 Correlations with identifying useful tools .............................................................................. 117
5.3.8 Correlations with teaching-related activities ......................................................................... 118
5.4 Summary .............................................................................................................................. 119
Chapter Six Conclusions and Recommendations
6.1 Introduction ........................................................................................................................... 122
6.2 Summary of the chapters ..................................................................................................... 122
6.2.1 Chapter one.......................................................................................................................... 122
6.2.2 Chapter two .......................................................................................................................... 122
6.2.3 Chapter three ....................................................................................................................... 123
6.2.4 Chapter four ......................................................................................................................... 124
6.3 Executive summary of the pedagogical use of ICT for the teaching and learning of
grade 8 mathematics in South African schools .................................................................... 124
6.4 Executive summary of how pedagogical knowledge contributed toward more
effective mathematics teaching in schools ........................................................................... 125
6.4.1 Impact of ICT use ................................................................................................................. 127
6.4.2 Teacher practices ................................................................................................................. 127
6.4.3 Barriers ................................................................................................................................. 128
6.5 Policy implications ................................................................................................................ 128
6.5.1 Phase I of the e-Education policy and findings from the SDA ............................................. 129
6.5.2 Phase II of the e-Education policy and findings from the SDA ............................................ 131
6.5.3 Phase III of the e-Education policy and the findings from the SDA ..................................... 132
6.6 Recommendations ............................................................................................................... 133
6.6.1 System level ......................................................................................................................... 133
6.6.2 School level .......................................................................................................................... 134
6.6.3 Teacher level ........................................................................................................................ 134
viii
6.7 Reflection on the research journey ...................................................................................... 135
References ......................................................................................................................................... 137
The addenda are available on a CD-ROM at the back of the dissertation.
ix
List of Figures
Figure 2.1 The Technological Pedagogical Content Knowledge Framework .................................... 14
Figure 3.1 Data frequencies for teacher practice orientations with ICT or not ................................... 46
Figure 3.2 South African learner practice orientation grade 8 mathematics ...................................... 48
Figure 3.3 South African grade 8 mathematics teachers’ use of ICT ................................................ 51
Figure 3.4 South African Grade 8 Mathematics teachers’ confidence in using ICT .......................... 52
Figure 3.5 Four spheres of contextual factors .................................................................................... 58
Figure 3.6 Percentages of school principals in Chile and South Africa interested in training ............ 68
Figure 6.1 Summary of the correlations study between the variables and other variables
from the SITES 2006 teachers’ questionnaire ................................................................ 126
x
List of Tables
Table 3.1 Four elements of SITES M1 and research questions ....................................................... 33
Table 3.2 Percentage frequencies of computers not in use in South Africa ..................................... 35
Table 3.3 SITES Module 2 research areas and questions .............................................................. 38
Table 3.4 Three categorised patterns in ICT and curriculum ............................................................ 39
Table 3.5 Education systems that participated in the three SITES modules .................................... 42
Table 3.6 Summary of number frequencies of core the indicators on curriculum goal
orientations for grade 8 mathematics in South Africa ................................................. 45
Table 3.7 Frequencies of the core indicators on pedagogical practice orientations in South
African schools .................................................................................................................. 46
Table 3.8 Summary of the number frequencies of the core indicators on learners’ practice
orientations in grade 8 mathematics in South Africa ........................................................ 48
Table 3.9 Frequencies of South African teachers’ perceived impact of ICT use on learners ........... 53
Table 3.10 Frequencies of pedagogical practices with ICT use contributed to changes in
learners’ outcomes ............................................................................................................ 55
Table 3.11 Frequencies of pedagogical practices contributed to change in teaching ........................ 56
Table 3.12 Frequencies of initiating actors of teaching and learning aspects .................................... 57
Table 3.13 Summary of questions on teacher preparation, change in pedagogical practices
and new pedagogies using ICT ........................................................................................ 59
Table 3.14 Participating systems and ICT policy in place .................................................................. 62
Table 3.15 Changes within systems ................................................................................................... 64
Table 3.16 Type of training for school principals ............................................................................... 68
Table 3.17 Changes in pedagogical practices .................................................................................... 70
Table 5.1 Percentage frequencies of general use of ICTs (word-processing, email,
electronic filing and spreadsheets) ................................................................................... 78
Table 5.2 Percentage frequencies confidence for the pedagogical use of ICTs .............................. 80
Table 5.3 Percentage frequencies of learners’ competence in operating skills ................................ 83
Table 5.4 Percentage frequencies for the impact of ICT on teachers’ pedagogical practices ......... 85
Table 5.5 Percentage frequencies of barriers of ICT use for teaching and learning ........................ 88
Table 5.6 Cross tabulations between teacher knowledge of teaching and learning
situations best suited for ICT use, and teacher use of ICT for extended projects ............ 90
Table 5.7 Effect size of the relationship between teacher knowledge of teaching and
learning situations best suited for ICT use, and teacher use of ICT for extended
projects .............................................................................................................................. 90
Table 5.8 Cross tabulations between teacher knowledge of teaching and learning
situations best suited for ICT use, and teacher use of ICT in teacher lectures ................ 91
xi
Table 5.9 Effect size of the relationship between teacher knowledge of teaching and
learning situations best suited for ICT use, and teacher use of ICT in teacher
lectures .............................................................................................................................. 91
Table 5.10 Cross tabulations between teacher knowledge of teaching and learning
situations best suited for ICT use, and teacher use of ICT to present Information
or demonstrations ............................................................................................................. 92
Table 5.11 Effect size of the relationship between teacher knowledge of teaching and
learning situations best suited for ICT use, and teacher use of ICT to present
information or demonstrations and or class instructions ................................................... 92
Table 5.12 Cross tabulations between teacher knowledge of teaching and learning
situations best suited for ICT use, and my ICT skills have improved .............................. 94
Table 5.13 Effect size of the relationship between teacher knowledge of teaching and
learning situations best suited for ICT use, and my ICT skills have improved ................. 94
Table 5.14 Cross tabulations between teacher knowledge of teaching and learning
situations best suited for ICT use, and incorporate new teaching methods ..................... 94
Table 5.15 Effect size of the relationship between teacher knowledge of teaching and
learning situations best suited for ICT use, and incorporate new teaching
methods ............................................................................................................................ 95
Table 5.16 Cross tabulations between teacher knowledge of teaching and learning
situations best suited for ICT use, and provide more individualised feedback to
learners using ICT ............................................................................................................. 95
Table 5.17 Effect size of the relationship between teacher knowledge of teaching and
learning situations best suited for ICT use, and provide more individualised
feedback to learners using ICT ......................................................................................... 96
Table 5.18 Cross tabulations between teacher knowledge of teaching and learning
situations best suited for ICT use, and incorporate new ways of organising
learners’ learning using ICT .............................................................................................. 96
Table 5.19 Effect size of the relationship between teacher knowledge of teaching and
learning situations best suited for ICT use, and incorporate new ways to
organising learners’ learning using ICT ............................................................................ 97
Table 5.20 Cross tabulations between teacher knowledge of teaching and learning
situations best suited for ICT use, and monitoring learners’ progress .............................. 97
Table 5.21 Effect size of the relationship between teacher knowledge of teaching and
learning situations best suited for ICT use, and monitoring learners’ progress ................ 97
Table 5.22 Cross tabulations between teacher knowledge of teaching and learning
situations best suited for ICT use, and access to more diverse or higher quality
learning resources ............................................................................................................. 98
Table 5.23 Effect size of the relationship between teacher knowledge of teaching and
learning situations best suited for ICT use, and access more diverse or higher
quality learning resources ................................................................................................. 98
xii
Table 5.24 Cross tabulations between teacher knowledge of teaching and learning
situations best suited for ICT use, and more collaboration with colleagues within
the school .......................................................................................................................... 99
Table 5.25 Effect size of the relationship between teacher knowledge of teaching and
learning situations best suited for ICT use, and more collaboration with
colleagues within the school ............................................................................................. 99
Table 5.26 Cross tabulations between teacher knowledge of teaching and learning
situations best suited for ICT use, and more collaboration with peers and experts
outside my school ........................................................................................................... 100
Table 5.27 Effect size of the relationship between teacher knowledge of teaching and
learning situations best suited for ICT use, and more collaboration with peers
and experts outside the school ....................................................................................... 100
Table 5.28 Cross tabulations between teacher knowledge of teaching and learning
situations best suited for ICT use, and completing administrative tasks ........................ 101
Table 5.29 Effect size of the relationship between teacher knowledge of which teaching and
learning situations are suitable for ICT use, and completing administrative tasks ......... 101
Table 5.30 Cross tabulations between teacher knowledge of teaching and learning
situations best suited for ICT use, and increased workload with the use of ICT ............ 102
Table 5.31 Effect size of the relationship between teacher knowledge of teaching and
learning situations best suited for ICT use, and increased workload with the use
of ICT............................................................................................................................... 102
Table 5.32 Cross tabulations between teacher knowledge of teaching and learning
situations best suited for ICT use, and there is increased work pressure ...................... 102
Table 5.33 Effect size of the relationship between teacher knowledge of teaching and
learning situations best suited for ICT use, and there is increased work pressure ........ 103
Table 5.34 Cross tabulations between teacher knowledge of teaching and learning
situations best suited for ICT use, and impact of ICT on learners’ subject matter
knowledge ....................................................................................................................... 104
Table 5.35 Effect size of the relationship between teacher knowledge of teaching and
learning situations best suited for ICT use, and impact of ICT on learners’ subject
matter knowledge ............................................................................................................ 104
Table 5.36 Cross tabulations between teacher knowledge of teaching and learning
situations best suited for ICT use, and impact of ICT on’ learners’ learning
motivation ........................................................................................................................ 105
Table 5.37 Effect size of the relationship between teacher knowledge of teaching and
learning situations best suited for ICT use, and impact of ICT on learners’
learning motivation .......................................................................................................... 105
Table 5.38 Cross tabulations between teacher knowledge of teaching and learning
situations best suited for ICT use, and impact of ICT on’ information-handling
skills................................................................................................................................. 106
xiii
Table 5.39 Effect size of the relationship between teacher knowledge of teaching and
learning situations best suited for ICT use, and impact of ICT on information-
handling skills .................................................................................................................. 106
Table 5.40 Cross tabulations between teacher knowledge of teaching and learning
situations best suited for ICT use, and impact of ICT on learners’ problem-solving
skills................................................................................................................................. 107
Table 5.41 Effect size of the relationship between teacher knowledge of teaching and
learning situations best suited for ICT use, and impact of ICT on learners’
problem-solving skills ...................................................................................................... 107
Table 5.42 Cross tabulations between teacher knowledge of teaching and learning
situations best suited for ICT use, and impact of ICT on learners’ self-directed
learning skills ................................................................................................................... 108
Table 5.43 Effect size of the relationship between teacher knowledge of teaching and
learning situations best suited for ICT use, and Impact of ICT on learners’ self-
directed skills ................................................................................................................... 108
Table 5.44 Cross tabulations between teacher knowledge of teaching and learning
situations best suited for ICT use, and Impact of ICT on learners’ collaborative
skills................................................................................................................................. 109
Table 5.45 Effect size of the relationship between teacher knowledge of teaching and
learning situations best suited for ICT use, and Impact of ICT on learners’
collaborative skills ........................................................................................................... 110
Table 5.46 Cross tabulations between teacher knowledge of teaching and learning
situations best suited for ICT use, and Impact of ICT on learners’ communication
skills................................................................................................................................. 110
Table 5.47 Effect size of the relationship between teacher knowledge of teaching and
learning situations best suited for ICT use, and Impact of ICT on learners’
communication skills ....................................................................................................... 110
Table 5.48 Cross tabulations between teacher knowledge of teaching and learning
situations best suited for ICT use, and impact of ICT on learners’ communication
skills................................................................................................................................. 111
Table 5.49 Effect size of the relationship between teacher knowledge of teaching and
learning situations best suited for ICT use, and Impact of ICT on communication
skills................................................................................................................................. 111
Table 5.50 Cross tabulations between teacher knowledge of teaching and learning
situations best suited for ICT use, and Impact of ICT on learners’ learning at their
own pace ......................................................................................................................... 112
Table 5.51 Effect size of the relationship between teacher knowledge of teaching and
learning situations best suited for ICT use, and Impact of ICT on learners’
learning at their own pace ............................................................................................... 112
xiv
Table 5.52 Cross tabulations between teacher knowledge of teaching and learning
situations best suited for ICT use, and Impact of ICT on learners’ assessment
results .............................................................................................................................. 113
Table 5.53 Effect size of the relationship between teacher knowledge of teaching and
learning situations best suited for ICT use, and Impact of ICT on learners’
assessment results ......................................................................................................... 113
Table 5.54 Cross tabulations between teacher knowledge of teaching and learning
situations best suited for ICT use, and prepare lessons that involve the use of
ICT by learners ................................................................................................................ 114
Table 5.55 Effect size of the relationship between teacher knowledge of teaching and
learning situations best suited for ICT use, and prepare lessons that involve the
use of ICT by learners ..................................................................................................... 114
Table 5.56 Cross tabulations between teacher knowledge of teaching and learning
situations best suited for ICT use, and do not have the necessary ICT-related
pedagogical skills ............................................................................................................ 116
Table 5.57 Effect size of the relationship between teacher knowledge of teaching and
learning situations best suited for ICT use, and do not have the necessary ICT-
related pedagogical skills ................................................................................................ 116
Table 5.58 Cross tabulations between teacher knowledge of teaching and learning
situations best suited for ICT use, and knowledge how to identify which ICT tools
will be useful .................................................................................................................... 117
Table 5.59 Effect size of the relationship between teacher knowledge of teaching and
learning situations best suited for ICT use, and knowledge how to identify which
ICT tools will be useful .................................................................................................... 117
Table 5.60 Cross tabulations between teacher knowledge of teaching and learning
situations best suited for ICT use, and computer use for teaching related
activities .......................................................................................................................... 118
Table 5.61 Effect size of the relationship between teacher knowledge of teaching and
learning situations best suited for ICT use, and computer use for teaching related
activities .......................................................................................................................... 118
Table 6.1 Executive summary of the pedagogical use of ICT for teaching and learning of
grade 8 mathematics in South African schools ............................................................... 125
Table 6.2 e-Education Phase I and findings from SITES 2006 and the SDA conducted for
this research .................................................................................................................... 129
Table 6.3 e-Education Phase II and findings from SITES 2006 and the SDA conducted for
this research .................................................................................................................... 130
Table 6.4 e-Education Phase III and findings from SITES 2006 and the SDA conducted for
this research .................................................................................................................... 133
xv
List of Addenda
Addendum 4.1 SITES 2006 Teachers’ Questionnaire
Addendum 4.2 SITES 2006 mathematics teachers’ data frequencies
Addenda are available on the CD-ROM at the back of the dissertation.

xvi
List of Acronyms
ANOVA Analysis of variance
CD Compact disk
CK Content knowledge
DVD Digital video disk
CD-ROM Compact disk, read only memory
CPTD Continuous Professional Teacher Development
FET Further Education and Training
GET General Education and Training
HOTS Higher Order Thinking Skills
ICT Information and Communication Technology
IEA International Association for the Evaluation of Educational Achievement
ISAD Information Society and Development
IT Information Technology
KHANYA Western Cape Educational Department Technology in Education Project
NAPTOSA National Professional Teachers’ Organisation of South Africa
NCS National Curriculum Statement
NDoE National Department of Education
NEPAD New Partnership for African Development
NRC National Research Coordinator
OBE Outcomes Based Education
ODC Online data collection
OfSTED The Officer for Standards in Education
OLSET Open Learning Systems Educational Trust
PC Pedagogical content
PCK Pedagogical content knowledge
PK Pedagogical knowledge
PIRLS Progress in International Reading Literacy Study
PNC Presidential Commission on Information Society and Development
PCA Problem-Centered Approach
SAR Hong Kong Special Administrative Regions
SABC South African Broadcasting Cooperation
SDA Secondary data analysis
SITES Second International Information Technology in Education Study
SMME Small, medium and micro enterprises
SMT Senior Management Team
TIMMS Trends in International Mathematics and Science Study
xvii
TK Technological knowledge
TCK Technological content knowledge
TPK Technological pedagogical knowledge
TPCK Technological pedagogical content knowledge
UNDP United Nations Development Program
UNESCO United Nations Educational, Scientific and Cultural Organisation
VSAT Very Small Aperture Terminal
1
Chapter One
Introduction to the Study 1.1 Introduction
The technological era demands that learners develop higher order thinking skills (HOTS) in school
education. Mathematics is an indispensable part of the curriculum and has an important role in the
development of HOTS to accomplish the tasks relevant to achieving the outcomes and developing
skills like conceptualising, abstraction, generalisation, problem solving and information-processing
(Nieuwoudt, 2006: 150-155). The South African education system should adapt to the change and
use information and communication technology (ICTs) to enhance the development of HOTS through
integrated ICT teaching and learning (South Africa, 2004b: 4).
The Second International Information Technology in Education Study (SITES 2006) was a large scale
comparative survey that provided an extended view on the pedagogical practices of ICT across the
world (Pelgrum et al., 2008: 10, 16) (Chapter 3). The study constructed three questionnaires that
were administered to school principals, ICT coordinators at schools, and mathematics and science
teachers in a probabilistic sample of more than 400 schools per country or education system. SITES
2006 focused on the role ICT can play in the teaching and learning of mathematics in schools and
examined how it can contribute towards the development of 21st century skills. They include
conceptualising, abstraction, generalisation, problem solving and information processing. From these
results, South Africa ranked the lowest ICT use for teaching and learning mathematics. Findings
indicate that other factors besides policy and school level conditions contribute to the insufficient ICT
use in teaching and learning (IEA, 2007: 2).
This chapter provides an overview of the background of the study, the purpose of the research, the
clarification of relevant terminology, as well as an outline of the following chapters.
1.2 Background and problem statement
The pedagogical use of ICTs consists of two main components, namely the application of pedagogy
and the use of ICTs. Mishra (2008) refers to the importance of having a sound technological
pedagogical content knowledge (TPCK) to ensure the effective integration of ICTs in schools.
Pedagogy is an active method of teaching with confidence using certain techniques, strategies and
2
technologies to attain pedagogical goals within a specific environment, as well as assisting learners
through interaction and activity in the ongoing academic and social events of the classroom (BlogSpot,
2008; Farlex, 2009: online; Martinet et al., 2001: 43-50). It is also known as the study or scientific
method of teaching where the teacher has to acquire relevant pedagogical knowledge and techniques
to be able to teach competently and confidently (BlogSpot, 2008: online). Besides having adequate
pedagogical knowledge, teachers should be knowledgeable about the content of their subject (content
knowledge) as well. The third important element in the TPCK is technological knowledge.
Technological knowledge is the ability to use the ICTs in teaching and learning of content knowledge
to learners. ICTs are characterised as artificial and symbolical technologies implemented in schools to
facilitate the teaching and learning process (Bosco, 2004: 266). Technological tools such as graphing
calculators, geometric software, multimedia tools and the Internet are useful tools in teaching and
learning mathematics (Jarred, 1998: 8). According to the White Paper on e-Education (South Africa,
2004b: 14), ICTs represent the convergence of information technology and communication technology
and the combination of networks, hardware and software, as well as the means of electronic
communication. The pedagogical use of ICTs refers to the methods and practices involved in using
ICTs for teaching and learning processes (Law et al., 2008e: 5). While pedagogy has a broad usage,
for the purpose of this investigation the ICT pedagogical practices of teachers relating to the methods,
techniques and strategies of ICT use in classrooms will be investigated (South Africa, 2002: 8).
The National Curriculum Statements for grades R-9 (South Africa, 2002), the South African education
system is based on progressive, learner-centered, outcomes-based education, with an integrated
approach to knowledge. Both The Need for an e-Education Initiative (South Africa, 2007b: 81) and the
National Curriculum Statement (South Africa, 2002: 8) for grades R-9, encourage the use of ICTs for
teaching and learning, especially in learning areas not traditionally taught through these tools. This
encouragement is manifested in the critical outcomes, which among others, require learners to use
science and technology to solve problems and communicate (South Africa, 2007a: 57-58). Some of
the most effective methods of teaching mathematics can be applied by means of certain electronic
devices and technologies (South Africa, 2007a: 5). Technology can be used to effectively master
routine elements of measuring, calculating, tabulating and graphing, which are some of the basic
mathematics processes learners have to master in grade 8 (Ruthven et al., 2002: 50).
Learning with ICTs is a powerful way to support learners to achieve NCS goals (South Africa, 2007a:
19). However, the South African results from international surveys and studies on the use of ICTs do
not reflect the vision stated within the policy documents. South Africa also participated in other large
scale studies: the international reading literacy levels (PIRLS), Trends in learner achievement in
mathematics and science (TIMMS) and SITES through the International Association for the Evaluation
of Achievement (IEA). South Africa performed poorly in all these studies compared to the other
participating education systems. Though ICT can add value to the teaching and learning of
mathematics, it is only effective when the three main components of the learning environment are
used simultaneously: (i) the content (subject matter), (ii) the pedagogy (means of teaching) and, (iii)
3
the technology (Mishra et al., 2006a: 1019). This implies a sound pedagogical content knowledge on
the use of ICTs. This study will, through secondary data analysis of the SITES 2006 data, investigate
teachers’ pedagogical use of ICTs for teaching and learning of mathematics in South African schools.
Mathematical pedagogy is based on the philosophy of mathematics. Many view mathematics as a set
of rules, while others regard mathematics as a combination of deductive and inductive processes
(Huetinck et al., 2000: 12). The teacher should be in charge of relevant mathematical knowledge,
skills, attitudes and values that the learners should achieve in order to facilitate learners in a specific
context. Therefore, effective mathematics teaching is not only about the personal attributes of the
teacher, but also about the contextual perspective of teaching and learning mathematics. Learners
with different learning styles should be challenged and supported to meet the expectations and reach
the logical and analytical outcomes required from a formal science subject like mathematics
(Goldsmith et al., 1993a: 124-131). The teachers questionnaire of the SITES 2006 study
(International Association for the Evaluation of Educational Achievement, 2006) investigated, amongst
others things, how and to what extend ICTs foster learners’ ability and readiness to set their own
learning goals and to plan, monitor and evaluate their own progress, as well as to what extent ICTs
impact problem-solving skills, self-directed learning skills, collaborative skills, etc.
The problem-centred approach (PCA), which is also a socio-constructivist approach is proposed as
the best practice for mathematics education at school level (Nieuwoudt, 2006: 33; Ridlon, 2004: 2).
Through PCA activities mathematics is not based on drill and practice exercises, but relates to the
active engagement of learners in mathematical problems and activities relating to their immediate
environments. Two cornerstones of PCA are problem-solving contexts and social interaction
(Nieuwoudt, 2006: 36). According to Murray et al. (1998: 171) social interaction creates opportunities
for learners to talk about their own thinking which is essential for meta-cognition and reflective
thinking. Reflective thinking is an important requirement for effective learning (Du Plessis et al., 2008:
16). Learners learn from the knowledge they construct during social interaction with their peers.
Meaningful problem solving and HOTS occur within learner-learner and teacher-learner relationships
which develop during such social constructivist interaction: “Technology’s greatest impact on learning
is in the area of problem solving and higher order thinking and when technology is integrated into the
core curriculum it can be an exceptionally powerful teaching and learning tool” (Jarred, 1998: 5).
Teachers who experience difficulties in developing learners’ understanding of mathematics, could
make use of ICTs to provide visual and dynamic representations of abstract ideas (Kennewell, 2004:
61). Teachers can, amongst others, obtain pedagogical support through a variety of technological
means: downloading teaching materials from the Internet, improving their pedagogical knowledge
though professional development, coping with curriculum changes through peer support, as well as
developing insight and obtaining advice from other online mathematics teachers. ICTs can assist
teachers in providing individual tuition and support to learners, especially learners with special needs.
Also, teachers can use ICTs to assist in electronic assessments, to keep record of marks and
4
outcomes, to report results, as well as to do many other repetitive administrative tasks (Oldknow et al.,
2003: 241). ICTs can provide opportunities to learners to apply mathematical skills in extended
projects (Way et al., 2007: 20). According to the Need for an e-Education Initiative (South Africa,
2007a: 104), ICTs make unique pedagogical contributions to the development of learners’
mathematical skills when they connect within and across areas of mathematics. Examples are
relational symbolical functions, computation of set values, and graphical representations generated of
a mathematical situation. Some key elements of the National Curriculum Statement for grade R-9
(South Africa, 2002) cannot be successfully accomplished without the use of ICTs.
The effective use of ICTs can challenge current pedagogical practices, as they facilitate efficient and
reliable communication between teachers (Tirosh et al., 2003: 653). According to the White Paper on
e-Education (South Africa, 2004b: 6&41), ICTs are obligatory to the changes taking place throughout
the world. Furthermore, the e-Education policy intends that all teachers should have integrated ICTs
into their classrooms by 2013. The percentage of South African schools with computers only
increased from 18% during the 1998 study to about 38% during the 2006 study, despite South Africa’s
enormous development leap during this period (Pelgrum, 2008a: 74). Considering the above stated
2013 objectives of the White Paper of e-Education and the fact that PCA is currently proposed as best
practice for mathematics education at school level (Nieuwoudt, 2006: 33), it is important that ICTs
should link to the basic requirements of PCA for the effective teaching and learning of mathematics.
ICTs can support PCA and at the same time add value to the teaching and learning of mathematics
(Law et al., 2008e). With proper equipment and training, teachers can easily use ICTs to compose
and facilitate assessments. One of the most widely used ICT in mathematics is the calculator. While
many learners in rural areas share calculators in groups because of poverty in the community, the
greater majority of learners do get the opportunity to use calculators in mathematic classrooms and at
home. Computer facilities are increasingly being implemented at schools in South Africa, and it is
therefore expected that mathematical computer software will be used by more schools in the future.
From the above, it becomes evident that ICTs offer benefits for the teaching and learning of
mathematics. However, only 8% of grade 8 South African mathematics teachers that participated in
the SITES 2006 studies (2008: online) reported that they made use of ICTs in their teaching of
mathematics (Law et al., 2008e: 159). Many respondents from the SITES 2006 indicated that the real
benefit of ICTs only becomes evident when teachers are both competent and confident to use ICTs.
Ruthven and Hennessy (2000: 43-88) and Law et al. (2008e), ICTs have the potential to change the
way mathematics is taught, but only when teachers are confident to use ICTs effectively in front of
their learners, who are often more ICT competent than them. Competent teachers plan effectively
with clear goals and specific instructional objectives, act with confidence, and reflect on how they
teach (Department of Education, 2002; Eison, 1990: 21). Such teachers tend to be more open
towards change relating to their teaching practices when they realise the value of ICTs for
mathematics teaching.
5
All Singapore’s learners had access to ICTs since 1998 and were the best performers in TIMMS 2003
still identified a number of barriers preventing teachers from using ICTs in teaching and learning (Law
et al., 2008e). Some of their teachers were not confident to use ICTs due to intrinsic and extrinsic
reasons. Extrinsic barriers related to the inability to change, the lack of control over access to ICTs,
insufficient time to plan instruction, inadequate technical skills, insufficient training to support teachers
with the ICT integration processes, as well as pressure from management for learner achievement
(Lim et al., 2006: 100). An additional extrinsic barrier important to the South African context is the
unavailability of guidelines for the integration of ICTs in mathematics teaching and learning
(Department of Education, 2007: 229). Intrinsic barriers relate to teachers’ low appreciation of the
benefits of ICTs in the learning process, their beliefs about what constitutes good teaching, the
teaching practices at the specific schools, the role of ICTs in teachers’ lives, teachers’ reluctance to
change, and technophobia (Law et al., 2008e). Large scale quantitative data of South Africa’s
participation in SITES 2006 (Law et al., 2008e) provide a valuable opportunity to explore different
intrinsic and extrinsic barriers of ICT use for pedagogical purposes in grade 8 mathematics in South
Africa.
Both the intrinsic and extrinsic barriers to teaching and learning with ICTs can be managed. Extrinsic
barriers can be managed through professional teacher development to assist in the ICT integration
process. Also, effective management of time and schedules assist teachers to plan their ICT
pedagogical integration, and also support them in the selection and use of educational software (Lim
et al., 2006: 103). When teachers focus on resolving their intrinsic barriers, their confidence and
competencies increase and they become more open to change. Therefore, both extrinsic and intrinsic
barriers should be addressed in order to facilitate effective change in schools (Drent et al., 2007: 189).
From the above exposition, the following research questions arise: What is the pedagogical use of
ICTs for the teaching and learning of grade 8 mathematics in South African schools? To what extend
can knowledge of the pedagogical use of ICTs in grade 8 mathematics contribute toward more
effective mathematics teaching in schools?
1.3 Purpose of the research
The aim of this study is to determine:
(i) what teachers’ pedagogical use of ICTs is within the teaching and learning of grade 8
mathematics in South African schools
(ii) to what extend knowledge of the pedagogical use of ICTs in grade 8 mathematics contributes
toward more effective mathematics teaching in schools
Conducting this research will give the National Department of Education (NDoE) some insight to the
progress of ICT integration in schools in collaboration with the aims set by the e-Education policy in
6
the three phase plan (South Africa, 2004b: 22-23) (Chapter 6), the extent of the pedagogical use of
ICT by teachers in mathematics classroom in South Africa, and the areas at system, school and
teacher level that need to be addressed in order to achieve those aims.
1.4 Research design and methodology
The study will follow a basic secondary data analysis (SDA) methodology that includes a scholarly
review of the literature, as well as analyses of the South African data of SITES 2006 (Smith, 2008: 4).
The central theme of the SITES group of studies was to understand how ICTs affect the way learners
learn in schools. For the purpose of this investigation, only the South African dataset for 640 grade 8
mathematics teachers who completed the teachers’ questionnaire was used for the SDA to gain
insight in the pedagogical use of ICTs in mathematics in South Africa.
1.5 Clarification of important terminology
The important terminology for this study is:
• Pedagogical use of ICT in education refers to the science or profession of teaching, which
includes how the teaching occurs, the approach to teaching and learning, the way the content is
delivered and what the learners learn as result of the process (Oakland, 2010: 1). The use of ICT
in mathematics is an example of an approach to deliver the subject content or the classroom
pedagogy (Law et al., 2008e). Technological pedagogical content knowledge (TPCK) links the
pedagogy, content and knowledge and is central to effective teaching and learning with ICT
(Chapter 2).
• Mathematics education focuses on engaging learners in problem solving situations, requiring
reasoning, discovering, inventing and communication of ideas and ultimately critically evaluating
the results and reflecting on the whole teaching and learning process (Thompson, 1988: 128)
• The International Evaluation for the Educational Achievement (IEA) started work in 1967
when a group of scholars, educational psychologist, sociologist and psychometricians met at the
UNESCO Institute for Education in Hamburg to voice their concern regarding problems in school
and education. Since then they have used educational systems across the world to experiment,
using a variety of research methods to get results for many questions concerning education and
the meaningful contribution towards the development of educational outcomes (IEA, 2007: 1).
• The Second International Information Technology in Education Study (SITES 2006) is an
international comparative research study conducted under the support of the IEA to research the
use of ICT in education. The study does not focus on the learner performance and abilities, but
on the pedagogical practices with ICT and the availability and integration of ICT in schools
(Pelgrum et al., 2008: 2).
7
1.6 Layout of the chapters
Chapter 1 provides an overview of the research study and addresses the introduction to the research,
the statement of the problem for the research, background to the study, the purpose of the research,
and clarification of terminology used throughout the study.
Chapter 2 links the relevant literature and underpinning philosophy of teaching and learning to
pedagogical practices of mathematics education in schools, resources available for teaching and
learning mathematics, the pedagogical use of ICT and how ICT can contribute to the effective
teaching and learning of grade 8 mathematics. The existing ICT-related policy model in South Africa
is discussed and how it relates to some other systems. The barriers experienced to implementing ICT
in South African schools are discussed and how these barriers can be overcome. The management
of ICT at system, school and classroom level is also addressed. The professional development status
in South Africa, the strategies implemented at system and school level, as well as the importance
thereof is discussed.
Chapter 3 provides an overview of the all the SITES Modules since the commencement of the
research by the IEA, specifically focussing on the purpose of the research, the research design and
methodology of all SITES research conducted, the findings from SITES M1 conducted between
1997and 1999, SITES M2 conducted from 2000 and 2002, and SITES 2006 which started in 2004
until 2006, and the recommendations made for future research.
Chapter 4 describes the research design and methodology of the SDA of the 504 South African
participating computer and non-computer schools; the nature of the dataset; the ethical consideration;
the variables that were identified for correlation SDA; and the statistical analysis procedures in this
SDA.
Chapter 5 analyses the results of the pedagogical use of ICT in grade 8 mathematics in South African
schools and the SDA conducted to answer the research question: whether the knowledge of the
pedagogical use of ICTs in grade 8 mathematics contribute toward more effective mathematics
teaching in schools.
Chapter 6 summarises the findings which have affected the three phase plan of the e-Education policy
in South Africa, the ICT integration process in schools, and recommendations at system, school and
teacher level to have ICT into all schools in South Africa by 2013 specifically in the teaching and
learning of all learning areas (subjects) (South Africa, 2004b).
8
Chapter Two
Literature Review 2.1 Introduction
This chapter describes the ICT use in mathematics education in South African schools. Firstly, it
refers to philosophical views of mathematical teachers and how these views underpin the teaching
and learning of mathematics in schools. This chapter also obtains information from the e-Education
policy (South Africa, 2004b), the National Curriculum Statement (NCS) for mathematics (South Africa,
2002), and how these policies compare to those from other educational systems. This chapter
outlines the South African e-Education implementation model developed by the NDoE and reviews the
current implementation status of ICT in South African schools. The chapter also describes the multiple
resources available for teaching mathematics in schools, the availability of ICT infrastructure in South
African schools, as well as how ICTs benefit mathematics teaching and learning. It is necessary to
take note of the barriers that hinder the implementation of ICT in South African schools and other
systems worldwide, and possible solutions to overcome these barriers are speculated on. The
chapter concludes with the need for continuous professional teacher development (CPTD) and how
the current status of CPTD influences ICT use in South African schools.
2.2 Philosophy of mathematics education
Mathematics has a unique place within the every education system. It has been debated since the
early Greek philosophers Plato and Aristotle, as well as Thompson (1988) and in modern times .
Teachers’ patterns of behaviour and instruction methods are manifested in their notions, beliefs, and
preferences. All teaching therefore will be influenced by these conceptions (Thompson, 1984: 173).
The NCS grades R-7 (South Africa, 2002: 4) mathematics is a human activity that involves observing,
representing, investigating patterns and quantitative relationships in physical and social phenomena
and relationships between mathematical objects themselves. Mathematics has unique symbols to
describe the multiple patterns, geometrical and graphical relationships. Mathematics is a form of
symbolic language which allows humans to think about, record and communicate ideas in relation to
quantities. It is a universal method of communicating with numbers irrelevant to the race, language or
social background of individuals. Gates and Vistro-Yu (2003: 31-32) add that mathematics is a
discipline by which individuals make sense of the world through communication of information, ideas,
and solving a range of real life tasks and problems.
9
2.2.1 Mathematics education in South Africa
The Constitution of the Republic of South Africa in Act 108 of 1996 (South Africa, 2002: 1) provides a
foundation for curriculum transformation and development to enable education to move forward as
one nation and not according to previous colour margins . Mathematics aims to heal the divisions of
the past by having an education system used in all school throughout the nine provinces in South
Africa, create a society based on democratic values, improve the quality of life for all citizens, develop
the potential of all people, and build a united and democratic South Africa (South Africa, 2002: 1).
Education and the curriculum are fundamental in realising these aims. A new curriculum, the
outcomes-based curriculum (OBE), was developed to enable learners to reach their maximum
potential.
2.2.2 The link between the philosophical views and mathematics education Philosophy has multiple meanings: it refers to the academic study devoted to the systematic
examination of concepts such as truth, existence, reality, causality, and freedom. It also denotes a
particular system of thought or a set of principles or concepts underlying a particular sphere of
knowledge. Broadly, philosophy refers to beliefs, aims, precepts, or principles that underpin
practices, conducts, restraints, resignations, tranquillity or rationality in the behaviour or response of
people to events (Barnhart et al., 1990a: 1565).
Mathematicians in South Africa have different philosophical views on what mathematics entails. Every
mathematics teacher has an opinion, a judgment and a particular way of interpreting or thinking about
something. This is especially true of how mathematics should be used in specific situations. While
many philosophers view mathematics as a set of rules, others regard it as deductive and inductive
processes (Huetinck et al., 2000: 12). Disagreements about what constitutes good mathematics
teaching prevail. One should address the nature of mathematics to resolve these issues (Marang,
2006; Thompson, 1988: 132). Mathematics education in South Africa promotes OBE as philosophy,
but various other philosophical viewpoints are still dominant in classrooms.
The realist formalists view mathematics as absolute truths bound together through logic. Intrinsic
meanings then form the basis of mathematics teaching. This eclectic view often involves the more
gifted learners (Nieuwoudt, 2006: 11) and strongly links to the traditional method of mathematics
teaching. From this perspective, the mathematics teacher plays the central role in the teaching and
learning where learners have become passive recipients of knowledge.
From a relativist perspective, Aristotle believed that mathematics constantly develops in the human
mind, expands through human creation and invention while generated patterns are distilled into
knowledge. He believed that learners should engage in mathematical activities from a problem-
centred approach while they enquire to get to know (Nieuwoudt, 2006: 11; Stanford Encyclopedia of
10
Philosopy, 2004; Stumpf, 1993: 80-107). Therefore, the role of teachers is to present learners with
problems which they engage in and solve. Activities from this philosophical perspective are aimed at
the highest cognitive domains and require that learners plan, generate, produce, formulate, design
and construct knowledge (Gunter et al., 2003: 27).
The instrumentalists view mathematics teaching as content organised according to a hierarchy of skills
and concepts (Thompson, 1988: 136). Therefore, mathematics teaching becomes a set of unrelated,
but utilitarian rules and facts to be taught and learnt (Ernest, 1989: 13-33; Nieuwoudt, 2006: 12). This
perspective of mathematics results in a product-directed method of teaching. The role of the teacher
is to demonstrate, explain and define the material, and present it in an expository style. This method
of teaching has dominated mathematics classrooms. It overarches many teachers’ perspective of
good mathematics teaching as teachers’ philosophical views determine their methods and classroom
practices of mathematics teachings (Setati, 2004; Thompson, 1988: 136).
The OBE viewpoint, which forms the basis of the NCS is rooted in the functionalist or socio-
constructivist paradigm (Burrel et al., 1979). Mathematics teaching and learning should be objective
and qualitatively focused on the development of unique individuals through life-long learning, who are
confident and independent, literate, numerate, and multi-skilled, compassionate, respectful of the
environment, and will participate in society as a critical and active citizen (South Africa, 2002: 8).
Nieuwoudt (2000: 7) maintains that teaching and learning of Mathematics should be discussed from
an ontological-contextual perspective consisting of six inter-related aspects: the teacher, learner,
content, intention, live interaction and the context, which coherently enable learners to perform
learning tasks. Teachers, who use learning facilitation as a teaching strategy, should have a clear
goal about what they want to achieve during learning interventions. The teacher should be in charge
of relevant mathematical knowledge, skills, attitudes and values that learners should achieve in order
to facilitate learners in a specific context. Therefore, effective mathematics teaching is not only about
the personal attributes of the teacher, but also about the ontological-contextual perspective of teaching
and learning mathematics. Learners of different types of learning styles should be challenged and
supported to meet the set expectations and to reach the logical and analytical outcomes required from
a formal science subject like mathematics (Goldsmith et al., 1993a: 124-131).
The problem-centred approach (PCA) represents a socio-constructivist approach like OBE. It is
currently proposed as a best practice for mathematics education at school level (Nieuwoudt, 2006: 33;
Ridlon, 2004: 2). Conducting PCA mathematics activities is not based on drill and practice exercises,
but relates to the active engagement of learners in mathematical problems and activities relating to
their immediate environments. Two cornerstones of PCA are problem-solving contexts and social
interaction (Nieuwoudt, 2006: 36). According to Murray et al. (1998: 171) social interaction creates
opportunities for learners to talk about their own thinking, essential for meta-cognition and reflective
thinking.
11
After research in nine secondary schools, Wilson, Cooney and Stinton (2005: 83) state that good
mathematics teaching comprises:
• teachers who have a comprehensive knowledge of mathematics
• teachers who promote mathematical understanding
• learners engaged and motivated to learn mathematics
• teachers who manage the teaching and learning process effectively
• guidelines to ensure good mathematics education
• a mathematics curriculum policy that ensures that learners obtain appropriate knowledge and
skills.
When all these components are presents good mathematics teaching and learning will take place.
2.2.3 Mathematics teaching and learning
In this section the following aspects of mathematics education will be discussed: mathematics policy
and the standing of South African mathematics towards other systems.
2.2.3.1 Mathematics policy
For the General Education and Training (GET) band eight learning area statements were developed:
languages, mathematics, natural sciences, social sciences, arts and culture, life orientation, economic
and management science, and technology. The learning area statement and the national policy on
assessment form the foundation for teaching and learning in each learning area (subject). Included in
the learning area statements are the critical outcomes, which relate to the long term goals for
education in South Africa. One of the critical outcomes is to use science and technology effectively
and critically. Within each learning area are learning outcomes and assessment standards which
learners should be achieved before progressing to the next learning outcome. For mathematics the
leaning outcomes are: numbers, operations and relationships; patterns, functions and algebra; space
and shape; measurement; and data handling. The teaching and learning of mathematics comprises
the mastering of the learning outcomes in alliance with the critical outcomes. Teaching mathematics
with technology is part of the critical outcomes: use science and technology effectively and critically,
showing responsibility towards the environment and the health of other (South Africa, 2002: 1).
2.2.3.2 The standing of South African mathematics towards other systems
South Africa was one of 49 countries across the world who participated in the Trends in International
Mathematics and Science Study (TIMMS) in 2003. The aim of TIMMS 2003 was to provide policy
makers and curriculum designers with data about learners’ achievements in mathematics and science
in relation to different types of curricula, instructional practices and school environments.
Fundamentally all systems want their learners to be able to compete in a global society and therefore
12
it is important for each system to improve the teaching and learning of mathematics and science and
address the areas for improvement (Mullis et al., 2004: 13).
For TIMMS 2003 four different points as international benchmarks were used to represent the range of
performance of learners. The advanced benchmark was 625, the high benchmark was 550, the
intermediate benchmark was 475, and the low benchmark was 400. The best performing countries
were Singapore, Chinese Taipei, Korea, and Hong Kong Special Administrative Regions (SAR) had
about one-third or more of their learners reaching the advanced benchmark, about two-thirds to three-
fourths reaching the high benchmark, around 90% reaching the intermediate benchmark, and almost
all (96 to 99%) reaching the low benchmark. In South Africa, none of the learners at grade 8 could
reach the advanced benchmark which focussed on the ability to organise information and make
generalisations to solve non routine mathematical problems. Only 2% of the grade 8 learners could
apply their understanding and knowledge in a wide variety of complex situations, and only 6% of the
grade 8 learners could apply basic mathematical knowledge in uncomplicated questions. The highest
score was reached in the low international benchmark at 10% of grade 8 learners in South Africa, with
having a basic mathematical knowledge (Mullis et al., 2004: 62-64).
The results from the TIMMS 2003 study indicate that South Africa was one of the poor performing
countries and were, at that stage, not able to compete in a global society. Policymakers, curriculum
designers, and teachers have a huge task to raise the level of teaching and learning of mathematics in
South African schools. It will contribute to increase the results in mathematics if all the role players are
provided with the necessary resources and training.
2.2.4 Resources for mathematics Miller (2003: 2) identifies four important principles for successful mathematics teaching: let it make
sense, remember the goals, know your tools, and live and love mathematics. These four principles
also should be central to the teaching and learning of any mathematics class. Teachers should strive
to ensure that the concepts they teach are understood. The goals that mathematics teachers aim for
their learners to achieve are: to survive in the modern world, understand the information surrounding
them, prepare for further education and training, to teach logical reasoning, and appreciate the beauty
of mathematics.
To meet these mathematical principles and goals, teachers should know the mathematical tools
available to them. However, some of these tools can be intimidating. Miller (2003: 2) reminds about
the basic rules of mathematical tools: quantity does not equal quality. Using fewer tools effectively is
more useful than using more tools ineffectively. Mathematical resources and tools can be categorised
in two groups: basic tools and extras. The basic tools consist of: the blackboard, chalk and books to
write in; the mathematics curriculum; and manipulatives (concrete objects like the abacus, place value
cubes, fraction, and cardboard models, and geometry and measuring tools). Many extra tools are
13
available: games for drill and practice exercises, games relevant to certain topics, mathematical
software, and an online library of technology tools, lessons, activities, and support materials.
2.3 ICT as a mode of instruction
The White Paper on e-Education (South Africa, 2004b) defines ICT as representing a body of
information technology and communication technology. Galloway (2007: 1) states that the use of the
term ICT is unique to the field of education. Others refer to this concept as information technology
(IT), which includes a wide range of equipment such as computers, cables, the Internet, wireless
connections, handheld devices, mobile phones, digital cameras, DVD and CD players, television,
radio and microwave installations. The IT range of tools for educational purposes includes data-
capturing tools, multimedia software, information systems, publishing and presentation tools, digital
recording equipment, computer projection technology and computer-controlled microscopes for
science (Osborne et al., 2003: 4). The communication aspect linked to IT mainly focuses on the
communication of learners and teachers by through the use of word-processing, electronic mail, video
conferencing and web searching and communication. Additionally, the term ICT is also used when
information technological equipment is used to perform an educational task focusing on achieving the
learning outcomes and assessment standards set by the curriculum. Therefore, ICT is not merely
beneficial for learners in terms of ongoing support, but also increases cognitive engagement with
Mathematics by means of providing mathematical contexts, enabling learners to visualize
mathematical concepts and aiding them in communicating with mathematical forms independent from
the mathematical formulas.
2.3.1 Pedagogical use of ICT
All of our lives are influenced by new technologies. This is especially true for ICT in teaching and
learning in schools. In the past, many tasks have been performed without using ICT, and the question
arises: of what is the value ICT brings the pedagogy? Ertmer et al. (1999: 47) maintains that ICT can
supplement, support and facilitate the entire curriculum.
However, merely introducing ICT into teaching and learning is not sufficient. Teachers should be
skilled and knowledgeable in order to appropriately incorporate ICT into their teaching and learning
practices (Mishra et al., 2006b: 1018). Shulman (2004: 201) in The Wisdom of Practice discusses
three categories of knowledge that facilitate effective teaching: content knowledge, pedagogical
knowledge, and pedagogical content knowledge. Content knowledge (CK) refers to the quality and
organisation of knowledge in the thought processes of teachers. Mathematics teachers should have
appropriate content knowledge to be able to teach the subject successfully (Ball et al., 2008: 395;
Mishra et al., 2006b: 1026). Pedagogical knowledge (PK) refers to the expertise of teachers in
selecting appropriate methods of teaching the content to learners. Ball et al., (2008: 395) maintain
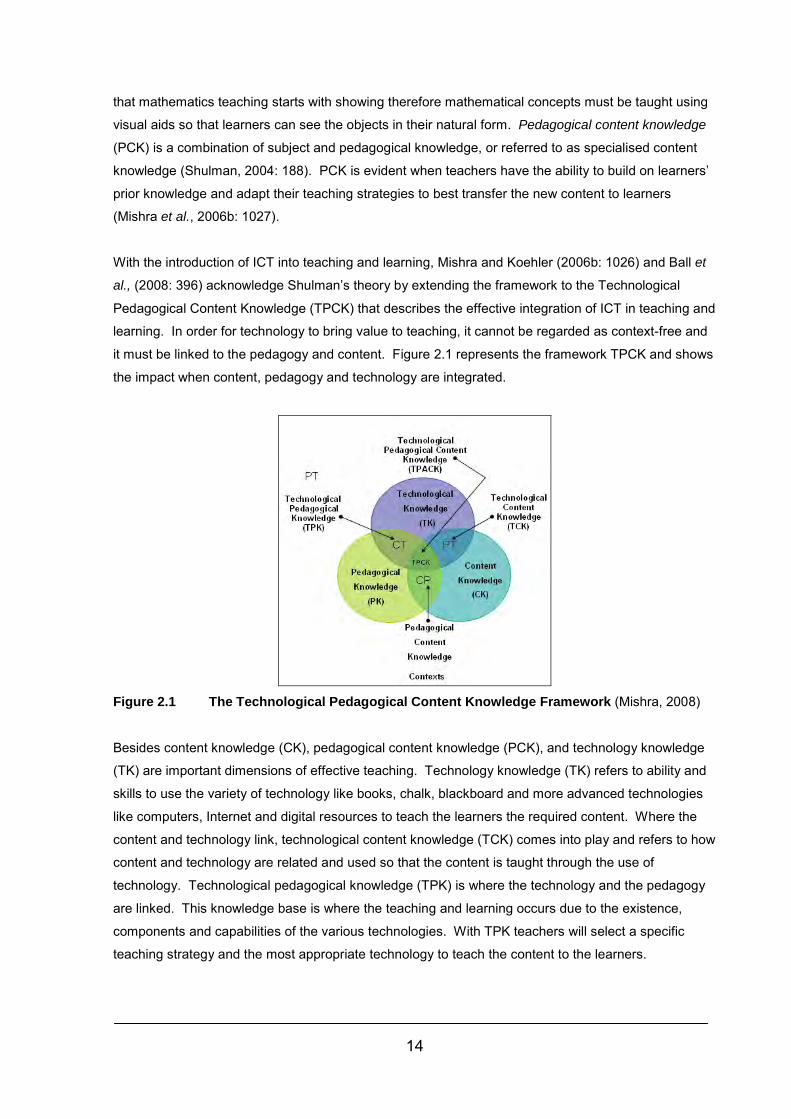
14
that mathematics teaching starts with showing therefore mathematical concepts must be taught using
visual aids so that learners can see the objects in their natural form. Pedagogical content knowledge
(PCK) is a combination of subject and pedagogical knowledge, or referred to as specialised content
knowledge (Shulman, 2004: 188). PCK is evident when teachers have the ability to build on learners’
prior knowledge and adapt their teaching strategies to best transfer the new content to learners
(Mishra et al., 2006b: 1027).
With the introduction of ICT into teaching and learning, Mishra and Koehler (2006b: 1026) and Ball et
al., (2008: 396) acknowledge Shulman’s theory by extending the framework to the Technological
Pedagogical Content Knowledge (TPCK) that describes the effective integration of ICT in teaching and
learning. In order for technology to bring value to teaching, it cannot be regarded as context-free and
it must be linked to the pedagogy and content. Figure 2.1 represents the framework TPCK and shows
the impact when content, pedagogy and technology are integrated.
Figure 2.1 The Technological Pedagogical Content Knowledge Framework (Mishra, 2008)
Besides content knowledge (CK), pedagogical content knowledge (PCK), and technology knowledge
(TK) are important dimensions of effective teaching. Technology knowledge (TK) refers to ability and
skills to use the variety of technology like books, chalk, blackboard and more advanced technologies
like computers, Internet and digital resources to teach the learners the required content. Where the
content and technology link, technological content knowledge (TCK) comes into play and refers to how
content and technology are related and used so that the content is taught through the use of
technology. Technological pedagogical knowledge (TPK) is where the technology and the pedagogy
are linked. This knowledge base is where the teaching and learning occurs due to the existence,
components and capabilities of the various technologies. With TPK teachers will select a specific
teaching strategy and the most appropriate technology to teach the content to the learners.
15
The central dimension where all these technology will meet are known as Technological Pedagogical
Content Knowledge (TPCK) which is not merely a basis of technology, pedagogy and content. Mishra
and Koehler (2006b: 1029) maintains that TPCK is the basis of teaching with technology which
requires:
• an understanding of the representation of concepts with technology
• pedagogical techniques that use technologies in constructive ways to teach content
• knowledge of what makes concepts difficult or easy to learn and how technologies can redress
the problems learners are facing
• knowledge of learners’ prior knowledge and theories of teachers’ nature of their philosophy
• knowledge of how technology can be used to build on their existing knowledge and build on new
philosophies.
When ICT is embedded in the teaching and learning (TPCK), many activities are available to learners
to research, create and communicate using ICTs to enhance their learning. ICT specifically enhances
both the theoretical and practical aspects of teaching and learning. Examples are: speeding up and
enhancing work production, linking school content with reality, supporting exploration and
experimentation and providing immediate feedback, focusing attention on over arching issues,
increasing relevant and underlying abstract objects and improving motivation and engagement
(Osborne et al., 2003: 4). More importantly, these activities will not be effective if the learners cannot
use the technological devices. It is the teacher’s responsibility to teach the use of these devices while
simultaneously focusing on skills development, acknowledge acquisition and collaboration (Galloway,
2007: 2).
2.3.2 ICT infrastructure
Infrastructure refers to the essential hardware elements that form the basis of a system or structure
(Barnhart et al., 1990b: 1084). Supplying schools with the necessary ICT infrastructure is the first step
towards ICT integration in education. The basic ICT infrastructure includes: a basic computer, an
advanced computer, a refurbished computer, a basic laptop, a server and a basic printer. In 2005 the
ICT infrastructure status for teaching and learning in South Africa was: Eastern Cape 7.89% out of 6
239 schools were equipped with the basic infrastructure; 25,9% out of 1 842 schools in the Free State,
78.81% out of 1 897 schools in Gauteng, 11.98% out of 5 653 schools in Kwazulu-Natal were
equipped, 16.32% out of 1 863 schools in Mpumulanga, 60.43% out of 422 schools in the Northern
Cape, 8.74% out of 4187 schools in Limpopo, 29.73% out of 2 025 schools in the North West, and
76.55% out of 1 454 schools in the Western Cape. The national status for ICT infrastructure for
teaching and learning was 22.59% out of the 25 582 schools in South Africa (South Africa, 2007b: 57-
58).
The SITES 2006 data on the availability of ICT resources of the participating schools through the
technical questionnaire indicate that South Africa has the lowest infrastructure at 17%, Thailand
16
following at 40%, Chile and the Russian Federation at 47% and the remaining system above 60%
(Pelgrum, 2008b: 81). A shortfall of infrastructure will influence the implementation process,
professional development and the ICT status in comparison with other educational systems worldwide.
South Africa faces many challenges regarding integration of ICT in schools, eventually making it
impossible to compete with other systems in all areas relating to education (Els et al., 2009: 2).
2.3.3 Benefits of ICT in mathematics teaching and learning
A benefit is an advantage which has a good effect and promotes well-being (Barnhart et al., 1990b:
188). ICT cross-curriculum use can be an advantage for teachers, learners, schools, as well as the
wider education system. How can each sector in education benefit by ICT cross-curriculum use?
In their study of How Information Technology Enable 21st Century Schools, Kolderie and Mc Donald
(2009: 1) maintains that the national and provincial departments benefit by gaining competent learners
and teachers who could compete in a global society. This comparative study indicate that ICT cross-
curriculum schools are more effective and achieve better results in assessment when compared to
schools that did not use ICT. In an European study, Balanskat et al., (2006: 1) noticed that learners’
marks in their various subjects increased, their motivation increased, their cognitive processing
developed, and they were able to work independently. The initial cost of installing the ICT
infrastructure is high, but ultimately the institutions will be cutting on costs, especially with regard to
resources like books, copying, and postage.
Schools benefit in many aspects from using ICT. Firstly, learning and teaching materials are available
in one central location, ensuring easy access for both teachers and learners. Teaching aids are also
made available by means of email and websites, and new stimulating lessons are readily accessible to
all learners. Learners can communicate and share information with one another, as well as with
teachers, even after the end of the normal school day. Although machines cannot replace the human
interaction between teachers and learners, they can be used to enhance the relationship between the
various role players within the system of education (Bramald et al., 2000: 6). Role players in the
learner’s school career, e.g. parents, have easy access to important information on the homepage,
which saves time and money, and ensures that all role players receive relevant news (Becta, 2006: 3).
Assessment marks are also recorded electronically and parents can monitor their children’s
performance without making an appointment with the class teacher. Additionally learners can have
access to their marks at all times to pace their performance as well (Twiner et al., 2007: 141). This
indicates that the computer-generated classroom allows a multi-faceted teaching and learning
experience (Becta, 2010: 2).
Ward (2003: 9) states that teachers have mixed opinions on the benefits of ICT, but according to
Kolderie and McDonald (2009: 7), teachers can benefit in various ways, including reconstructing and
improving the method of presenting, planning, advising and evaluating their work, as well as their
17
teaching practice in general. Teachers who make use of ICT realise its value through engaging with
ICT when teaching their learners. Their attitudes change as they realise the value it brings and many
make a paradigm shift when they embrace the concept of teaching and learning by means of
technology (Balanskat et al., 2006: 2). Learners also benefit from teachers using ICT. Learners’
individual needs are catered for, as they are able to engage in creating their own knowledge and play
an active role in their own learning. Learners also become the centre of learning and they can work at
their own pace without feeling pressured. Enrichment exercises can also be done after they have
finished their tasks, which will ensure that the learners feel more motivated to learn. A vital aspect of
OBE is that the individual needs can be catered for by creating activities according to the level of the
abilities of each learner. Learners can complete tasks at their own pace without feeling pressured by
the rest of the group. They engage in creating their own knowledge through exploring with multiple
tools at their disposal. By engaging with the various tools and software, they are actively involved in
learning. Additionally, teachers can engage with the more competent learners in enrichment exercises
(Kolderie et al., 2009: 1-7). Some learners love playing with numbers, but find mathematics difficult or
just boring. Edutainment software can make learning mathematics fun—or at least a lot less painful—
by incorporating solid mathematics practices work into multimedia by combining animations, problem-
solving exercises, learning games, and adventure plots. Educational specialists agree that much
learning takes place through the interactivity of play (Cooper et al., 1996: 34-36).
Galloway (2007: 64) believes that ICT significantly supports the teaching of mathematics through
shareable tools on interactive whiteboards. They include games and activities specifically designed
for the learning of mathematics. Examples are drill and practice type activities, during which learners
use ICT to practice concepts and calculate their sums. Some of these activities are designed to assist
the whole class, and others are suitable to support the individual learner.
Surveys, counting work and fractions in bars are some of the spreadsheet activities for the foundation
phase, while ratio, percentages, estimation, currency converters, and travel budgets for the
intermediate and senior phase are some of the activities addressing the outcomes for mathematics.
Spreadsheets are easily accessible tools for teachers without schools having to purchase additional
software (Ozgun-Koca, 2000). Spreadsheets create platforms where abstract concepts in
mathematics can be communicated through pictures, coloured squares, number lines, number charts
and pictographs. They also serve classrooms with diverse learning styles (Goldsmith et al., 1993b:
124-131). Dynamic software (e.g. spreadsheets, Geometeris™, Sketchpad™, GeoGebra™) cater for
learners who learn visually as they use colour and patterns to shade areas to visualise addition and
subtraction. According to Bloom (1976) and Gardner (1986), developing higher order thinking and
problem solving skills are some of the critical outcomes learners have to develop in order to survive in
the world of work. Using the formulas allows them to focus on the mathematical reasoning and helps
them to shift between a wider range of representations of modelling approaches embedded in
spreadsheets. Dynamic spreadsheets and spreadsheets provide learners with the opportunity to
organise their ideas using charts and graphs from existing records, and present the relevant

18
information to analyse, interpret and add meaning to the information. By using ICT in teaching
mathematics, curriculum outcomes can be addressed through various activities, particularly
spreadsheet activities ranging from foundation phase to senior phase (Lewis, 2001) Spreadsheets
also contribute to learner motivation. The computer is a judgement free environment where learners
can be motivated to play, complete tasks, correct their mistakes and add some personal touches to
their work (Lewis, 2001; Ozgun-Koca, 2000).
The interactive whiteboard and other multimedia tools can be used to explain mathematical concepts
to groups or to the whole class. The built-in computer performs difficult calculations like long
additions, multiplications, divisions and subtractions, which saves time and provides the teachers the
opportunity to focus on more important activities at hand.(Gillespie, 2006: 99). Various integrated
learning systems are available which adjust automatically according to the learner’s performance.
These integrated systems record the learners’ results which then assist the teachers in assessment.
Additionally, ICT develops the skills, concepts and the ability to perform mathematical procedures
through drill and practice (Galloway, 2007: 67). According to Gillespie (2006: 94), computers support
and heighten the learning process as ICT mediated learning supports weaker learners by permitting
them to learn at an appropriate pace (Lim, 2006: 84).
2.4 Policies on ICT
A policy is defined as a course of action, a program of actions adopted by a person, government or the
set of principles on which they are based (Barnhart et al., 1990a: 1613). It is a prerequisite for all
educational systems to have a national ICT policy. Policymakers are responsible for implementing this
policy successfully. Embedded within the policy must be a vision—an idea perceived vividly in the
wisdom of planning. According to The Need for an e-Education Initiative in South Africa (South Africa,
2007b: 7) the vision of South Africa is that all its people will have access to lifelong learning, education
and training opportunities, which will ultimately contribute towards improving the quality of life.
However, the reality is that South Africa faces many barriers to the implementation of ICTs in schools.
2.4.1 e-Education White Paper
The NDoE has a responsibility towards ensuring the implementation of ICT in schools. In 2004, the
former Minister of Education, Naledi Pandor, introduced the Draft White Paper on e-Education after
consultations within the Presidential Commission on Information Society and Development (PNC on
ISAD) since 2001. An advisory team consisted of representatives from the public as well as the
private sectors. In September 2002 three focus areas, education, health and small, medium, and
micro enterprises were identified by an additional council made up of executive officers from large
international companies and professionals working in the field of ICT (South Africa, 2004b: 8). The
19
ICT policy development in South Africa lags behind other countries. In the late 1990s, the Danish
Ministry of Education introduced an ICT integrated achievement plan; Italy’s program for the
Development of Educational Technologies was implemented during 1997-2000; the e-Japan strategy
was introduced in 2001; and Masterplan for IT in Education for Singapore has existed since 1997
(Anderson et al., 2008: 57-63).
The ICT policy in South Africa holistically organises important aspects relating to ICT to ensure
effective implemented (South Africa, 2004b: 8&22-23). The national policy is a framework that relates
to equity, access to ICT infrastructure, capacity building and norms and standards to ensure that
educational institutions, teachers and learners are engaging in creative, problem-centred and
innovative activities. In alignment with the national policy all ICT schools should have an active ICT
policy to monitor the functioning and equipment within the laboratory. Each school should develop its
individual ICT policy within context specifically keeping in mind the motivation, the pedagogies and
technological infrastructure (Way et al., 2007: 16). The purpose of the school ICT policy is to address
the different elements needed to regulate the daily activities within the laboratory as well as the duties
of the different ICT committee members (Pacaltsdorp, 2009: 1).
2.4.1.1 e-Education White Paper recommendations
Singapore made policy recommendations after conducting research on the effective integration of ICT
in Singapore schools (Lim, 2006: 112-113). These include: developing strategies for learners’ ICT
competency in government and subsidised schools, setting standards for teachers and learners, and
re-assessing methods of assessment currently used. It was agreed that the vision statement for ICT
integration has to be clear and the whole school community should share this vision. A framework
should be designed where teachers can work collaboratively on ICT-mediated lessons, allowing every
teacher within the same department to create ICT mediated lessons and distribute the available
resources and lesson preparations. Regular workshops were held to showcase examples of ICT
mediated lessons, and to provide learners and teachers with incentives as a motivating mechanism.
According to Childs et al., (2005: 30) the NDoE should have the authorisation to set ICT related
policies, outcomes and curriculum guidelines to support e-learning. Strategic planning for e-learning
integration at national and regional level must be in place. A committed team of managers, technical
staff and teachers is needed to promote the policies for ICT integration. Unenthusiastic managers and
teachers should be replaced. The ICT integration learning programs have to be flexible in structure,
methods and time allocation, and these have to be easily accessible to accelerate the teaching and
learning process.
20
2.5 Implementation of ICT In the following sections the implementation of ICT is discussed under the headings of South African
implementation models, implementation status of ICT in South African Schools, and barriers to ICT
implementation.
2.5.1 South African implementation models
In accordance with the NDoE obligation to deliver on public expectation and growth as well as the
assurance that every learner in the General Education and Training (GET) and Further Education and
Training (FET) band will be ICT literate by 2013, a three phase implementation model with specific
priorities and actions, was created in alignment with the capacity and national educational budget .
Phase I (2004-2007) focussed on the enhancement of system-wide and institutional readiness to use
ICT in teaching and learning. In Phase II (2007-2010) the focus has been on the system-wide
integration of ICT’s into teaching and learning. Phase III (2010-2013) ICT’s will be integrated at all
levels of the education system—management, teaching, learning and administration (South Africa,
2004b: 22-23).
2.5.2 Implementation status of ICT in South African schools According to The Need for an e-Education Initiative in South Africa (South Africa, 2007b), referring to
system-wide readiness to use ICTs for learning, teaching and administration, the lowest percentages
were seen in the Limpopo Province where only 50% of regional offices were connected, less than
three percent (2.09%) of schools were connected for administrative purposes, and less than two
percent (1.24%) of schools were connected for teaching and learning purposes. The Western Cape
was the only province with a 99% availability of computers for administrative purposes. Nationally in
South Africa in 2005, less than thirty percent (22.59%) of schools had computers for teaching and
learning.
Other initiatives that support ICT implementation in South Africa are Mindset, the Learning Channel
and OLSET (Open Learning Systems Educational Trust) who were active in developing content
applicable for the South African curriculum. Mindset has developed more than two hundred hours of
educational content in video, print, computer-based format and multimedia including both primary and
high schools. The basic functionality of OLSET includes: to provide teachers with learner-centred
pedagogy, qualitative audio and print support materials, design, produce and broadcast radio
instruction programs on SABC (South African Broadcast Cooperation), and use ICT to deliver the
curriculum in rural schools. Gulati (2008: 12) agrees that the printed materials, radio and television
are more useful and available in rural schools. In August 2006, 18 535 content resources were
available via Thutong Portal relating to the National Curriculum Statement (South Africa, 2007b: 62).
Unfortunately, these provisions are not adequate to address the shortcomings at system level.
21
2.5.3 Barriers to ICT implementation
A barrier refers to an obstruction, or something which separates one place from another; often a
stumbling block obstructing success (Microsoft Corporation, 2006). It can also be something that
causes problems or makes it impossible for something to happen (Burgess, 2002: 51). According to
Barnhart and Barnhart (1990b: 166) a barrier is something which hinders progress. There are many
ICT-related barriers that affect teachers, managers, learners and the broader education sectors. They
ultimately have an effect on the success of ICT implementation in schools and may prevent the
successful integration of ICT in schools, or prevent schools from realising their pedagogical goals.
These can be divided into barriers with extrinsic and intrinsic qualities. Lim and Khine (2006: 91-96)
focus on extrinsic as well as intrinsic barriers hindering the implementation of ICT, whereas Pelgrum
(2008b: 85) mainly looks at extrinsic barriers teachers experienced during SITES 2006.
2.5.3.1 Extrinsic barriers
Poverty, insufficient social and educational infrastructures and cultural issues are examples of
extrinsic barriers which restrict developing countries and widen the gap between the privileged and
deprived groups. In China, more than 70 000 schools with computers and more than ten million
learners have mastered basic computer skills. Most of these schools are in cities. Rural and poorer
communities are continually being deprived of investment, infrastructure and skilled teachers.
Technology has done little to help deprived groups gain access to educational opportunities (Gulati,
2008: 1-12). This seems to be much the same situation in South Africa (Pelgrum, 2008b: 86).
The pedagogical barriers from the SITES 2006 were: insufficient Internet-enabled computers, a
scarcity of ICT equipment for learners with special needs, unsatisfactory ICT equipment for teaching,
outdated computers, shortage of digital equipment for instruction, and lack of ICT science tools for
laboratory work (Pelgrum, 2008b: 85). These aspects act as barriers as they prevent successful
integration of ICT from taking place. All the equipment, if easily accessible for teachers and used
correctly, will allow teachers to achieve the learning outcomes in the best possible manner.
Several substantial issues were raised regarding the ICT integration and effectiveness in England,
Singapore, Canada, New England, and Australia (Bramald et al., 2000: 2; Granger et al., 2002: 485;
Lim et al., 2006: 99; Richardson, 2000: 12; Ward, 2003: 2). An important aspect was the amount of
time available to teachers to devote to the learners who are working on the computers as there is
often only one or two computers available per class. It takes much time to teach learners even the
most basic word-processing skills in such cases. The amount of time it takes teachers to acquire skills
to use high-level and complicated software is also a problem as they do not have the knowledge and
skills to interact with the software on a high level. Insufficient and immediate technical support is also
problematic.
22
2.5.3.2 Intrinsic barriers
The intrinsic barriers are those essential aspects that hinder change of teachers towards ICT
integration (Ertmer et al., 1999: 55). These barriers are of a personal nature and much more difficult
to overcome (Lim et al., 2006: 100). According to Greenberg et al(1998: 300), Handal (2004: 8) and
Ward (2003: 8)the fact that teachers do not believe in the ability of ICT to enhance learning, have
confidence in their learners and the contexts of schools, and their reluctance to change their deep-
rooted teaching methods will require much effort to change. Ward (2003: 9) reveals that teachers
disliked the ongoing development and the requirement of changing their teaching practices.
Every new curriculum development will encompass barriers that should be addressed. However, they
are not impossible to overcome. Ignoring the barriers that prevent the use of ICT in the teaching and
learning process is not the route any stakeholder in education will follow. Bramald et al. (2000: 3),
suggested that once barriers have been overcome, the development gains momentum and overcomes
the issues of limited teachers’ skills. Confidence increases and implementation spreads. In the past
barriers were addressed in isolation, but Thornburn (2004: 2) envisages the importance of dealing with
these barriers as a whole.
2.5.3.3 Managing of barriers Managing of barriers relate to overcoming defeat or to control something successfully (Burgess, 2002:
459). For the implementation of ICT to be successful, educational institutions, managers, technical
staff and teachers should overcome barriers. Every new curriculum development comprises barriers
that should be addressed. Although the previous education system was not developed to adjust to
any changes within the system (Kolderie et al., 2009: 10), it is not impossible to overcome the barriers
of ICT implementation in schools. Strategies should in place to speed the process of addressing
barriers (Lim et al., 2006: 100).
Employing strategies for solving the extrinsic barriers seems to be straightforward. The failure to
complete activities within a specific timeslot could be overcome by allocating appropriate timeslots to
each subject. ICT-mediated lessons have to be pre-tested before the learners participate in the
activity to ensure that all technical glitches are addressed. A supply of CD-ROM courseware should
be available to assist the teachers in their teaching. Teachers should allow learners to progress at
their own pace, and not at that of the teacher. The frustration that outdated computers and insufficient
computers cause should be rectified by the school management team and local education department.
Schools should be supplied with adequate computers to optimally mediate an ICT learning
environment (Lim et al., 2006: 109-113).
23
Addressing the intrinsic barriers requires much more effort as teachers’ beliefs of teaching and
learning with ICT should be changed. Teachers need ongoing motivation and they should be willing to
make a mind shift and gain confidence in their ability to change. Getting teachers to not only make
use of ICT in their traditional methods, e.g. using drill and practice exercises, but also to engage in
CPTD activities to develop their skills and knowledge on the use of ICT in teaching and learning, is
extremely important. Teachers should be encouraged to participate in seminars, workshops and
demonstration sessions where the focus is on the pedagogical aspect of ICT use. They should reflect
on what they have learnt, as well as areas that still need assistance to increase their confidence (Lim
et al., 2006: 114-119). Motivating teachers and learners with incentives like flexibility in achieving the
ICT-related outcomes is a method to develop positive attitudes towards ICT in teaching and learning
(Lim et al., 2006: 121).
2.6 Managing of ICT
The ICT managerial duties are not solely the responsibility of the NDoE and provincial departments of
education, but all that of stakeholders, including the school, the community, and teachers.
2.6.1 System management
The Ministry of Education is first and foremost responsible for development and integration of ICTs in
schools. Managing ICT at system level is a big responsibility. Quebec, Canada, is one of the world
leaders in ICT integration in education and they have measures in place to ensure a high level of ICT
curriculum content available that is accessible to teachers. They continually evaluate ICT tools,
curriculum content, assessment practices, and CPTD. Teachers have access to online networks from
which they download relevant documents and communicate with each other. Quebec has a budget of
about $2 million for computer and telecommunications infrastructure, as well as a separate grant for
content development, and for maintenance. Finland, which is considered the leader in ICT
implementation, has 90% of their primary and 95% of high schools connected to the Internet. They
have an annual budget of €50.5 million, to further their ICT strategy. Schools in Finland are supported
by the Ministry of Education through infrastructure, strategic planning, support services, and the
development of learning materials. Israel was one of the first countries to have an ICT integration
program ready in the early nineties. The Ministry of Education and the national lottery have provided
funds since1994 for the development of new curricula, alternative assessment methods, CPTD, and
infrastructure that provides schools with ICT infrastructure and Internet broadband (Richardson, 2000:
5-19). The NDoE of South Africa has a set three phase plan for ICT integration into teaching and
learning to ensure the process are managed and integrated according to the targets set within the plan
(South Africa, 2004b: 22-23). Unfortunately the implementation of the phase plan is not as effective
as visualized.
24
2.6.2 School management
Managing a school is foremost the responsibility of the principal or school leader. Leadership is the
condition of the ability to lead and give guidance and direction (Barnhart et al., 1990a: 1191). It is
imperative for all educational institutions to have leaders that guide ICT innovations in schools. The
school leader in collaboration with its leadership team is central in supporting teachers to participate in
innovative practices (Scrimshaw, 2004: 5). The principal, with one or two deputy principals and the
heads of departments, constitutes the leadership team known in South Africa as the Senior
Management Team (SMT) (Knapp et al., 1996: 9). The SMT is responsible for the strategic planning
and management of the school which includes strategic direction and development of the school,
teaching and learning, leading and management staff, efficient and effective deployment of staff and
resources and accountability. Strategic direction, which relates to the continuous development of ICT
administration and development, is needed to ensure the effective functioning of the school. The SMT
should determine to what extent the ICT curriculum should be taught, and the relevant teacher training
required for the ICT-related needs to be met. Members of the SMT have leadership and managerial
responsibilities. Adequate resources should be distributed at the school according to the strategic
plan for ICT curriculum integrating. Learning areas should be allocated to the most suitable staff
member for each specific area. SMT members are accountable to the parents, governing body and
the NDoE (Becta, 2002: 1-2).
In addition, the SMT has specific ICT-related obligations including the planning and arranging of the
ICT CPTD plan, ICT purchasing, ICT planning, ICT numeracy and literacy targets, understanding and
ensuring integration of ICT into the teaching and learning. Managing ICT and guaranteeing ICT are
integrated into the curriculum (Becta, 2002: 2). School managers should regularly monitor the
integration process to ensure that ICT targets are met.
Unfortunately, many SMT’s experience many challenges which hinder the strategic planning and
management of schools. The annual technology budget of the school is an important aspect central to
the future ICT innovation. SITES 2006 indicated that more than forty percent (47.71%) of principals
did not even have enough funds for non-ICT supplies. Principals should be aware of the factors that
influence the effective use of ICT in their schools to be able to facilitate the eradication of
inadequacies in their schools (Vallance, 2008: 1).
2.6.3 Classroom management
It is crucial for ICT to be managed appropriately within the classroom to ensure that the pedagogical
use of ICT within teaching and learning is in line with achieving the 21st century skills.
Lim (2006: 110-111) states that, in order to effectively integrate ICT in the classroom, a favourable
environment should be created. Firstly, the educational institution needs to address the classroom
25
management issues which create a barrier for successful ICT pedagogical use. During a study by Lim
(2006) for Effective integration of ICT in Singapore schools, a couple of important issues concerning
classroom management were identified. The availability of ICT tools, the creation of disciplinary rules
and procedures, and the distribution of labour among teachers, technical assistants and learners is
important to ensure smooth functionality of the ICT laboratory and that maximum learning will take
place for the time learners have access to the facilities. Classroom activities should be designed to
engage learners in high-order thinking. It must also acknowledge the role of the teacher in creating
suitable activities and achieve high-order thinking. The teacher should keep the outcomes of each
lesson in mind and make use of scaffolding where learners must unpack the information in order to
solve the problem. Learners should also be trained in ICT skills to ensure the activities will be
performed without wasting time.
2.7 ICT training and professional development of teachers
ICT professional development of teachers is fundamental in ensuring that teachers will integrate ICT
into their teaching and learning practices. The development of teachers must be based on the TPCK
model to teach new concepts to the learners.
2.7.1 Professional teacher development
Profession refers to an occupation that needs a high level of training or education (Burgess, 2002:
506). According to Barnhart et al. (1990b: 572), development is the process of growth and expansion.
Burgess (2002: 182) states that it is the practice of becoming better in your job. The Need for an e-
Education Initiative (South Africa, 2007b: 25) describes professional development as the provision of
access for teachers to resources, tools and services designed to facilitate the teaching and learning
process. Ongoing professional development forms an integral part of education enhancement.
Providing teachers with adequate resources, tools, training and opportunities to develop their ICT
skills is essential in ultimately achieving successful pedagogical use of ICT (Reynolds et al., 2003:
159). Childs et al. (2005: 30) and Zucker (2008: 132) acknowledge that continuous professional
teacher development (CPTD) is an essential though costly element in ensuring the integration of ICT
in teaching and learning. If CPTD is inadequate, barriers will affect ICT integration (Becta, 2006: 2).
2.7.2 Required teacher professional development for the implementation of ICT
The quality of CPTD ensures that teachers make a paradigm shift and become innovative and
adventurous in their teaching practices (Ward, 2003: 12). CPTD should occur in all sectors of
education, including leadership development, teacher development, supporting staff development and
technical staff development (Becta, 2008a; Becta, 2008b: 1). A detailed training program for each
staff member, depending on the role they fulfil at the school, should be implemented, ensuring that
26
teachers are not only experts users of computers, but are at least skilled in using ICT to teach learners
(Ward, 2003: 11). The CPTD must engage teachers in continuous, life-long training that will ensure
that they are constantly gaining new insight regarding technological and curriculum developments
(Thornburn, 2004: 3). Therefore, CPTD must ensure that all teachers have a sound technological
pedagogical content knowledge (TPCK), not merely teaching using ICT, but knowing how to teach the
content using ICT.
A CPTD program that focuses on skills training, as well as on the design, development and provision
of ICT integration is needed. Technical staff should be supplied with the technical and administrative
equipment necessary for learner support. The ICT tools have to be in good condition to ensure that
effective teaching and learning with ICT can take place (Childs et al., 2005: 30). Apart from the basic
training for ICT integration, a CPTD program in the form of workshops, courses and other in-service
programs is essential to keep teachers motivated and equipped for new trends. Zucker (2008: 132)
and Granger et al.,(2002: 483) maintain that teachers' successful implementation of ICT in should be
‘just-in time’ collaborative learning where teachers learn from their colleagues as well as from the
learners. A balance between formal and informal training is vital to ensure that ongoing CPTD takes
place. All schools are responsible for maintaining a guaranteed high standard of CPTD to promote the
attainment of the learning outcomes (Zucker, 2008: 132).
2.7.3 Current status of ICT CPTD in South African schools
Reynolds, Treharne and Tripp (2003: 159) report that in 2002 that only six out of every ten high school
teachers were trained in ICT use, and half of teachers in primary schools in South Africa never had
any ICT training. SITES 2006 indicated that only 26% of the participating mathematics teachers in
South Africa had ICT training for Internet and general applications like word-processing, spreadsheet
and data processing. Nine percent of mathematics teachers attended a pedagogical ICT course, but
87% indicated that they would have liked to attend a similar course. Education systems like Alberta
Province, Canada, Chile, Finland, Israel, Italy, Japan, France, Norway and Thailand also indicated that
their educational institutions have insufficient ICT integrated courses (Pelgrum, 2008b: 97). The Need
of an e-Education Initiative in South Africa (South Africa, 2007b: 216) states that CPTD will be
monitored through a provincial development model. The program will focus on improving teachers’
competence in using ICT for their administrative tasks, as well as in their classrooms. It declares that
ICT training will form an integral part of continuous CPTD.
ICT training in South African schools is an area of concern. During SITES 2006 the technical
coordinators indicated that 32% of teachers attended introductory courses (word-processing,
spreadsheet, databases), 19% received training for technical courseware relating to operating and
maintaining computer systems, 16% attended advanced courses for application or standard tools
(advanced word-processing, relational databases, etc.), 15% had training in advanced courses for
Internet use, 17% in learning area specific training and 13% on multimedia use (Pelgrum, 2008b: 100-
27
101). These findings indicate that the majority of teachers in South African schools have received
insufficient training to ensure the smooth integration of ICT into administration, managing, and
teaching and learning. According to The Need for an e-Education Initiative in South Africa (South
Africa, 2007b: 38) all learners in the GET and FET will be ICT capable by 2013. When considering the
backlog regarding the ICT training of teachers in 2006, we should realise that the strategic goal of the
NDoE may not be achieved.
Depending only on private initiatives like Microsoft Partners in Learning to collaboratively work with the
various Departments of Education will not solve the lack of ICT pedagogical training within the broader
education system. It will also not accommodate the magnitude of teachers who still need training.
There are other pathways which can be explored to maximise the output of CPTD. According to
Blignaut et al. (2009: 6), technical coordinators at schools can assist and promote CPTD programs
which are currently not functioning to their potential.
The school and the Ministry of Education are responsible for CPTD to ensure successful ICT
integration in schools (Vallance, 2008: 14). A professional learning community where all staff and
learners participate in continuous training is important for personal growth to ensure that a high
standard of education is maintained (Becta, 2008b: 3). To achieve a positive climate for CPTD at
schools, regular training must form part of the teacher training program at school. Competent and
confident teachers will raise the standard of education at schools in South Africa and enable teachers
and learners to compete globally with leading ICT countries like Singapore and Finland.
2.8 Strategies for supporting professional teacher development
Every education system and school needs a structured plan to ensure the level of CPTD on ICT
integration in teaching and learning to be at an acceptable standard. In 2001, Finnish schools had a
strategy for ICT CPTD at school and further education and training level (Richardson, 2000: 15). In
Lithuania, more than ninety percent (92%) of the participating school teachers in SITES 2006
indicated that they have been trained for pedagogical use of integrating ICT, as well as subject-
specific training with learning software (Pelgrum, 2008b: 101). Unfortunately, it is not always possible
to address the shortage of CPTD at national and provincial levels. Schools in all systems as well as in
South Africa should contribute to the CPTD of ICT integration in teaching and learning.
28
2.8.1 External enabling strategies
External aspects such as support and guidance from the NDoE and the various provincial education
departments can often be the most frustrating part of ICT implementation and usage, and can make
managers and teachers very despondent. This is especially true with regard to something as this ‘new’
as ICT, especially since it can have such a great influence on the general approach to teaching and
learning in schools. Several external strategies are recommended and can be put in place to achieve
less frustration during ICT integration.
Community involvement can help schools to move further towards a learner-centred approach of ICT
integration by supplying schools with computers through fundraising, use the existing facilities to
further training, and allowing learners to make use of the ICT facilities after school under the
supervision of a governing body member. Through community involvement, ICT integration will
benefit from such an approach and the integration of ICT will become more contextualised. Promoting
a working relationship with neighbouring schools, teachers can exchange ideas and information to
integrate ICT into pedagogical practices. Skills training sessions can be arranged for teachers to
enable them to become more confident about using ICT use in their classes. Participating in the
national ICT initiatives like ICT-based projects can also cultivate a beneficial positive attitude.
Managers can have access to valuable information and training if they actively participate in these
projects and initiatives. Teachers can communicate with other teachers via email, blogs, wiki’s and
webcams to share ideas and information. Using these multiple methods will ensure that ICT CPTD
development will take place (Childs et al., 2005; Scrimshaw, 2004: 6).
2.8.2 School-enabling strategies
There are many ways in which schools can move ahead without any external support to enable ICT
use in schools. The role of the principal is essential in enabling teachers to engage in innovative
practice (Gibson, 2002). Planning the ICT implementation process is central to any success. There
are three aspects of planning which should be taken into consideration: (i) the creation of a vision that
is an important driving force behind the success of any project; (ii) the importance of needs
assessment; (iii) the need for a school development plan. The following three aspects are important:
to assess the current status of ICT in the school, to determine what the shortcomings are, and
establish the methods by which those shortcomings will be addressed (Becta ICT Research, 2006).
Any success should have a clear goal to attain the end product. All role players within the school
should be involved with ICT integration and sharing of resources, information, ideas and planning of
the integration process. CPTD at school level can take place where a variety of approaches may be
used depending on the level of staff abilities and current skills at their disposal. In Finland it is
compulsory that 10% of all teaching staff members at a school should be competent in ICT curriculum
content, professional applications, creating digital resources, and the ability to assist in ICT
29
management and training (Richardson, 2000: 16). Many schools have skilled staff members who can
assist and train the other staff members to assist them in utilising the basic skills required to use ICT in
classrooms. Schools should appoint reliable technical support to assist in the basic technical
requirements of implementing the ICT program (Scrimshaw, 2004: 5). The materials and equipment
should be easily accessible—preferably all at a central location where all teachers can access these
(Becta, 2006: 2).
2.8.3 Teacher strategies
Bramald et al.,(2000: 5) identifies four factors at teacher level that affect teachers’ engagement with
ICT. They are confidence, time, access to quality resources and adequate CPTD. If teachers are not
confident in using ICT, they are less likely to experience the positive effect it has on the quantity and
quality of the learners’ work. Reynolds et al., (2003: 159) and (Ward, 2003: 8) observed that the
teachers’ confidence as well as their abilities has an influence on the extent of ICT use in their
classrooms and also on the effectiveness of it. The teachers’ level of confidence has a noticeable
effect on the outcomes learners achieve (Bramald et al., 2000: 5). During a quantitative study in
Queensland schools, mathematics teachers were asked to indicate whether they are confident to use
technology while teaching mathematics, and of the 483 participants, 59% indicated a high level of
confidence, 33% indicated moderately confident and only 18% said that they were not confident.
SITES 2006 indicated that 70 % of Mathematics teachers indicated that they had little or no
confidence with regard to using ICT in teaching and learning situations (SITES, 2006a: 64) and
Proctor-Jamieson et al. (2006: 2-4) also acknowledge that lack of confidence in teachers is a global
problem which many educational institutions experience which can be a reason why many teachers
shy away from communication due to the fact that they lack confidence.
Granger et al. (2002: 487) maintains that attitudes, philosophies and communication are also
important factors that influence ICT implementation. Attitudes such as resistance and to change
teachers’ philosophical view can prevent the successful integration of ICT in teaching and learning,
especially when teachers have not realised the advantages of using technology in their teaching
practices.
In contrast to the adaptability and acceptance required from the teachers in terms of valuing ICT as
effective tools in schools, many educational departments do not acknowledge the critical role the
teachers play in creating the conditions for ICT-supported learning. Teachers are of great importance
in this project as they are required to select and evaluate appropriate resources, as well as to design
structure and sequence a set of learning activities (Osborne et al., 2003: 4).
30
2.9 Summary
Mathematics teaching in South Africa starts first and foremost with the policy (NCS) (South Africa,
2002: 2) and the most suitable philosophical viewpoint to promote the achieving of the outcomes
within the policy. OBE still forms the basis for teaching and learning in South African schools, even
though many teachers struggle in adapting to this transformation, and though the policy will be
changed in the near future. Embedded in the critical outcomes are the promotion of ICT and the
importance of using technology effectively and critically. In alignment with the critical outcomes, an e-
Education policy (South Africa, 2004b) has been introduced with a three phase implementation plan to
ensure South Africa will compete with other systems worldwide.
Effective mathematics teaching entails that teachers should have a good comprehensive knowledge of
mathematics; they should promote mathematical understanding; learners should be engaged and
motivated; and teachers should manage teaching and learning effectively. In addition, the goals
mathematics teachers want their learners to achieve should be met. These goals include: to guide
their learners in the modern society to survive in the world, to understand the information around them,
to prepare learners for further education and training, to teach logical reasoning and to promote the
beauty of mathematics. Ensuring that these mathematical principles adhere to the envisaged goals,
teachers should have a sound knowledge of the content and pedagogy; know the mathematical tools
available to them and when to use them. There are numerous mathematical tools available to
teachers to assist them when teaching: the traditional tools like the textbooks, blackboard, chalk,
abacus, etc. and the more recent ICT tools.
Having these tools available is unfortunately not enough. In order for any of these tools to add value
to the teaching and learning of mathematics a sound Technological Pedagogical Content Knowledge
(TPCK) is required. The TPCK model developed by (Mishra, 2008) addresses the various aspects in
teaching and learning which must be in place and used collaboratively to achieve effective results:
technological knowledge, content knowledge, and pedagogical knowledge. Teachers therefore must
know the subject content, know how best to teach it to the learners and use technology at their
disposal effectively to assist them in their teaching and learning practices.
Even though the NDoE has an ICT integration plan, the implementation of ICT into teaching and
learning remains a major challenge. SITES 2006 indicated that only 26% of teachers in South African
schools received basic training and only 8% ICT integration training. Therefore South Africa should
invest much more time and resources to raise the ICT competence level of teachers and extend their
existing CPTD program.
Managing ICT is not solely the responsibility of the NDoE, but at school level the SMT and the local
community can also make an effort to contribute to promoting ICT integration in teaching and learning.
It can be made compulsory that a percentage of all teaching staff members at a school should be
31
competent in ICT relating to curriculum content, professional applications and creating digital
resources, and have the ability to assist in ICT management and training.
SITES 2006 indicated that of the participating schools more than forty percent (47.71%) of principals
indicated that they did not even have enough funds for non-ICT supplies. It is clear that South Africa
is faced with many barriers that deter teachers from integrating ICT into teaching and learning. Some
of the barriers identified in SITES 2006 were: shortage of Internet accessed computers, a scarcity of
ICT equipment for learners with special needs, unsatisfactory ICT equipment for teaching, outdated
computers, shortage of digital equipment for instruction, and lack of ICT tools for teaching and
learning.
The barriers of ICT integration in teaching and learning will be overcome only when the NDoE, the
provincial departments and SMT’s of schools invest in the necessary funds for the professional
development of teachers, focussing on developing a sound knowledge base for curriculum ICT
integration and for supplying schools with the ICT infrastructure.
32
Chapter Three
Overview of the SITES Modules 3.1 Introduction
Since its commencement in 1958, the IEA has conducted more than 23 research studies on cross
national achievement of trends in international reading literacy levels (PIRLS), trends in learner
achievement in mathematics and science (TIMMS) and SITES (Second International Technology in
Education Study). PIRLS is conducted on a five year cycle (2001, 2006 and 2011) and twenty six
countries participate to measure the trends in grade 4 childrens’ reading literacy achievement and the
policy and practices related to literacy. The trends in grades 4 and 8 achievement in mathematics and
science are measured by TIMMS for learners in more than sixty countries (IEA, 2007).
The SITES modules are the only studies of which the main focus is not on learner achievement. The
SITES modules focus on the educational aspects from a teacher and school perspective. SITES
Module 1 (1997-1999) was a survey to principals and technology coordinators; SITES Module 2
(1999-2003) was an in-depth study of innovative teaching practices in schools (Plomp et al., 2009: 7).
SITES 2006 built on the findings from the previous SITES modules to obtain an extended overview on
the effectiveness of ICT integrated pedagogical practices in all the participating educational systems
(Pelgrum et al., 2008: 10, 16).
3.2 SITES Module 1
SITES Module 1 was a quantitative international comparative study that took place between 1997 and
1999. The purpose of this study was to determine the status of each of the twenty six participating
education system on the availability of ICT infrastructure in schools relative to the status of the other
participating countries. The study also provides a benchmark for subsequent studies, and assists
national policy-makers in the planning of their educational strategies. The data collection took place
between November 1998 and February 1999 (Pelgrum et al., 2008: 3).
3.2.1 Study design and methodology
The battery of surveys consisted of a questionnaire to school principals and to the technology co-
coordinators. In South Africa, the representative sample involved only computer-using schools from
primary, lower secondary and upper secondary schools. Twenty four countries from the northern
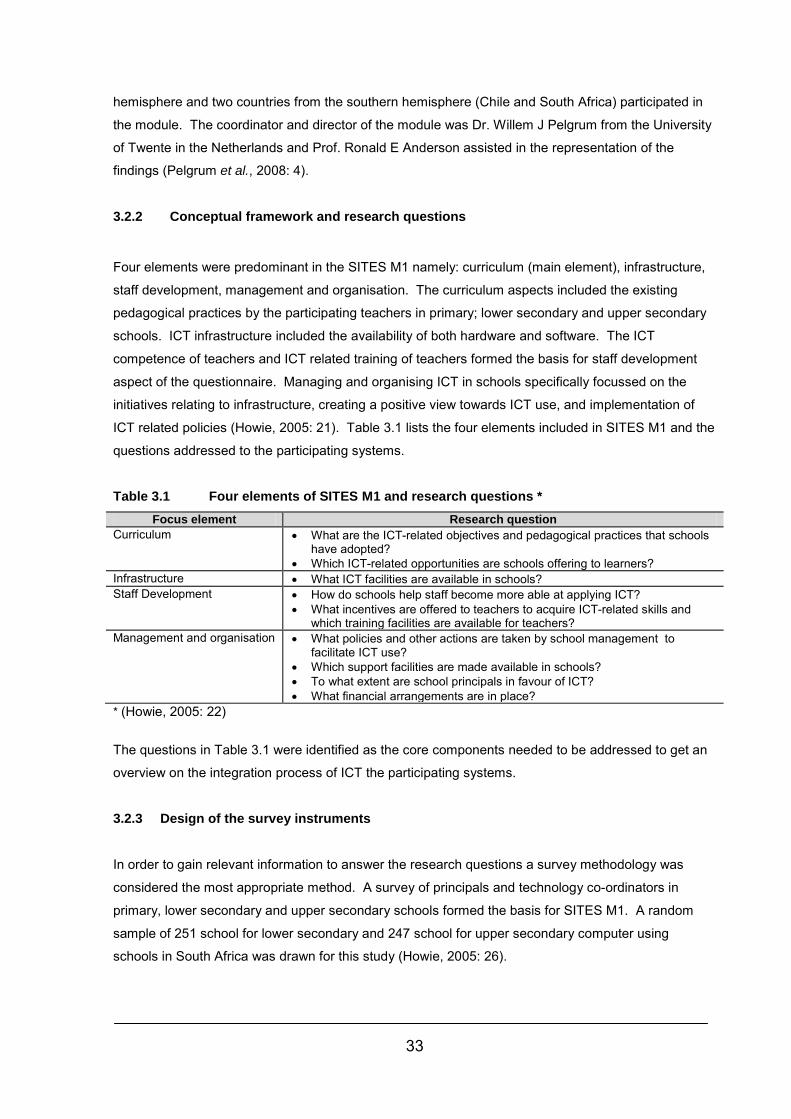
33
hemisphere and two countries from the southern hemisphere (Chile and South Africa) participated in
the module. The coordinator and director of the module was Dr. Willem J Pelgrum from the University
of Twente in the Netherlands and Prof. Ronald E Anderson assisted in the representation of the
findings (Pelgrum et al., 2008: 4).
3.2.2 Conceptual framework and research questions
Four elements were predominant in the SITES M1 namely: curriculum (main element), infrastructure,
staff development, management and organisation. The curriculum aspects included the existing
pedagogical practices by the participating teachers in primary; lower secondary and upper secondary
schools. ICT infrastructure included the availability of both hardware and software. The ICT
competence of teachers and ICT related training of teachers formed the basis for staff development
aspect of the questionnaire. Managing and organising ICT in schools specifically focussed on the
initiatives relating to infrastructure, creating a positive view towards ICT use, and implementation of
ICT related policies (Howie, 2005: 21). Table 3.1 lists the four elements included in SITES M1 and the
questions addressed to the participating systems.
Table 3.1 Four elements of SITES M1 and research questions * Focus element Research question
Curriculum • What are the ICT-related objectives and pedagogical practices that schools have adopted?
• Which ICT-related opportunities are schools offering to learners? Infrastructure • What ICT facilities are available in schools? Staff Development • How do schools help staff become more able at applying ICT?
• What incentives are offered to teachers to acquire ICT-related skills and which training facilities are available for teachers?
Management and organisation • What policies and other actions are taken by school management to facilitate ICT use?
• Which support facilities are made available in schools? • To what extent are school principals in favour of ICT? • What financial arrangements are in place?
* (Howie, 2005: 22)
The questions in Table 3.1 were identified as the core components needed to be addressed to get an
overview on the integration process of ICT the participating systems.
3.2.3 Design of the survey instruments
In order to gain relevant information to answer the research questions a survey methodology was
considered the most appropriate method. A survey of principals and technology co-ordinators in
primary, lower secondary and upper secondary schools formed the basis for SITES M1. A random
sample of 251 school for lower secondary and 247 school for upper secondary computer using
schools in South Africa was drawn for this study (Howie, 2005: 26).
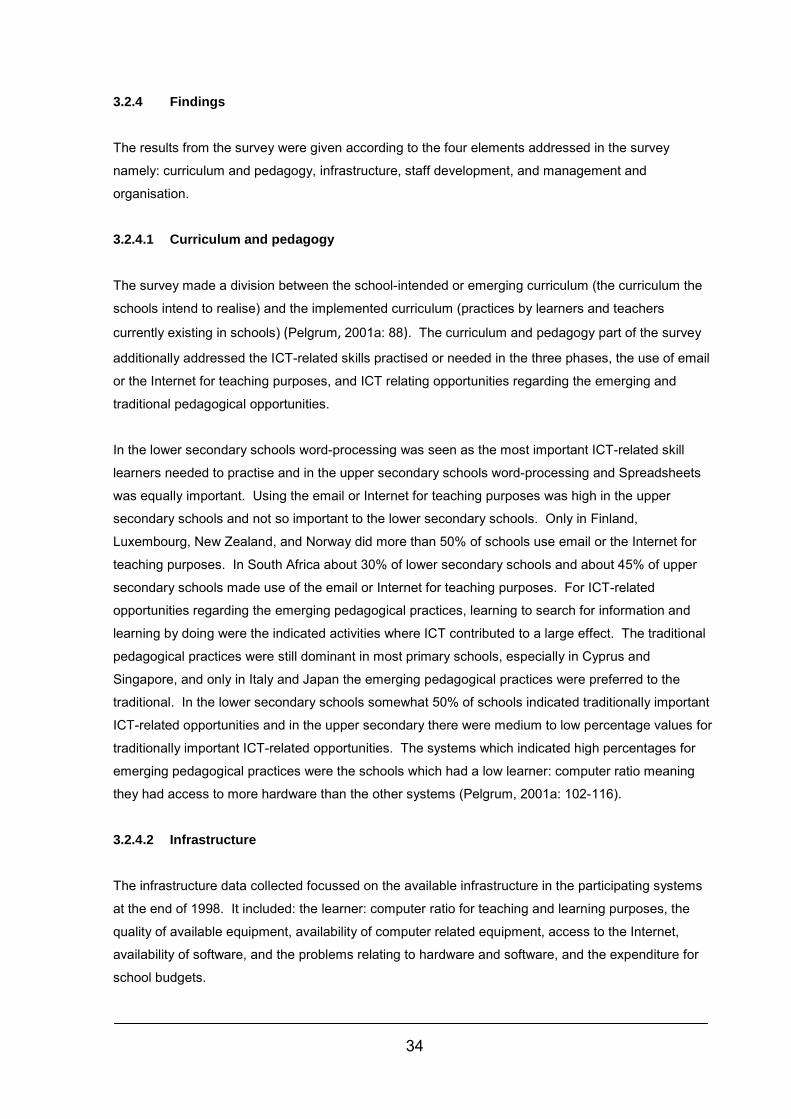
34
3.2.4 Findings The results from the survey were given according to the four elements addressed in the survey
namely: curriculum and pedagogy, infrastructure, staff development, and management and
organisation.
3.2.4.1 Curriculum and pedagogy
The survey made a division between the school-intended or emerging curriculum (the curriculum the
schools intend to realise) and the implemented curriculum (practices by learners and teachers
currently existing in schools) (Pelgrum, 2001a: 88). The curriculum and pedagogy part of the survey
additionally addressed the ICT-related skills practised or needed in the three phases, the use of email
or the Internet for teaching purposes, and ICT relating opportunities regarding the emerging and
traditional pedagogical opportunities.
In the lower secondary schools word-processing was seen as the most important ICT-related skill
learners needed to practise and in the upper secondary schools word-processing and Spreadsheets
was equally important. Using the email or Internet for teaching purposes was high in the upper
secondary schools and not so important to the lower secondary schools. Only in Finland,
Luxembourg, New Zealand, and Norway did more than 50% of schools use email or the Internet for
teaching purposes. In South Africa about 30% of lower secondary schools and about 45% of upper
secondary schools made use of the email or Internet for teaching purposes. For ICT-related
opportunities regarding the emerging pedagogical practices, learning to search for information and
learning by doing were the indicated activities where ICT contributed to a large effect. The traditional
pedagogical practices were still dominant in most primary schools, especially in Cyprus and
Singapore, and only in Italy and Japan the emerging pedagogical practices were preferred to the
traditional. In the lower secondary schools somewhat 50% of schools indicated traditionally important
ICT-related opportunities and in the upper secondary there were medium to low percentage values for
traditionally important ICT-related opportunities. The systems which indicated high percentages for
emerging pedagogical practices were the schools which had a low learner: computer ratio meaning
they had access to more hardware than the other systems (Pelgrum, 2001a: 102-116).
3.2.4.2 Infrastructure
The infrastructure data collected focussed on the available infrastructure in the participating systems
at the end of 1998. It included: the learner: computer ratio for teaching and learning purposes, the
quality of available equipment, availability of computer related equipment, access to the Internet,
availability of software, and the problems relating to hardware and software, and the expenditure for
school budgets.
35
To determine the learner computer ratio the total number of learners attending the specific school was
divided by the number of computers available for teaching and learning purposes. Canada, Finland,
Iceland, Israel, New Zealand, Norway and Singapore were the primary schools which had a low
learner computer ratio. In the lower secondary schools, Canada and New Zealand had fewer than ten
learners per computer, but in Lithuania and the Russian Federation more than fifty learners had to
share one computer. China Hong Kong, Iceland, Luxembourg, and Singapore had more
advantageous computer availability in the lower secondary and in the primary schools. Availability in
the upper secondary schools was more promising. In South Africa 60% of the lower secondary
schools and (45%) of the upper secondary schools had Windows 95 or 98, WinNT MacOS 7,5+
processors. This standard of equipment was the same in the majority of the participating systems. In
China Hong Kong, the majority of schools; primary 91%, lower secondary 84%, and upper secondary
had Intel Pent+ Mac 103+ higher standard of equipment.
In 1998 nearly 60% lower and upper secondary schools in South Africa were connected to local
networks. Iceland indicated the highest level for connectedness at more than 70% in primary, more
than 80% in lower secondary, and more than 90% in upper secondary schools. Table 3.2, indicates
the percentages of computers that were not in use during the survey in South Africa. More than fifty
percent (56% of the computers in the lower secondary, and 57% in the upper secondary schools)
were broken. High percentages of computers were outdated: 62% in the lower secondary and (69%)
in the upper secondary. More than fifty percent (56% of the total amount) of computers in the lower
secondary were not in use and 35% in the upper secondary
Table 3.2 Percentage frequencies of computers not in use in South Africa *
Lower secondary % Upper secondary % Not in use 56 Not in use 35 Outdated 62 Outdated 69 Not compatible 20 Not compatible 22 Broken 56 Broken 57 Do not know how to use 8 Do not know how to use 7 * (Pelgrum, 2001b: 136)
The computer related equipment most commonly found in all the participating systems were laser
printers, CD-Rom drives, colour printers and scanners.
Communications facilities for teaching and learning purposes were the highest in the upper secondary
schools and less in the primary and lower secondary schools. The highest access to the Internet was
80% in Canada, China Hong Kong, Chinese Taipei, Denmark, Finland, Iceland, Lithuania, New
Zealand, Norway, Singapore and Slovenia. Low Internet access was experienced in Bulgaria, Cyprus
and Thailand. Of the participating schools in South Africa more than 50% had access in the lower
secondary and more than 60% in the upper secondary schools (Pelgrum, 2001b: 119-140).
36
Mathematical software was most commonly found available in most of the participating systems.
Budget expenditure on software was a lot less compared to that on hardware. In Finland the
educational department spent US $50 and in Italy only US $15 per learner on educational software.
One of the barriers identified relating to hardware and software for educational purposes were the lack
of copies of the educational software. A vast difference between countries regarding ICT
infrastructure in schools and the availability thereof to learners was the most significant finding in the
SITES M1 (Pelgrum, 2001b: 149-152).
3.2.4.3 Staff development
The training of teachers to integrate ICT within teaching and learning is an integral part of achieving
the 21st century skills. For many teachers it is a complex innovation and they experience difficulties in
making the necessary adjustment to their teaching and learning practices. The aspect relating to staff
development, addressed in SITES M1 to school principals and ICT coordinators, was to what extent
they experienced lack of qualifications as a problem, specifically relating to lack of knowledge and
training. In primary schools and lower secondary schools lack of knowledge was identified as a major
barrier. The Teachers quality of training was the most significant barrier, especially in Canada, New
Zealand, Slovenia and South Africa, in the upper secondary schools (Pelgrum, 2001c: 157-159).
All the participating systems indicated that the training of teachers was a policy goal in their schools.
In the participating schools in South Africa, more than 20% of teachers in the lower secondary schools
were compelled to undergo training, but 40% of the teachers had undergone training. In the upper
secondary schools 40% were compelled and more than 60% had undergone training. Only 20% of
the training courses were informal and less than 10% of the courses were done by external agencies.
More than 80% of teachers in lower and more than 70% of teachers in upper secondary schools in
South Africa received general ICT training, and just above 30% in both lower and upper secondary
schools received ICT training (Pelgrum, 2001c: 160-171). 3.2.4.4 Management and organisation
The aspects addressed in this part of the survey dealt with: the principals’ attitudes towards ICT,
school adopted ICT policies, the extent to which ICT was being used to monitor learners’ progress and
administrative work of teachers and the organisational problems experienced with the introduction of
ICT. In general principals from primary schools, lower secondary and upper secondary schools had a
positive attitude towards the use of ICT in schools. More than 80% of principals in South Africa
indicated a positive attitude towards the use of ICT in schools.
Despite the positive attitude towards ICT in schools, less than 50% of lower and upper secondary
schools in many systems, including South Africa, had an ICT related school policy. Between 40-60%
37
of primary schools did not make use of ICT to track the learners’ performance, 40% of lower
secondary schools did make use of ICT to track learners’ performance, and in the upper secondary
schools ICT was used more frequently for this purpose.
The problems identified in all systems that prevented the realising of ICT-related goals were:
insufficient time to prepare ICT lessons, difficulty to integrate ICT in classroom instruction, scheduling
enough time to get learners to use the facilities, no time to schedule time for learners to use the
Internet and not enough time to explore the opportunities of the Internet (Bos et al., 2001: 181-200).
Regardless of the availability of computers at schools and access to the Internet, in many educational
systems significant problems were identified which may have an influence on subsequent projects.
The problem most often mentioned was the insufficient number of computers and their inability to have
access to the Internet. Teachers had insufficient knowledge and skills regarding ICT and the
integration of ICT from a pedagogical perspective show a large difference between systems. Policy
goals regarding ICT training for teachers were not realised because only the minority of the schools
achieved these (Pelgrum et al., 2008: 4). The relationship between ICT and innovative pedagogical
use thereof was also addressed in the SITES Module 2.
3.3 SITES Module 2 SITES Module 2 took place between 1999 and 2002 and comprised both quantitative and qualitative
components. It was an international comparative study of innovative pedagogical practices of using
ICT in schools, the role that ICT played in these practices and the contextual factors that influenced
and supported them. The study provided an opportunity for all the stakeholders in the educational
system to get an overview of the current status, and for innovations regarding the implementation and
adaptations of ICT in their systems. It also provided policy makers with information that will help them
in their ICT initiative, and provided teachers with new ideas for ICT use in classrooms, and identified
contributing factors for the successful use of ICT in classrooms (IEA, 2007: 1).
3.3.1 Study design and methodology
A common set of case study methods collected data from 28 educational systems from the Northern
and Southern hemispheres. Chile and South Africa were again the only two countries from the
Southern hemisphere. Data from 174 case studies between 2000 and 2001 described innovative
pedagogical practices using ICT (IEA, 2007). The rationale for using more qualitative research
methods was to provide more detailed information relating to the participating people and systems.
Due to the large number of cases the quantitative analyses were used to identify the major trends
between systems (Kosma, 2003b: 21).
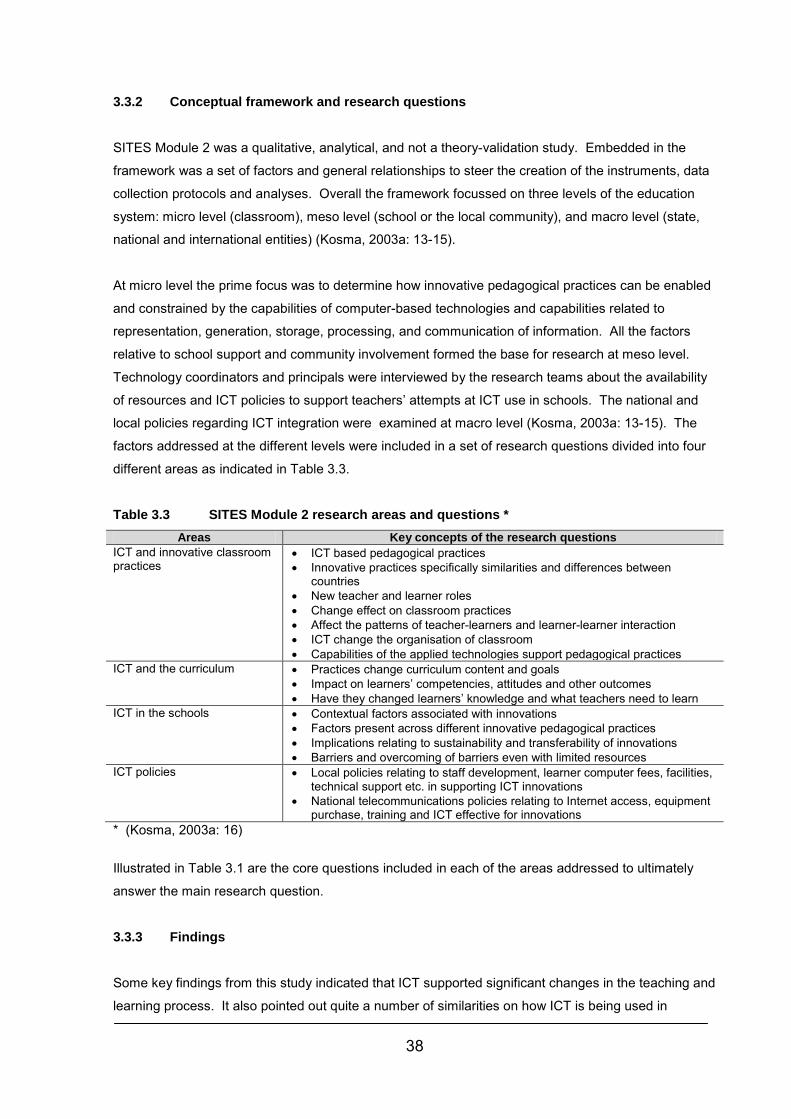
38
3.3.2 Conceptual framework and research questions
SITES Module 2 was a qualitative, analytical, and not a theory-validation study. Embedded in the
framework was a set of factors and general relationships to steer the creation of the instruments, data
collection protocols and analyses. Overall the framework focussed on three levels of the education
system: micro level (classroom), meso level (school or the local community), and macro level (state,
national and international entities) (Kosma, 2003a: 13-15).
At micro level the prime focus was to determine how innovative pedagogical practices can be enabled
and constrained by the capabilities of computer-based technologies and capabilities related to
representation, generation, storage, processing, and communication of information. All the factors
relative to school support and community involvement formed the base for research at meso level.
Technology coordinators and principals were interviewed by the research teams about the availability
of resources and ICT policies to support teachers’ attempts at ICT use in schools. The national and
local policies regarding ICT integration were examined at macro level (Kosma, 2003a: 13-15). The
factors addressed at the different levels were included in a set of research questions divided into four
different areas as indicated in Table 3.3.
Table 3.3 SITES Module 2 research areas and questions * Areas Key concepts of the research questions
ICT and innovative classroom practices
• ICT based pedagogical practices • Innovative practices specifically similarities and differences between
countries • New teacher and learner roles • Change effect on classroom practices • Affect the patterns of teacher-learners and learner-learner interaction • ICT change the organisation of classroom • Capabilities of the applied technologies support pedagogical practices
ICT and the curriculum • Practices change curriculum content and goals • Impact on learners’ competencies, attitudes and other outcomes • Have they changed learners’ knowledge and what teachers need to learn
ICT in the schools • Contextual factors associated with innovations • Factors present across different innovative pedagogical practices • Implications relating to sustainability and transferability of innovations • Barriers and overcoming of barriers even with limited resources
ICT policies • Local policies relating to staff development, learner computer fees, facilities, technical support etc. in supporting ICT innovations
• National telecommunications policies relating to Internet access, equipment purchase, training and ICT effective for innovations
* (Kosma, 2003a: 16)
Illustrated in Table 3.1 are the core questions included in each of the areas addressed to ultimately
answer the main research question.
3.3.3 Findings
Some key findings from this study indicated that ICT supported significant changes in the teaching and
learning process. It also pointed out quite a number of similarities on how ICT is being used in
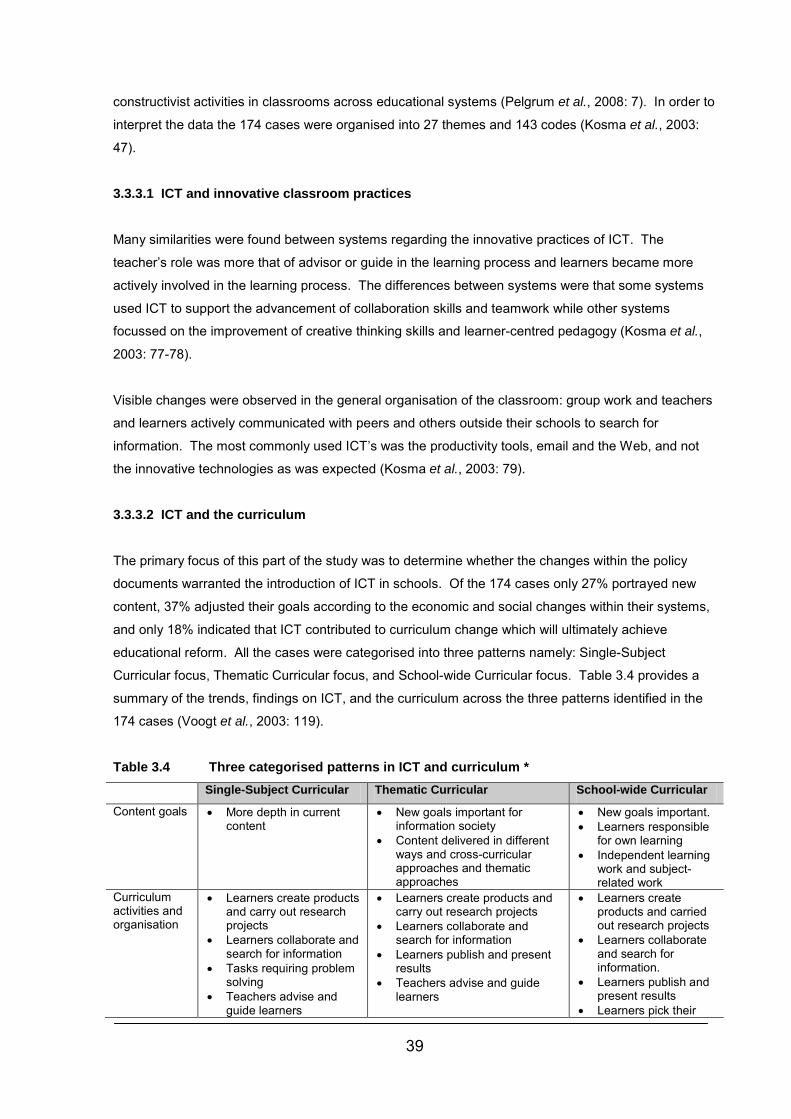
39
constructivist activities in classrooms across educational systems (Pelgrum et al., 2008: 7). In order to
interpret the data the 174 cases were organised into 27 themes and 143 codes (Kosma et al., 2003:
47).
3.3.3.1 ICT and innovative classroom practices
Many similarities were found between systems regarding the innovative practices of ICT. The
teacher’s role was more that of advisor or guide in the learning process and learners became more
actively involved in the learning process. The differences between systems were that some systems
used ICT to support the advancement of collaboration skills and teamwork while other systems
focussed on the improvement of creative thinking skills and learner-centred pedagogy (Kosma et al.,
2003: 77-78).
Visible changes were observed in the general organisation of the classroom: group work and teachers
and learners actively communicated with peers and others outside their schools to search for
information. The most commonly used ICT’s was the productivity tools, email and the Web, and not
the innovative technologies as was expected (Kosma et al., 2003: 79).
3.3.3.2 ICT and the curriculum
The primary focus of this part of the study was to determine whether the changes within the policy
documents warranted the introduction of ICT in schools. Of the 174 cases only 27% portrayed new
content, 37% adjusted their goals according to the economic and social changes within their systems,
and only 18% indicated that ICT contributed to curriculum change which will ultimately achieve
educational reform. All the cases were categorised into three patterns namely: Single-Subject
Curricular focus, Thematic Curricular focus, and School-wide Curricular focus. Table 3.4 provides a
summary of the trends, findings on ICT, and the curriculum across the three patterns identified in the
174 cases (Voogt et al., 2003: 119).
Table 3.4 Three categorised patterns in ICT and curriculum * Single-Subject Curricular Thematic Curricular School-wide Curricular
Content goals • More depth in current content
• New goals important for information society
• Content delivered in different ways and cross-curricular approaches and thematic approaches
• New goals important. • Learners responsible
for own learning • Independent learning
work and subject-related work
Curriculum activities and organisation
• Learners create products and carry out research projects
• Learners collaborate and search for information
• Tasks requiring problem solving
• Teachers advise and guide learners
• Learners create products and carry out research projects
• Learners collaborate and search for information
• Learners publish and present results
• Teachers advise and guide learners
• Learners create products and carried out research projects
• Learners collaborate and search for information.
• Learners publish and present results
• Learners pick their
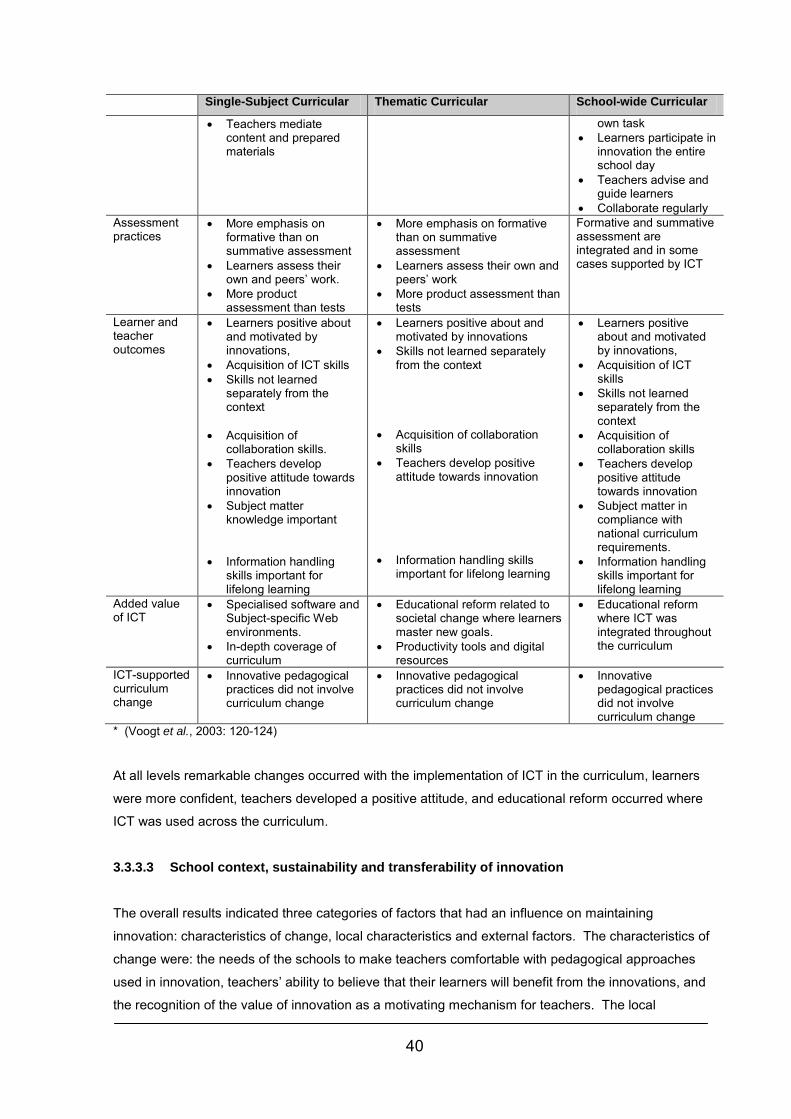
40
Single-Subject Curricular Thematic Curricular School-wide Curricular
• Teachers mediate content and prepared materials
own task • Learners participate in
innovation the entire school day
• Teachers advise and guide learners
• Collaborate regularly Assessment practices
• More emphasis on formative than on summative assessment
• Learners assess their own and peers’ work.
• More product assessment than tests
• More emphasis on formative than on summative assessment
• Learners assess their own and peers’ work
• More product assessment than tests
Formative and summative assessment are integrated and in some cases supported by ICT
Learner and teacher outcomes
• Learners positive about and motivated by innovations,
• Acquisition of ICT skills • Skills not learned
separately from the context
• Acquisition of
collaboration skills. • Teachers develop
positive attitude towards innovation
• Subject matter knowledge important
• Information handling
skills important for lifelong learning
• Learners positive about and motivated by innovations
• Skills not learned separately from the context
• Acquisition of collaboration
skills • Teachers develop positive
attitude towards innovation • Information handling skills
important for lifelong learning
• Learners positive about and motivated by innovations,
• Acquisition of ICT skills
• Skills not learned separately from the context
• Acquisition of collaboration skills
• Teachers develop positive attitude towards innovation
• Subject matter in compliance with national curriculum requirements.
• Information handling skills important for lifelong learning
Added value of ICT
• Specialised software and Subject-specific Web environments.
• In-depth coverage of curriculum
• Educational reform related to societal change where learners master new goals.
• Productivity tools and digital resources
• Educational reform where ICT was integrated throughout the curriculum
ICT-supported curriculum change
• Innovative pedagogical practices did not involve curriculum change
• Innovative pedagogical practices did not involve curriculum change
• Innovative pedagogical practices did not involve curriculum change
* (Voogt et al., 2003: 120-124)
At all levels remarkable changes occurred with the implementation of ICT in the curriculum, learners
were more confident, teachers developed a positive attitude, and educational reform occurred where
ICT was used across the curriculum.
3.3.3.3 School context, sustainability and transferability of innovation
The overall results indicated three categories of factors that had an influence on maintaining
innovation: characteristics of change, local characteristics and external factors. The characteristics of
change were: the needs of the schools to make teachers comfortable with pedagogical approaches
used in innovation, teachers’ ability to believe that their learners will benefit from the innovations, and
the recognition of the value of innovation as a motivating mechanism for teachers. The local
41
characteristics of sustaining innovation are the teachers, principal and school, the districts, as well as
the broader community. Teachers’ support and professional development was identified as essential
components. Professional development not merely to enhance the technical skills of teachers, but
also innovative practices teachers need to participate in. Principals need to improve the status of
innovation within their schools and provide ongoing support to learners. Some of the external factors
identified which had an influence on ICT innovation were ICT policy and plans and the lack of
partnerships with universities and private sectors. Numerous barriers were recognised: 62% of the
cases lacked of equipment and resources, 41% named teacher-related concerns such as an
overworked schedule or limited computer skills, 36% involved learner-related concerns such as
inability to make use of the Internet or email, and 30% of the cases indicated a shortage of technical
support (Owston, 2003: 159-160).
3.3.3.4 Local and national ICT policies
Several change factors were addressed in national policies: the method to which ICT can change
education (Singapore and Finland), the enhancement of learner achievement (United States), ICT-
related goals as to the development of ICT capacity and skills in teachers and learners (Denmark),
and the goals relating to the performance of learners (England). In several countries the national
policy supported the expansion of educational software for curriculum purposes.
The local policies differed relatively between cases. Local policies mainly focussed on the practices
that occurred in classrooms. Some cases emphasised the enhancement of higher-order thinking and
problem solving skills while others used technologies to change the teaching and learning
methodologies. More than fifty percent of the cases (54%) acknowledged that innovation was
connected to both the national and local ICT policies (Jones, 2003: 188-191).
Kosmo (2003c: 232-233) agrees that in order for policy makers to achieve effective results regarding
ICT innovation, they need to administer several changes within their systems. Firstly, they have to
incorporate skills relating to information management, knowledge creation, investigation and
collaboration. Constant professional development of teachers and principals need to take place to
ensure the implementation of policies and classroom activities. Lastly, they have to revise their
assessment methods to incorporate new goals and content, such as information management,
problem solving, communication and collaborative skills.
3.4 SITES 2006
Twenty-two countries participated in SITES 2006 (Table 3.4). As indicated, fifteen of these countries
also participated in SITES Module 1 and Module 2. SITES 2006 was designed as a survey of schools
and teachers—specifically mathematics and science teachers for grade 8. The focus of the study was
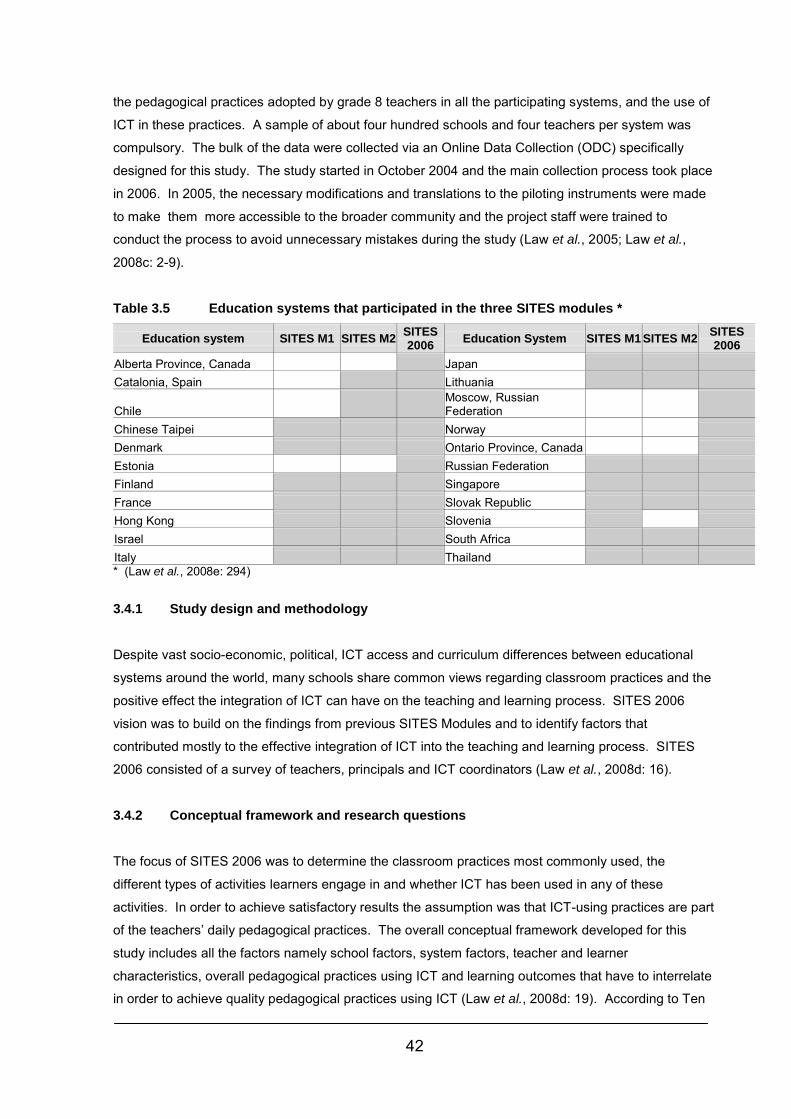
42
the pedagogical practices adopted by grade 8 teachers in all the participating systems, and the use of
ICT in these practices. A sample of about four hundred schools and four teachers per system was
compulsory. The bulk of the data were collected via an Online Data Collection (ODC) specifically
designed for this study. The study started in October 2004 and the main collection process took place
in 2006. In 2005, the necessary modifications and translations to the piloting instruments were made
to make them more accessible to the broader community and the project staff were trained to
conduct the process to avoid unnecessary mistakes during the study (Law et al., 2005; Law et al.,
2008c: 2-9).
Table 3.5 Education systems that participated in the three SITES modules *
Education system SITES M1 SITES M2 SITES 2006 Education System SITES M1 SITES M2 SITES
2006 Alberta Province, Canada Japan Catalonia, Spain Lithuania
Chile Moscow, Russian Federation
Chinese Taipei Norway Denmark Ontario Province, Canada Estonia Russian Federation Finland Singapore France Slovak Republic Hong Kong Slovenia Israel South Africa Italy Thailand * (Law et al., 2008e: 294) 3.4.1 Study design and methodology
Despite vast socio-economic, political, ICT access and curriculum differences between educational
systems around the world, many schools share common views regarding classroom practices and the
positive effect the integration of ICT can have on the teaching and learning process. SITES 2006
vision was to build on the findings from previous SITES Modules and to identify factors that
contributed mostly to the effective integration of ICT into the teaching and learning process. SITES
2006 consisted of a survey of teachers, principals and ICT coordinators (Law et al., 2008d: 16).
3.4.2 Conceptual framework and research questions
The focus of SITES 2006 was to determine the classroom practices most commonly used, the
different types of activities learners engage in and whether ICT has been used in any of these
activities. In order to achieve satisfactory results the assumption was that ICT-using practices are part
of the teachers’ daily pedagogical practices. The overall conceptual framework developed for this
study includes all the factors namely school factors, system factors, teacher and learner
characteristics, overall pedagogical practices using ICT and learning outcomes that have to interrelate
in order to achieve quality pedagogical practices using ICT (Law et al., 2008d: 19). According to Ten
43
Brummelhuis (1995: 91), successful implementation of ICT is not dependent on the presence or
absence of one factor but is determined during a dynamic process of linking all the factors. The
findings and results from the previous modules helped to determine the relevant factors that should to
be included in the overall conceptual framework for SITES 2006 (Law et al., 2005: 7) . The three
research questions were based on the conceptual framework for the study to ensure that all the facets
within the framework were included within the research process, of which the first two questions
focussed on the pedagogical aspects and the third concentrated more on the contextual factors that
can be influential on the pedagogical practices of ICT in schools.
Research question 1: What are the pedagogical practices adopted in schools and how is ICT used
in them?
This question aimed to determine what the key pedagogical approaches were and which practices
were adopted by teachers in their teaching, the importance of ICT use in realising these different
approaches and practices, and the perceived impact of ICT on learners.
Research question 2: What ICT and how is ICT used in specific situations where ICT has been used
relatively extensively within a pedagogical practice?
This question aimed to gather descriptions from teachers of their satisfying experiences in their use of
ICT in teaching. They were asked to describe one experience where ICT had been used to support
learning and teaching, and they had to report on the contributions of ICT in practice to learner
outcomes and teaching practice.
Research question 3: What are the teacher, school, community and system factors that are
associated with different pedagogical approaches and ICT?
This question aimed to explore the current status of these factors within the different educational
systems, how these may be related to different characteristics of pedagogical practices and ICT use,
and whether there were systematic differences across countries in relation to the explanatory models
identified (Law et al., 2008d: 20).
3.4.3 Design of the survey instruments
In order to gain the relevant information to answer the research questions, a survey methodology was
considered the most appropriate method of gathering data to realise the aim and the current status of
pedagogical practices and ICT use in all the participating educational systems. The survey consisted
of three questionnaires: a teacher questionnaire (core component), a principal questionnaire and a
technical questionnaire. An additional context questionnaire was distributed to the National Research
Coordinators to gather contextual information at system level (Law et al., 2008d: 20).
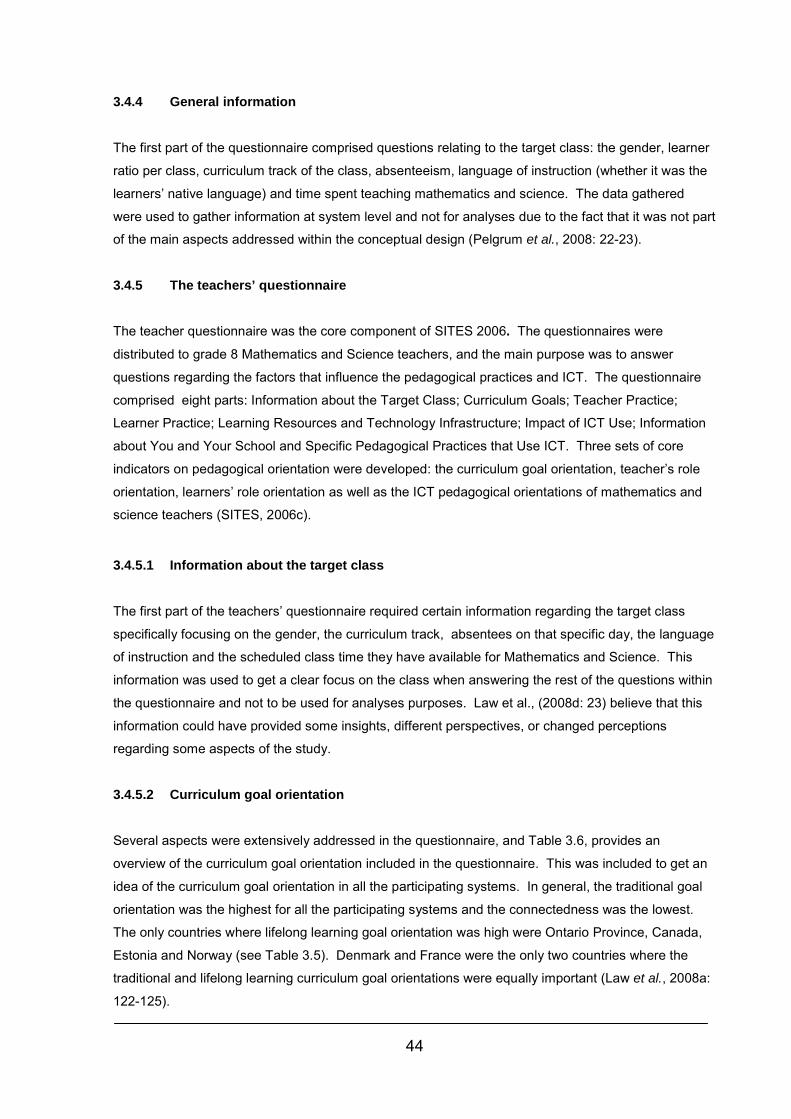
44
3.4.4 General information The first part of the questionnaire comprised questions relating to the target class: the gender, learner
ratio per class, curriculum track of the class, absenteeism, language of instruction (whether it was the
learners’ native language) and time spent teaching mathematics and science. The data gathered
were used to gather information at system level and not for analyses due to the fact that it was not part
of the main aspects addressed within the conceptual design (Pelgrum et al., 2008: 22-23).
3.4.5 The teachers’ questionnaire The teacher questionnaire was the core component of SITES 2006. The questionnaires were
distributed to grade 8 Mathematics and Science teachers, and the main purpose was to answer
questions regarding the factors that influence the pedagogical practices and ICT. The questionnaire
comprised eight parts: Information about the Target Class; Curriculum Goals; Teacher Practice;
Learner Practice; Learning Resources and Technology Infrastructure; Impact of ICT Use; Information
about You and Your School and Specific Pedagogical Practices that Use ICT. Three sets of core
indicators on pedagogical orientation were developed: the curriculum goal orientation, teacher’s role
orientation, learners’ role orientation as well as the ICT pedagogical orientations of mathematics and
science teachers (SITES, 2006c).
3.4.5.1 Information about the target class
The first part of the teachers’ questionnaire required certain information regarding the target class
specifically focusing on the gender, the curriculum track, absentees on that specific day, the language
of instruction and the scheduled class time they have available for Mathematics and Science. This
information was used to get a clear focus on the class when answering the rest of the questions within
the questionnaire and not to be used for analyses purposes. Law et al., (2008d: 23) believe that this
information could have provided some insights, different perspectives, or changed perceptions
regarding some aspects of the study.
3.4.5.2 Curriculum goal orientation
Several aspects were extensively addressed in the questionnaire, and Table 3.6, provides an
overview of the curriculum goal orientation included in the questionnaire. This was included to get an
idea of the curriculum goal orientation in all the participating systems. In general, the traditional goal
orientation was the highest for all the participating systems and the connectedness was the lowest.
The only countries where lifelong learning goal orientation was high were Ontario Province, Canada,
Estonia and Norway (see Table 3.5). Denmark and France were the only two countries where the
traditional and lifelong learning curriculum goal orientations were equally important (Law et al., 2008a:
122-125).
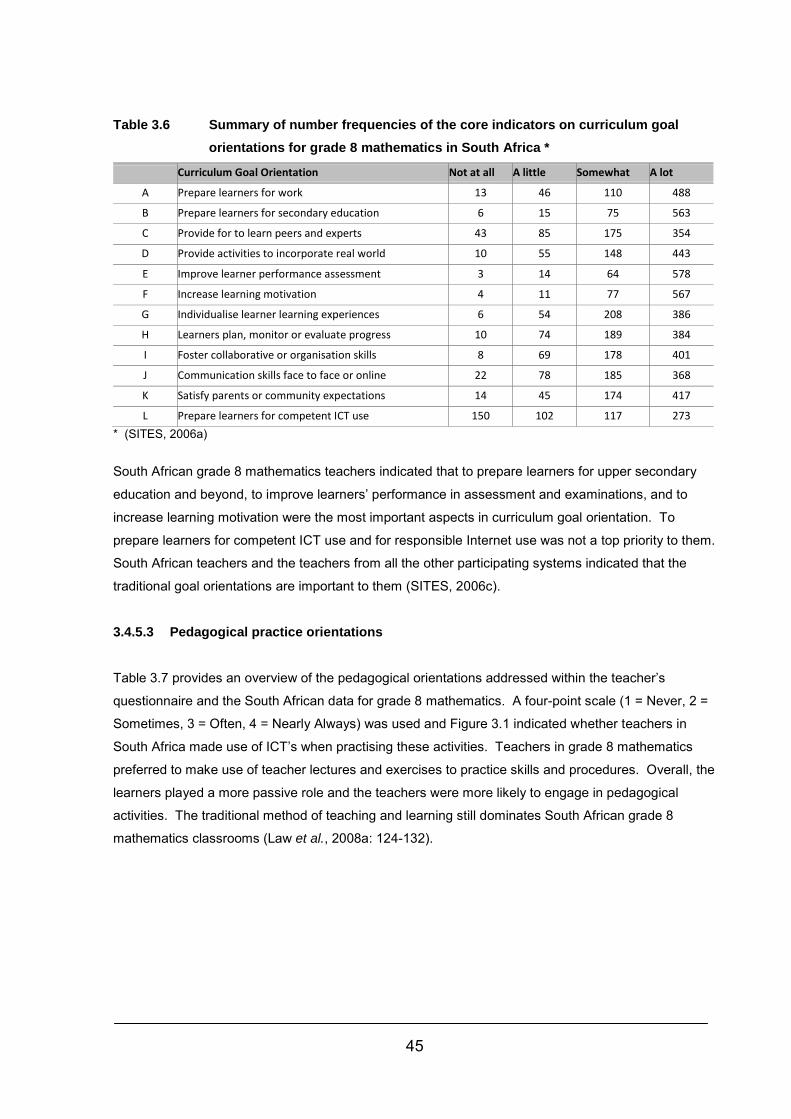
45
Table 3.6 Summary of number frequencies of the core indicators on curriculum goal
orientations for grade 8 mathematics in South Africa *
Curriculum Goal Orientation Not at all A little Somewhat A lot A Prepare learners for work 13 46 110 488
B Prepare learners for secondary education 6 15 75 563
C Provide for to learn peers and experts 43 85 175 354
D Provide activities to incorporate real world 10 55 148 443
E Improve learner performance assessment 3 14 64 578
F Increase learning motivation 4 11 77 567
G Individualise learner learning experiences 6 54 208 386
H Learners plan, monitor or evaluate progress 10 74 189 384
I Foster collaborative or organisation skills 8 69 178 401
J Communication skills face to face or online 22 78 185 368
K Satisfy parents or community expectations 14 45 174 417
L Prepare learners for competent ICT use 150 102 117 273 * (SITES, 2006a)
South African grade 8 mathematics teachers indicated that to prepare learners for upper secondary
education and beyond, to improve learners’ performance in assessment and examinations, and to
increase learning motivation were the most important aspects in curriculum goal orientation. To
prepare learners for competent ICT use and for responsible Internet use was not a top priority to them.
South African teachers and the teachers from all the other participating systems indicated that the
traditional goal orientations are important to them (SITES, 2006c).
3.4.5.3 Pedagogical practice orientations
Table 3.7 provides an overview of the pedagogical orientations addressed within the teacher’s
questionnaire and the South African data for grade 8 mathematics. A four-point scale (1 = Never, 2 =
Sometimes, 3 = Often, 4 = Nearly Always) was used and Figure 3.1 indicated whether teachers in
South Africa made use of ICT’s when practising these activities. Teachers in grade 8 mathematics
preferred to make use of teacher lectures and exercises to practice skills and procedures. Overall, the
learners played a more passive role and the teachers were more likely to engage in pedagogical
activities. The traditional method of teaching and learning still dominates South African grade 8
mathematics classrooms (Law et al., 2008a: 124-132).
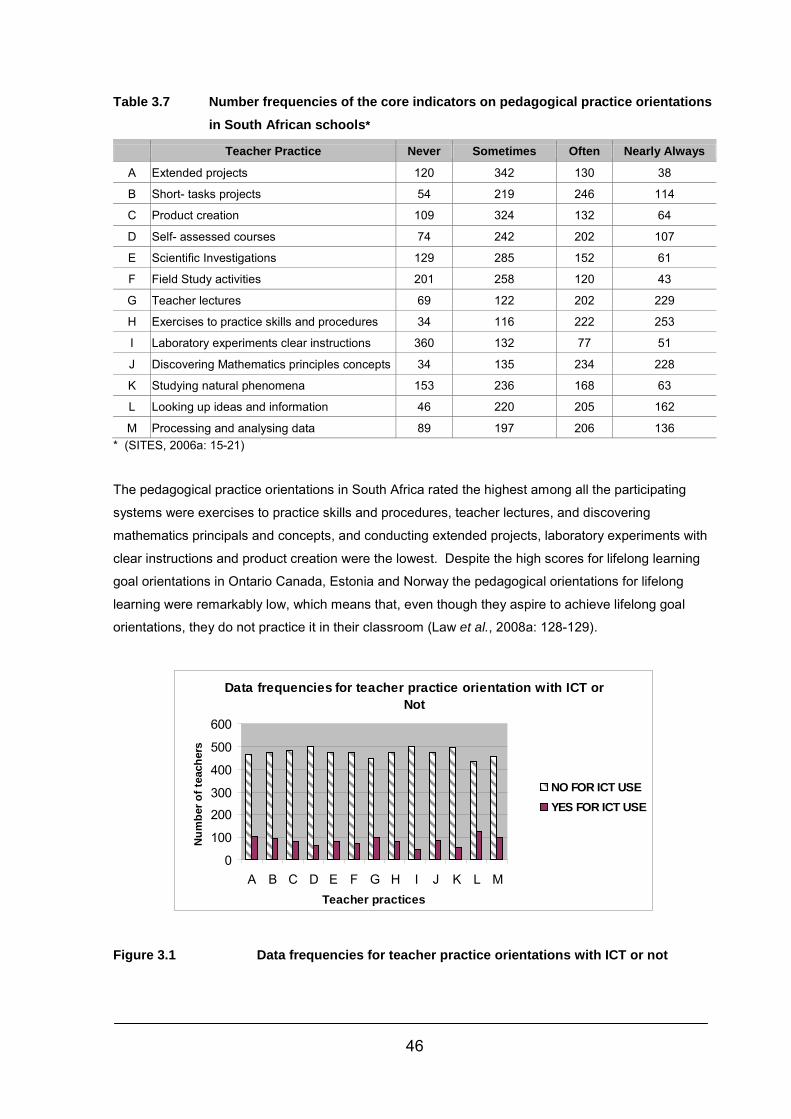
46
Table 3.7 Number frequencies of the core indicators on pedagogical practice orientations in South African schools*
Teacher Practice Never Sometimes Often Nearly Always
A Extended projects 120 342 130 38
B Short- tasks projects 54 219 246 114
C Product creation 109 324 132 64
D Self- assessed courses 74 242 202 107
E Scientific Investigations 129 285 152 61
F Field Study activities 201 258 120 43
G Teacher lectures 69 122 202 229
H Exercises to practice skills and procedures 34 116 222 253
I Laboratory experiments clear instructions 360 132 77 51
J Discovering Mathematics principles concepts 34 135 234 228
K Studying natural phenomena 153 236 168 63
L Looking up ideas and information 46 220 205 162
M Processing and analysing data 89 197 206 136 * (SITES, 2006a: 15-21)
The pedagogical practice orientations in South Africa rated the highest among all the participating
systems were exercises to practice skills and procedures, teacher lectures, and discovering
mathematics principals and concepts, and conducting extended projects, laboratory experiments with
clear instructions and product creation were the lowest. Despite the high scores for lifelong learning
goal orientations in Ontario Canada, Estonia and Norway the pedagogical orientations for lifelong
learning were remarkably low, which means that, even though they aspire to achieve lifelong goal
orientations, they do not practice it in their classroom (Law et al., 2008a: 128-129).
Data frequencies for teacher practice orientation with ICT or Not
0
100
200
300
400
500
600
A B C D E F G H I J K L MTeacher practices
Num
ber o
f tea
cher
s
NO FOR ICT USEYES FOR ICT USE
Figure 3.1 Data frequencies for teacher practice orientations with ICT or not
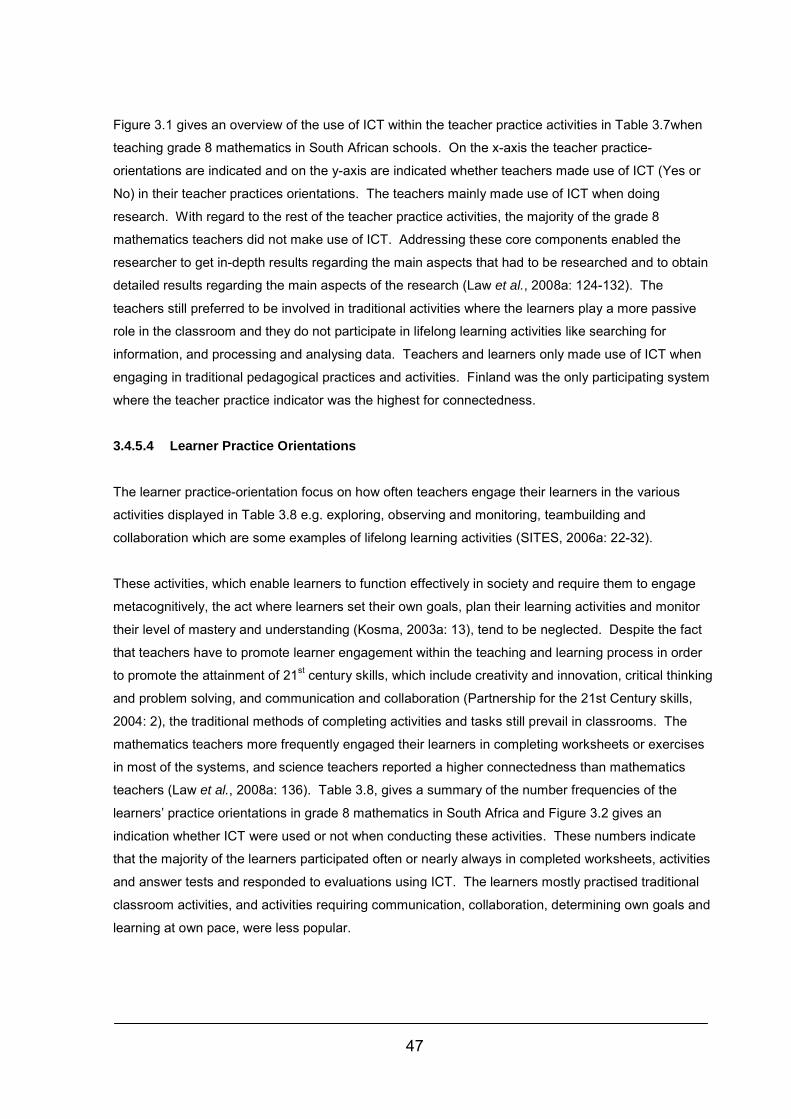
47
Figure 3.1 gives an overview of the use of ICT within the teacher practice activities in Table 3.7when
teaching grade 8 mathematics in South African schools. On the x-axis the teacher practice-
orientations are indicated and on the y-axis are indicated whether teachers made use of ICT (Yes or
No) in their teacher practices orientations. The teachers mainly made use of ICT when doing
research. With regard to the rest of the teacher practice activities, the majority of the grade 8
mathematics teachers did not make use of ICT. Addressing these core components enabled the
researcher to get in-depth results regarding the main aspects that had to be researched and to obtain
detailed results regarding the main aspects of the research (Law et al., 2008a: 124-132). The
teachers still preferred to be involved in traditional activities where the learners play a more passive
role in the classroom and they do not participate in lifelong learning activities like searching for
information, and processing and analysing data. Teachers and learners only made use of ICT when
engaging in traditional pedagogical practices and activities. Finland was the only participating system
where the teacher practice indicator was the highest for connectedness.
3.4.5.4 Learner Practice Orientations
The learner practice-orientation focus on how often teachers engage their learners in the various
activities displayed in Table 3.8 e.g. exploring, observing and monitoring, teambuilding and
collaboration which are some examples of lifelong learning activities (SITES, 2006a: 22-32).
These activities, which enable learners to function effectively in society and require them to engage
metacognitively, the act where learners set their own goals, plan their learning activities and monitor
their level of mastery and understanding (Kosma, 2003a: 13), tend to be neglected. Despite the fact
that teachers have to promote learner engagement within the teaching and learning process in order
to promote the attainment of 21st century skills, which include creativity and innovation, critical thinking
and problem solving, and communication and collaboration (Partnership for the 21st Century skills,
2004: 2), the traditional methods of completing activities and tasks still prevail in classrooms. The
mathematics teachers more frequently engaged their learners in completing worksheets or exercises
in most of the systems, and science teachers reported a higher connectedness than mathematics
teachers (Law et al., 2008a: 136). Table 3.8, gives a summary of the number frequencies of the
learners’ practice orientations in grade 8 mathematics in South Africa and Figure 3.2 gives an
indication whether ICT were used or not when conducting these activities. These numbers indicate
that the majority of the learners participated often or nearly always in completed worksheets, activities
and answer tests and responded to evaluations using ICT. The learners mostly practised traditional
classroom activities, and activities requiring communication, collaboration, determining own goals and
learning at own pace, were less popular.

48
Table 3.8 Summary of the number frequencies of the core indicators on learners’ practice orientations in grade 8 mathematics in South Africa *
Learner Practice Never Sometimes Often Nearly Always A Learners working on the same learning
materials at the same pace 36 204 236 165
B Learners learning and working during lesson at own pace
19 207 260 156
C Complete worksheets, exercises 14 106 219 303 D Give presentations 85 281 170 103 E Determine own content goals for learning 167 274 133 66 F Explain and discuss own ideas with teachers
and peers 35 243 243 123
G Collaborate with peers form other schools within or outside the country
276 240 83 41
H Answer tests or respond to evaluations 6 89 252 292 I Self or peer evaluation 49 238 220 134 J Reflect on own learning experiences and
review or adjust learning strategy 130 268 167 70
K Communicate with outside parties 225 268 103 43 L Contribute to community through own learning
experiences 257 257 92 35
* (SITES, 2006a: 22-32)
Learners' Practice Orientations in Grade 8 Mathematics
0
100
200
300
400
500
600
A B C D E F G H I J K L
Practice Orientations
Num
ber o
f Res
pond
ents
NO TO ICT USEYES TO ICT USE
Figure 3.2 South African learners’ practice orientation grade 8 mathematics Figure 3.2 presents the data recorded for the use of ICT in learner practice orientation in grade 8
mathematics in South Africa. On the x-axis the learners’ practice-orientations are indicated and
whether learners made use of ICT (Yes or No) in their practices orientations are indicated on the y-
axis. The majority of South African learners do not make use of ICT when learning. ICT was most
frequently used to complete worksheets and exercises (SITES, 2006a: 22-32).
The traditional orientation dominates in all three sets of core indicators on pedagogical orientation.
Change needs to occur in the pedagogical practices in all systems that participated in SITES 2006.
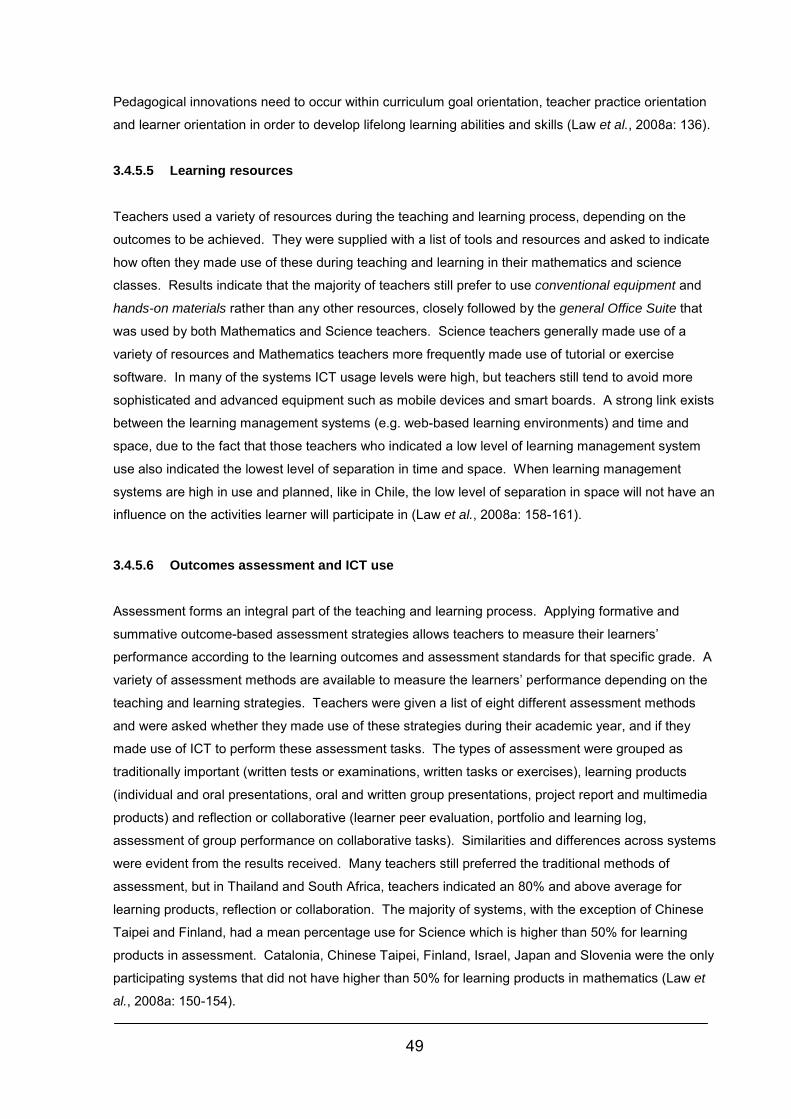
49
Pedagogical innovations need to occur within curriculum goal orientation, teacher practice orientation
and learner orientation in order to develop lifelong learning abilities and skills (Law et al., 2008a: 136).
3.4.5.5 Learning resources
Teachers used a variety of resources during the teaching and learning process, depending on the
outcomes to be achieved. They were supplied with a list of tools and resources and asked to indicate
how often they made use of these during teaching and learning in their mathematics and science
classes. Results indicate that the majority of teachers still prefer to use conventional equipment and
hands-on materials rather than any other resources, closely followed by the general Office Suite that
was used by both Mathematics and Science teachers. Science teachers generally made use of a
variety of resources and Mathematics teachers more frequently made use of tutorial or exercise
software. In many of the systems ICT usage levels were high, but teachers still tend to avoid more
sophisticated and advanced equipment such as mobile devices and smart boards. A strong link exists
between the learning management systems (e.g. web-based learning environments) and time and
space, due to the fact that those teachers who indicated a low level of learning management system
use also indicated the lowest level of separation in time and space. When learning management
systems are high in use and planned, like in Chile, the low level of separation in space will not have an
influence on the activities learner will participate in (Law et al., 2008a: 158-161).
3.4.5.6 Outcomes assessment and ICT use
Assessment forms an integral part of the teaching and learning process. Applying formative and
summative outcome-based assessment strategies allows teachers to measure their learners’
performance according to the learning outcomes and assessment standards for that specific grade. A
variety of assessment methods are available to measure the learners’ performance depending on the
teaching and learning strategies. Teachers were given a list of eight different assessment methods
and were asked whether they made use of these strategies during their academic year, and if they
made use of ICT to perform these assessment tasks. The types of assessment were grouped as
traditionally important (written tests or examinations, written tasks or exercises), learning products
(individual and oral presentations, oral and written group presentations, project report and multimedia
products) and reflection or collaborative (learner peer evaluation, portfolio and learning log,
assessment of group performance on collaborative tasks). Similarities and differences across systems
were evident from the results received. Many teachers still preferred the traditional methods of
assessment, but in Thailand and South Africa, teachers indicated an 80% and above average for
learning products, reflection or collaboration. The majority of systems, with the exception of Chinese
Taipei and Finland, had a mean percentage use for Science which is higher than 50% for learning
products in assessment. Catalonia, Chinese Taipei, Finland, Israel, Japan and Slovenia were the only
participating systems that did not have higher than 50% for learning products in mathematics (Law et
al., 2008a: 150-154).
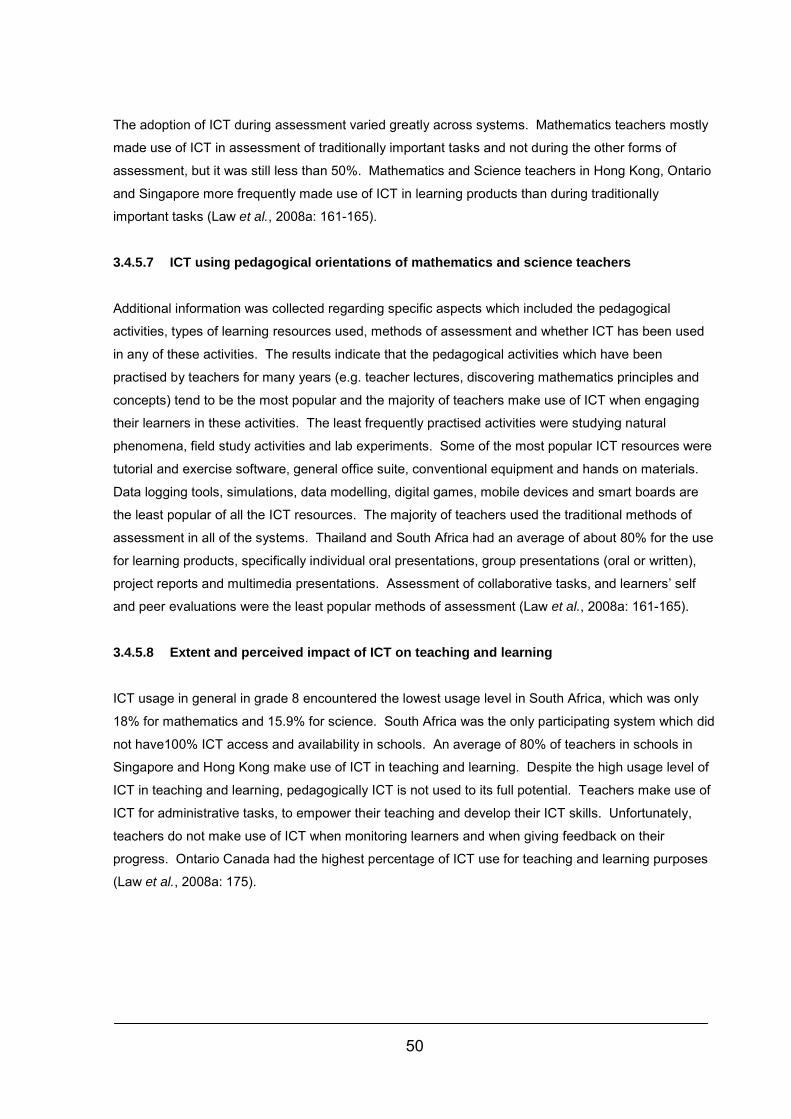
50
The adoption of ICT during assessment varied greatly across systems. Mathematics teachers mostly
made use of ICT in assessment of traditionally important tasks and not during the other forms of
assessment, but it was still less than 50%. Mathematics and Science teachers in Hong Kong, Ontario
and Singapore more frequently made use of ICT in learning products than during traditionally
important tasks (Law et al., 2008a: 161-165).
3.4.5.7 ICT using pedagogical orientations of mathematics and science teachers
Additional information was collected regarding specific aspects which included the pedagogical
activities, types of learning resources used, methods of assessment and whether ICT has been used
in any of these activities. The results indicate that the pedagogical activities which have been
practised by teachers for many years (e.g. teacher lectures, discovering mathematics principles and
concepts) tend to be the most popular and the majority of teachers make use of ICT when engaging
their learners in these activities. The least frequently practised activities were studying natural
phenomena, field study activities and lab experiments. Some of the most popular ICT resources were
tutorial and exercise software, general office suite, conventional equipment and hands on materials.
Data logging tools, simulations, data modelling, digital games, mobile devices and smart boards are
the least popular of all the ICT resources. The majority of teachers used the traditional methods of
assessment in all of the systems. Thailand and South Africa had an average of about 80% for the use
for learning products, specifically individual oral presentations, group presentations (oral or written),
project reports and multimedia presentations. Assessment of collaborative tasks, and learners’ self
and peer evaluations were the least popular methods of assessment (Law et al., 2008a: 161-165).
3.4.5.8 Extent and perceived impact of ICT on teaching and learning
ICT usage in general in grade 8 encountered the lowest usage level in South Africa, which was only
18% for mathematics and 15.9% for science. South Africa was the only participating system which did
not have100% ICT access and availability in schools. An average of 80% of teachers in schools in
Singapore and Hong Kong make use of ICT in teaching and learning. Despite the high usage level of
ICT in teaching and learning, pedagogically ICT is not used to its full potential. Teachers make use of
ICT for administrative tasks, to empower their teaching and develop their ICT skills. Unfortunately,
teachers do not make use of ICT when monitoring learners and when giving feedback on their
progress. Ontario Canada had the highest percentage of ICT use for teaching and learning purposes
(Law et al., 2008a: 175).
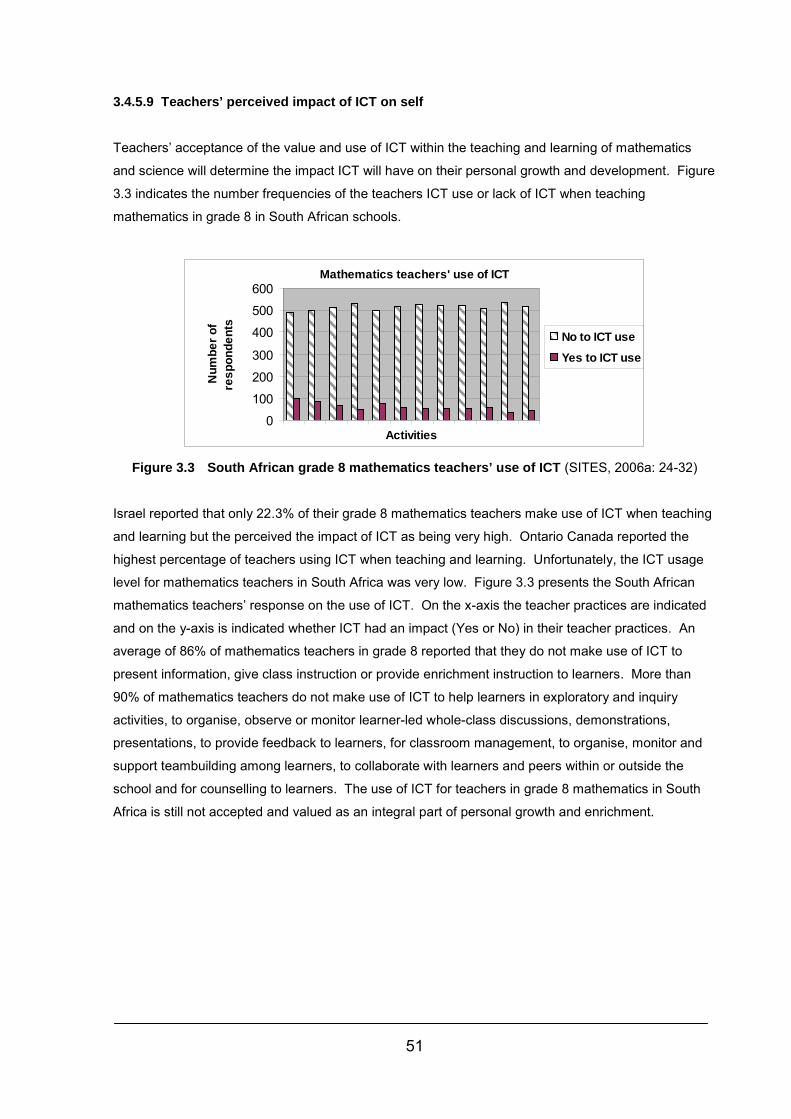
51
3.4.5.9 Teachers’ perceived impact of ICT on self
Teachers’ acceptance of the value and use of ICT within the teaching and learning of mathematics
and science will determine the impact ICT will have on their personal growth and development. Figure
3.3 indicates the number frequencies of the teachers ICT use or lack of ICT when teaching
mathematics in grade 8 in South African schools.
Mathematics teachers' use of ICT
0
100
200
300
400
500
600
Activities
Num
ber o
f re
spon
dent
s
No to ICT use
Yes to ICT use
Figure 3.3 South African grade 8 mathematics teachers’ use of ICT (SITES, 2006a: 24-32)
Israel reported that only 22.3% of their grade 8 mathematics teachers make use of ICT when teaching
and learning but the perceived the impact of ICT as being very high. Ontario Canada reported the
highest percentage of teachers using ICT when teaching and learning. Unfortunately, the ICT usage
level for mathematics teachers in South Africa was very low. Figure 3.3 presents the South African
mathematics teachers’ response on the use of ICT. On the x-axis the teacher practices are indicated
and on the y-axis is indicated whether ICT had an impact (Yes or No) in their teacher practices. An
average of 86% of mathematics teachers in grade 8 reported that they do not make use of ICT to
present information, give class instruction or provide enrichment instruction to learners. More than
90% of mathematics teachers do not make use of ICT to help learners in exploratory and inquiry
activities, to organise, observe or monitor learner-led whole-class discussions, demonstrations,
presentations, to provide feedback to learners, for classroom management, to organise, monitor and
support teambuilding among learners, to collaborate with learners and peers within or outside the
school and for counselling to learners. The use of ICT for teachers in grade 8 mathematics in South
Africa is still not accepted and valued as an integral part of personal growth and enrichment.
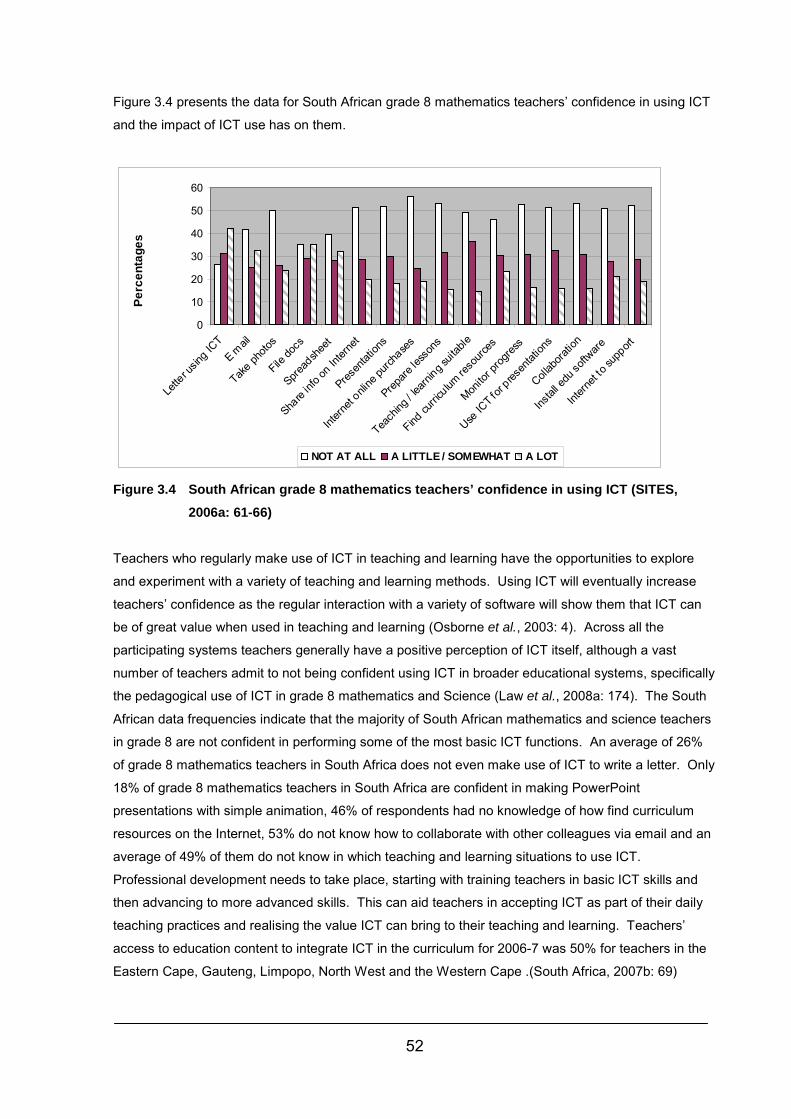
52
Figure 3.4 presents the data for South African grade 8 mathematics teachers’ confidence in using ICT
and the impact of ICT use has on them.
0
10
20
30
40
50
60
Lette
r usin
g ICT
E mail
Take ph
otos
File do
cs
Spread
shee
t
Share
info o
n Inter
net
Presen
tation
s
Intern
et onli
ne pu
rchase
s
Prepare
less
ons
Teach
ing / l
earni
ng suit
able
Find cu
rriculum
reso
urces
Monito
r prog
ress
Use IC
T for
presen
tation
s
Collab
oratio
n
Instal
l edu
softw
are
Intern
et to
supp
ort
Activities
Perc
enta
ges
NOT AT ALL A LITTLE / SOMEWHAT A LOT
Figure 3.4 South African grade 8 mathematics teachers’ confidence in using ICT (SITES, 2006a: 61-66)
Teachers who regularly make use of ICT in teaching and learning have the opportunities to explore
and experiment with a variety of teaching and learning methods. Using ICT will eventually increase
teachers’ confidence as the regular interaction with a variety of software will show them that ICT can
be of great value when used in teaching and learning (Osborne et al., 2003: 4). Across all the
participating systems teachers generally have a positive perception of ICT itself, although a vast
number of teachers admit to not being confident using ICT in broader educational systems, specifically
the pedagogical use of ICT in grade 8 mathematics and Science (Law et al., 2008a: 174). The South
African data frequencies indicate that the majority of South African mathematics and science teachers
in grade 8 are not confident in performing some of the most basic ICT functions. An average of 26%
of grade 8 mathematics teachers in South Africa does not even make use of ICT to write a letter. Only
18% of grade 8 mathematics teachers in South Africa are confident in making PowerPoint
presentations with simple animation, 46% of respondents had no knowledge of how find curriculum
resources on the Internet, 53% do not know how to collaborate with other colleagues via email and an
average of 49% of them do not know in which teaching and learning situations to use ICT.
Professional development needs to take place, starting with training teachers in basic ICT skills and
then advancing to more advanced skills. This can aid teachers in accepting ICT as part of their daily
teaching practices and realising the value ICT can bring to their teaching and learning. Teachers’
access to education content to integrate ICT in the curriculum for 2006-7 was 50% for teachers in the
Eastern Cape, Gauteng, Limpopo, North West and the Western Cape .(South Africa, 2007b: 69)
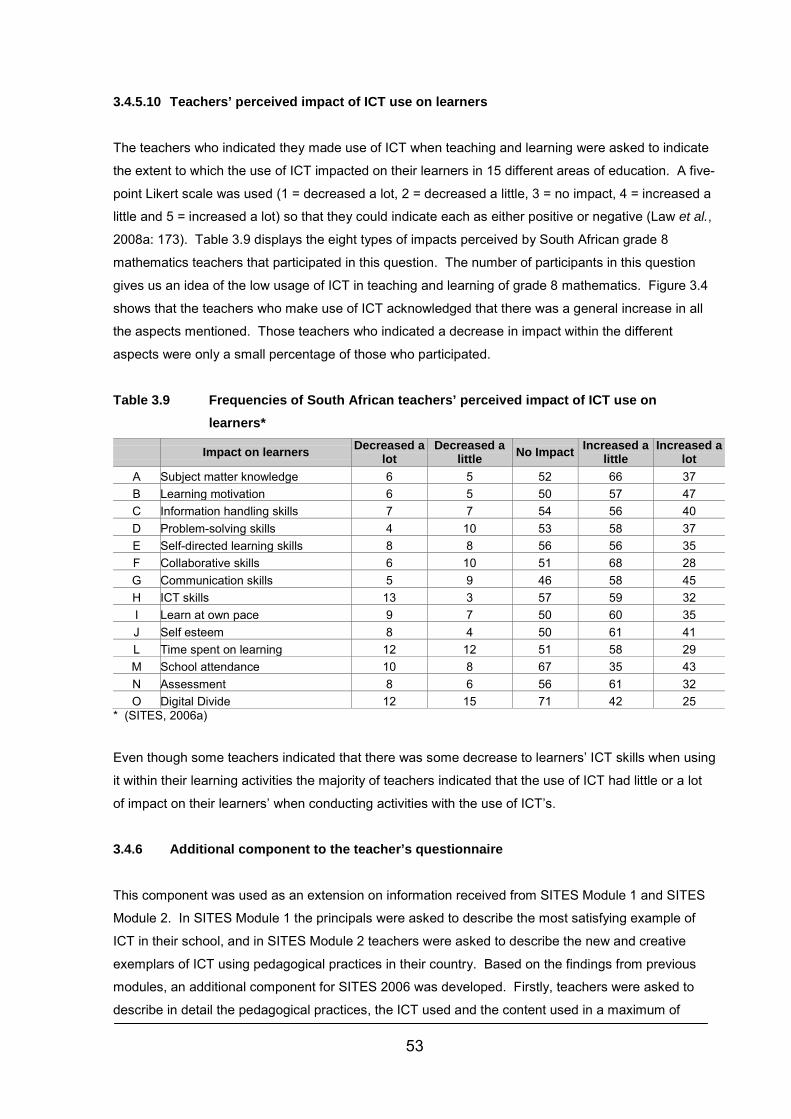
53
3.4.5.10 Teachers’ perceived impact of ICT use on learners
The teachers who indicated they made use of ICT when teaching and learning were asked to indicate
the extent to which the use of ICT impacted on their learners in 15 different areas of education. A five-
point Likert scale was used (1 = decreased a lot, 2 = decreased a little, 3 = no impact, 4 = increased a
little and 5 = increased a lot) so that they could indicate each as either positive or negative (Law et al.,
2008a: 173). Table 3.9 displays the eight types of impacts perceived by South African grade 8
mathematics teachers that participated in this question. The number of participants in this question
gives us an idea of the low usage of ICT in teaching and learning of grade 8 mathematics. Figure 3.4
shows that the teachers who make use of ICT acknowledged that there was a general increase in all
the aspects mentioned. Those teachers who indicated a decrease in impact within the different
aspects were only a small percentage of those who participated.
Table 3.9 Frequencies of South African teachers’ perceived impact of ICT use on learners*
Impact on learners Decreased a lot
Decreased a little No Impact Increased a
little Increased a
lot A Subject matter knowledge 6 5 52 66 37 B Learning motivation 6 5 50 57 47 C Information handling skills 7 7 54 56 40 D Problem-solving skills 4 10 53 58 37 E Self-directed learning skills 8 8 56 56 35 F Collaborative skills 6 10 51 68 28 G Communication skills 5 9 46 58 45 H ICT skills 13 3 57 59 32 I Learn at own pace 9 7 50 60 35 J Self esteem 8 4 50 61 41 L Time spent on learning 12 12 51 58 29 M School attendance 10 8 67 35 43 N Assessment 8 6 56 61 32 O Digital Divide 12 15 71 42 25
* (SITES, 2006a)
Even though some teachers indicated that there was some decrease to learners’ ICT skills when using
it within their learning activities the majority of teachers indicated that the use of ICT had little or a lot
of impact on their learners’ when conducting activities with the use of ICT’s.
3.4.6 Additional component to the teacher’s questionnaire
This component was used as an extension on information received from SITES Module 1 and SITES
Module 2. In SITES Module 1 the principals were asked to describe the most satisfying example of
ICT in their school, and in SITES Module 2 teachers were asked to describe the new and creative
exemplars of ICT using pedagogical practices in their country. Based on the findings from previous
modules, an additional component for SITES 2006 was developed. Firstly, teachers were asked to
describe in detail the pedagogical practices, the ICT used and the content used in a maximum of
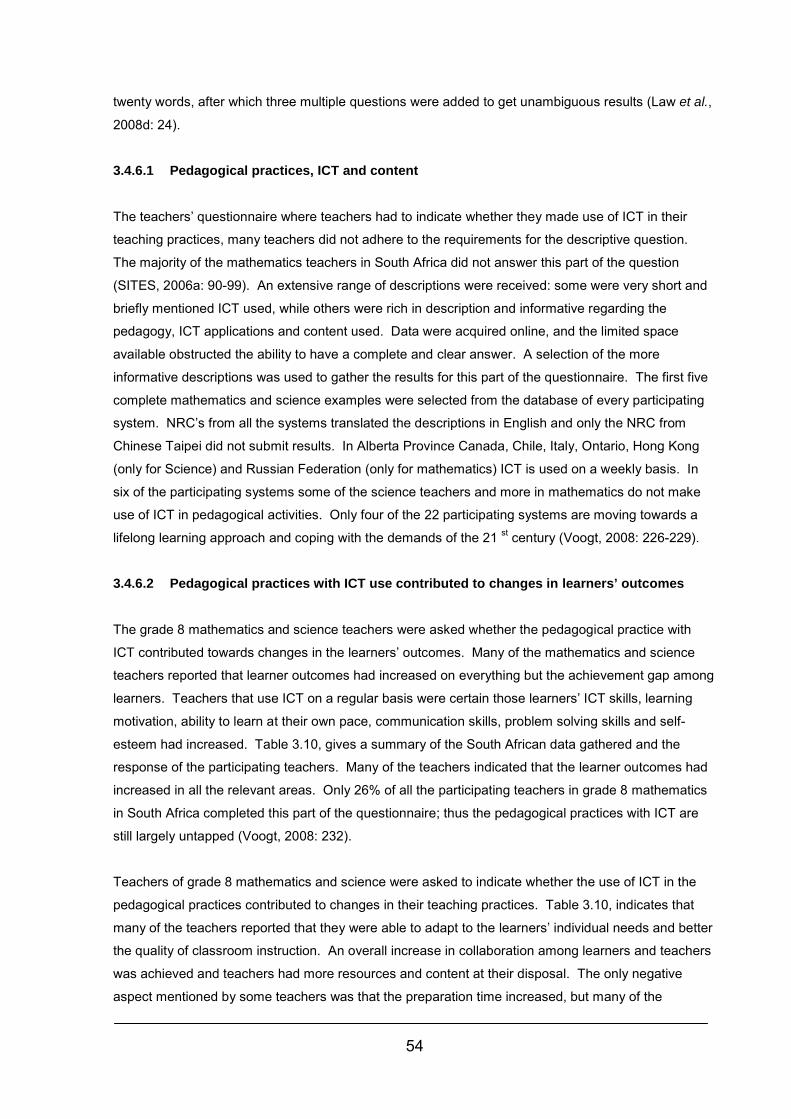
54
twenty words, after which three multiple questions were added to get unambiguous results (Law et al.,
2008d: 24).
3.4.6.1 Pedagogical practices, ICT and content
The teachers’ questionnaire where teachers had to indicate whether they made use of ICT in their
teaching practices, many teachers did not adhere to the requirements for the descriptive question.
The majority of the mathematics teachers in South Africa did not answer this part of the question
(SITES, 2006a: 90-99). An extensive range of descriptions were received: some were very short and
briefly mentioned ICT used, while others were rich in description and informative regarding the
pedagogy, ICT applications and content used. Data were acquired online, and the limited space
available obstructed the ability to have a complete and clear answer. A selection of the more
informative descriptions was used to gather the results for this part of the questionnaire. The first five
complete mathematics and science examples were selected from the database of every participating
system. NRC’s from all the systems translated the descriptions in English and only the NRC from
Chinese Taipei did not submit results. In Alberta Province Canada, Chile, Italy, Ontario, Hong Kong
(only for Science) and Russian Federation (only for mathematics) ICT is used on a weekly basis. In
six of the participating systems some of the science teachers and more in mathematics do not make
use of ICT in pedagogical activities. Only four of the 22 participating systems are moving towards a
lifelong learning approach and coping with the demands of the 21 st century (Voogt, 2008: 226-229).
3.4.6.2 Pedagogical practices with ICT use contributed to changes in learners’ outcomes
The grade 8 mathematics and science teachers were asked whether the pedagogical practice with
ICT contributed towards changes in the learners’ outcomes. Many of the mathematics and science
teachers reported that learner outcomes had increased on everything but the achievement gap among
learners. Teachers that use ICT on a regular basis were certain those learners’ ICT skills, learning
motivation, ability to learn at their own pace, communication skills, problem solving skills and self-
esteem had increased. Table 3.10, gives a summary of the South African data gathered and the
response of the participating teachers. Many of the teachers indicated that the learner outcomes had
increased in all the relevant areas. Only 26% of all the participating teachers in grade 8 mathematics
in South Africa completed this part of the questionnaire; thus the pedagogical practices with ICT are
still largely untapped (Voogt, 2008: 232).
Teachers of grade 8 mathematics and science were asked to indicate whether the use of ICT in the
pedagogical practices contributed to changes in their teaching practices. Table 3.10, indicates that
many of the teachers reported that they were able to adapt to the learners’ individual needs and better
the quality of classroom instruction. An overall increase in collaboration among learners and teachers
was achieved and teachers had more resources and content at their disposal. The only negative
aspect mentioned by some teachers was that the preparation time increased, but many of the
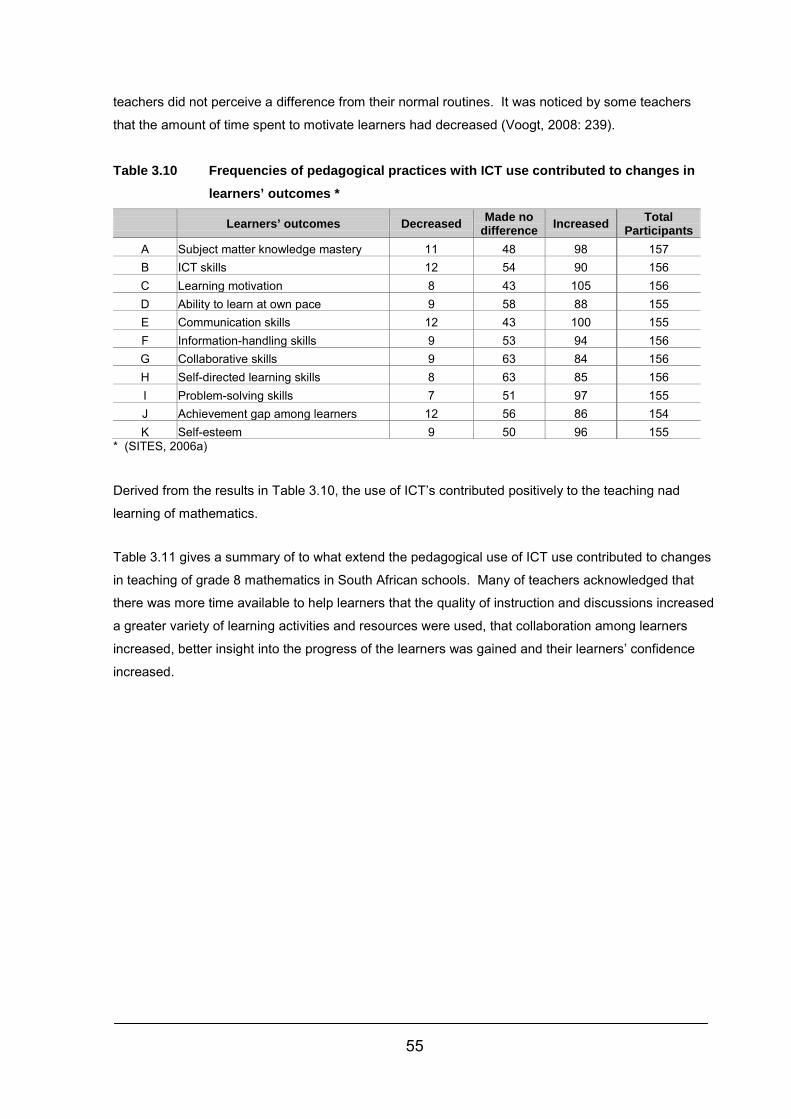
55
teachers did not perceive a difference from their normal routines. It was noticed by some teachers
that the amount of time spent to motivate learners had decreased (Voogt, 2008: 239).
Table 3.10 Frequencies of pedagogical practices with ICT use contributed to changes in
learners’ outcomes *
Learners’ outcomes Decreased Made no difference Increased Total
Participants A Subject matter knowledge mastery 11 48 98 157 B ICT skills 12 54 90 156 C Learning motivation 8 43 105 156 D Ability to learn at own pace 9 58 88 155 E Communication skills 12 43 100 155 F Information-handling skills 9 53 94 156 G Collaborative skills 9 63 84 156 H Self-directed learning skills 8 63 85 156 I Problem-solving skills 7 51 97 155 J Achievement gap among learners 12 56 86 154 K Self-esteem 9 50 96 155
* (SITES, 2006a)
Derived from the results in Table 3.10, the use of ICT’s contributed positively to the teaching nad
learning of mathematics.
Table 3.11 gives a summary of to what extend the pedagogical use of ICT use contributed to changes
in teaching of grade 8 mathematics in South African schools. Many of teachers acknowledged that
there was more time available to help learners that the quality of instruction and discussions increased
a greater variety of learning activities and resources were used, that collaboration among learners
increased, better insight into the progress of the learners was gained and their learners’ confidence
increased.
56
Table 3.11 Frequencies of pedagogical practices contributed to change in teaching *
Pedagogical practice Decreased Made no difference Increased Total
participants A Quality of coaching learners 9 50 100 159 B Time available to help individual learners 14 61 85 160 C Time needed to solve technical problems 19 60 79 158 D Time needed for preparations 24 49 86 159 E Quality of instruction given to the learners 11 51 93 155 F Time needed for classroom management 20 55 83 158 G Quality of classroom discussion 11 53 95 159 H Collaboration between learners 7 61 91 159 I Communication with the outside world 17 62 80 159 J Availability of new learning content 9 51 99 159 K Variety of learning resources or materials 14 53 91 158 L Variety of learning activities 12 49 97 158 M Adaptation to individual needs of learners 13 61 84 158 N Amount of effort needed to motivate learners 15 57 87 159
O Insight into the progress of learner performance 8 56 95 159
P Self-confidence 7 52 100 159 * (SITES, 2006a)
Grade 8 mathematics teachers from all participating systems agreed on most of the aspects
mentioned in this question. Unfortunately, the opinions expressed were only some of all the
participating grade 8 mathematics teachers in South Africa.
3.4.6.3 Initiating agent of teaching and learning actions
The grade 8 mathematics and science teachers were asked to indicate which party (teacher or
learner) initiated actions of teaching and learning in the pedagogical practice. Different aspects of
teaching and learning were included within this specific question and teachers were asked to indicate
which party was responsible for initiating this aspect of the teaching and learning. The results from all
the participating systems show that the teachers in all the systems were the initiators in teaching and
learning activities. Demonstrating learning achievement was the only aspect where 43% of the
teachers reported that the learners take initiative. Teachers who make use of ICT on a weekly basis
reported that learners take the initiative in organising group work (Voogt, 2008: 247).
Table 3.12, summarises the different aspects addressed in this question and data as captured in
South Africa. It shows that the grade 8 mathematics teachers in South Africa are the initiators in the
planning and conducting of teaching and learning activities. Learners tend to take initiative only when
demonstrating learning achievement, organising groups and providing feedback. The remaining
teaching and learning activities was teacher initiated.
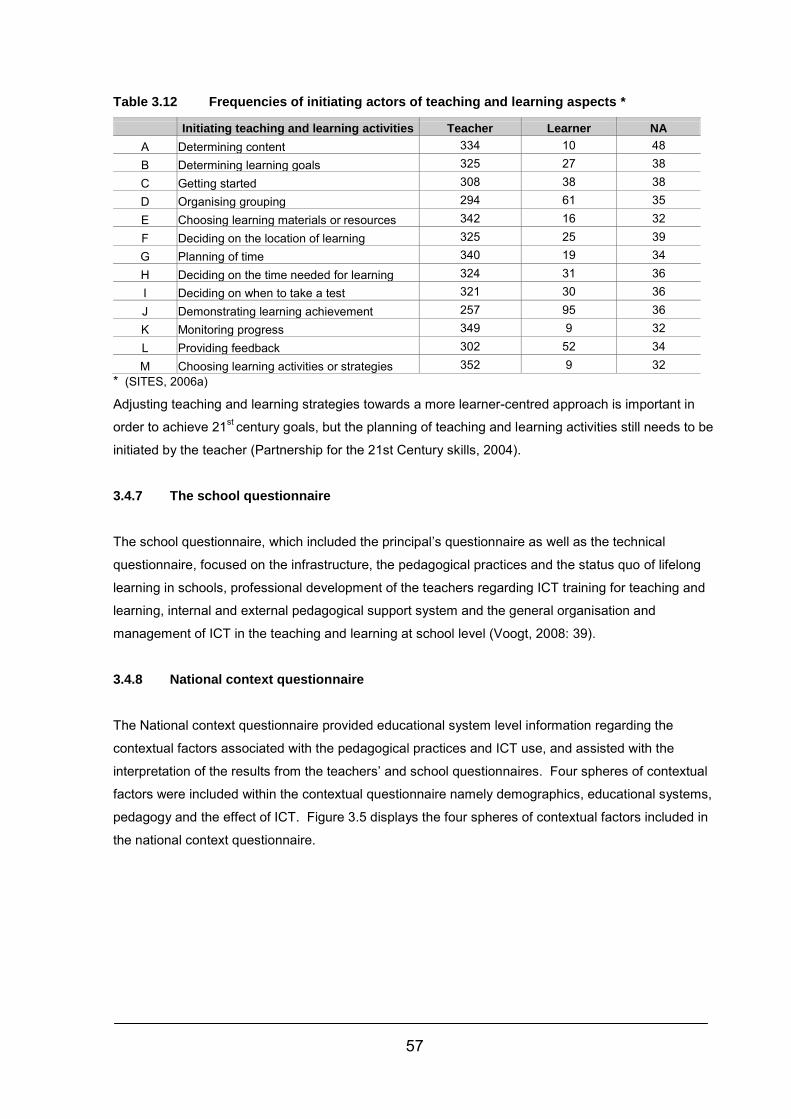
57
Table 3.12 Frequencies of initiating actors of teaching and learning aspects *
Initiating teaching and learning activities Teacher Learner NA A Determining content 334 10 48 B Determining learning goals 325 27 38
C Getting started 308 38 38 D Organising grouping 294 61 35
E Choosing learning materials or resources 342 16 32
F Deciding on the location of learning 325 25 39 G Planning of time 340 19 34
H Deciding on the time needed for learning 324 31 36 I Deciding on when to take a test 321 30 36
J Demonstrating learning achievement 257 95 36 K Monitoring progress 349 9 32
L Providing feedback 302 52 34
M Choosing learning activities or strategies 352 9 32 * (SITES, 2006a)
Adjusting teaching and learning strategies towards a more learner-centred approach is important in
order to achieve 21st century goals, but the planning of teaching and learning activities still needs to be
initiated by the teacher (Partnership for the 21st Century skills, 2004).
3.4.7 The school questionnaire
The school questionnaire, which included the principal’s questionnaire as well as the technical
questionnaire, focused on the infrastructure, the pedagogical practices and the status quo of lifelong
learning in schools, professional development of the teachers regarding ICT training for teaching and
learning, internal and external pedagogical support system and the general organisation and
management of ICT in the teaching and learning at school level (Voogt, 2008: 39).
3.4.8 National context questionnaire
The National context questionnaire provided educational system level information regarding the
contextual factors associated with the pedagogical practices and ICT use, and assisted with the
interpretation of the results from the teachers’ and school questionnaires. Four spheres of contextual
factors were included within the contextual questionnaire namely demographics, educational systems,
pedagogy and the effect of ICT. Figure 3.5 displays the four spheres of contextual factors included in
the national context questionnaire.
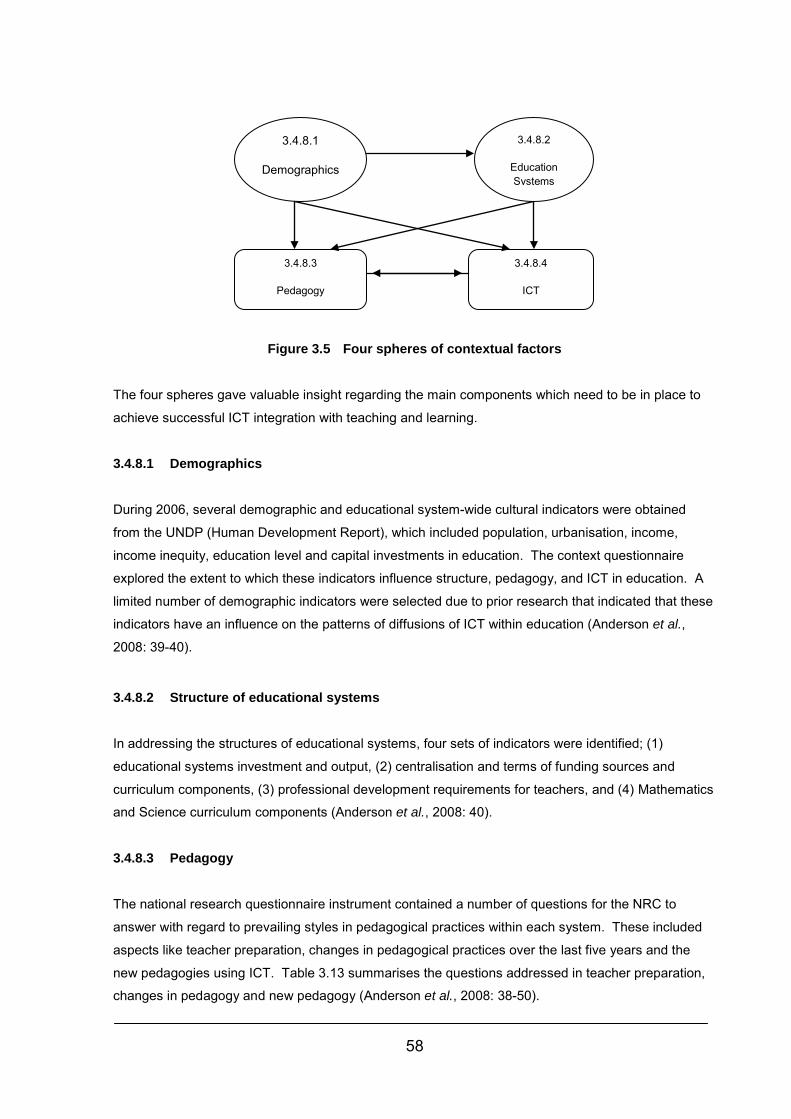
58
Figure 3.5 Four spheres of contextual factors
The four spheres gave valuable insight regarding the main components which need to be in place to
achieve successful ICT integration with teaching and learning.
3.4.8.1 Demographics
During 2006, several demographic and educational system-wide cultural indicators were obtained
from the UNDP (Human Development Report), which included population, urbanisation, income,
income inequity, education level and capital investments in education. The context questionnaire
explored the extent to which these indicators influence structure, pedagogy, and ICT in education. A
limited number of demographic indicators were selected due to prior research that indicated that these
indicators have an influence on the patterns of diffusions of ICT within education (Anderson et al.,
2008: 39-40).
3.4.8.2 Structure of educational systems
In addressing the structures of educational systems, four sets of indicators were identified; (1)
educational systems investment and output, (2) centralisation and terms of funding sources and
curriculum components, (3) professional development requirements for teachers, and (4) Mathematics
and Science curriculum components (Anderson et al., 2008: 40).
3.4.8.3 Pedagogy The national research questionnaire instrument contained a number of questions for the NRC to
answer with regard to prevailing styles in pedagogical practices within each system. These included
aspects like teacher preparation, changes in pedagogical practices over the last five years and the
new pedagogies using ICT. Table 3.13 summarises the questions addressed in teacher preparation,
changes in pedagogy and new pedagogy (Anderson et al., 2008: 38-50).
3.4.8.1
Demographics
3.4.8.2
Education Systems
3.4.8.3
Pedagogy
3.4.8.4
ICT
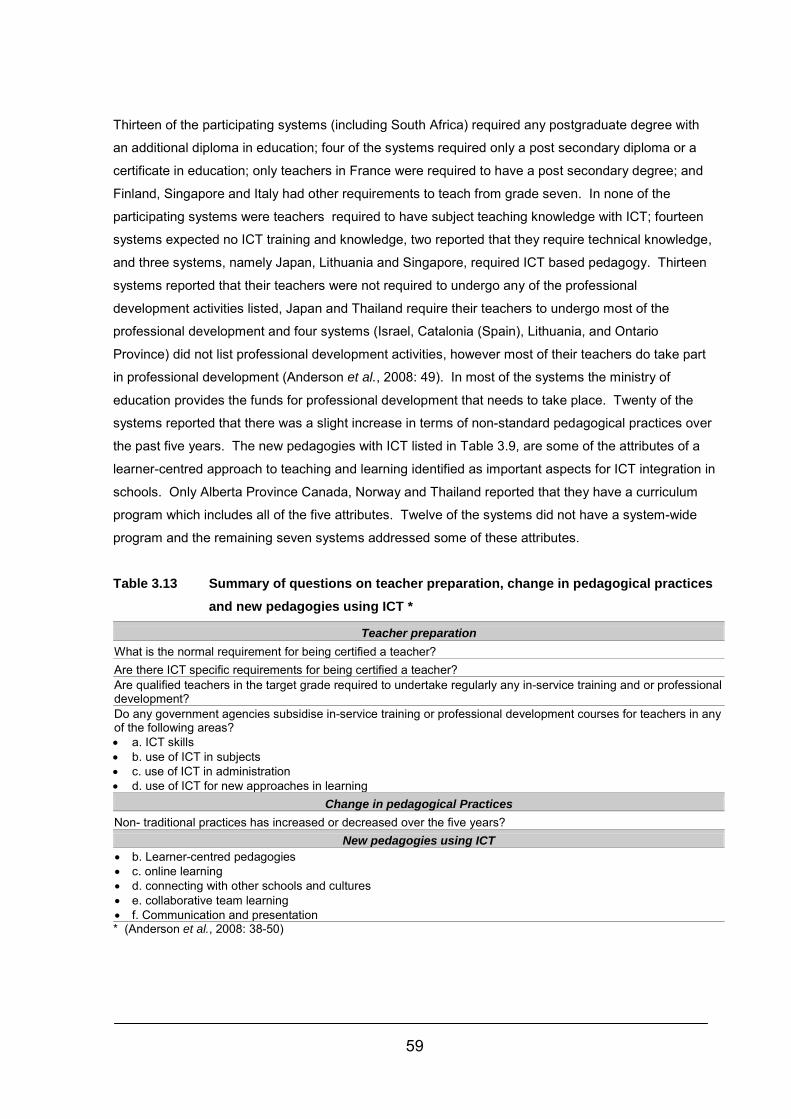
59
Thirteen of the participating systems (including South Africa) required any postgraduate degree with
an additional diploma in education; four of the systems required only a post secondary diploma or a
certificate in education; only teachers in France were required to have a post secondary degree; and
Finland, Singapore and Italy had other requirements to teach from grade seven. In none of the
participating systems were teachers required to have subject teaching knowledge with ICT; fourteen
systems expected no ICT training and knowledge, two reported that they require technical knowledge,
and three systems, namely Japan, Lithuania and Singapore, required ICT based pedagogy. Thirteen
systems reported that their teachers were not required to undergo any of the professional
development activities listed, Japan and Thailand require their teachers to undergo most of the
professional development and four systems (Israel, Catalonia (Spain), Lithuania, and Ontario
Province) did not list professional development activities, however most of their teachers do take part
in professional development (Anderson et al., 2008: 49). In most of the systems the ministry of
education provides the funds for professional development that needs to take place. Twenty of the
systems reported that there was a slight increase in terms of non-standard pedagogical practices over
the past five years. The new pedagogies with ICT listed in Table 3.9, are some of the attributes of a
learner-centred approach to teaching and learning identified as important aspects for ICT integration in
schools. Only Alberta Province Canada, Norway and Thailand reported that they have a curriculum
program which includes all of the five attributes. Twelve of the systems did not have a system-wide
program and the remaining seven systems addressed some of these attributes.
Table 3.13 Summary of questions on teacher preparation, change in pedagogical practices and new pedagogies using ICT *
Teacher preparation What is the normal requirement for being certified a teacher? Are there ICT specific requirements for being certified a teacher? Are qualified teachers in the target grade required to undertake regularly any in-service training and or professional development? Do any government agencies subsidise in-service training or professional development courses for teachers in any of the following areas? • a. ICT skills • b. use of ICT in subjects • c. use of ICT in administration • d. use of ICT for new approaches in learning
Change in pedagogical Practices Non- traditional practices has increased or decreased over the five years?
New pedagogies using ICT • b. Learner-centred pedagogies • c. online learning • d. connecting with other schools and cultures • e. collaborative team learning • f. Communication and presentation * (Anderson et al., 2008: 38-50)
60
3.4.8.4 Use of information and communication technologies Various aspects were included in this part of the questionnaire namely funding for ICT in education,
ICT policies and practices on the use of ICT.
• Funding
Twenty of the systems increased their funding for ICT over the past five years. Norway, Catalonia,
Spain and Finland spend vast amounts of money on ICT. South Africa was one of the countries who
increased their ICT funding, but it was less than the required amount. The funding required for e-
Education in South Africa in the budget plan was R 608,4 million for all provinces, but only 36% of the
target was met in 2005-6, R 717 million for 2006-7 of which only 48% of the target was met and R
789,6 million required for 2007-8, but only R 394,788 (0.44%) was allocated (South Africa, 2007b: 69).
The shortfall of funds, the lack of training and access to ICT for integration into the curriculum every
year will ultimately create a bigger gap between South Africa and the other educational systems
worldwide.
• System-wide ICT Education Policy
In twenty of the systems an ICT policy in education existed. Each system was asked to look at the
eleven specific components: clear vision, support for the curriculum, mode of integrating ICT in
teaching, minimum level of access to ICT, Internet connectivity, goal to reduce the digital divide,
attempt to ensure ICT access outside school, teachers’ professional development requirements,
stimulation of teachers’ professional development requirements on ICT, evaluation for ICT policy
implementation, and funding arrangement. Estonia, Israel, Singapore and South Africa were the only
four systems which had all the components in place (Anderson et al., 2008: 56).
Eight of the educational systems indicated that language was an obstacle: Israel, Lithuania, Moscow,
Slovak Republic, Slovenia, South Africa and Thailand. The remaining educational system did not
regard language as a barrier to ICT use in grade 8.
The various educational systems were asked to indicate whether they have a system-wide program
regarding the ICT related skills learners are required to have in grade 8. Chinese Taipei, France,
Japan, Slovak Republic and Thailand have one or two compulsory classes in ICT and Alberta
Province Canada, Chile, Denmark, Finland and Singapore implement the program policy by
integrating ICT instruction within the different subject areas. Thirteen of the participating systems
indicated that they had policies promoting 21st century skills.
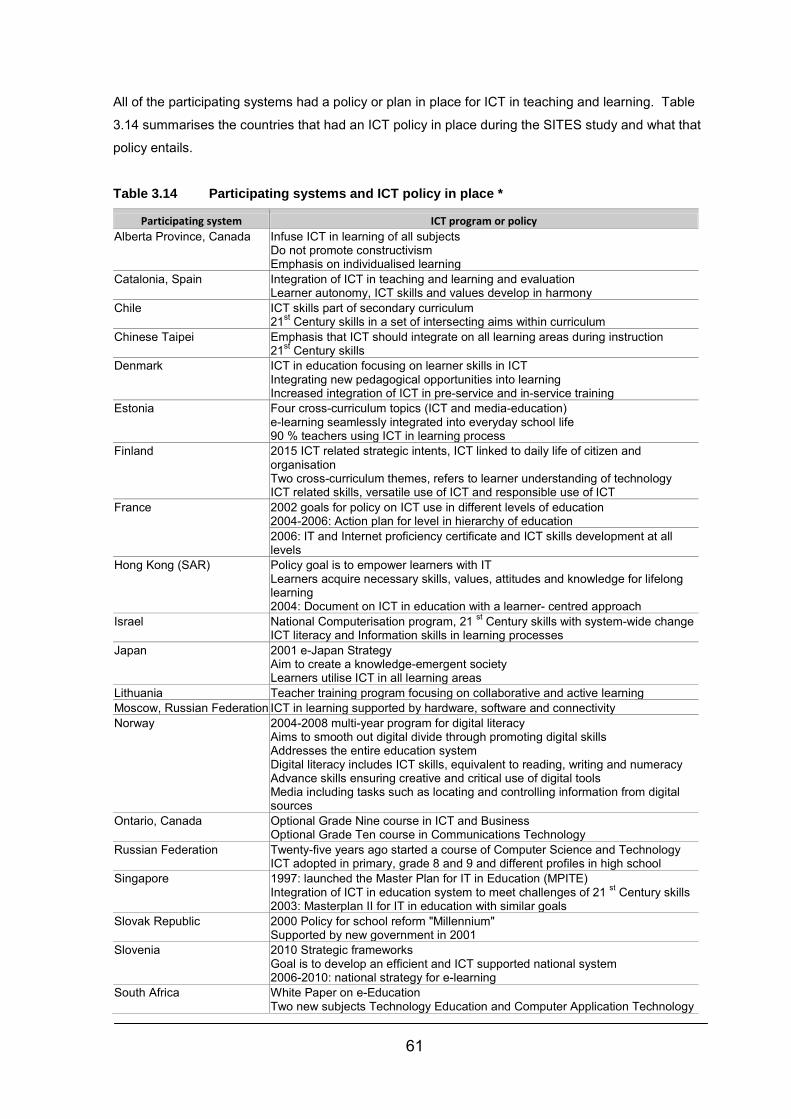
61
All of the participating systems had a policy or plan in place for ICT in teaching and learning. Table
3.14 summarises the countries that had an ICT policy in place during the SITES study and what that
policy entails.
Table 3.14 Participating systems and ICT policy in place *
Participating system ICT program or policy Alberta Province, Canada Infuse ICT in learning of all subjects
Do not promote constructivism Emphasis on individualised learning
Catalonia, Spain Integration of ICT in teaching and learning and evaluation Learner autonomy, ICT skills and values develop in harmony
Chile ICT skills part of secondary curriculum 21st Century skills in a set of intersecting aims within curriculum
Chinese Taipei Emphasis that ICT should integrate on all learning areas during instruction 21st Century skills
Denmark ICT in education focusing on learner skills in ICT Integrating new pedagogical opportunities into learning Increased integration of ICT in pre-service and in-service training
Estonia Four cross-curriculum topics (ICT and media-education) e-learning seamlessly integrated into everyday school life 90 % teachers using ICT in learning process
Finland 2015 ICT related strategic intents, ICT linked to daily life of citizen and organisation Two cross-curriculum themes, refers to learner understanding of technology ICT related skills, versatile use of ICT and responsible use of ICT
France 2002 goals for policy on ICT use in different levels of education 2004-2006: Action plan for level in hierarchy of education 2006: IT and Internet proficiency certificate and ICT skills development at all levels
Hong Kong (SAR) Policy goal is to empower learners with IT Learners acquire necessary skills, values, attitudes and knowledge for lifelong learning 2004: Document on ICT in education with a learner- centred approach
Israel National Computerisation program, 21 st Century skills with system-wide change ICT literacy and Information skills in learning processes
Japan 2001 e-Japan Strategy Aim to create a knowledge-emergent society Learners utilise ICT in all learning areas
Lithuania Teacher training program focusing on collaborative and active learning Moscow, Russian Federation ICT in learning supported by hardware, software and connectivity Norway 2004-2008 multi-year program for digital literacy
Aims to smooth out digital divide through promoting digital skills Addresses the entire education system Digital literacy includes ICT skills, equivalent to reading, writing and numeracy Advance skills ensuring creative and critical use of digital tools Media including tasks such as locating and controlling information from digital sources
Ontario, Canada Optional Grade Nine course in ICT and Business Optional Grade Ten course in Communications Technology
Russian Federation Twenty-five years ago started a course of Computer Science and Technology ICT adopted in primary, grade 8 and 9 and different profiles in high school
Singapore 1997: launched the Master Plan for IT in Education (MPITE) Integration of ICT in education system to meet challenges of 21 st Century skills 2003: Masterplan II for IT in education with similar goals
Slovak Republic 2000 Policy for school reform "Millennium" Supported by new government in 2001
Slovenia 2010 Strategic frameworks Goal is to develop an efficient and ICT supported national system 2006-2010: national strategy for e-learning
South Africa White Paper on e-Education Two new subjects Technology Education and Computer Application Technology
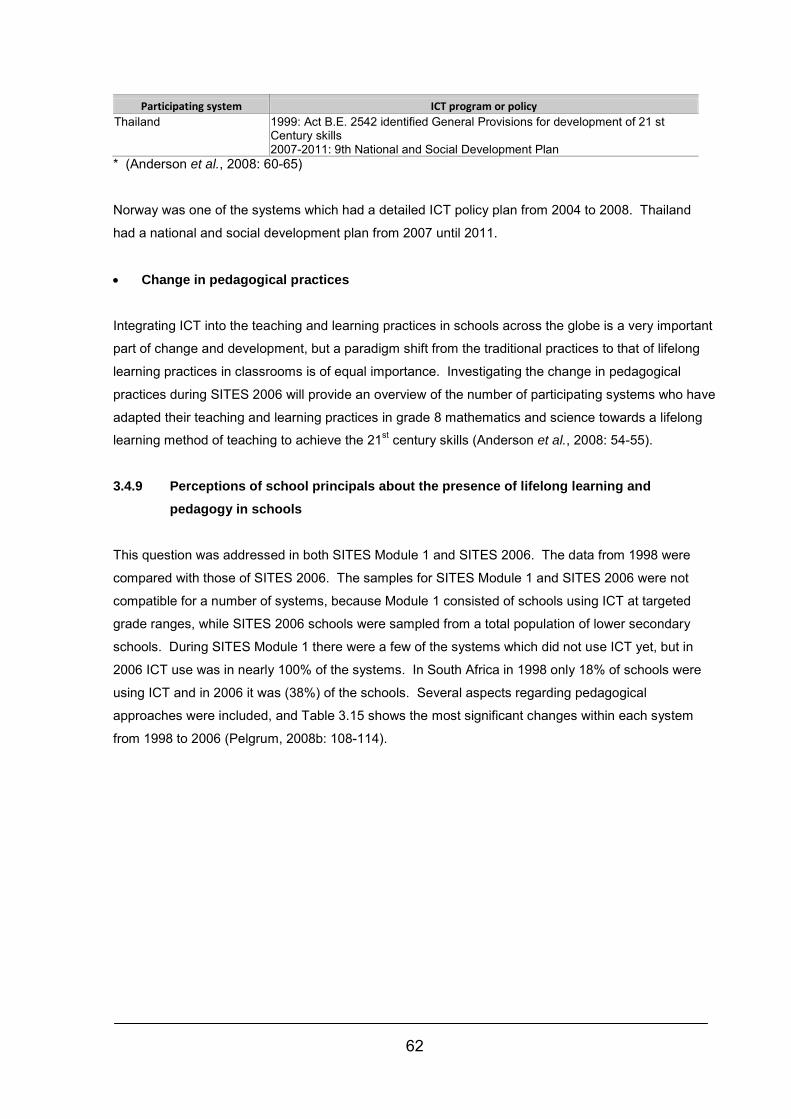
62
Participating system ICT program or policy Thailand 1999: Act B.E. 2542 identified General Provisions for development of 21 st
Century skills 2007-2011: 9th National and Social Development Plan
* (Anderson et al., 2008: 60-65)
Norway was one of the systems which had a detailed ICT policy plan from 2004 to 2008. Thailand
had a national and social development plan from 2007 until 2011.
• Change in pedagogical practices
Integrating ICT into the teaching and learning practices in schools across the globe is a very important
part of change and development, but a paradigm shift from the traditional practices to that of lifelong
learning practices in classrooms is of equal importance. Investigating the change in pedagogical
practices during SITES 2006 will provide an overview of the number of participating systems who have
adapted their teaching and learning practices in grade 8 mathematics and science towards a lifelong
learning method of teaching to achieve the 21st century skills (Anderson et al., 2008: 54-55).
3.4.9 Perceptions of school principals about the presence of lifelong learning and
pedagogy in schools
This question was addressed in both SITES Module 1 and SITES 2006. The data from 1998 were
compared with those of SITES 2006. The samples for SITES Module 1 and SITES 2006 were not
compatible for a number of systems, because Module 1 consisted of schools using ICT at targeted
grade ranges, while SITES 2006 schools were sampled from a total population of lower secondary
schools. During SITES Module 1 there were a few of the systems which did not use ICT yet, but in
2006 ICT use was in nearly 100% of the systems. In South Africa in 1998 only 18% of schools were
using ICT and in 2006 it was (38%) of the schools. Several aspects regarding pedagogical
approaches were included, and Table 3.15 shows the most significant changes within each system
from 1998 to 2006 (Pelgrum, 2008b: 108-114).
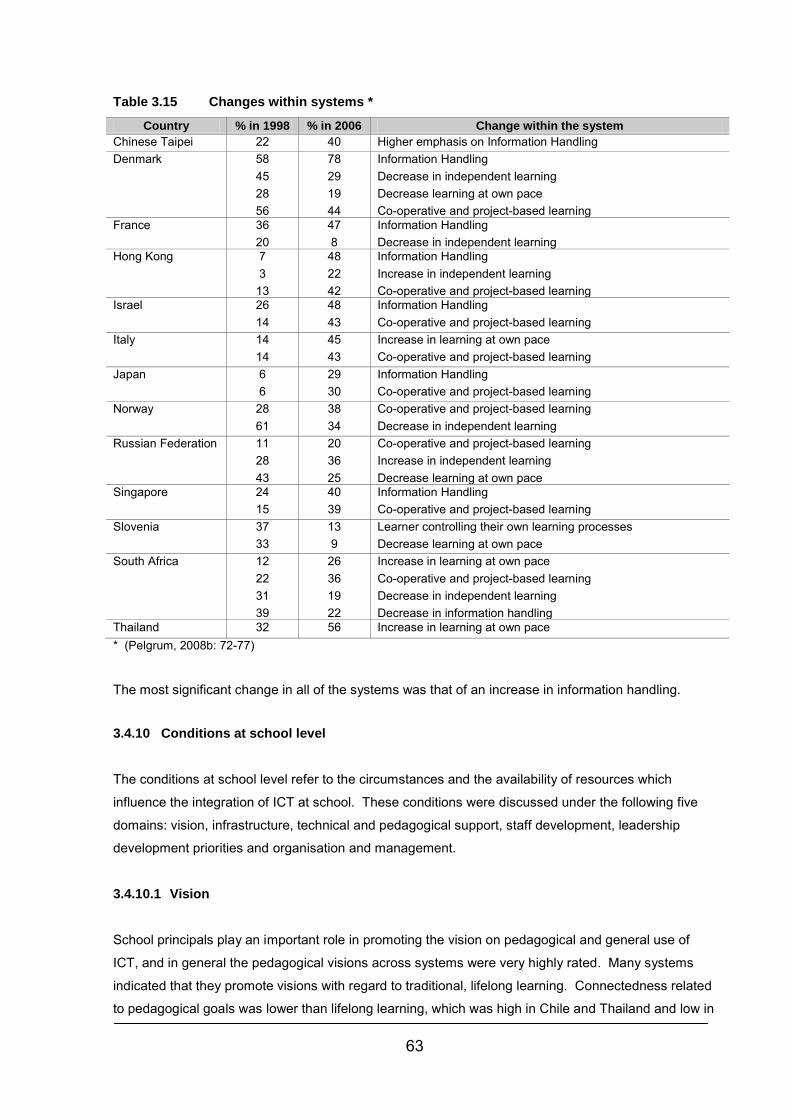
63
Table 3.15 Changes within systems *
Country % in 1998 % in 2006 Change within the system Chinese Taipei 22 40 Higher emphasis on Information Handling Denmark 58 78 Information Handling
45 29 Decrease in independent learning 28 19 Decrease learning at own pace 56 44 Co-operative and project-based learning
France 36 47 Information Handling 20 8 Decrease in independent learning
Hong Kong 7 48 Information Handling 3 22 Increase in independent learning
13 42 Co-operative and project-based learning Israel 26 48 Information Handling
14 43 Co-operative and project-based learning Italy 14 45 Increase in learning at own pace
14 43 Co-operative and project-based learning Japan 6 29 Information Handling
6 30 Co-operative and project-based learning Norway 28 38 Co-operative and project-based learning
61 34 Decrease in independent learning Russian Federation 11 20 Co-operative and project-based learning
28 36 Increase in independent learning 43 25 Decrease learning at own pace
Singapore 24 40 Information Handling 15 39 Co-operative and project-based learning
Slovenia 37 13 Learner controlling their own learning processes 33 9 Decrease learning at own pace
South Africa 12 26 Increase in learning at own pace 22 36 Co-operative and project-based learning 31 19 Decrease in independent learning 39 22 Decrease in information handling
Thailand 32 56 Increase in learning at own pace * (Pelgrum, 2008b: 72-77)
The most significant change in all of the systems was that of an increase in information handling.
3.4.10 Conditions at school level
The conditions at school level refer to the circumstances and the availability of resources which
influence the integration of ICT at school. These conditions were discussed under the following five
domains: vision, infrastructure, technical and pedagogical support, staff development, leadership
development priorities and organisation and management.
3.4.10.1 Vision
School principals play an important role in promoting the vision on pedagogical and general use of
ICT, and in general the pedagogical visions across systems were very highly rated. Many systems
indicated that they promote visions with regard to traditional, lifelong learning. Connectedness related
to pedagogical goals was lower than lifelong learning, which was high in Chile and Thailand and low in
64
Denmark, Finland and Norway. Even though lifelong learning is low in these countries, more of the
lifelong pedagogical practices exist in these countries. Principals in all twenty two participating
systems indicated that they do encourage teachers to prepare the learners for responsible Internet
use even though about 20% of principals in Israel, South Africa and the Russian Federation did not
pay attention to this matter. In France and Japan the lifelong learning pedagogical practices were very
low. There is no comparison between the vision of the principals and the pedagogical practices of
teachers (Pelgrum, 2008b: 69).
The question regarding the lifelong learning orientated practices were addressed to both the teachers
and the principals and relative high scores of Chile and Thailand in comparison to the low scores of
Catalonia, France, Japan and South Africa the, but the indicators were convergent and therefore
further investigation is necessary in future analyses (Pelgrum, 2008b: 72-74). Chile and Thailand both
indicate within their policy they focus a lot on the development of the 21st century skills.
3.4.10.2 Infrastructure
Schools need adequate infrastructure (hardware and software) to support teachers in achieving their
pedagogical goals. South Africa had the lowest availability of infrastructure at 38% in 2006. All the
other participating systems had an availability of 95% to 100%.
There was a vast difference between education systems in terms of ICT-infrastructural conditions.
The learner-computer ratio refers to the number of computers available to learners for teaching and
learning at each school, and for access to ICT this varied quite significantly. The number of
computers available at the school was expressed as a ratio to the number of learners and the results
were given as percentages. In some systems like Alberta Province, Canada and Norway the ratio was
less than five (at least one computer for every five learners), which is quite satisfactory, and in other
systems like Denmark, Finland, France, Japan, Hong Kong, Ontario and Singapore it is still
satisfactory with a ratio of less than ten at least one computer for every ten learners). In Italy, the
Russian Federation, Slovak Republic, South Africa and Thailand hardly any schools had a ratio of less
than ten (Pelgrum, 2008b: 74-76).
• Tools and facilities available
The availability of tools and facilities form an integral part of the teaching and learning process with
ICT. ICT equipment was available in most of the systems, but in Chile at 47%, Thailand at 41% and
South Africa the lowest at 17%, the availability of ICT equipment poses a real problem. Most of the
systems had adequate tutorial software, except Thailand at 17% and South Africa at 10%. The
access to general purpose software was only a problem in South Africa and Thailand and only 13% of
teachers in South Africa and 11% of teachers in Thailand had mail accounts. These two countries
were also the only which did not have any communication software (Pelgrum, 2008b: 80).
65
• Needs for ICT tools and facilities
There was a general increase in the number of PCs and Internet availability in schools, but whether it
is sufficient to realise the pedagogical goals for schools needs to be investigated. Most of the systems
were satisfied with the amount of PCs in their schools as well as the Internet availability. South
Africa’s needs were the highest of all the participating systems:
• Equipment 83%
• Tutorial software 88%
• General Software 54%
• Multimedia 91%
• Data-logging 86%
• Simulation 93%
• Communication Software 83%
• Digital Resources 80%
• Mobile Devices 79%
• Smart Boards 88%
• LMS 89%
• Mail accounts for teachers 83%
• Mail accounts for learners 84%.
Many teachers, through their technology co-coordinators, identified various barriers that prevent them
from achieving their pedagogical goals. Insufficient ICT tools for science laboratory work, was a
barrier in most of the systems. Chile, Russian Federation, South Africa and Thailand did not even
have a sufficient budget for basic equipment like pencils and paper, thus ICT tools are not a priority for
teachers in these systems (Pelgrum, 2008b: 83):
• Location of Computers in schools. In 2006, only 1% of classrooms in South Africa had
computers, only 3% had computers in some classes, 48% had computer laboratories, 9% had
computers in their libraries and 12% had computers elsewhere on the school premises. All of
the other participating systems had an average of 78% to 100% computer laboratories
(Pelgrum, 2008b: 88-89).
• Maintenance of computers at schools. Almost all of the systems’ school staff took care of the
general maintenance of the IT equipment. The lowest rate of staff maintenance was in
Singapore at 49% and South Africa at 42% (Pelgrum, 2008b: 88-90).
3.4.10.3 Technical and pedagogical support
The presence of technical and pedagogical support is a very important condition when implementing
ICT into the teaching and learning process. Two questions were posed to the principals:
66
• Who is providing ICT support to teachers and how much time is spent on these activities per
week?
• To what extent is technical support available for teachers who use ICT for new forms of teaching
and learning?
The technical support in nearly all of the systems was adequate and teachers knew that there was a
good support system in place. Many teachers and technical staff were efficiently trained to see to
some of the basic maintenance of the IT equipment. In South Africa, 41% of the technical support
came from the computer coordinators, 24% of teachers indicated that other ICT staff members
assisted them, 4% indicated that the school administrative staff helped them, 28% of the teachers said
that their colleagues supported them, 14% of the teachers got help from their learners, 3% were
assisted by external companies and 4% of the teachers indicated that other people assisted them.
The ICT equipment was available for a total of thirteen hours per week and each learner only had one
minute access time per week. The pedagogical support was not discussed in detail by the researcher,
but the pedagogical support for teachers in South Africa was less than 85% (Pelgrum, 2008b: 90-94)
3.4.10.4 Staff development
Professional development for teachers is an important part of enhancing the quality of education in
schools. It is an ongoing process, whereby the education department can ensure that quality teaching
and learning will take place (Reynolds et al., 2003: 159). During Sites 2006 the principals, as well as
the technology coordinators, were asked to list fifteen barriers preventing the school from realising its
pedagogical goals. The obstacle that dominated in all the systems was that teachers did not have
efficient ICT skills. Most education systems did not require their teachers to be trained for the
integrating of ICT in any form of teaching and learning. In Chinese Taipei, Denmark, Estonia, Hong
Kong, Lithuania, Moscow, Singapore and Slovenia courses on pedagogical issues relating to the
integration of ICT were available. Education systems like Alberta province, Canada, Chile, Finland,
Israel, Italy, Japan, Norway, South Africa and Thailand did not have access to pedagogical courses
relating to ICT integration. Many school principals did have ICT integration training and school leaders
should be competent handling educational innovations in schools (Pelgrum, 2008b: 95-101). Staff
development across all systems needs to take place in order to achieve the 21st Century skills.
3.4.10.5 Leadership development priorities
School principals must be equipped with the relevant academic knowledge and skills, management
skills as well as competencies regarding the use of ICT to ensure that the institution functions properly
and works toward achieving the 21st Century skills. Principals play an important role in managing and
initiating changes and growth within the school, and are solely responsible for creating a positive
school climate (Becta, 2002: 1-2). Unfortunately, many school principals do not have the sufficient
qualifications to perform the tasks to the best of their ability. Many school principals indicated the
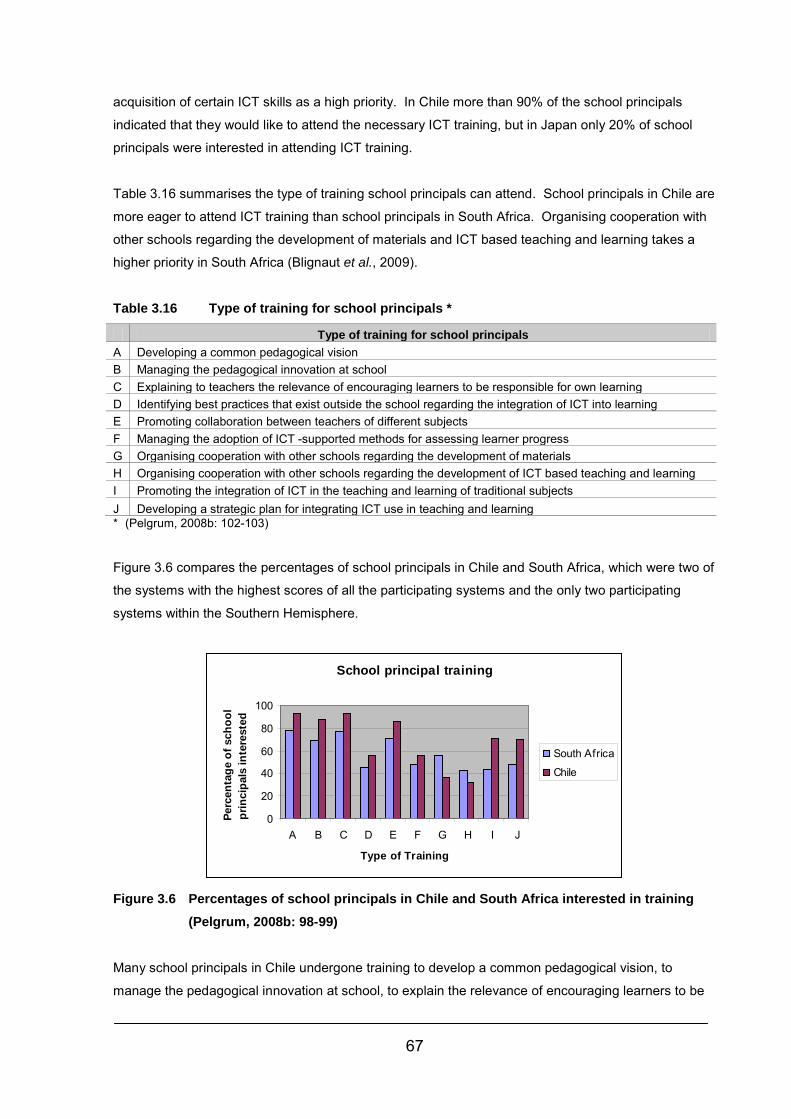
67
acquisition of certain ICT skills as a high priority. In Chile more than 90% of the school principals
indicated that they would like to attend the necessary ICT training, but in Japan only 20% of school
principals were interested in attending ICT training.
Table 3.16 summarises the type of training school principals can attend. School principals in Chile are
more eager to attend ICT training than school principals in South Africa. Organising cooperation with
other schools regarding the development of materials and ICT based teaching and learning takes a
higher priority in South Africa (Blignaut et al., 2009).
Table 3.16 Type of training for school principals *
Type of training for school principals A Developing a common pedagogical vision B Managing the pedagogical innovation at school C Explaining to teachers the relevance of encouraging learners to be responsible for own learning D Identifying best practices that exist outside the school regarding the integration of ICT into learning E Promoting collaboration between teachers of different subjects F Managing the adoption of ICT -supported methods for assessing learner progress G Organising cooperation with other schools regarding the development of materials H Organising cooperation with other schools regarding the development of ICT based teaching and learning I Promoting the integration of ICT in the teaching and learning of traditional subjects J Developing a strategic plan for integrating ICT use in teaching and learning * (Pelgrum, 2008b: 102-103)
Figure 3.6 compares the percentages of school principals in Chile and South Africa, which were two of
the systems with the highest scores of all the participating systems and the only two participating
systems within the Southern Hemisphere.
School principal training
0
20
40
60
80
100
A B C D E F G H I J
Type of Training
Perc
enta
ge o
f sch
ool
prin
cipa
ls in
tere
sted
South Africa
Chile
Figure 3.6 Percentages of school principals in Chile and South Africa interested in training
(Pelgrum, 2008b: 98-99)
Many school principals in Chile undergone training to develop a common pedagogical vision, to
manage the pedagogical innovation at school, to explain the relevance of encouraging learners to be
68
responsible for their own learning and promoting collaboration, which shows that they are
implementing their ICT policy and plan (Pelgrum, 2008b: 72-77&98-99).
3.4.10.6 Organisation and management of ICT in schools
The organisational and management aspects regarding the infrastructure and pedagogical use of ICT
are an integral part in ensuring the implementation and the development of ICT in the teaching and
learning as well as the wider school spectrum. Funds, academic programs, timetables, access to
resources and Websites, planning of activities, and training programs are some of the important facets
of the organisation and management of schools. Unfortunately the bulk of the 2010 South African
budget which amounted to R 165 billion with an additional R 2.7 billion, was allocated towards
Numeracy, Literacy and development and training of teachers, and not for ICT infrastructure and
resources (South Africa, 2010). The NDoE in South Africa has a structural academic program referred
to as the NCS from grade R to twelve, as well as an additional ICT policy known as the White Paper
on e-Education which all schools must adhered to, depending on the availability of infrastructure and
resources. All schools are required to develop timetables within the requirements set by the NDoE.
All schools and communities need to have access to websites. The training of teachers and the
broader community to raise the standard of educational is essential. Schools must plan ICT
collaboration activities well in advance to ensure the optimum time for activities is utilised and teachers
can monitor the whole implementation process. Providing all teachers with laptops is a dream many
systems would like to achieve, unfortunately not a realistic vision for many systems. A laptop initiative
was launched for teachers in South Africa in 2008, but in a recent notice by NAPTOSA (National
Professional Teachers’ Organisation of South Africa) there has been no notification of the purchasing
of laptops and training program. Regardless of the lack of ICT infrastructure and the declaration of the
laptop initiative the basic requirements regarding the organisational and management are vital in
ensuring effective functionality of the educational program and ICT integration.
School principals were given a list of eleven measures relating organization action: re-allocate
workload for collaborative planning, re-allocate workload for technical support, organizing demo-
workshops, review pedagogical approach of teachers, monitor implementation of change, new teacher
teams, change class schedules, incentive schemes, teacher collaboration with external experts, new
instructional methods to school newspaper and parents’ involvement in ICT related activites.
Re-allocating workload to allow for collaborative planning took place in more than 80% of schools in
Chile, Norway, Singapore and Thailand, but fewer were implemented in Estonia at only 43%, Finland
47% and France 30%. The results indicate that there were vast differences among education systems
for the remaining ten measures (Pelgrum, 2008b: 104-107). Many principals do not realise that the
organisation and management of ICT infrastructure and pedagogy will determine the quality and
success of ICT implementation in schools.
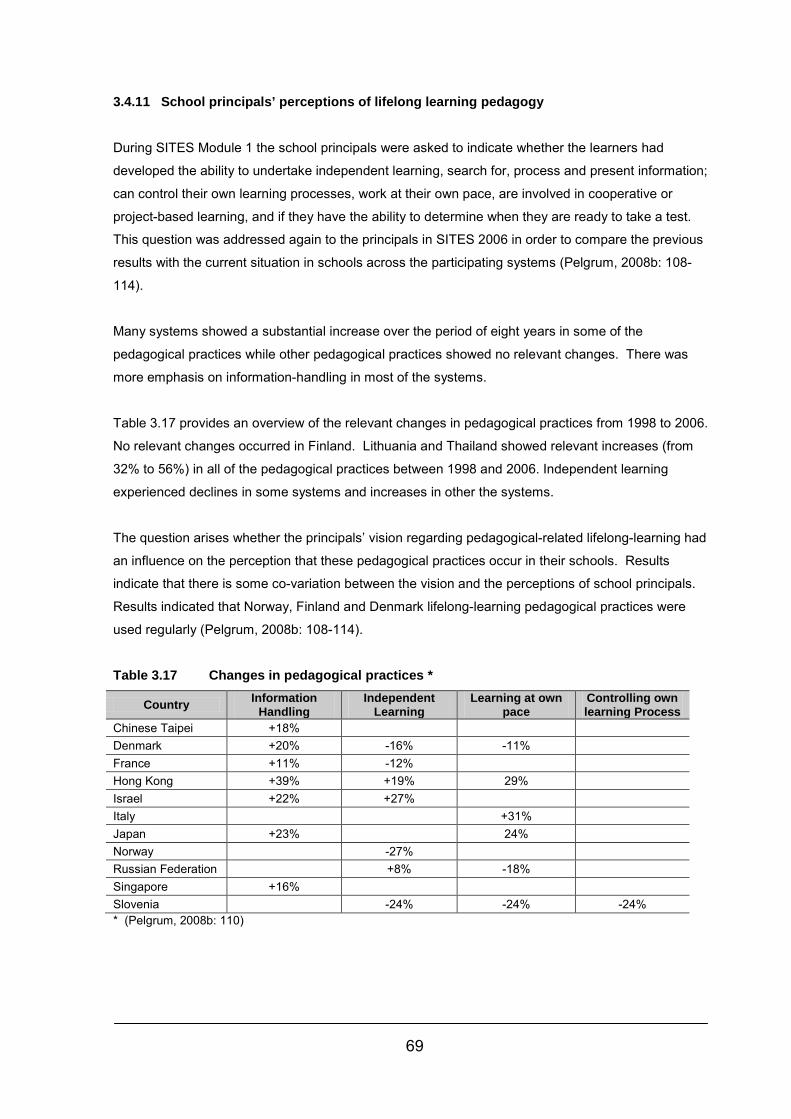
69
3.4.11 School principals’ perceptions of lifelong learning pedagogy During SITES Module 1 the school principals were asked to indicate whether the learners had
developed the ability to undertake independent learning, search for, process and present information;
can control their own learning processes, work at their own pace, are involved in cooperative or
project-based learning, and if they have the ability to determine when they are ready to take a test.
This question was addressed again to the principals in SITES 2006 in order to compare the previous
results with the current situation in schools across the participating systems (Pelgrum, 2008b: 108-
114).
Many systems showed a substantial increase over the period of eight years in some of the
pedagogical practices while other pedagogical practices showed no relevant changes. There was
more emphasis on information-handling in most of the systems.
Table 3.17 provides an overview of the relevant changes in pedagogical practices from 1998 to 2006.
No relevant changes occurred in Finland. Lithuania and Thailand showed relevant increases (from
32% to 56%) in all of the pedagogical practices between 1998 and 2006. Independent learning
experienced declines in some systems and increases in other the systems.
The question arises whether the principals’ vision regarding pedagogical-related lifelong-learning had
an influence on the perception that these pedagogical practices occur in their schools. Results
indicate that there is some co-variation between the vision and the perceptions of school principals.
Results indicated that Norway, Finland and Denmark lifelong-learning pedagogical practices were
used regularly (Pelgrum, 2008b: 108-114).
Table 3.17 Changes in pedagogical practices *
Country Information Handling
Independent Learning
Learning at own pace
Controlling own learning Process
Chinese Taipei +18% Denmark +20% -16% -11% France +11% -12% Hong Kong +39% +19% 29% Israel +22% +27% Italy +31% Japan +23% 24% Norway -27% Russian Federation +8% -18% Singapore +16% Slovenia -24% -24% -24% * (Pelgrum, 2008b: 110)
70
3.4.12 Conclusion and reflections on South Africa’s ICT pedagogical status
SITES 2006’ main purpose was to examine the pedagogical practices adopted by grade 8 teachers in
all the participating systems and the use of ICT in these practices. Contextual aspects incorporated
within the teaching and learning process were built into the different research tools in order to get a
global picture concerning general practices in schools, and whether adjustments within the systems
were made in order to promote 21st century skills. Most importantly, SITES 2006 wanted us to
understand the status of pedagogy, and the ICT-use in mathematics and science classrooms in all the
participating systems, and how these practices compare and differ across systems. Additionally, the
status of the different contextual factors at work in school and system-levels was addressed. It also
allowed the researchers to build models aimed at explaining how these different contextual factors
contribute or restrain the pedagogical use of ICT by teachers (Law, 2008: 263).
South Africa’s participation in this study gave all the role-players within the educational system an
opportunity to measure the countries’ status of pedagogy, the ICT-use in mathematics and science
classes, the contextual factors at school and system level compared to the rest of the participating
systems.
Even though the world is striving towards educational reform, many schools do not have the
equipment and the infrastructure to compete with the global society. The conditions at school level in
South Africa is one of the aspects that need to be addressed in order achieve equality with the rest of
the participating systems, especially those system that performed well in SITES 2006. South Africa
had the lowest availability of infrastructure at 38% in 2006 whereas other participating systems had
computer laboratories, 9% had computers in their libraries and (12%) had computers elsewhere on the
school premises. South Africa was the only participating system which did not have 100% access and
availability to ICT in schools.
Pedagogical and the technical support are definitely areas of concern as well. In South Africa, the
technical support came mainly from the computer coordinators at 41%, while 24% indicated that other
ICT staff members assisted them, 4% indicated that the school administrative staff helped them, 28%
of the teachers said that their colleagues supported them, 14% of the teachers got help from their
learners, 3% were assisted by external companies and 4% of the teachers indicated that other people
assisted them. Pedagogical support for teachers in South Africa was less than 85% (Pelgrum, 2008b:
90-94).
Staff development opportunities did not exist for training of ICT integration into the teaching and
learning process. Organising cooperation with other schools regarding the development of materials
and ICT based teaching and learning takes a higher priority in South Africa than in other countries,
and school principals were more eager to attend ICT training than the remaining participating systems.
71
In general, teachers in South Africa do not welcome change. The majority of teachers indicated that
they still prefer to use the traditional method of teaching as well as traditional goal orientations. Many
teachers only made use of ICT search for information. In South Africa in 1998 only 18% of schools
were using ICT and in 2006 it was 38% of the schools. Teachers in grade 8 Mathematics preferred to
make use of teacher lectures and exercises to practice skills and procedures. Even though a variety
of resources were available in many schools, mathematics teachers more frequently made use of
tutorial or exercise software. Even though there are many infrastructural shortages, the South African
teachers indicated an 80% and above average for learning products, reflection or collaboration, which
was higher than all the other participating systems.
The teachers mainly made use of ICT when they were looking up ideas and information, and for
extended projects. Regarding the rest of the teacher practice activities, the majority of the grade 8
Mathematics teachers did not make use of ICT. Many schools do have efficient ICT and
infrastructure, but they indicated a low level of confidence due to the fact that they did not know in
which teaching and learning situations to use ICT effectively. ICT usage in general in grade 8
encountered the lowest usage level in South Africa, which was only 18% for mathematics and 15.9%
for science.
Even though South Africa has an ICT policy in place and acknowledges that certain changes within
the systems need to take place, reform needs to starts at the foundation of education where teachers
play a fundamental role in the change and development process.
72
Chapter Four
Research Design and Methodology 4.1 Introduction The study followed a basic secondary data analysis (SDA) using the data of the stratified sample of
the 504 computer using and non-computer using schools in South Africa which participated in SITES
2006; specifically the data from the mathematics teachers’ questionnaire. This chapter outlines the
SDA research design and methodology used in this study, the nature of the dataset, ethical
considerations, the variables that were identified for correlation within SDA, and the statistical analysis
procedures in this SDA. SDA refers to the empirical exercise that uses original research questions
and data for the analyses of further questions in order to address specific research questions, using
either the same or different statistical procedures (Smith, 2008: 4). SDA aims at reanalysing such
data in order to test hypotheses or to validate models (Mouton, 2001: 153).
4.2 Secondary data analysis
The National Research Coordinators (NRC) (Law et al., 2008e: 289-293) from all participating
education systems in SITES 2006 used survey methodology as their approach to the international
comparative study. Three survey instruments: a teacher questionnaire (Addendum 4.1), a principal
questionnaire, and a technical questionnaire were developed in cooperation with the participating
countries. An additional national context questionnaire collected data on the policies that prevailed in
each country. The target population was grade 8 mathematics and science teachers, the school
principal and the ICT co-ordinator of randomly selected schools. In South Africa, a stratified sample of
504 non-computer using and computer using schools comprised the final sample prepared by the
Data Processing Centre, Hamburg, Germany (Law et al., 2008e: 26).
This investigation followed a basic SDA methodology that includes a scholarly review of the literature
(Smith, 2008: 4), as well as analyses of the South African data of SITES 2006. According to Barrett
(2006; 406), secondary data have already been collected by another organisation and the researcher
was not involved in the data collecting process. SDA focuses on specific problems through analysis
of existing data which were originally collected for another purpose (Glaser, 1963: 11; Mouton, 2001:
153), and uses original research questions and either numeric or non-numeric data for the analyses of
further questions in order to address specific research questions distinct from that dataset (Hewson,
2006: 274). It can use the same statistical procedures as the original study, or different ones. The
73
numeric empirical data can include population census, government surveys, other large scale surveys,
cohort and other longitudinal studies, other regular or continuous surveys and administrative records
(Smith, 2008: 4).
Conducting SDA are not always more objective than the data received using qualitative research
methods and mistakes which might have been visible in the original data can not be traced (Smith,
2008: 64-70).
The reason why many researchers choose SDA as the method of research is that there are significant
benefits of using SDA. Using SDA saves time and money, and allows an increased sample size from
the existing high quality primary data that are available from the organisation (Barrett, 2006: 406). The
researcher saves time in the designing process and no primary data need to be gathered. The SITES
2006 dataset is readily available and is considered of high quality. The SITES 2006 dataset
(Addendum 4.2) allows the researcher to explore different themes and correlations between variables
that were not calculated and reported by the main study, without any further data collection or
expenditure beyond SDA consultation services.
4.3 Study population for this secondary data analysis
The international SITES 2006 dataset comprises the combined data collected from the teachers’
questionnaire, technical questionnaire and a principals’ questionnaire of the 22 participating countries
and educational systems. For the purpose of this investigation, only the South African dataset for
grade 8 mathematics teachers who completed the teachers’ questionnaire will be used for the SDA.
This dataset comprises a total of 640 South African grade eight mathematics teachers (Howie et al.,
2009: 8). The gender distribution of the participating grade 8 mathematics teachers in South Africa
was well-balanced with 306 male and 334 female teachers (SITES, 2006a: 86).
4.4 Ethical consideration for SDA
The questionnaires and dataset of SITES 2006 are available in the public domain. Therefore, this
study acknowledges the source of data, as well as respect for the integrity of the dataset. No
identifiable information is available on the teachers or schools that participated in the main study and
therefore the research will adhere to all ethics of research already obtained during the main study. No
further ethical clearance was necessary.
74
4.5 Variables
A variable is any quality or characteristic in a research investigation that has two or more possible
values (Leedy et al., 2005: 218). For this study, the variables constituted the pedagogical use of ICTs
in the teaching and learning of mathematics. After intensive review of the questions in the teachers’
questionnaire, the researcher, in cooperation with the statistical consultation services of the North-
West University, will attempt to answer the second research question: to determine whether
knowledge of the pedagogical use of ICTs in grade 8 mathematics contributes towards more effective
mathematics teaching in schools, Question 21 J (from Part VII of the SITES 2006 Teachers’
questionnaire on the pedagogical use of ICT (I know in which teaching and learning situation to use
ICT). This research will be used as the main variable, then correlated with as many possible other
variables within the same teachers’ questionnaire, to answer the research question: To what extend
can knowledge of the pedagogical use of ICT’s in grade eight mathematics contribute towards more
effective mathematics teaching in schools?
4.6 Statistical procedures for SDA In order to address the first research question: What is the pedagogical use of ICTs for the teaching
and learning of grade eight mathematics in South African schools?, the frequency tables of the dataset
for mathematics teachers (Addendum 4.2) were used to identify how grade 8 mathematics teachers
use ICTs for teaching and learning. First of all, the dataset is used to analyse the mathematics
teachers’ general use of ICT and use of ICTs, i.e. word-processing, e-mail, electronic filing,
spreadsheet use for budgeting and administration, the use of Power Point presentations, ICT for
lesson planning and learner monitoring, ICTs to practise skills and procedures, ICTs to look up ideas
and information and process data, and how ICTs in general are used to reach curriculum goals.
Thereafter, the proportion of learners’ skills in mathematics classrooms in word-processing, database
software, spreadsheet, presentation software, application of multi-media, email, Internet, graphic
calculator and data-logging tools is analysed. Thirdly, the impact of ICT use is analysed, and fourthly
the obstacles of ICT use for teaching and learning are evaluated.
In order to address the second research question: To what extend can knowledge of the pedagogical
use of ICT’s in grade eight mathematics contribute toward more effective mathematics teaching in
schools?, descriptive statistics and cross tabulations are calculated. In many cases it is important to
know whether there is a relationship (correlation) between two variables. As already pointed out in
Section 4.5, to determine to what extend whether knowledge of the pedagogical use of ICTs in grade
8 mathematics contributes towards more effective mathematics teaching in schools (SITES 2006
Teachers’ Questionnaire, (Addendum 4.1) Part VII, Item 21J), is the main variable that is correlated
with other variables in order to answer the second research question. For random sampling, statistical
relationships (correlations) between variables are determined with Chi-square tests and effect sizes,
75
but what is imperative is whether the relationship is large enough to be important (Ellis et al., 2003: 4).
In such cases the statistical significance tests (e.g. Chi-square tests) are used to show that the result
is practically statistically significant. Chi-square X2 is a sampling distribution that gives probabilities
about frequencies (Spatz, 2008: 295). The kind of data is the characteristic that distinguishes Chi-
square from other techniques. For t-tests and ANOVA (analysis of variance), the data consist of a set
of scores such Intelligence Quotients (IQs), attitudes, time, errors, etc. Each subject has one
quantitative score. With Chi-square, however, the data are frequency counts in categories. Each
subject is observed and placed in one category. The frequencies of observations in categories are
counted and the Chi-square test is calculated from the frequency counts. Chi-square analysis
compares the observed frequencies of a category to frequencies that will be expected if the null
hypothesis is true (Spatz, 2008: 295). There is an effect size index for Chi-square problems that have
more than one degree of freedom. Both phi coefficient and Cramer’ v can be considered as effect
sizes. It was proposed by Harald Cramér and is referred to as Cramér ø, or Cramér V. A Cramér V <
0.3 is considered a small effect with no or very little practically significant correlation; 0.3 ≤ Cramér V ≤
0.4 is considered a medium effect that tends towards practically significant correlation; and Cramér V
≥ 0.5 is considered a large effect with practically significant correlation. The Statistical Consultation
Services of the North-West University assist in the cross tabulation analysis using SPSS® 16.0 for
Windows (SPSS, 2007: 141).
4.7 Summary
This is an SDA of the South African dataset for the grade 8 mathematics teachers who completed the
teachers’ questionnaire. A total of 666 South African grade 8 mathematics teachers, 49.4% male and
50.6% female, completed the teachers questionnaire (Howie et al., 2009: 8). No ethical clearance
was necessary because this is an SDA. In order to address the first research aim and to answer the
first research question: What is the pedagogical use of ICTs for the teaching and learning of grade 8
mathematics in South African schools?; the frequency tables of the dataset for mathematics teachers
are used to identify how grade eight mathematics teachers use ICTs for the teaching and learning. In
order to answer the second research question: To what extend can knowledge of the pedagogical use
of ICT’s in grade 8 mathematics contribute toward more effective mathematics teaching in schools?;
descriptive statistics and cross tabulations are calculated. Knowledge and confidence to suit ICTs to
different teaching and learning situations (SITES 2006 Teachers’ Questionnaire, Part VII, Item 21J), is
the main variable that is correlated with other variables using cross tabulation (Chi-square X2) and
effect size (Cramér V) in order to answer the second research question.
76
Chapter Five
Results and Discussion 5.1 Introduction This chapter addresses the research questions through the calculation of frequencies of the data from
the SITES 2006 mathematics Teachers’ Questionnaire. First it addresses the question: What is the
pedagogical use of ICTs for the teaching and learning of grade 8 mathematics in South African
schools? This includes the extent of ICT pedagogical practices of mathematics teachers, as well as
their perceptions of the value of ICT for mathematics education. In order to answer the second
research question: To what extend can knowledge of the pedagogical use of ICT’s in grade 8
mathematics contribute toward more effective mathematics teaching in schools?, descriptive statistics
and cross tabulations indicate how pedagogical knowledge of ICT impacts on the curriculum goals and
teacher practices. This section also includes how the availability of learning resources and
technological infrastructure influences pedagogical practices.
5.2 Pedagogical use of ICT in grade 8 mathematics classrooms in South African schools
The dataset of this study relates to the South African dataset from the international SITES 2006 main
study. Various frequencies were calculated to address this question. The SITES 2006 mathematics
teachers’ data frequencies comprised eight parts:
Part I information about the target class
Part II curriculum goals
Part III teacher practice
Part IV learner practice
Part V learning resources and technology infrastructure
Part VI impact of ICT use
Part VII information about schools
Part VIII specific pedagogical practice that use ICT (SITES, 2006c: 34-36).
To address the first research question, the results are discussed under the following themes: general
use of ICT; pedagogical use of ICT; learners’ competence with operating skills; impact of ICT; and
barriers of ICT use for teaching and learning.
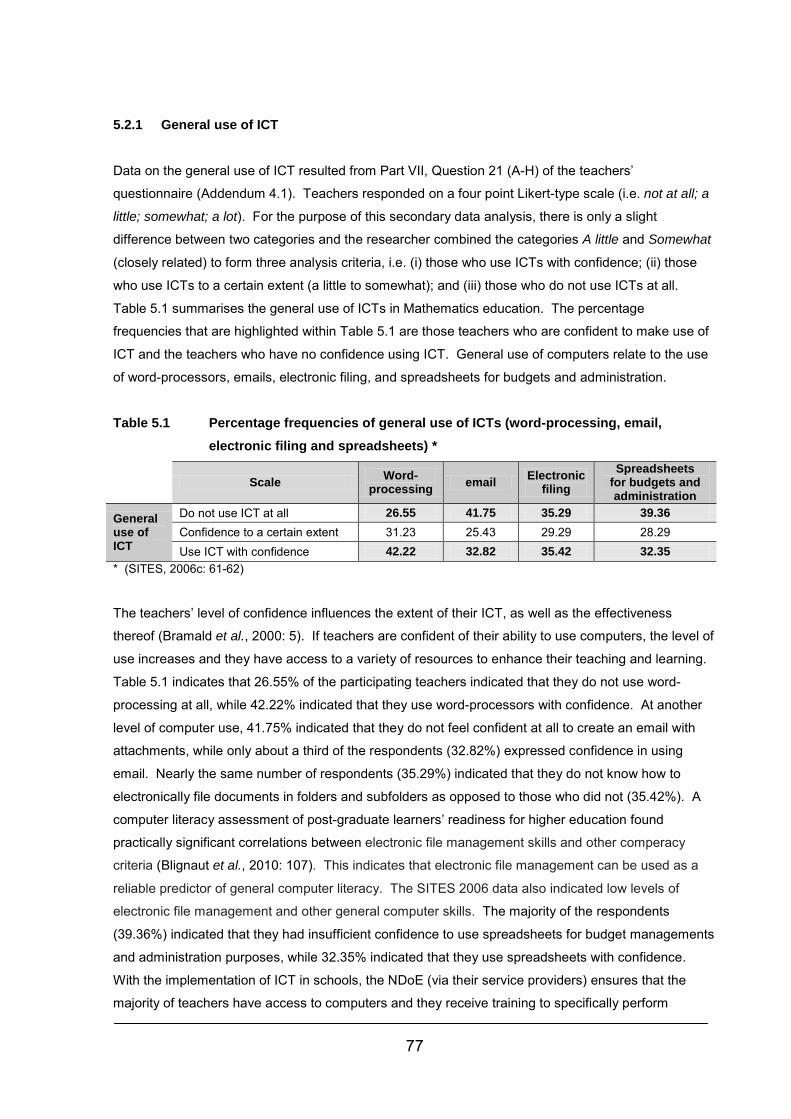
77
5.2.1 General use of ICT
Data on the general use of ICT resulted from Part VII, Question 21 (A-H) of the teachers’
questionnaire (Addendum 4.1). Teachers responded on a four point Likert-type scale (i.e. not at all; a
little; somewhat; a lot). For the purpose of this secondary data analysis, there is only a slight
difference between two categories and the researcher combined the categories A little and Somewhat
(closely related) to form three analysis criteria, i.e. (i) those who use ICTs with confidence; (ii) those
who use ICTs to a certain extent (a little to somewhat); and (iii) those who do not use ICTs at all.
Table 5.1 summarises the general use of ICTs in Mathematics education. The percentage
frequencies that are highlighted within Table 5.1 are those teachers who are confident to make use of
ICT and the teachers who have no confidence using ICT. General use of computers relate to the use
of word-processors, emails, electronic filing, and spreadsheets for budgets and administration.
Table 5.1 Percentage frequencies of general use of ICTs (word-processing, email, electronic filing and spreadsheets) *
Scale Word-
processing email Electronic filing
Spreadsheets for budgets and administration
General use of ICT
Do not use ICT at all 26.55 41.75 35.29 39.36 Confidence to a certain extent 31.23 25.43 29.29 28.29 Use ICT with confidence 42.22 32.82 35.42 32.35
* (SITES, 2006c: 61-62)
The teachers’ level of confidence influences the extent of their ICT, as well as the effectiveness
thereof (Bramald et al., 2000: 5). If teachers are confident of their ability to use computers, the level of
use increases and they have access to a variety of resources to enhance their teaching and learning.
Table 5.1 indicates that 26.55% of the participating teachers indicated that they do not use word-
processing at all, while 42.22% indicated that they use word-processors with confidence. At another
level of computer use, 41.75% indicated that they do not feel confident at all to create an email with
attachments, while only about a third of the respondents (32.82%) expressed confidence in using
email. Nearly the same number of respondents (35.29%) indicated that they do not know how to
electronically file documents in folders and subfolders as opposed to those who did not (35.42%). A
computer literacy assessment of post-graduate learners’ readiness for higher education found
practically significant correlations between electronic file management skills and other comperacy
criteria (Blignaut et al., 2010: 107). This indicates that electronic file management can be used as a
reliable predictor of general computer literacy. The SITES 2006 data also indicated low levels of
electronic file management and other general computer skills. The majority of the respondents
(39.36%) indicated that they had insufficient confidence to use spreadsheets for budget managements
and administration purposes, while 32.35% indicated that they use spreadsheets with confidence.
With the implementation of ICT in schools, the NDoE (via their service providers) ensures that the
majority of teachers have access to computers and they receive training to specifically perform
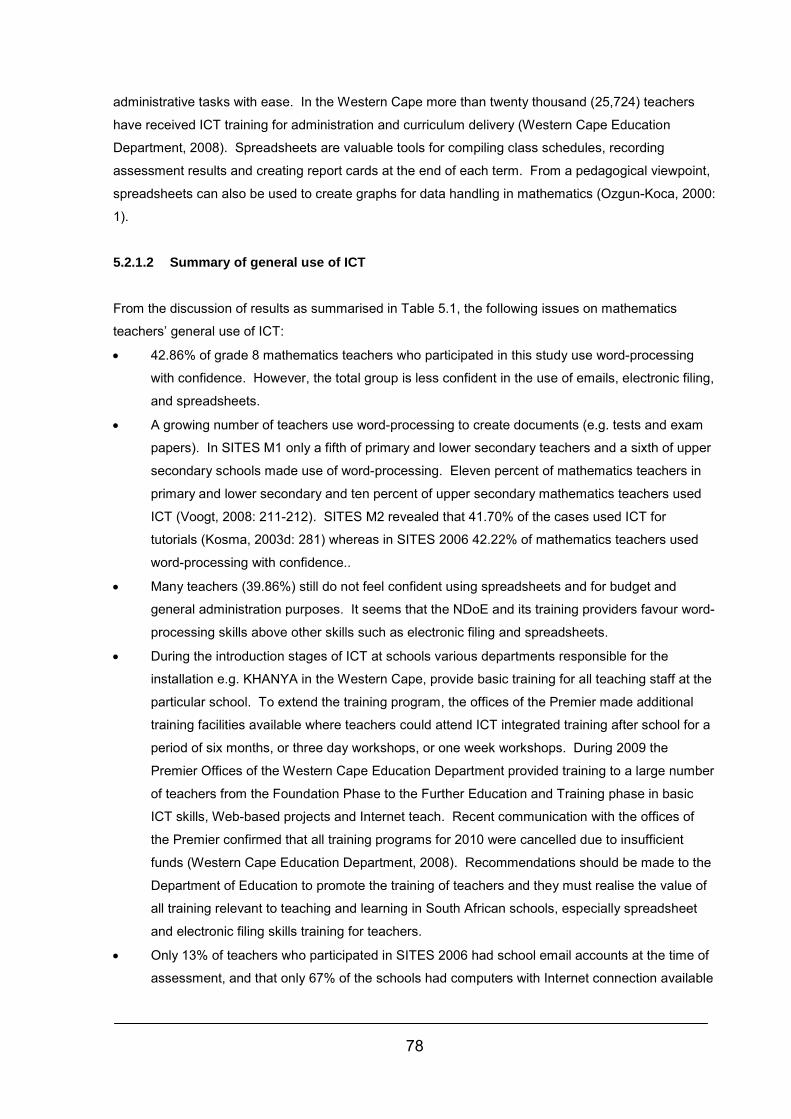
78
administrative tasks with ease. In the Western Cape more than twenty thousand (25,724) teachers
have received ICT training for administration and curriculum delivery (Western Cape Education
Department, 2008). Spreadsheets are valuable tools for compiling class schedules, recording
assessment results and creating report cards at the end of each term. From a pedagogical viewpoint,
spreadsheets can also be used to create graphs for data handling in mathematics (Ozgun-Koca, 2000:
1).
5.2.1.2 Summary of general use of ICT
From the discussion of results as summarised in Table 5.1, the following issues on mathematics
teachers’ general use of ICT:
• 42.86% of grade 8 mathematics teachers who participated in this study use word-processing
with confidence. However, the total group is less confident in the use of emails, electronic filing,
and spreadsheets.
• A growing number of teachers use word-processing to create documents (e.g. tests and exam
papers). In SITES M1 only a fifth of primary and lower secondary teachers and a sixth of upper
secondary schools made use of word-processing. Eleven percent of mathematics teachers in
primary and lower secondary and ten percent of upper secondary mathematics teachers used
ICT (Voogt, 2008: 211-212). SITES M2 revealed that 41.70% of the cases used ICT for
tutorials (Kosma, 2003d: 281) whereas in SITES 2006 42.22% of mathematics teachers used
word-processing with confidence..
• Many teachers (39.86%) still do not feel confident using spreadsheets and for budget and
general administration purposes. It seems that the NDoE and its training providers favour word-
processing skills above other skills such as electronic filing and spreadsheets.
• During the introduction stages of ICT at schools various departments responsible for the
installation e.g. KHANYA in the Western Cape, provide basic training for all teaching staff at the
particular school. To extend the training program, the offices of the Premier made additional
training facilities available where teachers could attend ICT integrated training after school for a
period of six months, or three day workshops, or one week workshops. During 2009 the
Premier Offices of the Western Cape Education Department provided training to a large number
of teachers from the Foundation Phase to the Further Education and Training phase in basic
ICT skills, Web-based projects and Internet teach. Recent communication with the offices of
the Premier confirmed that all training programs for 2010 were cancelled due to insufficient
funds (Western Cape Education Department, 2008). Recommendations should be made to the
Department of Education to promote the training of teachers and they must realise the value of
all training relevant to teaching and learning in South African schools, especially spreadsheet
and electronic filing skills training for teachers.
• Only 13% of teachers who participated in SITES 2006 had school email accounts at the time of
assessment, and that only 67% of the schools had computers with Internet connection available
79
for teachers. Insufficient access may account for the mathematics teachers’ low confidence and
skill in email use (SITES, 2006d).
5.2.2 The pedagogical use of ICT
The pedagogical use of ICT for mathematics teachers relates to Part VII Question 21 (I-P) of the
teachers’ questionnaire from SITES 2006 (Addendum 4.1). Teachers responded on a four point
Likert-type scale (i.e. not at all; a little; somewhat; a lot). Again, the researcher combined the
categories as there is not a noticeable difference between the two categories: A little and Somewhat
(closely related) to form three analysis criteria, i.e (i) those who use ICTs with confidence (a lot); (ii)
those who use ICTs to a certain extent (a little to somewhat); and (iii) those who do not use ICTs at all.
Table 5.2 shows the grade 8 mathematics teachers’ confidence about their pedagogical use of ICTs.
The percentage frequencies highlighted indicate how many teachers lacked confidence to make use
of ICT’s for some of the basic ICT skills for teaching and learning and the small percentage of
teachers who can use ICT’s with confidence.
Table 5.2 Percentage frequencies confidence for the pedagogical use of ICTs * Pedagogical use of ICT: Knowledge of … Not at all (%) Sometimes (%) A lot (%) Preparing lesson using ICT 52.87 31.82 15.31 Using ICT in teaching and learning 48.96 36.67 14.37 Finding curriculum resources (via Internet) 46.02 30.30 23.67 Monitoring learners’ progress with ICT 52.59 30.86 16.54 Using ICT for effective presentations or demonstrations 51.18 32.60 16.22 Using ICT for collaboration with others 53.00 31.07 15.93 Installing educational software 51.06 27.68 21.27 Using the Internet to support learners’ learning 52.21 28.55 19.23 * (SITES, 2006a: 64-66)
Lesson preparation is a daily chore for all teachers and using a word-processor saves much time.
Although only 42.22% grade 8 mathematics teachers from the study use word-processing with
confidence (Table 5.1), the majority (52.87%) indicated that they were unable to use ICTs in the
preparation of lessons (Table 5.2). Only 15.31% teachers indicated that they used ICTs with
confidence to prepare lessons with confidence (SITES, 2006a: 64-66).
Almost half of the respondents (48.96%) indicated that they have no confidence to assess the
principal use of ICTs in different teaching and learning scenarios. It is unfortunate that only 14.37% of
the respondents have the confidence and knowledge to integrate ICTs in different learning situations.
The Internet provides many curriculum resources for teachers to support their pedagogical practices.
Examples of valuable Internet resources for grade 8 mathematics include: Think Quest (real life
geometry), Building Big (interactive laboratories and challenges of building big and figuring out how
geometry is used in building big structures), Symmetry and Pattern (the art of oriental carpets) and Dr
Maths (mathematics practices and games as well and online tutor facilities) (Ittechno, 2010).
However, 46.02% of the respondents indicated that they do not know where to find curriculum
resources using ICTs (e.g. via the Internet); while a mere 23.67% indicated that they are confident to
80
search for curriculum resources on the Internet, despite the fact that free curriculum-based resources
(e.g. the NDoE, Thutong Portal, available at http://www.thutong.doe.gov.za) are available to teachers.
Only 27.72% of the mathematics teachers indicated that they had already completed an introductory
course for Internet use and general applications (e.g. basic word-processing, spreadsheets, etc.),
while only 8.26% indicated they had completed an advanced course in Internet use and web-
development (SITES, 2006a).
The National Policy on Assessment and Qualifications for Schools in the General Education and
Training Band (South Africa, 2004a: 9) states that reporting should take place at least once a term,
and informal or daily assessment should be done through observations, discussions and informal
classroom discussions (South Africa, 2004a: 7). Regular electronic monitoring of learners’ progress
will assist teachers when they finalise assessments at the end of each term. Table 5.1 indicates that
about 39.36% of teachers do not make use of spreadsheets for administrative purposes, while Table
5.2 shows that more than half of the respondents (52.59%) do not use ICTs to monitor their learners’
progress with readily available tools such as spreadsheets. This indicates that many teachers still
record their marks manually and do not make use of electronic tools for planning. They waste a lot of
time by repeating the same tasks instead of creating interesting lessons for their learners. Many
existing spreadsheet templates are available that can be easily adapted. The use of macros
accelerates the compilation of graphs that illustrate and monitor learners’ progress (Ozgun-Koca,
2000).
It is essential to use visual aids in the transfer of certain mathematical concepts, e.g. mathematical
patterns to illustrate certain patterns in nature (Galloway, 2007: 66). More than half of the
respondents (52.59%) were unable to create effective presentations with ICT’s. Only 16.22% of the
respondents indicated that they were able to use ICTs for effective presentational and explanatory
purposes. In addition, installing simple educational software on computers posed difficulties for more
than half of the respondents (51.06%). Subject specific educational software is often necessary to
complement and enhance presentations to augment difficult concepts. Teachers who cannot install
educational software cannot expose their learners to optimal learning opportunities to achieve the
learning outcomes best.
Teachers should communicate with their peers, share information and ideas on teaching mathematical
concepts or clearing away uncertainties. More than half of the respondents (53.00%) could not use
ICT to collaborate with their colleagues at their schools, or schools in their districts. It is disheartening
that only 15.93% of teachers were able to communicate via ICTs as email has become the business
communication method of choice. One should consider that only 13% of teachers who participated in
the SITES 2006 had e-mail accounts at their schools, and that only 67% of the schools had computers
with an Internet connection (SITES, 2006d). Insufficient ICT infrastructure and professional training,
as well as technophobia, possibly accounts for why only 15.93% of mathematics teachers use e-mails
for communication and networking (Els et al., 2009).
81
Teachers should have a variety of resources at their disposal to create a rich and authentic learning
environment. However, the majority of the respondents (52.21%) did not use the Internet to support
their learners’ learning. Only 19.23% were confident to use the Internet to search for resources to
assist their learners in their learning. This indicates that teachers struggle to provide rich learning
environment, especially in the light of the demise of school libraries. Outcomes-Based Education’s
(OBE) principal focus is quality education where learners will engage in lifelong learning experiences,
be numerate and be successful at the end of each learning activity. ICTs can greatly assist in this
regard (South Africa, 2008: 2).
5.2.2.1 Summary of the confident pedagogical use of ICT
From the discussion of results as summarised in Table 5.2 the following issues on the pedagogical
use of ICT:
• The majority of grade 8 mathematics teachers have no confidence knowing in which teaching and
learning situation to use ICT. They reflect insufficient confidence to use ICT to prepare lessons
adequately.
• Finding curriculum resources on the Internet, monitoring learners’ progresses, as well as the
ability to do presentations and explanations with ICTs, are problematic.
• The majority of the respondents were not confident in the pedagogical use of ICT and only a
small percentage of them make use of ICTs in planning, monitoring, supporting and conducting
pedagogical activities.
5.2.3 Learners’ competence with operating skills Issues regarding learners’ basic operating skills were addressed in Part I Question 7 (A-I) of the
teachers’ questionnaire, which used a five point Likert-type response (i.e. nearly none; some learners;
majority of the learners; nearly all the learners; don’t know). For the purpose of this secondary data
analysis the researcher combined the frequencies for the majority of the learners and nearly all
learners because they are closely related and there is no noticeable difference between these two
indicators. Table 5.3 summarises the learners’ competence in operating the computer. The
highlighted percentages indicate how many learners has no basic ICT skills and the small percentages
of learners possessing basic ICT skills.
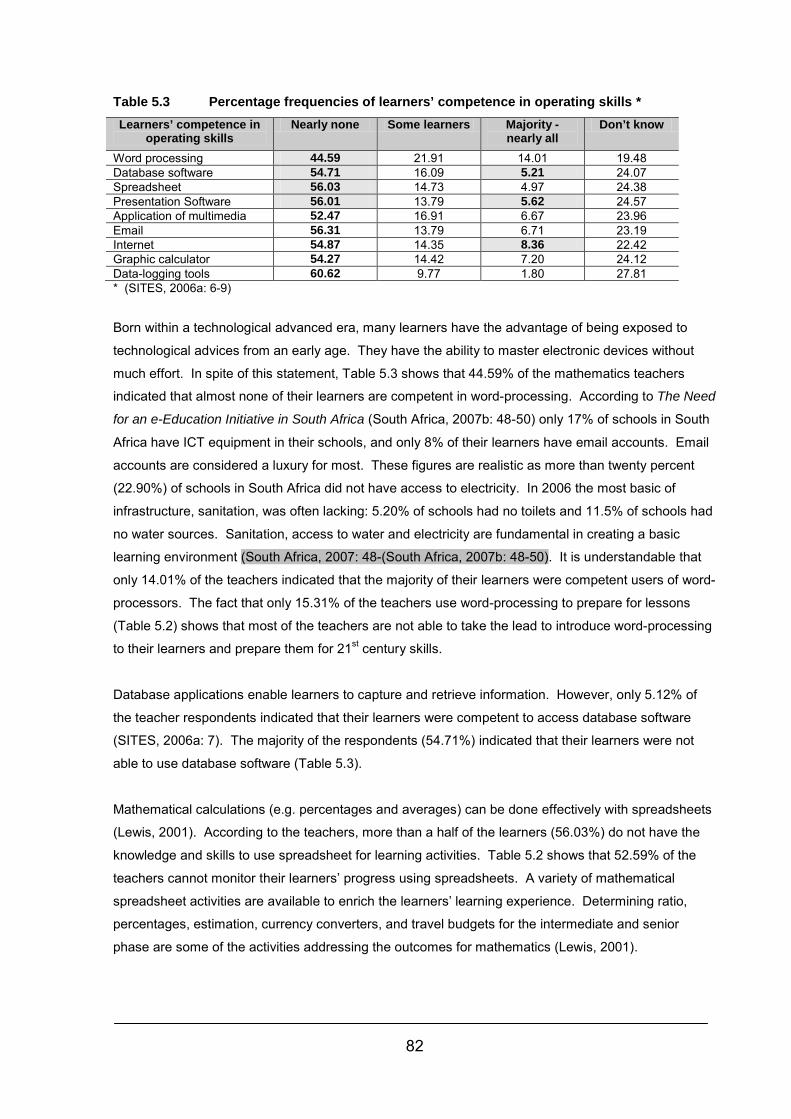
82
Table 5.3 Percentage frequencies of learners’ competence in operating skills * Learners’ competence in
operating skills Nearly none Some learners Majority -
nearly all Don’t know
Word processing 44.59 21.91 14.01 19.48 Database software 54.71 16.09 5.21 24.07 Spreadsheet 56.03 14.73 4.97 24.38 Presentation Software 56.01 13.79 5.62 24.57 Application of multimedia 52.47 16.91 6.67 23.96 Email 56.31 13.79 6.71 23.19 Internet 54.87 14.35 8.36 22.42 Graphic calculator 54.27 14.42 7.20 24.12 Data-logging tools 60.62 9.77 1.80 27.81 * (SITES, 2006a: 6-9)
Born within a technological advanced era, many learners have the advantage of being exposed to
technological advices from an early age. They have the ability to master electronic devices without
much effort. In spite of this statement, Table 5.3 shows that 44.59% of the mathematics teachers
indicated that almost none of their learners are competent in word-processing. According to The Need
for an e-Education Initiative in South Africa (South Africa, 2007b: 48-50) only 17% of schools in South
Africa have ICT equipment in their schools, and only 8% of their learners have email accounts. Email
accounts are considered a luxury for most. These figures are realistic as more than twenty percent
(22.90%) of schools in South Africa did not have access to electricity. In 2006 the most basic of
infrastructure, sanitation, was often lacking: 5.20% of schools had no toilets and 11.5% of schools had
no water sources. Sanitation, access to water and electricity are fundamental in creating a basic
learning environment (South Africa, 2007: 48-(South Africa, 2007b: 48-50). It is understandable that
only 14.01% of the teachers indicated that the majority of their learners were competent users of word-
processors. The fact that only 15.31% of the teachers use word-processing to prepare for lessons
(Table 5.2) shows that most of the teachers are not able to take the lead to introduce word-processing
to their learners and prepare them for 21st century skills.
Database applications enable learners to capture and retrieve information. However, only 5.12% of
the teacher respondents indicated that their learners were competent to access database software
(SITES, 2006a: 7). The majority of the respondents (54.71%) indicated that their learners were not
able to use database software (Table 5.3).
Mathematical calculations (e.g. percentages and averages) can be done effectively with spreadsheets
(Lewis, 2001). According to the teachers, more than a half of the learners (56.03%) do not have the
knowledge and skills to use spreadsheet for learning activities. Table 5.2 shows that 52.59% of the
teachers cannot monitor their learners’ progress using spreadsheets. A variety of mathematical
spreadsheet activities are available to enrich the learners’ learning experience. Determining ratio,
percentages, estimation, currency converters, and travel budgets for the intermediate and senior
phase are some of the activities addressing the outcomes for mathematics (Lewis, 2001).
83
Presentation software can be used to address many learning outcomes and assessment standards in
mathematics, e.g. concepts relating to shapes and space. Learners can use the presentation software
to demonstrate how various shapes can be used to create a structure (Cooper et al., 1996: 34-36).
Despite the value that presentation software can add to teaching and learning, only 5.62% of the
respondents indicated that their learners have the ability and opportunity to use presentation software
for activities and projects. More than fifty percent of the respondents (56.01%) indicated that none of
the learners are competent to use presentation software (SITES, 2006a: 8). In addition, Table 5.2
indicates that only 16.22% of the mathematics teachers are able to use presentation software for
teaching and learning purposes themselves. Learners will not be exposed to presentational software
and gain new skills as long as teachers are incompetent and afraid to use presentational software for
pedagogy. This indicates that even though presentational software can enhance the teaching and
learning of mathematics many teachers and learners do not have the skills to take advantage of the
equipment at their disposal.
Email is one of the most affordable methods of communication outside the classroom for teachers and
learners. The NDoE informs teachers, learners and principals on any changes and future events via
email. At the time of data collection, a little more than fifty percent (56.31%) of the respondents
indicated that nearly none of their learners were competent in email use; and only 8.36% indicated
that most of their learners were competent in emails (Table 5.3).
Intel® Teach (SchoolNet, 2008), an initiative by SchoolNet South Africa, is used by many education
systems throughout the world. It is mostly project based teaching in collaboration with the Internet to
search for information regarding the topic. Additionally, Wiki’s and Blogs support communication
between teachers and learners. Information regarding their projects will be in the Wiki especially
created by the teacher for that specific project. Learners can access the project blog if they have any
questions regarding their project. In most schools Internet access is available for teachers and
learners (under supervision) when they search information for projects. Unfortunately, 54.87% of the
mathematics teachers indicated that nearly none of their learners are competent in operating the
Internet and only 8.36% indicated that most of their learners could use the Internet competently.
The graphic calculator is a mathematical tool that can be attached to computers to assist learners in
calculating difficult sums and concepts like quadrants, x and y ratios (Jarred, 1998: 19). However, in
Table 5.3 only 7.20% of the respondents indicated nearly all of their learners were competent in using
graphic calculator tools, and 54.27% of the respondents indicated that nearly none of their learners
could use graphical calculators. In addition, more than half of the respondents (60.62%) in Table 5.3
indicated that nearly none of their learners were competent in operating data-logging tools, and only
1.80% indicated that nearly all of their learners were competent to operate data-logging tools (Els et
al., 2009). For the above exposition of the SITES data, it can be concluded that most South African
learners are not ready for 21st century learning skills where the use of ICT tools assists higher order
thinking skills.
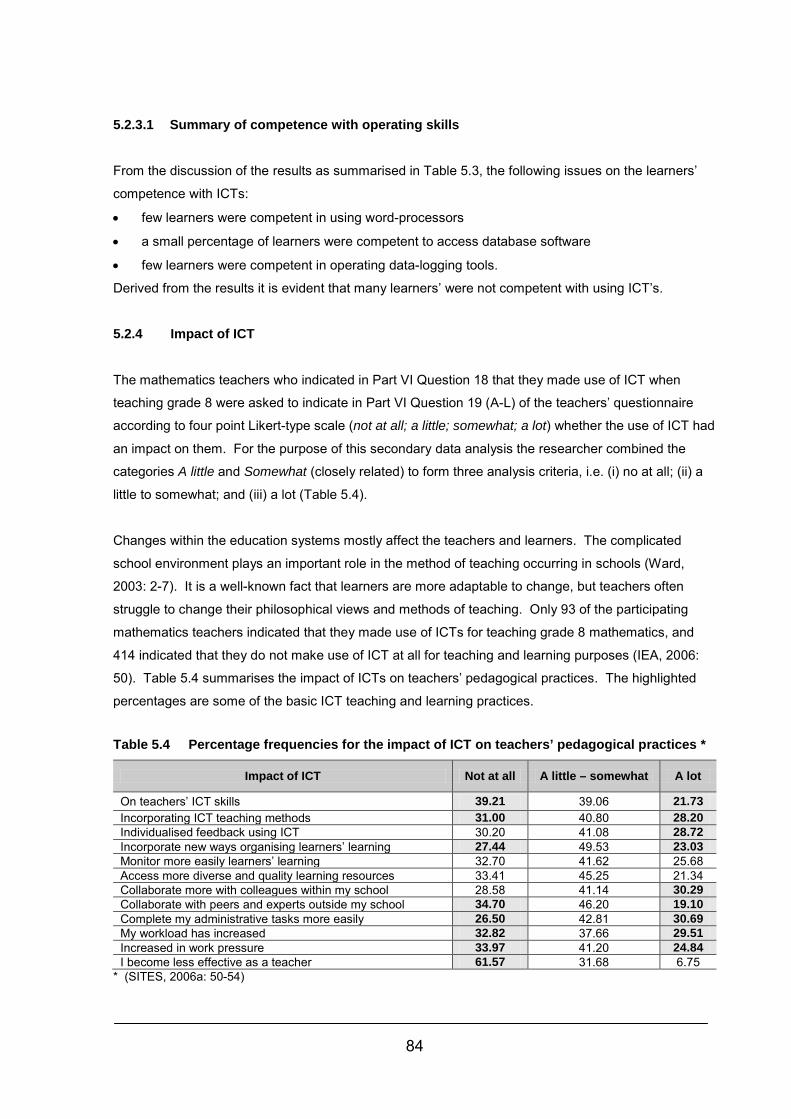
84
5.2.3.1 Summary of competence with operating skills
From the discussion of the results as summarised in Table 5.3, the following issues on the learners’
competence with ICTs:
• few learners were competent in using word-processors
• a small percentage of learners were competent to access database software
• few learners were competent in operating data-logging tools.
Derived from the results it is evident that many learners’ were not competent with using ICT’s.
5.2.4 Impact of ICT
The mathematics teachers who indicated in Part VI Question 18 that they made use of ICT when
teaching grade 8 were asked to indicate in Part VI Question 19 (A-L) of the teachers’ questionnaire
according to four point Likert-type scale (not at all; a little; somewhat; a lot) whether the use of ICT had
an impact on them. For the purpose of this secondary data analysis the researcher combined the
categories A little and Somewhat (closely related) to form three analysis criteria, i.e. (i) no at all; (ii) a
little to somewhat; and (iii) a lot (Table 5.4).
Changes within the education systems mostly affect the teachers and learners. The complicated
school environment plays an important role in the method of teaching occurring in schools (Ward,
2003: 2-7). It is a well-known fact that learners are more adaptable to change, but teachers often
struggle to change their philosophical views and methods of teaching. Only 93 of the participating
mathematics teachers indicated that they made use of ICTs for teaching grade 8 mathematics, and
414 indicated that they do not make use of ICT at all for teaching and learning purposes (IEA, 2006:
50). Table 5.4 summarises the impact of ICTs on teachers’ pedagogical practices. The highlighted
percentages are some of the basic ICT teaching and learning practices.
Table 5.4 Percentage frequencies for the impact of ICT on teachers’ pedagogical practices *
Impact of ICT Not at all A little – somewhat A lot
On teachers’ ICT skills 39.21 39.06 21.73 Incorporating ICT teaching methods 31.00 40.80 28.20 Individualised feedback using ICT 30.20 41.08 28.72 Incorporate new ways organising learners’ learning 27.44 49.53 23.03 Monitor more easily learners’ learning 32.70 41.62 25.68 Access more diverse and quality learning resources 33.41 45.25 21.34 Collaborate more with colleagues within my school 28.58 41.14 30.29 Collaborate with peers and experts outside my school 34.70 46.20 19.10 Complete my administrative tasks more easily 26.50 42.81 30.69 My workload has increased 32.82 37.66 29.51 Increased in work pressure 33.97 41.20 24.84 I become less effective as a teacher 61.57 31.68 6.75
* (SITES, 2006a: 50-54)
85
Mastering the use of ICT equipment will occur when one constantly explores its functions and abilities
(Kolderie et al., 2009: 7). Teachers’ ICT skills will improve if they optimally make use of ICTs for
teaching and learning. As shown in Table 5.4, about a fifth (21.73%) of the respondents indicated a
change within their ICT skills, but 39.21% indicated no transformation in their abilities to operate ICTs.
When teachers start integrating ICT into their teaching and learning, they have insufficient confidence
and knowledge. However, multiple mathematics software is available to assist them with the
integration process (Cooper et al., 1996: 34). About the same number of teachers indicated that they
do not use ICTs to incorporate new teaching methods (31%) as those who tried ICTs in collaboration
with various new instruction methods (28.20%).
Providing learners with individualised feedback regarding their progress will give them an indication in
which areas they needs to improve. Using ICT to give progress reports to the learners will allow them
to access their results at any convenient time. Only 28.72% of the respondents indicated that they
made use of ICT to provide feedback to their learners. As indicated in Table 5.2 more than fifty
percent (52.59%) of the respondents did not make use of ICT to monitor their learners’ progress,
therefore the chances of them providing individualised feedback to their learners are slim. Changes in
teaching practices can be overwhelming if not done systematically (Jarred, 1998: 6). According to
Table 5.4, 49.53% of the mathematics teachers indicated that they started to use ICT to incorporate
new ways to organise their learners’ learning. Unfortunately, only 23.03% regularly made use of ICT
to incorporate various methods to organise their learners’ learning. Even though 27.44% of the
respondents indicated that ICT did not have an impact on the way in which they organised their
learners learning, many are starting to use ICT (SITES, 2006a: 50-54).
Many teachers are faced with a massive workload and extramural activities each day. Therefore, it is
not always possible for teachers to regularly communicate with their colleagues. Using ICT to keep in
touch and share ideas would be the most convenient alternative method of communication for
teachers (Bramald et al., 2000: 6). A total of 30.29% of the respondents indicated that ICTs impact on
collaboration with colleagues within their schools. About forty percent of the respondents (41.14%)
said that they also make use of ICT to communicate with their colleagues to a certain extent.
Teachers are less likely to interact with people outside their schools than with those they have built a
working relationship with over a long time. Therefore, the decline in communication with peers outside
their school is understandable. Only 19.10% of the respondents indicated they regularly share ideas
and information with peers outside their schools, while 34.70% indicated that they never communicate
with peers outside their own schools (SITES, 2006b). Building networks with other teachers within the
same district will help teachers develop their ICT knowledge and increase their confidence.
Administration is an integrated part of teaching and the less time spent on doing these time consuming
tasks the more time could be spent on actually teaching and preparing learners to take their rightful
place within society. Teachers spend many hours on administrative duties as the last review of
86
curricula showed (Twiner et al., 2007: 141). Repetition occurs when teachers initially do their work
manually, and afterwards convey it to a computer. Nearly thirty percent (26.50%) of the respondents
indicated that ICT did not impact on their administrative tasks, while 30.69% indicated that ICT had a
massive impact on their ability to complete their administrative tasks more easily.
About thirty percent of the mathematics teachers indicated that their workload has not increased
(32.89%) after they started to make use of ICTs; and 33.97% indicated that the use of ICTs has not
increased their work pressure. A total of 29.51% of the respondents indicated that the use of ICTs has
increased their workload much; and 24.84% indicated that the use of ICTs has had a negative impact
on the amount of pressure at work. It is important that only small portions of the new curriculum be
tackled and mastered at once. About sixty percent of respondents (61.57%) indicated that ICTs had
no impact on them becoming less effective as a teacher.
5.2.4.1 Summary of the impact of ICTs on teachers
The following issues regarding the impact of ICTs on teachers were evident from the discussion in
Table 5.4:
• many teachers indicated no change to their abilities to operate ICTs
• teachers still lack confidence and knowledge with regard to integrating ICT into their teaching and
learning even though many kinds of mathematics software are available (e.g. edutainment
software) to assist them with the integration process (Cooper et al., 1996: 34)
• more than fifty percent of the respondents did not make use of ICT to monitor their learners’
progress
• ICTs had no impact on them becoming less effective as teachers, therefore they acknowledge
that ICT had no negative effect on their teaching
• few teachers regularly shared ideas and information with peers outside their schools.
The integration of ICT’s in the teaching and learning of mathematics holds many challenges for
teachers and implementing ICT’s will have an impact on the teachers’ use thereof.
5.2.5 Barriers of ICT use for teaching and learning
The barriers mathematics teachers experienced were addressed in the teachers’ questionnaire Part
VII question 23 (A-L). Teachers were asked to answer yes or no to specific statements. Table 5.5
shows the many barriers teachers are faced with when integrating ICTs in the teaching and learning
process. The percentage frequencies highlighted are some most important findings regarding the
barriers relating to teaching practices in schools.
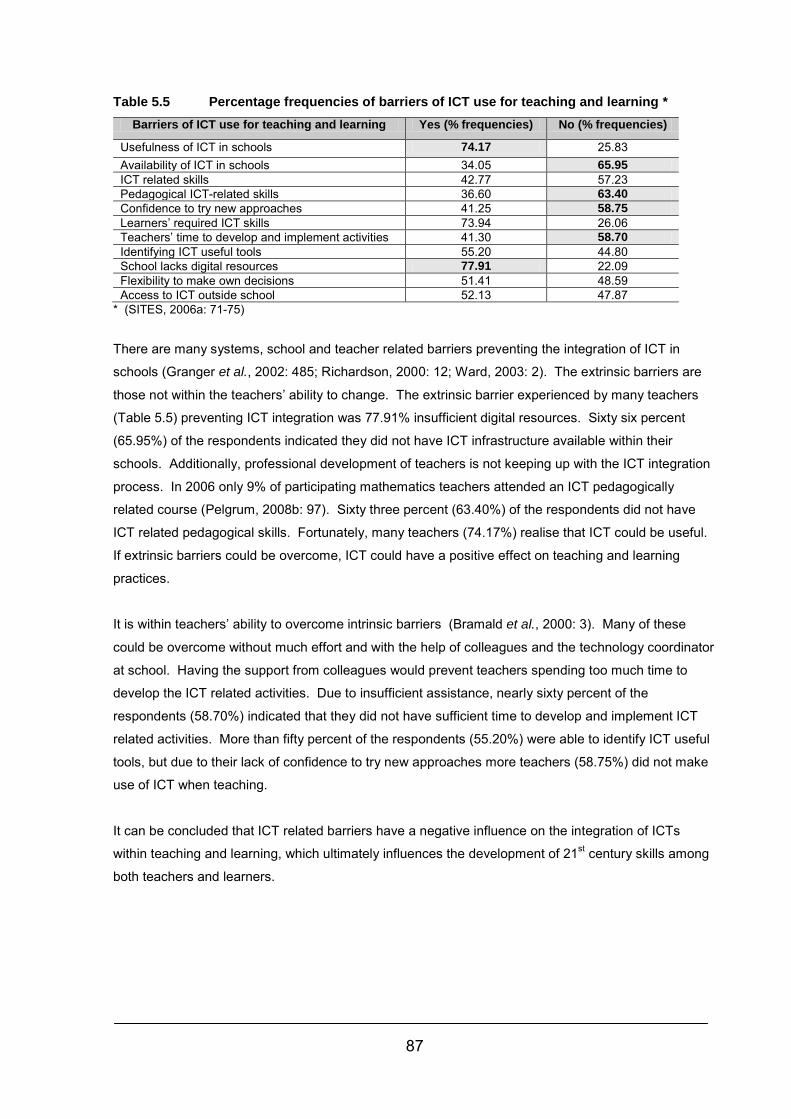
87
Table 5.5 Percentage frequencies of barriers of ICT use for teaching and learning * Barriers of ICT use for teaching and learning Yes (% frequencies) No (% frequencies)
Usefulness of ICT in schools 74.17 25.83 Availability of ICT in schools 34.05 65.95 ICT related skills 42.77 57.23 Pedagogical ICT-related skills 36.60 63.40 Confidence to try new approaches 41.25 58.75 Learners’ required ICT skills 73.94 26.06 Teachers’ time to develop and implement activities 41.30 58.70 Identifying ICT useful tools 55.20 44.80 School lacks digital resources 77.91 22.09 Flexibility to make own decisions 51.41 48.59 Access to ICT outside school 52.13 47.87
* (SITES, 2006a: 71-75)
There are many systems, school and teacher related barriers preventing the integration of ICT in
schools (Granger et al., 2002: 485; Richardson, 2000: 12; Ward, 2003: 2). The extrinsic barriers are
those not within the teachers’ ability to change. The extrinsic barrier experienced by many teachers
(Table 5.5) preventing ICT integration was 77.91% insufficient digital resources. Sixty six percent
(65.95%) of the respondents indicated they did not have ICT infrastructure available within their
schools. Additionally, professional development of teachers is not keeping up with the ICT integration
process. In 2006 only 9% of participating mathematics teachers attended an ICT pedagogically
related course (Pelgrum, 2008b: 97). Sixty three percent (63.40%) of the respondents did not have
ICT related pedagogical skills. Fortunately, many teachers (74.17%) realise that ICT could be useful.
If extrinsic barriers could be overcome, ICT could have a positive effect on teaching and learning
practices.
It is within teachers’ ability to overcome intrinsic barriers (Bramald et al., 2000: 3). Many of these
could be overcome without much effort and with the help of colleagues and the technology coordinator
at school. Having the support from colleagues would prevent teachers spending too much time to
develop the ICT related activities. Due to insufficient assistance, nearly sixty percent of the
respondents (58.70%) indicated that they did not have sufficient time to develop and implement ICT
related activities. More than fifty percent of the respondents (55.20%) were able to identify ICT useful
tools, but due to their lack of confidence to try new approaches more teachers (58.75%) did not make
use of ICT when teaching.
It can be concluded that ICT related barriers have a negative influence on the integration of ICTs
within teaching and learning, which ultimately influences the development of 21st century skills among
both teachers and learners.
88
5.2.5.1 Summary of the barriers
From the discussion in Table 5.5 the following barriers regarding integrating ICTs in the teaching and
learning practices in grade 8 mathematics classes were identified:
• teachers did not have ICT related pedagogical skills
• teachers did not have sufficient time to develop and implement ICT related activities
• Insufficient assistance for teachers to develop ICT related activities
• teachers had insufficient confidence to try out new approaches.
There are many barriers that hinder the integration of ICT’s into the teaching and learning of
mathematics and only when these barriers are dealt with will the integration process be successful.
5.3 Knowledge of the pedagogical use of ICTs in grade 8 mathematics In order to answer the second research question: Can knowledge of the pedagogical use of ICT
contribute towards more effective mathematics teaching in schools? various questions arose from the
dataset from the SITES 2006 mathematics teachers’ data frequencies which comprised eight parts:
Part I information about the target class
Part II curriculum goals
Part III teacher practice
Part IV learner practice
Part V learning resources and technology infrastructure
Part VI impact of ICT use
Part VII information about schools
Part VIII specific pedagogical practices that use ICT (SITES, 2006c) were correlated with Item 21 J: I
know which teaching or learning situations are suitable for ICT use (Part VII of the SITES
2006 Teachers’ Questionnaire).
The analysis also investigated whether curriculum goals, teacher practices, impact of ICT, impact of
ICT on learners, confidence in the pedagogical use of ICT’s, enhancing ICT in teaching and learning,
barriers in using ICT, and teaching related activities had an influence on the practices in grade 8
mathematics classrooms. For the purpose of this secondary data analysis, there is only a slight
difference between the two categories and the researcher combined the categories A little and
Somewhat (closely related) to form three analysis criteria, i.e. no knowledge to use ICT (not at all), ICT
knowledge to a certain extent (A little and Somewhat), and adequate ICT knowledge (A lot).
The frequency tables of the dataset for mathematics teachers in South Africa were correlated using
cross-tabulations. For random sampling, statistically and practically significant correlations were
determined between variables using Chi-square tests and effect sizes (Ellis et al., 2003: 4). Chi-
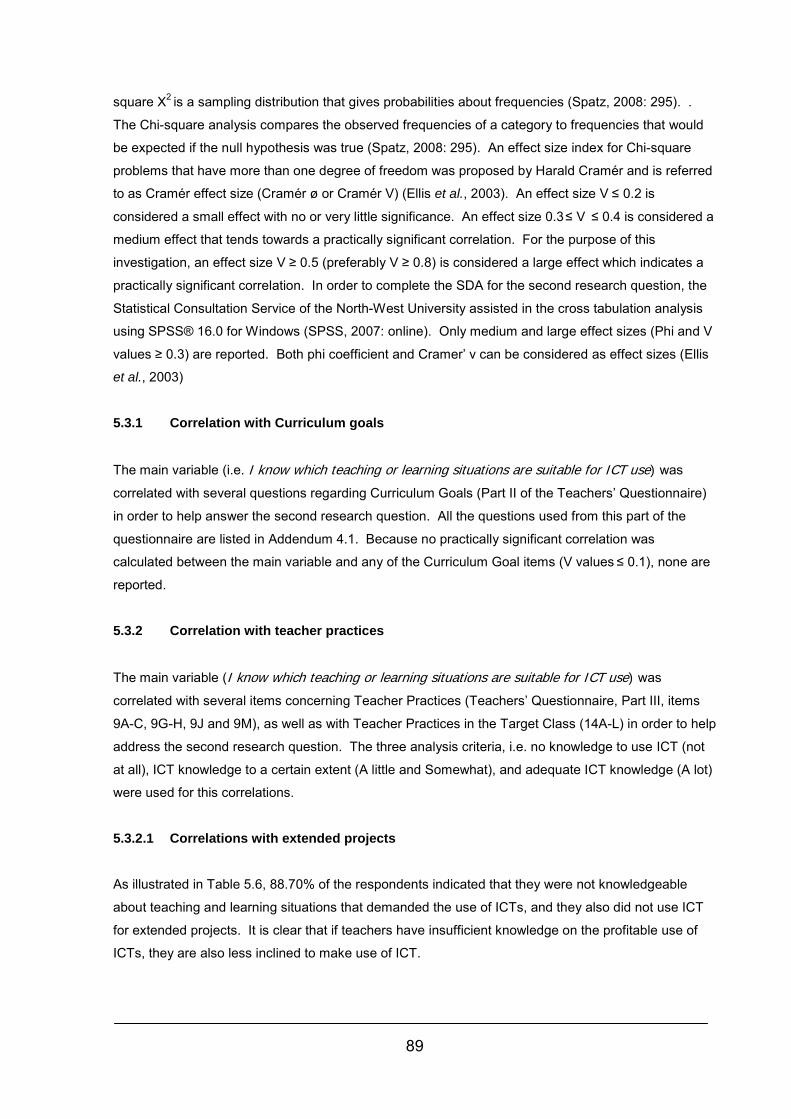
89
square X2 is a sampling distribution that gives probabilities about frequencies (Spatz, 2008: 295). .
The Chi-square analysis compares the observed frequencies of a category to frequencies that would
be expected if the null hypothesis was true (Spatz, 2008: 295). An effect size index for Chi-square
problems that have more than one degree of freedom was proposed by Harald Cramér and is referred
to as Cramér effect size (Cramér ø or Cramér V) (Ellis et al., 2003). An effect size V ≤ 0.2 is
considered a small effect with no or very little significance. An effect size 0.3 ≤ V ≤ 0.4 is considered a
medium effect that tends towards a practically significant correlation. For the purpose of this
investigation, an effect size V ≥ 0.5 (preferably V ≥ 0.8) is considered a large effect which indicates a
practically significant correlation. In order to complete the SDA for the second research question, the
Statistical Consultation Service of the North-West University assisted in the cross tabulation analysis
using SPSS® 16.0 for Windows (SPSS, 2007: online). Only medium and large effect sizes (Phi and V
values ≥ 0.3) are reported. Both phi coefficient and Cramer’ v can be considered as effect sizes (Ellis
et al., 2003)
5.3.1 Correlation with Curriculum goals
The main variable (i.e. I know which teaching or learning situations are suitable for ICT use) was
correlated with several questions regarding Curriculum Goals (Part II of the Teachers’ Questionnaire)
in order to help answer the second research question. All the questions used from this part of the
questionnaire are listed in Addendum 4.1. Because no practically significant correlation was
calculated between the main variable and any of the Curriculum Goal items (V values ≤ 0.1), none are
reported.
5.3.2 Correlation with teacher practices
The main variable (I know which teaching or learning situations are suitable for ICT use) was
correlated with several items concerning Teacher Practices (Teachers’ Questionnaire, Part III, items
9A-C, 9G-H, 9J and 9M), as well as with Teacher Practices in the Target Class (14A-L) in order to help
address the second research question. The three analysis criteria, i.e. no knowledge to use ICT (not
at all), ICT knowledge to a certain extent (A little and Somewhat), and adequate ICT knowledge (A lot)
were used for this correlations.
5.3.2.1 Correlations with extended projects
As illustrated in Table 5.6, 88.70% of the respondents indicated that they were not knowledgeable
about teaching and learning situations that demanded the use of ICTs, and they also did not use ICT
for extended projects. It is clear that if teachers have insufficient knowledge on the profitable use of
ICTs, they are also less inclined to make use of ICT.
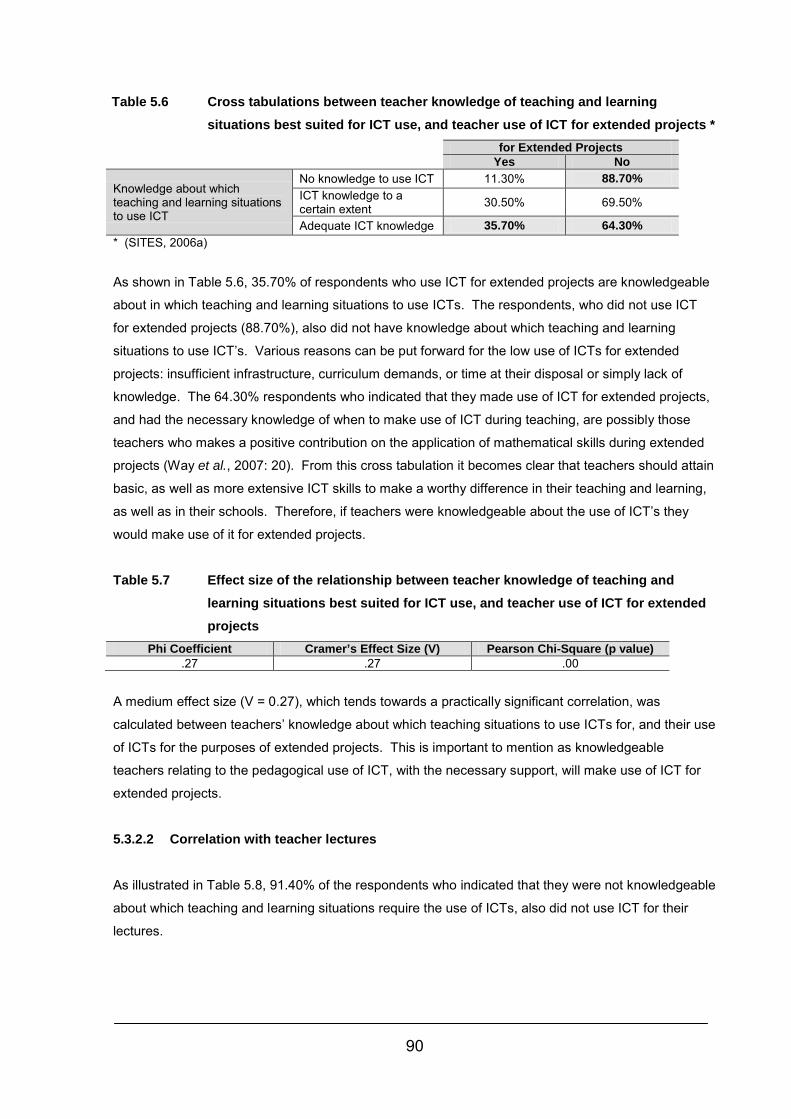
90
Table 5.6 Cross tabulations between teacher knowledge of teaching and learning situations best suited for ICT use, and teacher use of ICT for extended projects *
for Extended Projects Yes No
Knowledge about which teaching and learning situations to use ICT
No knowledge to use ICT 11.30% 88.70% ICT knowledge to a certain extent 30.50% 69.50%
Adequate ICT knowledge 35.70% 64.30% * (SITES, 2006a)
As shown in Table 5.6, 35.70% of respondents who use ICT for extended projects are knowledgeable
about in which teaching and learning situations to use ICTs. The respondents, who did not use ICT
for extended projects (88.70%), also did not have knowledge about which teaching and learning
situations to use ICT’s. Various reasons can be put forward for the low use of ICTs for extended
projects: insufficient infrastructure, curriculum demands, or time at their disposal or simply lack of
knowledge. The 64.30% respondents who indicated that they made use of ICT for extended projects,
and had the necessary knowledge of when to make use of ICT during teaching, are possibly those
teachers who makes a positive contribution on the application of mathematical skills during extended
projects (Way et al., 2007: 20). From this cross tabulation it becomes clear that teachers should attain
basic, as well as more extensive ICT skills to make a worthy difference in their teaching and learning,
as well as in their schools. Therefore, if teachers were knowledgeable about the use of ICT’s they
would make use of it for extended projects.
Table 5.7 Effect size of the relationship between teacher knowledge of teaching and learning situations best suited for ICT use, and teacher use of ICT for extended projects
Phi Coefficient Cramer’s Effect Size (V) Pearson Chi-Square (p value) .27 .27 .00
A medium effect size (V = 0.27), which tends towards a practically significant correlation, was
calculated between teachers’ knowledge about which teaching situations to use ICTs for, and their use
of ICTs for the purposes of extended projects. This is important to mention as knowledgeable
teachers relating to the pedagogical use of ICT, with the necessary support, will make use of ICT for
extended projects. 5.3.2.2 Correlation with teacher lectures
As illustrated in Table 5.8, 91.40% of the respondents who indicated that they were not knowledgeable
about which teaching and learning situations require the use of ICTs, also did not use ICT for their
lectures.
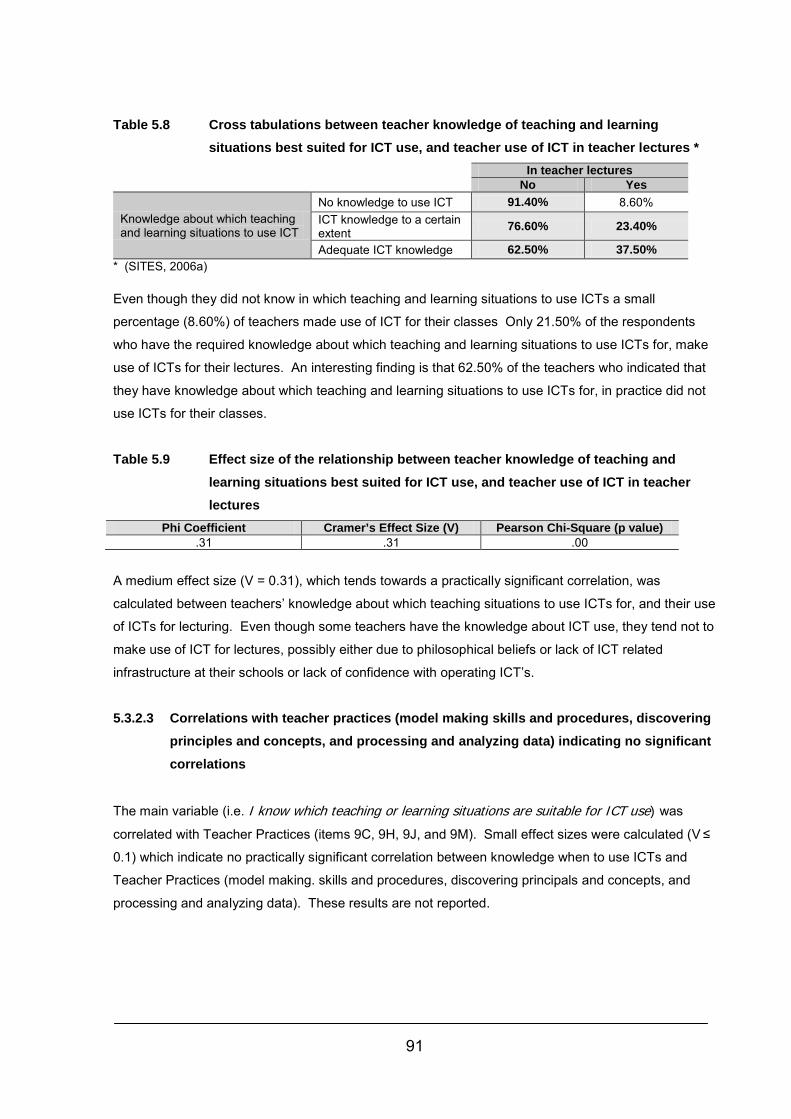
91
Table 5.8 Cross tabulations between teacher knowledge of teaching and learning situations best suited for ICT use, and teacher use of ICT in teacher lectures *
In teacher lectures No Yes
Knowledge about which teaching and learning situations to use ICT
No knowledge to use ICT 91.40% 8.60% ICT knowledge to a certain extent 76.60% 23.40%
Adequate ICT knowledge 62.50% 37.50% * (SITES, 2006a) Even though they did not know in which teaching and learning situations to use ICTs a small
percentage (8.60%) of teachers made use of ICT for their classes Only 21.50% of the respondents
who have the required knowledge about which teaching and learning situations to use ICTs for, make
use of ICTs for their lectures. An interesting finding is that 62.50% of the teachers who indicated that
they have knowledge about which teaching and learning situations to use ICTs for, in practice did not
use ICTs for their classes.
Table 5.9 Effect size of the relationship between teacher knowledge of teaching and learning situations best suited for ICT use, and teacher use of ICT in teacher lectures
Phi Coefficient Cramer’s Effect Size (V) Pearson Chi-Square (p value) .31 .31 .00
A medium effect size (V = 0.31), which tends towards a practically significant correlation, was
calculated between teachers’ knowledge about which teaching situations to use ICTs for, and their use
of ICTs for lecturing. Even though some teachers have the knowledge about ICT use, they tend not to
make use of ICT for lectures, possibly either due to philosophical beliefs or lack of ICT related
infrastructure at their schools or lack of confidence with operating ICT’s.
5.3.2.3 Correlations with teacher practices (model making skills and procedures, discovering principles and concepts, and processing and analyzing data) indicating no significant correlations
The main variable (i.e. I know which teaching or learning situations are suitable for ICT use) was
correlated with Teacher Practices (items 9C, 9H, 9J, and 9M). Small effect sizes were calculated (V ≤
0.1) which indicate no practically significant correlation between knowledge when to use ICTs and
Teacher Practices (model making. skills and procedures, discovering principals and concepts, and
processing and analyzing data). These results are not reported.
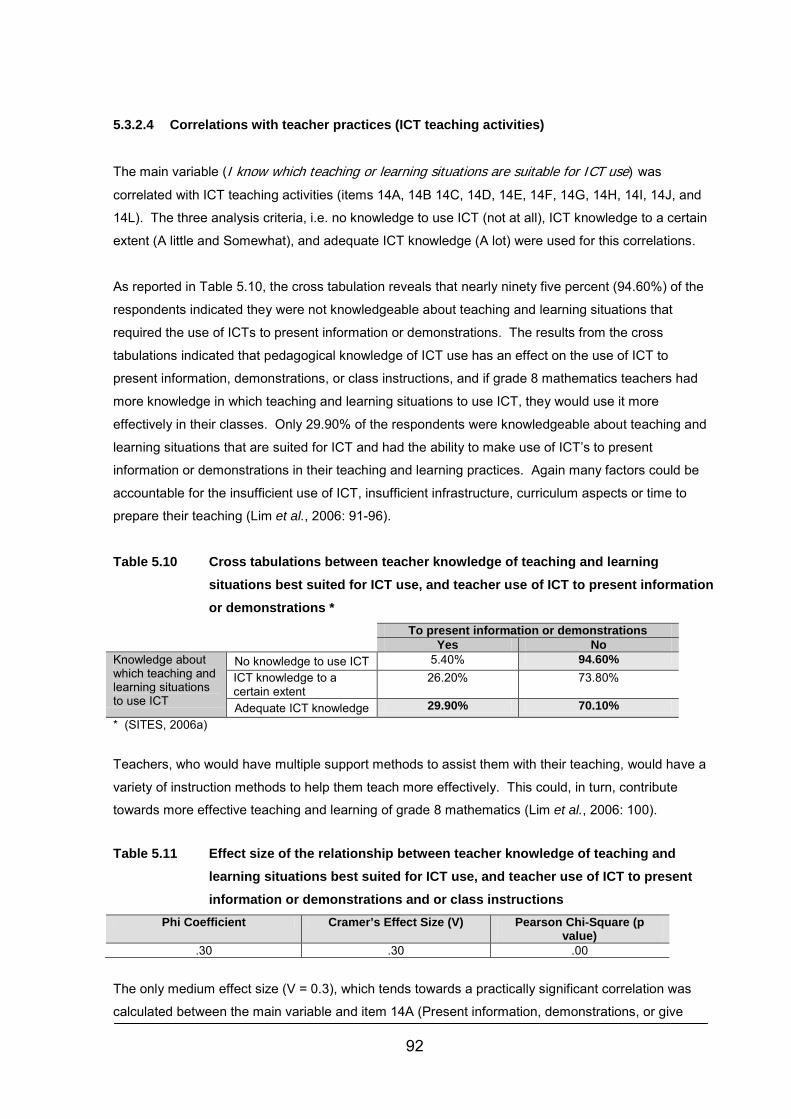
92
5.3.2.4 Correlations with teacher practices (ICT teaching activities)
The main variable (I know which teaching or learning situations are suitable for ICT use) was
correlated with ICT teaching activities (items 14A, 14B 14C, 14D, 14E, 14F, 14G, 14H, 14I, 14J, and
14L). The three analysis criteria, i.e. no knowledge to use ICT (not at all), ICT knowledge to a certain
extent (A little and Somewhat), and adequate ICT knowledge (A lot) were used for this correlations.
As reported in Table 5.10, the cross tabulation reveals that nearly ninety five percent (94.60%) of the
respondents indicated they were not knowledgeable about teaching and learning situations that
required the use of ICTs to present information or demonstrations. The results from the cross
tabulations indicated that pedagogical knowledge of ICT use has an effect on the use of ICT to
present information, demonstrations, or class instructions, and if grade 8 mathematics teachers had
more knowledge in which teaching and learning situations to use ICT, they would use it more
effectively in their classes. Only 29.90% of the respondents were knowledgeable about teaching and
learning situations that are suited for ICT and had the ability to make use of ICT’s to present
information or demonstrations in their teaching and learning practices. Again many factors could be
accountable for the insufficient use of ICT, insufficient infrastructure, curriculum aspects or time to
prepare their teaching (Lim et al., 2006: 91-96).
Table 5.10 Cross tabulations between teacher knowledge of teaching and learning situations best suited for ICT use, and teacher use of ICT to present information or demonstrations *
To present information or demonstrations Yes No Knowledge about which teaching and learning situations to use ICT
No knowledge to use ICT 5.40% 94.60% ICT knowledge to a certain extent
26.20% 73.80%
Adequate ICT knowledge 29.90% 70.10% * (SITES, 2006a)
Teachers, who would have multiple support methods to assist them with their teaching, would have a
variety of instruction methods to help them teach more effectively. This could, in turn, contribute
towards more effective teaching and learning of grade 8 mathematics (Lim et al., 2006: 100).
Table 5.11 Effect size of the relationship between teacher knowledge of teaching and learning situations best suited for ICT use, and teacher use of ICT to present information or demonstrations and or class instructions
Phi Coefficient Cramer’s Effect Size (V) Pearson Chi-Square (p value)
.30 .30 .00
The only medium effect size (V = 0.3), which tends towards a practically significant correlation was
calculated between the main variable and item 14A (Present information, demonstrations, or give
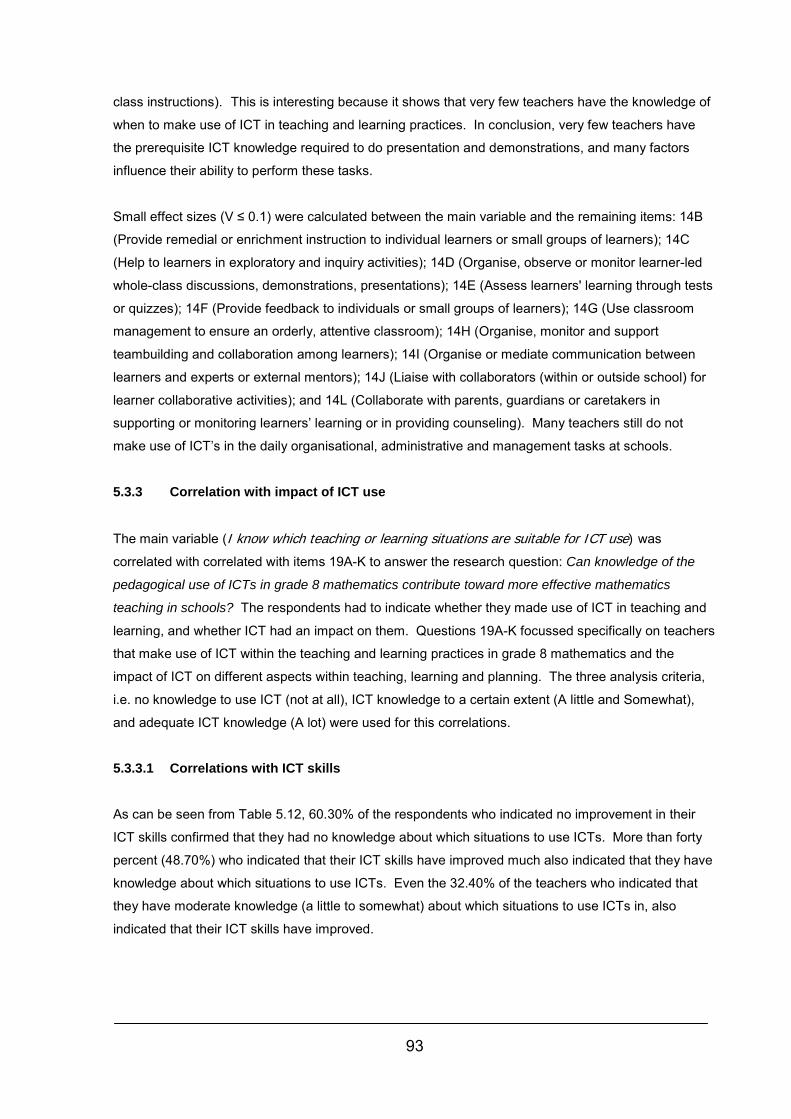
93
class instructions). This is interesting because it shows that very few teachers have the knowledge of
when to make use of ICT in teaching and learning practices. In conclusion, very few teachers have
the prerequisite ICT knowledge required to do presentation and demonstrations, and many factors
influence their ability to perform these tasks.
Small effect sizes (V ≤ 0.1) were calculated between the main variable and the remaining items: 14B
(Provide remedial or enrichment instruction to individual learners or small groups of learners); 14C
(Help to learners in exploratory and inquiry activities); 14D (Organise, observe or monitor learner-led
whole-class discussions, demonstrations, presentations); 14E (Assess learners' learning through tests
or quizzes); 14F (Provide feedback to individuals or small groups of learners); 14G (Use classroom
management to ensure an orderly, attentive classroom); 14H (Organise, monitor and support
teambuilding and collaboration among learners); 14I (Organise or mediate communication between
learners and experts or external mentors); 14J (Liaise with collaborators (within or outside school) for
learner collaborative activities); and 14L (Collaborate with parents, guardians or caretakers in
supporting or monitoring learners’ learning or in providing counseling). Many teachers still do not
make use of ICT’s in the daily organisational, administrative and management tasks at schools.
5.3.3 Correlation with impact of ICT use
The main variable (I know which teaching or learning situations are suitable for ICT use) was
correlated with correlated with items 19A-K to answer the research question: Can knowledge of the
pedagogical use of ICTs in grade 8 mathematics contribute toward more effective mathematics
teaching in schools? The respondents had to indicate whether they made use of ICT in teaching and
learning, and whether ICT had an impact on them. Questions 19A-K focussed specifically on teachers
that make use of ICT within the teaching and learning practices in grade 8 mathematics and the
impact of ICT on different aspects within teaching, learning and planning. The three analysis criteria,
i.e. no knowledge to use ICT (not at all), ICT knowledge to a certain extent (A little and Somewhat),
and adequate ICT knowledge (A lot) were used for this correlations.
5.3.3.1 Correlations with ICT skills
As can be seen from Table 5.12, 60.30% of the respondents who indicated no improvement in their
ICT skills confirmed that they had no knowledge about which situations to use ICTs. More than forty
percent (48.70%) who indicated that their ICT skills have improved much also indicated that they have
knowledge about which situations to use ICTs. Even the 32.40% of the teachers who indicated that
they have moderate knowledge (a little to somewhat) about which situations to use ICTs in, also
indicated that their ICT skills have improved.
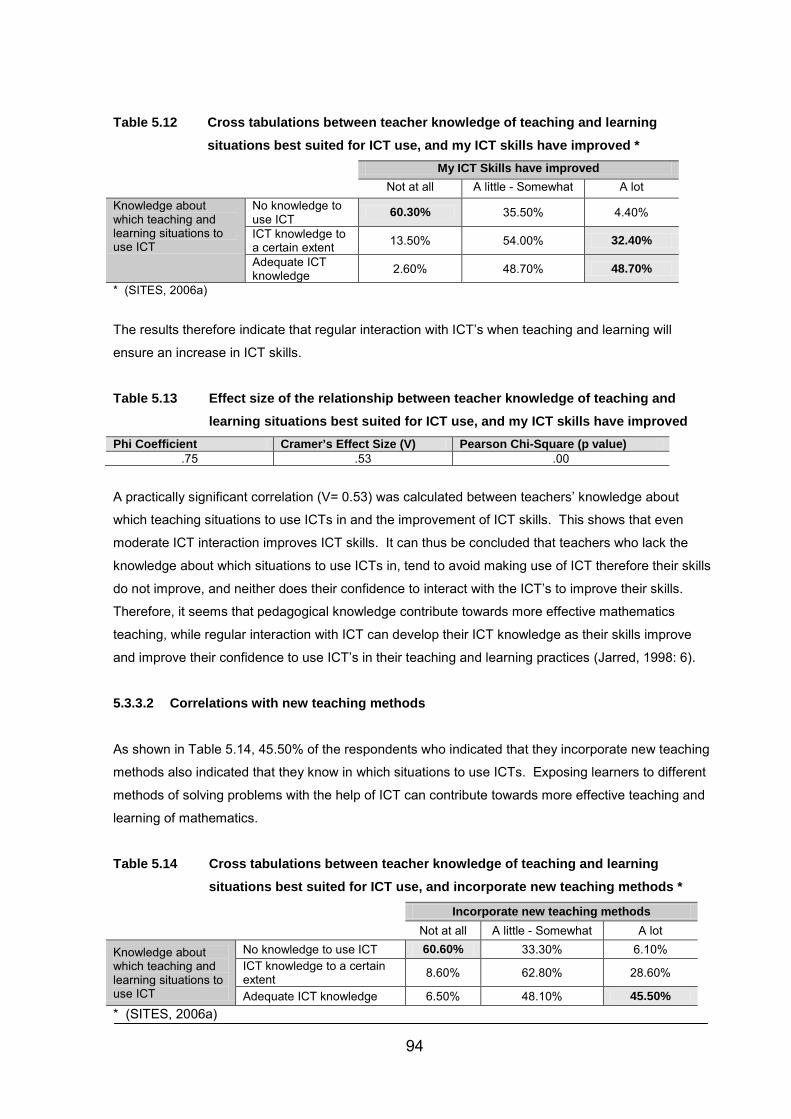
94
Table 5.12 Cross tabulations between teacher knowledge of teaching and learning situations best suited for ICT use, and my ICT skills have improved *
My ICT Skills have improved Not at all A little - Somewhat A lot Knowledge about which teaching and learning situations to use ICT
No knowledge to use ICT 60.30% 35.50% 4.40%
ICT knowledge to a certain extent 13.50% 54.00% 32.40%
Adequate ICT knowledge 2.60% 48.70% 48.70%
* (SITES, 2006a)
The results therefore indicate that regular interaction with ICT’s when teaching and learning will
ensure an increase in ICT skills.
Table 5.13 Effect size of the relationship between teacher knowledge of teaching and learning situations best suited for ICT use, and my ICT skills have improved
Phi Coefficient Cramer’s Effect Size (V) Pearson Chi-Square (p value) .75 .53 .00
A practically significant correlation (V= 0.53) was calculated between teachers’ knowledge about
which teaching situations to use ICTs in and the improvement of ICT skills. This shows that even
moderate ICT interaction improves ICT skills. It can thus be concluded that teachers who lack the
knowledge about which situations to use ICTs in, tend to avoid making use of ICT therefore their skills
do not improve, and neither does their confidence to interact with the ICT’s to improve their skills.
Therefore, it seems that pedagogical knowledge contribute towards more effective mathematics
teaching, while regular interaction with ICT can develop their ICT knowledge as their skills improve
and improve their confidence to use ICT’s in their teaching and learning practices (Jarred, 1998: 6).
5.3.3.2 Correlations with new teaching methods
As shown in Table 5.14, 45.50% of the respondents who indicated that they incorporate new teaching
methods also indicated that they know in which situations to use ICTs. Exposing learners to different
methods of solving problems with the help of ICT can contribute towards more effective teaching and
learning of mathematics.
Table 5.14 Cross tabulations between teacher knowledge of teaching and learning situations best suited for ICT use, and incorporate new teaching methods *
Incorporate new teaching methods Not at all A little - Somewhat A lot
Knowledge about which teaching and learning situations to use ICT
No knowledge to use ICT 60.60% 33.30% 6.10% ICT knowledge to a certain extent 8.60% 62.80% 28.60%
Adequate ICT knowledge 6.50% 48.10% 45.50% * (SITES, 2006a)
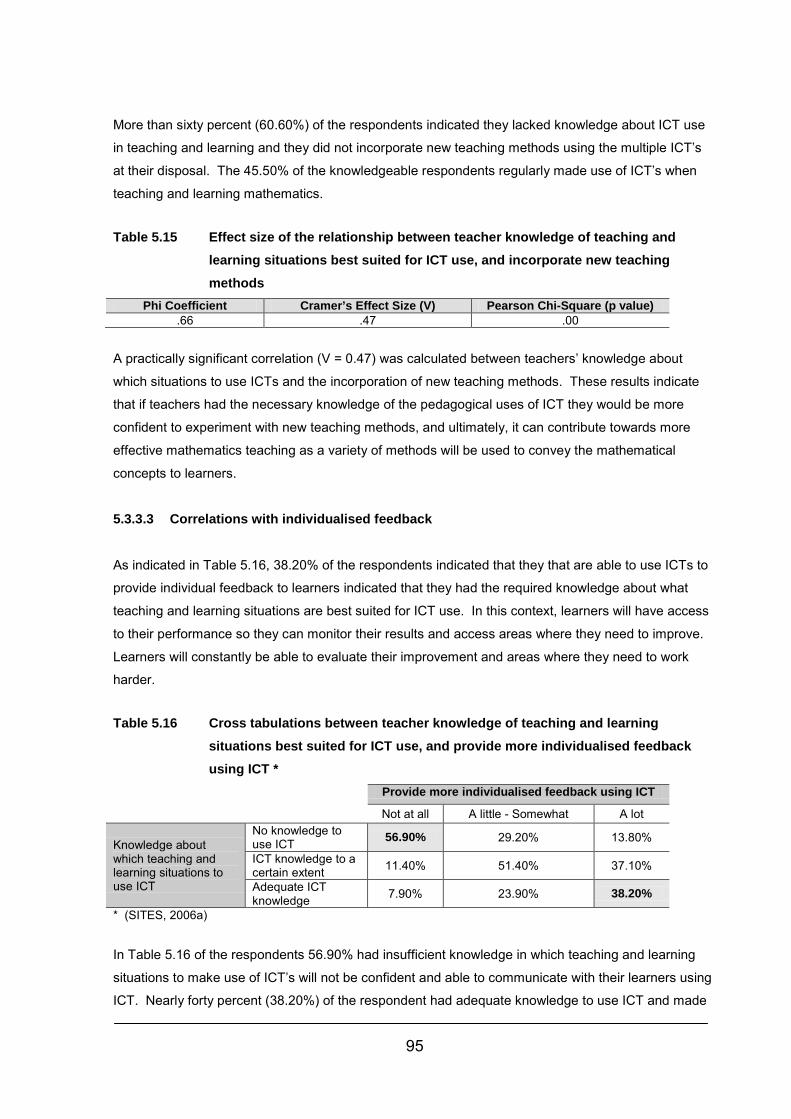
95
More than sixty percent (60.60%) of the respondents indicated they lacked knowledge about ICT use
in teaching and learning and they did not incorporate new teaching methods using the multiple ICT’s
at their disposal. The 45.50% of the knowledgeable respondents regularly made use of ICT’s when
teaching and learning mathematics.
Table 5.15 Effect size of the relationship between teacher knowledge of teaching and learning situations best suited for ICT use, and incorporate new teaching methods
Phi Coefficient Cramer’s Effect Size (V) Pearson Chi-Square (p value) .66 .47 .00
A practically significant correlation (V = 0.47) was calculated between teachers’ knowledge about
which situations to use ICTs and the incorporation of new teaching methods. These results indicate
that if teachers had the necessary knowledge of the pedagogical uses of ICT they would be more
confident to experiment with new teaching methods, and ultimately, it can contribute towards more
effective mathematics teaching as a variety of methods will be used to convey the mathematical
concepts to learners.
5.3.3.3 Correlations with individualised feedback
As indicated in Table 5.16, 38.20% of the respondents indicated that they that are able to use ICTs to
provide individual feedback to learners indicated that they had the required knowledge about what
teaching and learning situations are best suited for ICT use. In this context, learners will have access
to their performance so they can monitor their results and access areas where they need to improve.
Learners will constantly be able to evaluate their improvement and areas where they need to work
harder.
Table 5.16 Cross tabulations between teacher knowledge of teaching and learning situations best suited for ICT use, and provide more individualised feedback using ICT *
Provide more individualised feedback using ICT Not at all A little - Somewhat A lot
Knowledge about which teaching and learning situations to use ICT
No knowledge to use ICT 56.90% 29.20% 13.80%
ICT knowledge to a certain extent 11.40% 51.40% 37.10%
Adequate ICT knowledge 7.90% 23.90% 38.20%
* (SITES, 2006a)
In Table 5.16 of the respondents 56.90% had insufficient knowledge in which teaching and learning
situations to make use of ICT’s will not be confident and able to communicate with their learners using
ICT. Nearly forty percent (38.20%) of the respondent had adequate knowledge to use ICT and made
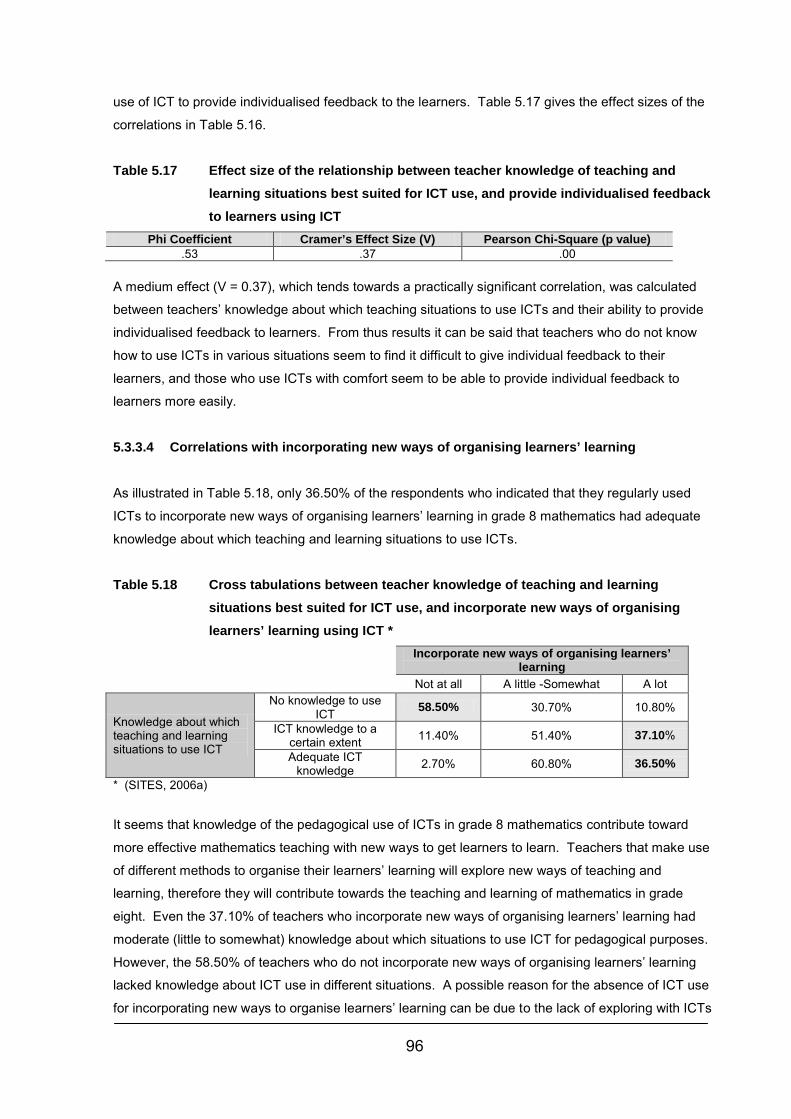
96
use of ICT to provide individualised feedback to the learners. Table 5.17 gives the effect sizes of the
correlations in Table 5.16.
Table 5.17 Effect size of the relationship between teacher knowledge of teaching and learning situations best suited for ICT use, and provide individualised feedback to learners using ICT
Phi Coefficient Cramer’s Effect Size (V) Pearson Chi-Square (p value) .53 .37 .00
A medium effect (V = 0.37), which tends towards a practically significant correlation, was calculated
between teachers’ knowledge about which teaching situations to use ICTs and their ability to provide
individualised feedback to learners. From thus results it can be said that teachers who do not know
how to use ICTs in various situations seem to find it difficult to give individual feedback to their
learners, and those who use ICTs with comfort seem to be able to provide individual feedback to
learners more easily.
5.3.3.4 Correlations with incorporating new ways of organising learners’ learning As illustrated in Table 5.18, only 36.50% of the respondents who indicated that they regularly used
ICTs to incorporate new ways of organising learners’ learning in grade 8 mathematics had adequate
knowledge about which teaching and learning situations to use ICTs.
Table 5.18 Cross tabulations between teacher knowledge of teaching and learning situations best suited for ICT use, and incorporate new ways of organising learners’ learning using ICT *
Incorporate new ways of organising learners’ learning
Not at all A little -Somewhat A lot
Knowledge about which teaching and learning situations to use ICT
No knowledge to use ICT 58.50% 30.70% 10.80%
ICT knowledge to a certain extent 11.40% 51.40% 37.10%
Adequate ICT knowledge 2.70% 60.80% 36.50%
* (SITES, 2006a)
It seems that knowledge of the pedagogical use of ICTs in grade 8 mathematics contribute toward
more effective mathematics teaching with new ways to get learners to learn. Teachers that make use
of different methods to organise their learners’ learning will explore new ways of teaching and
learning, therefore they will contribute towards the teaching and learning of mathematics in grade
eight. Even the 37.10% of teachers who incorporate new ways of organising learners’ learning had
moderate (little to somewhat) knowledge about which situations to use ICT for pedagogical purposes.
However, the 58.50% of teachers who do not incorporate new ways of organising learners’ learning
lacked knowledge about ICT use in different situations. A possible reason for the absence of ICT use
for incorporating new ways to organise learners’ learning can be due to the lack of exploring with ICTs
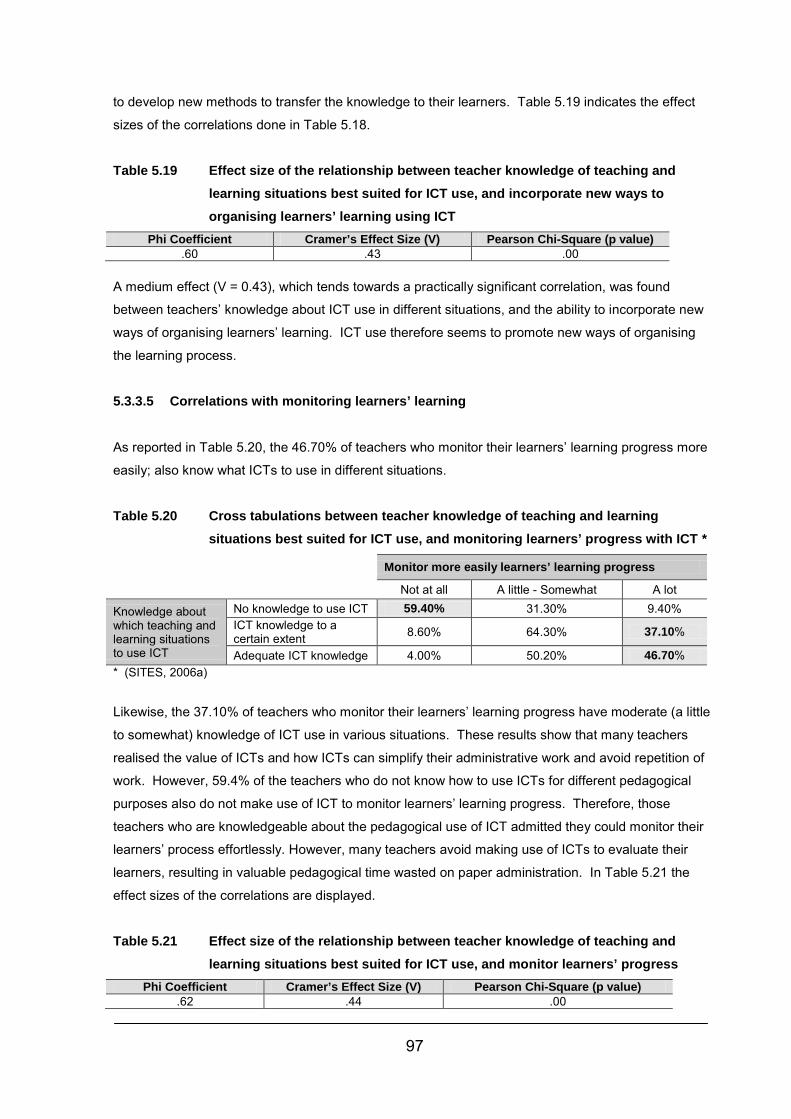
97
to develop new methods to transfer the knowledge to their learners. Table 5.19 indicates the effect
sizes of the correlations done in Table 5.18.
Table 5.19 Effect size of the relationship between teacher knowledge of teaching and learning situations best suited for ICT use, and incorporate new ways to organising learners’ learning using ICT
Phi Coefficient Cramer’s Effect Size (V) Pearson Chi-Square (p value) .60 .43 .00
A medium effect (V = 0.43), which tends towards a practically significant correlation, was found
between teachers’ knowledge about ICT use in different situations, and the ability to incorporate new
ways of organising learners’ learning. ICT use therefore seems to promote new ways of organising
the learning process.
5.3.3.5 Correlations with monitoring learners’ learning
As reported in Table 5.20, the 46.70% of teachers who monitor their learners’ learning progress more
easily; also know what ICTs to use in different situations.
Table 5.20 Cross tabulations between teacher knowledge of teaching and learning situations best suited for ICT use, and monitoring learners’ progress with ICT *
Monitor more easily learners’ learning progress Not at all A little - Somewhat A lot
Knowledge about which teaching and learning situations to use ICT
No knowledge to use ICT 59.40% 31.30% 9.40% ICT knowledge to a certain extent 8.60% 64.30% 37.10%
Adequate ICT knowledge 4.00% 50.20% 46.70% * (SITES, 2006a)
Likewise, the 37.10% of teachers who monitor their learners’ learning progress have moderate (a little
to somewhat) knowledge of ICT use in various situations. These results show that many teachers
realised the value of ICTs and how ICTs can simplify their administrative work and avoid repetition of
work. However, 59.4% of the teachers who do not know how to use ICTs for different pedagogical
purposes also do not make use of ICT to monitor learners’ learning progress. Therefore, those
teachers who are knowledgeable about the pedagogical use of ICT admitted they could monitor their
learners’ process effortlessly. However, many teachers avoid making use of ICTs to evaluate their
learners, resulting in valuable pedagogical time wasted on paper administration. In Table 5.21 the
effect sizes of the correlations are displayed.
Table 5.21 Effect size of the relationship between teacher knowledge of teaching and learning situations best suited for ICT use, and monitor learners’ progress
Phi Coefficient Cramer’s Effect Size (V) Pearson Chi-Square (p value) .62 .44 .00
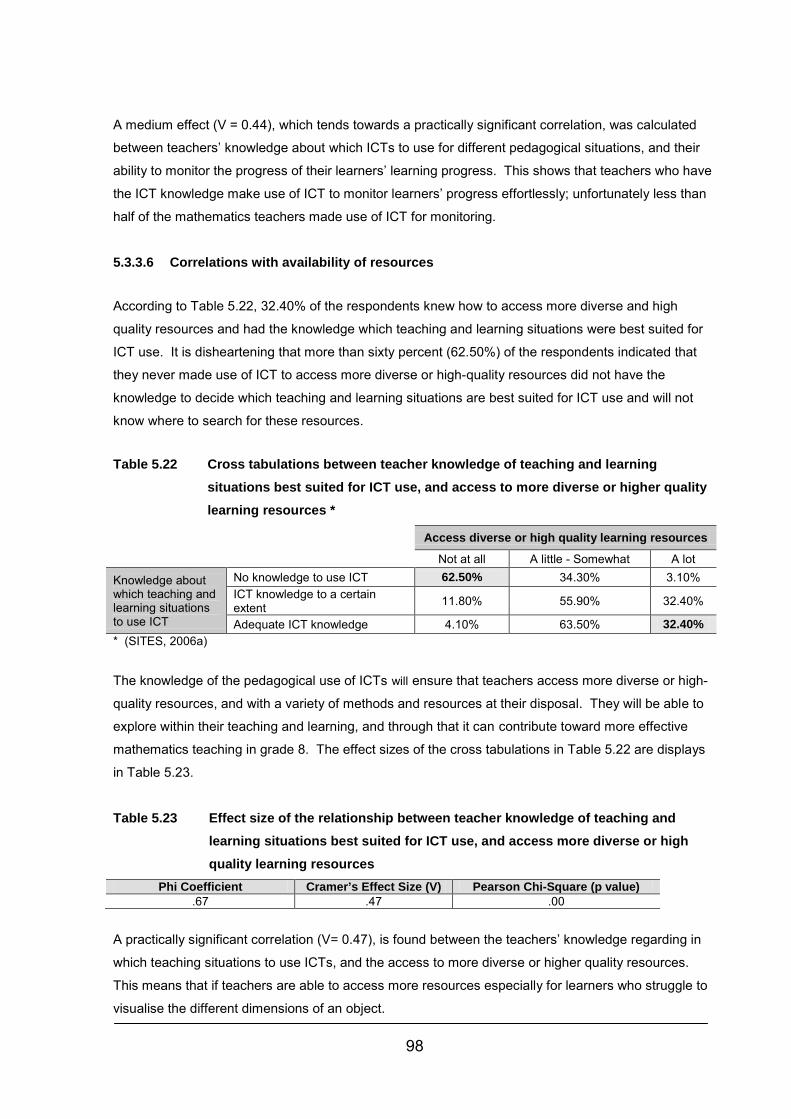
98
A medium effect (V = 0.44), which tends towards a practically significant correlation, was calculated
between teachers’ knowledge about which ICTs to use for different pedagogical situations, and their
ability to monitor the progress of their learners’ learning progress. This shows that teachers who have
the ICT knowledge make use of ICT to monitor learners’ progress effortlessly; unfortunately less than
half of the mathematics teachers made use of ICT for monitoring.
5.3.3.6 Correlations with availability of resources
According to Table 5.22, 32.40% of the respondents knew how to access more diverse and high
quality resources and had the knowledge which teaching and learning situations were best suited for
ICT use. It is disheartening that more than sixty percent (62.50%) of the respondents indicated that
they never made use of ICT to access more diverse or high-quality resources did not have the
knowledge to decide which teaching and learning situations are best suited for ICT use and will not
know where to search for these resources.
Table 5.22 Cross tabulations between teacher knowledge of teaching and learning situations best suited for ICT use, and access to more diverse or higher quality learning resources *
Access diverse or high quality learning resources Not at all A little - Somewhat A lot
Knowledge about which teaching and learning situations to use ICT
No knowledge to use ICT 62.50% 34.30% 3.10% ICT knowledge to a certain extent 11.80% 55.90% 32.40%
Adequate ICT knowledge 4.10% 63.50% 32.40% * (SITES, 2006a)
The knowledge of the pedagogical use of ICTs will ensure that teachers access more diverse or high-
quality resources, and with a variety of methods and resources at their disposal. They will be able to
explore within their teaching and learning, and through that it can contribute toward more effective
mathematics teaching in grade 8. The effect sizes of the cross tabulations in Table 5.22 are displays
in Table 5.23.
Table 5.23 Effect size of the relationship between teacher knowledge of teaching and learning situations best suited for ICT use, and access more diverse or high quality learning resources
Phi Coefficient Cramer’s Effect Size (V) Pearson Chi-Square (p value) .67 .47 .00
A practically significant correlation (V= 0.47), is found between the teachers’ knowledge regarding in
which teaching situations to use ICTs, and the access to more diverse or higher quality resources.
This means that if teachers are able to access more resources especially for learners who struggle to
visualise the different dimensions of an object.

99
5.3.3.7 Correlations with collaboration with colleagues
As illustrated in Table 5.24, 48.60% of the respondents who regularly communicated with their
colleagues using various ICT methods of communication knew which teaching and learning situations
are best suited for ICT use. They were able to support each other in completing tasks and sharing
their ICT knowledge. Unfortunately more than fifty percent (56.90%) of the respondents could not
communicate constructively with their peers on aspects relating to the completion of tasks and they
did not have the ICT pedagogical knowledge to make use of ICT.
Table 5.24 Cross tabulations between teacher knowledge of teaching and learning situations best suited for ICT use, and more collaboration with colleagues within the school *
I collaborate more with colleagues within my school Not at all A little - Somewhat A lot
Knowledge about which teaching and learning situations to use ICT
No knowledge to use ICT 56.90% 24.60% 18.50%
ICT knowledge to a certain extent 5.70% 57.10% 37.10%
Adequate ICT knowledge 5.40% 46.00% 48.60%
* (SITES, 2006a)
If teachers had the ICT related pedagogical knowledge they will confidently collaborate with
colleagues within their school, to share ideas and information to enrich their teaching practices. Table
5.25 indicates the effect sizes of the correlations done in Table 5.24.
Table 5.25 Effect size of the relationship between teacher knowledge of teaching and learning situations best suited for ICT use, and more collaboration with colleagues within the school
Phi Coefficient Cramer’s Effect Size (V) Pearson Chi-Square (p value) .60 .43 .00
A medium effect (V= 0.43), which tends towards a practically significant correlation, is found between
the teachers’ knowledge regarding in which teaching situations to use ICTs and collaboration with
colleagues within their school. This is interesting because if teachers had the necessary ICT
pedagogical knowledge they will be able to communicate effectively with their peers regarding tasks
and activities, and share information that will assist them to transfer knowledge more effectively
(Oldknow et al., 2003: 60).
5.3.3.8 Correlations with collaboration with peers outside their schools
According to Table 5.26, 53.80% of the respondents who indicated that they did not collaborate with
peers and experts outside their schools had insufficient ICT-related pedagogical knowledge. Their
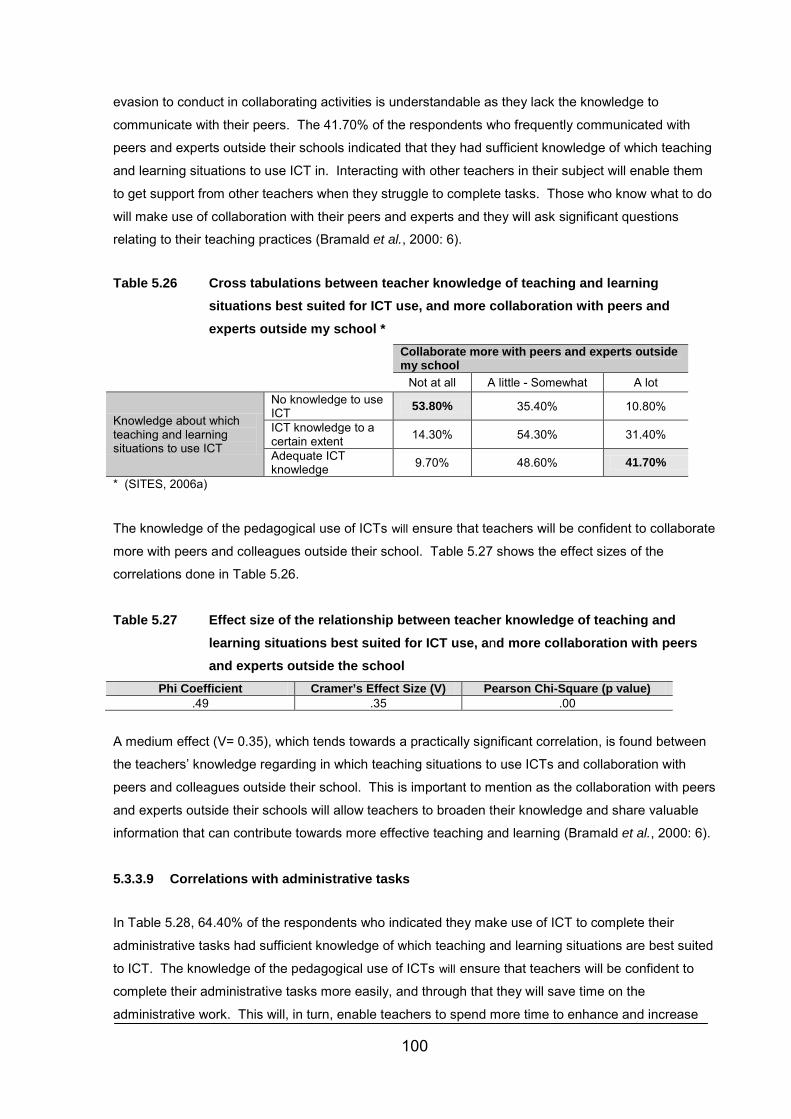
100
evasion to conduct in collaborating activities is understandable as they lack the knowledge to
communicate with their peers. The 41.70% of the respondents who frequently communicated with
peers and experts outside their schools indicated that they had sufficient knowledge of which teaching
and learning situations to use ICT in. Interacting with other teachers in their subject will enable them
to get support from other teachers when they struggle to complete tasks. Those who know what to do
will make use of collaboration with their peers and experts and they will ask significant questions
relating to their teaching practices (Bramald et al., 2000: 6).
Table 5.26 Cross tabulations between teacher knowledge of teaching and learning situations best suited for ICT use, and more collaboration with peers and experts outside my school *
Collaborate more with peers and experts outside my school
Not at all A little - Somewhat A lot
Knowledge about which teaching and learning situations to use ICT
No knowledge to use ICT 53.80% 35.40% 10.80%
ICT knowledge to a certain extent 14.30% 54.30% 31.40%
Adequate ICT knowledge 9.70% 48.60% 41.70%
* (SITES, 2006a)
The knowledge of the pedagogical use of ICTs will ensure that teachers will be confident to collaborate
more with peers and colleagues outside their school. Table 5.27 shows the effect sizes of the
correlations done in Table 5.26.
Table 5.27 Effect size of the relationship between teacher knowledge of teaching and learning situations best suited for ICT use, and more collaboration with peers and experts outside the school
Phi Coefficient Cramer’s Effect Size (V) Pearson Chi-Square (p value) .49 .35 .00
A medium effect (V= 0.35), which tends towards a practically significant correlation, is found between
the teachers’ knowledge regarding in which teaching situations to use ICTs and collaboration with
peers and colleagues outside their school. This is important to mention as the collaboration with peers
and experts outside their schools will allow teachers to broaden their knowledge and share valuable
information that can contribute towards more effective teaching and learning (Bramald et al., 2000: 6).
5.3.3.9 Correlations with administrative tasks
In Table 5.28, 64.40% of the respondents who indicated they make use of ICT to complete their
administrative tasks had sufficient knowledge of which teaching and learning situations are best suited
to ICT. The knowledge of the pedagogical use of ICTs will ensure that teachers will be confident to
complete their administrative tasks more easily, and through that they will save time on the
administrative work. This will, in turn, enable teachers to spend more time to enhance and increase
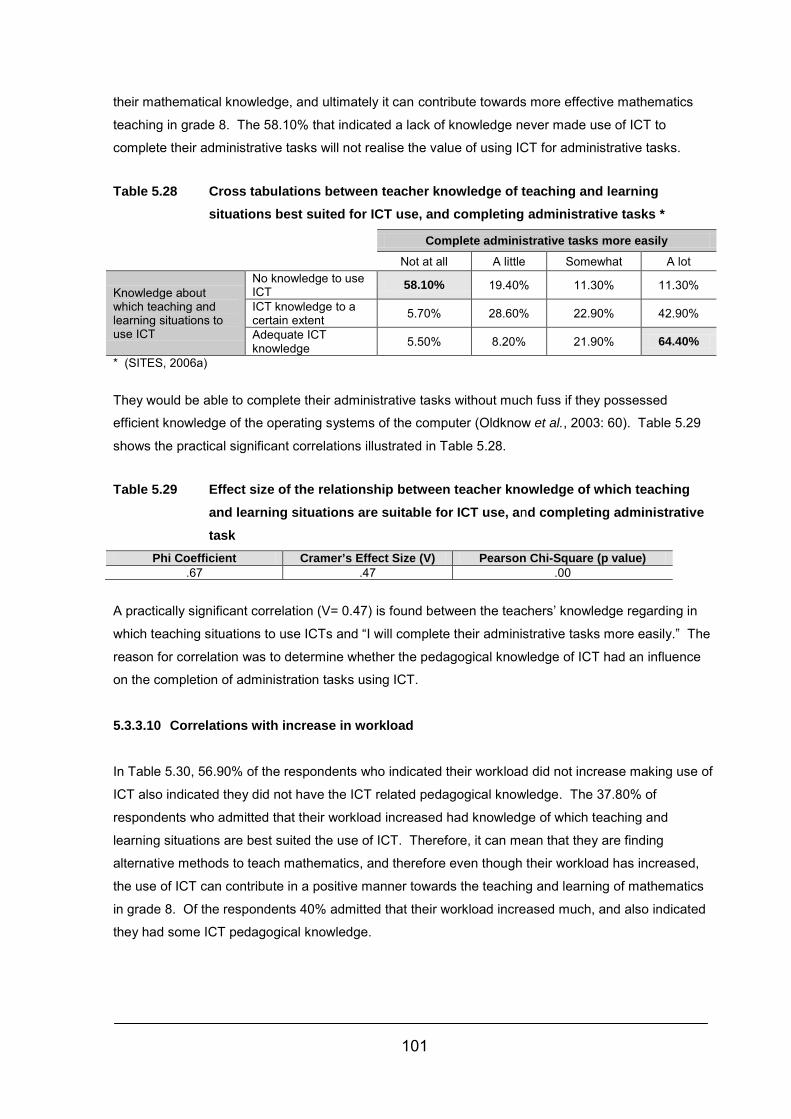
101
their mathematical knowledge, and ultimately it can contribute towards more effective mathematics
teaching in grade 8. The 58.10% that indicated a lack of knowledge never made use of ICT to
complete their administrative tasks will not realise the value of using ICT for administrative tasks.
Table 5.28 Cross tabulations between teacher knowledge of teaching and learning situations best suited for ICT use, and completing administrative tasks *
Complete administrative tasks more easily Not at all A little Somewhat A lot
Knowledge about which teaching and learning situations to use ICT
No knowledge to use ICT 58.10% 19.40% 11.30% 11.30%
ICT knowledge to a certain extent 5.70% 28.60% 22.90% 42.90%
Adequate ICT knowledge 5.50% 8.20% 21.90% 64.40%
* (SITES, 2006a)
They would be able to complete their administrative tasks without much fuss if they possessed
efficient knowledge of the operating systems of the computer (Oldknow et al., 2003: 60). Table 5.29
shows the practical significant correlations illustrated in Table 5.28.
Table 5.29 Effect size of the relationship between teacher knowledge of which teaching and learning situations are suitable for ICT use, and completing administrative task
Phi Coefficient Cramer’s Effect Size (V) Pearson Chi-Square (p value) .67 .47 .00
A practically significant correlation (V= 0.47) is found between the teachers’ knowledge regarding in
which teaching situations to use ICTs and “I will complete their administrative tasks more easily.” The
reason for correlation was to determine whether the pedagogical knowledge of ICT had an influence
on the completion of administration tasks using ICT.
5.3.3.10 Correlations with increase in workload
In Table 5.30, 56.90% of the respondents who indicated their workload did not increase making use of
ICT also indicated they did not have the ICT related pedagogical knowledge. The 37.80% of
respondents who admitted that their workload increased had knowledge of which teaching and
learning situations are best suited the use of ICT. Therefore, it can mean that they are finding
alternative methods to teach mathematics, and therefore even though their workload has increased,
the use of ICT can contribute in a positive manner towards the teaching and learning of mathematics
in grade 8. Of the respondents 40% admitted that their workload increased much, and also indicated
they had some ICT pedagogical knowledge.
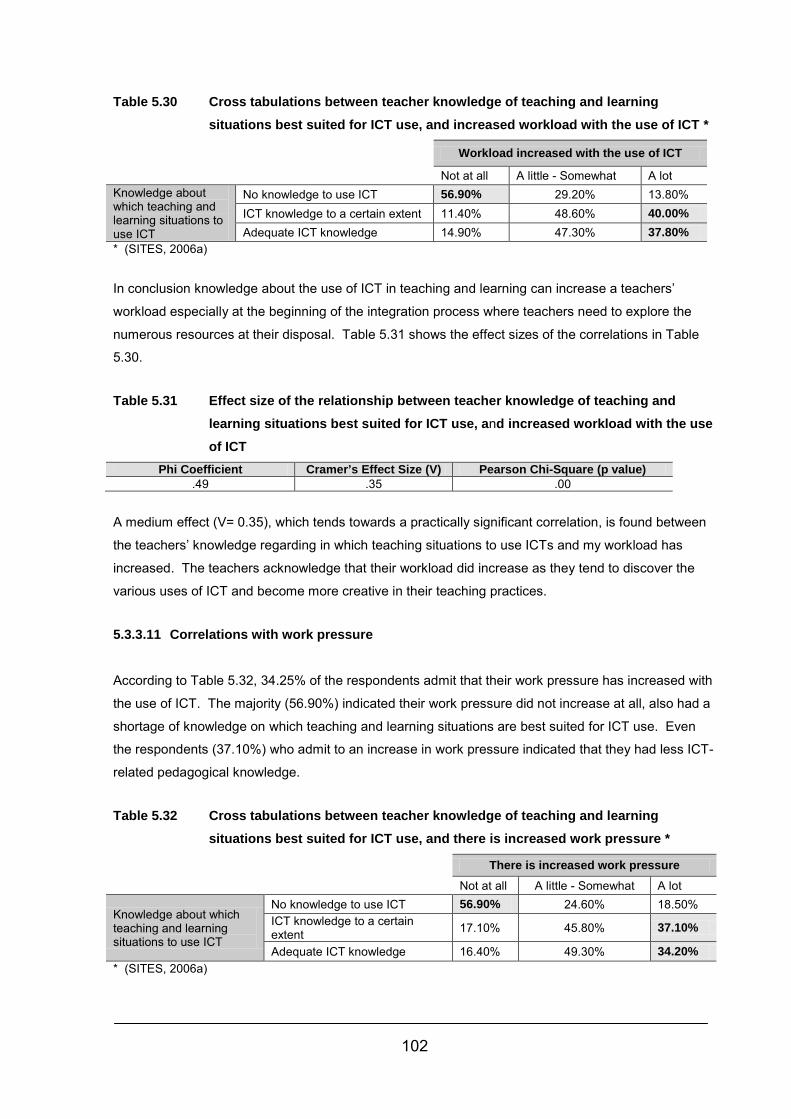
102
Table 5.30 Cross tabulations between teacher knowledge of teaching and learning situations best suited for ICT use, and increased workload with the use of ICT *
Workload increased with the use of ICT Not at all A little - Somewhat A lot Knowledge about which teaching and learning situations to use ICT
No knowledge to use ICT 56.90% 29.20% 13.80% ICT knowledge to a certain extent 11.40% 48.60% 40.00% Adequate ICT knowledge 14.90% 47.30% 37.80%
* (SITES, 2006a)
In conclusion knowledge about the use of ICT in teaching and learning can increase a teachers’
workload especially at the beginning of the integration process where teachers need to explore the
numerous resources at their disposal. Table 5.31 shows the effect sizes of the correlations in Table
5.30.
Table 5.31 Effect size of the relationship between teacher knowledge of teaching and learning situations best suited for ICT use, and increased workload with the use of ICT
Phi Coefficient Cramer’s Effect Size (V) Pearson Chi-Square (p value) .49 .35 .00
A medium effect (V= 0.35), which tends towards a practically significant correlation, is found between
the teachers’ knowledge regarding in which teaching situations to use ICTs and my workload has
increased. The teachers acknowledge that their workload did increase as they tend to discover the
various uses of ICT and become more creative in their teaching practices.
5.3.3.11 Correlations with work pressure
According to Table 5.32, 34.25% of the respondents admit that their work pressure has increased with
the use of ICT. The majority (56.90%) indicated their work pressure did not increase at all, also had a
shortage of knowledge on which teaching and learning situations are best suited for ICT use. Even
the respondents (37.10%) who admit to an increase in work pressure indicated that they had less ICT-
related pedagogical knowledge.
Table 5.32 Cross tabulations between teacher knowledge of teaching and learning situations best suited for ICT use, and there is increased work pressure *
There is increased work pressure Not at all A little - Somewhat A lot
Knowledge about which teaching and learning situations to use ICT
No knowledge to use ICT 56.90% 24.60% 18.50% ICT knowledge to a certain extent 17.10% 45.80% 37.10%
Adequate ICT knowledge 16.40% 49.30% 34.20% * (SITES, 2006a)
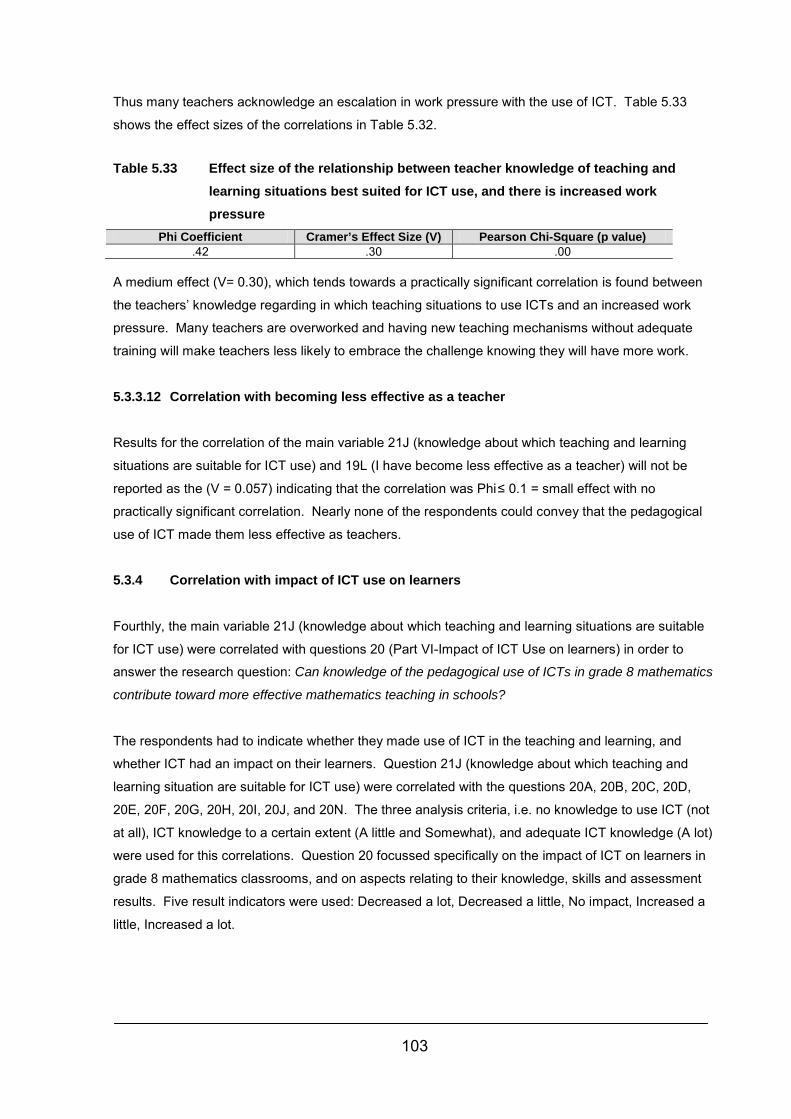
103
Thus many teachers acknowledge an escalation in work pressure with the use of ICT. Table 5.33
shows the effect sizes of the correlations in Table 5.32.
Table 5.33 Effect size of the relationship between teacher knowledge of teaching and learning situations best suited for ICT use, and there is increased work pressure
Phi Coefficient Cramer’s Effect Size (V) Pearson Chi-Square (p value) .42 .30 .00
A medium effect (V= 0.30), which tends towards a practically significant correlation is found between
the teachers’ knowledge regarding in which teaching situations to use ICTs and an increased work
pressure. Many teachers are overworked and having new teaching mechanisms without adequate
training will make teachers less likely to embrace the challenge knowing they will have more work.
5.3.3.12 Correlation with becoming less effective as a teacher
Results for the correlation of the main variable 21J (knowledge about which teaching and learning
situations are suitable for ICT use) and 19L (I have become less effective as a teacher) will not be
reported as the (V = 0.057) indicating that the correlation was Phi ≤ 0.1 = small effect with no
practically significant correlation. Nearly none of the respondents could convey that the pedagogical
use of ICT made them less effective as teachers.
5.3.4 Correlation with impact of ICT use on learners
Fourthly, the main variable 21J (knowledge about which teaching and learning situations are suitable
for ICT use) were correlated with questions 20 (Part VI-Impact of ICT Use on learners) in order to
answer the research question: Can knowledge of the pedagogical use of ICTs in grade 8 mathematics
contribute toward more effective mathematics teaching in schools?
The respondents had to indicate whether they made use of ICT in the teaching and learning, and
whether ICT had an impact on their learners. Question 21J (knowledge about which teaching and
learning situation are suitable for ICT use) were correlated with the questions 20A, 20B, 20C, 20D,
20E, 20F, 20G, 20H, 20I, 20J, and 20N. The three analysis criteria, i.e. no knowledge to use ICT (not
at all), ICT knowledge to a certain extent (A little and Somewhat), and adequate ICT knowledge (A lot)
were used for this correlations. Question 20 focussed specifically on the impact of ICT on learners in
grade 8 mathematics classrooms, and on aspects relating to their knowledge, skills and assessment
results. Five result indicators were used: Decreased a lot, Decreased a little, No impact, Increased a
little, Increased a lot.
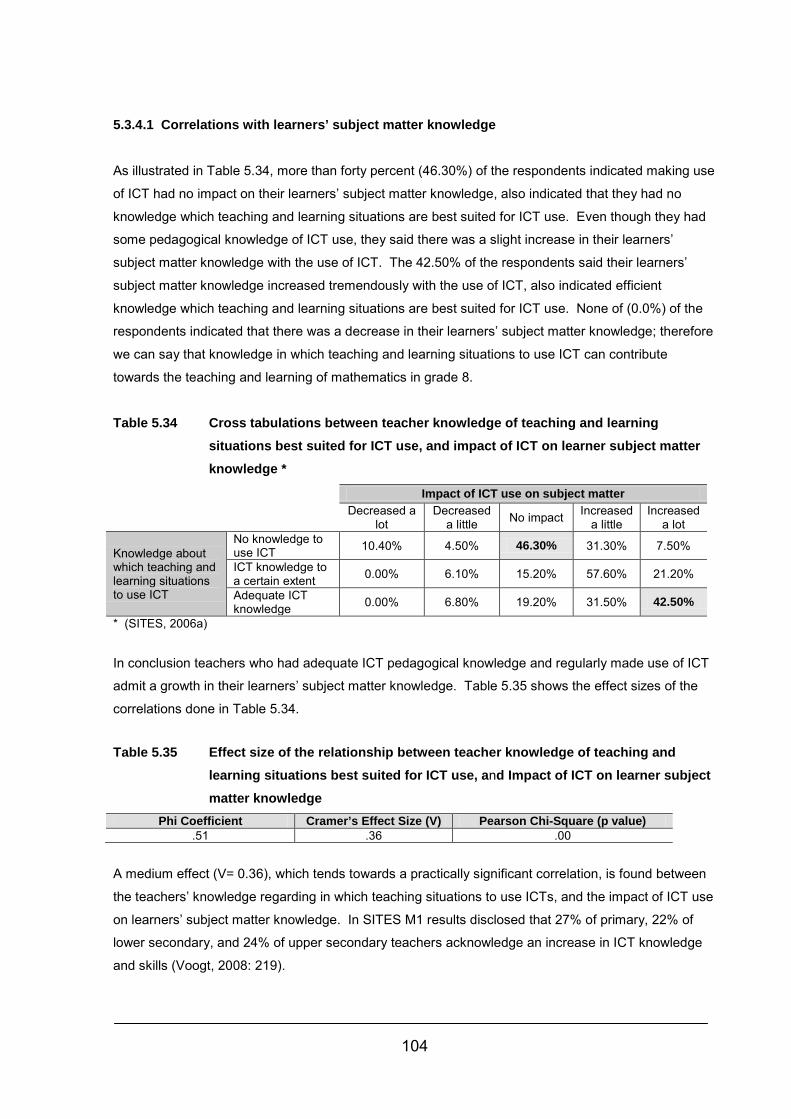
104
5.3.4.1 Correlations with learners’ subject matter knowledge
As illustrated in Table 5.34, more than forty percent (46.30%) of the respondents indicated making use
of ICT had no impact on their learners’ subject matter knowledge, also indicated that they had no
knowledge which teaching and learning situations are best suited for ICT use. Even though they had
some pedagogical knowledge of ICT use, they said there was a slight increase in their learners’
subject matter knowledge with the use of ICT. The 42.50% of the respondents said their learners’
subject matter knowledge increased tremendously with the use of ICT, also indicated efficient
knowledge which teaching and learning situations are best suited for ICT use. None of (0.0%) of the
respondents indicated that there was a decrease in their learners’ subject matter knowledge; therefore
we can say that knowledge in which teaching and learning situations to use ICT can contribute
towards the teaching and learning of mathematics in grade 8.
Table 5.34 Cross tabulations between teacher knowledge of teaching and learning situations best suited for ICT use, and impact of ICT on learner subject matter knowledge *
Impact of ICT use on subject matter Decreased a
lot Decreased
a little No impact Increased a little
Increased a lot
Knowledge about which teaching and learning situations to use ICT
No knowledge to use ICT 10.40% 4.50% 46.30% 31.30% 7.50%
ICT knowledge to a certain extent 0.00% 6.10% 15.20% 57.60% 21.20%
Adequate ICT knowledge 0.00% 6.80% 19.20% 31.50% 42.50%
* (SITES, 2006a)
In conclusion teachers who had adequate ICT pedagogical knowledge and regularly made use of ICT
admit a growth in their learners’ subject matter knowledge. Table 5.35 shows the effect sizes of the
correlations done in Table 5.34.
Table 5.35 Effect size of the relationship between teacher knowledge of teaching and learning situations best suited for ICT use, and Impact of ICT on learner subject matter knowledge
Phi Coefficient Cramer’s Effect Size (V) Pearson Chi-Square (p value) .51 .36 .00
A medium effect (V= 0.36), which tends towards a practically significant correlation, is found between
the teachers’ knowledge regarding in which teaching situations to use ICTs, and the impact of ICT use
on learners’ subject matter knowledge. In SITES M1 results disclosed that 27% of primary, 22% of
lower secondary, and 24% of upper secondary teachers acknowledge an increase in ICT knowledge
and skills (Voogt, 2008: 219).
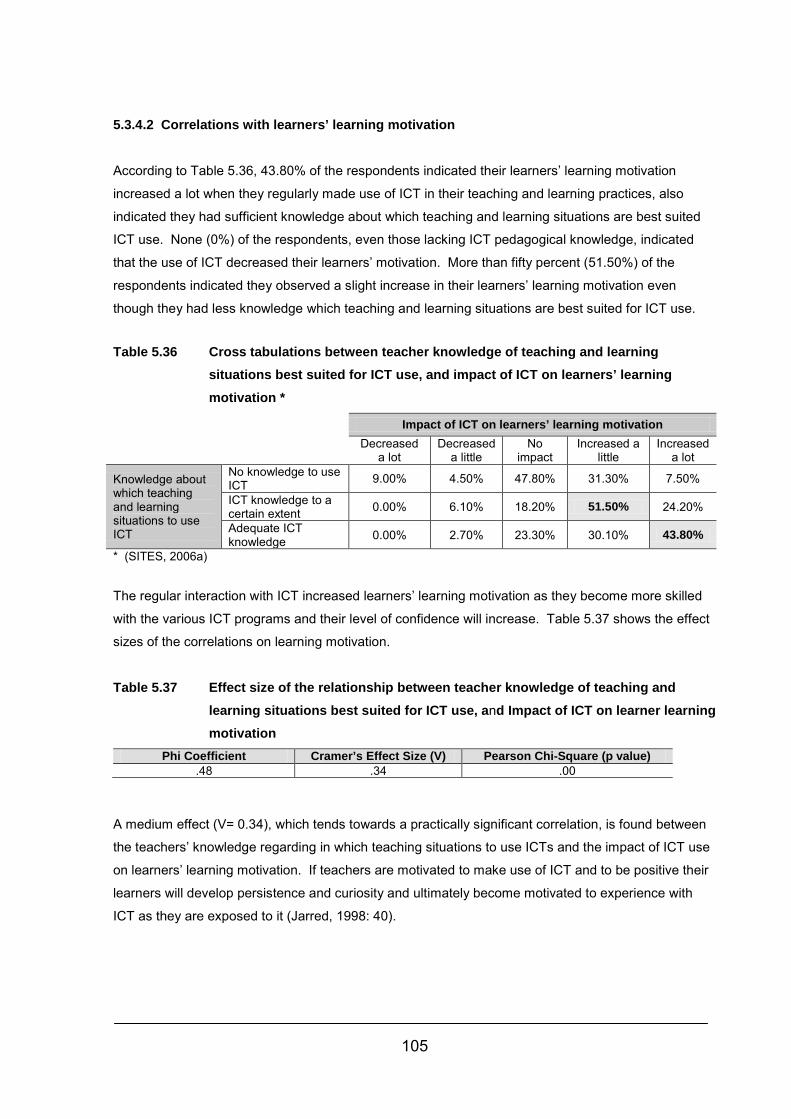
105
5.3.4.2 Correlations with learners’ learning motivation
According to Table 5.36, 43.80% of the respondents indicated their learners’ learning motivation
increased a lot when they regularly made use of ICT in their teaching and learning practices, also
indicated they had sufficient knowledge about which teaching and learning situations are best suited
ICT use. None (0%) of the respondents, even those lacking ICT pedagogical knowledge, indicated
that the use of ICT decreased their learners’ motivation. More than fifty percent (51.50%) of the
respondents indicated they observed a slight increase in their learners’ learning motivation even
though they had less knowledge which teaching and learning situations are best suited for ICT use.
Table 5.36 Cross tabulations between teacher knowledge of teaching and learning situations best suited for ICT use, and impact of ICT on learners’ learning motivation *
Impact of ICT on learners’ learning motivation Decreased
a lot Decreased
a little No
impact Increased a
little Increased
a lot
Knowledge about which teaching and learning situations to use ICT
No knowledge to use ICT 9.00% 4.50% 47.80% 31.30% 7.50%
ICT knowledge to a certain extent 0.00% 6.10% 18.20% 51.50% 24.20%
Adequate ICT knowledge 0.00% 2.70% 23.30% 30.10% 43.80%
* (SITES, 2006a)
The regular interaction with ICT increased learners’ learning motivation as they become more skilled
with the various ICT programs and their level of confidence will increase. Table 5.37 shows the effect
sizes of the correlations on learning motivation.
Table 5.37 Effect size of the relationship between teacher knowledge of teaching and learning situations best suited for ICT use, and Impact of ICT on learner learning motivation
Phi Coefficient Cramer’s Effect Size (V) Pearson Chi-Square (p value) .48 .34 .00
A medium effect (V= 0.34), which tends towards a practically significant correlation, is found between
the teachers’ knowledge regarding in which teaching situations to use ICTs and the impact of ICT use
on learners’ learning motivation. If teachers are motivated to make use of ICT and to be positive their
learners will develop persistence and curiosity and ultimately become motivated to experience with
ICT as they are exposed to it (Jarred, 1998: 40).
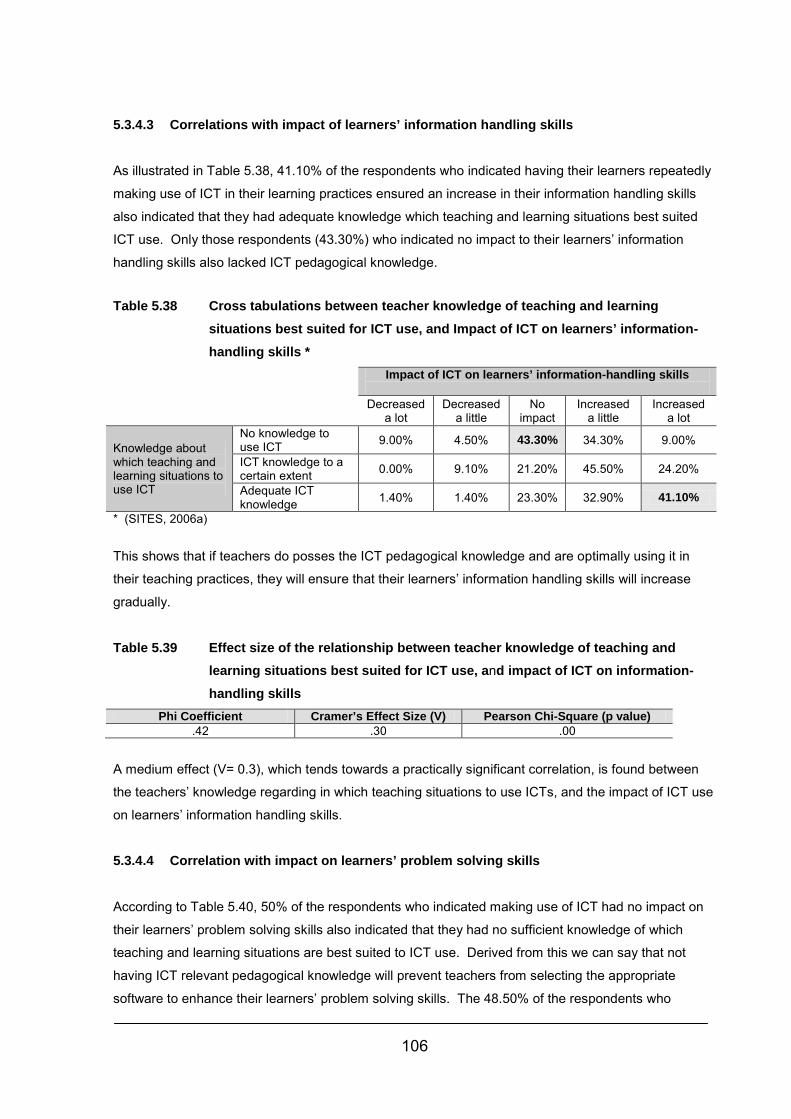
106
5.3.4.3 Correlations with impact of learners’ information handling skills
As illustrated in Table 5.38, 41.10% of the respondents who indicated having their learners repeatedly
making use of ICT in their learning practices ensured an increase in their information handling skills
also indicated that they had adequate knowledge which teaching and learning situations best suited
ICT use. Only those respondents (43.30%) who indicated no impact to their learners’ information
handling skills also lacked ICT pedagogical knowledge.
Table 5.38 Cross tabulations between teacher knowledge of teaching and learning situations best suited for ICT use, and Impact of ICT on learners’ information-handling skills *
Impact of ICT on learners’ information-handling skills
Decreased a lot
Decreased a little
No impact
Increased a little
Increased a lot
Knowledge about which teaching and learning situations to use ICT
No knowledge to use ICT 9.00% 4.50% 43.30% 34.30% 9.00%
ICT knowledge to a certain extent 0.00% 9.10% 21.20% 45.50% 24.20%
Adequate ICT knowledge 1.40% 1.40% 23.30% 32.90% 41.10%
* (SITES, 2006a)
This shows that if teachers do posses the ICT pedagogical knowledge and are optimally using it in
their teaching practices, they will ensure that their learners’ information handling skills will increase
gradually.
Table 5.39 Effect size of the relationship between teacher knowledge of teaching and learning situations best suited for ICT use, and impact of ICT on information-handling skills
Phi Coefficient Cramer’s Effect Size (V) Pearson Chi-Square (p value) .42 .30 .00
A medium effect (V= 0.3), which tends towards a practically significant correlation, is found between
the teachers’ knowledge regarding in which teaching situations to use ICTs, and the impact of ICT use
on learners’ information handling skills.
5.3.4.4 Correlation with impact on learners’ problem solving skills
According to Table 5.40, 50% of the respondents who indicated making use of ICT had no impact on
their learners’ problem solving skills also indicated that they had no sufficient knowledge of which
teaching and learning situations are best suited to ICT use. Derived from this we can say that not
having ICT relevant pedagogical knowledge will prevent teachers from selecting the appropriate
software to enhance their learners’ problem solving skills. The 48.50% of the respondents who
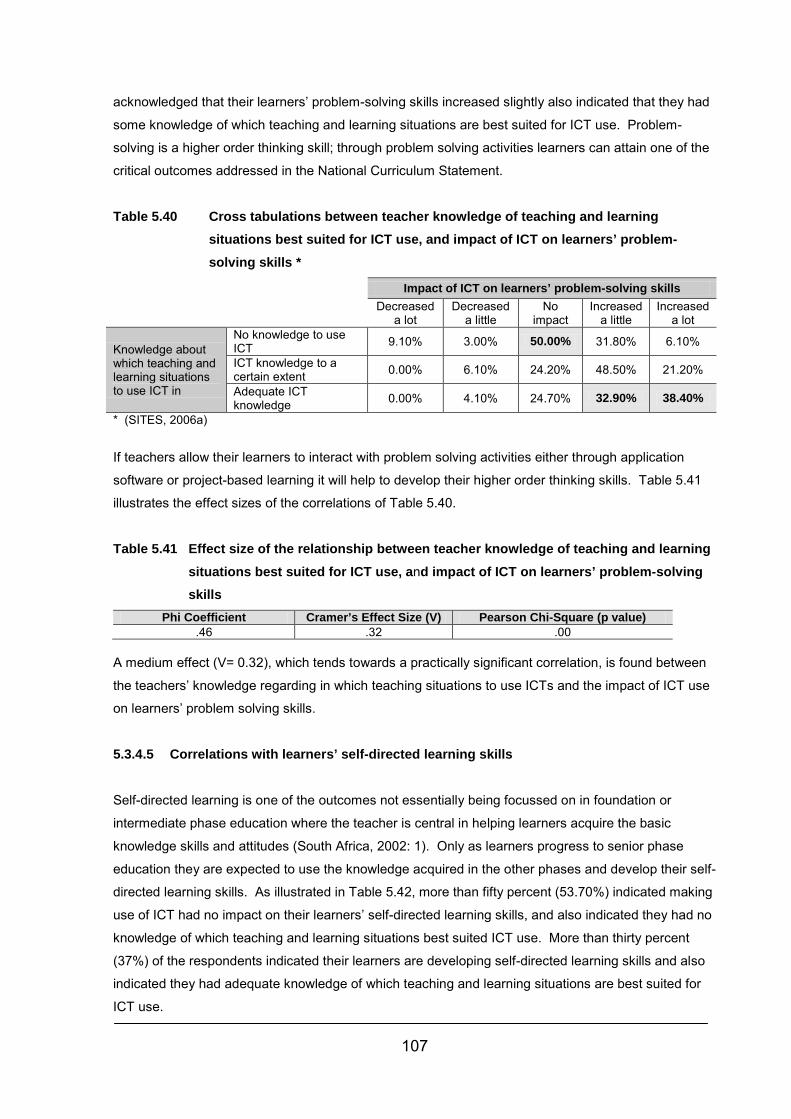
107
acknowledged that their learners’ problem-solving skills increased slightly also indicated that they had
some knowledge of which teaching and learning situations are best suited for ICT use. Problem-
solving is a higher order thinking skill; through problem solving activities learners can attain one of the
critical outcomes addressed in the National Curriculum Statement.
Table 5.40 Cross tabulations between teacher knowledge of teaching and learning situations best suited for ICT use, and impact of ICT on learners’ problem-solving skills *
Impact of ICT on learners’ problem-solving skills Decreased
a lot Decreased
a little No
impact Increased
a little Increased
a lot
Knowledge about which teaching and learning situations to use ICT in
No knowledge to use ICT 9.10% 3.00% 50.00% 31.80% 6.10%
ICT knowledge to a certain extent 0.00% 6.10% 24.20% 48.50% 21.20%
Adequate ICT knowledge 0.00% 4.10% 24.70% 32.90% 38.40%
* (SITES, 2006a)
If teachers allow their learners to interact with problem solving activities either through application
software or project-based learning it will help to develop their higher order thinking skills. Table 5.41
illustrates the effect sizes of the correlations of Table 5.40.
Table 5.41 Effect size of the relationship between teacher knowledge of teaching and learning situations best suited for ICT use, and impact of ICT on learners’ problem-solving skills
Phi Coefficient Cramer’s Effect Size (V) Pearson Chi-Square (p value) .46 .32 .00
A medium effect (V= 0.32), which tends towards a practically significant correlation, is found between
the teachers’ knowledge regarding in which teaching situations to use ICTs and the impact of ICT use
on learners’ problem solving skills.
5.3.4.5 Correlations with learners’ self-directed learning skills
Self-directed learning is one of the outcomes not essentially being focussed on in foundation or
intermediate phase education where the teacher is central in helping learners acquire the basic
knowledge skills and attitudes (South Africa, 2002: 1). Only as learners progress to senior phase
education they are expected to use the knowledge acquired in the other phases and develop their self-
directed learning skills. As illustrated in Table 5.42, more than fifty percent (53.70%) indicated making
use of ICT had no impact on their learners’ self-directed learning skills, and also indicated they had no
knowledge of which teaching and learning situations best suited ICT use. More than thirty percent
(37%) of the respondents indicated their learners are developing self-directed learning skills and also
indicated they had adequate knowledge of which teaching and learning situations are best suited for
ICT use.
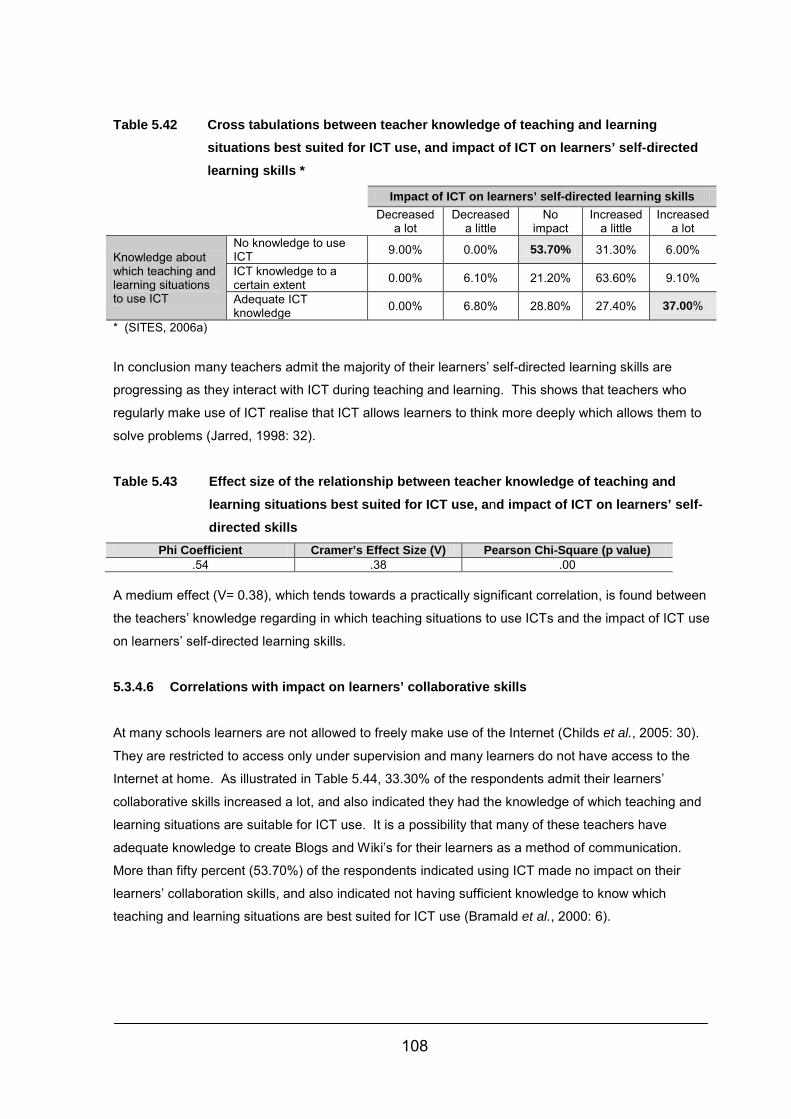
108
Table 5.42 Cross tabulations between teacher knowledge of teaching and learning situations best suited for ICT use, and impact of ICT on learners’ self-directed learning skills *
Impact of ICT on learners’ self-directed learning skills Decreased
a lot Decreased
a little No
impact Increased
a little Increased
a lot
Knowledge about which teaching and learning situations to use ICT
No knowledge to use ICT 9.00% 0.00% 53.70% 31.30% 6.00%
ICT knowledge to a certain extent 0.00% 6.10% 21.20% 63.60% 9.10%
Adequate ICT knowledge 0.00% 6.80% 28.80% 27.40% 37.00%
* (SITES, 2006a)
In conclusion many teachers admit the majority of their learners’ self-directed learning skills are
progressing as they interact with ICT during teaching and learning. This shows that teachers who
regularly make use of ICT realise that ICT allows learners to think more deeply which allows them to
solve problems (Jarred, 1998: 32).
Table 5.43 Effect size of the relationship between teacher knowledge of teaching and
learning situations best suited for ICT use, and impact of ICT on learners’ self-directed skills
Phi Coefficient Cramer’s Effect Size (V) Pearson Chi-Square (p value) .54 .38 .00
A medium effect (V= 0.38), which tends towards a practically significant correlation, is found between
the teachers’ knowledge regarding in which teaching situations to use ICTs and the impact of ICT use
on learners’ self-directed learning skills.
5.3.4.6 Correlations with impact on learners’ collaborative skills At many schools learners are not allowed to freely make use of the Internet (Childs et al., 2005: 30).
They are restricted to access only under supervision and many learners do not have access to the
Internet at home. As illustrated in Table 5.44, 33.30% of the respondents admit their learners’
collaborative skills increased a lot, and also indicated they had the knowledge of which teaching and
learning situations are suitable for ICT use. It is a possibility that many of these teachers have
adequate knowledge to create Blogs and Wiki’s for their learners as a method of communication.
More than fifty percent (53.70%) of the respondents indicated using ICT made no impact on their
learners’ collaboration skills, and also indicated not having sufficient knowledge to know which
teaching and learning situations are best suited for ICT use (Bramald et al., 2000: 6).
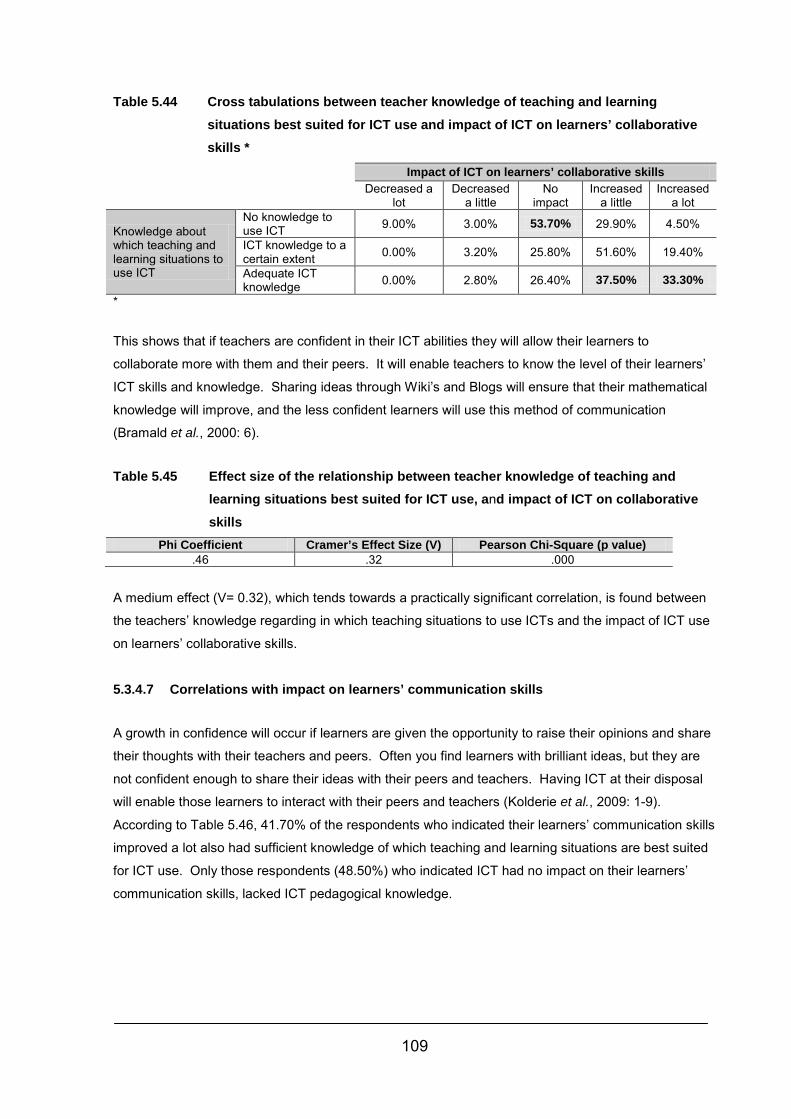
109
Table 5.44 Cross tabulations between teacher knowledge of teaching and learning situations best suited for ICT use and impact of ICT on learners’ collaborative skills *
Impact of ICT on learners’ collaborative skills Decreased a
lot Decreased
a little No
impact Increased
a little Increased
a lot
Knowledge about which teaching and learning situations to use ICT
No knowledge to use ICT 9.00% 3.00% 53.70% 29.90% 4.50%
ICT knowledge to a certain extent 0.00% 3.20% 25.80% 51.60% 19.40%
Adequate ICT knowledge 0.00% 2.80% 26.40% 37.50% 33.30%
*
This shows that if teachers are confident in their ICT abilities they will allow their learners to
collaborate more with them and their peers. It will enable teachers to know the level of their learners’
ICT skills and knowledge. Sharing ideas through Wiki’s and Blogs will ensure that their mathematical
knowledge will improve, and the less confident learners will use this method of communication
(Bramald et al., 2000: 6).
Table 5.45 Effect size of the relationship between teacher knowledge of teaching and learning situations best suited for ICT use, and impact of ICT on collaborative skills
Phi Coefficient Cramer’s Effect Size (V) Pearson Chi-Square (p value) .46 .32 .000
A medium effect (V= 0.32), which tends towards a practically significant correlation, is found between
the teachers’ knowledge regarding in which teaching situations to use ICTs and the impact of ICT use
on learners’ collaborative skills.
5.3.4.7 Correlations with impact on learners’ communication skills
A growth in confidence will occur if learners are given the opportunity to raise their opinions and share
their thoughts with their teachers and peers. Often you find learners with brilliant ideas, but they are
not confident enough to share their ideas with their peers and teachers. Having ICT at their disposal
will enable those learners to interact with their peers and teachers (Kolderie et al., 2009: 1-9).
According to Table 5.46, 41.70% of the respondents who indicated their learners’ communication skills
improved a lot also had sufficient knowledge of which teaching and learning situations are best suited
for ICT use. Only those respondents (48.50%) who indicated ICT had no impact on their learners’
communication skills, lacked ICT pedagogical knowledge.
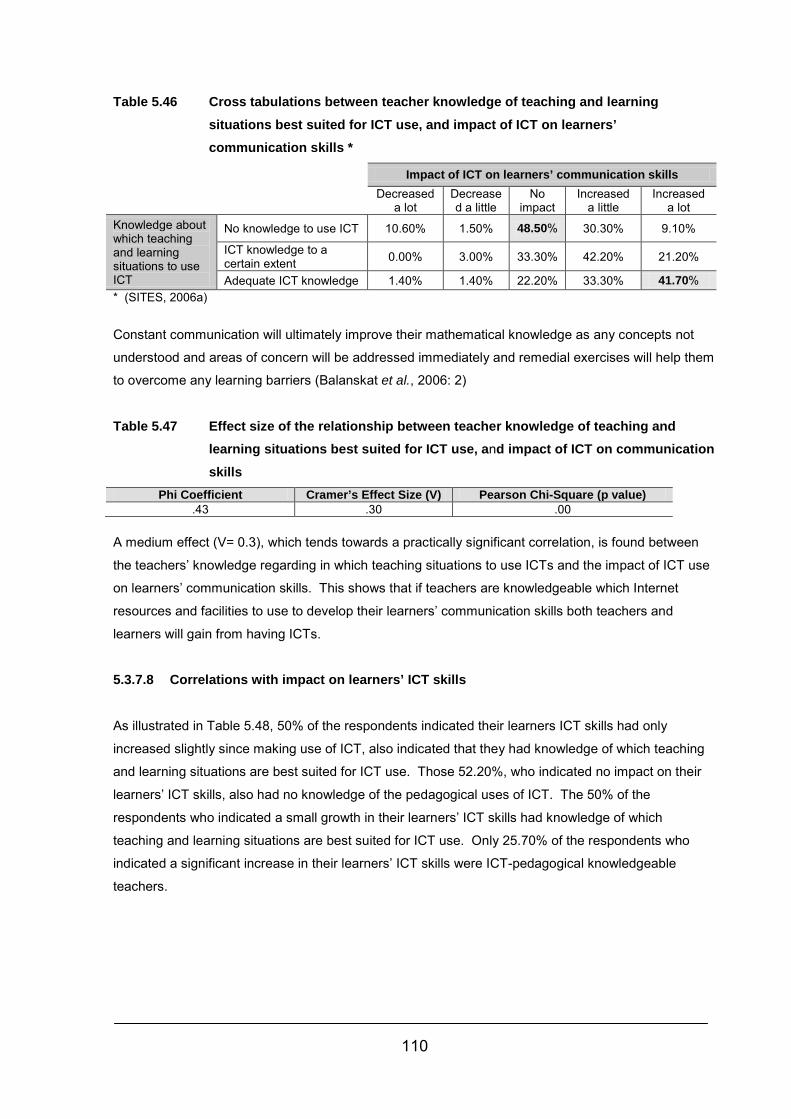
110
Table 5.46 Cross tabulations between teacher knowledge of teaching and learning situations best suited for ICT use, and impact of ICT on learners’ communication skills *
Impact of ICT on learners’ communication skills Decreased
a lot Decreased a little
No impact
Increased a little
Increased a lot
Knowledge about which teaching and learning situations to use ICT
No knowledge to use ICT 10.60% 1.50% 48.50% 30.30% 9.10%
ICT knowledge to a certain extent 0.00% 3.00% 33.30% 42.20% 21.20%
Adequate ICT knowledge 1.40% 1.40% 22.20% 33.30% 41.70% * (SITES, 2006a)
Constant communication will ultimately improve their mathematical knowledge as any concepts not
understood and areas of concern will be addressed immediately and remedial exercises will help them
to overcome any learning barriers (Balanskat et al., 2006: 2)
Table 5.47 Effect size of the relationship between teacher knowledge of teaching and learning situations best suited for ICT use, and impact of ICT on communication skills
Phi Coefficient Cramer’s Effect Size (V) Pearson Chi-Square (p value) .43 .30 .00
A medium effect (V= 0.3), which tends towards a practically significant correlation, is found between
the teachers’ knowledge regarding in which teaching situations to use ICTs and the impact of ICT use
on learners’ communication skills. This shows that if teachers are knowledgeable which Internet
resources and facilities to use to develop their learners’ communication skills both teachers and
learners will gain from having ICTs.
5.3.7.8 Correlations with impact on learners’ ICT skills
As illustrated in Table 5.48, 50% of the respondents indicated their learners ICT skills had only
increased slightly since making use of ICT, also indicated that they had knowledge of which teaching
and learning situations are best suited for ICT use. Those 52.20%, who indicated no impact on their
learners’ ICT skills, also had no knowledge of the pedagogical uses of ICT. The 50% of the
respondents who indicated a small growth in their learners’ ICT skills had knowledge of which
teaching and learning situations are best suited for ICT use. Only 25.70% of the respondents who
indicated a significant increase in their learners’ ICT skills were ICT-pedagogical knowledgeable
teachers.
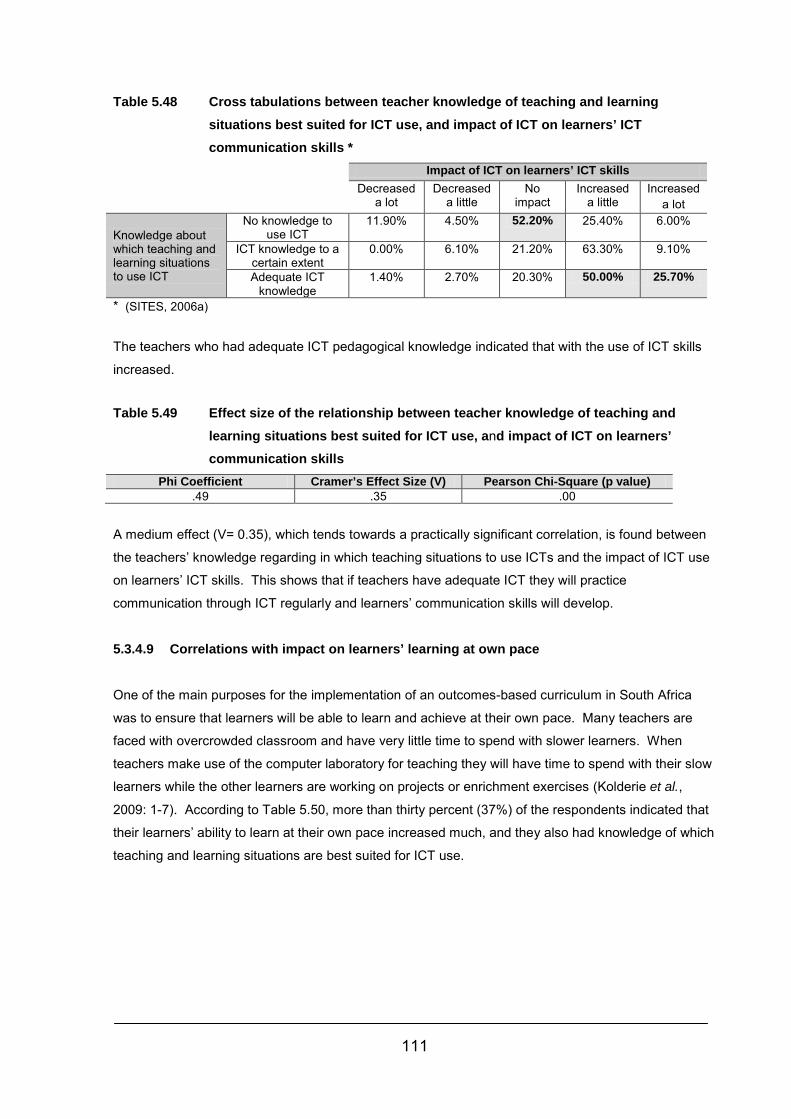
111
Table 5.48 Cross tabulations between teacher knowledge of teaching and learning situations best suited for ICT use, and impact of ICT on learners’ ICT communication skills *
Impact of ICT on learners’ ICT skills Decreased
a lot Decreased
a little No
impact Increased
a little Increased
a lot
Knowledge about which teaching and learning situations to use ICT
No knowledge to use ICT
11.90% 4.50% 52.20% 25.40% 6.00%
ICT knowledge to a certain extent
0.00% 6.10% 21.20% 63.30% 9.10%
Adequate ICT knowledge
1.40% 2.70% 20.30% 50.00% 25.70%
* (SITES, 2006a)
The teachers who had adequate ICT pedagogical knowledge indicated that with the use of ICT skills
increased.
Table 5.49 Effect size of the relationship between teacher knowledge of teaching and learning situations best suited for ICT use, and impact of ICT on learners’ communication skills
Phi Coefficient Cramer’s Effect Size (V) Pearson Chi-Square (p value) .49 .35 .00
A medium effect (V= 0.35), which tends towards a practically significant correlation, is found between
the teachers’ knowledge regarding in which teaching situations to use ICTs and the impact of ICT use
on learners’ ICT skills. This shows that if teachers have adequate ICT they will practice
communication through ICT regularly and learners’ communication skills will develop.
5.3.4.9 Correlations with impact on learners’ learning at own pace
One of the main purposes for the implementation of an outcomes-based curriculum in South Africa
was to ensure that learners will be able to learn and achieve at their own pace. Many teachers are
faced with overcrowded classroom and have very little time to spend with slower learners. When
teachers make use of the computer laboratory for teaching they will have time to spend with their slow
learners while the other learners are working on projects or enrichment exercises (Kolderie et al.,
2009: 1-7). According to Table 5.50, more than thirty percent (37%) of the respondents indicated that
their learners’ ability to learn at their own pace increased much, and they also had knowledge of which
teaching and learning situations are best suited for ICT use.
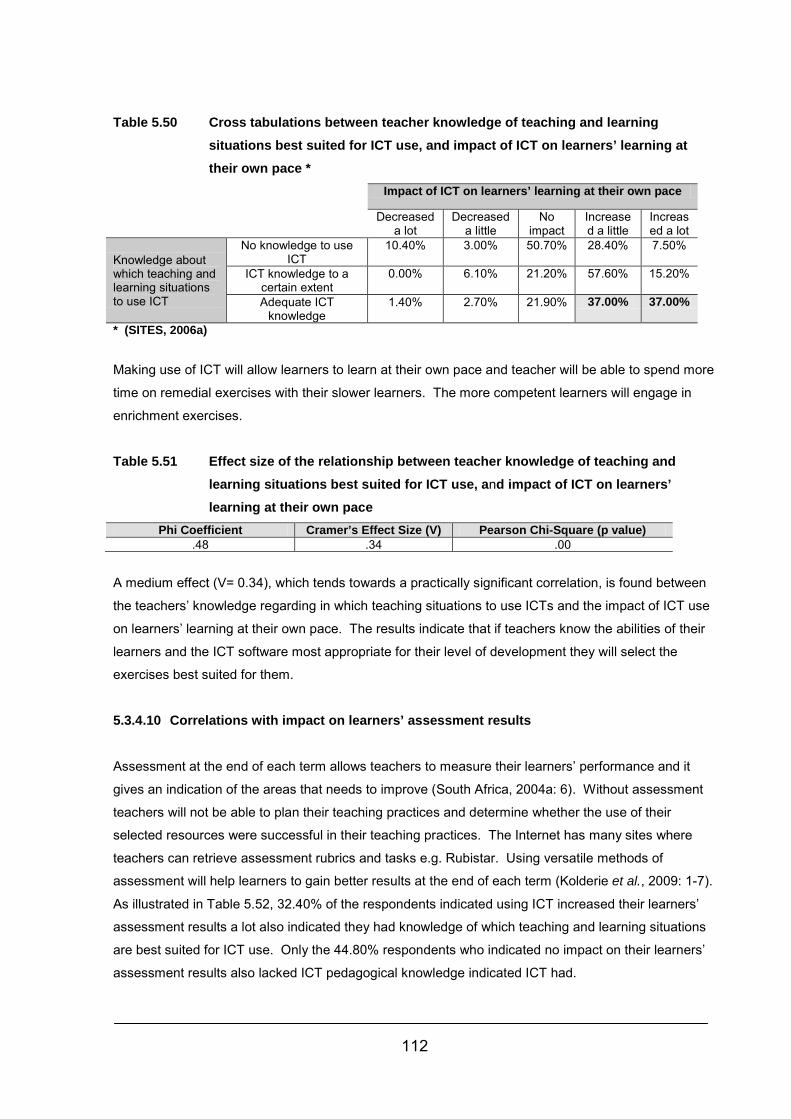
112
Table 5.50 Cross tabulations between teacher knowledge of teaching and learning situations best suited for ICT use, and impact of ICT on learners’ learning at their own pace *
Impact of ICT on learners’ learning at their own pace
Decreased a lot
Decreased a little
No impact
Increased a little
Increased a lot
Knowledge about which teaching and learning situations to use ICT
No knowledge to use ICT
10.40% 3.00% 50.70% 28.40% 7.50%
ICT knowledge to a certain extent
0.00% 6.10% 21.20% 57.60% 15.20%
Adequate ICT knowledge
1.40% 2.70% 21.90% 37.00% 37.00%
* (SITES, 2006a)
Making use of ICT will allow learners to learn at their own pace and teacher will be able to spend more
time on remedial exercises with their slower learners. The more competent learners will engage in
enrichment exercises.
Table 5.51 Effect size of the relationship between teacher knowledge of teaching and learning situations best suited for ICT use, and impact of ICT on learners’ learning at their own pace
Phi Coefficient Cramer’s Effect Size (V) Pearson Chi-Square (p value) .48 .34 .00
A medium effect (V= 0.34), which tends towards a practically significant correlation, is found between
the teachers’ knowledge regarding in which teaching situations to use ICTs and the impact of ICT use
on learners’ learning at their own pace. The results indicate that if teachers know the abilities of their
learners and the ICT software most appropriate for their level of development they will select the
exercises best suited for them.
5.3.4.10 Correlations with impact on learners’ assessment results
Assessment at the end of each term allows teachers to measure their learners’ performance and it
gives an indication of the areas that needs to improve (South Africa, 2004a: 6). Without assessment
teachers will not be able to plan their teaching practices and determine whether the use of their
selected resources were successful in their teaching practices. The Internet has many sites where
teachers can retrieve assessment rubrics and tasks e.g. Rubistar. Using versatile methods of
assessment will help learners to gain better results at the end of each term (Kolderie et al., 2009: 1-7).
As illustrated in Table 5.52, 32.40% of the respondents indicated using ICT increased their learners’
assessment results a lot also indicated they had knowledge of which teaching and learning situations
are best suited for ICT use. Only the 44.80% respondents who indicated no impact on their learners’
assessment results also lacked ICT pedagogical knowledge indicated ICT had.
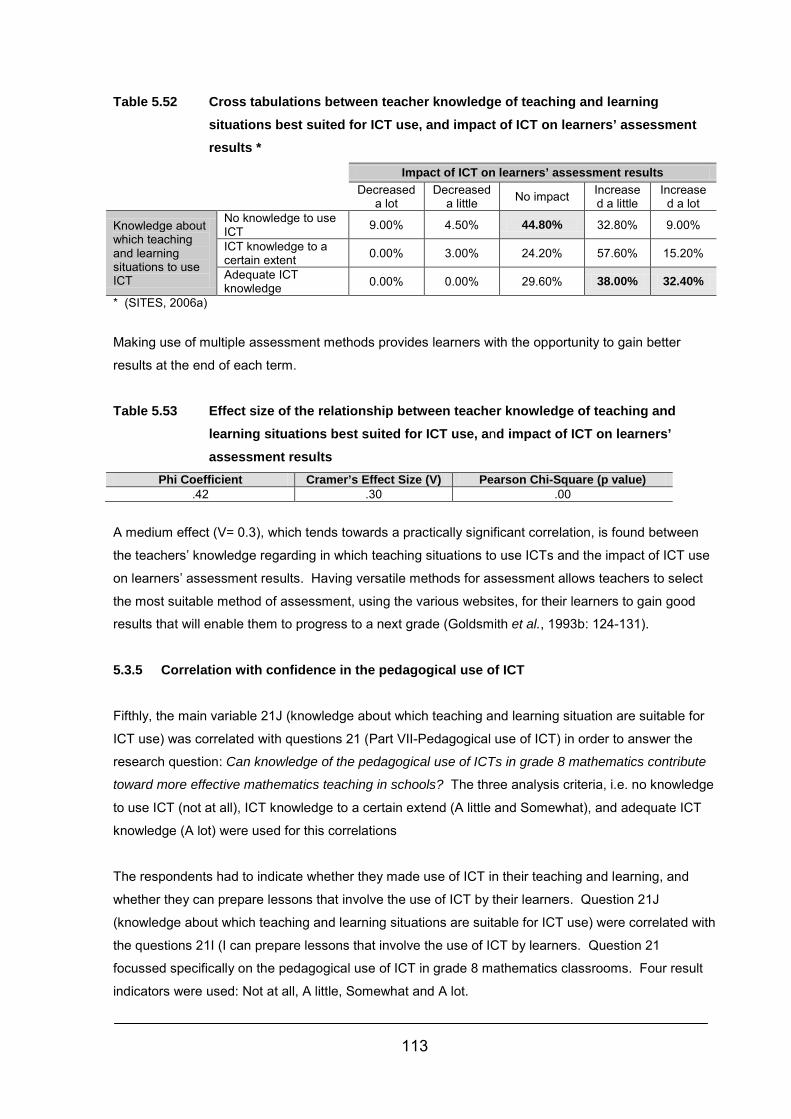
113
Table 5.52 Cross tabulations between teacher knowledge of teaching and learning situations best suited for ICT use, and impact of ICT on learners’ assessment results *
Impact of ICT on learners’ assessment results Decreased
a lot Decreased
a little No impact Increased a little
Increased a lot
Knowledge about which teaching and learning situations to use ICT
No knowledge to use ICT 9.00% 4.50% 44.80% 32.80% 9.00%
ICT knowledge to a certain extent 0.00% 3.00% 24.20% 57.60% 15.20%
Adequate ICT knowledge 0.00% 0.00% 29.60% 38.00% 32.40%
* (SITES, 2006a)
Making use of multiple assessment methods provides learners with the opportunity to gain better
results at the end of each term.
Table 5.53 Effect size of the relationship between teacher knowledge of teaching and learning situations best suited for ICT use, and impact of ICT on learners’ assessment results
Phi Coefficient Cramer’s Effect Size (V) Pearson Chi-Square (p value) .42 .30 .00
A medium effect (V= 0.3), which tends towards a practically significant correlation, is found between
the teachers’ knowledge regarding in which teaching situations to use ICTs and the impact of ICT use
on learners’ assessment results. Having versatile methods for assessment allows teachers to select
the most suitable method of assessment, using the various websites, for their learners to gain good
results that will enable them to progress to a next grade (Goldsmith et al., 1993b: 124-131).
5.3.5 Correlation with confidence in the pedagogical use of ICT
Fifthly, the main variable 21J (knowledge about which teaching and learning situation are suitable for
ICT use) was correlated with questions 21 (Part VII-Pedagogical use of ICT) in order to answer the
research question: Can knowledge of the pedagogical use of ICTs in grade 8 mathematics contribute
toward more effective mathematics teaching in schools? The three analysis criteria, i.e. no knowledge
to use ICT (not at all), ICT knowledge to a certain extend (A little and Somewhat), and adequate ICT
knowledge (A lot) were used for this correlations
The respondents had to indicate whether they made use of ICT in their teaching and learning, and
whether they can prepare lessons that involve the use of ICT by their learners. Question 21J
(knowledge about which teaching and learning situations are suitable for ICT use) were correlated with
the questions 21I (I can prepare lessons that involve the use of ICT by learners. Question 21
focussed specifically on the pedagogical use of ICT in grade 8 mathematics classrooms. Four result
indicators were used: Not at all, A little, Somewhat and A lot.
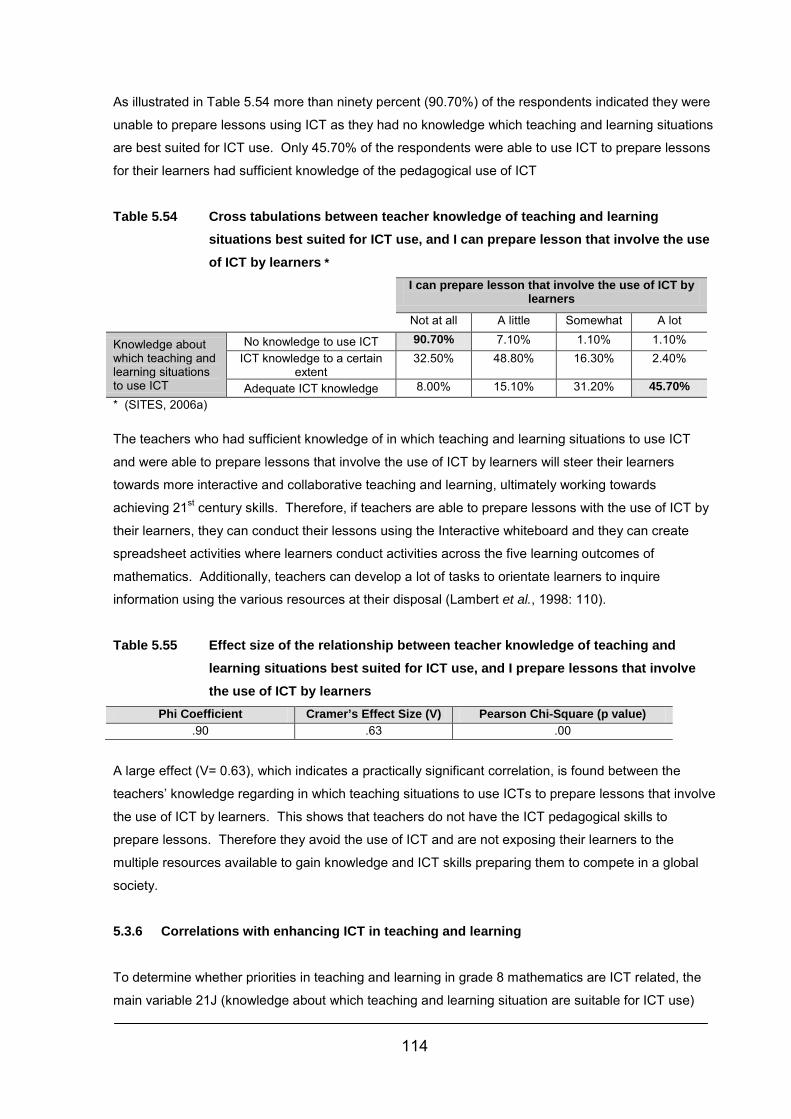
114
As illustrated in Table 5.54 more than ninety percent (90.70%) of the respondents indicated they were
unable to prepare lessons using ICT as they had no knowledge which teaching and learning situations
are best suited for ICT use. Only 45.70% of the respondents were able to use ICT to prepare lessons
for their learners had sufficient knowledge of the pedagogical use of ICT
Table 5.54 Cross tabulations between teacher knowledge of teaching and learning situations best suited for ICT use, and I can prepare lesson that involve the use of ICT by learners *
I can prepare lesson that involve the use of ICT by learners
Not at all A little Somewhat A lot
Knowledge about which teaching and learning situations to use ICT
No knowledge to use ICT 90.70% 7.10% 1.10% 1.10% ICT knowledge to a certain
extent 32.50% 48.80% 16.30% 2.40%
Adequate ICT knowledge 8.00% 15.10% 31.20% 45.70% * (SITES, 2006a) The teachers who had sufficient knowledge of in which teaching and learning situations to use ICT
and were able to prepare lessons that involve the use of ICT by learners will steer their learners
towards more interactive and collaborative teaching and learning, ultimately working towards
achieving 21st century skills. Therefore, if teachers are able to prepare lessons with the use of ICT by
their learners, they can conduct their lessons using the Interactive whiteboard and they can create
spreadsheet activities where learners conduct activities across the five learning outcomes of
mathematics. Additionally, teachers can develop a lot of tasks to orientate learners to inquire
information using the various resources at their disposal (Lambert et al., 1998: 110).
Table 5.55 Effect size of the relationship between teacher knowledge of teaching and learning situations best suited for ICT use, and I prepare lessons that involve the use of ICT by learners
Phi Coefficient Cramer’s Effect Size (V) Pearson Chi-Square (p value) .90 .63 .00
A large effect (V= 0.63), which indicates a practically significant correlation, is found between the
teachers’ knowledge regarding in which teaching situations to use ICTs to prepare lessons that involve
the use of ICT by learners. This shows that teachers do not have the ICT pedagogical skills to
prepare lessons. Therefore they avoid the use of ICT and are not exposing their learners to the
multiple resources available to gain knowledge and ICT skills preparing them to compete in a global
society.
5.3.6 Correlations with enhancing ICT in teaching and learning
To determine whether priorities in teaching and learning in grade 8 mathematics are ICT related, the
main variable 21J (knowledge about which teaching and learning situation are suitable for ICT use)
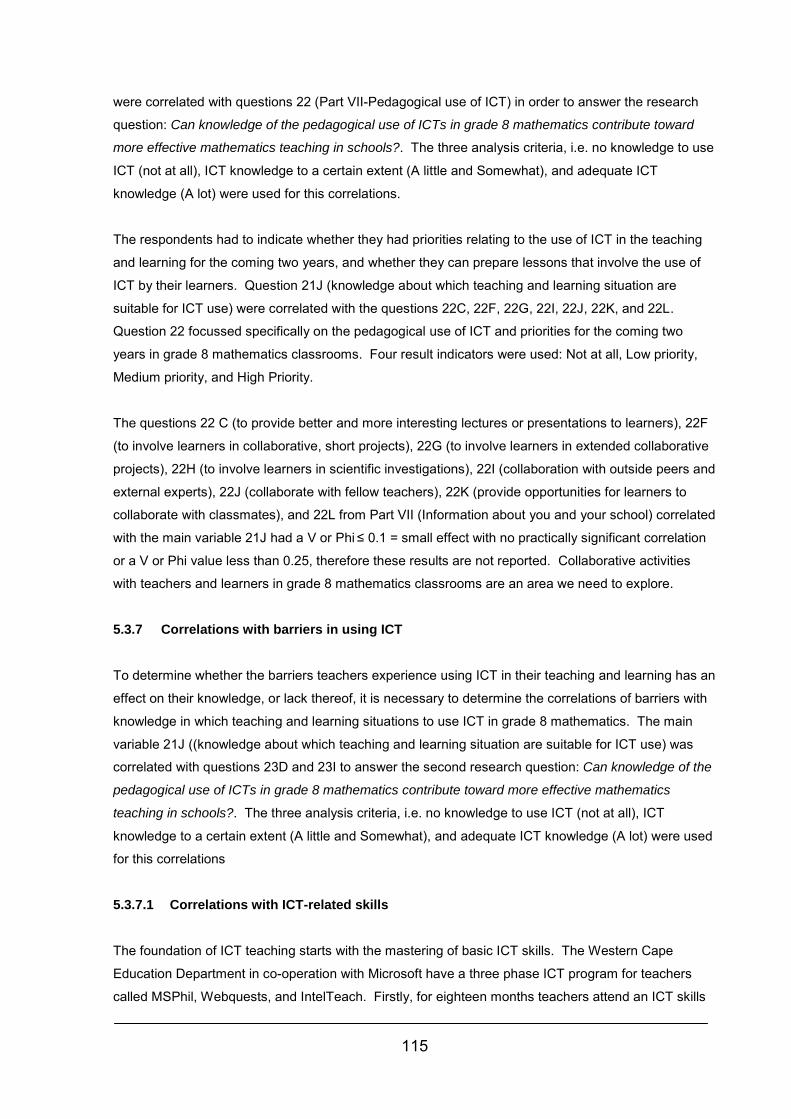
115
were correlated with questions 22 (Part VII-Pedagogical use of ICT) in order to answer the research
question: Can knowledge of the pedagogical use of ICTs in grade 8 mathematics contribute toward
more effective mathematics teaching in schools?. The three analysis criteria, i.e. no knowledge to use
ICT (not at all), ICT knowledge to a certain extent (A little and Somewhat), and adequate ICT
knowledge (A lot) were used for this correlations.
The respondents had to indicate whether they had priorities relating to the use of ICT in the teaching
and learning for the coming two years, and whether they can prepare lessons that involve the use of
ICT by their learners. Question 21J (knowledge about which teaching and learning situation are
suitable for ICT use) were correlated with the questions 22C, 22F, 22G, 22I, 22J, 22K, and 22L.
Question 22 focussed specifically on the pedagogical use of ICT and priorities for the coming two
years in grade 8 mathematics classrooms. Four result indicators were used: Not at all, Low priority,
Medium priority, and High Priority.
The questions 22 C (to provide better and more interesting lectures or presentations to learners), 22F
(to involve learners in collaborative, short projects), 22G (to involve learners in extended collaborative
projects), 22H (to involve learners in scientific investigations), 22I (collaboration with outside peers and
external experts), 22J (collaborate with fellow teachers), 22K (provide opportunities for learners to
collaborate with classmates), and 22L from Part VII (Information about you and your school) correlated
with the main variable 21J had a V or Phi ≤ 0.1 = small effect with no practically significant correlation
or a V or Phi value less than 0.25, therefore these results are not reported. Collaborative activities
with teachers and learners in grade 8 mathematics classrooms are an area we need to explore.
5.3.7 Correlations with barriers in using ICT
To determine whether the barriers teachers experience using ICT in their teaching and learning has an
effect on their knowledge, or lack thereof, it is necessary to determine the correlations of barriers with
knowledge in which teaching and learning situations to use ICT in grade 8 mathematics. The main
variable 21J ((knowledge about which teaching and learning situation are suitable for ICT use) was
correlated with questions 23D and 23I to answer the second research question: Can knowledge of the
pedagogical use of ICTs in grade 8 mathematics contribute toward more effective mathematics
teaching in schools?. The three analysis criteria, i.e. no knowledge to use ICT (not at all), ICT
knowledge to a certain extent (A little and Somewhat), and adequate ICT knowledge (A lot) were used
for this correlations
5.3.7.1 Correlations with ICT-related skills
The foundation of ICT teaching starts with the mastering of basic ICT skills. The Western Cape
Education Department in co-operation with Microsoft have a three phase ICT program for teachers
called MSPhil, Webquests, and IntelTeach. Firstly, for eighteen months teachers attend an ICT skills
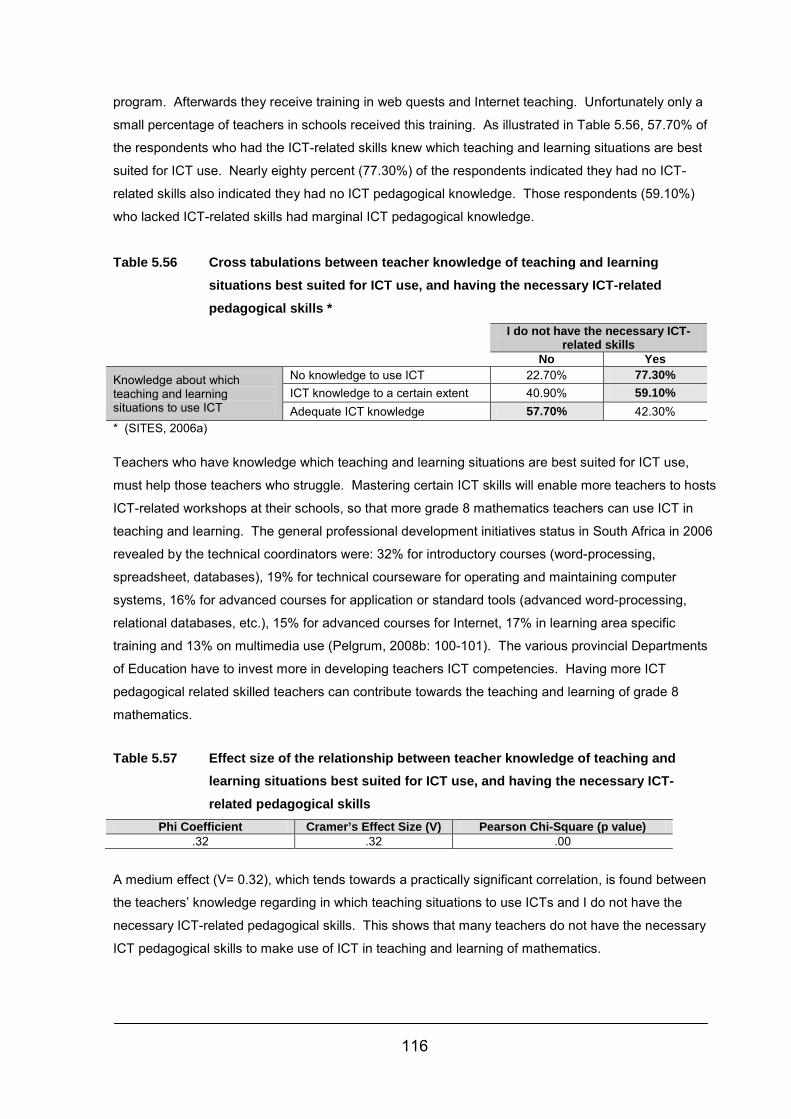
116
program. Afterwards they receive training in web quests and Internet teaching. Unfortunately only a
small percentage of teachers in schools received this training. As illustrated in Table 5.56, 57.70% of
the respondents who had the ICT-related skills knew which teaching and learning situations are best
suited for ICT use. Nearly eighty percent (77.30%) of the respondents indicated they had no ICT-
related skills also indicated they had no ICT pedagogical knowledge. Those respondents (59.10%)
who lacked ICT-related skills had marginal ICT pedagogical knowledge.
Table 5.56 Cross tabulations between teacher knowledge of teaching and learning situations best suited for ICT use, and having the necessary ICT-related pedagogical skills *
I do not have the necessary ICT-related skills
No Yes
Knowledge about which teaching and learning situations to use ICT
No knowledge to use ICT 22.70% 77.30% ICT knowledge to a certain extent 40.90% 59.10% Adequate ICT knowledge 57.70% 42.30%
* (SITES, 2006a) Teachers who have knowledge which teaching and learning situations are best suited for ICT use,
must help those teachers who struggle. Mastering certain ICT skills will enable more teachers to hosts
ICT-related workshops at their schools, so that more grade 8 mathematics teachers can use ICT in
teaching and learning. The general professional development initiatives status in South Africa in 2006
revealed by the technical coordinators were: 32% for introductory courses (word-processing,
spreadsheet, databases), 19% for technical courseware for operating and maintaining computer
systems, 16% for advanced courses for application or standard tools (advanced word-processing,
relational databases, etc.), 15% for advanced courses for Internet, 17% in learning area specific
training and 13% on multimedia use (Pelgrum, 2008b: 100-101). The various provincial Departments
of Education have to invest more in developing teachers ICT competencies. Having more ICT
pedagogical related skilled teachers can contribute towards the teaching and learning of grade 8
mathematics.
Table 5.57 Effect size of the relationship between teacher knowledge of teaching and learning situations best suited for ICT use, and having the necessary ICT-related pedagogical skills
Phi Coefficient Cramer’s Effect Size (V) Pearson Chi-Square (p value) .32 .32 .00
A medium effect (V= 0.32), which tends towards a practically significant correlation, is found between
the teachers’ knowledge regarding in which teaching situations to use ICTs and I do not have the
necessary ICT-related pedagogical skills. This shows that many teachers do not have the necessary
ICT pedagogical skills to make use of ICT in teaching and learning of mathematics.
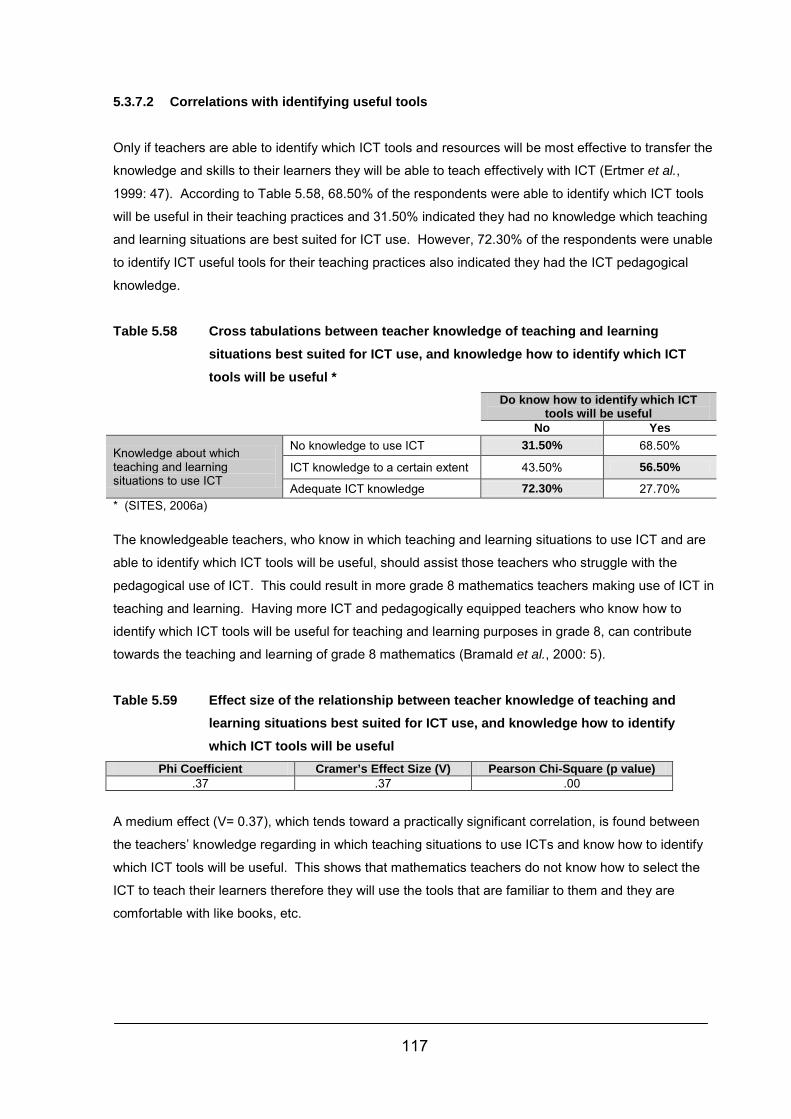
117
5.3.7.2 Correlations with identifying useful tools
Only if teachers are able to identify which ICT tools and resources will be most effective to transfer the
knowledge and skills to their learners they will be able to teach effectively with ICT (Ertmer et al.,
1999: 47). According to Table 5.58, 68.50% of the respondents were able to identify which ICT tools
will be useful in their teaching practices and 31.50% indicated they had no knowledge which teaching
and learning situations are best suited for ICT use. However, 72.30% of the respondents were unable
to identify ICT useful tools for their teaching practices also indicated they had the ICT pedagogical
knowledge.
Table 5.58 Cross tabulations between teacher knowledge of teaching and learning situations best suited for ICT use, and knowledge how to identify which ICT tools will be useful *
Do know how to identify which ICT tools will be useful
No Yes
Knowledge about which teaching and learning situations to use ICT
No knowledge to use ICT 31.50% 68.50%
ICT knowledge to a certain extent 43.50% 56.50%
Adequate ICT knowledge 72.30% 27.70% * (SITES, 2006a) The knowledgeable teachers, who know in which teaching and learning situations to use ICT and are
able to identify which ICT tools will be useful, should assist those teachers who struggle with the
pedagogical use of ICT. This could result in more grade 8 mathematics teachers making use of ICT in
teaching and learning. Having more ICT and pedagogically equipped teachers who know how to
identify which ICT tools will be useful for teaching and learning purposes in grade 8, can contribute
towards the teaching and learning of grade 8 mathematics (Bramald et al., 2000: 5).
Table 5.59 Effect size of the relationship between teacher knowledge of teaching and learning situations best suited for ICT use, and knowledge how to identify which ICT tools will be useful
Phi Coefficient Cramer’s Effect Size (V) Pearson Chi-Square (p value) .37 .37 .00
A medium effect (V= 0.37), which tends toward a practically significant correlation, is found between
the teachers’ knowledge regarding in which teaching situations to use ICTs and know how to identify
which ICT tools will be useful. This shows that mathematics teachers do not know how to select the
ICT to teach their learners therefore they will use the tools that are familiar to them and they are
comfortable with like books, etc.
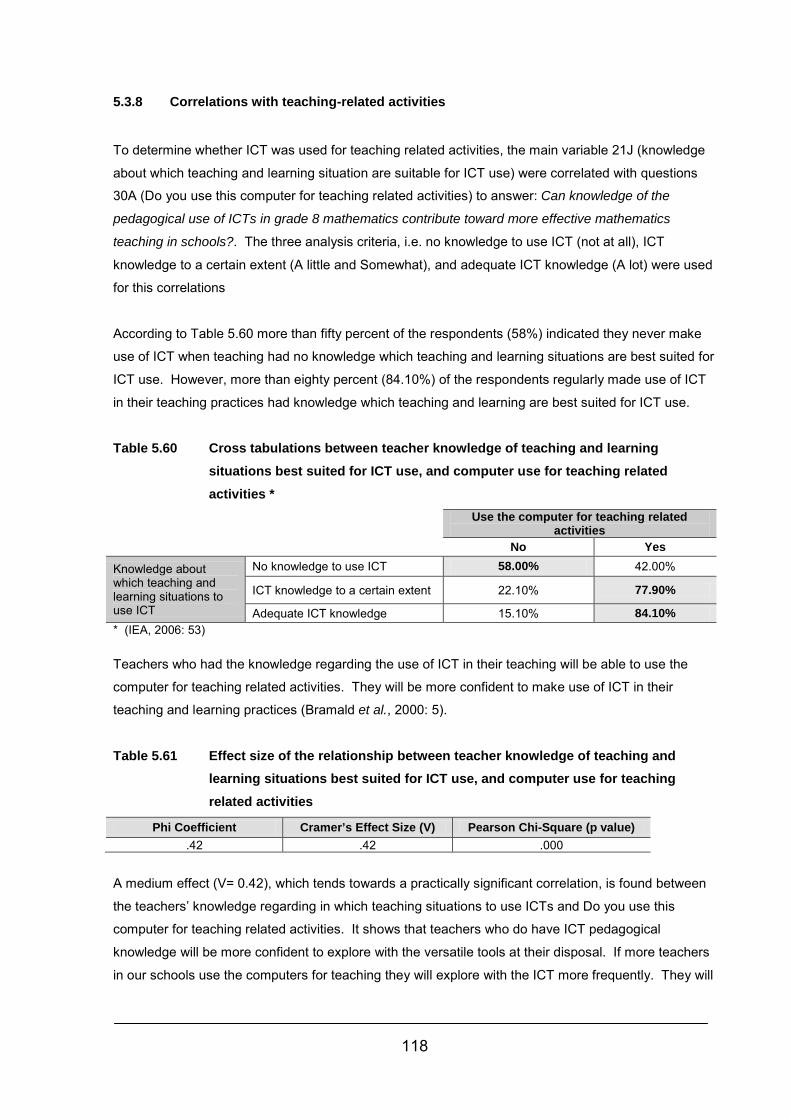
118
5.3.8 Correlations with teaching-related activities
To determine whether ICT was used for teaching related activities, the main variable 21J (knowledge
about which teaching and learning situation are suitable for ICT use) were correlated with questions
30A (Do you use this computer for teaching related activities) to answer: Can knowledge of the
pedagogical use of ICTs in grade 8 mathematics contribute toward more effective mathematics
teaching in schools?. The three analysis criteria, i.e. no knowledge to use ICT (not at all), ICT
knowledge to a certain extent (A little and Somewhat), and adequate ICT knowledge (A lot) were used
for this correlations
According to Table 5.60 more than fifty percent of the respondents (58%) indicated they never make
use of ICT when teaching had no knowledge which teaching and learning situations are best suited for
ICT use. However, more than eighty percent (84.10%) of the respondents regularly made use of ICT
in their teaching practices had knowledge which teaching and learning are best suited for ICT use.
Table 5.60 Cross tabulations between teacher knowledge of teaching and learning situations best suited for ICT use, and computer use for teaching related activities *
Use the computer for teaching related activities
No Yes
Knowledge about which teaching and learning situations to use ICT
No knowledge to use ICT 58.00% 42.00%
ICT knowledge to a certain extent 22.10% 77.90%
Adequate ICT knowledge 15.10% 84.10% * (IEA, 2006: 53) Teachers who had the knowledge regarding the use of ICT in their teaching will be able to use the
computer for teaching related activities. They will be more confident to make use of ICT in their
teaching and learning practices (Bramald et al., 2000: 5).
Table 5.61 Effect size of the relationship between teacher knowledge of teaching and learning situations best suited for ICT use, and computer use for teaching related activities
Phi Coefficient Cramer’s Effect Size (V) Pearson Chi-Square (p value) .42 .42 .000
A medium effect (V= 0.42), which tends towards a practically significant correlation, is found between
the teachers’ knowledge regarding in which teaching situations to use ICTs and Do you use this
computer for teaching related activities. It shows that teachers who do have ICT pedagogical
knowledge will be more confident to explore with the versatile tools at their disposal. If more teachers
in our schools use the computers for teaching they will explore with the ICT more frequently. They will
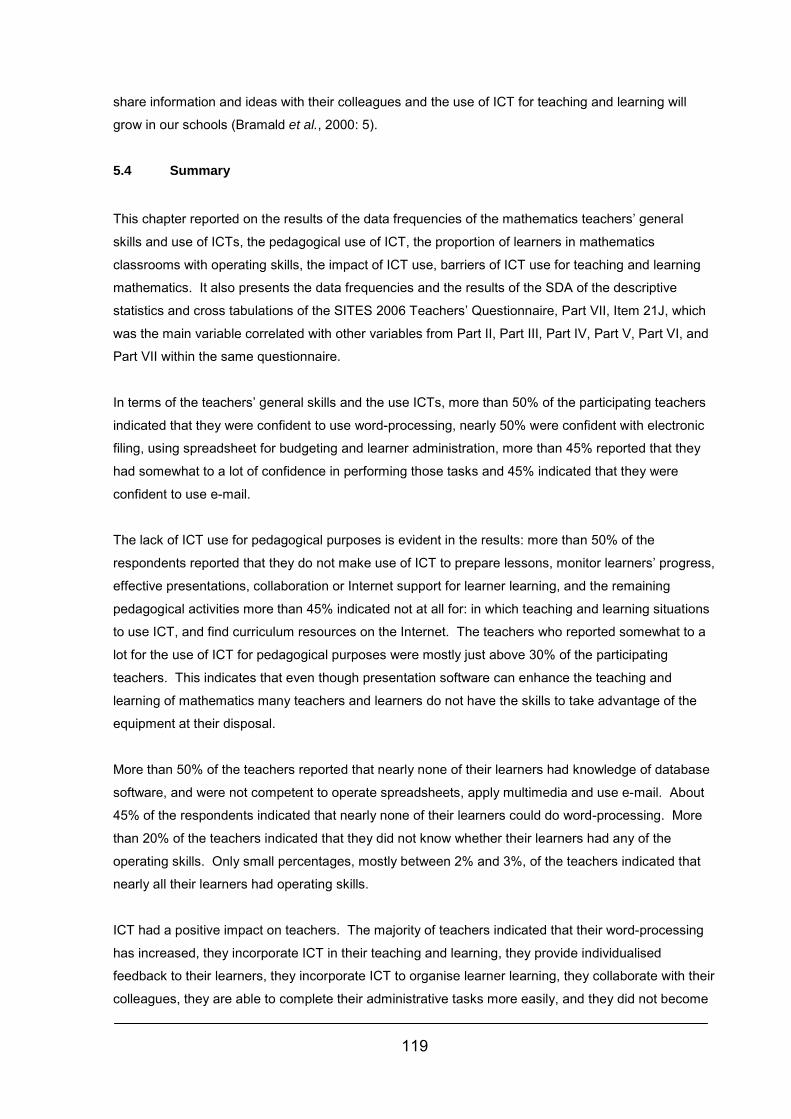
119
share information and ideas with their colleagues and the use of ICT for teaching and learning will
grow in our schools (Bramald et al., 2000: 5).
5.4 Summary
This chapter reported on the results of the data frequencies of the mathematics teachers’ general
skills and use of ICTs, the pedagogical use of ICT, the proportion of learners in mathematics
classrooms with operating skills, the impact of ICT use, barriers of ICT use for teaching and learning
mathematics. It also presents the data frequencies and the results of the SDA of the descriptive
statistics and cross tabulations of the SITES 2006 Teachers’ Questionnaire, Part VII, Item 21J, which
was the main variable correlated with other variables from Part II, Part III, Part IV, Part V, Part VI, and
Part VII within the same questionnaire.
In terms of the teachers’ general skills and the use ICTs, more than 50% of the participating teachers
indicated that they were confident to use word-processing, nearly 50% were confident with electronic
filing, using spreadsheet for budgeting and learner administration, more than 45% reported that they
had somewhat to a lot of confidence in performing those tasks and 45% indicated that they were
confident to use e-mail.
The lack of ICT use for pedagogical purposes is evident in the results: more than 50% of the
respondents reported that they do not make use of ICT to prepare lessons, monitor learners’ progress,
effective presentations, collaboration or Internet support for learner learning, and the remaining
pedagogical activities more than 45% indicated not at all for: in which teaching and learning situations
to use ICT, and find curriculum resources on the Internet. The teachers who reported somewhat to a
lot for the use of ICT for pedagogical purposes were mostly just above 30% of the participating
teachers. This indicates that even though presentation software can enhance the teaching and
learning of mathematics many teachers and learners do not have the skills to take advantage of the
equipment at their disposal.
More than 50% of the teachers reported that nearly none of their learners had knowledge of database
software, and were not competent to operate spreadsheets, apply multimedia and use e-mail. About
45% of the respondents indicated that nearly none of their learners could do word-processing. More
than 20% of the teachers indicated that they did not know whether their learners had any of the
operating skills. Only small percentages, mostly between 2% and 3%, of the teachers indicated that
nearly all their learners had operating skills.
ICT had a positive impact on teachers. The majority of teachers indicated that their word-processing
has increased, they incorporate ICT in their teaching and learning, they provide individualised
feedback to their learners, they incorporate ICT to organise learner learning, they collaborate with their
colleagues, they are able to complete their administrative tasks more easily, and they did not become
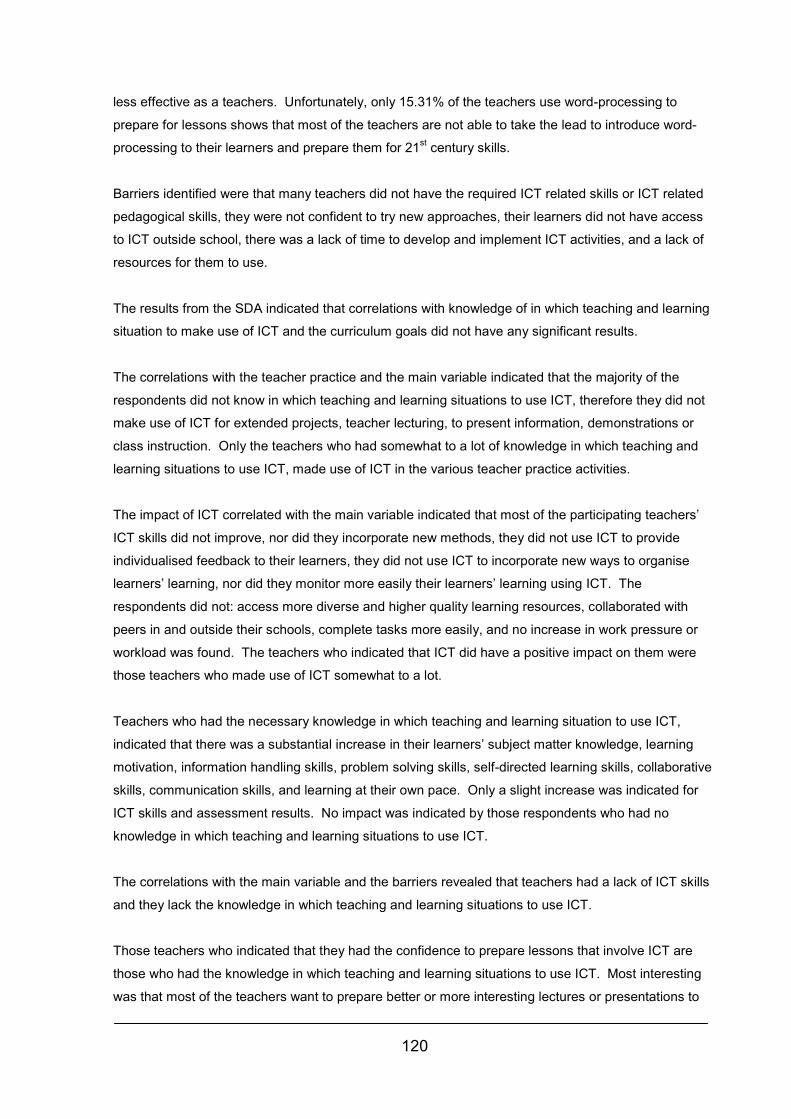
120
less effective as a teachers. Unfortunately, only 15.31% of the teachers use word-processing to
prepare for lessons shows that most of the teachers are not able to take the lead to introduce word-
processing to their learners and prepare them for 21st century skills.
Barriers identified were that many teachers did not have the required ICT related skills or ICT related
pedagogical skills, they were not confident to try new approaches, their learners did not have access
to ICT outside school, there was a lack of time to develop and implement ICT activities, and a lack of
resources for them to use.
The results from the SDA indicated that correlations with knowledge of in which teaching and learning
situation to make use of ICT and the curriculum goals did not have any significant results.
The correlations with the teacher practice and the main variable indicated that the majority of the
respondents did not know in which teaching and learning situations to use ICT, therefore they did not
make use of ICT for extended projects, teacher lecturing, to present information, demonstrations or
class instruction. Only the teachers who had somewhat to a lot of knowledge in which teaching and
learning situations to use ICT, made use of ICT in the various teacher practice activities.
The impact of ICT correlated with the main variable indicated that most of the participating teachers’
ICT skills did not improve, nor did they incorporate new methods, they did not use ICT to provide
individualised feedback to their learners, they did not use ICT to incorporate new ways to organise
learners’ learning, nor did they monitor more easily their learners’ learning using ICT. The
respondents did not: access more diverse and higher quality learning resources, collaborated with
peers in and outside their schools, complete tasks more easily, and no increase in work pressure or
workload was found. The teachers who indicated that ICT did have a positive impact on them were
those teachers who made use of ICT somewhat to a lot.
Teachers who had the necessary knowledge in which teaching and learning situation to use ICT,
indicated that there was a substantial increase in their learners’ subject matter knowledge, learning
motivation, information handling skills, problem solving skills, self-directed learning skills, collaborative
skills, communication skills, and learning at their own pace. Only a slight increase was indicated for
ICT skills and assessment results. No impact was indicated by those respondents who had no
knowledge in which teaching and learning situations to use ICT.
The correlations with the main variable and the barriers revealed that teachers had a lack of ICT skills
and they lack the knowledge in which teaching and learning situations to use ICT.
Those teachers who indicated that they had the confidence to prepare lessons that involve ICT are
those who had the knowledge in which teaching and learning situations to use ICT. Most interesting
was that most of the teachers want to prepare better or more interesting lectures or presentations to
121
their learners, even though they had no, a little, somewhat or a lot of knowledge in which teaching and
learning situations to use ICT.
If grade 8 mathematics teachers had more knowledge of in which teaching and learning situations to
use ICT, they would use it more effectively in their classes. The knowledge of the pedagogical use of
ICTs will ensure that teachers access more diverse or high-quality resources, and with a variety of
methods and resources at their disposal, it will enable them to explore within their teaching and
learning. Teachers will have multiple support methods to assist them with their teaching, a variety of
instruction methods will help them to teach more effectively, and exposing learners to different
methods of solving a problem with the help of ICT, ultimately all the resources support and variety of
methods, will contribute toward more effective teaching and learning of grade 8 mathematics.
122
Chapter Six
Conclusions and Recommendations 6.1 Introduction It is through the global knowledge economy that ICT has taken the world by storm. Many researchers
agree on the positive contribution of ICT on education: promoting problem solving, creativity,
productivity and collaboration with people in all spheres of life (Balanskat et al., 2006: 1; Bloom, 1976;
Galloway, 2007; Gardner, 1986). Therefore, one can question the reluctance of teachers to use ICT.
This research investigated the pedagogical use of ICTs for the teaching and learning of mathematics
in South African schools. It used SDA to answer the research questions of how knowledge of the
pedagogical use of ICTs contributes toward more effective mathematics teaching in schools. In this
chapter, the conclusions and implications of the findings are discussed according to the implications of
the e-Education policy (South Africa, 2004b: 22-23); the three phase plan of ICT integration into
teaching and learning by 2013, and the barriers teachers experience when implementing ICT in their
teaching and learning practices. Reflections are offered for future research on the integration of ICT
into teaching and learning in Mathematics in schools.
6.2 Summary of chapters A summary of the chapters for the research conducted.
6.2.1 Chapter one
Chapter one outlined the aim of the study, and identified the use of SDA as research methodology as
the data of SITES 2006 data were available in the public domain and has not been published
elsewhere. The researcher posed two questions (§ 1.3) to determine teachers’ pedagogical use of
ICTs for mathematics in South African schools.
6.2.2 Chapter two Chapter two discussed the mathematics education in South African schools in relation to the
philosophical views of mathematics teachers, the NCS, and the e-Education implementation model.
The problem-centred approach (PCA) represents a socio-constructivist approach embedded in the
NCS and one of the critical outcomes is to use science and technology effectively and critically (South
123
Africa, 2002: 1). The effective teaching of mathematics demands that teachers have a sound
technological pedagogical content knowledge of mathematics. They should promote mathematical
understanding, learners should be engaged and motivated, and teachers should manage teaching and
learning effectively with the multiple resources available. TIMMS, PILRS and SITES 2006 indicated
that South Africa was the poorest performing country in terms of mathematics reading skills and ICT
integration in schools. The NDoE and teachers have a huge task to raise the level of teaching and
learning in South African schools. Supplying schools with the necessary ICT infrastructure is the first
step towards ICT integration in education. Engaging with ICT when teaching their learners is the
second step. The e-Education policy (South Africa, 2004b: 22-23) with its three phase plan guides the
ICT integration process and managing the integration process. The NDoE is responsible for
managing ICT at system level, while the SMT at school level is tasked with specific ICT-related
obligations, including the planning and arranging of the ICT CPTD plan, ICT purchasing, ICT planning,
and ICT numeracy and literacy. Teachers should manage ICT at classroom level using adequate
resources, tools, training and opportunities to develop their ICT skills in line with achieving the 21st
century skills (Reynolds et al., 2003: 159).
6.2.3 Chapter three
This chapter reflect on the findings from the SITES Module 1, SITES Module 2, and SITES 2006. One
of the most important findings of SITES 2006 was that the conditions at school level in South Africa is
one of the aspects that needs to be addressed in order to achieve equality with the rest of the
participating system, especially those system that performed well in SITES 2006. South Africa did not
measure up to the other participating systems as it boasted the lowest availability of infrastructure
(38%) in 2006 whereas other participating systems had an availability of 95-100%. Access to the
results gave the NDoE an opportunity to evaluate the countries’ status of pedagogy, the ICT-use in
mathematics and science classes, the contextual factors at school and system level compared to the
rest of the participating systems. The SITES 2006 data indicated teacher professional development
opportunities were insufficient for the training of teachers for ICT integration.
Positive findings related to the development of materials for ICT use in teaching and learning and ICT
based teaching and learning takes a higher priority in South Africa than in other countries. School
principals were more eager to attend ICT training than the remaining participating systems.
Generally, teachers in South Africa are resistant to change. The majority of teachers prefer to use the
traditional method of teaching with traditional goal orientations. Many teachers only make use of ICT
to search for information. In some areas progression in terms of ICT use in teaching was found since
SITES Module 1. In South Africa in 1998 only 18% of schools used ICT and in 2006 it increased to a
mere 38%. Teachers in grade 8 Mathematics preferred to make use of teacher lectures and exercises
to practice skills and procedures. Even though a variety of resources were available in many schools,
mathematics teachers more frequently used tutorials or exercise software. Many schools have
124
sufficient ICT and infrastructure, but a low level of confidence due to insufficient ICT pedagogical
knowledge. The general use of ICT encountered the lowest usage level in South Africa, which was
only 18% for mathematics and 15.9% for natural sciences.
6.2.4 Chapter four This chapter outlines the research methodology followed during this study. It followed basic SDA of
the stratified data of 504 computer and non-computer using schools in South Africa which participated
in the SITES 2006. The study focused on the data from the mathematics Teachers’ Questionnaire.
The SITES 2006 dataset allowed the researcher to explore different themes and correlations between
variables not reported in the main study. The research collected no additional data. Data analysis
was guided by the Statistical Consultation Services from the North-West University, Potchefstroom
Campus.
A total of 640 South African grade 8 mathematics teachers comprised this dataset. The gender
distribution of the participating grade 8 mathematics teachers in South Africa was well-balanced with
306 male teachers and 334 female teachers. No identifiable information was available on the
teachers or schools that participated in the main study. Research ethics adhered to previously
approved permissions obtained during the SITES 2006. The variables of this research constituted the
pedagogical use of ICTs in the teaching and learning of mathematics.
6.3 Executive summary of the pedagogical use of ICT for the teaching and learning of grade 8 mathematics in South African schools
Chapter 5 discussed descriptive statistics relating to frequencies of the data from the SITES 2006
mathematics Teachers’ Questionnaire. The research questions addressed the extent of ICT
pedagogical practices of mathematics teachers, as well as their perceptions of the value of ICT for
mathematics education. An executive summary outline the most important findings. Table 6.1
provides a summary of the findings from the first research question, What are the pedagogical use of
ICTs for the teaching and learning of grade 8 mathematics in South African schools?
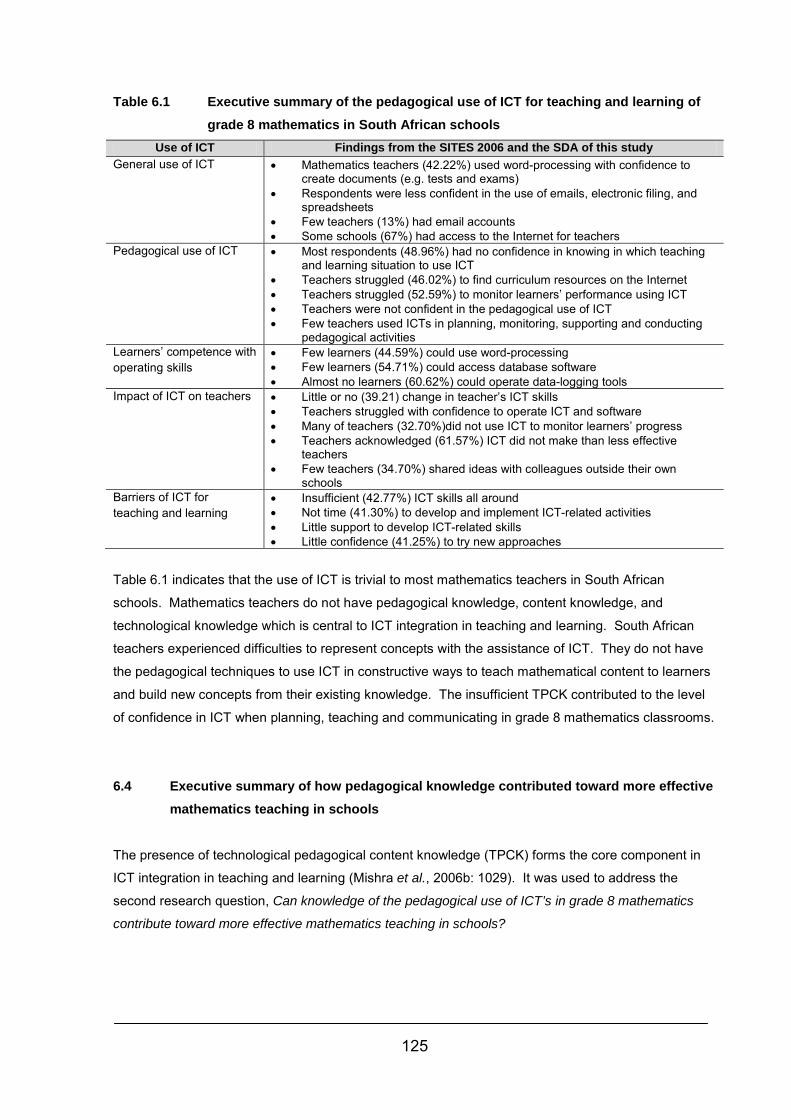
125
Table 6.1 Executive summary of the pedagogical use of ICT for teaching and learning of grade 8 mathematics in South African schools
Use of ICT Findings from the SITES 2006 and the SDA of this study General use of ICT • Mathematics teachers (42.22%) used word-processing with confidence to
create documents (e.g. tests and exams) • Respondents were less confident in the use of emails, electronic filing, and
spreadsheets • Few teachers (13%) had email accounts • Some schools (67%) had access to the Internet for teachers
Pedagogical use of ICT • Most respondents (48.96%) had no confidence in knowing in which teaching and learning situation to use ICT
• Teachers struggled (46.02%) to find curriculum resources on the Internet • Teachers struggled (52.59%) to monitor learners’ performance using ICT • Teachers were not confident in the pedagogical use of ICT • Few teachers used ICTs in planning, monitoring, supporting and conducting
pedagogical activities Learners’ competence with operating skills
• Few learners (44.59%) could use word-processing • Few learners (54.71%) could access database software • Almost no learners (60.62%) could operate data-logging tools
Impact of ICT on teachers • Little or no (39.21) change in teacher’s ICT skills • Teachers struggled with confidence to operate ICT and software • Many of teachers (32.70%)did not use ICT to monitor learners’ progress • Teachers acknowledged (61.57%) ICT did not make than less effective
teachers • Few teachers (34.70%) shared ideas with colleagues outside their own
schools Barriers of ICT for teaching and learning
• Insufficient (42.77%) ICT skills all around • Not time (41.30%) to develop and implement ICT-related activities • Little support to develop ICT-related skills • Little confidence (41.25%) to try new approaches
Table 6.1 indicates that the use of ICT is trivial to most mathematics teachers in South African
schools. Mathematics teachers do not have pedagogical knowledge, content knowledge, and
technological knowledge which is central to ICT integration in teaching and learning. South African
teachers experienced difficulties to represent concepts with the assistance of ICT. They do not have
the pedagogical techniques to use ICT in constructive ways to teach mathematical content to learners
and build new concepts from their existing knowledge. The insufficient TPCK contributed to the level
of confidence in ICT when planning, teaching and communicating in grade 8 mathematics classrooms.
6.4 Executive summary of how pedagogical knowledge contributed toward more effective mathematics teaching in schools
The presence of technological pedagogical content knowledge (TPCK) forms the core component in
ICT integration in teaching and learning (Mishra et al., 2006b: 1029). It was used to address the
second research question, Can knowledge of the pedagogical use of ICT’s in grade 8 mathematics
contribute toward more effective mathematics teaching in schools?
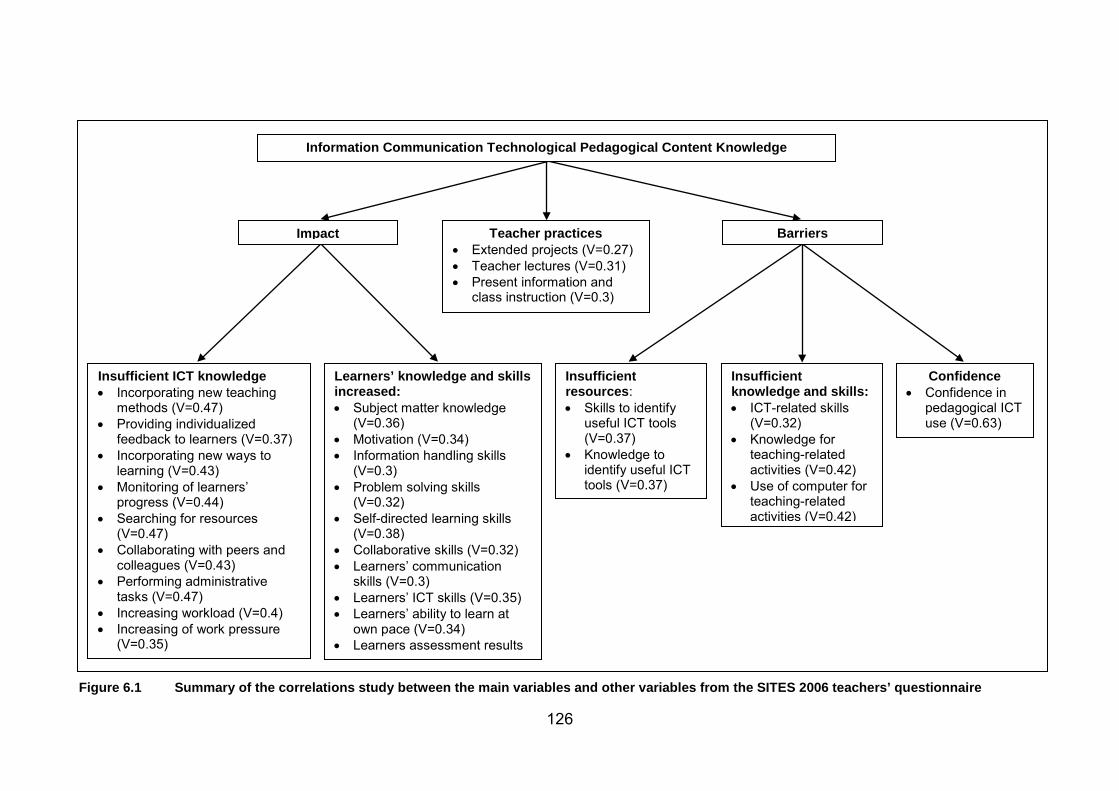
126
Figure 6.1 Summary of the correlations study between the main variables and other variables from the SITES 2006 teachers’ questionnaire
Teacher practices • Extended projects (V=0.27) • Teacher lectures (V=0.31) • Present information and
class instruction (V=0.3)
Impact Barriers
Information Communication Technological Pedagogical Content Knowledge
Insufficient ICT knowledge • Incorporating new teaching
methods (V=0.47) • Providing individualized
feedback to learners (V=0.37) • Incorporating new ways to
learning (V=0.43) • Monitoring of learners’
progress (V=0.44) • Searching for resources
(V=0.47) • Collaborating with peers and
colleagues (V=0.43) • Performing administrative
tasks (V=0.47) • Increasing workload (V=0.4) • Increasing of work pressure
(V=0.35)
Confidence • Confidence in
pedagogical ICT use (V=0.63)
Insufficient knowledge and skills: • ICT-related skills
(V=0.32) • Knowledge for
teaching-related activities (V=0.42)
• Use of computer for teaching-related activities (V=0.42)
Insufficient resources: • Skills to identify
useful ICT tools (V=0.37)
• Knowledge to identify useful ICT tools (V=0.37)
Learners’ knowledge and skills increased: • Subject matter knowledge
(V=0.36) • Motivation (V=0.34) • Information handling skills
(V=0.3) • Problem solving skills
(V=0.32) • Self-directed learning skills
(V=0.38) • Collaborative skills (V=0.32) • Learners’ communication
skills (V=0.3) • Learners’ ICT skills (V=0.35) • Learners’ ability to learn at
own pace (V=0.34) • Learners assessment results
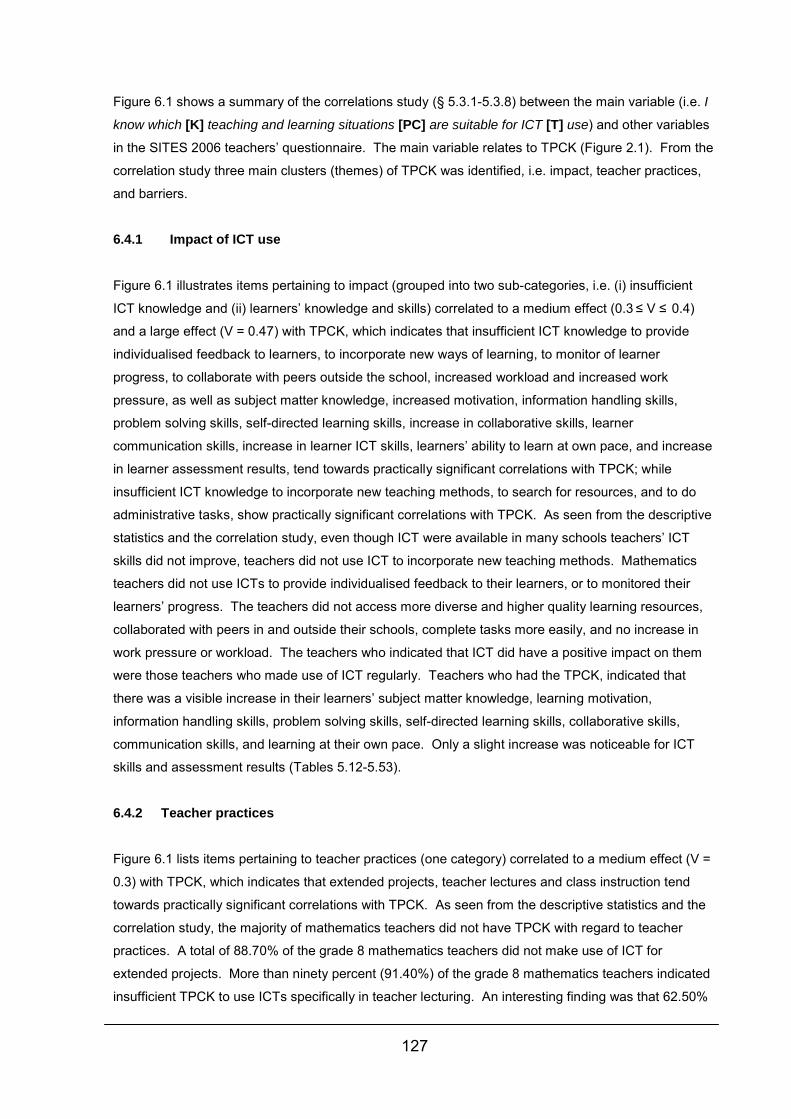
127
Figure 6.1 shows a summary of the correlations study (§ 5.3.1-5.3.8) between the main variable (i.e. I
know which [K] teaching and learning situations [PC] are suitable for ICT [T] use) and other variables
in the SITES 2006 teachers’ questionnaire. The main variable relates to TPCK (Figure 2.1). From the
correlation study three main clusters (themes) of TPCK was identified, i.e. impact, teacher practices,
and barriers.
6.4.1 Impact of ICT use
Figure 6.1 illustrates items pertaining to impact (grouped into two sub-categories, i.e. (i) insufficient
ICT knowledge and (ii) learners’ knowledge and skills) correlated to a medium effect (0.3 ≤ V ≤ 0.4)
and a large effect (V = 0.47) with TPCK, which indicates that insufficient ICT knowledge to provide
individualised feedback to learners, to incorporate new ways of learning, to monitor of learner
progress, to collaborate with peers outside the school, increased workload and increased work
pressure, as well as subject matter knowledge, increased motivation, information handling skills,
problem solving skills, self-directed learning skills, increase in collaborative skills, learner
communication skills, increase in learner ICT skills, learners’ ability to learn at own pace, and increase
in learner assessment results, tend towards practically significant correlations with TPCK; while
insufficient ICT knowledge to incorporate new teaching methods, to search for resources, and to do
administrative tasks, show practically significant correlations with TPCK. As seen from the descriptive
statistics and the correlation study, even though ICT were available in many schools teachers’ ICT
skills did not improve, teachers did not use ICT to incorporate new teaching methods. Mathematics
teachers did not use ICTs to provide individualised feedback to their learners, or to monitored their
learners’ progress. The teachers did not access more diverse and higher quality learning resources,
collaborated with peers in and outside their schools, complete tasks more easily, and no increase in
work pressure or workload. The teachers who indicated that ICT did have a positive impact on them
were those teachers who made use of ICT regularly. Teachers who had the TPCK, indicated that
there was a visible increase in their learners’ subject matter knowledge, learning motivation,
information handling skills, problem solving skills, self-directed learning skills, collaborative skills,
communication skills, and learning at their own pace. Only a slight increase was noticeable for ICT
skills and assessment results (Tables 5.12-5.53).
6.4.2 Teacher practices
Figure 6.1 lists items pertaining to teacher practices (one category) correlated to a medium effect (V =
0.3) with TPCK, which indicates that extended projects, teacher lectures and class instruction tend
towards practically significant correlations with TPCK. As seen from the descriptive statistics and the
correlation study, the majority of mathematics teachers did not have TPCK with regard to teacher
practices. A total of 88.70% of the grade 8 mathematics teachers did not make use of ICT for
extended projects. More than ninety percent (91.40%) of the grade 8 mathematics teachers indicated
insufficient TPCK to use ICTs specifically in teacher lecturing. An interesting finding was that 62.50%
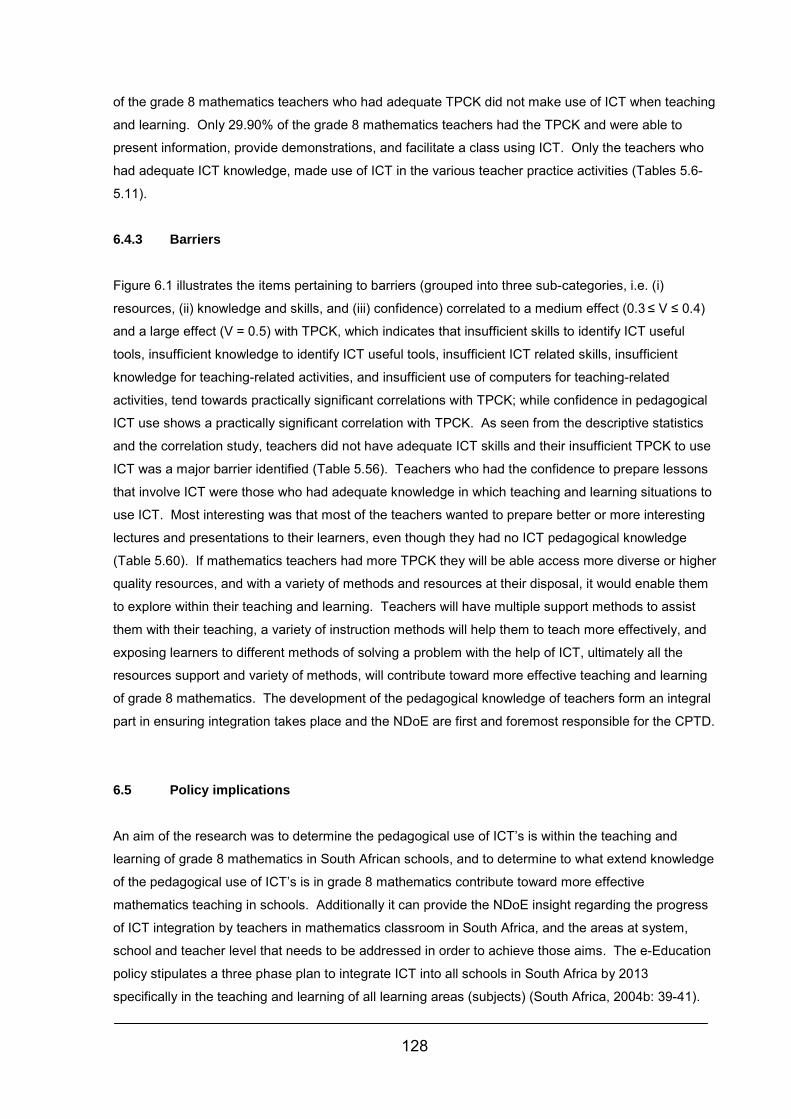
128
of the grade 8 mathematics teachers who had adequate TPCK did not make use of ICT when teaching
and learning. Only 29.90% of the grade 8 mathematics teachers had the TPCK and were able to
present information, provide demonstrations, and facilitate a class using ICT. Only the teachers who
had adequate ICT knowledge, made use of ICT in the various teacher practice activities (Tables 5.6-
5.11).
6.4.3 Barriers
Figure 6.1 illustrates the items pertaining to barriers (grouped into three sub-categories, i.e. (i)
resources, (ii) knowledge and skills, and (iii) confidence) correlated to a medium effect (0.3 ≤ V ≤ 0.4)
and a large effect (V = 0.5) with TPCK, which indicates that insufficient skills to identify ICT useful
tools, insufficient knowledge to identify ICT useful tools, insufficient ICT related skills, insufficient
knowledge for teaching-related activities, and insufficient use of computers for teaching-related
activities, tend towards practically significant correlations with TPCK; while confidence in pedagogical
ICT use shows a practically significant correlation with TPCK. As seen from the descriptive statistics
and the correlation study, teachers did not have adequate ICT skills and their insufficient TPCK to use
ICT was a major barrier identified (Table 5.56). Teachers who had the confidence to prepare lessons
that involve ICT were those who had adequate knowledge in which teaching and learning situations to
use ICT. Most interesting was that most of the teachers wanted to prepare better or more interesting
lectures and presentations to their learners, even though they had no ICT pedagogical knowledge
(Table 5.60). If mathematics teachers had more TPCK they will be able access more diverse or higher
quality resources, and with a variety of methods and resources at their disposal, it would enable them
to explore within their teaching and learning. Teachers will have multiple support methods to assist
them with their teaching, a variety of instruction methods will help them to teach more effectively, and
exposing learners to different methods of solving a problem with the help of ICT, ultimately all the
resources support and variety of methods, will contribute toward more effective teaching and learning
of grade 8 mathematics. The development of the pedagogical knowledge of teachers form an integral
part in ensuring integration takes place and the NDoE are first and foremost responsible for the CPTD.
6.5 Policy implications
An aim of the research was to determine the pedagogical use of ICT’s is within the teaching and
learning of grade 8 mathematics in South African schools, and to determine to what extend knowledge
of the pedagogical use of ICT’s is in grade 8 mathematics contribute toward more effective
mathematics teaching in schools. Additionally it can provide the NDoE insight regarding the progress
of ICT integration by teachers in mathematics classroom in South Africa, and the areas at system,
school and teacher level that needs to be addressed in order to achieve those aims. The e-Education
policy stipulates a three phase plan to integrate ICT into all schools in South Africa by 2013
specifically in the teaching and learning of all learning areas (subjects) (South Africa, 2004b: 39-41).

129
Tables 6.2-6.4 includes the three Phase ICT plan, the aims of each phase and the progress South
Africa made with implementing ICT in all educational schools, and the findings from SITES 2006
regarding the achievement of those aims set by the NDoE. It provides an overview of the plan for ICT
integration in South African schools and to what extend the NDoE achieved its aims according to the
time frames stipulated for each phase for ICT integration in schools.
6.5.1 Phase I of the e-Education policy and findings from the SDA
Phase I (2004-2007) of the e-Education policy strives to prepare the education systems ready for the
ICT integration process. However, less than 50% of the participating schools had an ICT strategic
plan in place, 11.43% of the teachers have received laptops, and 32% of the participating teachers
had access to introductory courses. One of the aims of Phase I were that managers and teachers had
to obtain a computer to assist them in administrative tasks and lesson planning. We are already in the
final quarter of 2010 and still the laptop initiative for all educators is not yet implemented. More than
40% of the participating teachers indicated they received no technical support even though 60.83% of
managers required support. It is disheartening that only 50.86% of schools in 2007 throughout South
Africa have computers available for teaching and learning. In order for any plan to be successfully
integrated the initiation process had to adhere to 100%. Unfortunately the shortcomings of the first
phase will influence the whole integration process as it has to be dealt with in the next phase, even if
each phase has its individual targets (Table 6.2).
Table 6.2 e-Education Phase I and findings from SITES 2006 and the SDA conducted for this research *
Phase I (2004-2007) Aims Findings from SDA of this study and
South Africa’s progress Enhance system-wide and institutional readiness to use ICT’s for teaching and learning (South Africa, 2004b: 39-41)
Build an education system to support ICT integration in teaching and learning: • Expertise at different levels: planning,
management, support, monitoring, and evaluation
• Ongoing support to managers at different levels
• Provinces collaborating and pool resources
• SITES 2006 indicated (Principal
Questionnaire) that (44.19%) of school managers in South Africa acknowledged that to develop a strategic plan for ICT integration
Build teachers’ and managers’ confidence in the use of ICTs: • Every teacher and manager obtain a
personal computer for administration and lesson preparing
• Teachers and managers access to basic training to use ICT
• Technology incentives • Case studies as examples to teachers and
managers to assist the integration process
• Principals in South Africa indicated
that 11.43% of their teachers have received laptops. Government laptops initiative ready for implementation stages
• Few teachers (32%) had access to introductory courses
• School managers (11.43%) indicated that they provided teachers with laptops or mobile devices
• SITES Module 2
Build a framework for competencies for teacher development in the integration of
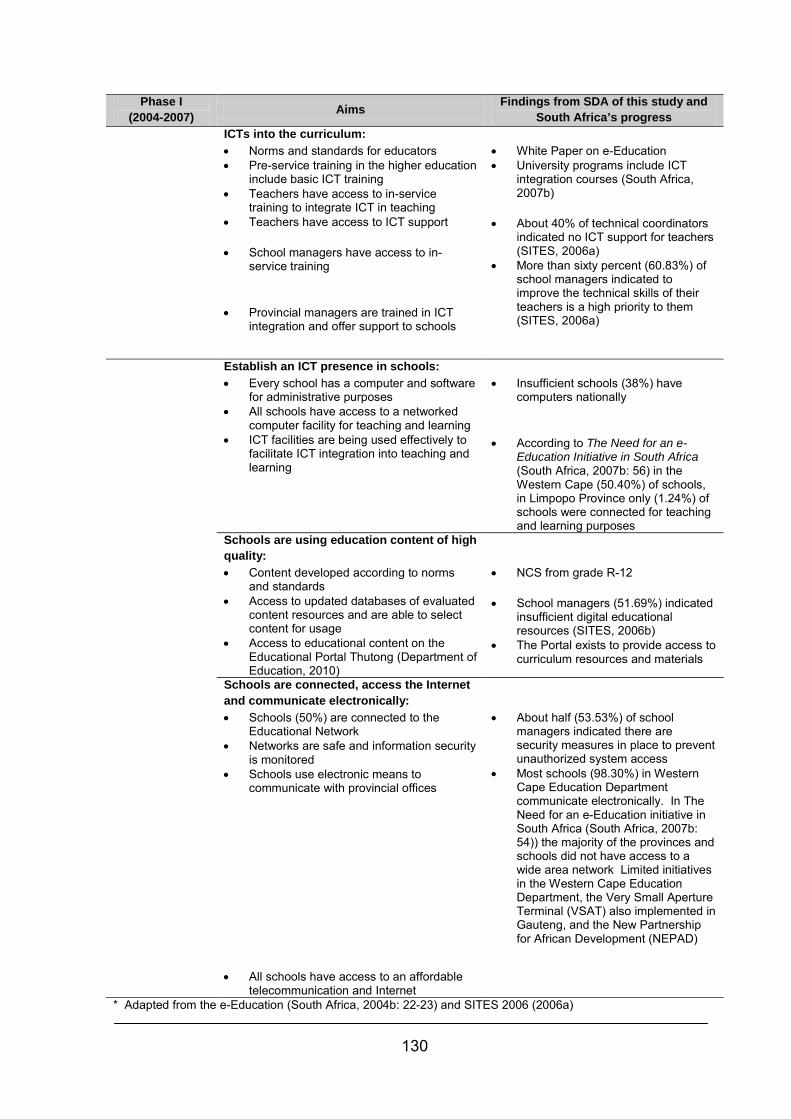
130
Phase I (2004-2007) Aims Findings from SDA of this study and
South Africa’s progress
ICTs into the curriculum: • Norms and standards for educators • Pre-service training in the higher education
include basic ICT training • Teachers have access to in-service
training to integrate ICT in teaching • Teachers have access to ICT support • School managers have access to in-
service training • Provincial managers are trained in ICT
integration and offer support to schools
• White Paper on e-Education • University programs include ICT
integration courses (South Africa, 2007b)
• About 40% of technical coordinators
indicated no ICT support for teachers (SITES, 2006a)
• More than sixty percent (60.83%) of school managers indicated to improve the technical skills of their teachers is a high priority to them (SITES, 2006a)
Establish an ICT presence in schools: • Every school has a computer and software
for administrative purposes • All schools have access to a networked
computer facility for teaching and learning • ICT facilities are being used effectively to
facilitate ICT integration into teaching and learning
• Insufficient schools (38%) have
computers nationally • According to The Need for an e-
Education Initiative in South Africa (South Africa, 2007b: 56) in the Western Cape (50.40%) of schools, in Limpopo Province only (1.24%) of schools were connected for teaching and learning purposes
Schools are using education content of high quality: • Content developed according to norms
and standards • Access to updated databases of evaluated
content resources and are able to select content for usage
• Access to educational content on the Educational Portal Thutong (Department of Education, 2010)
• NCS from grade R-12
• School managers (51.69%) indicated
insufficient digital educational resources (SITES, 2006b)
• The Portal exists to provide access to curriculum resources and materials
Schools are connected, access the Internet and communicate electronically: • Schools (50%) are connected to the
Educational Network • Networks are safe and information security
is monitored • Schools use electronic means to
communicate with provincial offices
• All schools have access to an affordable telecommunication and Internet
• About half (53.53%) of school
managers indicated there are security measures in place to prevent unauthorized system access
• Most schools (98.30%) in Western Cape Education Department communicate electronically. In The Need for an e-Education initiative in South Africa (South Africa, 2007b: 54)) the majority of the provinces and schools did not have access to a wide area network Limited initiatives in the Western Cape Education Department, the Very Small Aperture Terminal (VSAT) also implemented in Gauteng, and the New Partnership for African Development (NEPAD)
* Adapted from the e-Education (South Africa, 2004b: 22-23) and SITES 2006 (2006a)
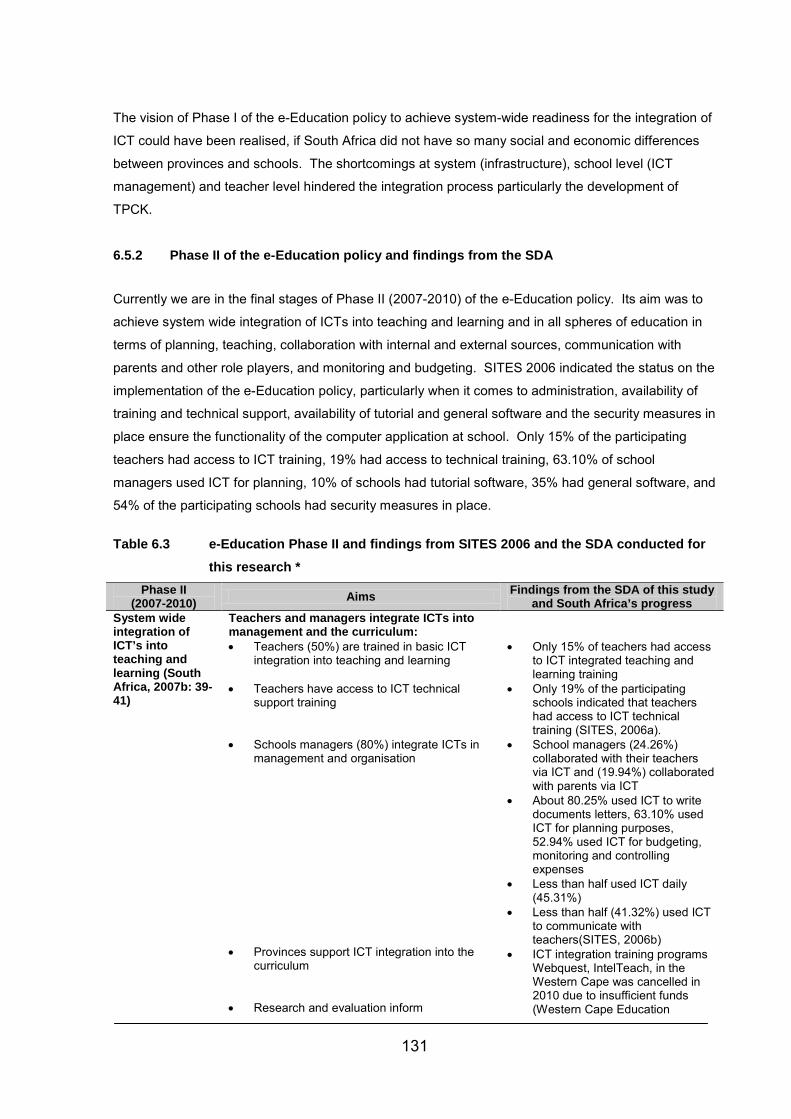
131
The vision of Phase I of the e-Education policy to achieve system-wide readiness for the integration of
ICT could have been realised, if South Africa did not have so many social and economic differences
between provinces and schools. The shortcomings at system (infrastructure), school level (ICT
management) and teacher level hindered the integration process particularly the development of
TPCK.
6.5.2 Phase II of the e-Education policy and findings from the SDA
Currently we are in the final stages of Phase II (2007-2010) of the e-Education policy. Its aim was to
achieve system wide integration of ICTs into teaching and learning and in all spheres of education in
terms of planning, teaching, collaboration with internal and external sources, communication with
parents and other role players, and monitoring and budgeting. SITES 2006 indicated the status on the
implementation of the e-Education policy, particularly when it comes to administration, availability of
training and technical support, availability of tutorial and general software and the security measures in
place ensure the functionality of the computer application at school. Only 15% of the participating
teachers had access to ICT training, 19% had access to technical training, 63.10% of school
managers used ICT for planning, 10% of schools had tutorial software, 35% had general software, and
54% of the participating schools had security measures in place. Table 6.3 e-Education Phase II and findings from SITES 2006 and the SDA conducted for
this research * Phase II
(2007-2010) Aims Findings from the SDA of this study and South Africa’s progress
System wide integration of ICT’s into teaching and learning (South Africa, 2007b: 39-41)
Teachers and managers integrate ICTs into management and the curriculum: • Teachers (50%) are trained in basic ICT
integration into teaching and learning • Teachers have access to ICT technical
support training • Schools managers (80%) integrate ICTs in
management and organisation
• Provinces support ICT integration into the
curriculum • Research and evaluation inform
• Only 15% of teachers had access
to ICT integrated teaching and learning training
• Only 19% of the participating schools indicated that teachers had access to ICT technical training (SITES, 2006a).
• School managers (24.26%) collaborated with their teachers via ICT and (19.94%) collaborated with parents via ICT
• About 80.25% used ICT to write documents letters, 63.10% used ICT for planning purposes, 52.94% used ICT for budgeting, monitoring and controlling expenses
• Less than half used ICT daily (45.31%)
• Less than half (41.32%) used ICT to communicate with teachers(SITES, 2006b)
• ICT integration training programs Webquest, IntelTeach, in the Western Cape was cancelled in 2010 due to insufficient funds (Western Cape Education
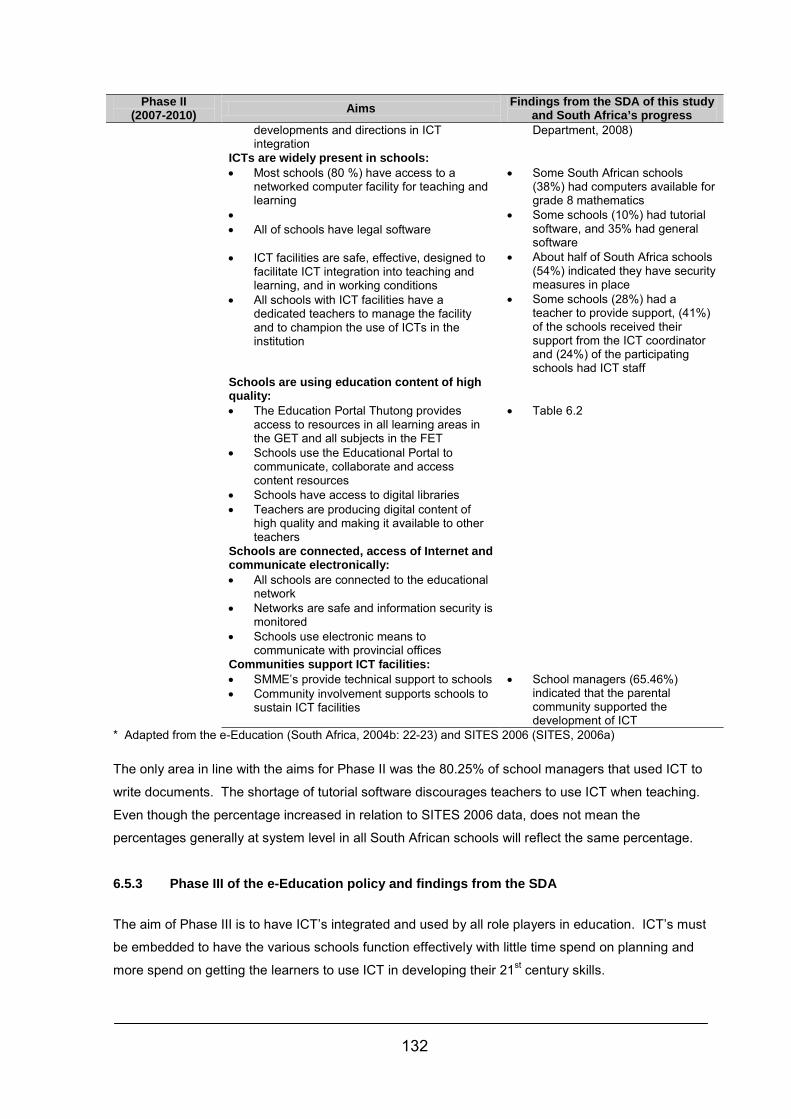
132
Phase II (2007-2010) Aims Findings from the SDA of this study
and South Africa’s progress developments and directions in ICT integration
Department, 2008)
ICTs are widely present in schools: • Most schools (80 %) have access to a
networked computer facility for teaching and learning
• • All of schools have legal software • ICT facilities are safe, effective, designed to
facilitate ICT integration into teaching and learning, and in working conditions
• All schools with ICT facilities have a dedicated teachers to manage the facility and to champion the use of ICTs in the institution
• Some South African schools
(38%) had computers available for grade 8 mathematics
• Some schools (10%) had tutorial software, and 35% had general software
• About half of South Africa schools (54%) indicated they have security measures in place
• Some schools (28%) had a teacher to provide support, (41%) of the schools received their support from the ICT coordinator and (24%) of the participating schools had ICT staff
Schools are using education content of high quality: • The Education Portal Thutong provides
access to resources in all learning areas in the GET and all subjects in the FET
• Schools use the Educational Portal to communicate, collaborate and access content resources
• Schools have access to digital libraries • Teachers are producing digital content of
high quality and making it available to other teachers
• Table 6.2
Schools are connected, access of Internet and communicate electronically: • All schools are connected to the educational
network • Networks are safe and information security is
monitored • Schools use electronic means to
communicate with provincial offices
Communities support ICT facilities: • SMME’s provide technical support to schools • Community involvement supports schools to
sustain ICT facilities
• School managers (65.46%)
indicated that the parental community supported the development of ICT
* Adapted from the e-Education (South Africa, 2004b: 22-23) and SITES 2006 (SITES, 2006a) The only area in line with the aims for Phase II was the 80.25% of school managers that used ICT to
write documents. The shortage of tutorial software discourages teachers to use ICT when teaching.
Even though the percentage increased in relation to SITES 2006 data, does not mean the
percentages generally at system level in all South African schools will reflect the same percentage.
6.5.3 Phase III of the e-Education policy and findings from the SDA
The aim of Phase III is to have ICT’s integrated and used by all role players in education. ICT’s must
be embedded to have the various schools function effectively with little time spend on planning and
more spend on getting the learners to use ICT in developing their 21st century skills.
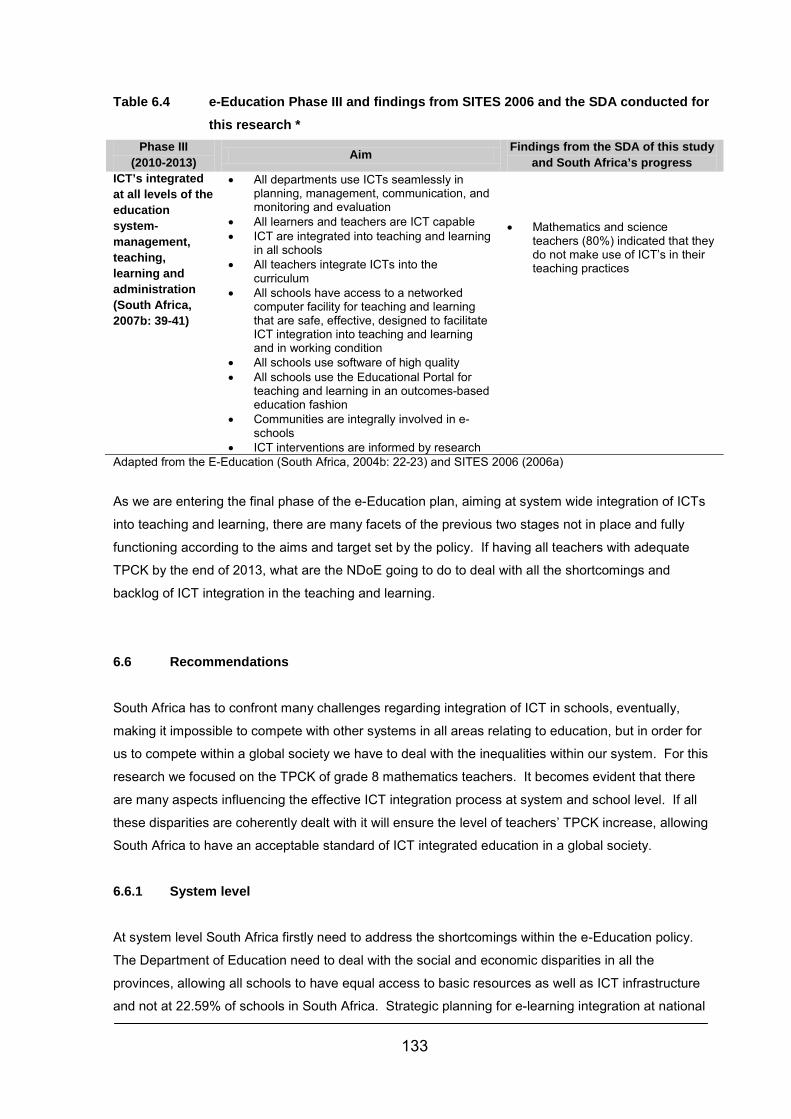
133
Table 6.4 e-Education Phase III and findings from SITES 2006 and the SDA conducted for this research *
Phase III (2010-2013) Aim Findings from the SDA of this study
and South Africa’s progress ICT’s integrated at all levels of the education system- management, teaching, learning and administration (South Africa, 2007b: 39-41)
• All departments use ICTs seamlessly in planning, management, communication, and monitoring and evaluation
• All learners and teachers are ICT capable • ICT are integrated into teaching and learning
in all schools • All teachers integrate ICTs into the
curriculum • All schools have access to a networked
computer facility for teaching and learning that are safe, effective, designed to facilitate ICT integration into teaching and learning and in working condition
• All schools use software of high quality • All schools use the Educational Portal for
teaching and learning in an outcomes-based education fashion
• Communities are integrally involved in e-schools
• ICT interventions are informed by research
• Mathematics and science
teachers (80%) indicated that they do not make use of ICT’s in their teaching practices
Adapted from the E-Education (South Africa, 2004b: 22-23) and SITES 2006 (2006a)
As we are entering the final phase of the e-Education plan, aiming at system wide integration of ICTs
into teaching and learning, there are many facets of the previous two stages not in place and fully
functioning according to the aims and target set by the policy. If having all teachers with adequate
TPCK by the end of 2013, what are the NDoE going to do to deal with all the shortcomings and
backlog of ICT integration in the teaching and learning.
6.6 Recommendations
South Africa has to confront many challenges regarding integration of ICT in schools, eventually,
making it impossible to compete with other systems in all areas relating to education, but in order for
us to compete within a global society we have to deal with the inequalities within our system. For this
research we focused on the TPCK of grade 8 mathematics teachers. It becomes evident that there
are many aspects influencing the effective ICT integration process at system and school level. If all
these disparities are coherently dealt with it will ensure the level of teachers’ TPCK increase, allowing
South Africa to have an acceptable standard of ICT integrated education in a global society.
6.6.1 System level
At system level South Africa firstly need to address the shortcomings within the e-Education policy.
The Department of Education need to deal with the social and economic disparities in all the
provinces, allowing all schools to have equal access to basic resources as well as ICT infrastructure
and not at 22.59% of schools in South Africa. Strategic planning for e-learning integration at national
134
and regional level must be in place. Nongovernmental schools must assist the NDoE in training
teachers for in achieving the TPCK required for ICT integration. For the stages an integrated ICT
curriculum program must be developed to assist teachers in knowing which ICT devices and software
are applicable for the content taught. The University must extend their current training program to
based on the developing of TPCK and ensure they make use of ICT when practice teaching.
Even tough OLSET, Thutong Portal and other websites are available to assist managers and teachers
in ICT integration these provisions are not adequate to address the shortcomings at system level,
therefore more websites must be created specifically to assist schools in ICT integration.
6.6.2 School level
School managers and SMT members must make ICT qualifications a prerequisite in all new staff
appointments. SMT members must motivate teachers to attend ICT training to ensure teachers have
a sound TPCK. Additionally they must supply their staff with sufficient time and opportunity to develop
ICT mediated lessons. All learning and teaching material must be held in one central location,
ensuring easy access for both teachers and learners. All schools must create a homepage so that all
parents can have access important information. A school ICT policy must be in place to address the
different elements needed to regulate the daily activities within the laboratory as well as the duties of
the different ICT committee members. Additionally a vision statement for ICT integration in all subjects
(learning areas). A framework must also be designed where teachers can work collaboratively on ICT-
mediated lessons and regular workshops should be held to showcase examples of ICT mediated
lessons.
6.6.3 Teacher level
The four areas influencing the use of ICT of teachers need to be addressed: confidence, time, access
to resources and adequate professional development. To raise the level of confidence of teachers
they have to be exposed to sufficient professional development to increase TPCK. They should use of
the time at their disposal to create ICT-mediated lesson in collaboration with their peers and
colleagues. The access to resources must be dealt with at system and school level. Knowledgeable
teachers can arrange informal ICT mediated work sessions to assist those who need guidance.
In order to raise the level of confidence of our mathematics teachers in South African schools from
30% to 100%, each stakeholder in education (system, school and teacher) must contribute to ensure
teaching and learning with ICT in South African schools become part of the daily practices.
135
6.7 Reflection on the research journey
Conducting SDA allowed the researcher to analyse the data from the SITES 2006 in order to gain
insight regarding the pedagogical practices of ICT in mathematics education in South African schools.
It allowed the researcher to correlate with the existing data to determine whether relationships
between the variables and to determine whether TPCK in grade 8 mathematics contribute towards
more effective mathematics teaching in schools. The researcher gained insight on the TPCK of
mathematics teachers and could determine the barriers hindering ICT integration in South African
schools. One restriction of using SDA from the SITES 2006 data was that it allowed the researcher to
correlate with only the data from the three questionnaires namely the teachers’, principals’, and the
technical questionnaires. The participants from the SITES 2006 in South Africa comprised 640
mathematics teachers, which is a small percentage of the total mathematics teachers in South Africa.
Therefore, more positive results could have been achieved if more teachers participated in this study.
Thank you to the IEA and SITES 2006 for being able to use the reliable dataset for my study.
136
References ANDERSON, R.E. & PLOMP, T. 2008. National Contexts. (In Law, N., Pelgrum W.J. & Plomp T., eds.
Pedagogy and Ict use in schools around the world: Finding from the IEA SITES 2006 study. Hong Kong: Centre for Information Technology in Education.)
BALANSKAT, A., BLAMIRE, R. & KEFALLA, S. 2006. The ICT Impact Report: A review of studies of ICT impact on schools in Europe. European Communities: European Schoolnet.
BALL, D.L., THAMES, M.H. & PHELPS, G. 2008. Content Knowledge for Teaching: What makes it special? Journal of Teacher Education, 59(5): 389-407
BARNHART, C. & BARNHART, R. 1990a. The World Book Dictionary. In Zenely, R.O. (Ed.) (4 ed., Vol. 2, pp. 1168-2430). Chicago: Merchandice Mart Plaza.
BARNHART, C. & BARNHART, R. 1990b. The World Book Dictionary. In Zenely, R.O. (Ed.) (4 ed., Vol. 1, pp. 1-1166). Chicago: Merchandice Mart Plaza.
BARRETT, K. 2006. Mixed-Methods, Secondary data, and action research. (In Mc Millan, J.H. & Schumacher S., eds. Research in education: evidence-based inquiry. Boston: Pearson Education.)
BECTA. 2002, 8 February 2007. The ICT Responsibilities of the Leadership Team. [Online]. Available from: http://www.becta.org,uk. Accessed: 15 February 2010.
BECTA. 2006, 27 July 2006. Organisational Information: Ardleigh Green Junior. [Online]. Available from: http://www.becta.org.uk. Accessed: 22 February 2010.
BECTA. 2008a, 10 October 2008. Professional Development for Support Staff. [Online]. Available from: http://www.becta.org,uk. Accessed: 15 February 2010.
BECTA. 2008b, 3 June 2009. Professional Development for Teachers. [Online]. Available from: http://www.becta.org,uk. Accessed: 15 February 2010.
BECTA. 2010. ICT: essential guides for school governors. [Online]. Available from: http://www.becta.org.uk. Accessed: 22 February 2010.
BECTA ICT RESEARCH. 2006. The Becta Review 2006: Evidence on the Progress of ICT in Education. [Online]. Available from: http://www.becta.org.uk. Accessed: 21 October 2010.
BLIGNAUT, S. & ELS, C. 2009. The Hare and the Tortoise: A Comparison of Nothern and Southern Hemisphere Findings of the SITES 2006. Potchefstroom: North-West University Potchefstroom.
BLIGNAUT, S. & ELS, C. 2010. Comperacy assessment of postgraduate students' readiness for higher education. Internet and HIgher Education. 13(210): 101-107
BLOGSPOT. 2008. Pedagogy. [Online]. Available from: http://pedagogy.bolgspot.com. Accessed: 13 October 2008.
BLOOM, B.S. 1976. Human Characteristics and school learning. New York: Mc Graw-Hill.
BOS, K.T. & VISSCHER, A.J. 2001. Attitudes, Policies, and the Usage at Managerial Level. (In Pelgrum, W.J. & Anderson R.E., eds. ICT and the Emerging Paradigm for Life-long Learning. 1st ed: IEA.)
137
BOSCO, A. 2004. ICT resources in the teaching of mathematics: between computer and school technologies. A case study. The Curriculum Journal, 15(3): 265-280
BRAMALD, R., MILLER, J. & HIGGINS, S. 2000. ICT, Mathematics and effective teaching. Mathematics Education Review, 12: 1-6, July 2000.
BURGESS, P. 2002. Oxford Student's Dictionary of English. In Ashby, M. (Ed.) (Third ed., Vol. 3, pp. 776). Oxford: Oxford University Press.
BURREL, G. & MORGAN, G. 1979. Sociological paradigms and organizational analysis. Brookfield: Ashgate Publishing.
CHILDS, S., BLENKINSOPP, E., HALL, A. & WALTON, G. 2005. Effective e-learning for health professionals and students-barriers and the solution. A systematic review of the literature-findings from the HeXL project. Health Information and Libraries Journal, 22(2): 13
COOPER, B., SCHLACHTER, S. & WATSON, J. eds. 1996. Multimedia: The complete guide to CD-Roms, the Internet, the World Wide Web, Virtual Reality, 3-D Games & the Information Superhighway. London: Dorling Kindersley Limited. 1-192 p.
DEPARTMENT OF EDUCATION. 2002. Revised National Curriculum Statement for Grades R-9. Pretoria: Government Gazette, 443 (23406).
DEPARTMENT OF EDUCATION. 2007. A Need for an e-Education Initiative in South Africa. Pretoria: Government Printer.
DEPARTMENT OF EDUCATION. 2010. Thutong. [Online]. Available from: http://www.thutong.doe.gov.za. Accessed: 21 September 2010.
DRENT, M. & MEELISSEN, M. 2007. Which factors obstruct or stimulate teacher educators to use ICT innovatively Computers and Education, 51(May): 187-199
DU PLESSIS, A. & WEBB, P. 2008. Generative use of computers: Promoting critical outcomes of the South African curriculum. Education as Change, 12(1): 15-27
EISON, J. 1990. Confidence in classroom: Ten maxims for New Teachers. College Teaching, 38(1): 19-21
ELLIS, S. & STEYN, H.S. 2003. Practical significance (effect sizes) versus or in combination with statistical significance (p-values). Management Dynamics, 12(4): 51-53
ELS, C. & BLIGNAUT, S. 2009. Qualitaitve case studies of context sensitive ICT pedagogical practices of teachers in the North-West Province. Paper presented at the 11th Annual Conference on World Wide Web Applications 1-5 September 2009. Retrieved from http://www.zaw3.co.za/index.php/ZA-WWW/2009/view/85/23.
ERNEST, P. 1989. The knowledge, beliefs and attitudes of the mathematics teacher: a model. Journal of Education for Teaching, 15(1): 13-33
ERTMER, P., ADDISON, P., LANE, M., ROSS, E. & WOODS, D. 1999. Examining Teachers' Beliefs about the role of Technology in the Elementary Classroom. Journal of Research on Computing in Education, 32(1): 54-72
GALLOWAY, J. 2007. Primary ICT for Teaching Assistance. First ed. Vol. 1. Glasgow: Routledge.
GARDNER, H. 1986. The mind's new science: A History of cognitive revolution. New York: Basic Books.
138
GATES, P. & VISTRO-YU, C.P. 2003. Is Mathematics for All? (In Bishop, A.J., Clements M.A., Keitel C., Kilpatrick J. & Leung F.K.S., eds. Second International Handbook of Mathematics Education. Dordrecht: Kluwer Academic Publishers.)
GIBSON, I.W. 2002. Technology Pedagogy and Education. Education Journal of Information for Teacher Education
GILLESPIE, H. 2006. Unlocking Learning and Teaching with ICT: Identifying and Overcoming Barriers. London: David Fulton Publishers.
GLASER, B.G. 1963. Retreating research materials: The use of secondary analysis by the independant researcher. The American Behavioural Scientist, 6(10): 11-14
GOLDSMITH, M. & WHARTON, M. 1993a. Knowing me, knowing you: exploring personality type and temperament. London: Ashfold Colour Press.
GOLDSMITH, M. & WHARTON, M. 1993b. Knowing you, knowing me: exploring personality type and temperament. London: Ashfold Colour Press.
GRANGER, C.A., MORBEY, M.L., LOTHERINGTON, H., OWSTON, R.D. & WIDERMAN, H.H. 2002. Factors contributing to teachers' successful implementation of IT. Journal of Computer Assisted Learning, 18(1): 480-488, 14 May 2002.
GREENBERG, R., RAPHAEL, J., KELLER, J. & TOBIAS, S. 1998. Teaching High School Science Using Image Processing: A Case Study of Implementation of Computer Technology. Journal of Research in Science Teaching, 35: 297-315
GULATI, S. 2008. Technology-enhanced learning in developing nations: a review. International Review of research in open and distance learning, 9(1): 16, February 2008.
GUNTER, M.A., ESTES, T.H. & SCHWAB, J. 2003. Instruction a Models Approach. 4th ed. Boston: Pearson.
HANDAL, B. 2004. Teachers' Instructural Beliefs About Integrating Educational Technology. e-Journal of Technology in Education, 7(1): 1-10
HEWSON, C. 2006. Secondary Analysis. (In Jupp, V., ed. The sage dictionary of research methods. London: Sage.)
HOWIE, S. 2005. Background to SITES. (In Council, H.S.R., ed. Information and Communication Technologies in South African Secondary Schools. Cape Town: HSRC Press.)
HOWIE, S.J. & BLIGNAUT, A.S. 2009. South Africa's readiness to integrate ICT into mathematics and science pedagogy in secondary schools. Education and Information Technology Journal, in press
HUETINCK, L. & MUNSHIN, S.N. 2000. Teaching Mathematics for the 21 st Century: Methods and activities for Grade 6-12 2nd ed. New Jersey: Pearson Education.
IEA. 2006. Mathematics Teacher Questionnaire with data frequencies (2008 ed., pp. 103): International Association for the Evaluation of Educational Achievement.
IEA. 2007. International Association for the Evaluation of Educational Achievement. [Online]. Available from: http://www.iea.nl/sites-m2html. Accessed: 6 May 2009.
INTERNATIONAL ASSOCIATION FOR THE EVALUATION OF EDUCATIONAL ACHIEVEMENT. 2006. SITES 2006 Second Information Technology in Education Study Teacher Questionnaire. International Association for the Evaluation of Educational Achievement.
139
ITTECHNO. 2010. IT technology. [Online]. Available from: http://www.Ittechno.com/links/spreadsheets.html. Accessed: 26 July 2010.
JARRED, D. 1998. Integrating Technology into Middle School Mathematics. New York: NWREL.
JONES, R.M. 2003. Local and National ICT policies. (In Kosma, R., ed. Technology Innovation and Educational Change. Danvers: International Society for Technology in Education.)
KENNEWELL, S. 2004. Meeting the standards in using ICT for secondary teaching: A guide to the ITT NC. New York: Routledge Falmer.
KNAPP, L.R. & GLEN, A.D. 1996. Restructuring a Traditional Junior High School in the community with Technology. Boston: Allyn & Bacon.
KOLDERIE, T. & MC DONALD, T. 2009. How Information Technology Can Enable 21st Century Schools. The Information Technology and Innovation Foundation: 1-14, July 2009.
KOSMA, R. 2003a. ICT and Educational Change. (In Kosma, R., ed. Technology Innovation and Educational Change. Danvers: International Society for Technology in Education.)
KOSMA, R. 2003b. Study procedures and first look at the data. (In Kosma, R., ed. Technology Innovation and Educational Change. Danvers: International Society for Technology in Education.)
KOSMA, R. 2003c. Summary and Implications for ICT-based Educational Change. (In Kosma, R., ed. Technology Innovation and Educational Change. Danvers: International Society for Technology in Education.)
KOSMA, R. ed. 2003d. Technology, Innovation and Educational Change. Danvers: International Society for Technology in Education. 301 p.
KOSMA, R. & MCGHEE, R. 2003. ICT and Innovative classroom practices. (In Kosma, R., ed. Technology Innovation and Educational Change. Danvers: International Society for Technology in Education.)
LAMBERT, M. & LOEWENBERG BALL, D. 1998. Teaching Multimedia, and Mathematics: Investigations and Real Practice. New York: Teachers College Press.
LAW, N. 2008. Summary and Reflections. (In Law, N., Pelgrum W.J. & Plomp T., eds. Pedagogy and Ict use in schools around the world: Findings from the IEA SITES 2006 study. Hong Kong: Centre for Information Technology in Education.)
LAW, N. & CHOW, A. 2008a. Pedagogical orientations in mathematics and science and the use of ICT. (In Law, N., Pelgrum W.J. & Plomp T., eds. Pedagogy and ICT use in schools around the world: Findings from the IEA SITES 2006 study. Hong Kong: Centre for Information Technology in Education.)
LAW, N. & CHOW, A. 2008b. Teacher characteristics, contextual factors and how these affect the pedagogical use of ICT. (In Law, N., Pelgrum W.J. & Plomp T., eds. Pedagogy and Ict use in schools around the world: Findings from the IEA SITES 2006 study. Hong Kong: Centre for Information Technology in Education.)
LAW, N. & PELGRUM, W.J. 2005. SITES 2006: Conceptual Framework and Research Design. Centre for Information Technology in Education,
LAW, N. & PELGRUM, W.J. 2008c. SITES 2006: Conceptual Framework and Research Design. Centre for Information Technology in Education,
140
LAW, N., PELGRUM, W.J., MONSEUR, C., BRESE, F., CARSTENS, R., VOOGT, J., et al. 2008d. Study Design and Methodology. (In Law, N., Pelgrum W.J. & Plomp T., eds. Pedagogy and ICT use in schools around the world: Findings from the IEA SITES 2006 study. Hong Kong: Centre for Information Technology in Education.)
LAW, N., PELGRUM, W.J. & PLOMP, T. eds. 2008e. Pedagogy and ICT use in schools around the world. Findings from the SITES 2006 Study. China: Springer. 296 p.
LEEDY, P. & ORMROD, J.E. 2005. Practical Research: Planning and Design. New Jersey: Pearson Prentice Hall.
LEWIS, P. 2001. Integrate Spreadsheets and Mathematics. [Online]. Available from: http://www.angelfire.com/wi2/spreadsheets/necc.html#IntergrateSpreadsheetsMaths. Accessed: 11 August 2010.
LIM, C.P. 2006. Effective Integration of ICT in Singapore Schools: pedagogical and policy indicators. Springer, 55: 83-116, 8 December 2006.
LIM, C.P. & KHINE, M.S. 2006. Managing Teachers’ Barriers to ICT integration in Singapore Schools. Journal of Technology and Teacher Education, 14(1): 91-125
MARANG. 2006. Marang Position Paper: Mathematics and science education research, policy and practice: do the relationships matter? Johannesburg: Marang Wits Centre for Maths and Science Education, University of the Witwatersrand.
MICROSOFT CORPORATION. 2006. Encarta Dictionary. In Corporation, M. (Ed.), Encarta: Microsoft.
MILLER, M. 2003. Four habits of highly effective math teaching. [Online]. Available from: http://www.homeschoolmath.net/teaching/teaching/php. Accessed: 11 August 2010.
MISHRA, P. 2008. TPACK. [Online]. Available from: http://www.punya.educ.msu.edu/research/tpck. Accessed: 15 October 2010.
MISHRA, P. & KOEHLER, M.J. 2006a. Technological Content Knowledge: A Framework for teacher knowledge [Electronic Version]. Teachers College Record, 108, 1017-1054. Retrieved 1 June 2009 from http://www.tcrecord.org
MISHRA, P. & KOEHLER, M.J. 2006b. Technological Pedagogical Content Knowledge: A Framework for Teacher Knowledge. Teacher College Record, 108(6): 1017-1054
MOUTON, J. 2001. How to succeed in your Master’s and Doctoral Studies: A South African guide and Resource book. 1st ed. Pretoria: Van Schaik
MULLIS, I.V.S., MARTIN, M.O., GONZALEZ, E.J. & CHROSTOWSKI, S.J. 2004. TIMMS 2003 International Mathematics Report: Trends in International Mathematics and Science study at the fourth and Eighth Grades. Boston: Boston College.
MURRAY, H., OLIVER, H. & HUMAN, P. 1998, 11 November. Learning through problem solving. (In Olivier, A. & Newstead K., eds. Twenty-second International Conference for the Psychology of Mathematics Education organised by Stellenbosch, South Africa. p. 169-185.)
NIEUWOUDT, H.D. 2000. Investing in Our Children: An Integrated Perspective of Effective Classroom Teaching. PU for CHE, Paper.
NIEUWOUDT, H.D. 2006. Approaches to the Teaching and Learning of Mathematics. An Interactive Manual for Mathematics Education Students and Mathematics Educators Potchefstroom: Keurkopie.

141
OAKLAND, C.C. 2010. Pedagogy. [Online]. Available from: www.oaklandcc.edu/assessment/terminology.htm. Accessed: 23 March 2010.
OLDKNOW, A. & TAYLOR, R. 2003. Teaching Mathematics using Information and Communications Technology. 2nd ed. London: Cromwell.
OSBORNE, J. & HENNESSEY, S. 2003. Literature Review in Science Education and the role of ICT: Promise, Problems and Future Decisions (Education No. 6). London: University of Cambrigde.
OWSTON, R.D. 2003. School Contexts, and Sustainability, and Transferability of Innovation. (In Kosma, R., ed. Technology Innovation and Educational Change. Danvers: International Society for Technology in Education.)
OZGUN-KOCA, A. 2000. Using Spreadsheet in Mathematics Education. Eric Digest. 1-4
PACALTSDORP, P. 2009. Acceptable Computer Laboratory use Policy (AUP). Pacaltsdorp Primary School, School ICT Policy.
PARTNERSHIP FOR THE 21ST CENTURY SKILLS. 2004. Framework for 21st Century Learning. [Online]. Available from: http://www.p21.org/index.php?option=com. Accessed: 14 May 2010.
PELGRUM, W. 2008a. School Practices and Conditions for Pedagogy and ICT. (In Law, N., Pelgrum W.J. & Plomp T., eds. Pedagogy and ICT Use in Schools Around the World: Findings from the IEA SITES 2006 Study. Hong Kong: Springer and Comparative Education Research Centre, The University of Hong Kong.)
PELGRUM, W.J. 2001a. Curriculum and Pedagogy. (In Pelgrum, W.J. & Anderson R.E., eds. ICT and the Emerging Paradigm for Life-long Learning. second ed: IEA.)
PELGRUM, W.J. 2001b. Infrastructure. (In Pelgrum, W.J. & Anderson R.E., eds. ICT and the Emerging Paradigm for Life-long Learning. second ed: IEA.)
PELGRUM, W.J. 2001c. Staff development. (In Pelgrum, W.J. & Anderson R.E., eds. ICT and the Emerging Paradigm for Life-long Learning. second ed: IEA.)
PELGRUM, W.J. 2008b. School practices and conditions for pedagogy and ICT. (In Law, N., Pelgrum W.J. & Plomp T., eds. Pedagogy and ICT use in schools around the world: Findings from the IEA SITES 2006 study. Hong Kong: Centre for Information Technology in Education.)
PELGRUM, W.J. & LAW, N. 2008. Introduction to SITES 2006. (In Law, N., Pelgrum W.J. & Plomp T., eds. Pedagogy and ICT use in schools around the world: Findings from the IEA SITES 2006 study. Hong Kong: Centre for Information Technology in Education.)
PLOMP, T. & ANDERSON, R.E. 2009. Introduction. (In Plomp, T., Anderson R.E., Law N. & Quale A., eds. Cross-National Infromation and Communication Technology: Policies and Practices in Education. North Carolina: Information Age Publishing, Inc.)
PROCTOR-JAMIESON, R.M., BURNETT, P.C., FINGER, G. & WATSON, G. 2006. ICT integration and the teachers' confidence in using ICT for teaching and learning in Queensland state schools. Austalian Journal of Educational Technology, 22(4): 21
REYNOLDS, D., TREHARNE, D. & TRIPP, H. 2003. ICT-Hopes And The Reality. British Journal of Educational Technology, 34(2): 151-167
RICHARDSON, J. 2000. ICT Implementation in Education: An analysis of implementation strategies in Australia, Canada, Finland and Israel. Luxembourg: Ministry of Education, Luxembourg.
RIDLON, C.L. 2004. The effect of a problem centered approach to mathematics on low-achieving sixth graders [Electronic Version]. Focus on Learning Problems in Mathematics, Spring.
142
RUTHVEN, K. & HENNESSY, S. 2000. A practitioner model of the use of computer-based tools and resources to support mathematics teaching and learning Educational Studies in Mathematics, 42(1): 47-88
RUTHVEN, K. & HENNESSY, S. 2002. A practitioner model of the use of computer-based tools and resources to support mathematics teaching and learning Educational Studies in Mathematics, 49(1): 47-88
SCHOOLNET. 2008. Intel Teach. [Online]. Available from: http://www.schoolnet.org.za/atwork/intelttf.htm. Accessed: 19 October 2010.
SCRIMSHAW, P. 2004. Enabling teachers to make successful use of ICT. British Educational Communications and Technology, 1(1): 45, June 2004.
SETATI, M. 2004. Maths is easy; teaching it is hard. City Press, 5 September.
SHULMAN, L. 2004. The Wisdom of Practice: essays on teaching, learning, and learning to teach first ed. San Francisco: Jossey-Bass.
SITES 2006. 2008. Sites in Brief. [Online]. Available from: http://www.sites2006.net/exponent/index.php?section=3. Accessed: 15 November 2008.
SITES. 2006a. South African Data Frequencies. IEA.
SITES. 2006b. South African Data Frequencies. IEA.
SITES. 2006c. South African Teachers' Questionnaire. IEA.
SITES. 2006d. South African Technical Questionnaire. IEA.
SMITH, E. 2008. Using Secondary Data in Education and Social Research. 2nd ed. New York: Bell and Bain Ltd.
SOUTH AFRICA. 2002. National Curriculum Statement Grades R-9 (Schools) Policy. Retrieved 20 June 2009. from http://education.pwc.gov.za.
SOUTH AFRICA. 2004a. National Policy on Assessment and Qualifications for Schools in the General Education and Training. In Education, D.O. (Ed.) (pp. 1-40). Pretoria: Government Printer.
SOUTH AFRICA. 2004b. White Paper on E-Education: Transforming Learning and Teaching through Information and Communication Technologies. [Online]. Available from: http://www.info.gov.za/whitepapers/2003/e-education.pdf. Accessed: 26 July 2006.
SOUTH AFRICA. 2007a. E-Learning in South Africa. Retrieved 15 May 2009. from http://www.education.gov.za.
SOUTH AFRICA. 2007b. A Need for an e-Education Initiative in South Africa. Pretoria: Government Printer.
SOUTH AFRICA. 2008. Review of Mathematics Sciences Research at South African Higher Education Institutions. [Online]. Available from: 2009.
SOUTH AFRICA. 2010, 5 July 2010. Budget 2010. [Online]. Available from: http://www.southafrica.ica.info/bugdet2010-education.htm. Accessed: 13 July 2010.
SPATZ, C. 2008. Basic statistics: Tales of distributions. Belmont: Thomson Wadsworth.
SPSS. 2007. SPSS® 16.0 for Window, Release 16.0.0, Copyright© by SPSS Inc. Chicago, Illinois.
143
STANFORD ENCYCLOPEDIA OF PHILOSOPY. 2004. Aristotle and Mathematics. [Online]. Available from: http://plato.stanford.edu/entries/aristotle-mathematics/. Accessed: 6 July 2009.
STUMPF, S.E. 1993. Aristotle. (In Socrates to Sartre. New York: McGraw-Hill.)
TEN BRUMMELHUIS, A.C.A. 1995. Models of educational change: An introduction of computers in Dutch secondary education [Electronic Version], 146. Retrieved 11 September 2009.
THOMPSON, A. 1988. Teachers’ beliefs and conceptions: A synthesis of the research (In Grouws, D.A., ed. Handbook on research on Mathematics Teaching and Learning. New York: McMillan.)
THOMPSON, A.G. 1984. The Relationships of Teachers' Conceptions of Mathematics and Mathematics Teaching to Instructural Practice. (In Carpenter, T.P., Dossey J.N. & Koehler J.L., eds. Classics in Mathematics Education Research. United States of America: The National Council of Teachers of Mathematics.)
THORNBURN, D. 2004. Technology Integration and Educational Change: Is it possible? : 9
TIROSH, D. & GRAEMER, A. 2003. Challenging and Changing Mathematics Teaching Classroom Practices. (In Bishop, A., ed. Second International Handbook of Mathematics Education. Dordrecht, Netherlands: Kluwer Academic Publishers.)
TWINER, A., BANYARD, P. & UNDERWOOD, B. 2007. Transition Between Educational Sectors and Discontinuities of ICT Resource and Pedagogy. Computers in the Schools, 24(3/4): 139-152
VALLANCE, M. 2008. Beyond Policy: Strategic actions to support ICT integration in Japanese schools. Australian Journal of Educational Technology, 24(3): 275-293
VOOGT, J. 2008. Satisfying pedagogical practices using ICT. (In Law, N., Pelgrum W.J. & Plomp T., eds. Pedagogy and Ict use in schools around the world: Finding from the IEA SITES 2006 study. Hong Kong: Centre for Information Technology in Education.)
VOOGT, J. & PELGRUM, W.J. 2003. ICT and the Curriculum. (In Kosma, R., ed. Technology Innovation and Educational Change. Danvers: International Society for Technology in Education.)
WARD, L. 2003. Teacher practice and the integration of ICT: Why aren't our secondary school teachers using computers in their classrooms. Paper presented at the NZARE / AARE 2003. Retrieved 13 October 2010.
WAY, J. & WEBB, C. 2007. A framework for analysing ICT adoption in Australian Primary Schools. Australian Journal of Educational Technology, 23(4): 559-582
WESTERN CAPE EDUCATION DEPARTMENT. 2008. Khanya. [Online]. Available from: http://www.wced.wcape.gov.za. Accessed: 6 October 2010.
WILSON, P., COONEY, T. & STINTON, W. 2005. What Constitutes Good Teaching and How It Develops: Nine High School Teachers’ Perspectives. Journal of Mathematics Teacher Education, 8(1): 83-111
ZUCKER, A.A. 2008. Transforming Schools with Technology. Cambrigde: Harvard Education Press.