Embed Size (px)
Citation preview
The Peoria Pulling Levers Drug Market Intervention: A Review of Program
Process, Changes in Perception, and Crime Impact
State of Illinois Pat Quinn, Governor Jack Cutrone, Executive Director Illinois Criminal Justice Information Authority
1
The Peoria Pulling Levers Drug Market Intervention: A Review of Program Process, Changes in Perceptions, and Crime Impact
Submitted to the Illinois Criminal Justice Information Authority
Prepared by
Nicholas Corsaro, Ph.D. Southern Illinois University – Carbondale
Rod K. Brunson, Ph.D.
Rutgers University
Jacinta M. Gau, Ph.D. California State University – San Bernardino
Christina Oldham, M.A. Student
Southern Illinois University – Carbondale
March 2011
This project was supported by Grant #08-DJ-BX-0034 awarded to the Illinois Criminal Justice Information Authority by the Bureau of Justice Assistance, Office of Justice Programs, U.S. Department of Justice. Points of view or opinions contained within this document are those of the authors and do not necessarily represent the official position or policies of the Authority or the U.S. Department of Justice.
2
Acknowledgements We are thankful to Peoria Police Chief Steve Settingsgaard and Doug Ward for their commitment to the implementation of the Peoria Drug Market Intervention, as well as their support regarding our efforts to conduct a rigorous and thorough evaluation of the initiative. In addition, we would like to thank the Peoria residents who participated in the phone surveys and in-depth interviews, which were invaluable to the research and evaluation design of the current study. Further, we sincerely appreciate Heather Perez from the Michigan State University research team for providing us with a detailed narrative of the offender notification session that took place in November 2009. Finally, we would like to thank Tracy Hahn, Mark Myrent, Christine Devitt from the Illinois Criminal Justice Information Authority (ICJIA) for their partnership and support throughout the project.
3
Peoria DMI Evaluation Executive Summary
The Peoria Drug Market Intervention (DMI) program was intended to alleviate the disproportionately high crime rates found within a high-risk, disadvantaged, and chronically violent geographic area. Officials within the city decided to implement a focused deterrence strategy that relied upon the use of target identification, investigation, and arrest sweeps followed with an offender notification session that occurred within the target neighborhood. At the core of the strategy was the enhanced prosecution of identified offenders combined with an attempt to bridge partnerships between local law enforcement and residents of the target area. Increased prosecution was designed to incapacitate chronic and violent offenders as well as to communicate a credible deterrent threat to potential replacement law violators. The public meeting (i.e., notification session) was used to publicize the increased risk of sanctions that potential replacement offenders would face if the drug markets re-emerged. This study used a variety of methodological and analytical approaches to examine the following:
• The fidelity of program implementation through the use of a detailed process assessment.
• The change in officially reported violent, property, and drug related offenses as well as calls for police service trends by relying upon interrupted time series analyses.
• Peoria residents’ perceptions of crime after the implementation of the strategy, awareness of the DMI program, and changes in police-community partnerships through the use of phone surveys that captured information from residents living in the target area, a control area, and the remainder of Peoria (for comparison purposes).
• The use of in-depth resident interviews to capture detailed information regarding the dynamics of neighborhood conditions, drug markets, and perceived police activity.
A synthesis of study results indicated that Peoria police and public officials were consistent with the fidelity of the focused deterrence framework throughout the duration of the initiative. Study results clearly indicated, however, that crime and calls for service within the target area remained relatively stable between pre- and post-intervention periods. In addition, the vast majority of target area residents that were interviewed appeared somewhat unfamiliar with the tenets and purpose of the intervention program, indicating a shortfall in the intended police-community partnership. In-depth resident interviews suggested that residents were seriously concerned with replacement offending, displacement, retaliation, and neighborhood stigmatization if they cooperated with police. We drew upon research from organizational and social disorganization theories to highlight the key themes, implications, and potential limitations of the Peoria focused deterrence strategy.
4
Table of Contents
Acknowledgements ....................................................................................................................................... 2
Peoria DMI Evaluation Executive Summary ................................................................................................ 3
Introduction ................................................................................................................................................... 5
The Evolution and Design of the Focused Deterrence Police Strategy .................................................... 5
Illicit Street Drug Markets: Crime Problems and Policing Efforts ........................................................... 8
The Peoria Drug Market Intervention: A Review of Process and Implementation .................................... 11
Intervention Setting ................................................................................................................................. 11
The Intervention Strategy ....................................................................................................................... 13
Program Implementation Summary ........................................................................................................ 19
Time Series Design and Outcome Analysis ................................................................................................ 21
Data ......................................................................................................................................................... 21
Geographic Boundaries ....................................................................................................................... 21
Variables ............................................................................................................................................. 23
Bivariate Analyses .................................................................................................................................. 24
Multivariate Analyses ............................................................................................................................. 28
Time Series Summary ............................................................................................................................. 33
Peoria Resident Survey Results .................................................................................................................. 35
Perceived Changes in Crime ................................................................................................................... 36
Awareness and Beliefs Regarding DMI Impact...................................................................................... 39
Peoria Survey Results Summary ............................................................................................................. 42
In-Depth Resident Interviews ..................................................................................................................... 44
Sample and Data ..................................................................................................................................... 44
Results ................................................................................................................................................. 45
Evaluation Summary and Discussion ......................................................................................................... 49
Traditional Law Enforcement Strategies ................................................................................................ 49
The Necessary Conditions for Social Change ......................................................................................... 50
The Peoria Findings ................................................................................................................................ 52
Implications and Conclusion ................................................................................................................... 54
Bibliography ............................................................................................................................................... 57
Appendix A: Peoria Resident Survey ......................................................................................................... 60
5
Introduction
The Evolution and Design of the Focused Deterrence Police Strategy
One of the most pervasive and important questions in criminal justice policy research is
whether law enforcement strategies can effectively impact crime. Studies testing this question
have produced somewhat mixed results. Some scholars have argued that police strategies have
little to no impact on crime (Bayley, 1994; Sherman, 1995), while others have found suggestive
evidence that certain types of police strategies can impact specific types of crime, including
robbery and homicide (MacDonald, 2002). Eck and Maguire (2000) illustrated the importance
of more thorough and comprehensive research concerning both unsuccessful and successful
policing strategies in order to make better sense of consistent patterns and themes.
A policing approach that seems to hold considerable promise is ‘deterrence-based’
policing. Sampson and Cohen (1988) illustrated that ‘proactive policing’ (i.e., law enforcement
responses to disorderly offenses) appears to correspond with lower levels of robbery over time
and Worrall (2006) found similar results with respect to assault and burglary. Kubrin et al.
(2010) re-assessed the potential relationship between proactive policing and violent crime with a
longitudinal study of large U.S. cities and similarly found support for a proactive policing effect,
net of other important measures known to influences changes in city levels of violence. In
addition to these cross-city studies, some deterrence-based initiatives have shown evidence of
‘within city’ violent crime changes.
Policing strategies that utilize focused deterrence and enhance the perceptions of risk to
identified and high-risk offenders have also shown considerable promise as a means to reduce
violent crime. For example, in response to the rise in citywide youth gun violence, Boston’s
6
Operation Ceasefire program began in the mid 1990s and was intended to reduce the high levels
of youth victimization throughout the city (Kennedy, Braga, and Piehl, 1996). Ceasefire was
initiated by a multi-agency working group involving prosecutors, police officials, youth service
officers, probation and parole officers, and social service providers. The Boston strategy was
ultimately built upon the principles of “pulling levers” policing, which requires public officials to
notify high-risk offenders of the enhanced sanctions that will be levied against them if they
continue to participate in illicit and criminal activities (Kennedy, 1997). A detailed analysis of
crime data indicated that local youth violence patterns were largely driven by a relatively small
number of chronic offenders involved in known gang-related networks. The strategy that
emerged was based upon a deterrence-driven model where the threat of federal prosecution was
communicated directly to groups of known offenders identified in the problem analysis.
Following crack-downs on several of the most violent groups and ongoing communication with
probationers and parolees connected to these offending networks, youth violence in the city
declined dramatically. After the initiative was fully implemented, the city of Boston experienced
a decline in youth gun violence of over 63 percent (Braga et al., 2001).
Based on the promise of pulling levers policing efforts, including the Boston project, in
the late 1990s, the Department of Justice (DOJ) developed the Strategic Approaches to
Community Safety Initiative (SACSI). Federal support was provided to five initial cities
(Indianapolis, IN, Memphis, TN, New Haven, CT, Portland, OR, and Winston-Salem, NC) and a
second set of cities (Albuquerque, NM, Atlanta, GA, Detroit, MI, St. Louis, MO, and Rochester,
NY). What became apparent was that many SACSI sites used strategic problem solving in order
to craft unique initiatives tailored to local contexts. For example, a number of SACSI sites used
systematic reviews of homicide incidents and gun assaults to unravel patterns of offenders,
7
victims, locations, and network connections, and then suggested specially tailored intervention
strategies. Similar to Boston, many of the SACSI sites implemented offender notification
meetings (i.e., pulling levers) in order to communicate the deterrence message and, as a way to
supplement the deterrent effect by offering troubled youths some prosocial alternatives to
delinquency and provide desisting offenders the opportunity for linkage to legitimate services.
Roehl et al. (2004) found that violent crime rates in the SACSI cities declined more dramatically
than those in comparable cities, suggesting that SACSI could have a suppressive effect on crime.
The use of specially crafted and deterrence-based strategies (i.e., pulling levers) became the
impetus for Project Safe Neighborhoods (PSN), a national initiative to reduce firearm and related
violence.
The PSN model was an extension of the Boston framework, and was implemented across
all 94 U.S. Federal districts as a response to firearms violence in each respective district.
McGarrell et al. (2009) illustrated that an estimated 3 billion dollars was allocated from Fiscal
Year (FY) 2001 through FY 2008 in order to: fund local and federal prosecutors; provide
resources for law enforcement; support research and community outreach partners; fund a
national media campaign; and provide training, technical assistance, and research functions for
the initiative. PSN was built on what were viewed as successful approaches utilized in the
Boston Ceasefire project, SACSI, and Richmond’s Project Exile (a deterrence based initiative
that relied on federal prosecution to increase the threat of enhanced sanctions to known gun
traffickers in the city). It was designed as a collaborative problem solving initiative utilizing a
strategic research-based model to reduce firearms violence through the use of enforcement,
deterrence, and prevention (Dalton, 2002). Perhaps most importantly, this model of
collaborative problem solving that relies upon an integration of different groups in the criminal
8
justice system can be used to address a variety of citywide crime problems (e.g., gang networks,
gun offending, drug dealing), including offense patterns specifically linked to open-air drug
markets.
Illicit Street Drug Markets: Crime Problems and Policing Efforts
Open-air drug markets have been a major focus of criminal justice research since the
mid-1980s when a sharp rise, followed later by a decline, in both crime and crack cocaine
markets occurred across the country (Blumstein, 1995). Community-level theoretical
explanations for the establishment and maintenance of illicit drug markets have mostly been
grounded within the social disorganization framework; that is, communities characterized by
extensive joblessness provide limited opportunities for legitimate employment (Wilson, 1987)
resulting in a rise in street-corner drug dealing (Anderson, 1990; Currie, 1993) which inhibits
neighborhood informal social control mechanisms (Sampson and Groves, 1989; Sampson,
Raudenbush, and Earls, 1997) and leads to increased crime rates.
Indeed, there is overwhelming support in the literature to suggest that street drug markets
both directly and indirectly facilitate property offenses (Rengert, 1996) and violent crime (Berg
and Rengifo, 2009; Blumstein and Rosenfeld, 1998; Jacobs and Wright, 2006; Wright and
Decker, 1997). In a study of street-level drug dealers who had been direct victims of robbery,
Topalli, Wright, and Fornango (2002) found that dealer-victims were often unwilling and unable
to rely on traditional legal justice responses (i.e., report victimization to police) and thus felt
compelled to resort to retaliation as a way of redress. It should also be noted that research by
Jacques and Wright (2008) demonstrated that cooperation and reciprocity are more commonly
observed between users and dealers in illicit drug markets than is the use of violence. That said,
9
research demonstrates that additional forms of non-violent retaliation exist in street drug markets
(Jacques, 2010), which can further diminish local residents’ perceptions of public safety.
Furthermore, this research highlights the importance that street drug dealers attribute to
reputation maintenance, loss recovery, and vengeance as mechanisms of maintaining legitimacy
in the illicit drug trade.
The Integration of Pulling Levers and Drug Market Policing
As noted earlier, pulling levers has been widely used as a strategy to reduce youth, gun,
and gang violence. However, Kennedy (2006) contends that pulling levers is an adaptable
strategy that can be applied to a variety of contexts. For example, problem identification and
analysis in High Point, North Carolina indicated the city experienced high levels of violence and
drug crime, but these incidents were primarily clustered in neighborhoods with illicit street level
drug markets (Hipple et al., 2010; Kennedy and Wong, 2009). Law enforcement officials within
the city developed strong partnerships with a number of criminal justice agencies (i.e.,
prosecution, probation, parole, and also social service providers) and communities throughout
the district in order to address their local crime problems. The High Point Police Department
(HPPD) also established a partnership with researchers from the University of North Carolina
Greensboro, Winston-Salem State University, and a number of key community groups (e.g.,
local business organizations). Their initial focus was on reducing gun and gang-related violence,
as part of their PSN strategies and objectives. After several years focusing on gun and gang
violence, the HPPD decided to focus on illegal street level drug markets, which were a major
cause of violence within the city. The initial intervention became known as High Point West
End Initiative, which showed promise in terms of impact (Frabutt et al., 2006).
10
The High Point pulling levers model was replicated in Rockford, Illinois and Nashville,
Tennessee, and study results for both sites revealed a statistically significant reduction in
nonviolent offenses as well as drug-related crime in the target communities relative to non-
treatment areas (Corsaro, Brunson, and McGarrell, 2009; 2010). In addition, in-depth interviews
indicated that many local residents in both Nashville and Rockford perceived an improved
quality of neighborhood life where the strategies were employed. Thus, given the promising
results in High Point, Nashville, and Rockford, a number of other law enforcement jurisdictions
have implemented this approach as part of the Bureau of Justice Assistance (BJA) drug market
intervention (DMI) training program.1 Peoria, Illinois was one such jurisdiction. In early 2009,
Peoria officials committed to the implementation and evaluation of a pulling levers focused
deterrence strategy designed to disrupt a local drug market.
In the following sections, we focus on the process of program implementation (i.e.,
fidelity to the ‘logic’ behind the model), perceived effectiveness of the strategy among Peoria
residents (using both survey data as well as in-depth resident interviews), changes in crime and
calls for service (relying on an interrupted time series research design), and directions and
recommendations for both future sites interested in adopting the strategy as well as researchers
committed to testing potential program effects.
1 Among the cities that have implemented the High Point drug market intervention strategy are: Berlin, MD; Chicago, IL; Hempstead, NY; Middletown, OH; Milwaukee, WI; Ocala, FL; Providence, RI; Raleigh, NC; Seattle, WA; and Winston-Salem, NC (Hipple and McGarrell 2009). The Bureau of Justice Assistance continues to sponsor a training and technical assistance program that will increase the number of cities adopting the pulling levers strategy.
11
The Peoria Drug Market Intervention: A Review of Process and Implementation
Intervention Setting
The current strategic intervention and subsequent research evaluation was conducted in
Peoria, Illinois during the spring and summer of 2010. Peoria is a mid-sized urban city located
along the banks of the Illinois River and is situated between St. Louis, Missouri and Chicago,
Illinois, approximately 170 miles from both metropolitan areas. Peoria is the county seat of
Peoria County and is home to 113,546 residents across a total area of 46.6 square miles. With
regard to demographics, Peoria as an overall city is comparable to national demographic and
social trends with a population that is 47% male, 70% white, and has an 82% high school
graduation rate. Also consistent with national trends, the population of Peoria has a median age
of 34 years and a median annual household income of $36, 397 (U.S. Census Bureau, 2000).
Though very similar to the national average, the population of Peoria differs from the
national average in two ways. First, according to the 2000 U.S. Census Bureau, the national
average of individuals living below the poverty level is 12.4%, whereas the average percentage
of individuals living below the poverty level in Peoria is 18.8%. Thus, Peoria has a greater
concentration of poverty relative to other cities in the nation.
Secondly, Peoria’s crime rate stands out on a national scale. During the mid-1990s,
Peoria experienced significant reductions in violent and property crime. Recently, however,
Peoria has experienced a surge in both violent and property crime rates. As of 2005, Peoria
County placed in the highest quartile, or the top 25 percent, of all counties within the United
States for index crime offenses. In other words, Peoria County has crime levels similar to those
of larger metropolitan areas, but lacks the financial resources of bigger cities to combat crime.
12
As noted earlier, law enforcement officials decided to implement the drug market
intervention (DMI), which relied upon the pulling levers (focused deterrence) framework as a
mechanism to reduce crime in a particular geographic area within the city. Ultimately, the
strategy was implemented in a high crime neighborhood (i.e., hotspot) that was identified and
targeted for intervention through problem analyses conducted by a research analyst within the
Peoria Police Department (PPD). It is important to note that the actual target zone was slightly
smaller than the two census tracts that were situated within the area. The current evaluation
controlled for the size discrepancies between the target area and the census tracts in both the
survey and crime trend data analyses.
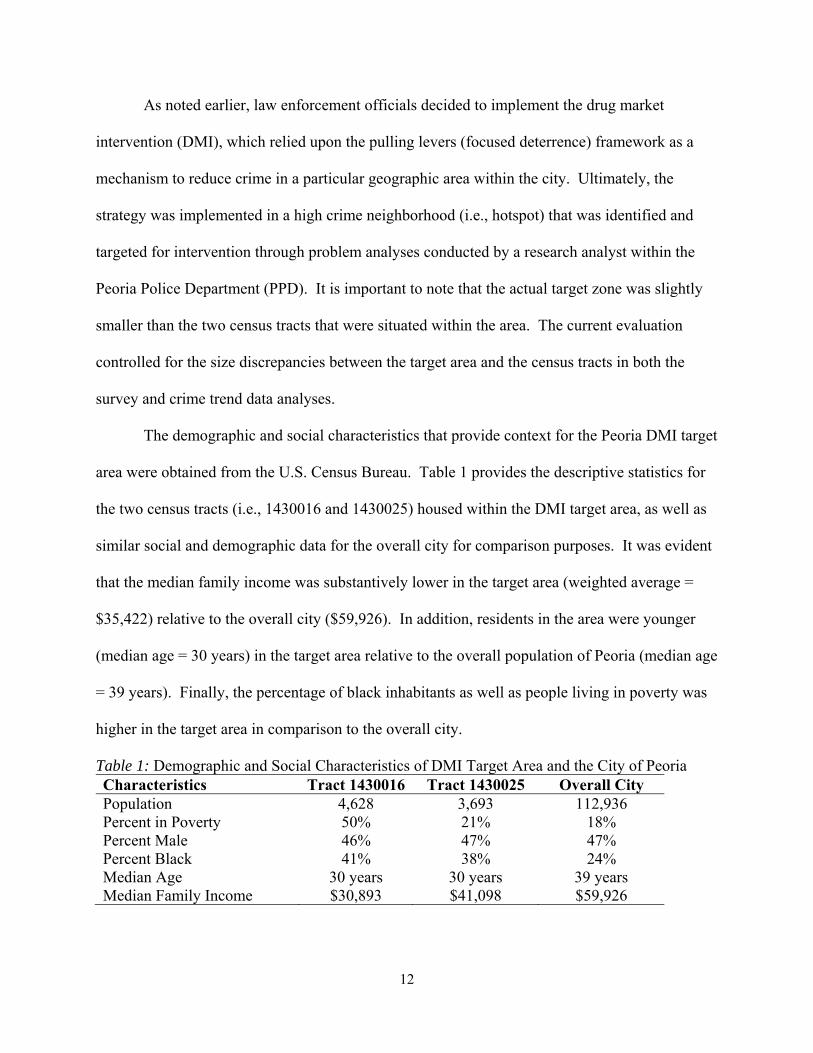
The demographic and social characteristics that provide context for the Peoria DMI target
area were obtained from the U.S. Census Bureau. Table 1 provides the descriptive statistics for
the two census tracts (i.e., 1430016 and 1430025) housed within the DMI target area, as well as
similar social and demographic data for the overall city for comparison purposes. It was evident
that the median family income was substantively lower in the target area (weighted average =
$35,422) relative to the overall city ($59,926). In addition, residents in the area were younger
(median age = 30 years) in the target area relative to the overall population of Peoria (median age
= 39 years). Finally, the percentage of black inhabitants as well as people living in poverty was
higher in the target area in comparison to the overall city.
Table 1: Demographic and Social Characteristics of DMI Target Area and the City of Peoria Characteristics Tract 1430016 Tract 1430025 Overall City Population 4,628 3,693 112,936 Percent in Poverty 50% 21% 18% Percent Male 46% 47% 47% Percent Black 41% 38% 24% Median Age 30 years 30 years 39 years Median Family Income $30,893 $41,098 $59,926
13
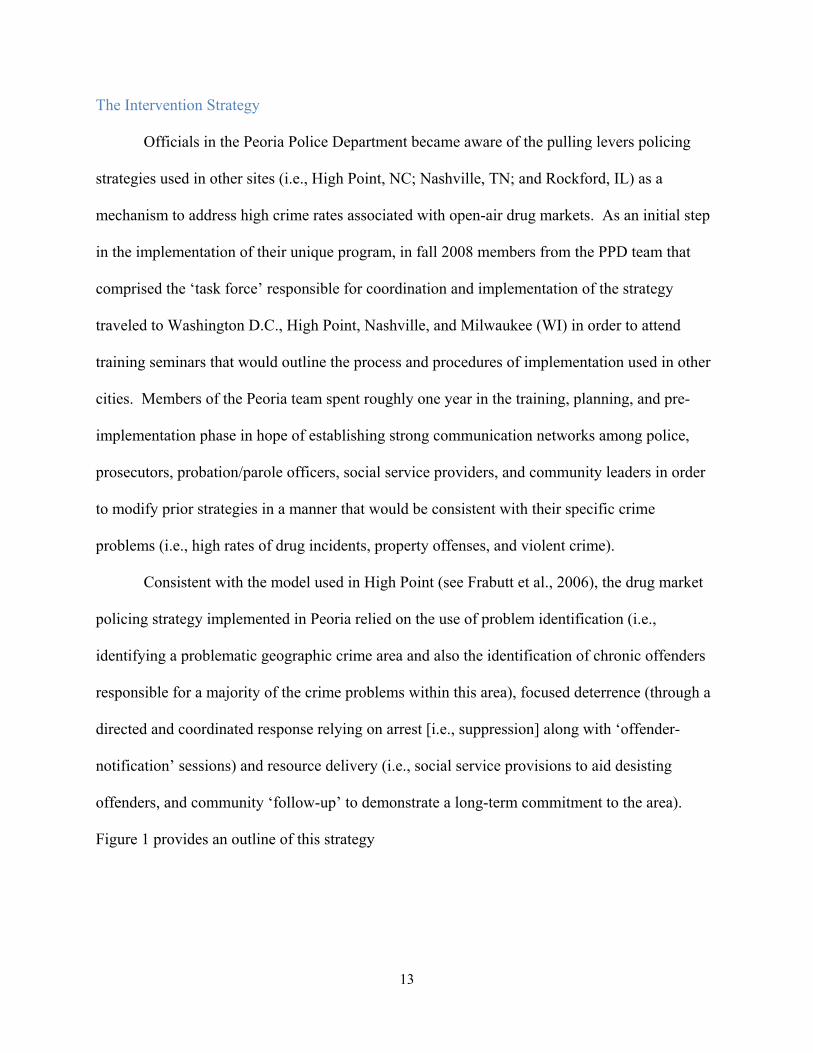
The Intervention Strategy
Officials in the Peoria Police Department became aware of the pulling levers policing
strategies used in other sites (i.e., High Point, NC; Nashville, TN; and Rockford, IL) as a
mechanism to address high crime rates associated with open-air drug markets. As an initial step
in the implementation of their unique program, in fall 2008 members from the PPD team that
comprised the ‘task force’ responsible for coordination and implementation of the strategy
traveled to Washington D.C., High Point, Nashville, and Milwaukee (WI) in order to attend
training seminars that would outline the process and procedures of implementation used in other
cities. Members of the Peoria team spent roughly one year in the training, planning, and pre-
implementation phase in hope of establishing strong communication networks among police,
prosecutors, probation/parole officers, social service providers, and community leaders in order
to modify prior strategies in a manner that would be consistent with their specific crime
problems (i.e., high rates of drug incidents, property offenses, and violent crime).
Consistent with the model used in High Point (see Frabutt et al., 2006), the drug market
policing strategy implemented in Peoria relied on the use of problem identification (i.e.,
identifying a problematic geographic crime area and also the identification of chronic offenders
responsible for a majority of the crime problems within this area), focused deterrence (through a
directed and coordinated response relying on arrest [i.e., suppression] along with ‘offender-
notification’ sessions) and resource delivery (i.e., social service provisions to aid desisting
offenders, and community ‘follow-up’ to demonstrate a long-term commitment to the area).
Figure 1 provides an outline of this strategy
14
Figure 1: The Drug Market Intervention Strategy (Adapted from Frabutt et al., 2006)
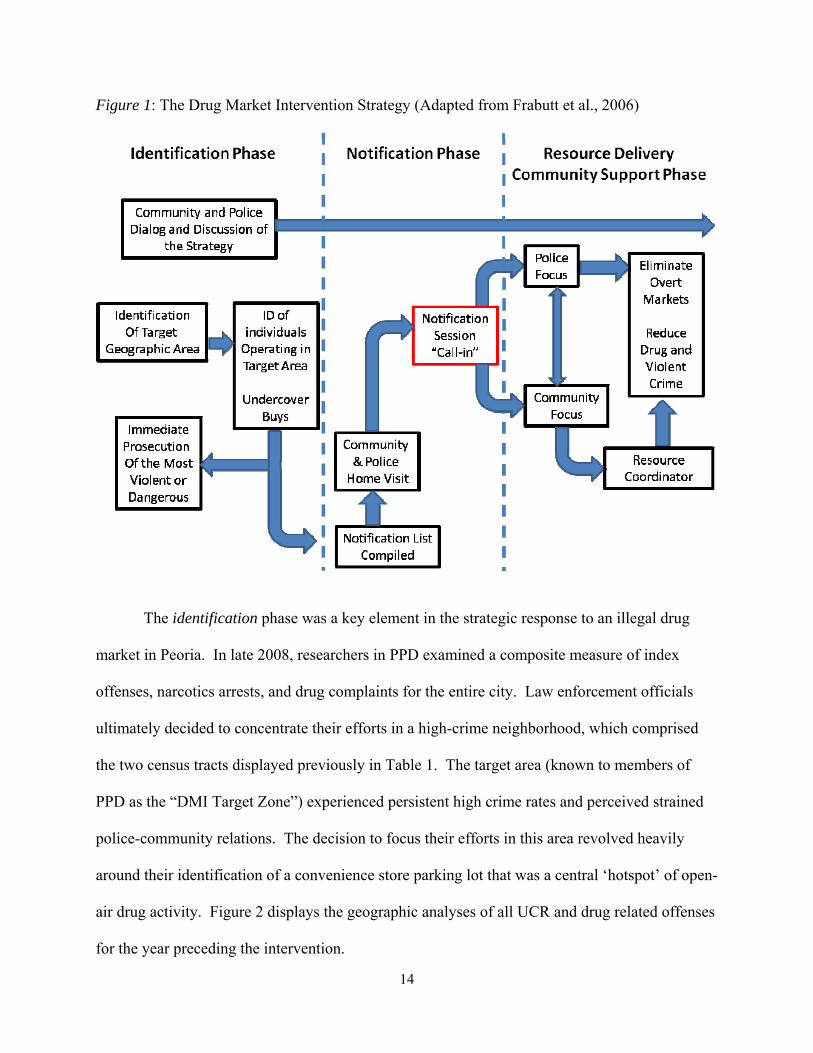
The identification phase was a key element in the strategic response to an illegal drug
market in Peoria. In late 2008, researchers in PPD examined a composite measure of index
offenses, narcotics arrests, and drug complaints for the entire city. Law enforcement officials
ultimately decided to concentrate their efforts in a high-crime neighborhood, which comprised
the two census tracts displayed previously in Table 1. The target area (known to members of
PPD as the “DMI Target Zone”) experienced persistent high crime rates and perceived strained
police-community relations. The decision to focus their efforts in this area revolved heavily
around their identification of a convenience store parking lot that was a central ‘hotspot’ of open-
air drug activity. Figure 2 displays the geographic analyses of all UCR and drug related offenses
for the year preceding the intervention.
15
Figure 2: The DMI Target Zone
Intelligence gathering took place in March and April 2009 when the PPD drug and
narcotics task force established criminal cases against 29 suspects. Detectives made video- and
audio-recorded controlled buys for evidentiary purposes (i.e., case building). PPD officers also
relied on additional sources of data, including narcotics complaints and police surveillance, in
order to strengthen evidence against repeat offenders.
From the onset, however, the program was forced to contend with a number of setbacks
during identification and investigation. First, in early spring 2009, the target area experienced a
spike in domestic violence-related homicides that appeared to be unrelated to illicit street drug
16
dealing. Narcotics officials within PPD stated the resulting rise in police presence during this
period inadvertently caused a ‘dispersion effect’ among dealers within the heavily concentrated
drug market area. Thus, narcotics investigators decided to wait several weeks (in an effort to
allow the drug market to become re-established) before they continued their ‘case building’
against users and dealers.
Second, a serious accident occurred in April 2009 in the vicinity of the targeted
community during the identification phase. A two-year old girl was struck and killed by a PPD
van that was transporting inmates to the county correctional facility.2 Officials responsible for
the DMI initiative reported that neighborhood residents were understandably upset and believed
that the PPD transport van may have been operated in a negligent manner, which had the
potential to strain police-community relationships in the area. This strain was not alleviated
when footage of the accident captured by cameras placed in the area (intended to gather evidence
on the illicit drug trafficking) was shown to a select group of concerned community residents.
The community’s distress over the incident prompted officials from PPD to postpone the more
extensive notification meeting and follow-up components of the strategy until tensions abated
and the community had an opportunity to heal from the loss. Thus, the intervention (i.e., arrest
and suppression of violent offenders combined with the ‘notification session’) was re-scheduled
for the fall of 2009.
In addition to identifying the target site and offenders within that area, task force
members also focused on network capacity-building (see Braga and Winship, 2006) across law
enforcement and prosecution officials, social service providers, faith-based organizations, and
community-based groups. Residents attending local community and police meetings in the
2 The official ‘Southeast Missourian’ website (http://www.semissourian.com/story/1532150.html) provides more in-depth information regarding the accident that occurred in April 2009.
17
target area were receptive to the idea of replicating the High Point drug market intervention
program in Peoria. It is also important to note that local religious leaders and social service
providers were enlisted to inform neighborhood residents who did not attend police-community
meetings of the impending implementation. They also served as liaisons between law
enforcement and offenders’ families in the hope of encouraging those eligible for the pulling
levers strategy to participate.
After the investigation was complete, officials had to determine who would be ‘called-in’
to the public notification session and who would be subjected to traditional sanctions through the
criminal justice system with enhanced prosecution. This determination was based on a multi-
phase process. First, the case officer responsible for the investigation made a recommendation
based on his/her experience with each dealer and that dealer’s criminal history. Second, two
police supervisors and a state’s district attorney each made individual recommendations
regarding which offenders were best suited for diversion. Finally, the four individuals met to
discuss and decide how the identified offenders would be processed taking each recommendation
into consideration.
Ultimately, 23 of the 29 individuals who were identified in the investigation phase were
arrested and targeted for enhanced prosecution, while six suspected dealers were deemed eligible
for the notification session due to their non-violent or less-extensive criminal histories. In late
October and early November 2009, PPD law enforcement officials moved forward with a
suppression-based component of the intervention and arrested the 23 offenders. It was predicted
that those who were arrested and prosecuted would serve as examples of the threat of enhanced
sanctions for non-compliance during the pulling levers notification meeting a week later.
18
The notification phase (i.e., advertisement of the deterrence-based intervention) occurred
on November 4, 2009 as PPD officials facilitated the meeting in a community center located near
the target area. The event attracted an audience of approximately 100. Researchers in
attendance estimated that roughly 60% of the attendees were from law enforcement, social
services, and prosecution, while 40% were community members and family members of notified
offenders. The local media also provided information about the effort to Peoria residents both
within and outside of the target community.3
Law enforcement, social service providers, the six notified offenders, and invited
members from the offenders’ families were all present during the call-in meeting. Local media
were also present for the beginning of the conference, which involved a description of the
deterrence, social service, and community reintegration components. The group of offenders
was shown surveillance videos of their alleged drug-dealing activities and informed about the
arrest and intended prosecution of the 23 others. As a symbolic gesture, 23 ‘empty’ chairs with
poster-size photos of those arrested within the past week were displayed beside the video screen.
The enforcement message emphasized that drug dealing in Peoria would not be tolerated
and that re-offending would result in full prosecution of the existing drug-dealing charges. The
local Sheriff also explained to the group that the county jurisdiction was equally invested in the
program, thus extending the boundary of coverage. Also, the State’s Attorney explained both the
enhanced sanctions that were available to non-desisting offenders—this is the focused deterrence
element of the ‘pulling levers’ initiative (Kennedy, 1997)—and the positive prosocial aspects of
the program that would be used to aid in their rehabilitation should they opt for that path.
3 A LexisNexis, EBSCO, and Web-Based search found eight news stories (five in the Journal Star – a local Peoria newspaper) that provided a description and outline of the program.
19
In terms of resource delivery, each of the notified individuals met separately with social
service providers as part of a preliminary assessment panel during the initial call-in. Suspects’
needs were assessed and specific strategies were designed to assist each person (i.e., drug
treatment, education and skills training, job-interview skills, etc.). Local religious leaders also
participated in the resource delivery component. Four of the six participants made a secondary
appointment the next day for a more private and personalized needs assessment. This phase of
the intervention was also meant to symbolize a long-term commitment to local Peoria residents
and the surrounding community, again as a way to heighten neighborhood local informal social
control mechanisms. In particular, officials hoped to convey to citizens that the focus on
reducing open-air drug offending was more than a traditional arrest and prosecution strategy.
Consequently, for several additional weeks, PPD committed additional patrol presence in the
neighborhood and made calls-for-police-service originating from the target area a priority for
police response. Patrol officers were encouraged to respond immediately to calls for service
stemming from the DMI target area, at least for several weeks following the call in session. This
was intended to communicate to residents that the police were committed to working with
residents to prevent the re-emergence of the drug market.
Program Implementation Summary
The program evaluation that relied heavily on narratives and interviews with law
enforcement officials and social service providers indicated that officials in Peoria followed the
tenets of the pulling levers policing framework with a fair degree of fidelity and consistency. In
particular, our process analysis indicates that considerable care was taken to: a) identify a
location and subsequent offenders within this location who were reportedly driving the drug
20
markets, b) notify high-risk individuals and local community members that illegal drug
distribution will no longer be tolerated, c) supply substantial services (i.e., resource delivery) to
desisting offenders and provide continued police presence in the target area after the notification
session (i.e., community support).
In order to assess whether the Peoria pulling levers program exerted its intended effects,
we move to a detailed assessment of program outcomes. We analyze three data sources for a
comprehensive examination of program effects. First, we examine official sources of crime and
calls for police service data using an interrupted time series design in an effort to isolate the
potential effect of the strategy on crime-specific outcomes. Second, we examine the results of a
community survey and assess the degree of familiarity people seemed to have with the
intervention, as well as the changes in perceived crime levels (roughly 6 months after the
notification session). Finally, we review in-depth interviews with local residents in an effort to
discern local perceptions about the strategy and find out whether there was a substantive change
in crime and community dynamics. Combined, these analytic techniques are designed to provide
an understanding of the utility and effectiveness of the Peoria DMI.
21
Time Series Design and Outcome Analysis
The primary goal of the Peoria DMI was to significantly reduce crime associated with
illicit street drug markets in the DMI Target Zone. To ascertain the extent to which this goal was
reached, an interrupted time series analysis employing official crime reports and calls-for-service
data was used to compare patterns of pre- and post-intervention responses across the relevant
outcomes (Cook and Campbell, 1979). In addition, the regression models used in the subsequent
statistical analyses are also designed to control for the potential influences of fluctuating crime
trends as well as seasonality in each time series (i.e., the changes in crime trends that are
associated with specific months during the calendar year).
Data
The trend data used here include several types of criminal offenses and calls for police
service over a five-year period. Offense data were aggregated into a monthly format beginning
January 1, 2005 and extending through October 31, 2010, which equates to over 4 years of pre-
intervention and 1 year of post-intervention data ultimately centering on the November 2009
intervention date (i.e., the arrests and call-in session in the target community). Each month’s
crime measure was operationalized as a composite variable, running from its first through its last
day, of all offenses occurring over this period.
Geographic Boundaries
Simply examining changes in crime and calls for service trends within the target area
alone would not rule out the possibility of a more ‘global’ effect that could have influenced local
crime patterns (Cook and Campbell, 1979). As a way to control for the potential influence of
22
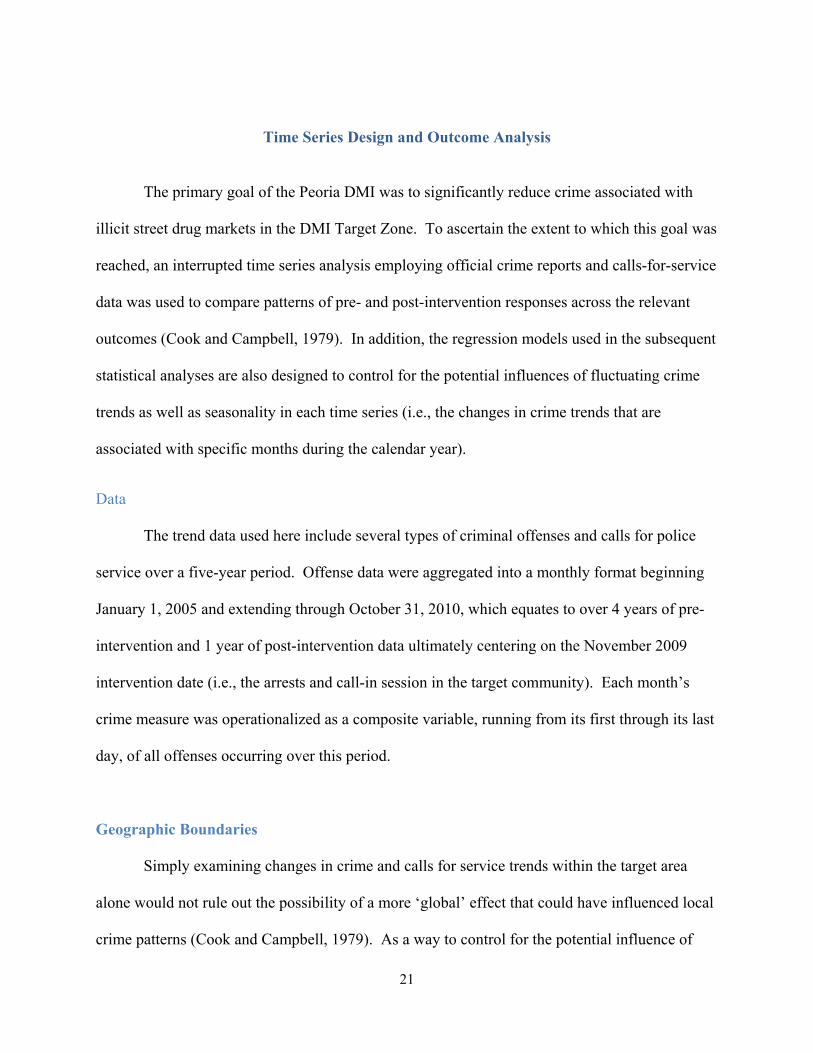
citywide fluctuating crime trends, we utilized three different units of analysis (see Figure 2).
More specifically, all offense and calls for service trend data were aggregated to different
geographic units (i.e., target area, police districts, and the overall city) for general comparison
purposes. Thus, as a first step, we examined local crime trend patterns specifically within the
DMI target zone before and after the November 2009 DMI strategy occurred. Comparatively,
we estimated the changes in the same crime and calls for service outcomes for a control site
(Peoria Police District #4) as well as the remainder of the overall city of Peoria in order to better
‘isolate’ the potential program effects of the strategy that occurred within the DMI target zone.
Figure 2: Map of Various Peoria Geographic Boundaries
23
We chose Police District #4 as an appropriate comparison site for two main reasons.
First, of the 17 police districts within the city, District #4 had the highest level of drug, narcotics
and violent crime incidents (relying on baseline data from 2008).4 Second, it was roughly 10
times larger than the DMI target area in terms of both geographic size and total population.
Thus, the control site served as a high-crime comparison area that was unlikely to be influenced
by either offense displacement or diffusion of crime-control benefits (see Green, 1995).
Variables
Four specific outcome variables were modeled in the current analytic framework. Violent
crimes were operationalized as the total number of robberies (which constituted 33.6% of all
violent crimes committed), aggravated assaults (65.1%), and homicides (1.3%).56 Property
crimes were a summed index of burglaries and larcenies (95.4%) as well as motor vehicle thefts
(4.6%). A third outcome measure was measured as drug and disorder crimes, which captured
levels of possession of cannabis (18.7%) and other controlled substances (19.0%), disorderly
conduct incidents (53.5%), and drug paraphernalia and equipment charges (8.6%).7 Finally, we
measured (dispatched) calls for police service given the susceptibility that official crime data
may have to police presence and patrolling approaches (Warner and Pierce, 1993). Thus, the
4 The DMI target area was actually located within Police District #3 (i.e., an adjacent police district to the control site), though it only comprised roughly ¼ of the geographic area within the district. Thus, as a comparison we chose a high-crime police district (#4) that was geographically proximate but still independent of the target area. 5 Since sexual assault and rape incidents were not included in the target area identification process, we did not include them as a component in our violent crime outcome measures. 6 All percentage distributions of the aggregated crimes that make up the various dependent variables used in the statistical analyses are based off of the total citywide crime data. 7 We also independently examined drug and disorder offenses as separate outcomes, where results were similar in terms of direction, magnitude, and statistical significance thresholds. Given the Peoria strategy was designed to reduce drug crimes as well as public nuisance and disorder offenses associated with illicit street drug markets (see Rengert, 1996), we combined these distinct offense measures into a single composite outcome.
24
calls for service outcome was also used to triangulate and ultimately cross-validate the potential
changes in specific offense outcomes over time.
We also incorporated an independent variable defined as the post-intervention period,
which we operationalized as November 2009 thereafter. This measure was a dummy variable
wherein the months from January 2005 to October 2009 were defined as the pre-intervention
period (i.e., value = 0). Subsequently, November 2009 and all subsequent months through
October 2010 were operationalized as the post-intervention period (i.e., value = 1) because
November 2009 was when the above-described DMI offender notification session occurred.8
In order to account for potential global trend influences, we added both a simple linear
trend variable (to account for linear trends) and a trend-squared variable (to account for
curvilinear trends), which were apparent in the bivariate graphs displayed in the results section.9
Similarly, we included monthly dummy variables, using December as the reference month, to
account for seasonal effects (i.e., seasonal shocks) that occurred during specific periods of the
year (mostly in the late spring and early summer), which are also seen in the bivariate trend
graphs.
Bivariate Analyses
As an initial step, we examined the average monthly percentage changes in the various
crime and calls for service outcome measures across the three distinct geographic zones. Table 2
shows that many of the crime and calls for service outcomes manifested somewhat inconsistent
8 In a detailed review of prior pulling levers strategies, Kennedy (2006) illustrated that pulling levers interventions often experience a ‘light switch’ deterrent-effect, which is an immediate and abrupt reduction in crime associated with the strategy (see also Piehl et al., 2003). Thus, we selected the month of the notification session as the light-switch intervention date. 9 The trend variable was created as a sequential time measure from the start to the end of the time series data (i.e., our data ran from January 2005 (1) to October 2010 (71). The trend-squared variable was simply the trend variable squared (trend variable * trend variable) to account for potential quadratic changes in a given time series.
25
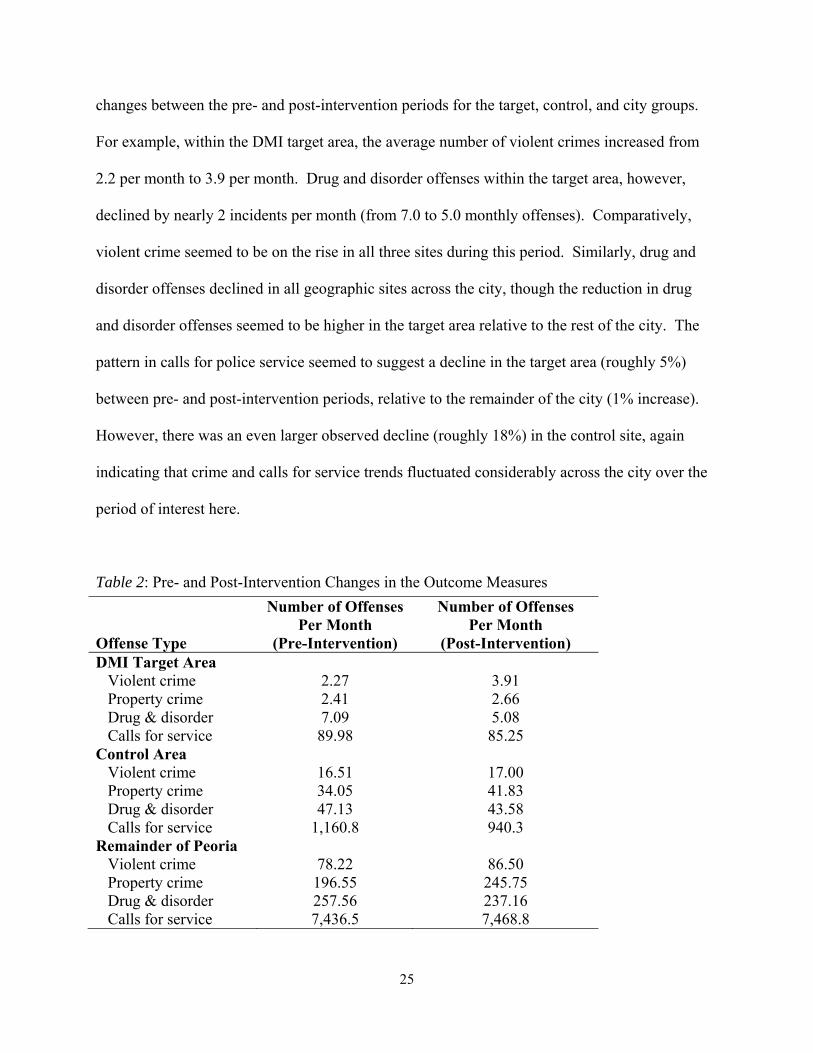
changes between the pre- and post-intervention periods for the target, control, and city groups.
For example, within the DMI target area, the average number of violent crimes increased from
2.2 per month to 3.9 per month. Drug and disorder offenses within the target area, however,
declined by nearly 2 incidents per month (from 7.0 to 5.0 monthly offenses). Comparatively,
violent crime seemed to be on the rise in all three sites during this period. Similarly, drug and
disorder offenses declined in all geographic sites across the city, though the reduction in drug
and disorder offenses seemed to be higher in the target area relative to the rest of the city. The
pattern in calls for police service seemed to suggest a decline in the target area (roughly 5%)
between pre- and post-intervention periods, relative to the remainder of the city (1% increase).
However, there was an even larger observed decline (roughly 18%) in the control site, again
indicating that crime and calls for service trends fluctuated considerably across the city over the
period of interest here.
Table 2: Pre- and Post-Intervention Changes in the Outcome Measures Offense Type
Number of Offenses Per Month
(Pre-Intervention)
Number of Offenses Per Month
(Post-Intervention) DMI Target Area Violent crime 2.27 3.91 Property crime 2.41 2.66 Drug & disorder 7.09 5.08 Calls for service 89.98 85.25 Control Area Violent crime 16.51 17.00 Property crime 34.05 41.83 Drug & disorder 47.13 43.58 Calls for service 1,160.8 940.3 Remainder of Peoria Violent crime 78.22 86.50 Property crime 196.55 245.75 Drug & disorder 257.56 237.16 Calls for service 7,436.5 7,468.8
26
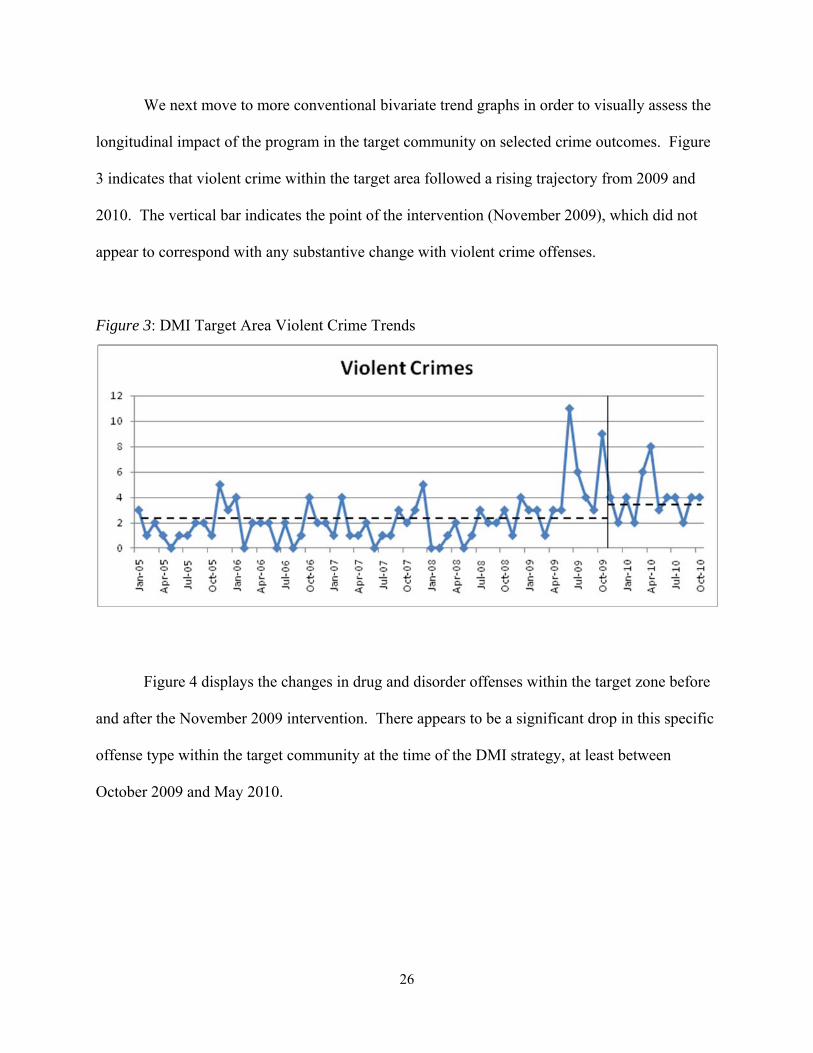
We next move to more conventional bivariate trend graphs in order to visually assess the
longitudinal impact of the program in the target community on selected crime outcomes. Figure
3 indicates that violent crime within the target area followed a rising trajectory from 2009 and
2010. The vertical bar indicates the point of the intervention (November 2009), which did not
appear to correspond with any substantive change with violent crime offenses.
Figure 3: DMI Target Area Violent Crime Trends
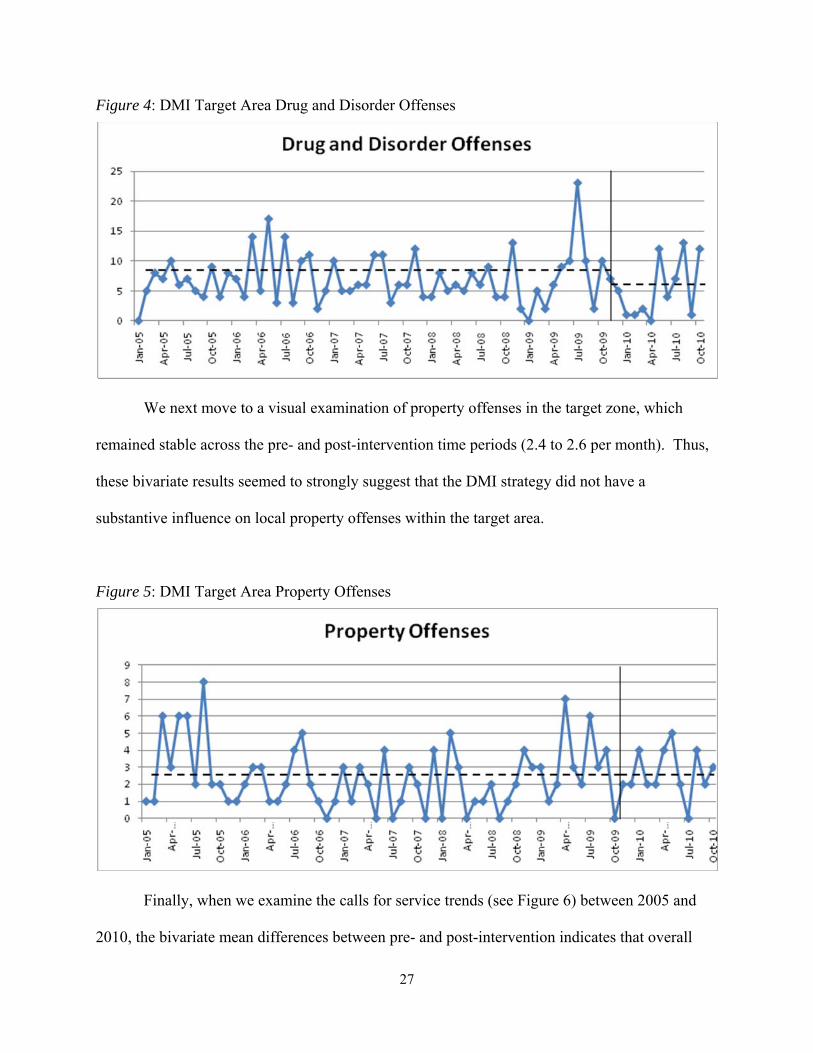
Figure 4 displays the changes in drug and disorder offenses within the target zone before
and after the November 2009 intervention. There appears to be a significant drop in this specific
offense type within the target community at the time of the DMI strategy, at least between
October 2009 and May 2010.
27
Figure 4: DMI Target Area Drug and Disorder Offenses
We next move to a visual examination of property offenses in the target zone, which
remained stable across the pre- and post-intervention time periods (2.4 to 2.6 per month). Thus,
these bivariate results seemed to strongly suggest that the DMI strategy did not have a
substantive influence on local property offenses within the target area.
Figure 5: DMI Target Area Property Offenses
Finally, when we examine the calls for service trends (see Figure 6) between 2005 and
2010, the bivariate mean differences between pre- and post-intervention indicates that overall
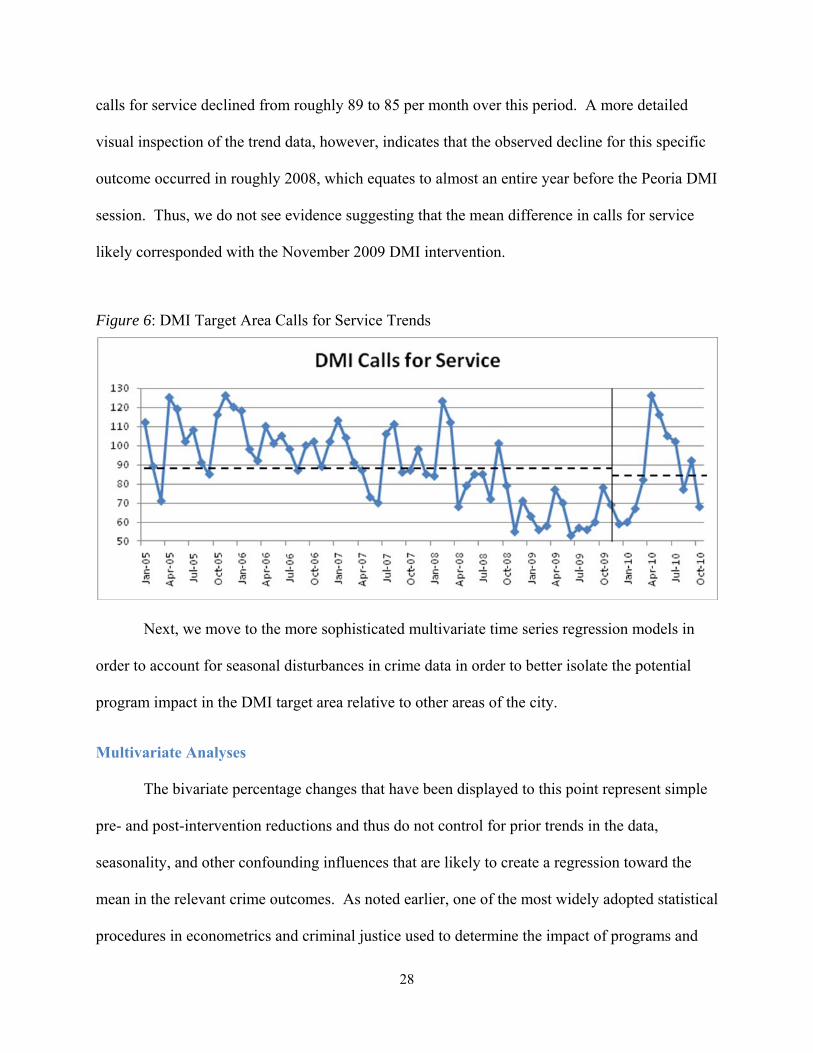
28
calls for service declined from roughly 89 to 85 per month over this period. A more detailed
visual inspection of the trend data, however, indicates that the observed decline for this specific
outcome occurred in roughly 2008, which equates to almost an entire year before the Peoria DMI
session. Thus, we do not see evidence suggesting that the mean difference in calls for service
likely corresponded with the November 2009 DMI intervention.
Figure 6: DMI Target Area Calls for Service Trends
Next, we move to the more sophisticated multivariate time series regression models in
order to account for seasonal disturbances in crime data in order to better isolate the potential
program impact in the DMI target area relative to other areas of the city.
Multivariate Analyses
The bivariate percentage changes that have been displayed to this point represent simple
pre- and post-intervention reductions and thus do not control for prior trends in the data,
seasonality, and other confounding influences that are likely to create a regression toward the
mean in the relevant crime outcomes. As noted earlier, one of the most widely adopted statistical
procedures in econometrics and criminal justice used to determine the impact of programs and
29
public policies is time series analysis. As McCleary and Hay (1980, p. 141) note, “the widest
use of the time series design has clearly been in the area of legal impact assessment.”
We utilized Generalized Linear Modeling count regression analysis to estimate the
impact of the Peoria DMI program (see Long, 1997). Ordinal Least Squares (OLS) regression
models are inappropriate for analyzing count outcomes because count data do not approximate a
normal distribution and thus analysis from these models would lead to biased and inconsistent
estimates (King, 1988). Each outcome examined was estimated using a log-linear Poisson
distribution, and in each estimated model presented here the sample variance was significantly
greater than the sample mean (i.e., an overdispersed distribution), and thus we relied upon the
negative binomial regression model given its additional parameter to account for the distribution
of the variance independent from the mean (Long, 1997; Long & Freese, 2003).10 Parameter
estimates for each regression model were subsequently expressed as incidence rate ratios (i.e.,
the change in the rate of an outcome based on a unit change in an independent variable), which
are simply calculated as the exponentiated coefficients given the use of logarithmic
transformation in Generalized Maximum Likelihood (Long & Freese, 2003).
As noted earlier, each regression model presented herein accounts for linear (i.e., trend)
and quadratic (i.e., trend squared) changes in the time series data as well as monthly dummy
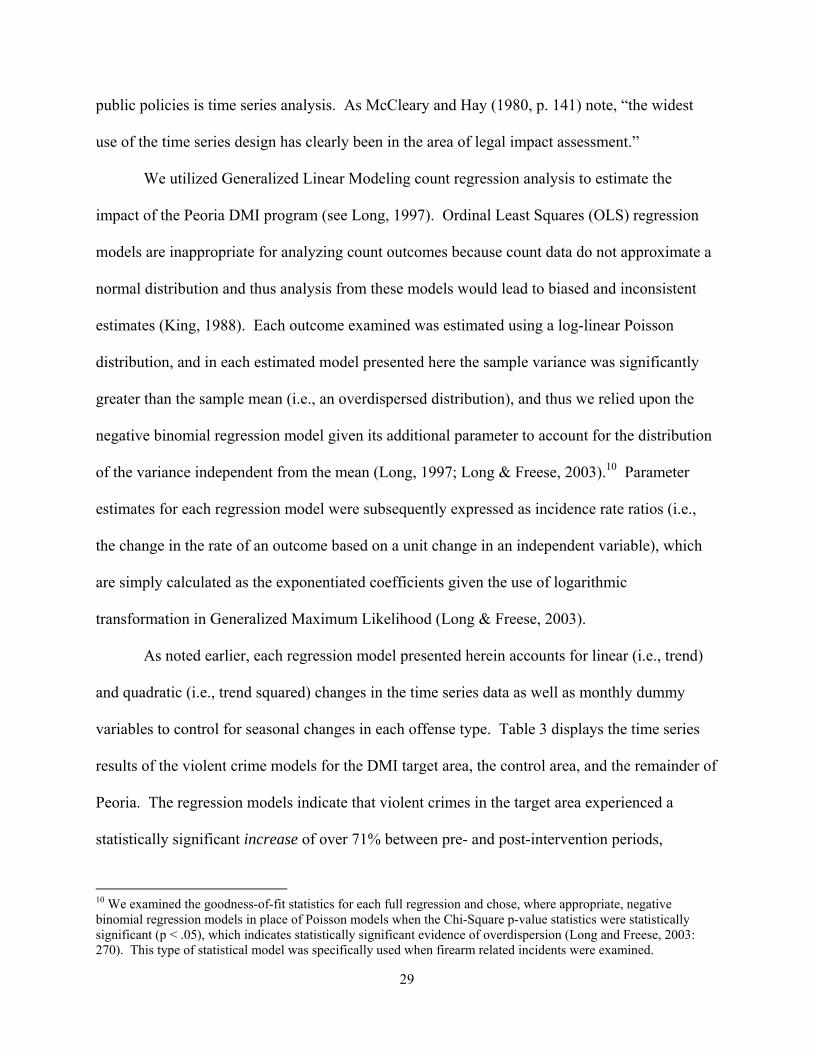
variables to control for seasonal changes in each offense type. Table 3 displays the time series
results of the violent crime models for the DMI target area, the control area, and the remainder of
Peoria. The regression models indicate that violent crimes in the target area experienced a
statistically significant increase of over 71% between pre- and post-intervention periods,
10 We examined the goodness-of-fit statistics for each full regression and chose, where appropriate, negative binomial regression models in place of Poisson models when the Chi-Square p-value statistics were statistically significant (p < .05), which indicates statistically significant evidence of overdispersion (Long and Freese, 2003: 270). This type of statistical model was specifically used when firearm related incidents were examined.
30
controlling for influential forces in the time series data.11 In terms of a relative comparison,
violent crimes also experienced a statistically significant increase in the remainder of the city by
roughly 26.4%. Interestingly, violent crimes in the control area experienced a very slight
decline, though not to any level of statistical significance. In sum, violent crimes appeared to be
on the rise in Peoria between pre- and post-intervention periods and this continued in the target
zone despite the implementation of the DMI.
Table 3: Maximum Likelihood Regression Models of Violent Crime Trends
Measure Coeff. St. Error p Coeff. St. Error p Coeff. St. Error pIntercept 1.210 0.401 < 0.01 2.476 0.186 < 0.01 4.26 0.074 < 0.01 Post-Intervention 0.542 0.021 0.01 -0.045 0.173 0.79 0.235 0.072 < 0.01Controls Trend -0.039 0.020 0.05 -0.001 0.008 0.85 -0.005 0.003 0.12 Trend Squared 0.000 0.000 <0.01 0.000 0.000 0.74 0.000 0.000 0.73 January -0.281 0.362 0.43 0.040 0.188 0.83 0.082 0.074 0.27 February -0.715 0.405 0.07 -0.406 0.207 0.05 -0.203 0.080 0.01 March -0.486 0.377 0.19 0.274 0.180 0.12 0.079 0.075 0.29 April -0.252 0.352 0.47 0.399 0.177 0.02 0.313 0.071 < 0.01 May -0.824 0.407 0.04 0.569 0.173 < 0.01 0.244 0.072 < 0.01 June -0.337 0.355 0.34 0.406 0.177 0.02 0.329 0.071 < 0.01 July -0.384 0.355 0.28 0.581 0.173 < 0.01 0.343 0.072 < 0.01 August -0.869 0.402 0.03 0.541 0.174 < 0.01 0.361 0.072 < 0.01 September -0.613 0.375 0.10 0.497 0.176 < 0.01 0.405 0.072 < 0.01 October -0.242 0.349 0.48 0.064 0.189 0.73 0.352 0.073 < 0.01 November -0.028 0.359 0.93 0.361 0.184 0.05 0.217 0.075 < 0.01Model Statistics Log Likelihood LR Chi-Square Test (df)
48.180.000
DMI Control Remaining Peoria
86.930.000
34.730.001
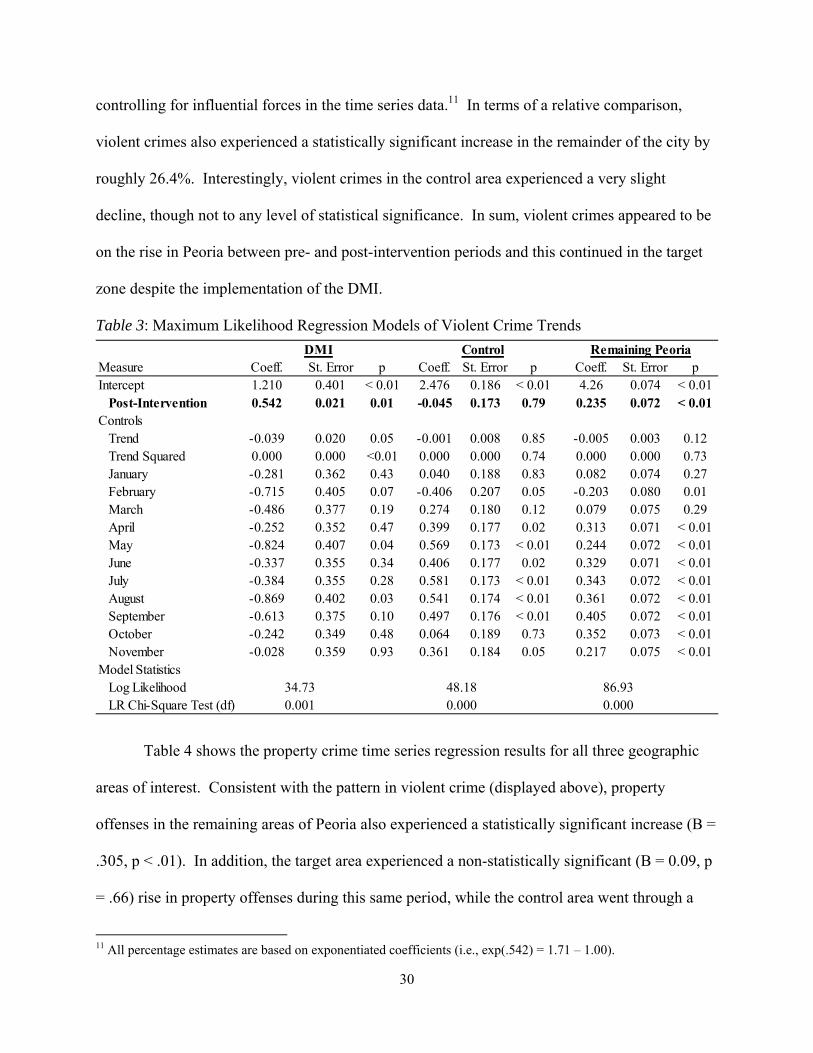
Table 4 shows the property crime time series regression results for all three geographic
areas of interest. Consistent with the pattern in violent crime (displayed above), property
offenses in the remaining areas of Peoria also experienced a statistically significant increase (B =
.305, p < .01). In addition, the target area experienced a non-statistically significant (B = 0.09, p
= .66) rise in property offenses during this same period, while the control area went through a
11 All percentage estimates are based on exponentiated coefficients (i.e., exp(.542) = 1.71 – 1.00).
31
non-significant (B = -0.104, p = .43) decline. Thus, there was no statistically significant change
in UCR property offenses in the target area between pre- and post-intervention periods, although
the remainder of Peoria did experience a significant rise in this specific type of offense during
the same period.
Table 4: Maximum Likelihood Regression Models of Property Crime Trends
Measure Coeff. St. Error p Coeff. St. Error p Coeff. St. Error pIntercept 1.390 0.416 < 0.01 3.62 0.141 < 0.01 5.44 0.08 < 0.01 Post-Intervention 0.099 0.229 0.66 -0.104 0.135 0.43 0.305 0.079 < 0.01Controls Trend -0.047 0.019 0.02 -0.023 0.006 < 0.01 -0.017 0.078 < 0.01 Trend Squared 0.000 0.000 0.02 0.000 0.000 < 0.01 0.000 0.080 < 0.01 January -0.133 0.431 0.75 -0.056 0.141 0.69 -0.067 0.078 < 0.01 February -0.127 0.430 0.76 -0.400 0.149 < 0.01 -0.389 0.077 < 0.01 March 0.242 0.401 0.54 0.062 0.138 0.65 -0.082 0.077 < 0.01 April 0.128 0.408 0.75 0.265 0.135 0.05 0.115 0.077 < 0.01 May 0.058 0.414 0.88 0.108 0.138 0.43 0.208 0.077 < 0.01 June 0.122 0.409 0.76 0.259 0.135 0.05 0.175 0.076 < 0.01 July -0.079 0.425 0.85 0.363 0.134 < 0.01 0.361 0.076 < 0.01 August 0.310 0.397 0.43 0.333 0.135 < 0.01 0.376 0.076 < 0.01 September -0.102 0.428 0.81 0.246 0.137 0.07 0.226 0.077 < 0.01 October -0.454 0.462 0.32 0.214 0.138 0.12 0.226 0.078 < 0.01 November -0.450 0.498 0.36 0.269 0.140 0.05 0.155 0.080 < 0.01Model Statistics Log Likelihood LR Chi-Square Test (df)
Control Remaining Peoria
12.85 54.150.538 0.000
107.80.000
DMI
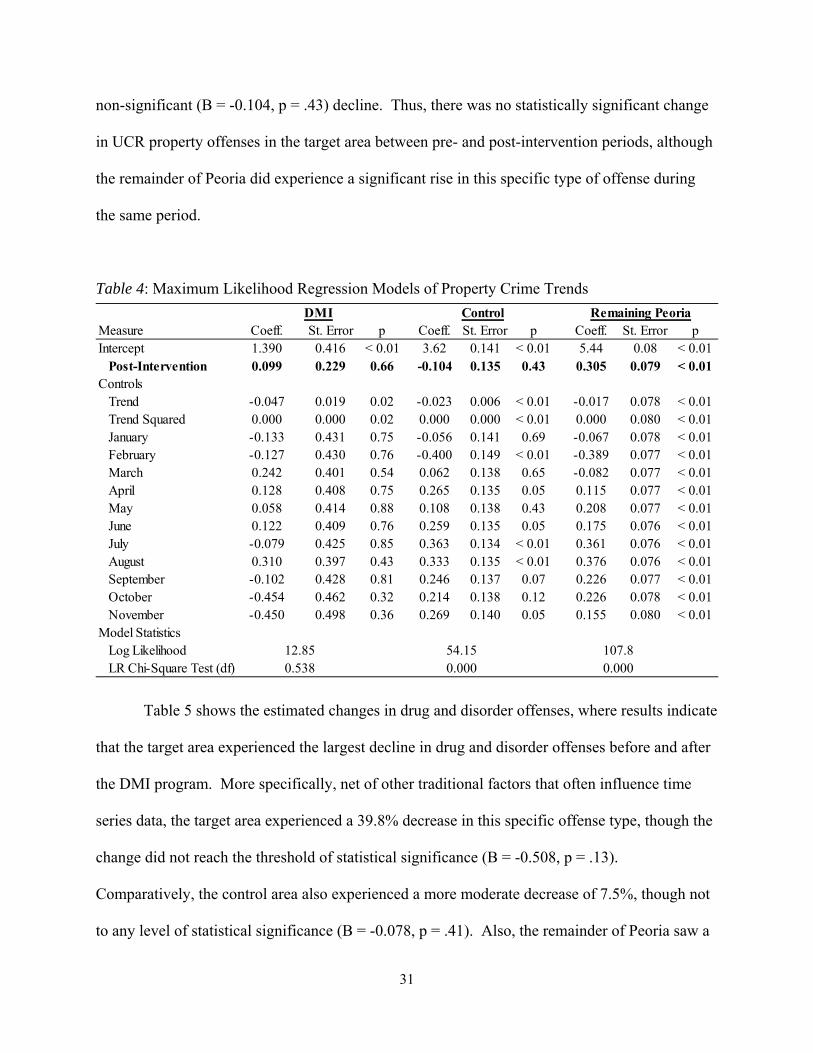
Table 5 shows the estimated changes in drug and disorder offenses, where results indicate
that the target area experienced the largest decline in drug and disorder offenses before and after
the DMI program. More specifically, net of other traditional factors that often influence time
series data, the target area experienced a 39.8% decrease in this specific offense type, though the
change did not reach the threshold of statistical significance (B = -0.508, p = .13).
Comparatively, the control area also experienced a more moderate decrease of 7.5%, though not
to any level of statistical significance (B = -0.078, p = .41). Also, the remainder of Peoria saw a
32
statistically significant increase of 36.3% in this same offense type (B = 0.031, p < .01), which is
consistent with the patterns of offenses seen above (i.e., the rest of the city went through
substantive and significant increase in crime that was not seen in the target or the control areas).
Table 5: Maximum Likelihood Regression Models of Drug and Disorder Crime Trends
Measure Coeff. St. Error p Coeff. St. Error p Coeff. St. Error pIntercept 1.694 0.346 < 0.01 3.9 0.114 < 0.01 5.31 0.06 < 0.01 Post-Intervention -0.508 0.339 0.13 -0.078 0.094 0.41 0.31 0.060 < 0.01Controls Trend -0.011 0.015 0.46 0.014 0.005 < 0.01 0.000 0.002 0.77 Trend Squared 0.000 0.000 0.49 0.000 0.000 0.55 0.000 0.000 0.01 January 0.023 0.355 0.95 0.095 0.117 0.41 0.203 0.060 < 0.01 February 0.271 0.344 0.43 0.112 0.117 0.33 0.256 0.060 < 0.01 March 0.085 0.352 0.80 0.380 0.112 < 0.01 0.429 0.059 < 0.01 April 0.795 0.328 0.01 0.320 0.113 < 0.01 0.430 0.059 < 0.01 May 0.439 0.338 0.19 0.363 0.113 < 0.01 0.467 0.059 < 0.01 June 0.915 0.326 0.00 0.272 0.115 0.01 0.426 0.059 < 0.01 July 0.489 0.341 0.15 0.351 0.114 < 0.01 0.495 0.060 < 0.01 August -0.009 0.357 0.98 0.372 0.114 < 0.01 0.563 0.060 < 0.01 September 0.665 0.335 0.04 0.628 0.111 < 0.01 0.513 0.060 < 0.01 October 0.407 0.343 0.23 0.318 0.116 < 0.01 0.467 0.062 < 0.01 November 0.107 0.367 0.77 0.026 0.123 0.82 0.211 0.060 < 0.01Model Statistics Log Likelihood LR Chi-Square Test (df)
Control Remaining Peoria
25.47 67.210.03 0.000
108.80.000
DMI
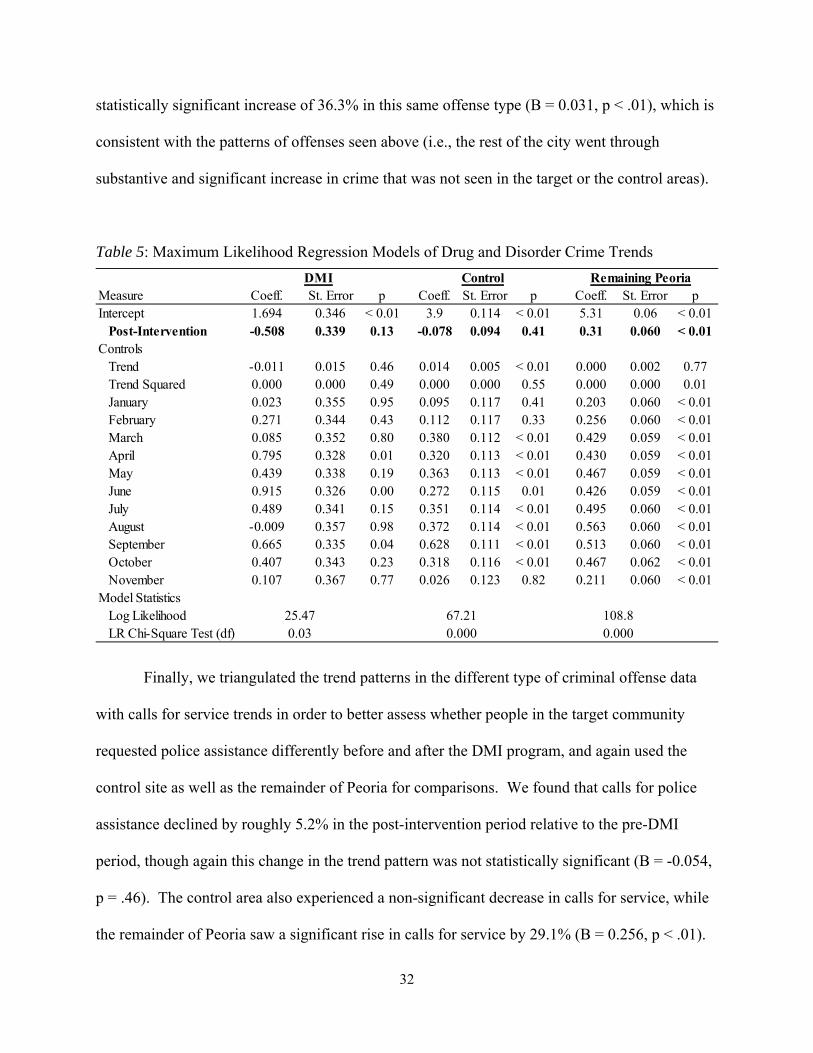
Finally, we triangulated the trend patterns in the different type of criminal offense data
with calls for service trends in order to better assess whether people in the target community
requested police assistance differently before and after the DMI program, and again used the
control site as well as the remainder of Peoria for comparisons. We found that calls for police
assistance declined by roughly 5.2% in the post-intervention period relative to the pre-DMI
period, though again this change in the trend pattern was not statistically significant (B = -0.054,
p = .46). The control area also experienced a non-significant decrease in calls for service, while
the remainder of Peoria saw a significant rise in calls for service by 29.1% (B = 0.256, p < .01).
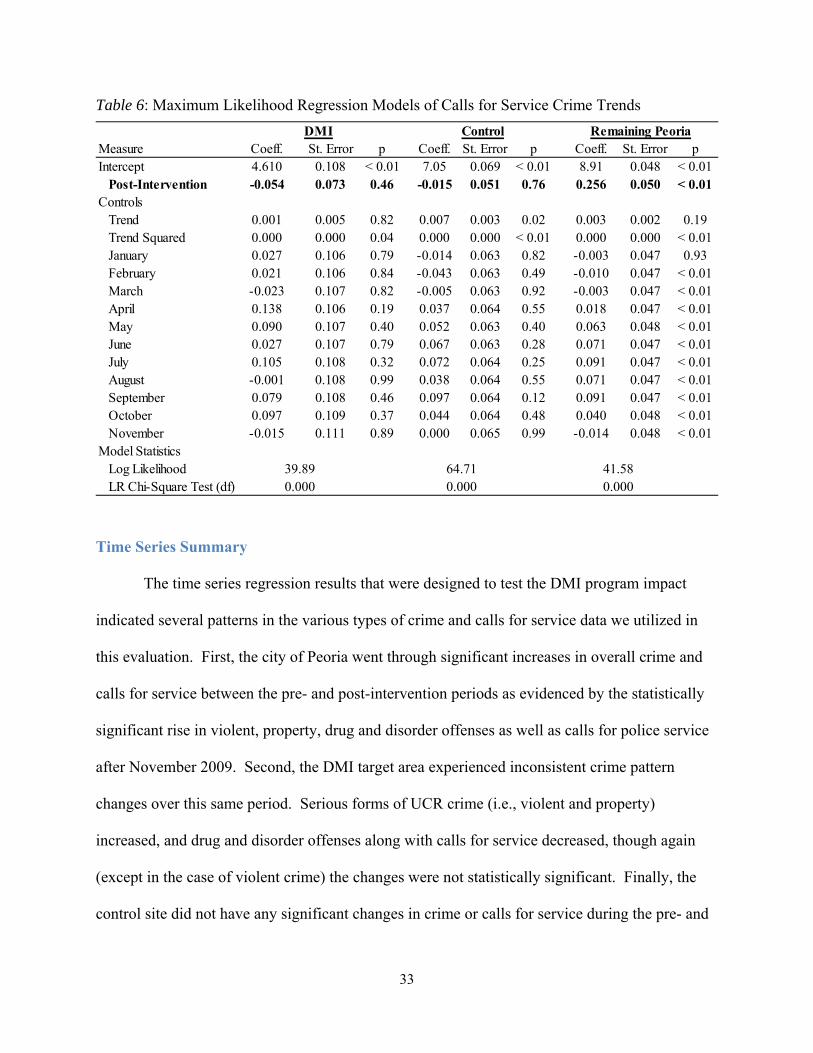
33
Table 6: Maximum Likelihood Regression Models of Calls for Service Crime Trends
Measure Coeff. St. Error p Coeff. St. Error p Coeff. St. Error pIntercept 4.610 0.108 < 0.01 7.05 0.069 < 0.01 8.91 0.048 < 0.01 Post-Intervention -0.054 0.073 0.46 -0.015 0.051 0.76 0.256 0.050 < 0.01Controls Trend 0.001 0.005 0.82 0.007 0.003 0.02 0.003 0.002 0.19 Trend Squared 0.000 0.000 0.04 0.000 0.000 < 0.01 0.000 0.000 < 0.01 January 0.027 0.106 0.79 -0.014 0.063 0.82 -0.003 0.047 0.93 February 0.021 0.106 0.84 -0.043 0.063 0.49 -0.010 0.047 < 0.01 March -0.023 0.107 0.82 -0.005 0.063 0.92 -0.003 0.047 < 0.01 April 0.138 0.106 0.19 0.037 0.064 0.55 0.018 0.047 < 0.01 May 0.090 0.107 0.40 0.052 0.063 0.40 0.063 0.048 < 0.01 June 0.027 0.107 0.79 0.067 0.063 0.28 0.071 0.047 < 0.01 July 0.105 0.108 0.32 0.072 0.064 0.25 0.091 0.047 < 0.01 August -0.001 0.108 0.99 0.038 0.064 0.55 0.071 0.047 < 0.01 September 0.079 0.108 0.46 0.097 0.064 0.12 0.091 0.047 < 0.01 October 0.097 0.109 0.37 0.044 0.064 0.48 0.040 0.048 < 0.01 November -0.015 0.111 0.89 0.000 0.065 0.99 -0.014 0.048 < 0.01Model Statistics Log Likelihood LR Chi-Square Test (df)
Control Remaining Peoria
39.89 64.710.000 0.000
41.580.000
DMI
Time Series Summary
The time series regression results that were designed to test the DMI program impact
indicated several patterns in the various types of crime and calls for service data we utilized in
this evaluation. First, the city of Peoria went through significant increases in overall crime and
calls for service between the pre- and post-intervention periods as evidenced by the statistically
significant rise in violent, property, drug and disorder offenses as well as calls for police service
after November 2009. Second, the DMI target area experienced inconsistent crime pattern
changes over this same period. Serious forms of UCR crime (i.e., violent and property)
increased, and drug and disorder offenses along with calls for service decreased, though again
(except in the case of violent crime) the changes were not statistically significant. Finally, the
control site did not have any significant changes in crime or calls for service during the pre- and
34
post-intervention periods. The time series results indicate the target area experienced no major
rise or decline in the major offense rates or calls for police service trends between the pre- and
post-DMI intervention periods. Thus, while the rest of the city was experiencing an increase in
all types of crime, rates of criminal offending remained relatively stable in the DMI target and
control areas during this same period.
Crime rates and calls for service tell only part of the story, though—the potential
effectiveness of a crime reduction strategy such as the Peoria DMI may extend beyond official
sources of data to encompass citizens’ perceptions of police activities and of possible changes in
neighborhood conditions as a result of the program. In the next two sections, we rely upon
citizen surveys and in-depth resident interviews in order to capture detailed information about
these important community dynamics.
35
Peoria Resident Survey Results
The data presented in this section were gathered from a telephone survey conducted in
May and June 2010 by the Survey Research Center at the University of Illinois – Springfield. A
total of 1,416 randomly selected Peoria adults were contacted, with up to four additional follow-
up requests to non-responders in order to improve the overall response rate. Individuals were
classified into three unique geographic areas, which were incorporated into the sampling
strategy: the target area (which accounted for 14.1% of the total number of respondents), the
control area (42.6% of respondents), and the remainder of Peoria (43.3% of respondents). A
total of 652 adults of the 1,416 contacted agreed to participate in the survey, and of those that
began, over 98.6% (N = 643 out of 652) completed the entire interview.
This sampling strategy resulted in an overall response rate of 45.4%. The target area’s
response rate was 45.3%, the control area’s was 43.0%, and for the remainder of Peoria, 48.0%.
As can be seen in Table 7, the final survey sample was predominately older (mean age = 56.6
years) and female (66.8%), and White (59.8%). In terms of financial information (not displayed
in Table 7), there was substantial variability in reported annual household income. The
breakdown was as follows: less than $20,000 (25.5%), $20,001 to $34,999 (26.5%), $35,000 to
$49,999 (17.9%), $50,000 to $69,999 (10.3%), greater than $70,000 (19.8%).12
12 While all demographic percentage distributions are based on the valid percent of cases (i.e., valid percents for each item), the measure for annual household income only resulted in a 75.3% valid response rate among the overall sample (i.e., 24.7% of the sample did not provide an answer). Thus, caution should be employed when considering the influence of annual home income on the various outcome measures among study participants.
36
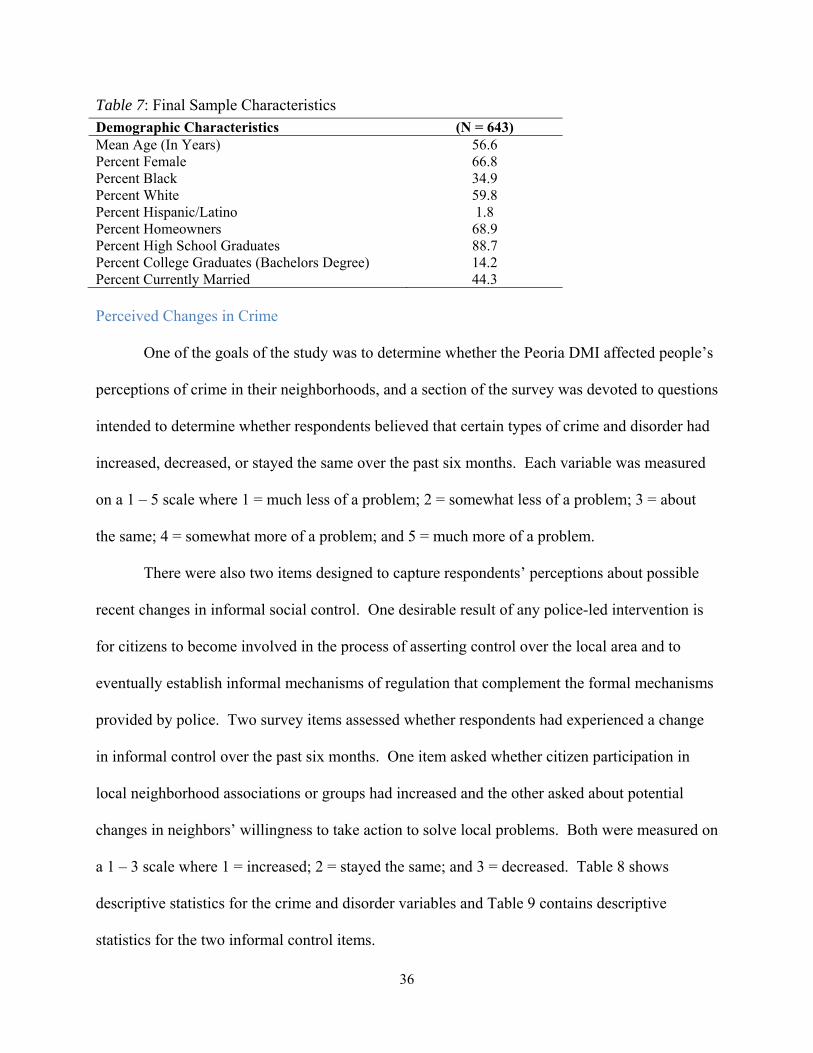
Table 7: Final Sample Characteristics Demographic Characteristics (N = 643) Mean Age (In Years) 56.6 Percent Female 66.8 Percent Black 34.9 Percent White 59.8 Percent Hispanic/Latino 1.8 Percent Homeowners 68.9 Percent High School Graduates 88.7 Percent College Graduates (Bachelors Degree) 14.2 Percent Currently Married 44.3 Perceived Changes in Crime
One of the goals of the study was to determine whether the Peoria DMI affected people’s
perceptions of crime in their neighborhoods, and a section of the survey was devoted to questions
intended to determine whether respondents believed that certain types of crime and disorder had
increased, decreased, or stayed the same over the past six months. Each variable was measured
on a 1 – 5 scale where 1 = much less of a problem; 2 = somewhat less of a problem; 3 = about
the same; 4 = somewhat more of a problem; and 5 = much more of a problem.
There were also two items designed to capture respondents’ perceptions about possible
recent changes in informal social control. One desirable result of any police-led intervention is
for citizens to become involved in the process of asserting control over the local area and to
eventually establish informal mechanisms of regulation that complement the formal mechanisms
provided by police. Two survey items assessed whether respondents had experienced a change
in informal control over the past six months. One item asked whether citizen participation in
local neighborhood associations or groups had increased and the other asked about potential
changes in neighbors’ willingness to take action to solve local problems. Both were measured on
a 1 – 3 scale where 1 = increased; 2 = stayed the same; and 3 = decreased. Table 8 shows
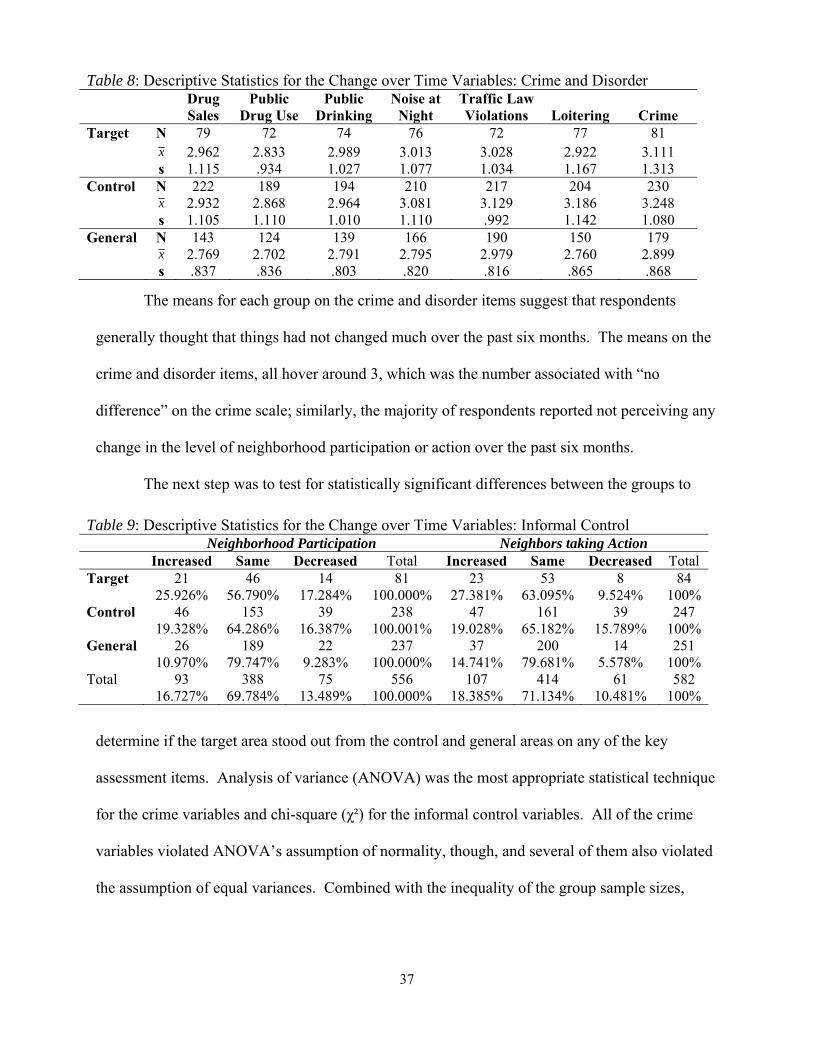
descriptive statistics for the crime and disorder variables and Table 9 contains descriptive
statistics for the two informal control items.
37
Table 9: Descriptive Statistics for the Change over Time Variables: Informal Control Neighborhood Participation Neighbors taking Action Increased Same Decreased Total Increased Same Decreased Total Target 21
25.926% 46
56.790% 14
17.284% 81
100.000%23
27.381% 53
63.095% 8
9.524% 84
100%Control 46
19.328% 153
64.286% 39
16.387% 238
100.001%47
19.028% 161
65.182% 39
15.789% 247
100%General 26
10.970% 189
79.747% 22
9.283% 237
100.000%37
14.741% 200
79.681% 14
5.578% 251
100%Total 93
16.727% 388
69.784% 75
13.489% 556
100.000%107
18.385% 414
71.134% 61
10.481% 582
100%
The means for each group on the crime and disorder items suggest that respondents
generally thought that things had not changed much over the past six months. The means on the
crime and disorder items, all hover around 3, which was the number associated with “no
difference” on the crime scale; similarly, the majority of respondents reported not perceiving any
change in the level of neighborhood participation or action over the past six months.
The next step was to test for statistically significant differences between the groups to
determine if the target area stood out from the control and general areas on any of the key
assessment items. Analysis of variance (ANOVA) was the most appropriate statistical technique
for the crime variables and chi-square (χ²) for the informal control variables. All of the crime
variables violated ANOVA’s assumption of normality, though, and several of them also violated
the assumption of equal variances. Combined with the inequality of the group sample sizes,
Table 8: Descriptive Statistics for the Change over Time Variables: Crime and Disorder Drug
Sales Public
Drug Use Public
Drinking Noise at
Night Traffic Law Violations
Loitering
Crime
Target N 79 72 74 76 72 77 81 x 2.962 2.833 2.989 3.013 3.028 2.922 3.111 s 1.115 .934 1.027 1.077 1.034 1.167 1.313 Control N 222 189 194 210 217 204 230 x 2.932 2.868 2.964 3.081 3.129 3.186 3.248 s 1.105 1.110 1.010 1.110 .992 1.142 1.080 General N 143 124 139 166 190 150 179 x 2.769 2.702 2.791 2.795 2.979 2.760 2.899 s .837 .836 .803 .820 .816 .865 .868
38
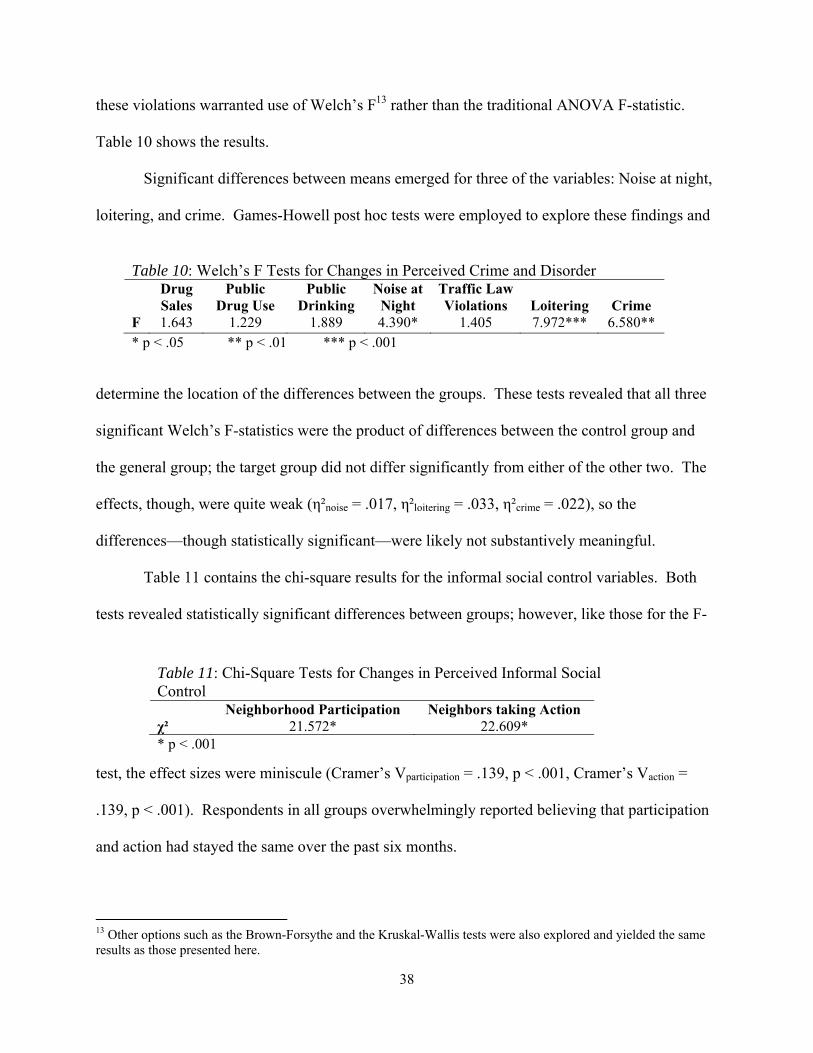
Table 11: Chi-Square Tests for Changes in Perceived Informal Social Control Neighborhood Participation Neighbors taking Action χ² 21.572* 22.609* * p < .001
these violations warranted use of Welch’s F13 rather than the traditional ANOVA F-statistic.
Table 10 shows the results.
Significant differences between means emerged for three of the variables: Noise at night,
loitering, and crime. Games-Howell post hoc tests were employed to explore these findings and
determine the location of the differences between the groups. These tests revealed that all three
significant Welch’s F-statistics were the product of differences between the control group and
the general group; the target group did not differ significantly from either of the other two. The
effects, though, were quite weak (η²noise = .017, η²loitering = .033, η²crime = .022), so the
differences—though statistically significant—were likely not substantively meaningful.
Table 11 contains the chi-square results for the informal social control variables. Both
tests revealed statistically significant differences between groups; however, like those for the F-
test, the effect sizes were miniscule (Cramer’s Vparticipation = .139, p < .001, Cramer’s Vaction =
.139, p < .001). Respondents in all groups overwhelmingly reported believing that participation
and action had stayed the same over the past six months.
13 Other options such as the Brown-Forsythe and the Kruskal-Wallis tests were also explored and yielded the same results as those presented here.
Table 10: Welch’s F Tests for Changes in Perceived Crime and Disorder Drug
Sales Public
Drug Use Public
Drinking Noise at
Night Traffic Law Violations
Loitering
Crime
F 1.643 1.229 1.889 4.390* 1.405 7.972*** 6.580** * p < .05 ** p < .01 *** p < .001
39
Table 12: Awareness of the DMI by Group Heard of the DMI? Yes No Maybe Total Target 29
34.118% 51
60.000% 5
5.882%85
100% Control 55
20.913% 197
74.905% 11
4.183%263
100% General 69
25.091% 189
68.727% 17
6.182%275
100% Total 153
24.559% 437
70.144% 33
5.297%623
100%
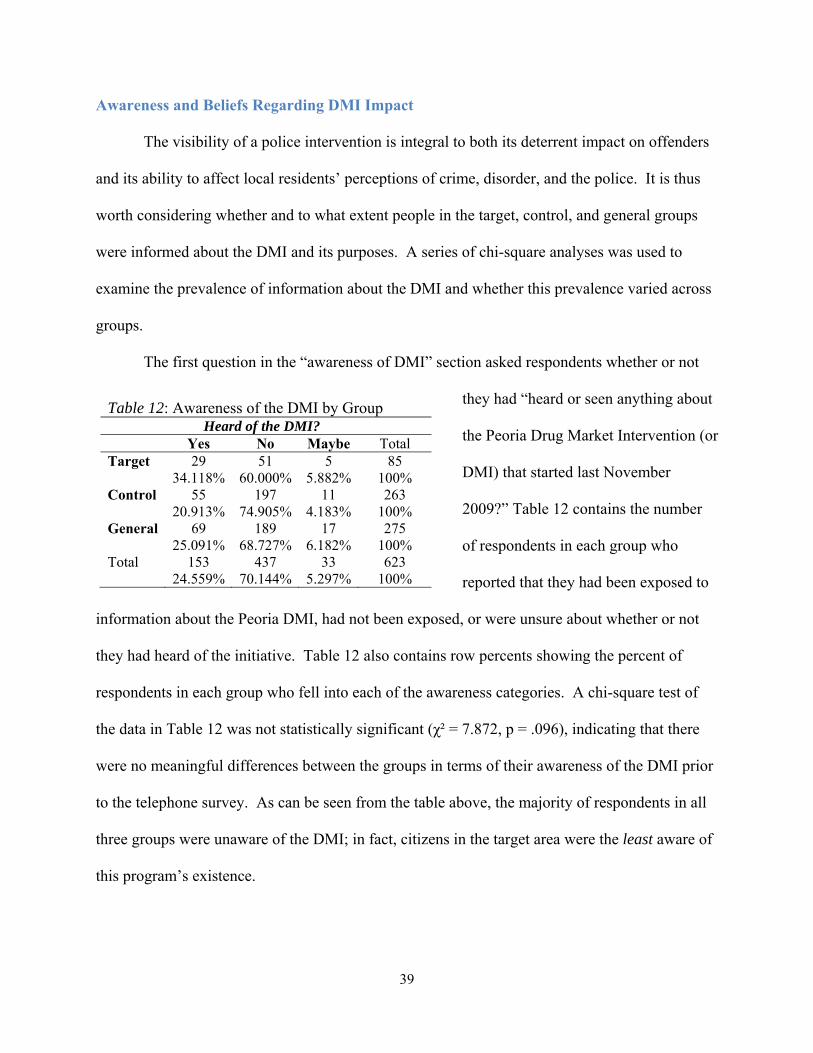
Awareness and Beliefs Regarding DMI Impact
The visibility of a police intervention is integral to both its deterrent impact on offenders
and its ability to affect local residents’ perceptions of crime, disorder, and the police. It is thus
worth considering whether and to what extent people in the target, control, and general groups
were informed about the DMI and its purposes. A series of chi-square analyses was used to
examine the prevalence of information about the DMI and whether this prevalence varied across
groups.
The first question in the “awareness of DMI” section asked respondents whether or not
they had “heard or seen anything about
the Peoria Drug Market Intervention (or
DMI) that started last November
2009?” Table 12 contains the number
of respondents in each group who
reported that they had been exposed to
information about the Peoria DMI, had not been exposed, or were unsure about whether or not
they had heard of the initiative. Table 12 also contains row percents showing the percent of
respondents in each group who fell into each of the awareness categories. A chi-square test of
the data in Table 12 was not statistically significant (χ² = 7.872, p = .096), indicating that there
were no meaningful differences between the groups in terms of their awareness of the DMI prior
to the telephone survey. As can be seen from the table above, the majority of respondents in all
three groups were unaware of the DMI; in fact, citizens in the target area were the least aware of
this program’s existence.
40
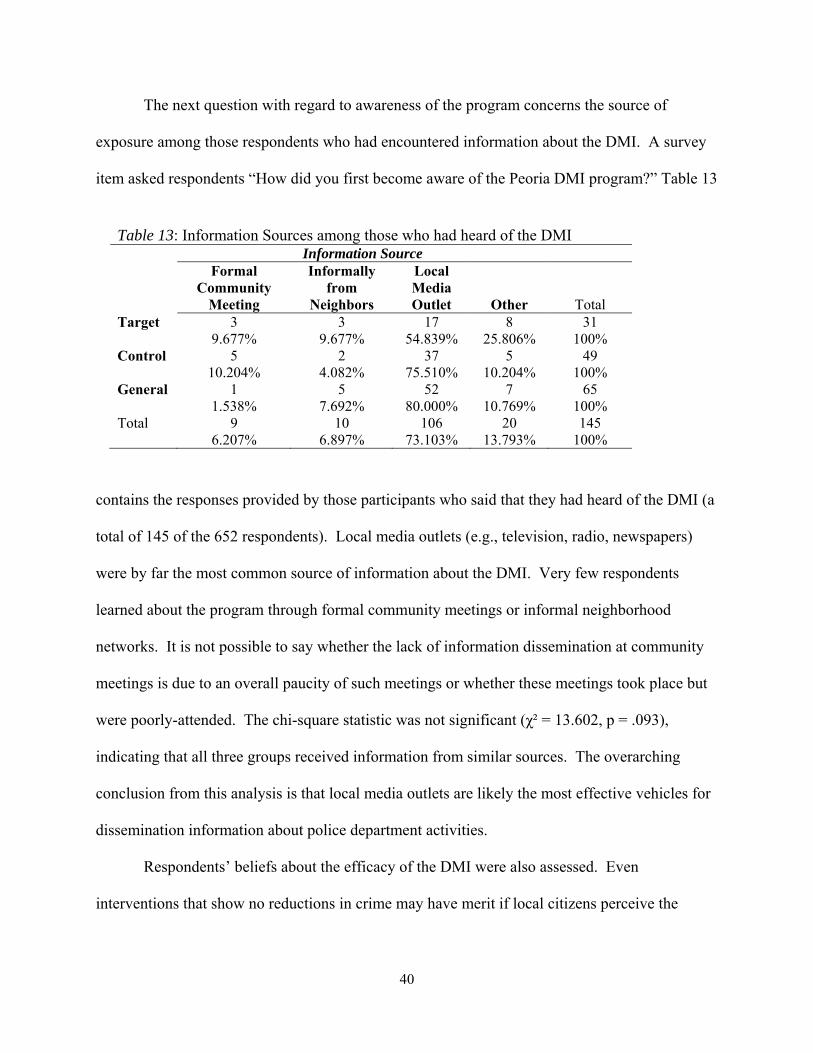
Table 13: Information Sources among those who had heard of the DMI Information Source Formal
Community Meeting
Informally from
Neighbors
Local Media Outlet
Other
Total Target 3
9.677% 3
9.677% 17
54.839% 8
25.806% 31
100% Control 5
10.204% 2
4.082% 37
75.510% 5
10.204% 49
100% General 1
1.538% 5
7.692% 52
80.000% 7
10.769% 65
100% Total 9
6.207% 10
6.897% 106
73.103% 20
13.793% 145
100%
The next question with regard to awareness of the program concerns the source of
exposure among those respondents who had encountered information about the DMI. A survey
item asked respondents “How did you first become aware of the Peoria DMI program?” Table 13
contains the responses provided by those participants who said that they had heard of the DMI (a
total of 145 of the 652 respondents). Local media outlets (e.g., television, radio, newspapers)
were by far the most common source of information about the DMI. Very few respondents
learned about the program through formal community meetings or informal neighborhood
networks. It is not possible to say whether the lack of information dissemination at community
meetings is due to an overall paucity of such meetings or whether these meetings took place but
were poorly-attended. The chi-square statistic was not significant (χ² = 13.602, p = .093),
indicating that all three groups received information from similar sources. The overarching
conclusion from this analysis is that local media outlets are likely the most effective vehicles for
dissemination information about police department activities.
Respondents’ beliefs about the efficacy of the DMI were also assessed. Even
interventions that show no reductions in crime may have merit if local citizens perceive the
41
Table 14: Beliefs about the DMI’s Impact Belief about Impact Major
Positive Difference
Minor Positive
Difference
No
Impact
Minor Negative
Difference
Major Negative
Difference
Total Target 11
25.000% 16
36.364% 12
27.273% 5
11.364% 0
0.000% 44
100% Control 20
25.641% 24
30.769% 31
39.744% 2
2.564% 1
1.282% 78
100% General 10
14.286% 30
42.857% 26
37.143% 3
4.286% 1
1.429% 70
100% Total 41
21.354% 70
36.458% 69
35.938% 10
5.208% 2
1.042% 192
100%
Table 15: Beliefs about the DMI’s Impact by Exposure to Information Belief about Impact Aware
Major Positive
Difference
Minor Positive
Difference
No
Impact
Minor Negative
Difference
Major Negative
Difference
Total Yes 21
20.000% 45
42.857% 31
29.524% 7
6.667% 1
.952% 105
100% No 14
19.178% 23
31.507% 34
46.575% 1
1.370% 1
1.370% 73
100% Maybe 6
50.000% 1
8.333% 3
25.000% 2
16.667% 0
0.000% 12
100% Total 41
21.579% 69
36.316% 68
35.789% 10
5.263% 2
1.053% 190
100%
police more positively afterward and/or perceive that crime and disorder have been quelled.
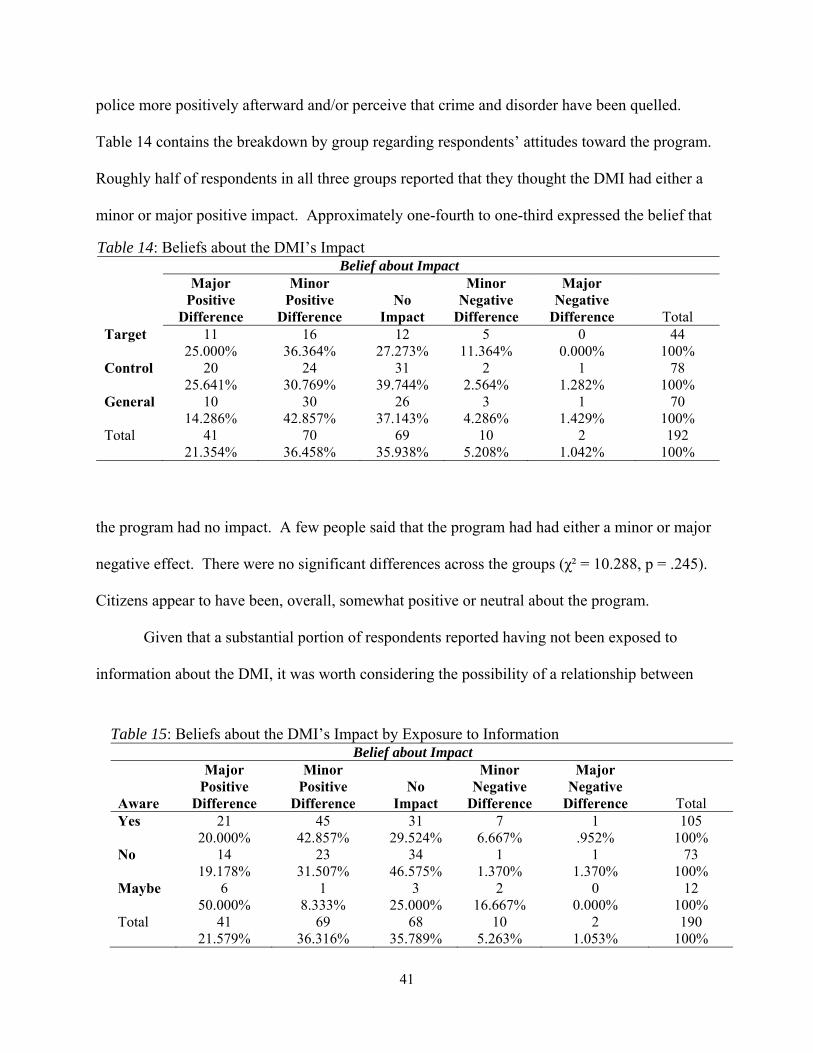
Table 14 contains the breakdown by group regarding respondents’ attitudes toward the program.
Roughly half of respondents in all three groups reported that they thought the DMI had either a
minor or major positive impact. Approximately one-fourth to one-third expressed the belief that
the program had no impact. A few people said that the program had had either a minor or major
negative effect. There were no significant differences across the groups (χ² = 10.288, p = .245).
Citizens appear to have been, overall, somewhat positive or neutral about the program.
Given that a substantial portion of respondents reported having not been exposed to
information about the DMI, it was worth considering the possibility of a relationship between
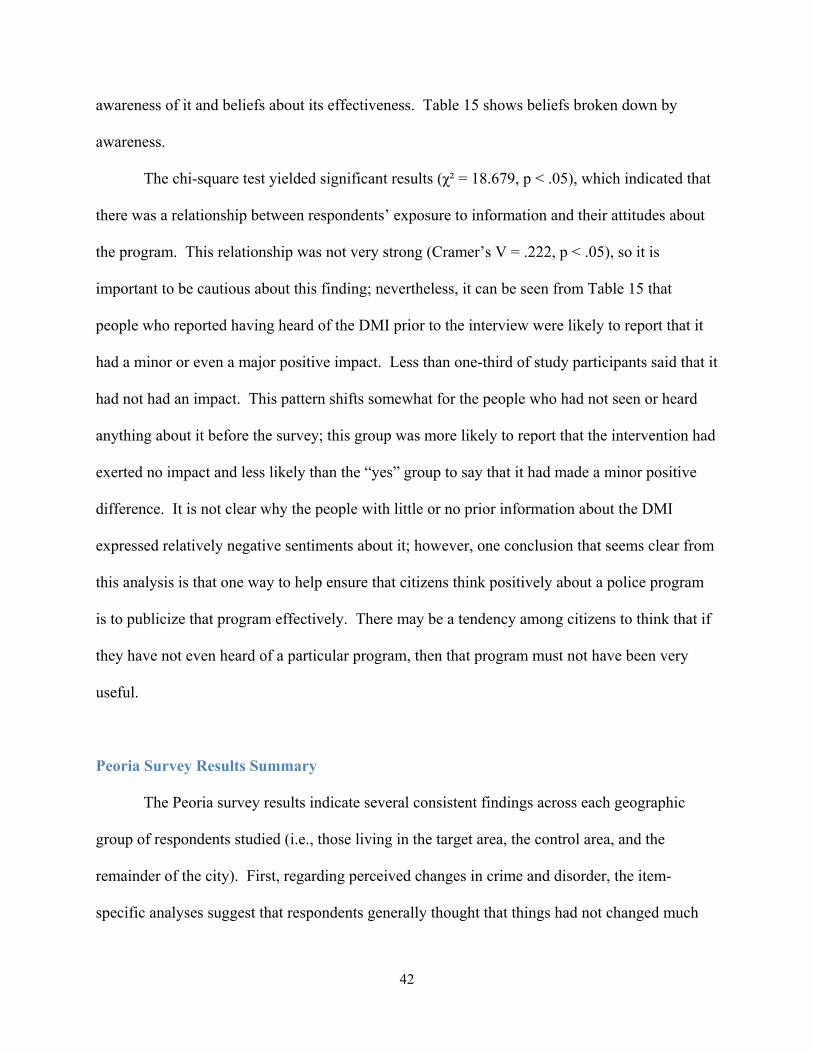
42
awareness of it and beliefs about its effectiveness. Table 15 shows beliefs broken down by
awareness.
The chi-square test yielded significant results (χ² = 18.679, p < .05), which indicated that
there was a relationship between respondents’ exposure to information and their attitudes about
the program. This relationship was not very strong (Cramer’s V = .222, p < .05), so it is
important to be cautious about this finding; nevertheless, it can be seen from Table 15 that
people who reported having heard of the DMI prior to the interview were likely to report that it
had a minor or even a major positive impact. Less than one-third of study participants said that it
had not had an impact. This pattern shifts somewhat for the people who had not seen or heard
anything about it before the survey; this group was more likely to report that the intervention had
exerted no impact and less likely than the “yes” group to say that it had made a minor positive
difference. It is not clear why the people with little or no prior information about the DMI
expressed relatively negative sentiments about it; however, one conclusion that seems clear from
this analysis is that one way to help ensure that citizens think positively about a police program
is to publicize that program effectively. There may be a tendency among citizens to think that if
they have not even heard of a particular program, then that program must not have been very
useful.
Peoria Survey Results Summary
The Peoria survey results indicate several consistent findings across each geographic
group of respondents studied (i.e., those living in the target area, the control area, and the
remainder of the city). First, regarding perceived changes in crime and disorder, the item-
specific analyses suggest that respondents generally thought that things had not changed much
43
over the past six months. The fact that a majority of respondents in each area reported “no
difference” on the various crime change scales for drug sales, public drug use, public drinking,
noise at night, traffic law violations, loitering, and overall crime within the past six months
suggests that the majority of respondents reported not perceiving any change in the level of
crime and disorder within their communities. This was particularly true among target area
respondents relative to the other two groups of participants. In addition, regarding neighborhood
participation and action (i.e., neighborhood informal social control mechanisms), respondents in
all groups overwhelmingly reported that participation and community action had stayed the same
in the past six months.
In essence, target area respondents’ perceptions of changes in crime and disorder
mirrored those of the residents in non-DMI areas of Peoria. In addition, DMI target area
residents were, on average, no more aware of the strategy than were the remaining city residents.
The group of people who lived closest to the DMI intervention setting also perceived no change
in neighborhood participation or in local citizens taking action to impact crime within the target
community. Thus, regardless of where people lived, there was not an overwhelming feeling that
the DMI corresponded with a substantive change in crime within the target area. Further, we did
not find evidence that citizens within the target community became more invested in social
behaviors intended to reduce local problems, nor were they any more aware of the DMI relative
to their counterparts residing in other areas of the city. These findings suggest that there was
inconsistency between police crime control efforts and target area residents’ perceptions of
neighborhood conditions.
44
In-Depth Resident Interviews
Sample and Data As indicated by the quantitative results presented above, the DMI was not associated with
a consistent reduction in either officially-measured or resident-perceived levels of crime in the
target zone. One downfall of survey data like that summarized in the previous section, though, is
that it captures relatively cursory information about citizens’ perceptions of crime, disorder,
social conditions, and police activities in their neighborhoods. In recognition of this
shortcoming, we attempted to complement our measurement of potential programmatic impact
with face-to-face interviews with 71 Peoria residents (49 females and 22 males). Study
participants ranged in age from 19 to 93, with a mean of 41.14 Forty-five percent of respondents
were White, 51% Black and, 4% Hispanic/Latino.
We purposefully targeted two groups of residents in our sampling strategy: individuals
that we considered heavily involved in police-community relations and persons who, in our
view, were less involved. Ultimately, the goal was to interview persons with considerable
knowledge about both the target area and Peoria as a whole. We hoped to obtain a
comprehensive assessment of study participants’ experiences with and perceptions of crime and
disorder. The research team conducted resident interviews in June and July of 2010.
Participation in the study was voluntary, and respondents were paid $25 (with a retail gift card)
and assured confidentiality.15
14 Several respondents identified themselves as long-time Peoria residents. 15 We use pseudonyms herein to further mask respondents’ identities. The interviews were semi-structured and consisted of open-ended questions that allowed for considerable probing.
45
Results
We sought study participants’ perceptions regarding a wide range of crimes and
neighborhood conditions. Consistent with the survey results, the in-depth interviews revealed
that the majority of respondents perceived no or minimal improvement in crime and disorder in
the target neighborhood. We limit our discussion here to open air-drug dealing as that was the
primary focus of DMI.
The in-depth interviews provided us with a detailed, nuanced understanding of the nature
and extent of drug dealing in the target area. When asked specifically about perceived changes
in the level of drug activity, the vast majority of respondents indicated that it was just as much a
problem currently than was the case pre-intervention. Several residents reported that police were
seemingly responsive to citizen complaints about street-level drug activity but believed that
officers’ efforts merely resulted in displacement and strategic changes in dealers’ behaviors
rather than effective, long term solutions. For example, Karen noted, “[Police efforts] changes
where [drug dealers] conduct [their activities]. They just move somewhere else. [They might
tell customers], ‘let’s go around the corner,’ they just rotate.” Similarly, Ruth stated, “[The drug
activity] has died down some [in a particular location]… but [the dealers] have taken it from that
area and then moved it right across the street.” Finally, Roberta remarked, “There was a
convenience store [where the drug dealers] used to hang out. You don’t see [open-air drug
dealing] so much there anymore so, once you stop seeing it in one area, it goes to another…”
A number of study participants also mentioned drug sellers’ innovations beyond simply
changing locations. While respondents remarked that the most blatant forms of open-air drug
dealing had dissipated in the target area, they noted that many remaining dealers had simply
adapted to enforcement efforts and now sold drugs more covertly (i.e., by staying mobile).
46
Maureen reported, “…[the drug dealers have been] riding up on bikes and doing [drug
transactions] real quick, you don’t have time to call the police, and they’re gone, then they might
come back… they’re not standing in one spot for any length of time.” Likewise, Wilma said,
“[The drug dealers] got their bikes, they’re doing their deals and then taking off on their bikes
instead of just staying in one area…” Eunice remarked:
Now they’ve gotten this new deal where they don’t just loiter around behind [buildings] and sell drugs. They have a moving thing where they pop in on a bike or a car and they sell the drugs and then they take off, so it doesn’t do us any good to call the police because by the time the police get there, they’re gone.
Further, several citizens identified one of the most highly touted police resources, the
armadillo,16 as being unwittingly responsible for dealers becoming more mobile and displacing
crime. For example, Ruth reported, “…they have the armadillo trucks parked out there now, but
[the dealers] have [gone] from [selling] in the front [of houses] to the alley.” In agreement,
Harriett commented, “I think maybe [the armadillo is a deterrent], especially if it’s parked in
front of a drug house, a gang-house, but [the activities] not goin’ away, it’s just deterrin’ it to
somewhere else.”
Residents also shared a belief that a sustainable crime prevention effort would require not
just a commitment from police but also greater levels of community involvement.17 Adam
reported, “[There’s] strength in numbers, that’s the only way this [crime reduction effort] is
gonna work, because [the police] can sweep up as many [dealers] as they want, if nobody comes
and stands up and says, ‘I’m taking my block back. You’re not comin’ back in here.’ They’ll
flood the place again.” And Kevin noted, “It’s like when you spray for bugs, they go next door,
16 The armadillo is a fortified former Brink’s truck, turned police vehicle, fully equipped with surveillance equipment. The Peoria Police Department deploys the vehicle on public streets in front of nuisance properties where drug dealing and other criminal activities are suspected (see Porter, 2009). The department previously used an unmanned, marked police vehicle but returned to find that it had been vandalized. 17 Low-levels of community engagement were well documented in the citizen survey results.
47
so obviously if you’re chasing [the dealers] out of one area, they’re gonna go into another area,
but what could happen is these other neighborhoods can prepare themselves and already have…”
Several studies have documented that illicit street drug markets have a propensity toward
violence where dealers engage in violent forms of retaliation that include beatings, fights,
killings, and other forms of physical attack to address perceived grievances (Jacobs and Wright,
2006; Kubrin and Weitzer, 2003). In addition, Jacques (2010) recently developed a framework
that outlined non-violent forms of retaliation used by dealers such as stealth and fraudulent forms
of retaliation, where dealers or buyers commit property offenses as a way of redressing perceived
harm. Study participants consistently reported that they and their neighbors were reluctant to
call the police to report crime.18 The vast majority of residents cited fear of retaliation from
suspects as the primary reason fellow citizens were unwilling to assist the police. It is beyond
the scope of this report to examine if these fears were real or perceived.19 Irrespective of actual
levels of retaliatory crimes, however, the sharing of accounts of retaliation among neighborhood
residents seemingly reduced the willingness of individuals to report crime or become actively
involved in neighborhood stabilization efforts. For example, Darlene said, “I think [concern
about retaliation is] widespread, I don’t know if I’ve run across anybody or heard from anybody
that doesn’t feel that way.” In agreement, Wilma noted, “[People] were afraid to be retaliated
[against], and I just tell them that they don’t have to leave their name or address, and just leave
their phone number if they want [the police] to talk to ‘em.” Likewise, Brett said, “[When
calling the police, people] just don’t wanna use their name[s].” Further, Cynthia remarked,
18 Recall that calls for service within the target area remained relatively stable between the pre- and post-intervention periods. 19 A handful of respondents offered acts of vandalism and other property crimes as evidence of their being retaliated against by local dealers for having called the police. For example, Clint noted, “I know people that have called [the police] and they’ll come out maybe the next day and their car windows are broken, or [their car has] been spray painted or keyed...”
48
“[Residents] are afraid that if someone finds out they’re the one that called the police that
somebody will retaliate on them, on their house or their family, ‘cause Peoria’s a small place and
everybody knows somebody that knows somebody, so a lotta people are just afraid to talk.”
And, Carla said, “I really don’t believe [neighborhood residents] will [call the police] because
they don’t want their names used, they don’t want their addresses used, I think they’re frightened
of retribution.” Finally, Michael observed, “[For minor problems] I’ll call, and I don’t care, [the
police can tell the suspect that] I said their name, but if there was someone that was actually
[threatening], like a big drug dealer, I wouldn’t call.”
Finally, in addition to being dissatisfied with neighborhood conditions, the vast majority
of residents were concerned with the wellbeing of neighborhood youth and were frustrated by the
lack of prosocial activities available to them. They consistently reported that the streets of the
target area were often besieged by scores of unsupervised youth, especially after nightfall.
Respondents associated idle youths with neighborhood crime and disorder. For instance, Jenny
said, “I think they need to do more with the youth and it would probably steer them away from
the violence and whatever, if they had more things to go on for them.” Trent observed, “You
have all these young mothers, who let these kids out, early in the morning, say about seven
o’clock, and they’re out all day and half the night, till bout 11.” Harriett noted, “[It would be
better] if [the youth] had somewhere to go, had somewhere to focus their attention…” “Matthew
reported, “[I have seen] kids walkin’ up and down the street late at night…” Greta said, “A lot
of the kids down here feel that they don’t have a chance, it’s like they look at things and [are a]
product of their environment. They feel they don’t have anywhere to go other than out on the
stoop or the corner…”
49
Evaluation Summary and Discussion
Traditional Law Enforcement Strategies Bayley (1994) contends that traditional law enforcement practices have little impact on
local crime rates. For example, research indicates that the number of law enforcement officers
available to police departments does not correlate with increased levels of crime and violence
across different cities (Eck and Maguire, 2000; Greenberg, Kessler, and Loftin, 1983). In
addition, Rosenbaum and Lurigio (1994) found that randomized patrols, rapid response
strategies, and routine criminal investigations have exhibited minimal crime reduction impact.
Thus, there is little reason to believe that suppression approaches or crackdowns will reduce
specific types of crime in a meaningful way.
Concerning the specific focus on open-air drug markets, Sherman (1990) illustrated long
ago that police crackdowns (i.e., sudden changes in police activity resulting in crime suppression
or geographic saturation) directed at street drug markets are generally unsuccessful. He noted
that “the [drug] market in some areas appears to be so strong that street dealing reappears almost
as soon as police efforts are reduced” (Sherman, 1990: 25). Related to this issue of offender
replacement and short-term effects, Skogan and Hartnett (1997) noted that law enforcement
officials cannot monitor neighborhoods with the same intensity as local community members.
This is particularly true as time progresses after a strategic initiative is implemented in a high-
crime area. As a result, many police departments have focused their efforts on collaborative and
dynamic approaches that are designed to alter the structural environments where drug crimes are
more likely to occur.
50
The Necessary Conditions for Social Change
In a seminal theoretical framework that attempted to identify the various processes that
facilitate social change within target populations, Mayer (1972) posited that three major nodes
are needed: (1) change the combination of persons who participate in the system; (2) change the
roles people play in the system; and (3) change the statuses of the persons in that system. Thus,
an integrative and dynamic framework may provide the best opportunity to create social change.
From a macro-social perspective, Bursik and Grasmick (1993) illustrated that neighborhoods
themselves are complex systems where residents, public officials, and offending populations
intersect. Disconnected and fragmented neighborhood social systems are at higher risk for illicit
activity, such as illegal drug use and street-level distribution.
Drawing from Carr’s (2003) definition, parochial informal social control is where
diminished private forms of social control may be enhanced by a combination of public and
private informal social control (i.e., non-intimates working with public sectors in order to
improve neighborhood social control mechanisms). Sites seemingly need to have (or generate)
enhanced police-community partnerships in order to sustain any gains in crime reduction efforts
after the police utilize the resources available to them. Consistent with Mayer’s (1972) second
tenet, the roles of actors in a neighborhood system must change in order for police interventions
to have meaningful and lasting impact. The pulling levers framework is an intervention intended
to alter the dynamics of the neighborhood wherein open-air drug markets flourish.
The pulling levers policing framework, which was at the core of the Peoria Drug Market
Intervention (DMI), is based on the notion that perceived risk of enhanced sanctions will deter
groups of high-risk individuals from re-offending. Kennedy (1997) contends that a successful
pulling levers strategy and response to targeted crime and violence must be advertised (i.e.,
51
signaled) and communicated to current and potential replacement offenders. The direct
communication message in the call-in meetings is intended to influence the perceptions among
high-risk and persistent offenders of the increased certainty of a criminal justice response for
continued illicit behavior (Nagin, 1998). Based on a systematic review of the deterrence
literature, Kennedy (2009) posits that the pulling levers strategy has the capacity to change
perceptions among chronic offenders because the threat of directed arrests and prosecutions
would be perceived as a change in the way that the criminal justice system typically handles drug
offenders.
In addition, the pulling levers approach draws upon the problem-oriented policing model
that relies upon target identification, strategic approaches to specific crime problems, and a
detailed impact evaluation of strategies employed (Goldstein, 1990). Mazerolle, Soole, and
Rombouts (2007) conducted a meta-analysis of evaluations of police-led anti-drug efforts and
found that problem-oriented policing strategies (i.e., proactive patrols, geographic focus,
community and police partnerships, arrest referrals, and diversion) appeared to be the most
effective approaches when dealing with drug crime and associated disorder and incivilities. The
authors concluded that initiatives relying on a variety of specifically-crafted tactics rather than
those that used more traditional and singular approaches (e.g., general patrols) appeared to hold
the most promise for producing significant results and long-term impact (Mazerolle et al., 2007:
137).
In order to change the perceived risk of criminal justice sanctions among high-risk
offenders in specific geographic contexts, as well as potential ‘replacement’ offenders within
illicit street drug markets, a risk-communication strategy must be strongly advertised and the
message must be received by the target audience (Kennedy, 2009). In addition, where policing
52
strategies have shown promise in the drug market context, there is evidence that key residents
within the target community became increasingly involved in network capacity building (i.e.,
community activism), and that parochial forms of informal social control were likely enhanced
(see Carr, 2005).
The Peoria Findings Our survey results indicated that target area residents were no more aware of the local
DMI intervention than were residents across the entire city and that there was no real substantive
change in neighborhood cohesion or in community members’ proclivity to work together to
solve local crime problems (i.e., there was no increase in informal social control mechanisms). It
would appear the Peoria DMI strategy did not reach its intended audience, resonate with local
citizens, or alter perceptions among target community members in terms of addressing the crime
problems associated with the local drug market.
The in-depth resident interviews suggested that target area residents were concerned with
the potential for retaliation for cooperating with police officials. This is important because
residents did not seem to share a collective identity and belief that the community could combat
illicit drug trafficking. Indeed, the vast majority of respondents seemed to believe it was best to
‘mind one’s own business and avoid potential entanglement with drug-buyers, -dealers, or
suspicious neighbors. A clear nexus and collaboration between law enforcement and among
residents did not emerge from the analysis of the interviews. The fear of a retaliatory response
against specific individuals appeared to be a significant mediating influence that weakened the
creation or strengthening of informal social control networks in the community. Combined with
the fact that many residents stated that drug offenders simply altered their distribution styles
(e.g., dealers later started to ride their bicycles to different locations and dispersed after a ‘quick-
53
sale’), it would appear that many residents felt a sense of helplessness in terms of combating the
illegal distribution of drugs in their neighborhood.
The results from the interrupted time series models estimating the changes in violent
crime, property crime, drug offenses, and disorder as well as calls for police service showed no
major significant changes between the pre- and post-intervention periods across the various
outcomes for up to one-year after the strategy. As Bursik and Grasmick (1993) illustrated, it is
very difficult to disentangle the causal relationship between neighborhood commitment and
participation with strategic policing strategies and crime reduction. It may be that police can
reduce crime and thereby facilitate neighborhood involvement, or it could be that neighborhood
involvement encourages police to commit resources to the community and reduce crime. In the
case of the Peoria DMI, however, our results indicate that none of these important mechanisms
occurred. There was no significant change in crime outcomes, nor was there a substantive
change in target area residents’ perceptions of enhanced informal social control mechanisms,
police effectiveness, or crime reduction. The strategy never seemed to gain momentum and this
inhibited long-term crime reduction benefits.
While the time series results do not indicate a significant ‘displacement effect’ to the
adjoining control site (i.e., Police District #4), respondents who participated in the qualitative
component of the study seemingly perceived this to be the case. In particular, respondents
illustrated the changes in tactics that dealers employed to continue to distribute drugs illegally in
the area, and they noted that different areas in the community appeared to become more
attractive as drug crime hotspots. These findings may explain why the time series results did not
reveal a meaningful or substantive reduction in drug crime within the target area after the Peoria
intervention.
54
Implications and Conclusion Risk identification is one of the most important phases in any strategic criminal justice
intervention that is designed to reduce crime, recidivism, and risk among offending populations
or high-crime areas (see Lowenkamp, Latessa, and Holsinger, 2006). We propose a series of
recommendations for stakeholders who are considering different approaches that might be
employed to disrupt illicit street level drug markets. The review of the policing literature
combined with this study illustrate that it is important to understand, identify, and implement the
core elements that need to exist for a strategic policing strategy to have a substantive impact.
The first recommendation revolves around the possibility that the null effects of the
Peoria DMI stemmed, in part, from strained relationships between local police and target area
residents. Selection bias often plagues initial strategic criminal justice interventions;
specifically, the sites that have shown a significant crime reduction impact may have had strong
inter-agency as well as police-community partnerships before the initiatives actually unfolded
(e.g., High Point, Nashville, Rockford). Unfortunately, innovative police strategies are well-
received in the areas that need them the least. Stable police-community relationships are what
allow strategies like the DMI to take hold and render an effect, but these relationships are
generally at their worst in the most crime-stricken neighborhoods. The findings from Peoria
illustrate that the initiative itself likely does not serve as a catalyst to draw these necessary
elements together when they do not predate the strategy. When information networks between
key stakeholders and police are absent, the risk of failure may be relatively high until such
communication structures are intact. The network capacity building that occurred between the
local prosecutor’s office and the PPD drug narcotics task force could perhaps have been
improved by strengthening the collaboration with local community groups (see Skogan and
55
Hartnett, 1997). Relying heavily on the model from Community Oriented Policing Services
(COPS) may hold significant promise in such contexts before transcending to a strategic
intervention designed to have longer-term success. The creation of strong partnerships before
any intervention is enacted seems to be a necessary condition for successful community
interventions.
Second, it is advisable that future police interventions contain a stronger media and
outreach component specifically designed to enhance the target community’s awareness of the
initiative in order to promote focused deterrence for high-risk individuals and to increase
residents’ knowledge of related police activity. While there was some local media coverage the
night of the call-in session, there did not appear to be widespread awareness of the program in
either the target areas or anywhere else within the city. Most of the stories we found through on-
line access (eight news articles in total) described the specifics of the notification session, but did
not include a follow-up regarding potential changes within the community itself. Knowledge
that the police are cracking down on a certain type of crime and that they are soliciting
community input and assistance could prompt residents to get involved.
Finally, Jacques and Wright (2008) illustrated that drug markets are known to cause
elevated rates of violence in high-risk communities; however, the reverse is also true in that areas
that are already socially disorganized and crime-ridden are prime contexts for markets to be
established and to flourish. One of the keys to implementation is to link rates of violent, drug,
and property crime with the network of actors involved in the markets within these contexts.
The use of social network analysis and the identification of the various communication structures
between high-risk offenders within the drug market may be a vital step when deciding where to
implement a given strategy (see Hunt et al., 2008).
56
The current evaluation contributes to the growing body of literature showing somewhat
mixed results in terms of a substantive crime reduction impact when police rely upon deterrent
based approaches to combat street crimes within urban contexts. As additional sites consider
alternative programs to disrupt open-air drug markets, we strongly suggest that police officials
develop a clear understanding of police-community relations beforehand. It appears that local
neighborhood involvement among community stakeholders is a major key toward achieving a
substantive impact and long-term crime reduction effect. The Peoria initiative clearly
demonstrates that the law enforcement component alone does not produce long-term crime
reduction impact absent other key components of neighborhood integration, recognition, and
local support of the multi-faceted pulling levers framework.
57
Bibliography
Anderson, E. (1990). Streetwise: race, class, and change in an urban community. Chicago:
University Of Chicago Press. Bayley, D. H. (1994). International differences in community policing. In D. P. Rosenbaum
(Ed.), The challenge of community policing (pp. 278-281). Thousand Oaks, CA: Sage. Berg, M. & Rengifo, A. (2009). Rethinking community organization and robbery: Considering
illicit market dynamics. Justice Quarterly, 26(2), 211 – 237. Blumstein, A. & Rosenfeld, R. (1998). Explaining recent trends in U.S. homicide rates. Journal
of Criminal Law & Criminology, 88(4), 1175 – 1216. Blumstein, A. (1995). Youth violence, guns, and the illicit-drug industry. Journal of Criminal
Law and Criminology, 86, 10 – 36. Braga, A.A., Kennedy, D., Waring, E., & Morrison Piehl, A. (2001). Problem-oriented policing,
deterrence, and youth violence: An evaluation of Boston’s operation ceasefire. Journal of Research in Crime and Delinquency, 38, 195–225. Braga, A.A., & Winship, C. (2006). Partnership, accountability, and innovation: Clarifying
Boston's experience with pulling levers. In Police Innovation: Contrasting Perspectives, (Editors) D. Weisburd and A. Braga. Pp. 171-190. New York: Cambridge University Press.
Bursik, R.J., & Grasmick, H.G. (1993). Neighborhoods and crime: The dimensions of effective community control. New York, NY: Lexington Books.
Carr, P.J. (2003). The new parochialism: The implications of the Beltway case for arguments concerning informal social control. American Journal of Sociology, 108, 1249-91.
Carr, P.J. (2005). Clean streets: Controlling crime, maintaining order, and building community activism. New York, NY: NYU Press. Cook, T. D., & Campbell, D. T. (1979). Quasi-experimentation: Design and analysis for field
settings. Chicago: Rand McNally. Corsaro, N., Brunson, R.K., & McGarrell, E.F. (forthcoming). Problem-oriented policing and
open-air drug markets: Examining the Rockford pulling levers deterrence strategy. Crime and Delinquency (Online First October 14, 2009).
Corsaro, N., Brunson, R.K., & McGarrell, E.F. (2010). Evaluating a policing strategy intended to disrupt an illicit street-level drug market. Evaluation Review, 34: 513-548.
Currie, E. (1993). Reckoning: Drugs, the Cities, and the American Future. New York, NY: Hill & Wang. Dalton, E. (2002). Targeted crime reduction efforts in ten communities: lessons for the Project Safe Neighborhoods Initiative. U.S. Attorney’s Bulletin, 50, 16–25.
Eck, J. E., & Maguire, E.R. (2000). Have changes in policing reduced violent crime? An assessment of the evidence. In A. Blumstein & J. Wallman (Eds.), The crime drop in America (pp. 207-265). New York: Cambridge University Press.
Frabutt, J. M., Gathings. M. J., Jackson, D.T., & Buford, A.P. (2006). High Point Daniel Brooks initiative: Project description and preliminary impact analysis. University of North Carolina at Greensboro: Center for youth, family and community partnerships. Green, L. (1995). Cleaning up drug hot spots in Oakland, California: The displacement and
diffusion effect. Justice Quarterly, 12:737-54
58
Hipple, N.K., & McGarrell, E.F. (2009). Drug market intervention implementation guide and lessons learned. Paper prepared for Bureau of Justice Assistance.
Hipple, N. K., McGarrell, E. F., Bynum, T. S., Perez, H. A., Corsaro, N., & Garmo, M. (2009). Project Safe Neighborhoods Case Study #12. Bureau of Justice Assistance Drug Market Intervention Implementation Guide and Lessons Learned. East Lansing, MI: Michigan
State University, School of Criminal Justice. Hipple, N. K., Corsaro, N., & McGarrell, E.F. (2010). Project Safe Neighborhoods Case Study
#12. The high point drug market initiative: A process and impact assessment. East Lansing, MI: Michigan State University, School of Criminal Justice. Hunt, E.D., Sumner, M., Scholten, T.J., and Frabutt, J.M.( 2008). Using GIS to identify drug
markets and reduce drug-related violence. Pp. 395-413 in Geography and Drug Addiction, Editors Y. F. Thomas, D. Richardson, and I. Cheung. New York: Springer.
Jacobs, B. A., & Wright, R. (2006). Street justice: retaliation in the criminal underworld. New York: Cambridge University Press.
Jacques, S. & Wright, R. (2008). The relevance of peace to studies of drug market violence. Criminology, 46(1), 221 – 253.
Jacques, S. (2010). The necessary conditions for retaliation: Toward a theory of non-violent and violent forms in drug markets. Justice Quarterly, 27, 186-205. Kennedy D.M. (2009). Deterrence and crime prevention: Reconsidering the prospect of
sanction. New York, NY: Routledge. Kennedy, D.M. (1997). Pulling levers: Chronic offenders, high-crime settings, and a theory of
prevention. Valparaiso University Law Review, 31:449-84. Kennedy, D. M., & Wong, S. L. (2009). The High Point Drug Market Intervention Strategy. Washington, D.C.: U.S. Department of Justice, Office of Community Oriented
Policing Services. Kennedy, D. M., Braga, A., & Piehl, A. M. (1996). The (un)known universe: mapping gangs and
gang violence in Boston. Cambridge, Mass.: Program in Criminal Justice Policy and Management, John F. Kennedy School of Government, Harvard University. King, G. (1988). Statistical models for political science event outcomes: Bias in conventional procedures and evidence for the exponential poisson regression. American Journal of Political Science, 32, 838-63. Kubrin, C., & Weitzer, R. (2003). Retaliatory homicide: Concentrated disadvantage and neighborhood culture. Social Problems, 50: 157-180.
Kubrin, C., Messner, S., Deane, G., McGeever, K., & Stucky, T. (2010). Proactive policing and robbery rates across U.S. cities. Criminology, 48(1), 57 – 97. Long, J. S. (1997). Regression models for categorical and limited dependent variables.
Thousand Oaks, CA: Sage Press. Long, J. S., & Freese, J. (2003). Regression models for categorical dependent variables using
Stata. College Station, TX: Stata Corporation. Lowenkamp, C.T., Latessa, E.J., and Holsinger, A.M. (2006). The risk principle in action: What
have we learned from 13,676 offenders and 97 correctional programs? Crime and Delinquency, 52, 77-93.
MacDonald, J. M. (2002). The effectiveness of community policing in reducing urban violence. Crime & Delinquency, 48, 592 – 618. Mayer, R. (1972). Social planning and social change. Englewood Cliffs, NJ: Prentice Hall. Mazerolle, L., Soole, D., & Rombouts, S. (2007). Drug law enforcement: A review of the
59
evaluation literature. Police Quarterly, 10, 115-53. McCleary, R., & Hay, R. (1980). Applied Time Series Analysis for the Social Sciences. Beverly
Hills, CA: Sage. McGarrell, E.F., Hipple, N.K., Corsaro, N., Bynum, T.S., Perez, H., Zimmerman, C.R., & Garmo, M. (2009). Project Safe Neighborhoods – A National Program to Reduce Gun Crime: Final Project Report. Final Report submitted to the National Institute of Justice (Grant #2002-GP-CX-1003) (230 pp.). Nagin, D.S. (1998). Criminal deterrence research at the outset of the twenty-first century. In
Crime and Justice: A Review of Research, Editor M. Tonry. Pp. 1-42. Chicago, IL: University of Chicago Press.
Porter, C. (2009). ‘Armadillo’ plays well in Peoria but is panned by drug dealers. Wall Street Journal. August 17, p. A1.
Piehl, A., Cooper, S., Braga, A., & Kennedy, D. (2003). Testing for structural breaks in the evaluation programs. The Review of Econometrics and Statistics, 85, 550–558.
Rengert, G. F. (1996). The geography of illegal drugs . Boulder, Colo.: Westview Press. Roehl, J., D. Rosenbaum, S. Costello, J. Coldren, A. Schuck, L. Kunard, and D. Forde. (2008). “Paving the way for Project Safe Neighborhoods: SACSI in 10 U.S. Cities.” National
Institute of Justice Research in Brief. Rosenbaum, D.P., & Lurigio, A.J. (1994). An inside look at community policing reform: Definitions, organizational changes, and evaluation findings.” Crime and Delinquency, 40, 299-314.
Sampson, R. J., & Cohen, J. (1988). Deterrent effects of the police on crime: A replication and theoretical extension. Law & Society Review, 22, 163 – 189.
Sampson, R. & Groves, W. (1989). Community structure and crime: Testing social- disorganization theory. American Journal of Sociology, 94, 774 – 802.
Sampson, R., Raudenbush, S., and Earls, F. (1997). Neighborhoods and violent crime: A multilevel study of collective efficacy. Science, 277, 918–924. Sherman, L.W. (1990). Police crackdowns: Initial and residual deterrence. Crime and Justice: A
Review of Research, 12:1-48. Sherman, L.W. (1995). The police. In J. Wilson & J. Petersilia (Eds.), Crime (pp. ). San
Francisco, CA: Institute for Contemporary Studies. Skogan, Wesley G. and Susan M. Hartnett. 1997. Community Policing: Chicago Style. New
York, NY: Oxford University Press. Topalli, V., Wright, R., & Fornango, R. (2002). Drug dealers, robbery, and retaliation:
Vulnerability, deterrence, and the contagion of violence. The British Journal of Criminology, 42, 337 – 351. Warner, B. & Pierce, G. (1993). Reexamining social disorganization theory using calls to the
police as a measure of crime. Criminology, 31:493-518. Wilson, W. J. (1987). The Truly Disadvantaged. Chicago, IL: University of Chicago.
Worrall, J.L. (2006). Does targeting minor offenses reduce serious crime? A provisional, affirmative answer based on an analysis of county-level data. Police Quarterly, 9:47-72.
Wright, R. T., & Decker, S. H. (1997). Armed Robbers in action: stickups and street culture. Boston: Northeastern University Press.
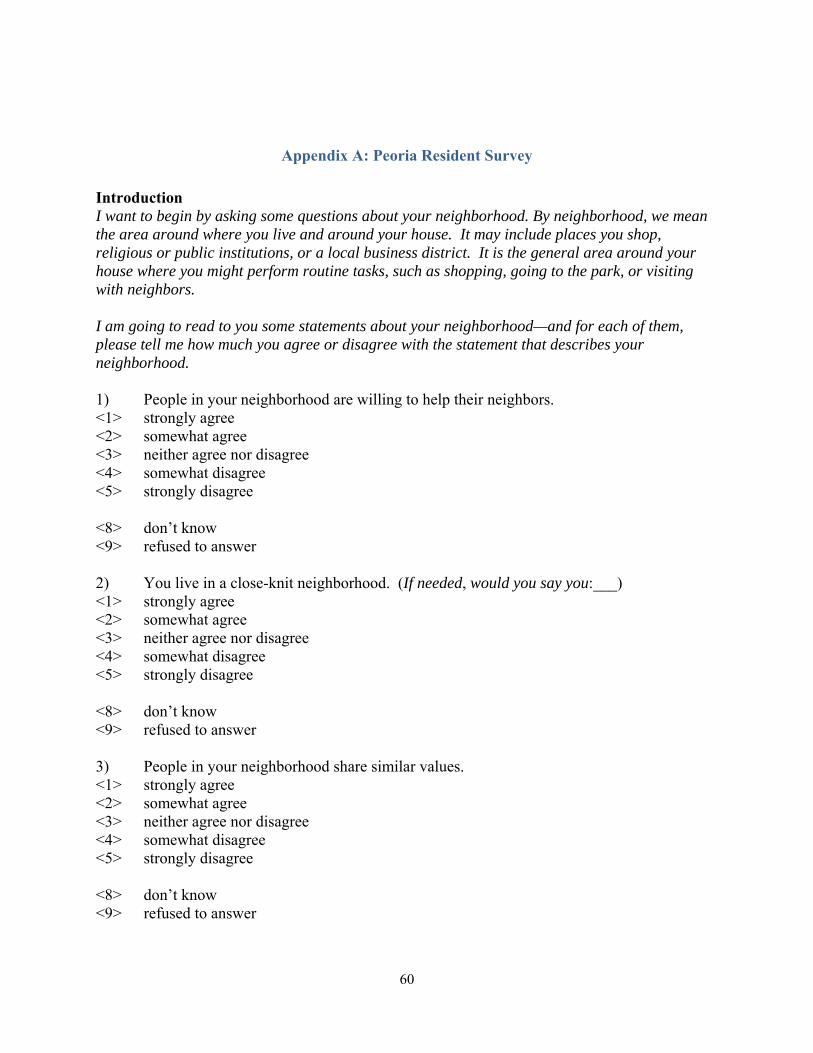
60
Appendix A: Peoria Resident Survey
Introduction I want to begin by asking some questions about your neighborhood. By neighborhood, we mean the area around where you live and around your house. It may include places you shop, religious or public institutions, or a local business district. It is the general area around your house where you might perform routine tasks, such as shopping, going to the park, or visiting with neighbors. I am going to read to you some statements about your neighborhood—and for each of them, please tell me how much you agree or disagree with the statement that describes your neighborhood.
1) People in your neighborhood are willing to help their neighbors. <1> strongly agree <2> somewhat agree <3> neither agree nor disagree <4> somewhat disagree <5> strongly disagree <8> don’t know <9> refused to answer 2) You live in a close-knit neighborhood. (If needed, would you say you:___) <1> strongly agree <2> somewhat agree <3> neither agree nor disagree <4> somewhat disagree <5> strongly disagree <8> don’t know <9> refused to answer 3) People in your neighborhood share similar values. <1> strongly agree <2> somewhat agree <3> neither agree nor disagree <4> somewhat disagree <5> strongly disagree <8> don’t know <9> refused to answer
61
4) People in your neighborhood can be trusted. <1> strongly agree <2> somewhat agree <3> neither agree nor disagree <4> somewhat disagree <5> strongly disagree <8> don’t know <9> refused to answer 5) People in your neighborhood are likely to call the police to report an accident. <1> strongly agree <2> somewhat agree <3> neither agree nor disagree <4> somewhat disagree <5> strongly disagree <8> don’t know <9> refused to answer 6) People in your neighborhood are likely to call the police to report a crime. <1> strongly agree <2> somewhat agree <3> neither agree nor disagree <4> somewhat disagree <5> strongly disagree <8> don’t know <9> refused to answer 7) People in your neighborhood are likely to call the police to report suspicious activity. <1> strongly agree <2> somewhat agree <3> neither agree nor disagree <4> somewhat disagree <5> strongly disagree <8> don’t know <9> refused to answer 8) People in your neighborhood are likely to provide information to police to help find a suspected criminal. <1> strongly agree <2> somewhat agree <3> neither agree nor disagree <4> somewhat disagree
62
<5> strongly disagree <8> don’t know <9> refused to answer Next, we are going to ask you about some issues that are problems in some neighborhoods. We are interested in asking you your perception of your neighborhood over the past two years, or for as long as you’ve lived in your current neighborhood (if it’s shorter than two years). 9) Illegal drug sales have been (would you say): <1> a major problem <3> a minor problem <5> not a problem <8> don’t know <9> refused to answer 10) People using drugs in public have been (would you say): <1> a major problem <3> a minor problem <5> not a problem <8> don’t know <9> refused to answer 11) People drinking in public have been (would you say): <1> a major problem <3> a minor problem <5> not a problem <8> don’t know <9> refused to answer 12) Noise at night has been (would you say): <1> a major problem <3> a minor problem <5> not a problem <8> don’t know <9> refused to answer 13) People violating local traffic laws have been (would you say): <1> a major problem <3> a minor problem <5> not a problem
63
<8> don’t know <9> refused to answer 14) Loitering (i.e., groups of people ‘hanging out’) have been (would you say): <1> a major problem <3> a minor problem <5> not a problem [if 5, skip question 15 and go to Question 16] <8> don’t know <9> refused to answer 15) Groups of people hanging out have mostly been: <1> mainly adults <3> mainly juveniles (say kids if probed) <5> a mixture of adults and juveniles <9> refused to answer I would next like to ask you some questions regarding certain behaviors in your neighborhood—and, I would like you to tell me the likelihood (ranging from very likely to very unlikely) of neighborhood behavior for each question. 16) How likely is it that a person selling drugs in your neighborhood will be arrested? Would you say: <1> very likely <2> likely <3> neither likely nor unlikely <4> unlikely <5> very unlikely <8> don’t know (includes not applicable; not a problem) <9> refused to answer 17) How likely is it that a person arrested for selling drugs in your neighborhood will be prosecuted and imprisoned? Would you say: <1> very likely <2> likely <3> neither likely nor unlikely <4> unlikely <5> very unlikely <8> don’t know (includes not applicable; not a problem) <9> refused to answer
64
18) How likely do you think it is that someone will assault you in your neighborhood? Would you say: <1> very likely <2> likely <3> neither likely nor unlikely <4> unlikely <5> very unlikely <8> don’t know <9> refused to answer 19) How likely do you think it is that someone will break into your house while you are home? Would you say: <1> very likely <2> likely <3> neither likely nor unlikely <4> unlikely <5> very unlikely <8> don’t know <9> refused to answer 20) How likely do you think it is that someone with a gun or a knife will try to rob you in your neighborhood? Would you say: <1> very likely <2> likely <3> neither likely nor unlikely <4> unlikely <5> very unlikely <8> don’t know <9> refused to answer Regarding the potential for being the victim of a crime, I’m going to ask you how concerned/fearful you are for each incident type: 21) How fearful are you that someone will assault you in your neighborhood? <1> very fearful <2> somewhat fearful <3> not at all fearful <8> don’t know <9> refused to answer 22) How fearful are you that someone to break into your house while you are home?
65
<1> very fearful <2> somewhat fearful <3> not at all fearful <8> don’t know <9> refused to answer 23) How fearful are you that someone who has a gun or knife will try to rob you in your neighborhood? Would you say: <1> very fearful <2> somewhat fearful <3> not at all fearful <8> don’t know <9> refused to answer Thinking about your neighborhood conditions today relative to six months ago, would you say: Changes in Neighborhood Dynamics 24) Illegal drug sales have been: <1> much less of a problem <2> somewhat less of a problem <3> about the same (note; code here if they say it was never a problem) <4> somewhat more of a problem <5> much more of a problem <8> don’t know (note: code 8 if didn’t live in neighborhood 6 months ago—n/a) <9> refused to answer 25) People using drugs in public have been: <1> much less of a problem <2> somewhat less of a problem <3> about the same (note; code here if they say it was never a problem) <4> somewhat more of a problem <5> much more of a problem <8> don’t know (note: code 8 if didn’t live in neighborhood 6 months ago—n/a) <9> refused to answer 26) People drinking in public have been: <1> much less of a problem <2> somewhat less of a problem <3> about the same (note; code here if they say it was never a problem) <4> somewhat more of a problem
66
<5> much more of a problem <8> don’t know (note: code 8 if didn’t live in neighborhood 6 months ago—n/a) <9> refused to answer 27) Noise at night has been: <1> much less of a problem <2> somewhat less of a problem <3> about the same (note; code here if they say it was never a problem) <4> somewhat more of a problem <5> much more of a problem <8> don’t know (note: code 8 if didn’t live in neighborhood 6 months ago—n/a) <9> refused to answer 28) People violating local traffic laws have been: <1> much less of a problem <2> somewhat less of a problem <3> about the same (note; code here if they say it was never a problem) <4> somewhat more of a problem <5> much more of a problem <8> don’t know (note: code 8 if didn’t live in neighborhood 6 months ago—n/a) <9> refused to answer 29) Loitering (i.e., groups of people ‘hanging out’) has been: <1> much less of a problem <2> somewhat less of a problem <3> about the same (note; code here if they say it was never a problem) <4> somewhat more of a problem <5> much more of a problem <8> don’t know (note: code 8 if didn’t live in neighborhood 6 months ago—n/a) <9> refused to answer 30) Crime in general has been: <1> much less of a problem <2> somewhat less of a problem <3> about the same (note; code here if they say it was never a problem) <4> somewhat more of a problem <5> much more of a problem <8> don’t know (note: code 8 if didn’t live in neighborhood 6 months ago—n/a) <9> refused to answer
67
Regarding social changes in your neighborhood, would you say: 31) Participation and involvement among local residents in neighborhood associations/organization/community groups has: <1> improved over the past six months <2> stayed about the same over the past six months <3> decreased over the past six months <8> don’t know (note: code 8 if didn’t live in neighborhood 6 months ago—n/a) <9> refused to answer 32) Neighbors taking action to solve local problems has: <1> improved over the past six months <2> stayed about the same over the past six months <3> decreased over the past six months <8> don’t know (note: code 8 if didn’t live in neighborhood 6 months ago—n/a) <9> refused to answer DMI We are next going to ask you some questions about a local policing strategy that was implemented in Peoria in late 2009. 33) Have you heard or seen anything about the Peoria Drug Market Intervention – that started last November 2009? It has also been called the “DMI strategy”. <1> yes <2> no <3> maybe; kind of; might have <9> refused to answer
In November 2009, the Peoria Police Department engaged in a Drug Market Intervention (DMI) that resulted in the arrest and prosecution of suspected drug dealers who had violent criminal histories. In addition, PPD held a notification meeting in the community where drug dealing occurred to warn non-violent dealers that continued drug offending would result in harsh criminal justice sentences; conversely, non-violent dealers who quit selling drugs were given access to social service opportunities (e.g., drug-treatment and counseling). Regarding your perceptions of that program:
34) Now, would you say that you had heard or seen anything about the Peoria Drug Market Intervention—or DMI—before our survey? <1> yes <2> maybe; may have; sort of <3> no (skip to question 38)
68
<9> refused to answer 35) Before the description I just read to you, how familiar would you say you were with the Peoria Drug Market Intervention, or DMI? <1> very familiar with it <2> somewhat familiar with it <3> not familiar with it 36) How did you first become aware of the Peoria DMI program? <1> formal community meeting <2> personal communication with neighbors and/or friends <3> local media (e.g., radio, television, newspaper) <4> other <5> none of the above/was never made aware of Peoria DMI program (until now) <8> don’t know <9> refused to answer 37) Regarding the overall impact of the DMI, do you believe? <1> it made a major positive difference <2> it made a minor positive difference <3> it made no impact one way or the other <4> it made a minor negative difference <5> it made a major negative difference <8> don’t know <9> refused to answer We next will ask you about your perception of Peoria police officers (in general): 38) Police in your neighborhood treat people with dignity and respect. <1> strongly agree <2> somewhat agree <3> neither agree nor disagree <4> somewhat disagree <5> strongly disagree <8> don’t know <9> refused to answer 39) The police in your neighborhood treat people fairly. <1> strongly agree <2> somewhat agree <3> neither agree nor disagree <4> somewhat disagree <5> strongly disagree
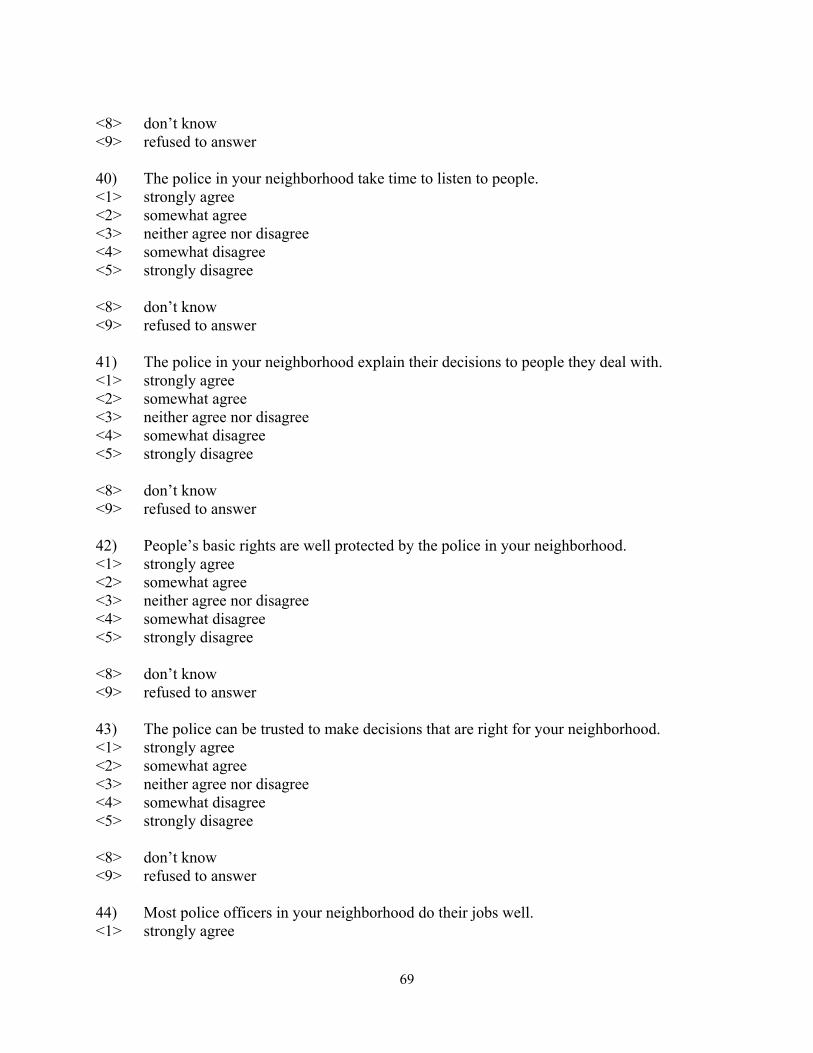
69
<8> don’t know <9> refused to answer 40) The police in your neighborhood take time to listen to people. <1> strongly agree <2> somewhat agree <3> neither agree nor disagree <4> somewhat disagree <5> strongly disagree <8> don’t know <9> refused to answer 41) The police in your neighborhood explain their decisions to people they deal with. <1> strongly agree <2> somewhat agree <3> neither agree nor disagree <4> somewhat disagree <5> strongly disagree <8> don’t know <9> refused to answer 42) People’s basic rights are well protected by the police in your neighborhood. <1> strongly agree <2> somewhat agree <3> neither agree nor disagree <4> somewhat disagree <5> strongly disagree <8> don’t know <9> refused to answer 43) The police can be trusted to make decisions that are right for your neighborhood. <1> strongly agree <2> somewhat agree <3> neither agree nor disagree <4> somewhat disagree <5> strongly disagree <8> don’t know <9> refused to answer 44) Most police officers in your neighborhood do their jobs well. <1> strongly agree
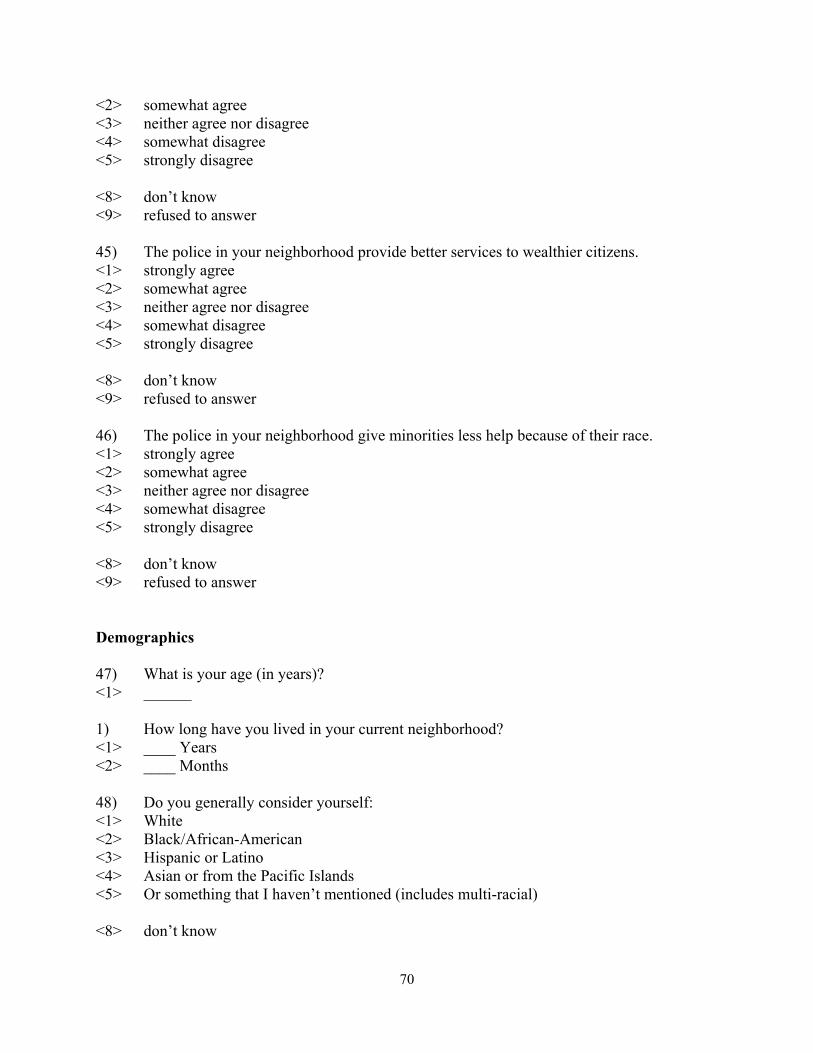
70
<2> somewhat agree <3> neither agree nor disagree <4> somewhat disagree <5> strongly disagree <8> don’t know <9> refused to answer 45) The police in your neighborhood provide better services to wealthier citizens. <1> strongly agree <2> somewhat agree <3> neither agree nor disagree <4> somewhat disagree <5> strongly disagree <8> don’t know <9> refused to answer 46) The police in your neighborhood give minorities less help because of their race. <1> strongly agree <2> somewhat agree <3> neither agree nor disagree <4> somewhat disagree <5> strongly disagree <8> don’t know <9> refused to answer Demographics 47) What is your age (in years)? <1> ______ 1) How long have you lived in your current neighborhood? <1> ____ Years <2> ____ Months 48) Do you generally consider yourself: <1> White <2> Black/African-American <3> Hispanic or Latino <4> Asian or from the Pacific Islands <5> Or something that I haven’t mentioned (includes multi-racial) <8> don’t know
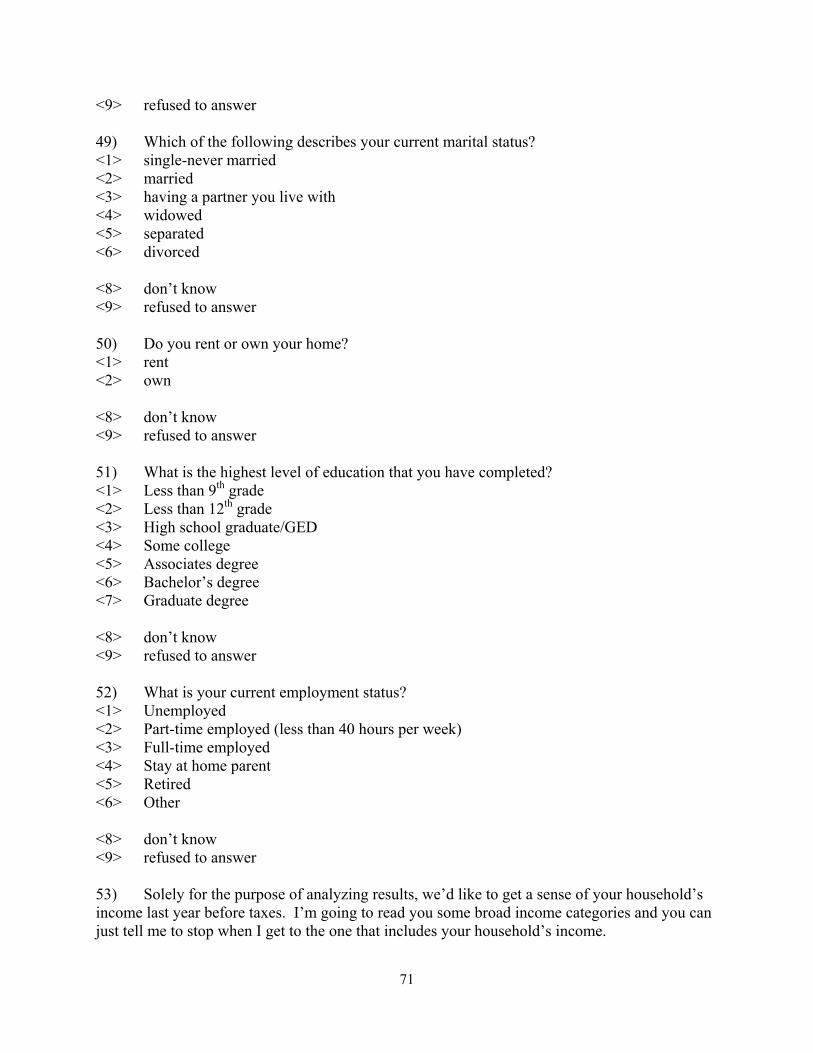
71
<9> refused to answer 49) Which of the following describes your current marital status? <1> single-never married <2> married <3> having a partner you live with <4> widowed <5> separated <6> divorced <8> don’t know <9> refused to answer 50) Do you rent or own your home? <1> rent <2> own <8> don’t know <9> refused to answer 51) What is the highest level of education that you have completed? <1> Less than 9th grade <2> Less than 12th grade <3> High school graduate/GED <4> Some college <5> Associates degree <6> Bachelor’s degree <7> Graduate degree <8> don’t know <9> refused to answer 52) What is your current employment status? <1> Unemployed <2> Part-time employed (less than 40 hours per week) <3> Full-time employed <4> Stay at home parent <5> Retired <6> Other <8> don’t know <9> refused to answer 53) Solely for the purpose of analyzing results, we’d like to get a sense of your household’s income last year before taxes. I’m going to read you some broad income categories and you can just tell me to stop when I get to the one that includes your household’s income.
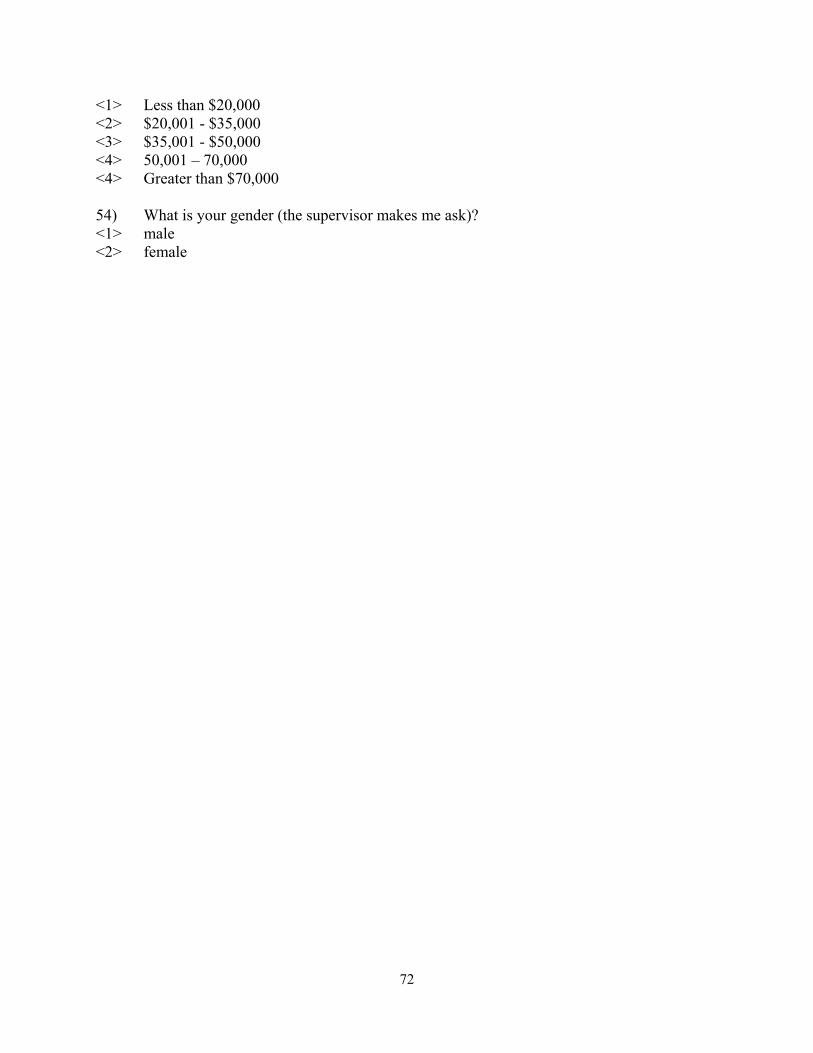
72
<1> Less than $20,000 <2> $20,001 - $35,000 <3> $35,001 - $50,000 <4> 50,001 – 70,000 <4> Greater than $70,000 54) What is your gender (the supervisor makes me ask)? <1> male <2> female