Embed Size (px)
Citation preview
1
Introduction | Exploration | Transport | Air pollution • Greenhouse gas emissions • Traffic noise • Physical (in)activity • Road safety | Context | Summary
Road transport facts and figuresHow healthy and environmentally friendly is our transport today?
2
Introduction | Exploration | Transport | Air pollution • Greenhouse gas emissions • Traffic noise • Physical (in)activity • Road safety | Context | Summary
Contents Introduction 03
Exploration 04
Transport 08
Air pollution 16
Greenhouse gas emissions 22
Traffic noise 27
Physical (in)activity 33
Road safety 40
Context 46
Summary 55
Acknowledgements 57
References 58
Our current system of tran sport and mobility is not sustainable. Traffic is the cause of several environ-mental, economic, social and health challenges. In this eMagazine we describe the current impacts of road transport based on the best knowledge available.
This eMagazine has been developed under the framework of the Transport, Health and Environment Pan-European Programme (THE-PEP), a programme of the United Nations Economic Commission for Europe (UNECE) and the WHO Regional Office for Europe with a focus on road transport, serving and bringing together 56 countries in the UNECE and WHO European region. The ambition of THE PEP is to acceler-ate the transformation of the transport sector in the decade 2020–2030 to a cleaner and healthier system for our transport and mobility by bringing together knowledge from different domains (transport, health and environment), working on integrated
policy-making, joint programming and the exchange of practices. The idea is that this eMagazine serves as a joint point of reference for further work in 2020–2030.
The eMagazine describes what we know about transport-related environ-mental and health effects in the region today. It shows where progress has been made and where further work needs to be done. Our story starts with some reflections on the main messages and challenges, based on interviews with Francesca Racioppi (WHO), Robert Thaler (Chair of THE PEP) and Khatuna Gogaladze (former Minister of Environment, Georgia).
The actual facts and figures start with a chapter with key facts about transport patterns and a description of some promising strategies. It shows that transport plays an essential role in our societies and economies. Transport provides access to jobs, education, services, amenities and leisure, while contri buting to economic growth, employment and trade. At the same time, it has an impact on the environ-ment and human health.
Although some promising trends have been observed, traffic-related air pollu tion, noise and road traffic injuries still contribute significantly to the disease burden in the European region, with a disproportio nate disease burden in certain regions and less affluent groups of society. Motorized road transport is also an important source of greenhouse gas emissions. Finally, car dependency, poor use of urban space and lack of safety for cyclists and pedestrians contribute to physical inactivity.
The eMagazine continues with some contextual descriptions to illuminate the differences between countries. Learning from experiences and putting tailor-made policy instruments in place, means also understanding the context. Differences in economics (gross domes - tic product (GDP)), income, population density, geogra phical conditions and land use are key factors to take into account, in order to build a programme for cooperation and best-fitted approach - es and solutions. Changes in mobility due to COVID-19 are also discussed.
We conclude with a summary of the key messages, which can serve as input for
further work in the decade to come on transforming the transport sector.
Data approachMultiple data resources have been used. For example, on a global scale, data have been used from the International Monetary Fund (IMF), World Bank, UNECE, International Transport Forum (ITF); and on a pan- European level, from the European Environmental Agency (EEA), European Free Trade Association (EFTA) and WHO. Priority has been given to the best available data for the specific themes. Due to the impact of the COVID-19 pandemic, data have been used for the year 2019 or most recent year available.
To develop the key messages, topic-specific meetings were organized in 2020 with experts from WHO, EEA, UNECE and the National Institute for Public Health and the Environment of the Netherlands (RIVM). Where needed, an additional evaluation of the litera-ture was carried out. Contributions to this eMagazine have been reviewed by the experts and the Steering Group of THE PEP, looking at the matter in a more integrated way.
Introduction
3
Introduction | Exploration | Transport | Air pollution • Greenhouse gas emissions • Traffic noise • Physical (in)activity • Road safety | Context | Summary

Translating solid science into a passion for change
This eMagazine is about answering the question: How healthyand environmentally friendly is our transport today? It takes us on a journey through facts and figures about the impacts of road transport, different methodologies, strategies and practices for change. Before we dive into the data, let's talk to three experts who are closely involved in the field of THE PEP. Their vision on the issue underlines its importance and practical applicability. The facts and figures are not only about quantifying research and development, but also about smart and widely useful routes for improvement. Francesca Racioppi, head of the WHO European Centre for Environment and Health says: “As a scientist, I have been working on the mobility issue for a quarter of a century. In that role, you always look for evidence. However, the world does not change through science alone, but through ambition, brought with passion. That is what we now advocate with THE PEP: we need to translate solid science into the passion for change”.
Source of a wide variety of challengesMobility and transport play an essential role in our societies and economies. The sector provides access to jobs, education, services, amenities and leisure, while contributing to economic growth, employment and trade. At the same time, it has a deep and growing impact on the environment and human health. Despite the technological, political and social progress made, the current transport system and mobility patterns remain unsustainable. Traffic remains the source of a wide range of challenges at all levels of government.
Everybody is an expertWithin THE PEP, facts from research and practice play a key role. They support the efforts of Member States when designing policies in the field of transport, health and environment. These are complex, interrelated and dynamic themes. This makes it difficult for policy-makers to decide where to proceed and how to accelerate sustainable change. From a scientific point of view, we actually know quite well where and how we could make transport healthier, safer and more environmentally friendly.
“But”, says Robert Thaler, Chair of the Steering Committee of THE PEP, “when it comes to transport, we are actually dealing with more than 900 million stakeholders in the UNECE and WHO European region. All residents feel like experts: as road users or passengers of public transport, of course, but also as a citizens who may experience negative impacts – or both at the same time. Transport has an impact on everyone, which makes the challenge of imple-menting solutions for transport issues extremely difficult and a hot issue for politics. There is a gap between the scientific evidence that we have and what is actually perceived. Many people recognize noise as the biggest prob-lem, because they experience the direct relationship between traffic and noise. But it is getting more complicated to address climate change and related heat waves as a consequence of our transport system. And that makes it difficult to gain public support for measures to combat emissions”.
An uncomfortable truthLooking at the facts, we see that there is work to be done. When it comes to air pollution from road traffic, the impacts of air pollution by particulate
Introduction | Exploration | Transport | Air pollution • Greenhouse gas emissions • Traffic noise • Physical (in)activity • Road safety | Context | Summary
4
matter and nitrogen dioxide (NO2) – typically associated with vehicle exhaust emissions – have decreased due to policy measures like setting improved fuel quality- and emission standards. Yet, for the whole of the WHO European Region, WHO estima-ted 509 000 premature deaths in 2016. Road accidents contribute to more than 110 000 deaths every year in the region. On average, this means one person is killed every five minutes. At the same time, millions more are seriously injured in road accidents. In addition, road transport is responsible for about a quarter of energy-related greenhouse gas emissions, thus contributing to climate change and increased global temperature. So what prevents us from taking more appropriate and effective actions?
Facts and assumptionsKhatuna Gogaladze has worked for various international organizations in different capacities as well as for the Ministry of Environment and Natural Resources Protection of Georgia – serving as minister in 2012–2014. As a minister, she has experienced that it is quite a struggle to rank facts before assumptions in the area of traffic and
transport. About her time as minister, she says: “We were working on an ambitious strategic document and action plan to reduce air pollution from transport. In the end, the plan was drawn up, but I remember how complicated it was to persuade economic sector ministries to support it. They argued that proposed mea-sures, such as replacing old cars, would harm poor people and may affect negatively the self-employed, for example taxi drivers. It was difficult to justify that poor environmental conditions increase inequality, and low income people suffer more from unhealthy air: they live in densely populated parts of the city with limited green spaces and they do not have summer houses where they can let their children enjoy the outdoors”.
Data availability and qualityTo allow for effective monitoring of the impacts of transport and sound decision-making, harmonized data on transport, environment and health is crucial. For all the themes addressed in this eMagazine, data is available at all levels of government, at our institutions and in the private sector. However, there are also significant
gaps in data availability and quality, which are important for a better understanding and comparison of data between countries. Thus, there is plenty of room for improvement here.
Setting the scene for a different futureFrancesca Racioppi recognizes what Gogaladze and Thaler are saying: “For the most part, there is a common understanding of what the right things are to do, but it remains very difficult to actually do them. But things have changed in recent years. In urban regeneration, more and more cities are considering cycling and walking as modes of transport, and quality of life is being taken seriously. Some cities have even made a real U-turn: Utrecht in the Netherlands is an important example. There they had the courage to transform an inner-city motorway into a waterway and city park, giving back to people public space that can be used to be more physically active, to enjoy the health benefits of blue and green spaces and to improve the quality of life in the city. This is the challenge: to make people a bit more courageous and to get policy-makers to look at the long-term. A growing
number of city dwellers are positive about change and want to embrace it”.
New mobility from Lisbon to MoscowSo there is movement and it extends everywhere, Thaler notes. “European cities look at each other, find interest-ing examples for a different approach and set to work. As a result, you see more and more cities with, for example, a bicycle sharing plan. In Rome and Moscow you will find bicycle sharing these days”. At the same time, it is also clear that there is still a long way to go. Cars remain by far the main means of transport if we look at the total of kilometres travelled. Khatuna Gogaladze says: “A lot has to do with behaviour and habit. A recent study shows that 20% of Georgians prefer to take the car, even for distances shorter than 1.5 km”. This, she believes, is partly due to the lack of infrastructure. “Take our capital, Tbilisi, where about 1.3 million of Georgia's 3.7 million inhabitants live. It is fully equipped for car traffic. A cycle path has been built in a few streets, but what are you supposed to do after that 1 km? Hang your bike around your neck? ”
5
Introduction | Exploration | Transport | Air pollution • Greenhouse gas emissions • Traffic noise • Physical (in)activity • Road safety | Context | Summary

Taking stock of the lessons of the crisisAccording to Gogaladze, the assump-tion has always been that Tblisi's hilly terrain is not suited very well for cycling. However, this assumption was challenged last spring, when COVID-19 responses brought car traffic and public transport to a standstill. “It was very surprising how many people then turned out to have a bicycle and used it to the full, now that it was safe. With a better infrastructure and, for example, a strong campaign to emphasize the economic, health and environmental benefits of cycling and active mobility in general, I see room for improve-ment. There is a lot of work to be done if we want to encourage people to switch to public transport or bicycles more often. Public transport, for example, must be comfortable, convenient and have good connectivity to make it competitive with private cars. Otherwise it will be difficult to achieve behavioural change”.
Tailor-made solutions are neededRobert Thaler also points out the difference between the cities and the regions. “In the cities you see the movement that the position of the car
is no longer sacred and multimodality is developing. For the young genera-tion digital access by smartphone is much more important than having a car. Sharing is the key word here and sharing systems are growing. Nevertheless, beyond that, there is often excessive car use in the outskirts and rural areas; here in Austria it is the most peripheral areas that have the highest degree of car ownership, because of poor public transport. Take, for example, the city of Vienna, which has a perfect balanced modal split with more than 70% of Viennese people using walking, cycling and public transport. However, if you then look at the commuter traffic by people from outside Vienna, it is almost the opposite and is dominated by the car. We really have to work on a fair balance between regions and cities when it comes to environmentally sound mobility choices”.
One life to liveThe facts and figures show that investing in healthier and safer mobility pays off in many ways. The benefits of a shift towards more active mobility and public transport arise mainly from increased life expectancy,
increased productivity and lower health-care costs related to non-communicable diseases. This shows, for example, a strong case for investing in promoting walking and cycling in cities and beyond. Francesca Racioppi also points to another, less quantifiable, potential yield: “We all have one life to live. Who is happy to spend hours in traffic jams every day or to breathe bad air? It is not without reason that more and more young people no longer have owning a car as a priority – something that was unthinkable for a long time. In that respect, we are facing a great opportunity in that things can be done differently and better”.
Practical knowledge put to useThat there is a different and better approach possible can be proven with data. Robert Thaler: “For example, I consider the development of the Health Economic Assessment Tool (HEAT) for walking and for cycling a major success of THE PEP. In that project, an inter-national coalition of scientists made it possible to provide hard evidence of the health and economic benefits of walking and cycling. That has now really been made measurable”.
In Austria, where Thaler is Head of the Division of Active Mobility and Mobility Management in the Federal Ministry of Climate Action, Environment, Energy, Mobility, Innovation and Technology, the instrument is used to shape cycling policy. Thaler: “THE PEP and its partnerships are enabling the sharing of an enormous amount of practical knowledge of clean and active mobility that can be used by Member States in their strategic initiatives and concrete work”.Multidisciplinary approachRacioppi, Gogaladze and Thaler agree on the important contribution THE PEP can make to the transformation of transport. Transforming the sector requires a multidisciplinary approach. Therefore, collaboration of decision-makers and experts in transport, environment, health, spatial planning and economy is crucial to design transport-related policies that deliver benefits to environment, health, well-being and climate simultaneously.
Moreover, international, cross-sectoral and multi-level (countries, regions and cities) cooperation is needed to drive the change towards sustainable, environmentally friendly and healthy
6
Introduction | Exploration | Transport | Air pollution • Greenhouse gas emissions • Traffic noise • Physical (in)activity • Road safety | Context | Summary

transport. Robert Thaler: “This inter-sectoral approach is very important. There is too much silo thinking. THE PEP brings together sectors that often oppose each other. That is also what we need: we need the full picture for a holistic approach and not just the classic technological perspective. Technology always has a drawback. Take, for instance, electric cars. This does not solve the space problems in public space. It's about the
combination of mobility management, pricing, technology and user perspective”.
Inspire and raise awarenessFrancesca Racioppi sees THE PEP as a joint platform for inspiration and change. “THE PEP brings together a wide community of people, which normally would not meet each other and are eager to learn from each other and to test new solutions. For example,
we have organized many workshops and trainings with numerous countries, where participants have experienced that much more is possible than initially assumed. By trial and error, you can actually see that things can be done differently. That facilitates and promotes change”.
Khatuna Gogaladze also sees the power of THE PEP in experimenting and bringing different sectors together. “Integrating transport, health, environ-mental and quality of life objectives into urban or any other development policies is the way forward. THE PEP gives the opportunity to countries to learn from each other. It produces clear recommendations and equips coun-tries with useful tools. It is up to us how we use these opportunities and whether we follow the path paved by other countries”. Thaler adds: “That is indeed attractive about THE PEP. We work as partners on real products and that is a lot more pleasant than just talking and producing paper. Countries that are actively involved in THE PEP really get something in return.”
7
Introduction | Exploration | Transport | Air pollution • Greenhouse gas emissions • Traffic noise • Physical (in)activity • Road safety | Context | Summary

Transport is about moving people and goods in the most effective and efficient way. Transport is not a purpose in itself; it is in support of other activities like working, socializing or studying and, as such, is an integrated part of our daily life. For many transport professionals, accessibility and tackling congestion are the main challenges, giving priority to the work on appropriate infrastructure investments, with efforts on capacity, reliability and efficiency. Regulatory and policy frameworks are guiding vehicle emissions and use of space and safety. Moreover, transport professionals work on the demand and supply for transport, with factors like travel time, convenience and pricing. Nowadays, there is a growing support for multimodality and safe and attractive spaces for walking and cycling.
Transport and mobility
Introduction | Exploration | Transport | Air pollution • Greenhouse gas emissions • Traffic noise • Physical (in)activity • Road safety | Context | Summary
8
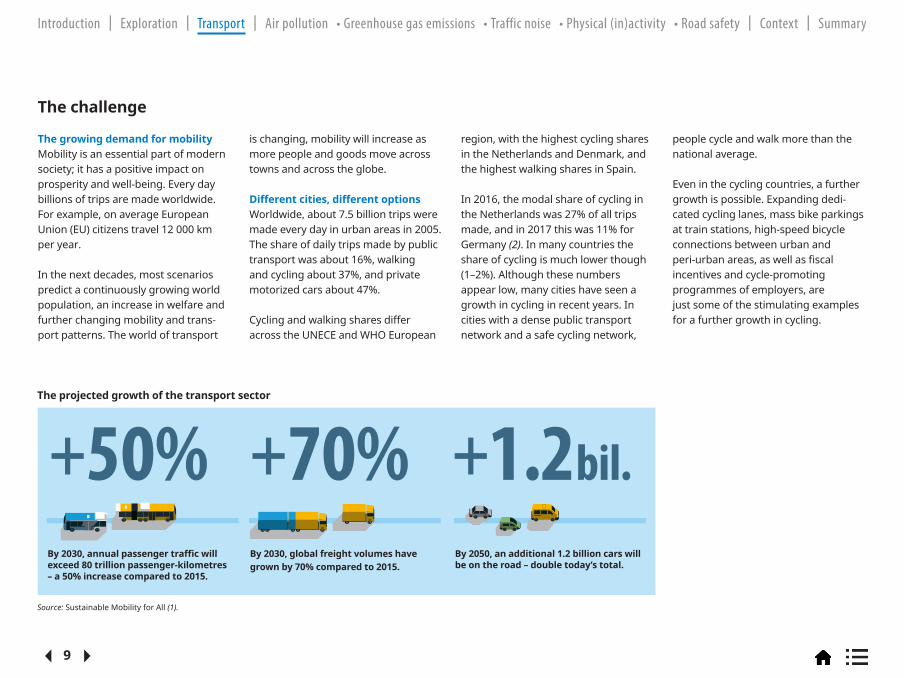
The growing demand for mobilityMobility is an essential part of modern society; it has a positive impact on prosperity and well-being. Every day billions of trips are made worldwide. For example, on average European Union (EU) citizens travel 12 000 km per year.
In the next decades, most scenarios predict a continuously growing world population, an increase in welfare and further changing mobility and trans-port patterns. The world of transport
is changing, mobility will increase as more people and goods move across towns and across the globe.
Different cities, different optionsWorldwide, about 7.5 billion trips were made every day in urban areas in 2005. The share of daily trips made by public transport was about 16%, walking and cycling about 37%, and private motorized cars about 47%.
Cycling and walking shares differ across the UNECE and WHO European
region, with the highest cycling shares in the Netherlands and Denmark, and the highest walking shares in Spain. In 2016, the modal share of cycling in the Netherlands was 27% of all trips made, and in 2017 this was 11% for Germany (2). In many countries the share of cycling is much lower though (1–2%). Although these numbers appear low, many cities have seen a growth in cycling in recent years. In cities with a dense public transport network and a safe cycling network,
people cycle and walk more than the national average.
Even in the cycling countries, a further growth is possible. Expanding dedi-cated cycling lanes, mass bike parkings at train stations, high-speed bicycle connections between urban and peri-urban areas, as well as fiscal incentives and cycle-promoting programmes of employers, are just some of the stimulating examples for a further growth in cycling.
Source: Sustainable Mobility for All (1).
+50% +70% +1.2bil.By 2030, annual passenger traffic will exceed 80 trillion passenger-kilometres – a 50% increase compared to 2015.
By 2030, global freight volumes have grown by 70% compared to 2015.
By 2050, an additional 1.2 billion cars will be on the road – double today’s total.
9
Introduction | Exploration | Transport | Air pollution • Greenhouse gas emissions • Traffic noise • Physical (in)activity • Road safety | Context | Summary
The challenge
The projected growth of the transport sector

Evolving challenges for transport professionalsWhat is the best way to travel between A and B? That is a key question for many transport planners, researchers and policy-makers. Their work is to understand mobility, from both a traveller (travel time, distance travelled, reliability, comfort and experience) and systemsperspective (accessibility, investments and land use) at accept-able costs and benefits for society.
Mobility policy used to be based on a “predict and provide” approach, which identified bottlenecks, set priorities and, as far as possible, expanded road and rail capacity. In this context, modes like public transport mainly had a social function. When interests in the development of land use began to play a part, this approach came under increasing pressure. As a result, the perception changed; the growing mobility no longer had to be merely facilitated. People started to think of how to shape mobility to improve accessibility while reducing the costs and negative impacts. At that time, in many countries, the realization of a modal shift from car to public transport became one of the leading policy objectives.
It should be noted that the “predict and provide” approach is still widely used in a number of countries at the state level and has not yet become “a thing of the past”. In some cases, or in some countries (e.g. when the road infra-structure is not sufficiently developed), this approach may be justified.
In current policies, the emphasis is shifting again. Nowadays, the approach is often to provide multimodal acces-sibility and to limit the negative impacts of car mobility, by facilitating high quality alternatives to mobility by car.
This approach should encompass a key role for more conscious consumer choice regarding modes of travel. For this, the mobility system must be coherent and robust, and all the modalities must be sufficiently solid to form convenient, reliable and affordable alternatives. This approach can be supported by mobility manage-ment measures like teleworking, rush hour avoidance and an increasing role for digital services (Mobility as a Service). Finally, an increasingly important role has been set aside for spatial planning in the limitation of
the further growth of unsustainable forms of mobility. Spatial planning that favours a dense public transport network, safe and attractive cycling and walking paths and combines functions (housing, working, services) contributes to sustainable mobility.
Compared space-time consumption Cars and roads take up a lot of the public space in cities: a car occupies 2.5 times more space than a cyclist does, 5 times more than a pedes - trian and 10 times more than a user of public transport at peak hours.
Pedestrian Cyclist Two-wheeled motor vehicles
Car
m2-h/vehicle km
Occupation rate
m2-h/traveller km
0.3
0.3
1
0.6
0.6
1
1.7
1.6
1.05
1.8
1.4
1.3
7
0.3
17
7
0.15
50
10
0.3
23
10
0.15
70
2
5 5
1.40.5
1.40.5
1
Bus (12m)
Peak hour Peak hour
Articulated bus (18m)
Note: The traffic demand for space-time of circulation is expressed in square meters per hour (m2-h).
Source: International Transport Forum (3).
Space differences compared to pedestrian
10
Introduction | Exploration | Transport | Air pollution • Greenhouse gas emissions • Traffic noise • Physical (in)activity • Road safety | Context | Summary

Share of passenger road vehicle transport in % of the total km travelled for the EU-28
Share of passenger road vehicle transport in % of the total km travelled for the UNECE region
10.4%7.1%82.5%
83.3% 8.7%8.0%
2000
2018
2000
2018
Motor coaches, trolleybuses and busesRailways Cars
93.0%
89.0% 8.0%
5.0%
2.3%
1.6%
Passenger transport The car remains the main mode of transport across the wider UNECE and WHO European region. UNECE data shows that the share of passenger transport by car, expressed as the percentage of the total passenger-kilometres travelled in that year, decreased slightly between 2000 and 2018 in the region as a whole, and increased slightly in that same period in the EU-28 Member States. The figures show that car use remained dominant throughout the period. In contrast, for example in a country like Germany, a quarter of all trips are made on foot. However, since the distance travelled on foot is limited, the contribution to total kilometres travelled is limited (4).
11
Introduction | Exploration | Transport | Air pollution • Greenhouse gas emissions • Traffic noise • Physical (in)activity • Road safety | Context | Summary
Modal split in passenger- and freight transport
Note: Differences have been rounded because of aggregated data from different sources.
Source: UNECE (5).
Source: Based on EEA (4).

Mobility in urban areas: different modal splits in cities and in their larger urban zones in 2018
12
Introduction | Exploration | Transport | Air pollution • Greenhouse gas emissions • Traffic noise • Physical (in)activity • Road safety | Context | Summary
Source: Based on EMTA (6).
Amsterdam
Barcelona
Berlin
Madrid
London
Copenhagen
Warsaw
Helsinki
Oslo
% cycling/walking
% public transport
% rest motorized modes
58%49%
55%44%
42%37%
34%27%
35%34%
28%28%
63%41%
21%25%
44%38% 22% 39%
31% 25%
40% 35%47% 32%
10% 49%13% 24%
37%37%
36%36%
25% 40%34% 31%
28% 45%36% 31%
19% 44%25% 33%
18% 36%30% 15%
13% 34%16% 26%
In the city centre
In the broader urban area
Modal share of journeys
Mobility in urban areasThe figure shows the modal split in 10 different urban areas in number of trips made. It shows the variety of modal shares between different cities and shows differences within cities. Most walking and cycling took place in the inner city, and a larger share of car mobility was in the broader urban area. It also shows that in cities with a higher share in bike-ridership, the use of public transport has lower shares of trips made.

Modal split freightTotal land freight transport by road, rail and waterways has grown steadily, as a result of economic growth and global trade in most countries of the region with a short dip caused by the 2008 financial crisis. In the EU, for example, the total road freight volumes in 2017 were around one quarter higher than in 2000. The amount of freight transported by rail in the EU-28 has grown during recent years, but is still below the peak recorded in 2007. In 2017, rail freight transport demand increased by 2.2% compared with the previous year.
The amount of freight transported by inland waterways was stable in the EU-28.
Source: EEA (4).
Road EU-28
RailInland waterwaysRoad
Rail EU-28
0
500
1000
1500
2000
2500
‘00‘95 ‘01 ‘02 ‘03 ‘04 ‘05 ‘06 ‘07 ‘08 ‘09 ‘10 ‘11 ‘12 ‘13 ‘14 ‘15 ‘16 ‘17
Modal split between freight transported by road and railin billion tonne-kilometres (tkm)
Freight transport volume by road and modal split within the EU (%)
Bill
ion
tonn
e-ki
lom
etre
s (t
km)
Shar
e of
fre
ight
tra
nspo
rted
(%)
0
20
40
60
80
100
Modal split freight
13
Introduction | Exploration | Transport | Air pollution • Greenhouse gas emissions • Traffic noise • Physical (in)activity • Road safety | Context | Summary

Safe, healthy and affordable solutions are available – just not widely imple-mented. Moreover, there is a rich range of resources on sustainable mobility and transport. We have selected a few key approaches, strategic concepts and trends for the transformation of the sector, to inspire those who would like to work on the alternatives. We see changes in mobility management approaches, other transport options in cities (last mile options) and an increasing attention on cycling and
walking, related to new concepts for urban development.
The “Avoid-Shift-Improve” strategy In the 1990s, the “Avoid-Shift-Improve” strategy was introduced by the German government in order to provide a concept to deliver on sustainable transport goals (7). To “avoid” is about reducing the length and the number of trips, and making it easier to avoid travel, like working from home.
To “shift” is to move towards environ-mentally friendly modes of transport, which is about walking, cycling or public transport. Finally, to “improve”, is about occupancy rate, about vehicle and energy efficiency and about data sources on travel information.
The first and the last mileMaking a transport system efficient means bringing together people or goods as early as possible in their journey (8). Transporting them sepa-rately implies a loss of efficiency and often increases negative environmental impacts. However, people or goods rarely travel only between two mass transport hubs or stops. That is where studying the first and last mile options come in. Such options allow people or goods to travel between their starting point (origin) and the start hub and/ or between the end hub and their destination. At the same time, they make the transport system as efficient as possible from a financial, resource use and environmental point of view, while meeting any convenience requirements. The EEA (9) has conducted some excellent work on understanding this concept better.
Their report on first/last/only mile options for passenger and freight transport, describes urban mobility and policy contexts and presents the current state of knowledge. This is a good reference for all professionals working on, for example, parking and cycling policies, environmental zones and the role of micro-mobility in cities.
Building back better with a “15-minute city” In a “15-minute city”, everyone is able to meet most, if not all, of their needs within a short walk or bike ride from their home (9). This helps to reduce unnecessary travel across cities, provides more public space, injects life into local high streets, strengthens the sense of community, promotes health and well-being, boosts resilience to ill-health and climate shocks, and improves cities’ sustainability and liveability.
Source: Based on Deutsche Gesellschaft für Internationale Zusammenarbeit (GIZ) (7).
Avoid-Shift-Improve approach
Shift/MaintainAvoid/Reduce Improve
Reduce or avoid the need
to travel
Shift to maintain share of more
environmentally friendly modes
Improve the energy of transport
modes and vehicle technology
System efficiency
Tripefficiency
Vehicleefficiency
14
Introduction | Exploration | Transport | Air pollution • Greenhouse gas emissions • Traffic noise • Physical (in)activity • Road safety | Context | Summary
Perspectives

The core principles of a 15-minute city are that residents of all neighbourhoods: • have easy access by foot or bicycle
to essential living needs;• have a variety of housing types, of
different sizes and levels of afford-ability, to accommodate many types of households and enable more people to live closer to where they work;
• are able to breathe clean air, free of harmful air pollutants;
• have green spaces for everyone to enjoy;
• have smaller-scale offices, retail and hospitality, and co-working spaces so that more people can work close to home or remotely.
The rise of electric vehicles A pathway towards zero-emission solutions has evolved through the intro duction of electric vehicles, with also ”shift” potential of electrification in public transport, rail freight, motor-cycles and bikes. This represents a significant turning point towards an irreversible end to the use of fossil fuels in transport.
At the same time, new technologies create new impacts on urban planning, health and the environment. A shift towards electric cars does not provide the health benefits of shifting to active transport. To maximize the benefits of a real sustainable system, indirect effects should be addressed at an early stage (e.g. improving the composition of batteries, working conditions in manufacturing and the energy used). The uptake of electric vehicles should ideally go hand in hand with policy approaches on the well-to-wheels chain (resources), circular economy (produc-tion methods and recycling), energy transition (source of power, energy efficiency) and active transport.
The latest figures on charging stations (https://www.eafo.eu) give an impres-sion of the emerging market for electric cars in our region. Nowadays, all car manu facturers offer electric models and countries are stimulating the roll out of the required charging infrastructure.
Volkswagen Group
Daimler
BMW Group
Hyundai-Kia
Peugeot-Citroen-Opel
Renault-Nissan-Mitsubishi
Volvo-Geely
Jaguar-Land Rover
Tesla
Toyota-Lexus
Ford
Others
Fiat Chrysler
End of 2019 2021
98 214
23
14 23
12 21
12 18
9 17
7 17
6 16
5 16
4 15
4 13
1 8
1 5
4
41
* Includes plug-in hybrid and fully electric models
Total
Note: Includes plug-in hybrid and fully electric models. Source: Reproduced under creative commons from Transport and Environment (10).
Expected number of electric car models available in Europe in late 2019 and in 2021
15
Introduction | Exploration | Transport | Air pollution • Greenhouse gas emissions • Traffic noise • Physical (in)activity • Road safety | Context | Summary

Road transport leads to both exhaust and non-exhaust (brake, tyre, road wear) emissions of air pollutants. Air pollution is a major cause of premature death and disease and is the single largest environmental health risk in Europe. WHO provides guideline values to protect health, which will be revised in the near future. However, current concentration levels are generally above these recommended guideline levels. Emissions from transport have decreased, but passenger and freight volumes have been gradually increasing. Still, in 2018, 74% of the EU urban population breathed air that exceeded the particulate matter 2.5 micron (PM2.5) WHO Air Quality Guideline (AQG); 99% was exposed to ozone levels above WHO AQG. Traffic-related air pollution also has negative impacts on ecosystems. Additional reduction measures can further improve human health, especially within urban areas.
Air pollution
Introduction | Exploration | Transport | Air pollution • Greenhouse gas emissions • Traffic noise • Physical (in)activity • Road safety | Context | Summary
16

Emissions from road traffic Road transport leads to both exhaust and non-exhaust (brake, tyre, road wear) emissions of air pollutants (11).
The most important emissions are particulate matter (black carbon, primary PM2.5, primary PM10), nitrogen oxides (NOx), and non-methane volatile organic compounds (NMVOC). Primary pollutants are directly emitted to the atmosphere, whereas secondary pollutants are formed in the atmos-phere through chemical reactions and microphysical processes from gaseous precursors. NOx emissions determine the population exposure to NO2, but also contribute to the formation of secondary PM2.5 and PM10 and, together with NMVOC, to ozone formation (12).
For long-term exposure, particulate matter (measured and modelled as black carbon, PM2.5 and PM10) and NO2 are the most used indicators for the air pollution mixture. For short-term exposure, ozone is a relevant air pollutant generated in the atmosphere from emissions of its precursors including those from road traffic.
Source: Based on EEA (13).
Passenger cars
Light duty vehicles
Heavy duty vehicles and buses
Mopeds and motorcycles
Other road transport
39%
6%7%
19%
29%48%
19%
32% 1%
16%
8%
9%
1%
66% 25%
11%
14%2%
48%
NMVOCNOx
PM10 PM2.5
EEA category Origin
Emissions from road transport in 2018 (% per air pollutant)
Engine exhaust
Tyre and brake wear
Road abrasion
17
Introduction | Exploration | Transport | Air pollution • Greenhouse gas emissions • Traffic noise • Physical (in)activity • Road safety | Context | Summary
What we know

20082006200420022000 2010 2012 2014 2016 2018
NOX
PM10
PM2.5
NMVOC
Carbon monoxide
Black carbon
Passenger transportFreight transport
120
100
80
60
40
20
0
140
160
Inde
x (%
of 2
000)
Note: Only pollutants are shown for which road transport contributed more than 5% of the total EU-28 emissions in 2018. For comparison, passenger transport (pkm) and freight transport (tkm) are shown.
Source: Reproduced from EEA (12).
Development in emissions of pollutants
18
Introduction | Exploration | Transport | Air pollution • Greenhouse gas emissions • Traffic noise • Physical (in)activity • Road safety | Context | Summary
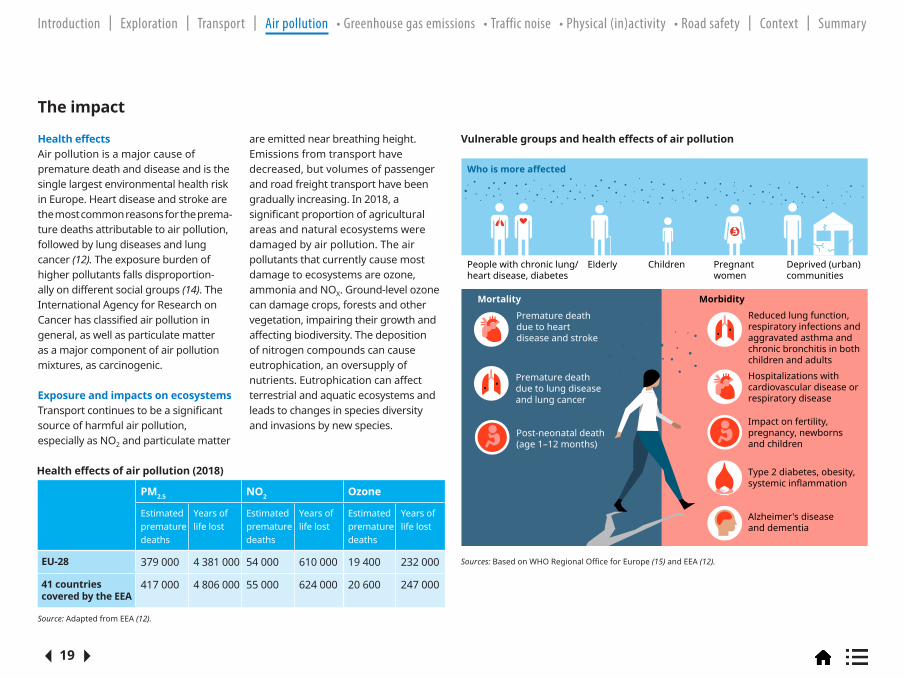
Health effects Air pollution is a major cause of prema ture death and disease and is the single largest environmental health risk in Europe. Heart disease and stroke are the most common reasons for the prema - ture deaths attributable to air pollution, followed by lung diseases and lung cancer (12). The exposure burden of higher pollutants falls disproportion - ally on different social groups (14). The International Agency for Research on Cancer has classified air pollution in general, as well as particulate matter as a major component of air pollution mixtures, as carcinogenic.
Exposure and impacts on ecosystemsTransport continues to be a significant source of harmful air pollution, especially as NO2 and particulate matter
are emitted near breathing height. Emissions from transport have decreased, but volumes of passenger and road freight transport have been gradually increasing. In 2018, a significant proportion of agricultural areas and natural ecosystems were damaged by air pollution. The air pollutants that currently cause most damage to eco systems are ozone, ammonia and NOX. Ground-level ozone can damage crops, forests and other vegetation, impairing their growth and affecting biodiversity. The deposition of nitrogen compounds can cause eutrophication, an over supply of nutrients. Eutrophication can affect terrestrial and aquatic ecosystems and leads to changes in species diversity and invasions by new species.
PM2.5 NO2 Ozone
Estimated premature deaths
Years of life lost
Estimated premature deaths
Years of life lost
Estimated premature deaths
Years of life lost
EU-28 379 000 4 381 000 54 000 610 000 19 400 232 000
41 countries covered by the EEA
417 000 4 806 000 55 000 624 000 20 600 247 000
Source: Adapted from EEA (12).
Sources: Based on WHO Regional Office for Europe (15) and EEA (12).
Who is more affected
Mortality Morbidity
Elderly Children
Premature death due to heart disease and stroke
Reduced lung function, respiratory infections and aggravated asthma and chronic bronchitis in both children and adults
Hospitalizations with cardiovascular disease or respiratory disease
Impact on fertility, pregnancy, newborns and children
Type 2 diabetes, obesity, systemic inflammation
Alzheimer's disease and dementia
Premature death due to lung disease and lung cancer
Post-neonatal death (age 1–12 months)
People with chronic lung/heart disease, diabetes
Pregnantwomen
Deprived (urban) communities
The impact
Vulnerable groups and health effects of air pollution
Health effects of air pollution (2018)
19
Introduction | Exploration | Transport | Air pollution • Greenhouse gas emissions • Traffic noise • Physical (in)activity • Road safety | Context | Summary

Air pollution concentration levels are generally above the guideline levels recommended by WHO. For example, in 2018, 74% of the EU urban popula-tion breathed air that exceeded the PM2.5 WHO AQG; 99% was exposed to ozone levels above the WHO AQG. The high exposure to air pollutants of people living along busy roads is not reflected in the average exposure of the population.
Although exposure levels and impacts from particulate matter and NO2 have decreased, air pollution still has a significant health impact and is the single largest environmental risk in Europe. For the whole of the WHO European Region, WHO estimates that 509 000 premature deaths per year are attributable to ambient air pollution, measured as particulate matter of 2.5 microns in aerodynamic diameter (PM2.5) in 2016 (16). The EEA estimates that attributable to PM2.5 417 000 died prematurely and over 4.8 million years of life were lost every year based on 2018 data covering 41 countries (12).
The estimated numbers of premature deaths attributed to PM2.5 and to NO2-exposure have declined since 2009 by 13% and 56% respectively.
Premature deaths attributable to exposure to ground-level ozone have increased by 20% in the 41 countries covered by the EEA, and by 24% in the EU-28.
A switch to electric vehicles will not solve the problem of particulate matter, since other sources (asphalt, tyres, industry, agriculture and natural sources) also contribute to particulate matter exposure.
What are we facing?
(a) The following EU standards are considered: PM10 daily limit value, PM2.5 annual limit value, O3 target value, NO2 annual limit value.
(b) For NO2, the EU annual limit value and the WHO AQG are the same.
Source: Based on EEA (12).
Percentage of the population exposed to concentrations above certain air pollution levels
EU-28 urban population expo-sure to concen-trations above EU standards (a)
Urban population exposure to concentrations above WHO AQG value
Reporting stations that registered concentrations above EU standards (a)
Reporting stations that registered concentrations above WHO AQG value
16 EU Member States and 3 other countries (b)
16 EU Member States and 3 other countries (b)
All countries except Estonia, Iceland and Ireland
All countries except Estonia, Finland Iceland and Ireland
PM10
PM2.5
O3
NO2
2018
20 EU Member States and 6 other countries
6 EU Member States and 2 other countries
20 EU Member States and 5 other countries
19%
4%
41%
8%
53%
70%
96%
8%
15%
4%
34%
4%
(b)
48%
74%
99%
4%
(b)
(a) The following EU standards are considered: PM10 daily limit value, PM2.5 annual limit value, O3 target value, NO2 annual limit value.
(b) For NO2, the EU annual limit value and the WHO AQG are the same.
20
Introduction | Exploration | Transport | Air pollution • Greenhouse gas emissions • Traffic noise • Physical (in)activity • Road safety | Context | Summary

Perspective on solutions A combined effort in urban planning, technical measures, regulationand changes in behaviour is urgently needed to reduce air pollution.
Governments can reduce air pollution by emission regulation and policies to stimulate the use of cleaner alternatives. Cities and regions can develop urban policies that reduce car use (e.g. compact cities or 15-minute cities).
Reducetraffic density
Limit traffic speed
Encourage higher penetration of cleaner (Euro 6/electric) cars
Less/cleaner emissions Modal shift
Synergetic and antagonistic effects
Use of bio-fuels or move towards zero-emissions
Promote active mobility
Promote public transport
Reduce journey times of public transport
10080
Change the allocation of the roads permanently:
The elimination of polluting vehicles and the increase in electric vehicles will reduce air pollution emissions.
Introducing zero-emissionvehicles may lead to an increase in emissions from the energy supply sector.
Change the vehicle fleet (less old cars)
?
Reduce lanes for cars
Increase space forcyclists and publictransport
Replace parking places with green areas for recreation
Minimize the availability of parking places
Low emission zone
Source: Adapted from EEA (12).
21
Introduction | Exploration | Transport | Air pollution • Greenhouse gas emissions • Traffic noise • Physical (in)activity • Road safety | Context | Summary

Greenhouse gas emissions contribute to climate change. The energy use of road transport is one of the largest contributors to greenhouse gas emissions, responsible for about 20% of all such emissions in 2018 for the EU alone. On a global scale, transport emits around 23% of the energy-related carbon dioxide (CO2) that feeds global warming. Without immediate action, its share could reach 40% by 2030. Currently, the rise in transport volumes out weighs improvements in vehicle energy efficiency. Without a global decrease in the use of fossil fuels, temperatures will further rise with worldwide effects. The projected increase in greenhouse gas emissions will lead to more damage to our environment, our homes, and the health and well-being of our citizens. As signatories of the Paris Agreement on climate change, all UNECE and WHO European region countries have committed to contribute to global efforts to limit climate change to below 2 ºC.
Greenhouse gas emissions
Introduction | Exploration | Transport | Air pollution • Greenhouse gas emissions • Traffic noise • Physical (in)activity • Road safety | Context | Summary
22

Energy use of road transport is one of the largest contributors of greenhouse gasesThe use of fossil fuel in transport causes greenhouse gas emissions. Amounts are influenced by vehicle- kilometres driven on the one hand and improvements in energy efficiency of vehicles on the other. The main
greenhouse gases emitted by vehicles are CO2 and methane (CH4).
Between 1990 and 2018, greenhouse gas emissions from road transport increased in most countries. In parti-cular, in the EU they increased by 20%. This was due to a rise in transport volumes that has outweighed improve-ments in vehicle efficiency. Emissions from maritime transport and aviation have also increased since 1990.
Road transport emissions showed a decline between 2007 and 2013 due to the economic recession, high oil prices and improvements in energy efficiency. But, due to economic growth and declining oil prices, emissions increased again between 2013 and 2017; transport was the fastest growing source of greenhouse gas emissions in the EU. While green - house gas emissions declined in most sectors in the EU in these years, emissions from transport increased.
Road transport constitutes the highest proportion of overall transport emissions (around 71% in 2018), but this is projected to decrease in the next 15 years, since road transport decarbonizes faster than the other
transport modes. The largest increases up to 2030 are projected for the aviation sector, followed by inter national maritime transport. These sub-sectors are therefore expected to constitute a higher proportion of transport sector emissions in the coming years. The number of vehicle-kilometres is still growing and is projected to grow for the next 20 years due to increasing incomes and trade, despite the current dip because of COVID-19 measures.
Greenhouse gases emitted differ between specific fossil fuels types used in road transport. Diesel causes less carbon emissions per kilometre than petrol, but causes more emissions of air pollutants. In 2018, the sales of petrol cars exceeded those of diesel cars (60%/40%).
What we know
Source: Based on EEA (18).
Motorcycles
1% Passenger
cars
60%
Heavy dutyvehicles
27%
Greenhouse gas emissions from road
transport
Light duty vehicles
12%
1990
600
700
800
900
500
400
300
200
100
0200820062004200220001998199619941992 2010 2012 2014 2016 2018
Number of years
Mill
ion
tonn
es C
O2 e
quiv
alen
ts
Direct emissions
1990
600
700
800
900
500
400
300
200
100
0200820062004200220001998199619941992 2010 2012 2014 2016 2018
Indirect emissions
Transportation Industry Residential Commercial Other sectors
Direct emissions
Road transport emissions
Source: Based on EEA (17).
23
Introduction | Exploration | Transport | Air pollution • Greenhouse gas emissions • Traffic noise • Physical (in)activity • Road safety | Context | Summary

Greenhouse gas emissions have far-reaching consequences for our environment and healthGlobal emissions of greenhouse gases cause climate change. They will increase climate hazards in Europe during the 21st century and beyond, such as droughts, with consequences for food production, vector borne diseases and allergies; heavy rains and flash floods; forest fires; and sea level rise. Storms and heavy rains and flash floods could occur in many parts of Europe.
Increasing summer temperatures will lead to an increase in heat-related morbidity and mortality. Increased health risks are expected to be the greatest in the southern parts of Europe and within cities (heat islands). In northern Europe cold-related morbidity and mortality is expected to decrease. Increasing temperatures could also stimulate new and existing vector borne diseases.
Rising atmospheric CO2 concen trations, higher temperatures and changes in
precipitation patterns, including drought conditions, affect the quantity, quality and stability of food production. Drought frequency is also projected to increase in central and western Europe, whereas it may decrease in some limited regions of northern Europe. Cascading impacts of climate change from outside Europe may affect agricultural income and price levels in Europe through changes in trade patterns.
CO2 contributes to the production of ozone by trapping radiation at ground
level and as such influences air pollution levels. Thus, greenhouse gas emissions also contribute to respiratory disease from smog and air pollution.
Climate change tends to affect vulnerable groups the most. The number of climate refugees will increase if no worldwide mitigation and adaptation measures are taken (20).
The impact
7
6
4
2
0
-2
-4
-6
-7
0C Most above the average over a large part of Siberia and the seas to the northAbove average
Average
Below average
Above average over virtually all of Europe, more so in the north and east
Above average over most other areas of land and ocean
Below average, particularly parts of western Canada
Below average, particularly parts of northern India
Below average over the eastern equatorial Pacific
Below average over the north Atlantic west of Ireland
Below average over several oceanic areas in the southern hemisphere
Source: Reproduced from Copernicus (19).
Surface air temperature anomaly for January–December 2020
24
Introduction | Exploration | Transport | Air pollution • Greenhouse gas emissions • Traffic noise • Physical (in)activity • Road safety | Context | Summary

If no measures are taken, the temperature will further rise with worldwide impact and in conflict with the Paris agreement
Emissions continue to riseDespite a temporary dip in emissions due to COVID-19 measures, it is expected that emissions will continue to rise if no measures are taken. Consequently, the targets of the Paris Agreement would not be reached, which would have a significant impact worldwide.
With current policies, road transport emissions in 2030 will remain 20% above the 1990 level. Additional measures reported in particular by EU Member States could bring 2030 emissions down to the 1990 level. But this would still be significantly higher than the 90% reduction needed for climate neutrality in 2050 (21).
Apart from the COVID-19 lockdowns in 2020, measures to reduce total vehicle kilometres have not been very effective. During the past 30 years, efficiency improvements were not sufficient to compensate for increased vehicle
mobility. An important way to realize emission reductions is to reduce the number of vehicle-kilometres and invest in a significant modal shift.
Phasing out old vehicles will not solve the problem If vehicle-kilometres continue to rise, the crucial question is whether this can be compensated for by improved energy efficiency of vehicles. This will depend on the renewal of the existing vehicle fleet: the phasing out of old vehicles with high emission factors and the penetration of new vehicles with substantially less or zero greenhouse gas emissions.
The switch towards zero-emission vehicles is still modest, but will also improve air quality.
However, it is important to realize that – by introducing zero-emission vehicles – the responsibility for clean energy production for transportation is passed on to the energy sector. Therefore a reduction in greenhouse gas emissions by the transport sector may imply an increase in emissions by the energy sector. Increased use of biofuels is part of the climate policy in
the EU, but could still entail increased local air pollution risks. The use of biofuels for transport was 8% in 2018; the 2020 target was 10%.
What are we facing?
Energy consumption in transport(million terajoules)
Other liquid biofuelsAviation gasolineElectricity roadShip gasolineNatural gasBiogasolineRail gas/diesel oilElectricity railLiquefied petroleum BiodieselShip diesel/gas oilShip residual fuel oilAviation keroseneRoad gasolineRoad dieselOil-derived fuels70% reduction from 2008 oilconsumption
0
2
4
6
8
10
12
14
16
18
‘90 ‘91 ‘92 ‘93 ‘94 ‘95 ‘96 ‘97 ‘98 ‘99 ‘00 ‘01 ‘02 ‘03 ‘04 ‘05 ‘06 ‘07 ‘08 ‘09 ‘10 ‘11 ‘12 ‘13 ‘14 ‘15 ‘16 ‘17Energy consumption in transport(million terajoules)
Other liquid biofuelsAviation gasolineElectricity roadShip gasolineNatural gasBiogasolineRail gas/diesel oilElectricity railLiquefied petroleum BiodieselShip diesel/gas oilShip residual fuel oilAviation keroseneRoad gasolineRoad dieselOil-derived fuels70% reduction from 2008 oilconsumption
0
2
4
6
8
10
12
14
16
18
‘90 ‘91 ‘92 ‘93 ‘94 ‘95 ‘96 ‘97 ‘98 ‘99 ‘00 ‘01 ‘02 ‘03 ‘04 ‘05 ‘06 ‘07 ‘08 ‘09 ‘10 ‘11 ‘12 ‘13 ‘14 ‘15 ‘16 ‘17
Energy consumption in transport(million terajoules)
Other liquid biofuelsAviation gasolineElectricity roadShip gasolineNatural gasBiogasolineRail gas/diesel oilElectricity railLiquefied petroleum BiodieselShip diesel/gas oilShip residual fuel oilAviation keroseneRoad gasolineRoad dieselOil-derived fuels70% reduction from 2008 oilconsumption
0
2
4
6
8
10
12
14
16
18
‘90 ‘91 ‘92 ‘93 ‘94 ‘95 ‘96 ‘97 ‘98 ‘99 ‘00 ‘01 ‘02 ‘03 ‘04 ‘05 ‘06 ‘07 ‘08 ‘09 ‘10 ‘11 ‘12 ‘13 ‘14 ‘15 ‘16 ‘17
Source: Reproduced from EEA (22).
Energy consumption in transport (million terajoules)
25
Introduction | Exploration | Transport | Air pollution • Greenhouse gas emissions • Traffic noise • Physical (in)activity • Road safety | Context | Summary

Climate change mitigation and adaptation is a challenge for all
Subregional variationsThere are large variations in car ownership per head in the UNECE and WHO European region, as well as the share of public transport and bicycle use in total mobility. This leads to variations in emissions. From these sub regional variations lessons might be drawn about success factors and effective instruments to influence mobility behaviour and reduce both greenhouse gas and air pollution emissions.
The end of the internal combustion engineSeveral countries and cities across the UNECE region have set targets to end the sales of new cars with an internal combustion engine in their national climate plans – for example: Norway (2025), Denmark, Sweden, Ireland and the Netherlands (2030), the United Kingdom (2035) and France (2040).
Towards climate action for transportSince the signing of the Paris Agreement in 2015, countries and cities have worked on more ambitious national and local climate plans, with transport and its related energy use as one of the priorities to tackle green-house gas emissions. These plans show a wide range of dedicated policy measures for reduction purposes – for example, on quality of fuels, vehicle efficiency and electrification, tax and financial incentives, promoting modal shift, and stimulating other modes of transport like public transport, walking and cycling. At a local level, first steps are being taken towards the national ambitions (24). Examples include the public procurement of zero-emission vehicles (e.g. electric or hydrogen cars) and the introduction of environmental zones (Low Emission Zones) to regulate the entry/exit of vehicles. Other measures include investing in energy infrastructure for electric cars, intro-ducing e-buses and building a cycling infrastructure.
Perspective on solutions
• Change in annual average temperature (in °C )
1.5 °C
1.5 °C
2 °C
2 °C
3 °C
3 °C
• Change in annual average precipitation (in %)
1 °C 1.5 °C 2 °C 2.5 °C 3 °C 3.5 °C 4 °C
-15% -10% -5% 0% 5% 10% 15%
Climate in Europe with global warming
Source: Reproduced from Feyen et al. (23).
26
Introduction | Exploration | Transport | Air pollution • Greenhouse gas emissions • Traffic noise • Physical (in)activity • Road safety | Context | Summary

Traffic noise affects people's health and well-being. It is a risk factor for annoyance, sleep disturbance and cardiovascular disease. Some people are more vulnerable, others are highly exposed, and some people are both. At least 20% of people living in countries covered by EEA studies live in areas where traffic noise exposures are harmful to health. Health impact assess-ments show that traffic noise is a major environmental concern in the UNECE and WHO European region. Yet, we are a long way from effective policies. National limits on noise are well above the WHO recommendations, data on traffic noise is incomplete and the number of people exposed to high levels of noise remains alarmingly high. An overarching health objective on road traffic noise is needed.
Traffic noise
Introduction | Exploration | Transport | Air pollution • Greenhouse gas emissions • Traffic noise • Physical (in)activity • Road safety | Context | Summary
27

Human response to noise
Noise sources
Processing by person
Physiological responses
Psychologicalresponses
Genetic and acquiredproperties (attitude,sensitivity processing behavior, etc.)
Physical and social environment, lifestyle
Exposure to noise
Stress
Sleep disturbanceAnnoyance Other health out-comes such as cogni-tive impairment, reduced quality of life and well-being, and mental health problems
Cardiovascular disease and metabolic effects
Noise affects the well-being and health of people Long-term exposure to traffic noise is associated with: • annoyance: a stress reaction
that encompasses a wide range of negative feelings, including disturbance, dissatisfaction, distress, displeasure and irritation;
• sleep disturbance: reduced sleep continuity and total amount of sleep time, which can have an impact on alertness, performance at work and quality of life;
• cardiovascular disease and metabolic effects: stress reactions in the body are activated, leading to increases in blood pressure, a changing heart rate and a release of stress hormones.
• other health outcomes such as cognitive impairment, reduced quality of life and well-being, and mental health problems.
Noise levels are often expressed as Lden (annual day-evening-night noise level) and Lnight (annual night noise level). WHO provides guideline values for road traffic noise to protect the general population in the WHO European Region, but some vulnerable people may not be fully protected (25). Risk levels on being highly annoyed and being highly sleep disturbed are the basis for setting corresponding guideline exposure value levels. Recommendations by WHO are not legally binding but should help in developing future noise policies to prevent further negative health impact.
What we know
Health impacts of traffic noise
28
Introduction | Exploration | Transport | Air pollution • Greenhouse gas emissions • Traffic noise • Physical (in)activity • Road safety | Context | Summary

Source WHO guideline value Associated risk level and health outcome
Road traffic noise 53 dBLden 10% highly annoyed
45 dBLnight 3% highly sleep disturbed
Traffic noise does not affect everyone equally
Socially deprived groups, as well as groups with increased susceptibility to noise, may suffer more pronounced health-related impacts of noise. For health protection policies to be more effective, WHO and the EEA highlighted the following:
• Exposure levels differ among socioeconomic groups: – Groups with lower socioeconomic positions tend to be
exposed to higher environmental noise levels. – Some studies show that affluent people can also be
more exposed as they prioritize a central living location to avoid commuting.
• Some people are more susceptible to noise: – Children, the elderly, people with pre-existing health
conditions, noise sensitive people and pregnant women can be more vulnerable to noise.
– Shift workers are often confronted with higher expo-sures and may be more at risk as their sleep structure is under stress.
• Deprived populations may experience the largest effects of noise pollution as a result of:
– poorer housing; – pre-existing health conditions; – fewer opportunities for coping with noise; – less access to quiet areas, providing relief from
environ mental stress and opportunities to rest and relax.
WHO derived guideline values to protect the general population
Source: Based on WHO Regional Office for Europe (25).
Sources: WHO Regional Office for Europe (26) and EEA (27).
29
Introduction | Exploration | Transport | Air pollution • Greenhouse gas emissions • Traffic noise • Physical (in)activity • Road safety | Context | Summary
Inside urban areas
Road noise
Road noise
Outside urban areas
≥70 dB65–69 dB60–64 dB55–59 dB50–54 dB
Million people
Night
0 10 20 30 40 50 60
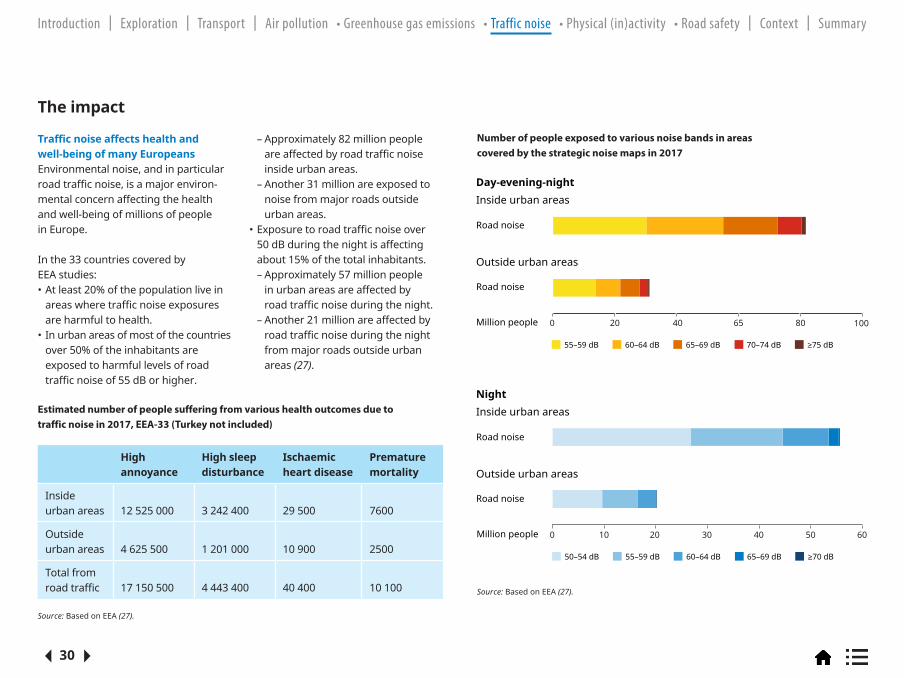
Traffic noise affects health and well-being of many EuropeansEnvironmental noise, and in particular road traffic noise, is a major environ-mental concern affecting the health and well-being of millions of people in Europe. In the 33 countries covered by EEA studies:• At least 20% of the population live in
areas where traffic noise exposures are harmful to health.
• In urban areas of most of the countries over 50% of the inhabitants are exposed to harmful levels of road traffic noise of 55 dB or higher.
– Approximately 82 million people are affected by road traffic noise inside urban areas. – Another 31 million are exposed to noise from major roads outside urban areas.
• Exposure to road traffic noise over 50 dB during the night is affecting about 15% of the total inhabitants. – Approximately 57 million people in urban areas are affected by road traffic noise during the night. – Another 21 million are affected by road traffic noise during the night from major roads outside urban areas (27).
High annoyance
High sleep disturbance
Ischaemic heart disease
Premature mortality
Inside urban areas
12 525 000
3 242 400
29 500
7600
Outside urban areas
4 625 500
1 201 000
10 900
2500
Total from road traffic
17 150 500
4 443 400
40 400
10 100
The impact
Source: Based on EEA (27).
Source: Based on EEA (27).
Estimated number of people suffering from various health outcomes due to traffic noise in 2017, EEA-33 (Turkey not included)
Million people
≥75 dB70–74 dB65–69 dB60–64 dB55–59 dB
Inside urban areas
Day-evening-night
Road noise
Road noise
Outside urban areas
0 20 40 65 80 100
Number of people exposed to various noise bands in areas covered by the strategic noise maps in 2017
30
Introduction | Exploration | Transport | Air pollution • Greenhouse gas emissions • Traffic noise • Physical (in)activity • Road safety | Context | Summary

More people affected in the future The reported number of people exposed to harmful traffic noise levels has not shown a significant drop or increase since 2012. However, estimations before the COVID-19 pandemic show that the population exposed to environmental noise is projected to increase because of future urban growth and an increased demand for mobility. Outlooks for 2030 predict, for example, an increase in the number of people affected by road traffic noise during the day- evening-night of another 7.8% in urban areas and 16.4% in areas near major roads in the EU (27). Implementing WHO noise guidelines would not only prevent the situation getting worse, but could also help to reduce the negative health impacts from traffic noise.
Noise limits do not meet WHO guidelinesFor EU Member States, the major legislation concerning environmental noise is the Environmental Noise Directive (END), which sets some reporting thresholds. Those are not legal limits, but countries are obliged to submit data on population
exposed above these thresholds and to develop action plans. The situation on national noise limits across the WHO European Region is not homogeneous. Most, if not all, national noise limits are above the WHO guidelines (27, 28).
Lack of sufficient and useful data Health impact assessments show that traffic noise is one of the major environmental concerns in the UNECE and WHO European region, but data on traffic noise is incomplete.
Data for noise is available for the 33 countries covered by EEA studies, but is incomplete, and data for the other 23 countries of the WHO European Region is lacking. Although some progress has been made on the reporting of noise mapping by countries, more than 30% of data required is still not available after the 2017 END legal reporting deadline (27). For proper health impact estima-tions, we need valid data on exposure for the whole of the region and at exposure ranges in accordance with the WHO guidelines.
Monitoring and evaluation need attentionOnly a limited number of transport interventions have evaluated health outcomes in relation to changes in noise levels. Most often, the noise management/control literature of interventions reports a change in noise emissions or in noise levels; the actual impact on health remains unknown. Under the END, countries are obliged to assemble action plans, but there is no follow-up or obligation to monitor whether the action plans are implemented or the measures are successful. In terms of reporting on noise action plans, significant delays and poor quality suggest that countries may not have taken the necessary steps to address noise pollution (27).
Policy objectives not yet achievedPolicy objectives on environmental noise have not yet been achieved: the number of people exposed to high levels of noise has not decreased, and millions of people remain exposed to noise levels harmful to health. Therefore, the objective of the 7th Environment Action Programme of the EU, of significantly reducing noise
pollution in the EU and moving closer to the WHO recommended levels by 2020, has not been achieved. Countries are undertaking a variety of actions to reduce and manage environmental noise, but as yet it is difficult to evaluate their benefits in terms of positive health outcomes (27).
That raises the question of whether there should be an overarching health objective on traffic noise for the whole UNECE and WHO European region, to be achieved in the next years. To protect the health of the pan-European population, better implementation of an approach similar to END, or even more stringent regulations, is needed – with a focus on road traffic noise as a cause of major health impacts.
What are we facing?
31
Introduction | Exploration | Transport | Air pollution • Greenhouse gas emissions • Traffic noise • Physical (in)activity • Road safety | Context | Summary

Change in behaviour to reduce exposures
Other physical measures
Availability of a quiet side
Availability of green space and quiet areas
Closure of an infrastructure related to the noise source
Closure of roads, railways or flights paths, pedestrianization
Re-routing of noise sourceBypass
Planning controls between receivers and noise sources
Noise control measures at the propagation path
Noise barrier
Sound-proofwindows
Insulation of building envelope
Noise control measures at the source
Time restrictions on source operations
Heavy vehicle curfew
Traffic management Reduce traffic density, speed reduction and traffic calming
Penalties for noisy and incentives for quieter sources
Urban planning and infrastructure change
Low-noiseasphalt
Quiet engines
30
Tunnel
Urban planning control, buffer zones, land-use planning and design
Education and communication
Educating people on how to change their exposure
Low-noisetyres
Sources: Adapted from EEA (27) and Brown & Van Kamp (29).
Perspective on solutions Especially when combined, a wide variety of measures can help reduce traffic noise and limit negative health impacts drastically.
32
Introduction | Exploration | Transport | Air pollution • Greenhouse gas emissions • Traffic noise • Physical (in)activity • Road safety | Context | Summary

Regular physical activity is a well-established protective factor against developing coronary heart disease, stroke, diabetes, breast and colon cancer, depression and dementia. Cycling and walking make an important contri-bution to overall physical activity, since these transport modes are accessible to almost everybody, can easily be integrated into a busy day and require a minimal personal financial investment. Active transport (walking or cycling to, for example, school or work) has been linked to decreased risks of developing hypertension, overweight and obesity.
A substantial percentage of daily car trips are short distance and could be replaced by cycling or walking. Increasing physical activity through more active transport could contribute to achieving many of the Sustainable Development Goals (SDGs).
Physical (in)activity
Introduction | Exploration | Transport | Air pollution • Greenhouse gas emissions • Traffic noise • Physical (in)activity • Road safety | Context | Summary
33

Health effectsThe health benefits of physical activity are well recognized. The greatest benefits are obtained when people switch from being non-active to doing some physical activity. Health benefits include reduced risks for noncommuni-cable diseases such as cardiovascular disease, diabetes and various types of cancer, and positive effects on mental health (30).
Levels of inactivityWorldwide, 1 in 4 adults, and 3 in 4 adolescents (aged 11–17 years), do not currently meet the global recommen-dations for physical activity set by WHO: for adults at least 150 minutes of moderate-intensity physical activity or 75 minutes of vigorous-intensity physical activity per week, or both. For children and adolescents the recom-mendation is at least 60 minutes of moderate to vigorous physical activity per day (31).
As countries develop economically, levels of inactivity (sitting time) increase. In some countries, levels of inactivity can be as high as 70%, due to changing patterns of transportation, increased use of technology and urbanization (32).
Respondents were asked how many days they walked for at least 10 minutes at a time in the previous seven days. Around 6 out of 10 (61%) say they walked for at least 10 minutes at a time on four or more days in the previous week, while 23% say they walked for this amount of time on 1 to 3 days. However, around 1 in 7 EU citizens (15%) say they did not walk for 10 minutes at a time on any day during the previous week (33).
What we know
Source: Based on EU (33).
min
0.7 km
min
9.1 minutes
median
11.9 minutesmedian
1.0 km
max
1.4 km
max
23 minutes
Daily average walking time versus the average walking distance
34
Introduction | Exploration | Transport | Air pollution • Greenhouse gas emissions • Traffic noise • Physical (in)activity • Road safety | Context | Summary

EU8%
Cycling share Walking share
Netherlands27%
54%
19%
14%
8%
Car
Public transport
Walking
Bicycle
Bulgaria and Spain25%
0 10 20 30 40 50 60Opportunities for active transportAn average journey length for motorized transport is 9–22 km per day. These distances provide many opportunities for more environmen-tally friendly modes of transport, like cycling or walking, especially in urban areas (34).
Source: Based on WHO Regional Office for Europe (32).
The most used modes of transport on a typical day for the EU-28:
EU8%
Cycling share Walking share
Netherlands27%
54%
19%
14%
8%
Car
Public transport
Walking
Bicycle
Bulgaria and Spain25%
0 10 20 30 40 50 60
Walking shareBulgaria and Spain have the highest wal king shares, as compared to the EU average:
Cycling shareIn the EU the mean proportion of the population using the bicycle is:
35
Introduction | Exploration | Transport | Air pollution • Greenhouse gas emissions • Traffic noise • Physical (in)activity • Road safety | Context | Summary
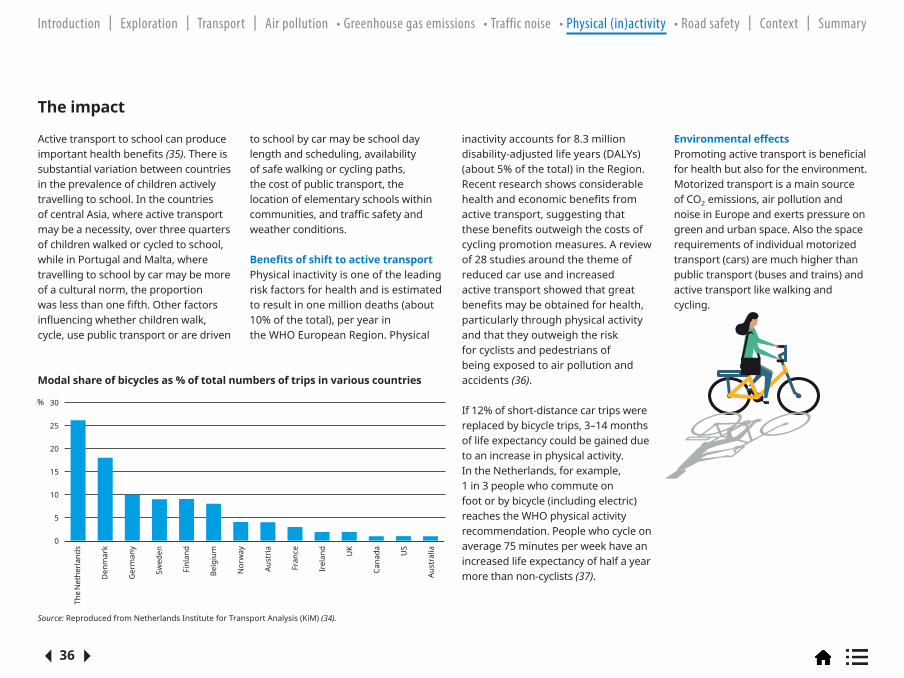
Source: Reproduced from Netherlands Institute for Transport Analysis (KiM) (34).
Active transport to school can produce important health benefits (35). There is substantial variation between countries in the prevalence of children actively travelling to school. In the countries of central Asia, where active transport may be a necessity, over three quarters of children walked or cycled to school, while in Portugal and Malta, where travelling to school by car may be more of a cultural norm, the proportion was less than one fifth. Other factors influencing whether children walk, cycle, use public transport or are driven
to school by car may be school day length and scheduling, availability of safe walking or cycling paths, the cost of public transport, the location of elementary schools within communities, and traffic safety and weather conditions.
Benefits of shift to active transportPhysical inactivity is one of the leading risk factors for health and is estimated to result in one million deaths (about 10% of the total), per year in the WHO European Region. Physical
inactivity accounts for 8.3 million disability-adjusted life years (DALYs) (about 5% of the total) in the Region.Recent research shows considerable health and economic benefits from active transport, suggesting that these benefits outweigh the costs of cycling promotion measures. A review of 28 studies around the theme of reduced car use and increased active transport showed that great benefits may be obtained for health, particularly through physical activity and that they outweigh the risk for cyclists and pedestrians of being exposed to air pollution and accidents (36).
If 12% of short-distance car trips were replaced by bicycle trips, 3–14 months of life expectancy could be gained due to an increase in physical activity. In the Netherlands, for example, 1 in 3 people who commute on foot or by bicycle (including electric) reaches the WHO physical activity recommendation. People who cycle on average 75 minutes per week have an increased life expectancy of half a year more than non-cyclists (37).
Environmental effectsPromoting active transport is beneficial for health but also for the environment. Motorized transport is a main source of CO2 emissions, air pollution and noise in Europe and exerts pressure on green and urban space. Also the space requirements of individual motorized transport (cars) are much higher than public transport (buses and trains) and active transport like walking and cycling.
The impact
Modal share of bicycles as % of total numbers of trips in various countries
30%
25
20
15
10
5
0
The N
ethe
rland
s
Den
mar
k
Ger
man
y
Swed
en
Finl
and
Belg
ium
Nor
way
Aust
ria
Fran
ce
Irel
and
UK
Cana
da US
Aust
ralia
36
Introduction | Exploration | Transport | Air pollution • Greenhouse gas emissions • Traffic noise • Physical (in)activity • Road safety | Context | Summary
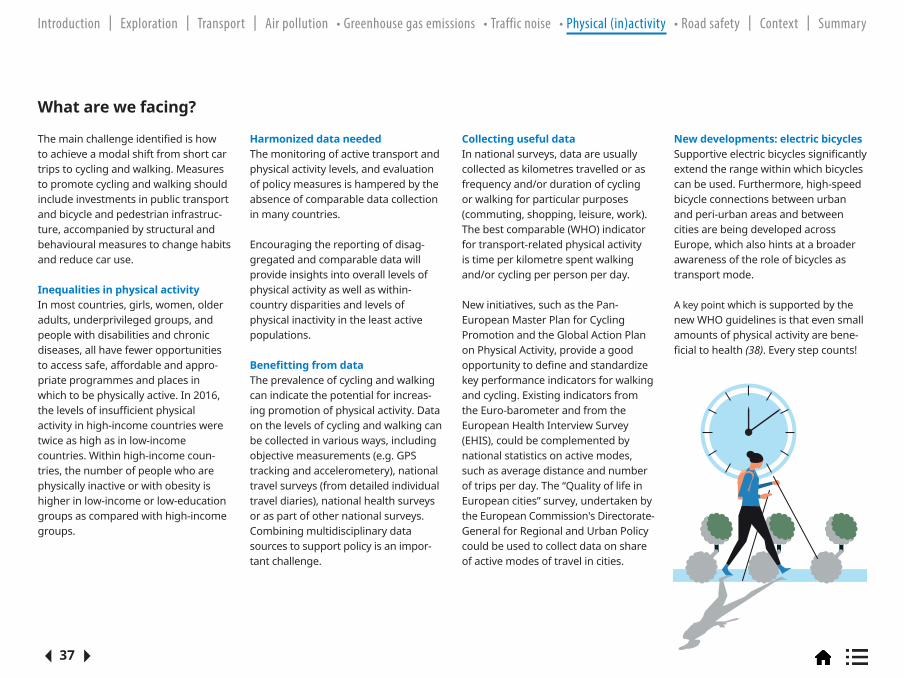
The main challenge identified is how to achieve a modal shift from short car trips to cycling and walking. Measures to promote cycling and walking should include investments in public transport and bicycle and pedestrian infrastruc-ture, accompanied by structural and behavioural measures to change habits and reduce car use.
Inequalities in physical activityIn most countries, girls, women, older adults, underprivileged groups, and people with disabilities and chronic diseases, all have fewer opportunities to access safe, affordable and appro-priate programmes and places in which to be physically active. In 2016, the levels of insufficient physical activity in high-income countries were twice as high as in low-income countries. Within high-income coun-tries, the number of people who are physically inactive or with obesity is higher in low-income or low-education groups as compared with high-income groups.
Harmonized data needed The monitoring of active transport and physical activity levels, and evaluation of policy measures is hampered by the absence of comparable data collection in many countries.
Encouraging the reporting of disag-gregated and comparable data will provide insights into overall levels of physical activity as well as within- country disparities and levels of physical inactivity in the least active populations. Benefitting from data The prevalence of cycling and walking can indicate the potential for increas-ing promotion of physical activity. Data on the levels of cycling and walking can be collected in various ways, including objective measurements (e.g. GPS tracking and accelerometery), national travel surveys (from detailed individual travel diaries), national health surveys or as part of other national surveys. Combining multidisciplinary data sources to support policy is an impor-tant challenge.
Collecting useful dataIn national surveys, data are usually collected as kilometres travelled or as frequency and/or duration of cycling or walking for particular purposes (commuting, shopping, leisure, work). The best comparable (WHO) indicator for transport-related physical activity is time per kilometre spent walking and/or cycling per person per day.
New initiatives, such as the Pan-European Master Plan for Cycling Promotion and the Global Action Plan on Physical Activity, provide a good oppor tunity to define and standardize key performance indicators for walking and cycling. Existing indicators from the Euro -baro meter and from the European Health Interview Survey (EHIS), could be com plemented by national statistics on active modes, such as average distance and number of trips per day. The “Quality of life in European cities” survey, undertaken by the European Commission's Directorate- General for Regional and Urban Policy could be used to collect data on share of active modes of travel in cities.
New developments: electric bicyclesSupportive electric bicycles significantly extend the range within which bicycles can be used. Furthermore, high-speed bicycle connections between urban and peri-urban areas and between cities are being developed across Europe, which also hints at a broader awareness of the role of bicycles as transport mode.
A key point which is supported by the new WHO guidelines is that even small amounts of physical activity are bene - ficial to health (38). Every step counts!
What are we facing?
37
Introduction | Exploration | Transport | Air pollution • Greenhouse gas emissions • Traffic noise • Physical (in)activity • Road safety | Context | Summary

Vulnerableelderly peopleexercise more
More socialinteraction
Increasedself-reliance
Better environmentalquality in disadvantaged
neighborhoods
Less noiseand air pollution
Feweraccidents
Less trafficdelaysLocations
in the citycan be
reachedmore quickly
Takes up less space than a car
Benefits higherthan costs
of measures
More visitshops in
city centersAnnualbicycle
costs 25% of car costs
Less heart and lung
disease
Less obesity and type 2
diabetes
Bettersleep quality
Bettermental health
Social Health
Enviro
men
t
and Infra
struc
ture
Economic
Average cycling distance per activity (km)
Commuting
Leisure
Shopping
Education
Other
All
4.4
5.3
2.1
3.4
2.5
3.8
16.7%
42.3%
47.4%
40.5%
34.4%
25.2%
22.4%
13.8%
8.6%
5.6%
4.4%
3.8%
2.0%
1.1%
0.5%
Share of bicycle use in trips by distance class
0.1– 0.5 km
0.5 –1.0 km
1.0 –2.5 km
2.5 –3.7 km
3.7–5.0 km
5.0 –7.5 km
7.5 –10 km
10 –15 km
15 –20 km
20 –30 km
30 –40 km
40 –50 km
50 –75 km
75 –100 km
>100 km
Up to 435 000 additional jobs in green and healthy transport might be created every year and 10 000 lives would be saved if 56 major European cities reached the same modal share of cycling as Copenhagen has.
Benefits outweigh the costsIntegration of physical activity
More teleworking
Spatial planning (urban sprawl)
Distance to work and services (schools,
health care)
Social travel (for family purposes)
Leisure activities and behaviour
Physical activity can and should be integrated into the settings in which people live, work and play.
Perspective on solutions Promoting active transport can contribute to achieving the SDGs
Sources: WHO Regional Office for Europe (32) and Inherit (39). Source: KiM (34).
38
Introduction | Exploration | Transport | Air pollution • Greenhouse gas emissions • Traffic noise • Physical (in)activity • Road safety | Context | Summary

Combining energy-efficient transport modes can compete with cars BiTiBi (bike-train-bike) stands for a seamless bike-train-bike combination for moving from A to B. BiTiBi combines the most energy-efficient transport modes with the bicycle; the latter is ideal for short distances and the train for longer distances. The combination of both modes (8) is a win for each of the separate modes. In that way, the competitive positions of the bicycle and the train are improved
compared with the car. The BiTiBi project, sponsored by the European Commission, first looked at the successful implemen tation of the BiTiBi model in the Netherlands and then replicated it in other regions and cities.
BiTiBi building blocksConvenience and seamlessness are crucial to making an intermodal transport journey (or a journey with a transfer) attractive. To get a good bike-train-bike service, the project
focussed on the barriers to using the service that potential users (could) experience and successful mitigating measures. These are, for example: • secure sheltered bicycle parking
for rail users’ bicycles;• safe bicycle routes to train stations
provided with the involvement of local authorities;
• bicycle parking and shared bicycles clearly signposted;
• an affordable shared bicycle service that is easy to use and allows the user to go to the final destination and come back to the railway station with the same bicycle;
• one integrated tariff and payment system, for example one card or app enabling the payment of all services via one invoice;
• frequent and fast trains without delay.
EU-wide roll out of BiTiBi for 2030The project calculated the possible impact of the implementation of the BiTiBi approach all over Europe. It was assumed that 20% of railway users would ride a bicycle to the railway station in 2030. This is less than half of the actual Dutch share but five times more than the estimated 4% for all EU railway users.
If 20% of railway users ride a bicycle, there will be:• 250 million more railway users in
the EU;• a reduction of 800 kilotonnes of
CO2, 55 tonnes of particulate matter and 250 tonnes of NOX emitted;
• a reduction in energy use of 200 000 tonnes of oil equivalent to 2500 MWh.
In addition, when a train passenger cycles to the station at least three times a week, 1200 premature deaths will be avoided each year because of the increase in physical activity. This is equivalent to €3 billion in savings in health expenses according to WHO's HEAT tool (40).
Case study: BiTiBi (bike-train-bike)
39
Introduction | Exploration | Transport | Air pollution • Greenhouse gas emissions • Traffic noise • Physical (in)activity • Road safety | Context | Summary

Road traffic injuries are a leading cause of death and disability in the UNECE and WHO European region. More than 110 000 people are killed every year, one person every 5 minutes, and millions more seriously injured. Road trauma has its greatest impact on young people, being the number one cause of death for those aged 5–29 years. Achieving SDG target 3.6 “By 2020, halve the number of global deaths and injuries from road traffic accidents” – is not yet in sight, despite a pronounced reduction until 2010. There are some marked regional differences between and within countries. Further disaggregation of data will allow better analyses, but data are not always comparable or even available. Speeding, driver distraction, age, drunk driving, vehicle size, type of road and new mobility forms are important factors influencing trends in road safety.
Road safety
Introduction | Exploration | Transport | Air pollution • Greenhouse gas emissions • Traffic noise • Physical (in)activity • Road safety | Context | Summary
40

2007
160 000
140 000
120 000
100 000
80 000
60 000
40 000
20 000
02008 2009 2010 2011 2012 2014 2014 2015 2016 2017 2018
or latest available year
UNECE total
Rest of UNECE
North America
EU (incl. UK)+ EFTA
More than 110 000 people across the region die every year from road traffic injuriesThis represents an average of about 300 people dying each day from such injuries in the region. Traffic fatalities only show the tip of the iceberg. About 4.6 million people were injured in 2018 (41).
In general, traffic deaths are a major public health concern. Road traffic crashes cost most countries 3% of their GDP and lay a heavy burden on health systems.
Next to factors directly related to the crashes, fatality rates are influenced by access to health care, which differs considerably between and within coun tries. A longer distance to travel to health care is significantly associated with higher mortality in general and more specifically from trauma accidents (42–44).
Between 2007 and 2017, the total number of deaths in road traffic crashes decreased by almost 30% in the UNECE and WHO European region. This trend was particularly pronounced between 2007 and 2010, when an
average annual decrease of almost 9% was reported. Belarus is the only country where the number of people killed in road traffic has halved since 2010.
Looking at the road traffic death rate (i.e. road traffic deaths per million inhabitants) in the European region, 82 people died in road traffic crashes per million inhabitants in 2017 (46).
Three out of 56 countries managed to reduce their road traffic death rate by more than 50% between 2010 and 2018, namely Belarus, Norway and Montenegro.
What we know
Source: Based on UNECE (41).
Number of deaths due to road traffic
41
Introduction | Exploration | Transport | Air pollution • Greenhouse gas emissions • Traffic noise • Physical (in)activity • Road safety | Context | Summary
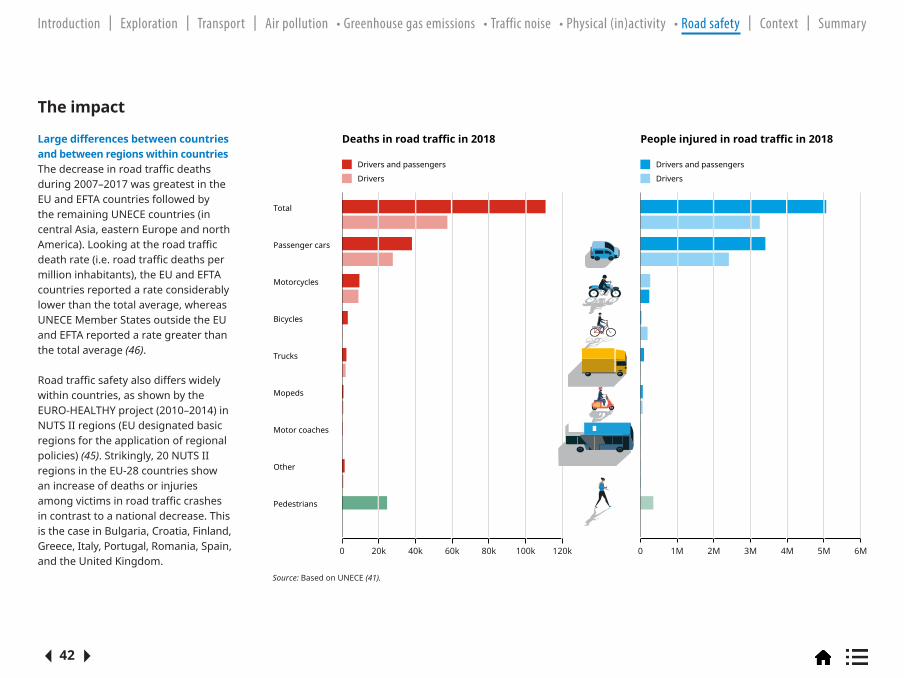
Large differences between countries and between regions within countries The decrease in road traffic deaths during 2007–2017 was greatest in the EU and EFTA countries followed by the remaining UNECE countries (in central Asia, eastern Europe and north America). Looking at the road traffic death rate (i.e. road traffic deaths per million inhabitants), the EU and EFTA countries reported a rate considerably lower than the total average, whereas UNECE Member States outside the EU and EFTA reported a rate greater than the total average (46).
Road traffic safety also differs widely within countries, as shown by the EURO-HEALTHY project (2010–2014) in NUTS II regions (EU designated basic regions for the application of regional policies) (45). Strikingly, 20 NUTS II regions in the EU-28 countries show an increase of deaths or injuries among victims in road traffic crashes in contrast to a national decrease. This is the case in Bulgaria, Croatia, Finland, Greece, Italy, Portugal, Romania, Spain, and the United Kingdom.
The impact
Source: Based on UNECE (41).
Deaths in road traffic in 2018 People injured in road traffic in 2018
Total
Passenger cars
Motorcycles
Bicycles
Trucks
Mopeds
Motor coaches
Other
Pedestrians
0 20k 40k 60k 80k 100k 120k 0 1M 2M 3M 4M 5M 6M
Drivers and passengers
Drivers
Drivers and passengers
Drivers
42
Introduction | Exploration | Transport | Air pollution • Greenhouse gas emissions • Traffic noise • Physical (in)activity • Road safety | Context | Summary

The SDG target to halve road traffic deaths and injuries by 2020 is not yet in sight In August 2020, the United Nations General Assembly, recognizing the lack of progress towards the original 2020 target, adopted a new resolution, extending the objective of SDG 3.6 of a 50% reduction in road traffic deaths and injuries until 2030.
Road traffic injuries do not affect everyone equallyRoad traffic injuries and related deaths are a major public health risk, unevenly distributed among and within countries in the UNECE and WHO European region. Income, age and sex affect road traffic death rates. Despite decreasing trends, significant inequalities by age and sex persist. Systematic equity-sensitive monitoring and reporting of road traffic deaths and injuries is needed from all countries in order to allow a more accurate assess ment of inequalities. Average mortality rates in low- and middle-income countries are more than twice as high as those in high-income countries; the rate decreased in most EU countries during 1999–
2001 and 2011–2013, but it has increased in many eastern European countries (45).
Men get killed and injured more often than women in all UNECE Member States (41, 47).The number of car drivers and passengers killed and injured in road traffic, is declining over time (41, 48). In contrast, the number of pedestrians killed or injured is not declining. The number of young people killed in road traffic crashes has strongly declined since 2010, but worldwide, road traffic continues to be the number one killer of children and youngsters (47, 48). Senior citizens are increasingly at risk from road traffic (48).
More harmonized data neededThe data availability in the EU for road traffic deaths is good, which is linked to EU policy development over the years requiring monitoring data at subnational level. However, this is not the case for the whole UNECE and WHO European region. Also, there are major gaps in injury data, and no standar dization of injury definitions across the region.
While almost all countries report the totals of deaths and injured persons, not all countries report the full disaggregation of these data into the detailed categories, such as type of road user, age and gender of victim, road conditions, time of day and year, and type of accident. It is important that countries provide the widest possible disaggregation of data in line with international reporting.
Explaining road safety trends, seen in the figures for road deaths by user group, requires exposure data. Looking at vulnerable road users (pedestrians, bicycle and motorcycle users), for example, exposure data would include the number of trips or distance travelled on foot or by bicycle. The emergence of new modes of transport such as e-scooters must also be considered.
Lack of data limits analysis and effective policy-makingChanges in exposure as a result of decreasing activity, for instance fewer pedestrians taking a walk, may explain a reduction in road deaths rather than a reduction in risk. This may be the
case, for example, for young pedes-trians. Data from several countries indicate that young people walk less than previous generations.
Inadequate disaggregation of data can limit analysis, particularly in relation to emerging modes of transport. The lack of standardized exposure data hinders more in-depth analysis of trends across countries.
What are we facing?
43
Introduction | Exploration | Transport | Air pollution • Greenhouse gas emissions • Traffic noise • Physical (in)activity • Road safety | Context | Summary

Source: Based on UNECE (41).
deathsinjured
10–14 years6–9 years<6 years 15–17 years 18–20 years 21–24 years 25–64 years 65+ years Unknown
Drivers and passengers
Pedestrians
?
Road users Age category
320
17 057
91 3541
494 493 679 1218 234717 177
7542376
49 070
13 723
54 57168 567
83 528
162 442 902 059 165 470
14 751
122 120 151 2563137
288343
12 083 7794 6074 9456
69 293
35 673
1467216
Number of deaths or people injured in road traffic crashes (by age category)
44
Introduction | Exploration | Transport | Air pollution • Greenhouse gas emissions • Traffic noise • Physical (in)activity • Road safety | Context | Summary

Safe systems approachRoad traffic injuries and deaths are preventable. UNECE, WHO and the European Commission all recommend Member States adopt a safe systems approach to road safety. A safe systems approach recognizes two key principles: (1) that the human body is fragile and highly vulnerable to injury, and (2) that humans, being fallible, make mistakes.
A safe system is one where a set of complementary interventions, to create safer roads, safer vehicles, safer speeds and safer behaviour by road users, work together to accommodate the road safety consequences of human error, preventing death and injury from occurring in the first place. Safe systems approaches to road safety are gaining political and technical traction across the UNECE and WHO European region.
To effectively address the problem of road traffic deaths and injuries following the safe systems approach, WHO produced the technical package Save LIVES, an evidence-based inven-tory of six strategies and 22 priority interventions to be implemented in an integrated manner.
Perspective on solutions
Source: Reproduced from WHO (49).
Component Interventions
Speedmanagement
• Establish and enforce speed limit laws nationwide, locally and in cities
• Build or modify roads which calm traffic (e.g. roundabouts, road narrowing, speed bumps, chicanes and rumble strips)
• Require car makers to install new technologies, such as intelligent speed adaptation, to help drivers keep to speed limits
Leadership onroad safety
• Create an agency to spearhead road safety• Develop and fund a road safety strategy• Evaluate the impact of road safety strategies
• Monitor road safety by strengthening data systems• Raise awareness and public support through
education and campaigns
Infrastructuredesign andimprovement
• Provide safe infrastructure for all road users including sidewalks, safe crossings, refuges, overpasses and underpasses
• Put in place bicycle and motorcycle lanes• Make the sides of roads safer by using clear
zones, collapsible structures or barriers• Design safer intersections
• Separate access roads from through-roads• Prioritize people by putting in place vehicle-free
zones• Restrict traffic and speed in residential,
commercial and school zones• Provide better, safer routes for public transport
Vehicle safetystandards
Establish and enforce motor vehicle safety standard regulations related to:• seat-belts• seat-belt anchorages• frontal impact• side impact
• electronic stability control• pedestrian protection• ISOFIX child restraint points
Establish and enforce regulations on motorcycle anti-lock braking and daytime running lights
Enforcement oftraffic laws
Establish and enforce laws at national, local and city levels on:• drinking and driving• motorcycle helmets
• seat-belts• child restraints
Survival aftera crash
• Develop organized and integrated prehospital and facility-based emergency care systems
• Train those who respond to crashes in basic emergency care
• Promote community first responder training
Save LIVES: a road safety technical package
45
Introduction | Exploration | Transport | Air pollution • Greenhouse gas emissions • Traffic noise • Physical (in)activity • Road safety | Context | Summary
Important drivers for the ongoing growth in motorized transport include economic factors (e.g. work patterns, increase in distribution of goods by road); urbanization; distance to work and services; social factors; geographi-cal conditions (e.g. climate, hilly or mountainous areas, distance between cities); demographics; availability of safe, accessible and affordable public transport; and cultural norms and individual preferences. These factors also explain the variety in road transport challenges across the UNECE and WHO European region. While the share of public transport is under pressure due to the COVID-19 pandemic, there are promising new developments, like the introduction in electric vehicles, new digital services and an increase in cycling and walking for short trips, favouring multimodal mobility.
Context: drivers for change
46
Introduction | Exploration | Transport | Air pollution • Greenhouse gas emissions • Traffic noise • Physical (in)activity • Road safety | Context | Summary
46

Despite the progress made, our current system of transport and mobility is not sustainable. By the year 2050, there will be an anticipated two billion vehicles worldwide. The number of cars is also growing in the UNECE and WHO European region. Individual transport by conventional fuelled cars remains by far the main
mode of transport across the region. In many countries, road transport is the cause of environmental, social and health challenges. The region differs widely in economic status, population density, climate and geographical conditions, as well as sociocultural aspects. There are differences in transport challenges, as well as in
drivers and approaches to solutions. These differences must be understood in order to develop sustainable solutions for transport challenges at local, regional, national and interna-tional levels. There is no one solution that fits all. By understanding the differences, each country can develop better tailor-made solutions.
Modal shares differ between countries, between cities and within cities, as shown in the section on transport. In cities with a dense public transport network and a safe cycling network, people cycle and walk more than the national average.
Building blocks for policies, strategies and solutions
Factors affectingregional transport
Economic status
Population density
ClimateGeographical conditions
Sociocultural aspects
47
Introduction | Exploration | Transport | Air pollution • Greenhouse gas emissions • Traffic noise • Physical (in)activity • Road safety | Context | Summary

Age of vehicle fleetGenerally, UNECE countries with lower GDP per capita report higher shares of older vehicles. Changes in the reported age composition of passenger car fleets in UNECE countries over the past decade show a general trend of aging vehicle fleets. This slower rate of vehicle fleet renewal is likely to have a negative impact on the short- to medium-term effectiveness of trans-port policies aiming to improve road safety or lowering vehicle emissions.
While several countries (Belgium, Denmark, Ireland and Luxembourg) report that over 40% of passenger cars are five years old or less, in over a quarter of reporting countries (nine) vehicles of this age make up less than 10%. In 21 of the 35 reporting coun-tries, over 50% of passenger cars registered are more than 10 years old, with Latvia, Lithuania, Montenegro, North Macedonia and the Republic of Moldova reporting that over three quarters are over a decade old. The differences between countries can be attributed to the economic well-being of residents and affordability of new vehicles, as well as policy decisions on vehicle fleet renewal (50). Countries
with higher GDP tend to report lower shares of both passenger and goods vehicles of more than 10 years old in their fleets. With new regulations, the pollutants emitted and the noise produced by new vehicles has decreased. Consequently, having an older vehicle fleet implies a bigger challenge to the transition to clean and healthy transport and mobility.
Note: 2015 data for Romania and Russian Federation. 2016 data for Austria, Denmark, Italy, Liechtenstein, Luxembourg, Portugal and Sweden. 10–20 year age group refers to greater than 10 years for Azerbaijan, Czechia, France, North Macedonia, Ireland, Italy, Luxembourg, Republic of Moldova, Romania, Russian Federation.
Source: Reproduced from UNECE (50).
Share of passenger car fleet by vehicle age category and country, 2017 or most recent year
0.0 0.2 0.4 0.6 0.8 1.0
AzerbaijanBosnia and Herzegovina
North MacedoniaMoldova, Republic of
LithuaniaMontenegro
RomaniaCyprusPolandEstoniaCroatiaFinland
HungaryMalta
PortugalSlovenia
ItalySpain
TurkeyCzechiaNorway
SwitzerlandFrance
GermanyLiechtensteinNetherlands
United KingdomRussian Federation
AustriaSwedenBelgium
LuxembourgDenmark
Ireland
<2 years 2–5 years 5–10 years 10–20 years >20 years
48
Introduction | Exploration | Transport | Air pollution • Greenhouse gas emissions • Traffic noise • Physical (in)activity • Road safety | Context | Summary

CongestionPetrol- and diesel-powered cars, vans and buses create noise and contribute massively to airborne concentrations of particulate matter, NOX, greenhouse gases and ground-level ozone. Our contemporary dependency on cars in cities contributes to division of commu-nities by roads, sedentary behaviour and less social interaction. Moreover, there is the problem of increased congestion. According to INRIX in the 10 most congested cities in Europe in 2019, average traffic speed ranged from 12.9 km/h to 24 km/h (51). A similar ranking compiled by TomTom for 2019 shows that congestion levels in Europe decreased only in 30 out of 239 cities, as compared to 2018 (52). In 2020, congestion levels decreased in many cities, due to the COVID-19 measures.
Helsinki,Finland
↓ 1%p19%
Brussels,Belgium
↑ 1%p38%
Congestion level in 2019
Increase since 2018
Saint Petersburg,Russian Federation
49% ↑ 2%p
Kyiv,Ukraine
53% ↑ 7%p
Paris,France
39% ↑ 3%p
London,United Kingdom
↑ 1%p38%
Lisbon,Portugal
↑ 1%p33%
Vienna,Austria
↑ 1%p28%
Oslo,Norway
↑ 1%p22%
Sofia,Bulgaria
↑ 1%p36%
Source: Adapted from TomTom (52).
Congestion levels in cities in 2019
49
Introduction | Exploration | Transport | Air pollution • Greenhouse gas emissions • Traffic noise • Physical (in)activity • Road safety | Context | Summary

Costs and benefits of road transportThe external costs of road transport are not reflected in current market prices in the road transport sector. The total bill for traffic congestion, pollution and accidents is very high. For example, it has been estimated at €502 billion per year for EU countries alone (53). The European Commission revised its calculations of the societal and environmental impacts of transport in 2019. The total external environmental costs of transport (linked to green-house gas emissions, local air pollution, noise, energy production, habitat damage), as well as the costs of congestion and crashes in the EU add up to almost €1 trillion annually. Road transport causes more than 80% of
such external costs (approximately €620 billion caused by passengers and €200 billion by freight), including road crash costs (some €280 billion), congestion costs (some €270 billion) and environmental costs (some €270 billion) (54, 55). This will be higher for the UNECE and WHO European region. Replacing passenger-car-kilometres by cycling reduces fuel consumption, as well as emissions of greenhouse gases, air pollutants and noise. Doubling the current rate of cycling will reduce greenhouse gas emissions by 8 million tonnes of CO2 , yielding €1.1 billion in indirect economic benefits per year (56, 57). It also helps in reducing traffic-related deaths and injuries. Using Organisation for Economic
Co-operation and Development (OECD) data on car crash fatalities, EU injury estimates, and casualty-related costs from the WHO-HEAT tool, the indirect economic benefit of avoiding car accidents (reduced fatalities and serious or slight injuries) by doubling the current level of cycling is estimated at €3.0 billion per year. Based on a German cost-benefit study, the indirect economic benefit of avoiding material damage from car accidents after doubling the current level of cycling in the region will amount to €4.9 billion per year (58).
A study looking at different transport scenarios after the COVID-19 lockdown in Italy estimates the social costs and
benefits of different policy choices (59). In the best-case scenario, where public transport would capture 33% of users and of the remaining journeys 38% would be made by car, 50% by cycling or e-cycling and 12% by foot, the study estimates net benefits of €20 billion per year. The benefits of a shift towards more active and public transport arise mainly from increased life expectancy, increased productivity and lower health-care costs. There is a strong basis for investing in and promoting walking and cycling in cities. Attention needs to be paid, though, to safe cycling infrastructure and the safe use of e-bikes, in order to prevent an increase in cycling accidents.
50
Introduction | Exploration | Transport | Air pollution • Greenhouse gas emissions • Traffic noise • Physical (in)activity • Road safety | Context | Summary

Linking spatial planning and clean and healthy transport systemsBehaviour is an important driver behind the choice of transport mode. Behaviours are influenced by cultural, social and physical environments. They can be the result of a conscious reflective process, but are mostly habitual, part of automatic processes. Social norms and people’s desire for convenient, comfortable, safe and fast transport is the main reason for the enormous increase in car use in recent decades. However, there is evidence that the average speed of cars in inner cities does not differ much from the average speed of public transport modes. In addition, ongoing social and demographic changes due to aging populations and immigration, as well as environmental changes due to expected increases in extreme weather events, mean cities must adapt. Plans for 21st century cities should link spatial planning and clean and sustainable transport systems. Such planning should include housing and infrastruc-ture, as well as green spaces, and adequate public transport that is accessible to all, including the poor, people with reduced mobility, children and the elderly.
Car dependency “by design”Often though, spatial planning is not well connected and coordinated with transport planning. This leads to increased transport demand and, when public transport services are poor, growth in private car dependency. The pattern of urban development over the past century has created a physical and social environment where dependence on car use has become the norm for accessing essential goods and services, as well as recreational opportunities. Urban sprawl and urban planning that favours shopping facilities in the urban periphery stimulate people to use their cars instead of other more sustainable options.
Poor quality public transport services, particularly in peri-urban and rural areas, reinforce socioeconomic disparities and exclusion, and encour-age car use. Cars, and related roads and parking space, use up a large amount of the already limited space in cities that could arguably be used for other purposes such as trees, parks and green public spaces. Such spaces are frequently in short supply in cities despite offering considerable benefits for climate adaptation,
recreation, social contacts and physical activity, and thus contributing to population health and well-being.
Important drivers for choice of transport mode
Economic
Urbanization
Distance to work and services
Social norms and behaviour
Geographic conditions
Demographics
Availability of safe, accessible and affordable public transport
Infrastructure
Available technology
Car
Bicycle
Public transport
By foot
Drivers for choices in transport modes and impacts
Source: Reproduced from Staatsen et al. (39).
51
Introduction | Exploration | Transport | Air pollution • Greenhouse gas emissions • Traffic noise • Physical (in)activity • Road safety | Context | Summary
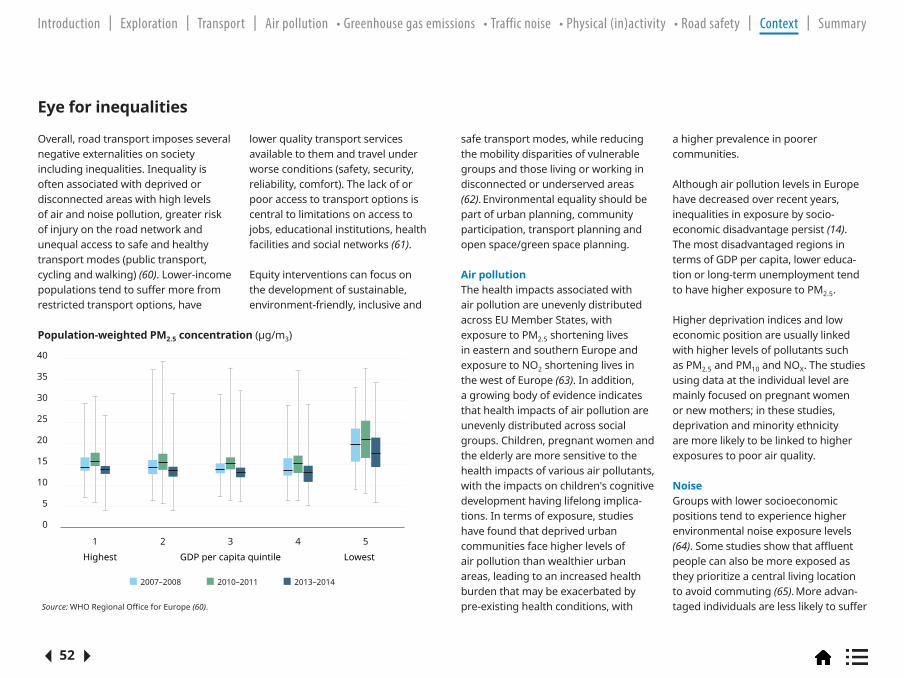
Overall, road transport imposes several negative externalities on society including inequalities. Inequality is often associated with deprived or disconnected areas with high levels of air and noise pollution, greater risk of injury on the road network and unequal access to safe and healthy transport modes (public transport, cycling and walking) (60). Lower-income populations tend to suffer more from restricted transport options, have
lower quality transport services available to them and travel under worse conditions (safety, security, reliability, comfort). The lack of or poor access to transport options is central to limitations on access to jobs, educational institutions, health facilities and social networks (61).
Equity interventions can focus on the development of sustainable, environment-friendly, inclusive and
safe transport modes, while reducing the mobility disparities of vulnerable groups and those living or working in disconnected or underserved areas (62). Environmental equality should be part of urban planning, community participation, transport planning and open space/green space planning.
Air pollutionThe health impacts associated with air pollution are unevenly distributed across EU Member States, with exposure to PM2.5 shortening lives in eastern and southern Europe and exposure to NO2 shortening lives in the west of Europe (63). In addition, a growing body of evidence indicates that health impacts of air pollution are unevenly distributed across social groups. Children, pregnant women and the elderly are more sensitive to the health impacts of various air pollutants, with the impacts on children's cognitive development having lifelong implica-tions. In terms of exposure, studies have found that deprived urban communities face higher levels of air pollution than wealthier urban areas, leading to an increased health burden that may be exacerbated by pre-existing health conditions, with
a higher prevalence in poorer communities.
Although air pollution levels in Europe have decreased over recent years, inequalities in exposure by socio-economic disadvantage persist (14). The most disadvantaged regions in terms of GDP per capita, lower educa-tion or long-term unemployment tend to have higher exposure to PM2.5.
Higher deprivation indices and low economic position are usually linked with higher levels of pollutants such as PM2.5 and PM10 and NOX. The studies using data at the individual level are mainly focused on pregnant women or new mothers; in these studies, deprivation and minority ethnicity are more likely to be linked to higher exposures to poor air quality.
NoiseGroups with lower socioeconomic positions tend to experience higher environmental noise exposure levels (64). Some studies show that affluent people can also be more exposed as they prioritize a central living location to avoid commuting (65). More advan-taged individuals are less likely to suffer
Eye for inequalities
40
2007–2008 2010–2011 2013–2014
35
30
25
20
15
10
5
0
1 2 3 4 5
Popu
latio
n-w
eigh
ted
PM2.
5 con
cent
ratio
n (μ
g/m
3 )
Highest GDP per capita quintile Lowest
Source: WHO Regional Office for Europe (60).
Population-weighted PM2.5 concentration (μg/m3)
52
Introduction | Exploration | Transport | Air pollution • Greenhouse gas emissions • Traffic noise • Physical (in)activity • Road safety | Context | Summary

from noise-related health impacts though, even if they live in noisier areas (66).
It is most likely that a combination of higher exposure, increased vulnera-bility and fewer resources results in more pronounced noise-related health impacts among socially disadvantaged people.
Road traffic injuriesThe average road traffic mortality rates have declined in the region, but the mortality rates in low- and middle-income countries are more than twice as high as those in high-income countries.
Child mortality rates from road traffic injuries also declined in the region between 2000 and 2015; however, the mortality gap has widened between low- and middle-income countries and high-income ones (67). Within-country studies also indicate inequalities in road traffic injuries for those living in less well-off areas.
53
Introduction | Exploration | Transport | Air pollution • Greenhouse gas emissions • Traffic noise • Physical (in)activity • Road safety | Context | Summary

A temporary drop in air pollution, less noise on the streets, the rediscovery of walking and cycling – these are just some of the early positive effects on traffic of the COVID-19 pandemic, despite its devastating impact.
The restrictions imposed on people’s movement (working from home, limiting measures in public tran sport, physical distancing in public spaces) rela ted to COVID-19 directly impacted traffic and the use of all forms of transport.
Increases in the sales of e-bikes across Europe and data from mobility reports suggest that bicycle use has increased since the COVID-19 outbreak and is higher than before the crisis. This trend is being reinforced by the COVID-19 physical distancing measures in cities in almost all countries. To create distance and facilitate active and safe transport in some cities, walking paths have been widened, cyclists moved on to major roads or separate cycling paths and car traffic limited. These interventions mean that there is currently less space for cars within cities. These changes in travel behaviour may be temporary.
Still, about 20% of the respondents from a mobility panel in the Nether-lands think they will eventually spend more time walking and cycling than before the crisis (69).
It is expected that after the pandemic people will continue teleworking for some days of the week, as surveys among companies and employees indicate. Not all people are able to work at home though and, depending on type of work and income, are depend-ent on public transport. For low-income groups and people in rural areas, a change in modal share is more difficult to achieve than for higher-income groups and people living in urban areas.
COVID-19 might accelerate the process towards healthy and sustainable transport and urban planning. On the other hand, the economic crisis may hamper investments in healthy and sustainable transport. The COVID-19 pandemic has done severe damage to the economies of the region and has exasperated social inequality by increasing the socioeconomic divide in many countries (70). It has also created some short-term benefits in terms of reduced air and noise
pollution and increased attention to promoting and providing for active mobility solutions.
However, it is also true that people have been encouraged to get back into their cars for their commute as the common perception has been that public transport was less safe (although this has yet to be proven). This creates the need for increased investment in public transport to match new require-
ments. The COVID-19 pandemic has led to significant changes in the patterns of work, education and recreation, and to changes in transport behaviour and demand. This should be taken into account when developing new tran sport policies.
Impacts of COVID-19 on transport and policies
-80%
-60%
-40%
-20%
0%
Lithuania Poland France Germany Netherlands
17 Feb, 2020
30 Apr 19 Jun 8 Aug 27 Sep 16 Nov 5 Jan 16 Feb, 2021
Source: Reproduced from Our World in Data (68).
Changes in use of public transport as a consequence of COVID-19
54
Introduction | Exploration | Transport | Air pollution • Greenhouse gas emissions • Traffic noise • Physical (in)activity • Road safety | Context | Summary

A joint point of reference on transport, health and environmentHow healthy and environmentally friendly is our transport today?
1. This eMagazine highlights key facts and figures to provide a solid base for support of the Member States of the UNECE and WHO European region in their efforts in advancing the transport systems in their own countries for the better and to accelerate the transformation towards sustainable transport and mobility, building forward based upon an “Avoid-Shift-Improve” strategy in mobility and transport policies.
2. Despite the technological progress made, the current transport system and mobility patterns remain unsustainable. Traffic is still the source of several challenges in many countries, while mobility and transport play an essential role in our societies and economies. The sector provides access to jobs, education, services, amenities and leisure, while contributing to economic growth, employment and trade. At the same time, it has
a growing impact on the environ-ment and human health.
3. THE PEP builds its objectives, strate gies and actions on the latest-available scientific evidence and data, analysing and highlight-ing the current state of mobility- and transport-related environ - mental and health impacts in the region. This information should serve as a starting point for the further trans formation of the sector towards zero emissions, health promoting mobility, and safe and efficient tran sport in the decade to come. There is an urgent need for this information, as the global increases in population, overall welfare and trade are expec ted to induce growing volumes of transport and mobility.
4. Across the UNECE and WHO European region, motorized vehicles continue to play a signifi-cant role in transport. Considerable differences exist across the region but also between urban areas, where the share of trips carried out by walking, cycling and in public transport is increasing; and rural
areas, where the car is still domi-nant and, all too often, no multi-modal mobility option is provided.
5. Due to the COVID-19 pandemic contrasting trends are observed. On the one hand, rapid integration of new digital services may lead to less transport, and the modal share of active mobility has increased. On the other hand, public transport has come under pressure and suffered significant decreases in passenger numbers and modal share.
6. Traffic-related air pollution, noise and road traffic accidents signifi-cantly contribute to the disease burden in the region, with a disproportionate burden in certain geographic areas and among less affluent groups of society. Cars and related infrastructure, such as park - ing spaces, use up a large amount of the already very limited space that is available in urban areas.
7. Emissions of the main air pollutants have declined in recent decades, resulting in generally improved air quality. However, a large
proportion of the European urban population remains exposed to levels of air pollution that exceed WHO Air Quality Guidelines. This makes air pollution the single largest environmental risk in Europe. For the whole of the WHO European Region, WHO estimates that 509 000 premature deaths per year are attributable to ambient air pollution, measured as particulate matter of 2.5 microns or less in aerodynamic diameter (PM2.5) in 2016. Another pollutant of concern typically associated with vehicle exhaust emissions is nitrogen dioxide (NO2). The EEA estimates that 417 000 premature deaths and 4.8 million years of life lost are attributable every year to PM2.5, while 55 000 premature deaths and 624 000 years of life lost are attributable to NO2, based on data from 2018 covering 41 countries. Policies to address transport-relat-ed air pollution should focus not only on limiting exhaust emissions, but also on reducing non-exhaust emissions (such as tyre and brake abrasion), which are also a signifi-cant cause of air pollution mostly through the production of particles.
Summary
55
Introduction | Exploration | Transport | Air pollution • Greenhouse gas emissions • Traffic noise • Physical (in)activity • Road safety | Context | Summary

8. At least 20% of the inhabitants of the UNECE and WHO European region live in areas with road traffic noise levels that are harmful to health. In urban areas in most countries, this figure exceeds 50%.
9. More than 110 000 people die on the road every year in the UNECE and WHO European region. On average, this means that one person dies every five minutes. Millions more are seriously injured in road accidents. Road traffic injuries are the number one cause of death globally among young people (aged 5–29 years).
10. Road transport is responsible for
about a quarter of energy-related greenhouse gas emissions, thus contributing to climate change and global temperature rise.
11. Car dependency, restricted use of public space and lack of safety for cyclists and pedestrians contribute to physical inactivity and to a sedentary lifestyle, which increases the risk of noncommunicable diseases and obesity. Physical inactivity is estimated to cause
about 1 million deaths each year in the WHO European Region alone. However, physical activity such as cycling and walking has very important health benefits.
12. The external costs of road transport are not reflected in current market prices. The total bill for traffic congestion, pollution and accidents, for example, has been estimated at €502 billion per year for EU Member States alone. The benefits of a shift towards more active mobility and public transport arise mainly from increased life expec-tancy, increased productivity and lower health-care costs related to noncommunicable diseases. This shows a strong case for investing in and promoting walking and cycling in cities and beyond.
13. Inequalities related to transport and urban sprawl can be found in exposure levels and negative health impacts from air pollution, noise and road safety hazards. Further - more, the benefits from transport are also unequally distributed. Not all socioeconomic groups have equal access to healthy transporta-
tion, public transport networks and recrea tional or green areas.
14. The conditions and circumstances in which people live determine their state of health and level of physical activity. The settings in which people live (cities, workplaces, schools, etc.) should make healthy choices the easiest ones; active transport (walking and cycling) in this case.
15. Countries differ in economic and sociocultural circumstances, population density, local climate, geography and topography. These differences need to be taken into account when developing tailor-made approaches and solutions to the challenges posed by transport at regional, national and local levels.
16. To allow for an effective monitoring of the impacts of transport, harmonized data on transport, environment and health is crucial. There are significant gaps in data-availability and quality, which need to be filled for a better understanding and comparison of data between countries.
17. Transforming the transport and mobility sector requires a multi-disciplinary approach. Therefore, collaboration of decision-makers and experts in transport, environ-ment, health, spatial planning and economy is crucial when designing transport-related policies that deliver benefits to environment, health and climate simultaneously. Moreover, international, cross-sectoral and multi-level (countries, regions and cities) cooperation is needed to drive the change to sustainable, environmentally friendly and healthy transport.
This summary is draft annex I to the Vienna Declaration (71).
56
Introduction | Exploration | Transport | Air pollution • Greenhouse gas emissions • Traffic noise • Physical (in)activity • Road safety | Context | Summary

The authors would like to thank the following experts, policy-makers and practitioners for their contributions to this eMagazine. They have provided valuable ideas, contributed to gathering and analysing data, revised this eMagazine extensively, and/or actively participated in meetings. Their work is crucial in setting the scene and paving the way forward for joint efforts to transform the transport sector.
Acknowledgements
Peter BakkerAlexander Blackburn Matthias BraubachKonrad ClemensClaudia CostaFrancesco Dionori Vadim Donchenko Gleb EvgenevSoledad Justo GilKhatuna Gogaladze Ilse GosensDorota JarosinskaElise van KempenVladimir KendrovskiHanneke KruizeAna Gil Luciano Rob MaasMark MajorGražvydė Norkienė
Krzysztof OlendrzynskiEvrim Ozturk Jonathon PassmoreEulalia Peris Francesca RacioppiMatthias RinderknechtAlberto Martin-Pérez RodriguezVigdis Rønning Paul RuyssenaarsBranislava Matić SavićevićWim Swart Irena TaraškevičienėSara Gil TarragatoRobert ThalerGediminas Toleikis Andreas UnterstallerWanda Wendel-VosStephen Whiting Kremlin Wickramasinghe
57
Introduction | Exploration | Transport | Air pollution • Greenhouse gas emissions • Traffic noise • Physical (in)activity • Road safety | Context | Summary

(1) Global Mobility Report 2017: Tracking sector performance. Washington, DC: Sustainable Mobility for All; 2017 (https://www.sum4all.org/publications/global-mobility-report-2017, accessed 29 March 2021).
(2) Harms L, Kansen M. Cycling facts. The Hague: KiM Netherlands Institute for Transport Policy Analysis; 2018 (https://english.kimnet.nl/publications/publications/2018/04/06/cycling-facts, accessed 25 April 2021).
(3) Crozet C. Cars and space consumption: Rethinking the regulation of urban mobility. Discussion paper, International Transport Forum. Paris: OECD Publishing; 2020 (https://www.itf-oecd.org/sites/default/files/docs/cars-space-consumption-regulation-urban-mobility.pdf, accessed 29 March 2021).
(4) Passenger and freight transport demand in Europe. Indicator assessment [website]. Copenhagen: European Environment Agency; 2021 (https://www.eea.europa.eu/data-and-maps/indicators/passenger-and-freight-transport-demand/assessment-1, accessed 30 March 2021).
(5) UNECE Statistical Database [database]. Geneva: United Nations Economic Commission for Europe; 2021 (https://w3.unece.org/PXWeb/en, accessed 21 April 2021).
(6) EMTA Barometer of public transport in the European metropolitan areas 2020 – Based on 2018 data. In: European Metropolitan Transport Authorities [website]; 2020 (https://www.emta.com/spip.php?article267, accessed 21 April 2021).
(7) iNUA #9: Avoid-Shift-Improve. Eschborn: Deutsche Gesellschaft für Internationale Zusammenarbeit (GIZ); 2019 (https://www.transformative-mobility.org/publications/inua-9-avoid-shift-improve, accessed 21 April 2021).
(8) The first and last mile — the key to sustainable urban transport. Luxembourg: European Environment Agency; 2020 (https://www.eea.europa.eu//publications/the-first-and-last-mile, accessed 21 April 2021).
(9) How to build back better with a 15 min city? In: C40 Knowledge Hub [website]. Delaware: C40 Cities Climate Leadership Group; 2020 (https://www.c40knowledgehub.org/s/article/How-to-build-back-better-with-a-15-minute-city?language=en_US, accessed 21 April 2021).
(10) Bannon, E. Electric car models to triple in Europe by 2021 – market data. In: Transport & Environment [website]; 2019 (https://www.transportenvironment.org/press/electric-car-models-triple-europe-2021-–-market-data, accessed 21 April 2021).
(11) Explaining road transport emissions. A non-technical guide. Copenhagen: European Environment Agency; 2016 (https://www.eea.europa.eu/publications/explaining-road-transport-emissions, accessed 30 March 2021).
(12) Air quality in Europe – 2020 report. Copenhagen: European Environment Agency; 2020 (https://www.eea.europa.eu/publications/air-quality-in-europe-2020-report, accessed 30 March 2021).
(13) Air pollutant emissions data viewer (Gothenburg Protocol, LRTAP Convention). In: European Environment Agency [website]. Copenhagen: EEA; 2020 (https://www.eea.europa.eu/data-and-maps/dashboards/air-pollutant-emissions-data-view-er-3, accessed 30 March 2021).
(14) Fairburn J, Schüle SA, Dreger S, Karla Hilz L, Bolte G. Social inequalities in exposure to ambient air pollution: a systematic review in the WHO European Region. Int J Environ Res Public Health. 2019;16(17):3127 (https://doi.org/10.3390/ijer-ph16173127, accessed 20 March 2021).
(15) Health aspects of air pollution and review of EU policies: the REVIHAAP and HRAPIE projects. In: WHO Regional Office for Europe [website]; 2021 (https://www.euro.who.int/en/health-topics/environment-and-health/air-quality/activities/health-aspects-of-air-pollution-and-review-of-eu-policies-the-revihaap-and-hrapie-projects, accessed 30 March 2021).
(16) Burden of disease from ambient air pollution for 2016. Geneva: World Health Organization; 2018 (https://www.who.int/airpollution/data/AAP_BoD_results_May2018_final.pdf?ua=1, accessed 30 March 2021).
(17) Evaluating 15 years of transport and environmental policy integration. Copenhagen: European Environment Agency; 2015 (https://www.eea.europa.eu/publications/term-report-2015, accessed 30 March 2021).
(18) Annual European Union greenhouse gas inventory 1990–2018 and inventory report 2020. Copenhagen: European Environment Agency; 2020 (https://www.eea.europa.eu/publications/european-union-greenhouse-gas-inventory-2020, accessed 30 March 2021).
(19) Surface air temperature for 2020. In: Copernicus [website]. European Centre for Medium-Range Weather Forecasts (ECMWF); 2020 (https://climate.copernicus.eu/surface-air-tem-perature-december-2020, accessed 30 March 2020).
(20) Watts N, Amann M, Arnell N, Ayeb-Karlsson S, Belesova K, Berry H et al. The 2018 report of the Lancet Countdown on health and climate change: shaping the health of nations for centuries to come. Lancet. 2018;392(10163):2479–514 (https://doi.org/10.1016/S0140-6736(18)32594-7, accessed 30 March 2021).
(21) Greenhouse gas emissions from transport in Europe. Indicator assessment [website]. Copenhagen: European Environment Agency; 2020 (https://www.eea.europa.eu/data-and-maps/indicators/transport-emissions-of-greenhouse-gases-7/assessment, accessed 31 March 2021).
(22) Final energy consumption in Europe by mode of transport. Indicator assessment [website]. Copenhagen: European Environment Agency; 2019 (https://www.eea.europa.eu/data-and-maps/indicators/transport-final-energy-consumption-by-mode/assessment-10, accessed 31 March 2021).
(23) Feyen L, Ciscar Martinez J, Gosling S, Ibarreta Ruiz D, Soria Ramirez A, Dosio A et al. Climate change impacts and adaptation in Europe. Luxembourg: Publications Office of the European Union; 2020 (https://doi.org/10.2760/171121, accessed 12 April 2021).
(24) Plans & actions. In: Covenant of Mayors for Climate & Energy EUROPE [website]. 2021 (https://www.covenantofmayors.eu/plans-and-actions/action-plans.html, accessed 31 March 2021).
(25) Environmental Noise Guidelines for the European Region. Copenhagen: WHO Regional Office for Europe; 2018 (https://www.euro.who.int/en/publications/abstracts/environmental-noise-guidelines-for-the-european-region-2018, accessed 31 March 2021).
References
58
Introduction | Exploration | Transport | Air pollution • Greenhouse gas emissions • Traffic noise • Physical (in)activity • Road safety | Context | Summary

(26) Environmental health inequalities in Europe. Second assessment report. Copenhagen: WHO Regional Office for Europe; 2019 (https://www.euro.who.int/en/publications/abstracts/environmental-health-inequalities-in-europe.-second-assessment-report-2019, accessed 31 March 2021).
(27) Environmental noise in Europe – 2020. Copenhagen: European Environment Agency; 2020 (https://www.eea.europa.eu/publications/environmental-noise-in-europe, accessed 31 March 2021).
(28) Peeters B, Nusselder R. Overview of critical noise values in the European Region. European Network of the Heads of Environment Protection Agencies (EPA Network); 2019 (https://mp.nl/sites/default/files/publications/IG%20Noise_Critical%20noise%20values%20in%20EU.pdf, accessed 31 March 2021).
(29) Brown L & Van Kamp I. WHO Environmental Noise Guidelines for the European Region: A Systematic Review of Transport Noise Interventions and Their Impacts on Health. Int J Environ Res Public Health. 2017;14(8):873 (https://doi.org/10.3390/ijerph14080873, accessed 21 April 2021).
(30) Physical activity. Key facts. Geneva: World Health Organization; 2020 (https://www.who.int/news-room/fact-sheets/detail/physical-activity, accessed 6 April 2021).
(31) WHO guidelines on physical activity and sedentary behaviour. Geneva: World Health Organization; 2020 (https://www.who.int/publications/i/item/9789240015128, accessed 6 April 2021).
(32) European Union and WHO Regional Office for Europe. Physical Activity Factsheets for the 28 European Union Member States of the WHO European Region. Copenhagen: WHO Regional Office for Europe; 2018 (https://www.euro.who.int/en/health-topics/disease-prevention/physical-activity/publications/2018/factsheets-on-health-enhancing-physical-activity-in-the-28-eu-member-states-of-the-who-european-region, accessed 6 April 2021).
(33) Special Eurobarometer 472: Sport and physical activity. In: EU open data portal [database]. Luxembourg: European Union; 2018 (https://data.europa.eu/euodp/en/data/dataset/S2164_88_4_472_ENG, accessed 6 April 2021).
(34) de Haas M, Hamersma M. Cycling facts: new insights. Netherlands Institute for Transport Policy Analysis (KiM); 2020 (https://english.kimnet.nl/publications/publications/2018/04/06/cycling-facts, accessed 6 April 2020).
(35) Childhood Obesity Surveillance Initiative (COSI): physical activity, screen time and sleep of children aged 6–9 in Europe. Copenhagen: WHO Regional Office for Europe; 2020 (https://www.euro.who.int/en/health-topics/disease-prevention/physical-activity/publications/2020/childhood-obesity-surveil-lance-initiative-cosi-physical-activity-habits-of-children-aged-6-9-in-the-who-european-region-2020, accessed 6 April 2021).
(36) Mueller N, Rojas-Rueda D, Cole-Hunter T, de Nazelle A, Dons E, Gerike R et al. Health impact assessment of active transporta-tion: a systematic review. Prev Med. 2015;76:103–1. (https://pubmed.ncbi.nlm.nih.gov/25900805/, accessed 6 April 2021).
(37) Fishman E, Schepers P, Kamphuis CBM. Dutch cycling: Quantifying the health and related economic benefits. Am J Public Health. 2015;105(8):e13–e5 (https://pubmed.ncbi.nlm.nih.gov/26066942/, accessed 6 April 2021).
(38) WHO guidelines on physical activity and sedentary behaviour. Geneva: World Health Organization; 2020 (https://www.who.int/publications/i/item/9789240015128, accessed 21 April 2021).
(39) Staatsen B, van der Vliet N, Kruize H, Hall L, Morris G, Bell R et al. Exploring triple-win solutions for living, moving and consuming that encourage behavioural change, protect the environment, promote health and health equity. Brussels: Inherit; 2017 (https://inherit.eu/baseline-review/, accessed 6 April 2021).
(40) Health economic assessment tool (HEAT) for walking and for cycling. Methods and user guide on physical activity, air pollution, injuries and carbon impact assessments. Copenhagen: WHO Regional Office for Europe; 2017 (https://www.euro.who.int/__data/assets/pdf_file/0010/352963/Heat.pdf, accessed 21 April 2021).
(41) UNECE Statistical Database [website]. Geneva: United Nations Economic Commission for Europe; 2021 (https://w3.unece.org/PXWeb2015/pxweb/en/STAT/STAT__40-TRTRANS__01-TRACCIDENTS, accessed 6 April 2021).
(42) Costa C, Tenedório JA, Santana P. Disparities in geographical access to hospitals in Portugal. Int J Geo-Inf. 2020;9(10):567 (https://doi.org/10.3390/ijgi9100567, accessed 6 April 2021).
(43) McCoy CE, Menchine M, Sampson S, Anderson C, Kahn C. Emergency medical services out-of-hospital scene and transport times and their association with mortality in trauma patients presenting to an urban Level I trauma center. Ann Emerg Med. 2013;61(2):167–74 (https://doi.org/10.1016/j.anne-mergmed.2012.08.026, accessed 6 April 2021).
(44) Clarke JR, Trooskin SZ, Doshi PJ, Greenwald L, Mode CJ. Time to laparotomy for intra-abdominal bleeding from trauma does affect survival for delays up to 90 minutes. J Trauma. 2002;52(3):420–5 (https://doi.org/10.1097/00005373-200203000-00002, accessed 6 April 2021).
(45) Atlas of population health in European Union regions. EURO-HEALTHY; 2017 (https://digitalis.uc.pt/pt-pt/livro/
atlas_population_health_european_union_regions, accessed 6 April 2021).
(46) Statistics of road traffic accidents in Europe and north America. Geneva: United Nations Economic Commission for Europe; 2019 (https://www.unece.org/fileadmin/DAM/trans/main/wp6/publications/2020_INLAND_TRANSPORT_STATISTICS.pdf, accessed 13 April 2021).
(47) Road traffic injuries factsheet. Geneva: World Health Organization; 2020 (https://www.who.int/news-room/fact-sheets/detail/road-traffic-injuries, accessed 6 April 2021).
(48) Road safety annual report 2020. Paris: International Transport Forum; 2020 (https://www.itf-oecd.org/road-safety-annual-report-2020, accessed 6 April 2021).
(49) Save LIVES – A road safety technical package. Geneva: World Health Organization; 2017 (https://www.who.int/publications/i/item/save-lives-a-road-safety-technical-package, accessed 6 April 2021).
(50) Assisting countries to monitor the Sustainable Development Goals: vehicle fleet age. Geneva: United Nations Economic Commission for Europe; 2019 (https://unece.org/DAM/trans/doc/2019/wp6/SDG_fleet_age_paper_FINAL.pdf, accessed 7 April 2021).
(51) INRIX 2019 Traffic Scorecard. INRIX; 2019 (https://inrix.com/scorecard/, accessed 7 April 2021).
(52) Traffic Index Ranking 2019. In: TomTom [website]; 2021 (https://www.tomtom.com/en_gb/traffic-index/ranking/, accessed 7 April 2021).
59
Introduction | Exploration | Transport | Air pollution • Greenhouse gas emissions • Traffic noise • Physical (in)activity • Road safety | Context | Summary

(53) van Essen H, Schroten A, Otten M, Sutter D, Schreyer C, Zandonella R et al. External costs of transport in Europe. Delft: CE Delft; 2011 (http://ecocalc-test.ecotransit.org/CE_Delft_4215_External_Costs_of_Transport_in_Europe_def.pdf, accessed 7 April 2021).
(54) Sustainable transport: Internalization of transport costs [website]. Brussels: European Commission; 2021. (https://ec.europa.eu/transport/themes/sustainable/internalisation-trans-port-external-costs_en; accessed 14 April 2021).
(55) Schroten A, van Essen H, van Wijngaarden L, Sutter D, Ella Andrew R. Sustainable Transport Infrastructure Charging and Internalization of Transport Externalities: Executive summary. Luxembourg: Publications Office of the European Union; 2019 (https://op.europa.eu/en/publication-detail/-/publication/0efedf2c-a386-11e9-9d01-01aa75ed71a1, accessed 24 April 2021).
(56) ForFITS Model: Assessing Future CO2 Emissions. Geneva: United Nations Economic Commission for Europe (www.unece.org/trans/theme_forfits.html, accessed 4 May 2021).
(57) Replogle M, Fulton L. Global High Shift Scenario: Impacts and Potential for More Public Transport, Walking, and Cycling with Lower Car Use. Intl J of Sustainable Transportation. 2014; 8 (https://trid.trb.org/view/1324903, accessed 25 April 2021).
(58) Röhling W, SchäferT. Kosten-Nutzen-Analyse: Bewertung der Effizienz von Radverkehrsmaßnahmen – Schlussbericht [Cost-benefit analysis: Assessment of the efficiency of cycling measures - final report]. Denzlingen: Transport Consulting International; 2008 (https://repository.difu.de/jspui/bitstream/difu/126264/3/DB0607-Schlussbericht.pdf, accessed 25 April 2021).
(59) Decisio. Social costs and benefits of post COVID-19 lockdown mobility scenarios in Italy. The Hague: Netherlands Enterprise Agency; 2020 (https://www.rvo.nl/sites/default/files/2020/11/Social-costs-and-benefits-of-post-COVID-19-lockdown-mobility-scenarios-in-Italy.pdf, accessed 7 April 2021).
(60) Environmental health inequalities in Europe. Second assessment report. Copenhagen: WHO Regional Office for Europe; 2019 (https://www.euro.who.int/en/publications/abstracts/environmental-health-inequalities-in-europe.-second-assessment-report-2019, accessed 7 April 2021).
(61) Income inequality, social inclusion and mobility: Synopsis. Paris: International Transport Forum; 2016 (https://www.itf-oecd.org/income-inequality-social-inclusion-and-mobility-synopsis/, accessed 7 April 2021).
(62) Environmental health inequalities resource package. A tool for understanding and reducing inequalities in environmental risk. Copenhagen: WHO Regional Office for Europe; 2019 (https://www.euro.who.int/en/health-topics/environment-and-health/health-impact-assessment/publications/2019/environmental-health-inequalities-resource-package, accessed 7 April 2021).
(63) Healthy environment, healthy lives: how the environment influences health and well-being in Europe. Copenhagen: European Environment Agency; 2020 (https://www.eea.europa.eu/publications/healthy-environment-healthy-livesv, accessed 7 April 2021).
(64) Dreger S, Schüle SA, Hilz LK, Bolte G. Social inequalities in environmental noise exposure: a review of evidence in the WHO European Region. Int J Environ Res Public Health. 2019;16(6):1011 (https://doi.org/10.3390/ijerph16061011, accessed 7 April 2021).
(65) Havard S, Reich BJ, Bean K, Chaix B. Social inequalities in residential exposure to road traffic noise: an environmental justice analysis based on the RECORD Cohort Study. Occup Environ Med. 2011;68:366–74 (https://doi.org/10.1136/oem.2010.060640, accessed 7 April 2021).
(66) Links between noise and air pollution and socioeconomic status. Science for Environment Policy. In-depth report 13. Brussels: European Commission; 2016 (https://ec.europa.eu/environment/integration/research/newsalert/pdf/air_noise_pol-lution_socioeconomic_status_links_IR13_en.pdf, accessed 7 April 2021).
(67) Sethi D, Aldridge E, Rakovac I, Makhija A. Worsening Inequalities in Child Injury Deaths in the WHO European Region. Int. J. Environ. Res. Public Health. 2017;14(10):1128 (https://doi.org/10.3390/ijerph14101128, accessed 25 April 2021).
(68) Our World in Data [website]. Google COVID-19 Community Mobility Reports; 2021 (https://ourworldindata.org/grapher/visitors-transit-covid?tab=chart&stackMode=absolute&time=earliest..latest&country=FRA%7EDEU%7ELTU%7ENLD%7EPOL®ion=World, accessed 8 April 2021).
(69) De Haas M, Faber R, Hamersma M. How COVID-19 and the Dutch ‘intelligent lockdown’ change activities, work and travel behaviour: Evidence from longitudinal data in the Netherlands. Transportation Research Interdisciplinary Perspectives; 2020 (https://doaj.org/article/d576514e5dcc47369b5ac5b9ff8454fa, accessed 14 April 2021).
(70) Task Force THE PEP. Recommendations for Green and Healthy Sustainable Transport – “Building Forward Better”; Geneva: United Nations; 2021(https://thepep.unece.org/sites/default/files/2021-04/2101940_E_PDF_WEB.pdf ,accessed 23 April 2021).
(71) Draft annex I to the Vienna Declaration. Key facts and figures on transport, health and environment. ECE/AC.21/2021/7/Rev.1 EUHP2018924/4.3.7/Rev.1, 2021. (https://thepep.unece.org/sites/default/files/2021-04/2104231E-1.pdf, accessed 28 April 2021).
60
Introduction | Exploration | Transport | Air pollution • Greenhouse gas emissions • Traffic noise • Physical (in)activity • Road safety | Context | Summary
eMagazineRoad transport facts and figures. How healthy and environmentally friendly is our transport today?
This eMagazine serves as a joint point of reference for the occasion of the Fifth High-level Meeting on Transport, Health and Environment in Vienna 17–18 May 2021.
The work took place under the auspices of the Bureau of the Transport, Health and Environment Pan-European Programme (THE PEP), a joint programme of the UNECE and WHO Regional Office for Europe. The Netherlands worked as lead country for this assignment, represented by the Dutch National Institute for Public Health and the Environment (RIVM) and the Ministry of Infrastructure and Water Management (IenW) in close cooperation with international experts and policy-makers from a wide variety of backgrounds.
© RIVM 2021. Parts of this publication may be used if cited as : Gerlofs-Nijland M, Staatsen B, Geelen L, Y Mulder et al. Road transport facts and figures. How healthy and environmentally friendly is our transport today. Bilthoven: RIVM, 2021.
Imprint
Editorial boardMiriam Gerlofs-Nijland, Brigit Staatsen, Loes Geelen, Yonne Mulder, Virginia Fuse, Nino Sharashidze, Nicholas Bonvoisin, Amy Kin Mee Choi and Mario Fruianu
Concept, layout and designVormVijf, The Hague
PhotographyMediatheek Rijksoverheid, unsplash.com, istock.com
Edition May 2021
Disclaimer: The designations employed and the presentation of the material in this publication do not imply the expression of any opinion whatsoever on the part of the World Health Organization (WHO), the United Nations Economic Commission for Europe (UNECE), the Dutch Ministry of Infrastructure and Waterworks (IenW) and the Dutch National Institute for Public health and the Environment (RIVM) concerning the legal status of any country, territory, city or area or of its authorities, or concerning the delimitation of its frontiers or boundaries. The mention of specific companies or of certain manufacturers’ products does not imply that they are endorsed or recommended by WHO and UNECE in preference to others of a similar nature that are not mentioned. Errors and omissions excepted, the names of proprietary products are distinguished by initial capital letters.
All reasonable precautions have been taken by WHO and UNECE to verify the information contained in this publication. However, the published material is being distributed without warranty of any kind, either expressed or implied. The responsibility for the interpretation and use of the material lies with the reader. In no event shall WHO, UNECE, IenW or RIVM be liable for damages arising from its use.
61
Introduction | Exploration | Transport | Air pollution • Greenhouse gas emissions • Traffic noise • Physical (in)activity • Road safety | Context | Summary

May 2021