Embed Size (px)
Citation preview

The Perception of Thai Consumers toward
Loose Candy (Lösgodis)
The Study of Product Selection for Thai Market
Advisor:
Tobias Eltebrandt
Examiner:
Ole Liljefors
Authors:
Nutnaree Chaisirivichien (861102)
Vuthi Tansomsakul (850721)
Mälardalen University Sweden School of Sustainable Development of Society and Technology
EFO705 Master Thesis, Spring 2011
June 1, 2011

1 | P a g e
ABSTRACT
Title: The Perception of Thai Consumer toward Loose Candy (Lösgodis)
The Study of Product Selection for Thai Market
Authors: Nutnaree Chaisirivichien-861102 Vuthi Tansomsakul-850721
[email protected] [email protected]
Advisor: Tobias Eltebrandt
Examiner: Ole Liljefors
Keywords: Confectionery market, Thai eating habit, Godis, Marketing mix, Food
Marketing, Product attributes, Consumer behavior, Consumer‟s perception,
and Sensory evaluation
Institution: Mälardalen University Sweden, School of Sustainable Development of
Society and Technology, Box 883, 721 23 Västerås
Course: Master Thesis in Business Administration, 15 ECTS-points, spring semester
2011
Problem: What are Thai consumers‟ perceptions toward sugar confectionery products,
which are sold as loose candy (lösgodis) in Sweden?
Purpose: The aim of this study is to identify and describe the perception of Thai
consumers toward sugar confectionery products with the concept of loose
candy (lösgodis) by putting an emphasis on the preferences of product features
and the choices of product as well as explore the similarities and differences of
each demographic and psychographic group.
Method: Method included a collection of information concerning theories. model and
confectionery market information from different sources; interview with the
candy store owner to figure out market insight as well as related information
and the survey with a sample of respondents in order to investigate their
perception and preferences of the sugar confectionery products. The retrieved
data was analyzed statistically and theoretically in accordance with the
conceptual framework.
Result: The findings indicated that the majority of Thai people like to consume candy.
By allowing consumers to perceive and evaluate candy features through
different senses, the result revealed that colorful soft gummy fruity flavors
candy with a shape of eatable product together with a uniquely stand-out
sweets smell are most preferable. After examining the similarities and
differences among the demographic and psychographic groups of consumer
regarding their perception and preferences of sugar confectionery products,
only minimal differences were found.

2 | P a g e
ACKNOWLEDGEMENT
We would like to express our gratitude to our advisor, Tobias Eltebrandt and Dr.
Sasithorn Phonkaew, for the guidance and cheerful support during our working
progress. We also appreciate the help of our opponents and friends and would
like to thank them for their useful advice and help.
We would like to dedicate this paper to our parents. We would like to express
additional appreciation to all respondents who spent their time to help us fill in
the survey.
We would like to thank our friends and relatives for their encouragement, care
and support.
____________________ ____________________
Nutnaree Chaisirivichien Vuthi Tansomsakul
Västerås, June 1, 2011

3 | P a g e
Table of Contents
Table of Figures ................................................................................................................................ 5
List of Tables .................................................................................................................................... 5
1. INTRODUCTION ..................................................................................................................... 1
1.1 Background ........................................................................................................................ 1
1.1.1 Confectionery Market ................................................................................................. 1
1.1.2 Loose Candy .............................................................................................................. 2
1.2 Problem Specification ........................................................................................................ 3
1.3 Strategic Question .............................................................................................................. 4
1.4 Research Question.............................................................................................................. 4
1.5 Purpose .............................................................................................................................. 4
1.6 Target Audience ................................................................................................................. 4
2. THEORETICAL FRAMEWORK .............................................................................................. 5
2.1 The Marketing Mix of Food Products ................................................................................. 5
2.1.1 Product ....................................................................................................................... 5
2.1.2 Price ........................................................................................................................... 6
2.1.3 Place (Distribution) .................................................................................................... 6
2.1.4 Promotion .................................................................................................................. 6
2.2 Consumer Behavior ............................................................................................................ 6
2.2.1 Consumer Perception .................................................................................................. 7
2.3 Conceptual framework ..................................................................................................... 10
3. METHODOLOGY .................................................................................................................. 12
3.1 Research Design............................................................................................................... 12
3.2 Choice of the topic and the study object............................................................................ 12
3.2.1 Choice of Topic ........................................................................................................ 12
3.2.2 Choice of Industry .................................................................................................... 13
3.2.3 Choice of Country .................................................................................................... 13
3.2.4 Choice of Respondents ............................................................................................. 13
3.3 Data Collection ................................................................................................................ 14
3.3.1 Literature Review ..................................................................................................... 15
3.3.2 Choice of Theories ................................................................................................... 15
3.3.3 Survey ...................................................................................................................... 16
3.3.4 Interview .................................................................................................................. 18
3.4 Data Analysis ................................................................................................................... 18
3.4.1 Survey ...................................................................................................................... 19

4 | P a g e
3.4.2 Interview .................................................................................................................. 21
3.5 Methodological Issues and Limitation .............................................................................. 21
3.6 Validity and Reliability .................................................................................................... 22
4. Empirical Data ......................................................................................................................... 23
4.1 Interview Summary .......................................................................................................... 23
4.1.1 Store Background ..................................................................................................... 23
4.1.2 Loose candy and other relevant factors ..................................................................... 24
4.2 Thailand‟s Confectionery Market ..................................................................................... 24
4.3 Thailand‟s Retailing Candy Chain, “aki-ko” ..................................................................... 25
4.4 Multi Sensory Experiences ............................................................................................... 25
4.5 Eating Healthier ............................................................................................................... 26
4.6 Top Flavors in Confectionery ........................................................................................... 27
4.7 Climate ............................................................................................................................ 28
4.8 Survey data ...................................................................................................................... 29
5. Analysis................................................................................................................................... 50
5.1 Concept of Loose Candy .................................................................................................. 50
5.2 Preferences of Product Features through Multi Sensory .................................................... 50
5.2.1 Taste ........................................................................................................................ 50
5.2.2 Texture ..................................................................................................................... 50
5.2.3 Shape and Color ....................................................................................................... 50
5.2.4 Smell ........................................................................................................................ 51
5.2.5 Package .................................................................................................................... 51
5.2.6 Brand ....................................................................................................................... 51
5.2.7 Place ........................................................................................................................ 51
5.3 Consumer Sensory Attribute ............................................................................................. 51
5.4 Segmentation ................................................................................................................... 52
5.4.1 Demographic ............................................................................................................ 52
5.4.2 Psychographic .......................................................................................................... 53
6. Conclusion .............................................................................................................................. 55
6.1 Managerial Implication .................................................................................................... 56
6.2 Suggestion for Future Research ........................................................................................ 57
REFERENCES................................................................................................................................... i
BIBLIOGRAPHY ............................................................................................................................ iv
APPENDIX ....................................................................................................................................... v
Appendix A – Draft Questionnaire..................................................................................................... v
Appendix B – Selected Loose Candy Sample List ........................................................................... viii

5 | P a g e
Appendix C – Interview Questions .................................................................................................... x
Appendix D – Survey Empirical Data from SPSS ............................................................................. xi
Table of Figures
FIGURE 1: PICTURE OF LOOSE CANDY (OWN PICTURES) ..................................................................... 2
FIGURE 2: INTERNATINAL PLANING PROCESS (INSPIRED BY CATEORA ET. AL., 2009, PP. 315) ..... 3
FIGURE 3: THE MARKETING MIX (OWN ILLUSTRATION) ...................................................................... 5
FIGURE 4: LENS MODEL (HAUSER, 1993) .................................................................................................. 7
FIGURE 5: CONCEPTUAL FRAMEWORK (OWN ILLUSTRATION) ........................................................ 10
FIGURE 6: PICTURE OF GOTT LAND (OWN PICTURES) ........................................................................ 23
FIGURE 7: TOP 20 FLAVORS IN NEW CONFECTIONERY PRODUCT INTRODUCTIONS, % OF ALL
PRODUCTS LAUNCHED IN 2004-2007 (RAITHATHA, 2008) ........................................................... 27
FIGURE 8: THE ANNUAL TEMPERATURE IN THAILAND AND SWEDEN (WEATHERONLINE LTD.,
2011) ..................................................................................................................................................... 28
List of Tables
TABLE 1: SUCCESSFUL RATE OF VALID RESPONDENTS ..................................................................... 29
TABLE 2: PROFILE OF RESPONDENTS IN THIS SURVEY ...................................................................... 29
TABLE 3: CANDY CONSUMPTION ........................................................................................................... 30
TABLE 4: PLACES TO BUY CANDY .......................................................................................................... 31
TABLE 5: DESCRIPTIVE STATISTIC OF PRODUCT FEATURES: 15 CANDY ........................................ 35
TABLE 6: TOP 3 CANDY BY EACH PRODUCT FEATURE ....................................................................... 36
TABLE 7: CORELLATIONS COEFFICIENT VALUE BETWEEN PRODUCT TASTE AND
RESPONDENT'S WILLINGNESS TO BUY ......................................................................................... 37
TABLE 8:CORELLATIONS COEFFICIENT VALUE BETWEEN PRODUCT TEXTURE AND
RESPONDENT'S WILLINGNESS TO BUY ......................................................................................... 38
TABLE 9: CORELLATIONS COEFFICIENT VALUE BETWEEN PRODUCT SHAPE AND
RESPONDENT'S WILLINGNESS TO BUY ......................................................................................... 38
TABLE 10: CORRELATIONS COEFFICIENT VALUE BETWEEN PRODUCT COLOR AND
RESPONDENT'S WILLINGNESS TO BUY ......................................................................................... 38
TABLE 11: CORRELATIONS COEFFICIENT VALUE BETWEEN PRODUCT SMELL AND
RESPONDENT'S WILLINGNESS TO BUY ......................................................................................... 38
TABLE 12: GENDERS AND BUYING INTENTION OF FRIED EGG ......................................................... 39
TABLE 13: GENDERS AND BUYING INTENTION OF RED METER ........................................................ 39
TABLE 14: GENDERS AND BUYING INTENTION OF CANDY CANE .................................................... 39
TABLE 15: GENDERS AND BUYING INTENTION OF JELLY BEAN....................................................... 39
TABLE 16: GENDERS AND BUYING INTENTION OF BLUE SHARK ..................................................... 39

6 | P a g e
TABLE 17: AGE GROUPS AND INTENTION TO BUY FRIED EGG .......................................................... 40
TABLE 18: AGE GROUPS AND INTENTION TO BUY RED METER ........................................................ 40
TABLE 19: AGE GROUPS AND INTENTION TO BUY CANDY CANE..................................................... 40
TABLE 20: AGE GROUPS AND INTENTION TO BUY JELLY BEAN ....................................................... 40
TABLE 21: AGE GROUPS AND INTENTION TO BUY BLUE SHARK...................................................... 41
TABLE 22: INCOME LEVELS AND INTENTION TO BUY FRIED EGG ................................................... 41
TABLE 23: INCOME LEVELS AND INTENTION TO BUY RED METER .................................................. 41
TABLE 24: INCOME LEVELS AND INTENTION TO BUY CANDY CANE .............................................. 42
TABLE 25: INCOME LEVELS AND INTENTION TO BUY JELLY BEAN................................................. 42
TABLE 26: INCOME LEVELS AND INTENTION TO BUY BLUE SHARK ............................................... 43
TABLE 27: LIFESTYLES AND INTENTION TO BUY RED METER .......................................................... 44
TABLE 28: ONE-WAY ANOVA - GENDER & TOP PRODUCT FEATURE PREFERENCE ....................... 44
TABLE 29: ONE-WAY ANOVA - INCOME/ALLOWANCE & TOP PRODUCT FEATURE PREFERNCE 45
TABLE 30: ONE-WAY ANOVA - GREEN LIFESTYLE & TOP PRODUCT FEATURE PREFERNCE ....... 46
TABLE 31: ONE-WAY ANOVA - HEALTHY LIFESTYLE & PRODUCT FEATURE PREFERENCE ........ 47
TABLE 32: ONE-WAY ANOVA - FASHION LIFESTYLE & PRODUCT FEATURE PREFERENCE ......... 47
TABLE 33: ONE-WAY ANOVA - TECHNOLOGY LIFESTYLE & PRODUCT FEATURE PREFERENCE 48
TABLE 18: DESCRIPTIVE STATISTIC OF CANDY FEATURES ............................................................... 49
TABLE 19: DESCRIPTIVE STATISTIC OF LOOSE CANDY CONCEPT .................................................... 49

1 | P a g e
1. INTRODUCTION
This chapter introduces the readers with the general overview of the research area followed
by the present of the problem specification as well as states the strategic question, the
research question and the purpose of the study. Later, the chapter concludes with the
indication of the target audience of this study.
1.1 Background
This section gives the reader some information regarding the industry background as well as
related topics.
1.1.1 Confectionery Market
Confectionery market is referring to the market of sweet, candy and other products in form of
confection. This market can be segmented into three different categories including;
chocolates, sugar confectionery and gum. The global confectionery market was worth 152
billion USD in the end of 2010. Business Insight (2011) forecasted the market to grow at a
CAGR (consolidated annual growth rate) of 3 percent from 2010 to 2014 reaching a value of
171.2 billion USD in 2014. The reasons behind the forecast growth of the industry were due
to the increase complexity in development market and rising demand in emerging markets.
(Business Insights, 2011, pp. 16,47)
Africa and the Middle East will have the fastest growing rate with a CAGR of about 3.8
percent during 2010 to 2014 followed closely by Asia-Pacific market at a CAGR rate of 3.7
percent and expecting to reach a value of 30 billion USD by 2014. The main factors driving
the growth of these markets are the raise of the disposable income of the growing middle
classes and the increase popularity of gifting confectionery during special occasions and
holidays. (Business Insights, 2011, pp. 47-49)
Thailand‟s confectionery market valued more than 10 billion THB or 3.3 million USD1 in
year 2008. Sugar confectionery contained the highest market share among the three
confectionery categories in Thailand with an estimation of 50 percent of the market. While
the rest of the market shares were equally distributed among chocolate and gum category at
25 percent each. (Thansettakij Co., Ltd., 2009)
The statistical report showed that the annual average confectionery consumption of each Thai
consumer was at 700 grams, which was lesser than some other countries such as the United
States, England, and Vietnam that consumed 12, 10 and 2 kilograms per person respectively.
However, rather than seeing the compound annual growth rate of 1 percent between 2004 and
2009 in Thai market as a relatively low rate, experts view it as an opportunity for potential
growth due to the level of maturity. Since there is more room for the unmature market like
Thailand to expand and the marketers to introduce new products to the consumers, this
market become more interesting and open to more opportunities than thoes in Europe or
America. (Thansettakij Co., Ltd., 2009; Datamonitor, 2010)
1
30.18 THB/ 1 USD as of May the 4th 2011 (Kasikornbank, 2011)

2 | P a g e
Sweden considered being one of the world largest sweet consumption compromising of a
large number of confectionery producers from both domestic and international (The Local,
2011). Leading Swedish candy manufacturer include Malaco (Leaf International), Cloetta
Fazer AB, Grahns‟ and many more. With a constant compound annual growth rate of 0.8
percent in Swedish confectionery market and an increasing competitors from both in and
outside of the country, pressuring the local producer to look for new opportunities just like
other international producers (Karamellkungen, 2011; Datamonitor, 2010).
1.1.2 Loose Candy
The concept of loose candy or „lösgodis‟ in Swedish is referred to the pick and mix candy
concept. Rather than pack in some kind of packages, the candies were loose and sit in some
kind of container. By being so, it allows the consumer to pick/scoop their own choice and
amount of candy from various boxes or containers of candy available in almost every
supermarket, candy store, gas station and kiosks all over Sweden (see Figure1). The price of
the candy is measured by the weight of the total amount of candy selected by the individual.
Since the concept was introduced in the 1980‟s, Swedish people started to consume more
candy. (Karamellkungen, 2011;The Local, 2011)
Figure 1: Picture of Loose candy (Own Pictures)
Candy or Godis is very popular in Sweden. Swedish people at all ages love candy and
Sweden also ranked as the highest candy consumption in the world with the annual average
consumption rate at about 17 kilograms per person and their consumption reach its peak
amount during Easter and Christmas holidays. Interestingly, non-chocolate candies such as
gummy candies with various shapes, colors and flavors are more popular than chocolate.
Within this category, some of the major Swedish producers and retailers claim that they have
more than 200 or even 300 different combinations of shape, flavor and style. This makes
having the right combination of candy and its availability the most important factors in the
business. (The Local, 2011; Karamellkungen, 2011; Optima Trade, 2011)
Many people are afraid of the additives in food but not in candy. In fact, the ingredients of
candy are a bigger problem than the addictives although all of them are tested and approved.
For example, Red raspberry boats and Ferrari cars candies get their color from dried bugs and
some other candies contain pig gelatin. Regarding the cleanliness of loose candy, it is
considered to be hygienic because of the dryness and the amount of sugar it contains. These
make it hard for bacteria or virus to survive. (The Local, 2011)

3 | P a g e
1.2 Problem Specification
When marketers decided to expand or venture into new international market, they require a
systematic and total commitment for that foreign market, the new way of performing and
operating tasks as well as the need to understand the consumer behavior of that country
(Cateora et al., 2009, p.9). Marketers who tried to operate in foreign country face a wide
range of unfamiliar problems and uncertainties, which require them to implement different
strategies necessary to encounter the situation. In order to do so, there is a need for marketers
to understand and be prepared of what lies ahead of them (Cateora et al., 2009, p.9).
Here in the case of this study, it is the international marketing task for Swedish candy
manufacturer who are interested in entering Thai market to deal with different levels of
uncertainty. These uncertainties are created by uncontrollable elements of all business
environments both domestic and internationally, consisting of those such as; competitive
forces, economic forces, cultural forces, etc. In order to deal with these uncertainties,
successful manager constructs a marketing program in which designed for optimal
adjustment to the potential customers and the uncertainties of the business climate. Marketers
are doing so by changing, adapting and blending their marketing mix to the changing
environmental factors as well as selecting the right product that will interest and attract
customers, which later on determine the outcomes of the marketing enterprise. (Cateora et al.,
2009, pp. 9-10).
As planning is an essential for the success of international marketing, Hult et al. (2007) gave
a guidelines and systematic procedures that are necessary for evaluating international
opportunities and risk as well as for developing strategic plans to take advantage of such
opportunities available. This process of the planning can be summarized in the following
sequences or phrase below:
Figure 2: Internatinal Planing Process (Inspired by Cateora et. al., 2009, pp. 315)
As recommended performing an initial in-depth study and screening of the potential country
and its market in first phrase, a more detail examination of the components of the marketing
mix as well as the customer behavior should be examined next. This is where this research is
lay upon since the authors see the potential in the Thai confectionery market.
Therefore, the purpose of phrase two is the reflection of the understanding of the target
customer by decided on the adjustment of the marketing mix that will cope with the cultural
constraints forced by the uncontrollable and the behavior of the consumer in the market in
order to achieve corporate objectives and goals (Cateora et al., 2009, pp.14,317- 316).
Phase 1: Preliminary Analysis and
Screening
• Matching compnany/countryneeds
Phase 2: Adapting the
Marketing Mix to Target Market
• Marketing mix requirement
Phase 3:Developing the Marketing Plan
• Marketing plan development
Phase 4:Implementation
and Control
• Implementatin, eveluation and control

4 | P a g e
In order to understand the consumers and their environment, it is important for the marketers
to understand how they think as well as how they receive and interpret things. As Engel et al.
(1986) had stated in his early study regarding consumer behavior that the process in which
stimulation, message or information were received, interpreted and translated into a response
is called perception process. As a result, if the marketers want customers to response to their
marketing plans and make their purchase it is important for them to understand this basic
perception process of the customers so that they are being about to select the right mix of
marketing elements for their customers.
1.3 Strategic Question
Given all the nuances associated with the importance of understanding and knowing the
target market as well as the consumers before initiate and implement a marketing plan into an
international environment, it is important for the marketing manager to answer the following
strategic question regarding:
What kind of product selection and other marketing elements should Swedish candy
manufacturers or candy retailers use when entering the Thai market?
1.4 Research Question
What are the Thai consumers’ preferences toward sugar confectionery products, which are
sold as loose candy (lösgodis) in Sweden?
1.5 Purpose
The aim of this study is to identify and describe the perception of Thai consumers toward
sugar confectionery products with the concept of loose candy (lösgodis) by putting an
emphasis on the preferences of product features and the choices of product. As the study tried
to identify the consumer‟s basic psychological and demographic background, it is able to
explore the similarities and differences in product preferences of each group of customers
that will allow candy manufacturers to categorize and be able to select the right products that
will appeal to the Thai consumers.
1.6 Target Audience
The study might be useful for both marketing managers of a company as well as marketing
students who are interested and seeking to understand Thai consumers‟ perception toward
confectionery products, especially loose candy (lösgodis). This report would be most
practical for candy manufacturers who have decided to enter the Thai market as well as the
existing companies or retailers in the market who strive for new opportunities, competitive
knowledge about product preferences of consumers and choice of product. They might
benefit from this research by adjusting their offering according to these customer groups‟
preferences.

5 | P a g e
2. THEORETICAL FRAMEWORK
This chapter covers concepts, theories and other interconnected academic frameworks that
are related and relevant to the area studied. The chapter begins with the description of the
marketing mix for food product, levels of product, consumer behavior, consumer perception
and its models and ends up with the conceptual framework. These theoretical frameworks
mentioned in this section will be mentioned and used in different parts throughout this paper.
2.1 The Marketing Mix of Food Products
Marketing mix is a set of controllable used by the marketers to influence their target
consumers. The elements of the marketing mix are the basic, tactical components of any
marketing plan. It is also known as the Four P's or the marketing mix elements including
price, place, product, and promotion. (Borden, 1964). As for food products including sugar
confectionary product, it is similar to other kinds of consuming products.
In general, food products involve both general marketing approaches and techniques that
applied the marketing of various kinds of products and services. Topics such as marketing,
segmentation, positioning, targeting, consumer research and market enter strategy are highly
relevant in food marketing. Food marketing also involves other kinds of challenges, for
example, the nature of food is that it has a perishable date and the quality as well as the
availability of food products varies among different types. Even though with the advanced
technological development on new processing and distribution options that were used to
provide consumer with convenience, the additional marketing, services, and processing are
still at a significantly higher costs for food marketers and firms than those other consumer
products. (Perner, 2008) Below is the description of each marketing mix with the concept of
food marketing.
Figure 3: The Marketing Mix (Own illustration)
2.1.1 Product
Product includes all features such as quality, appearance, packaging, brand, and conveniences
It is a part of the offering a company present to its customers (Borden, 1964). For food
marketing, firms usually invest in the product by using high quality ingredients in their
production or doing extensive research and development to improve it rather than adding a
new feature or function like other new consumer product development (Perner, 2008)

6 | P a g e
2.1.2 Price
Pricing is a specific price for a product or service offered. In a simplistic way, it refers to the
concept of price as the amount of money that customers have to pay to obtain the product.
Setting price is not simple because customers do not purely respond to the price but also the
value of the product being offer. (Borden, 1964). For the price on food marketing, some firms
compete on price while some other firms compete on other product features such as different
taste preferences for different segments or better product quality to charge higher prices
(Perner, 2008).
2.1.3 Place (Distribution)
Place or placement is those associated with channels of distribution that serve as the means
for getting the product to the target customers. (Borden, 1964). As for food, it is increasingly
being consumed away from home, food products are sold in a diversity of outlets various
from supermarkets to convenience stores to grocery stores to restaurants and
cafes. Supermarkets carry a broad assortment of food products that are generally offered at
lower prices. While certain convenience products such as beverages, candies and snacks are
being sold in a large number of outlets where consumers are willing to pay at a higher price
for their convenience and enjoyment. (Perner, 2008)
In developing countries, food is often sold in open markets or in small stores typically with
more local and fewer branded products available. In some European countries, many people
do not own cars, and thus smaller local shops may be visited frequently compared with larger
shops that are located outside the city central areas. (Perner, 2008)
2.1.4 Promotion
For food marketing, promotion involves many different marketing tools that marketers use to
make their customers buying more of their products. It includes advertising, coupons, in-store
price promotions, in-store demonstrations, or premiums. The consumption of some food
categories has been increasing in a large volume due to the heavy promotional campaign that
stimulates consumer demand. (Perner, 2008)
2.2 Consumer Behavior
Consumer behavior is the implication on the learning process of the people when selecting,
buying the products or services in order to fulfill their wants and needs. (Solomon, M., 2006)
Consumer behavior is different among various demographic groups. Consumer demographics
are an important factor used by marketers as a tool to divide and group different types of
people using variables such as age, gender, and occupation; by doing so they are able to
select their target consumers. These demographic characteristics should not be overlooked as
it adds value to the process of understanding consumers‟ behavior. (Evans, et.al, 2009, pp.
154-156) However, psychographics dimensions such as lifestyle, personality, and self-image
can also be use to explain consumer behavior in greater depth than the profiling approach of
demographics. Thus, it is best suit for marketers to use synergistic contributions of both
psychographics and demographics to understand the consumer in order that they will have the
right marketing activity for them. (Evans, et.al, 2009, p. 190)

7 | P a g e
2.2.1 Consumer Perception
As mentioned earlier in the introduction that from a consumer behavior point of view,
perception is the process where stimuli are received and interpreted by the individual then
translated into a response. In other words, marketer‟s message or offering is perceived,
interpreted and understood in the intended way during this process. (Engel et al., 1986)
Perception can also be defined as the process by which people select, organize and interpret
information to form a meaningful picture of the world (Kotler and Armstrong, 2008).
2.2.1.1 Consumer Perception of the Product
According to consumer behavior perspective, product perception is about how consumers
perceive a range of brands or product in order to build their personal mapping, which is how
consumers perceive the product in term of image relatively to other competing offerings. The
understanding of product perception helps marketers to position their own product or brand in
the mind of consumers. Marketers should emphasize on what kind of benefits the consumer is
looking for and how they perceive products and brands rather than thinking of what it is that
you are producing or selling. (Ries and Trout, 1986) Consumer‟s evaluations of the product‟s
value are partially drawn from the perception of the product quality as well as the perceptions
of price, product image and the brand itself. (Snoj, et al., 2004)
According to Lens Model in figure 4 below, it showed the concept that product features and
perceptions are interrelated as consumers see things through the lens of their perceptions and
their preferences are based on these perceptions. The product features are understood through
these perceptions. After perceiving of product features, consumers would select product
based on their preferences; this preferred product is called consumer‟s choice. Therefore, it
can be said that the choice of products depend upon consumer preferences. In addition, other
influences such as availability and perceived price can also influence the product that the
consumer will choose. (Hauser, 1993)
Figure 4: Lens Model (Hauser, 1993)
A number of studies on perceptions of product features stated that the outcome of individual
attitudes towards the preferences for the product and its features are based on one‟s
perceptions and needs. An individual‟s assessment of new products is analyzed to uncover
specific preference patterns that can help understanding and predicting individual‟s behavior.
The analysis of consumer preferences tends to highlight the most promising product
description in which consumers make their purchase decisions. Product features that are

8 | P a g e
usually evaluated by the customers are physical characteristics, price, warranty etc. (Cestre &
Darmon, 1998)
Obtaining the best product concept by analyzing overall consumer preferences provides
managers with an insight of what product characteristics are best fit the preferences of
different consumers as well as what marketing program should be modified to best suit
preferences of potential buyers. (Cestre & Darmon, 1998)
2.2.1.2 Consumer Perception and Sensory Systems
Perception act as a phase where the inward stimulus activates the sensory systems of five
senses: vision, sound, taste, touch and smell. Evans et al (2008) also discussed that consumers
become aware of their environment through these five senses. These senses can be used to
find out how individuals interpret messages. (Engel et al., 1986; Hoyer and McInnis, 2001,
pp. 92-95)
In a cross-cultural perception, vision and taste may have a huge effect on consumers‟ choice
for a product (Hoyer and McInnis, 2001, pp.92-95). Similarly, taste and texture of product
also considered having an effect on consumer perception. Interestingly, the first taste is
usually evaluated through the eye not the mouth. As a result, product appearance such as its
physical tangibility and packaging could lead to the modification of flavor perception and
level of food acceptance. (Imram, 1999) Product taste is important in this scenario and it is a
significant variable for marketing food or beverages. Furthermore, the product tastes are also
different based on the country or region in which they are being sold. The adaptation on
product taste is basically different from one group to the others. (Hoyer and McInnis, 2001,
pp. 92-95)
Sensory Evaluation
Seeing how important sensory have an impact on consumer behavior , now there is a need to
know how each element works together which lead to the field of sensory science. The goal
of sensory science is to understand the product person interface. In other words, exploring
how a person‟s senses work. Sensory testing involves human participants. However, a human
is a hard measuring instrument to work with as they come with various degrees of
knowledge, experiences, differing genetic sensory capabilities and different preferences.
Therefore, each person is different from one to another. (Lawless & Heymann, 2010, pp. 1-2)
To see how one evaluating things, scientist used something called sensory evaluation. This
evaluation has been defined as a scientific method used by people to stimulate, measure,
analyze, and interpret responses they have to products as they perceived it through the senses
of sight, smell, touch, taste, and hearing (Stone and Sidel, 2004). Sensory evaluation include
a set of techniques that are able to measurement a person‟s responses to foods in which the
biases effects of the product‟s brand and other influential factors on consumer perception can
be minimized (Lawless & Heymann, 2010, pp. 1-2). The perception of the sensory attributes,
which are smell, flavor, and texture of food, is a dynamic value and changes from time to
time (Lawless & Heymann, 2010, p. 179).

9 | P a g e
Principal Factors in Food Evaluation
There are four principal quality factors in food flavor, texture, appearance and nutrition. More
detail are listed below (Bourne, 2002, p.2)
1. Flavor, includes taste (perceived on the tongue) and odor (perceived in the olfactory
center in the nose). It is the response of receptors in the oral and nasal cavities to
chemical stimuli, which are called the chemical senses.
2. Texture is primarily the response of the tactile (touch) senses to physical stimuli that
result from contact between some part of the body and food; such as hands, lips, teeth
tongue and etc.
3. Appearance comprise of color, shape, size, gloss, which use by the optical sense.
4. Nutrition refers to both major nutrients (carbohydrates, fat, and protein) and minor
nutrients (minerals, vitamins, fiber).
However, other factors such as cost, convenience, and packaging of food products, are also
important but are not considered as quality factors of foods. The first three factors listed
above (Flavor, and Texture, and Appearance) are called sensory acceptability factors because
they are directly perceived by the person‟s sense. The sensory acceptability factors for food
are important because it is how people obtain great enjoyment from eating the food they like
and it is how they values and perceive the food. This enjoyment of food is called sensory
pleasure. (Bourne, 2002, p.2)
Flavor (Taste)
There are four classical tastes of food; sweet, salty, sour and bitter. They are used to
determine the perceptual taste qualities (Lawless & Heymann, 2010, p. 30). The definitions
of taste belong to the culture heritage of human society. As there are differences in tastes
among different people and regions in different parts of the world, tastes have been evolved
over time. Taste is simply defined as flavor in which individual sense through their tongue
and palate. It can also mean knowledge or the sensorial assessment of what is pleasing or
displeasing. Taste is a cultural experience transmitted from one generation to the next from
birth along with other variables that together define the values of a society. For something
that can be called the perfect food, all the tastes should be simultaneously presented.
(Montanari, et. al, 2006, pp. 61-65)
Texture
Food texture is used as an indicator of food quality. In some foods, the perceived texture is
the most important sensory attribute. The importance of texture and the overall acceptability
of foods are based on the type of food. It can be broken down into three groups, which are
critical, important and minor. Critical is food in which texture is the dominant quality
characteristic. For important, it is foods in which texture makes a significant but not a
dominant contribution to the overall quality. Lastly, minor, it refers to food in which texture
makes a negligible contribution to the overall quality. (Lawless & Heymann, 2010, p. 260)
There is a range in textural characteristics of foods. For example, the chewiness of meat, the
softness of marshmallows, the crispness of celery, the juiciness of fruits, the smoothness of
10 | P a g e
yogurt, and the melting of jelly. There is no right texture because many different types of
textures are demand by different types of people. Preferences (acceptability) and texture
perception are decision made by people every time they eat without much conscious thought.
(Bourne, 2002, p.1-34)
Appearances (Shape and Color)
Some studies stated that product appearances are those include product color and other
appearance properties such as physical form (shape and color). Previous scientific studies
have shown that the appearance and color of food is a primary indicator of perceived quality,
and color of the food product also have effects on the perception of other attributes, such as
aroma, taste, and flavor. Similarly, in food processing and cooking, color serves as a cue for
the doneness of foods and is correlated with changes in aroma and flavor. Moreover, color
and flavor interactions are likely real. The perceived color of an object is affected by three
entities: the physical and chemical composition of the object, the spectral composition of the
light source illuminating the object, and the spectral sensitivity of the viewer‟s eyes. (Lawless
& Heymann, 2010, pp. 283-299)
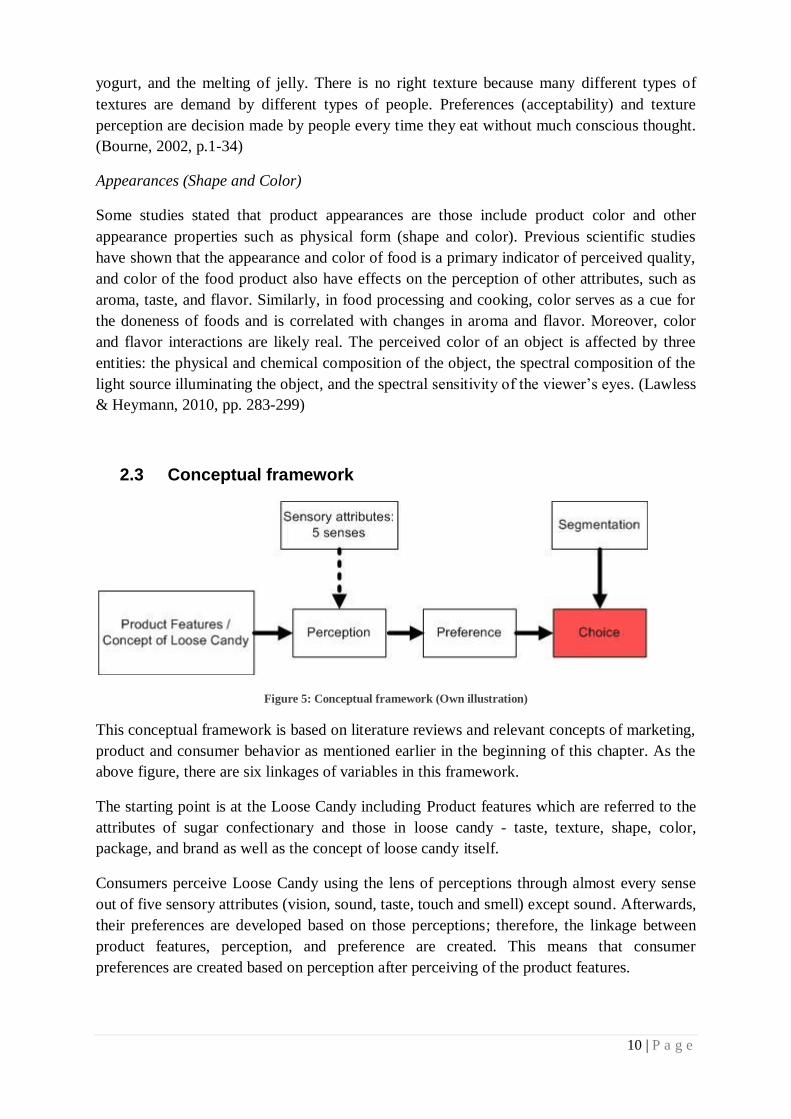
2.3 Conceptual framework
Figure 5: Conceptual framework (Own illustration)
This conceptual framework is based on literature reviews and relevant concepts of marketing,
product and consumer behavior as mentioned earlier in the beginning of this chapter. As the
above figure, there are six linkages of variables in this framework.
The starting point is at the Loose Candy including Product features which are referred to the
attributes of sugar confectionary and those in loose candy - taste, texture, shape, color,
package, and brand as well as the concept of loose candy itself.
Consumers perceive Loose Candy using the lens of perceptions through almost every sense
out of five sensory attributes (vision, sound, taste, touch and smell) except sound. Afterwards,
their preferences are developed based on those perceptions; therefore, the linkage between
product features, perception, and preference are created. This means that consumer
preferences are created based on perception after perceiving of the product features.

11 | P a g e
After perceiving and evaluating the product features, consumers would then select the
product they like most based on their preferences. This product being selected is called as
“choice”. However, the choice made by consumers was influenced by a variable called
“segmentation” which includes both demographic characteristics (age and gender) and
psychographic dimensions (lifestyle, personality, and self-image) in which made each
individual different.
.

12 | P a g e
3. METHODOLOGY
This part describes the method that was used in this research as well as the reason for
choosing the particular topic, particular research methods as well as the plan for collecting
data from both primary and secondary sources.
3.1 Research Design
Research Methods refers to a systematic and logically arranged process of collecting data for
the purpose of gathering information to solve or answer a particular research problem or
question (Jankowicz, 1991). Research methodology can be divided into two main types:
quantitative and qualitative methods. According to Colin Fisher, quantitative method deals
with numbers and its findings are arrived from statistical measurement and procedure. On the
other hand, qualitative research method emphases on the depth understanding of the
respondent and reach the conclusion by focusing on an explanation of words rather than
numbers (Fisher, 2007, p.62).
In literatures regarding research methods, there are debates regarding which research methods
or techniques are more suitable or „scientific‟ than others rather than choice a particular type,
Jankowicz (1991) emphasized that which method is suitable for one research or project
depends on the research problem and its purpose. As for the purpose of this research was
emphasizing on testing, verifying and describing consumer‟s perception toward the sugar
confectionary product especially the Swedish loose candy (lösgodis) under a controlled
measurement, a mixture of qualitative and quantitative method was selected as a research
method for this study. The combination of experimental product (candies) tasting with a
structured questionnaire conducting with a group of people from 2-9 people was used as a
tool to gather the date needed along with a small personal interview with the candy store
owner who has a certain level of experience and knowledge about the candies and the
industry.
3.2 Choice of the topic and the study object
The following section presents the different choices that were made for this study and their
reasons behind each selection.
3.2.1 Choice of Topic
Choosing the right topic is a crucial stage of writing a dissertation, Fisher (2007, pp. 31-32)
provides criteria for selecting a topic as it has to be interesting for the person who is doing the
research as well as the external audiences. The topic selecting for this current research was
focused on the perception on product features and preferences of Thai consumers towards
such sugar confectionary products as loose candy (lösgodis) as its managerial implication is
to help Swedish candy manufacturers in marketing and fitting their products to Thai
consumer preferences before entering Thai market. Millions of people everywhere in the
world, thus, consume candies in authors‟ opinions; this study was regarded to be interesting
for external readers. Moreover, Swedish loose candy was also of the authors‟ interest to
explore and analyze.

13 | P a g e
In addition, Fisher (2007, p. 32) also emphasized on the important of the durability of the
topic that it should be relevant in a year‟s time meaning that the data and information
collected should not face any rapid change during the length of the research. As the paper is
focusing on consumer behavior, the result and data collected should not be interference with
any of the mentioned problems.
3.2.2 Choice of Industry
This paper is based on the study of sugar confectionary products including the Swedish loose
candy in confectionery market. One of the most important reasons for this choice of
confectionery industry was the fact that loose candy or lösgodis is very popular in Sweden.
Swedish consumers of all ages like to consume candy, which ranked the highest sweets
consumption in the world and consume twice as much as candy as the average European
consumers. (Dagens Nyheter, 2011; Simpson, 2010)
Moreover, another contributing factor for this choice of industry was the authors‟ personal
interest and previous experience with the industry. After group discussion regarding potential
research capability and overall concept of loose candy as well as Swedish candy
consumption, confectionery industry was decided to be the selecting choice for this research.
However, the focus of this research paper was limited to only loose candy that are in sugar
confectionary instead of chocolate or gum due to the fact on Swedish candy consumption that
non-chocolate candies such as gummy candies with various shapes and colors are more
popular than chocolate in Sweden. (Swedish Freak, 2011) Thus, non-chocolate loose candies
were considered as more interesting for this study and being seen as an opportunity for
Swedish manufacturers in expanding and introducing loose candy to new confectionery
markets.
3.2.3 Choice of Country
Even though the concept of loose candy (lösgodis) has been widely spread in some countries
especially in Europe and America, the concept itself regardless of the products is new to Thai
confectionery market since it was rarely found in the marketplace and this made the Thai
market become much more interesting for this study.
The accessibility of resources and relevant information to the field of research and people
who helped in answering the research has been considered while deciding on the selecting
choice of potential country for this paper. By narrowing the focal area of research to be only
in the Thai market, this limits the breath of the research field to which is accessible and
suitable for the time and energy available for the authors to carry out the project. Another
reason why Thailand was chosen for this research is that both of the authors are Thai and they
have both accesses and capability to reach the potential Thai respondents living in Sweden
since this research was conducted in Sweden alone.
3.2.4 Choice of Respondents
Due to the fact that the research is studying overall customers‟ perception of Thai customers
toward loose candy, only Thai respondents were selected using a convenient sampling

14 | P a g e
approach and was decided to be current candy consumers whose ages range from 20 to 30
years old both male and female studying at Mälardalen University. The rationale behind the
selected age group was because more candy and confectionery products in Thailand were
consumed by people at younger ages (Datamonitor, 2010). Moreover, these people are
considered to be mature, with certain life experience and expected to be able to make their
own decision about their daily activities.
Since the design of the survey was a mixture of experimental product tasting and structured
questionnaire, which required the authors to be present and the need for having the sample
candy available for respondents to try when the survey was conducted, only Thai people
living in Sweden were chosen. In addition, conducting the survey in Sweden also allowed the
authors the accessibility to the candy (sugar confectionery products) which was the main
focus of this study. Moreover, carrying the survey in Thailand would create an accessibility
barrier for the authors as well as possibility of increasing an error and mislead data.
Moreover, as the study was aimed to explore the similarities and differences among different
demographic and psychographic group of the consumer, the respondents were to be asked
questions regarding their personal background such as age, gender, income as well as their
basic lifestyles in order to be able to categorize them into different groups.
According to Fisher (2007, pp. 189-190), the size of the required sample is partly depended
on the margin of error researcher prepare to accept and the size of the population from which
the sample is going to be taken from. However, due to the chosen method design and the in-
depth data that was able to produce from the research, a smaller number of samples were
selected. With a limited number of Thai students available in the location of the research,
approximately 85 people were asked to perform in the survey, in which 75 people were
willing to engage and responded to the authors‟ request in this research.
As mentioned in the theoretical framework chapter that taste belong to the culture heritage of
human society and was passed on from generation to generation creating a similarity of taste
preferences among the same group of people. Since the purpose of this research is to describe
and explore the consumer perception and preference in order to gain a deeper understanding
of the consumer rather than representing the population, the selected sample size was
considered to be enough and able to deliver valid data and result as well as providing a
guideline for the marketers regarding the consumer‟s taste, preference and perception of the
sugar confectionary product.
3.3 Data Collection
The research was based on the data collecting from a quantitative research using a mixture of
product sample tasting survey with structured questionnaire as well as other external sources
such as documents (press release, articles in the mass media, news article and internet),
organizational records together with the literature review.

15 | P a g e
3.3.1 Literature Review
The authors began collecting secondary data through various sources. Different books,
journal articles and pervious student dissertations as well as internet sources were chosen as
the sources for the literature review. The authors made sure that the information sources
would be relevant to the subject of study and were a truth worthy and reliable sources.
The books that were chosen as a reference were mainly from Mälardalen University‟s library
and also from a personal collection of the authors. The authors used different online database
and library catalogues to retrieve journal and articles available via the university network.
The databases used included Diva: Academic archive online, ABI/INFORN Global
(ProQuest), Business Insight, Google Scholar search engine and other webpage that was
relevant to the topic study. The authors used key worlds such as “Confectionery market”,
“Thai eating habit”, “Godis”, “Marketing mix”, “Food marketing”, “Product attributes”,
“Consumer behavior” “Consumer‟s perception”, and “Sensory evaluation” to find both books
and articles.
3.3.2 Choice of Theories
The choice of theories was made through the literature review in accordance with the area of
the research. The criteria in choosing and constructing the conceptual framework for the
current research was conditioned by theories and models that were considered as suitable for
understanding consumer perception on product features and their preferences. The concepts
and theories were also chosen based upon the purpose of this research.
First section of theories on the marketing mix (4P‟s) of food products together with food
marketing concept from Perner L. (2008) was introduced in order to give readers and authors
deeper into the field of research on food marketing concept as well as loose candy (lösgodis)
and its marketing elements. Moreover, the concept of sensory evaluation and principal factors
in food evaluation (flavor, texture, and appearances) were illustrated so as to support the field
of study in candy evaluation in order to know how people perceive and evaluate food through
their multi sensory. These food evaluation concepts were taken from three text books which
are Sensory Evaluation of Food: Principles and Practices from Lawless and Heymann
(2010), Food Texture and Viscosity: Concept and Measurement from Bourne A. C. (2002),
and 3 Sensory Evaluation Practices from Stone H. and Sidel J. L. (2004).
As a consequence, the concepts of consumer perception and preferences were chosen in order
to support the analysis of consumer‟s behavior. Perception theories were taken from Kotler P.
and Armstrong G. (2008), Evans et al. (2009), Snoj et al. (2004), Engel J. F. (1986), Imram
N. (1999). Lens Model from Hauser that showed the interrelationship between product
features and perception were also chosen to support the findings on consumer behavior. In
this case of the current research, authors would focus on perception and preferences of people
in the local context toward the product features of loose candy, which Swedish candy
manufacturers should study before introducing a range of candy selection to new potential
markets.

16 | P a g e
Moreover, “Business Insights” Journal and Thailand‟s local newspaper, “Thansettakij” were
selected to support the previous findings on theoretical framework. The first one from
Business Insights was a Future Flavor Trends in Food - New opportunities in sensory
innovation; the journal ranked the top flavors in confectionery and discussed about how
marketers can take advantage of the link between consumers‟ emotions and their sensory
experiences. Furthermore, this journal also mentioned about eating healthy trends and healthy
foods. The second one was from Thansettakij Newspaper discussing about Thai
confectionery market, market values, and market share among different categories of
confectionery products.
3.3.3 Survey
This research mainly focused on gathering primary data using a quantitative method by a
structured survey/questionnaire with closed ended questions as a tool to collect the data and a
means of measurement. The questionnaire was expected to be able to reveal the consumer‟s
perception, their product preferences as well as their choice of product of the investigated
research field: loose candy (lösgodis). The authors believed that using a questionnaire
together with product tasting survey as well as the interview with candy store owner was be
the best method to collect the primary data due to its usefulness in term of time-limitation as
well as its ability to cover the depth information required for the data analysis.
3.3.3.1 Survey Design
The authors attempted to design the survey using simple and concise language as well as
making it as relatively short and presentable as possible so that the respondents would not
spend much time filling in the survey. Moreover, English was using in this survey and was
not expected to create any language barrier for the respondent since all of the respondents are
an international students at Mälardalen University whose already acquired a decent level of
English education.
The questionnaire for this research has been structured and based on the conceptual
framework of the paper, which was constructed from various theories and literature concept
regarding consumer perception. Several formats of questions were used while structuring the
surveys, which contained of seven main questions with a total of 31 sub questions with a
mixture of dichotomous, multiple choice, checklist, rating scales and likert scale questions as
presented in the Appendix A of this report.
Questions: Variable (Candy consumption specification)
Question 1-5: (Do you eat candy; How often do you eat candy; How much do you spend on
purchasing candy per time; How much do you like candy; Where do you buy candy)
The first section of the questionnaire is questions act as a screening question regarding the
respondents‟ candy consumption as well as their basic pattern of consumption behavior. The
first question helps to identify the respondents whether they consume candy or not since the
authors study only current consumers. This question will allow authors to determine if the
questionnaire can be included in analysis.

17 | P a g e
The second question act as a general question regarding the amount of candy consume
measuring by the frequency of eating while the third question asked for the average amount
of money spend on each candy purchase. The fourth question is used to identify consumer
own identity toward candy as they classify themselves to a hierarchy of likeness toward
candy. The fifth question is a checklists question asking for the outlet where the respondent
purchases candy. This question used to identify the suitable retail location for loose candy as
well as the popularity of each outlet to the respondents.
Questions: Variables (Perception, preferences and choice)
Question 6: (How much do you like each feature of each product; How likely will you buy
this product)
Question 6.1 – 6.15 were used to identify consumer perception on product features
(attributes) of 15 different loose candies and their preferences toward each of them after they
perceived through the sense of the sensory attributes: vision, taste, touch and smell by asking
the respondents to rate or evaluate each candy one at a time. Moreover, at the end of each
product tasting the writer also asked how likely the respondent will buy each product in order
to identify which products was the respondent choice of preferences.
Question 7.1 – 7.9 (Do you agree or disagree with these following statements)
These set of questions are in likert scale used to ask the respondents for their opinion,
perception and attitude toward other product features such as brand, package as well as the
concept of loose candy. The questions were used to find respondents‟ points of view and
perception by asking them to choose a position on a provided five-point scale between
strongly agree and strongly disagree which reflects their opinion about certain statement. (Eg.
I prefer sugar-free candy; Candy should come in a package; Candy with popular brand is
better; I like to be able to select the amount of each candy I buy, etc.)
Questions: Variable (Segmentation/person related factor)
Question 7.10 – 10: (What is your gender; What is your age; What is your income/allowance)
The last set of questions were used to classify the respondents into different segments using
both demographic and psychographic elements in order to examine the similarities and
differences between each group, which could affect their choices of product. For the
psychographic elements the likert scale format questions were asked regarding respondent‟s
general lifestyle with the statement such as: I am concerned about the environment; I keep up
to date with the latest fashion trends; I would rather spend a night out then stay at home.
3.3.3.2 Choice of selected candy sample
According to Karamellkungen (Candy King), Swedish leading candy provider/ seller, loose
candy (lösgodis) can be categorized into mainly 8 different types: chocolate, covered sweets,
foam, hardboiled, jelly, liquorices, toffee and others (Karamellkungen, 2011). By looking at
the different kinds of product offered by Karamellkungen, the authors have chosen 15 kind of
products consisted of different flavors, type, shape and color in order to try to capture the

18 | P a g e
while range of products as a sample for the respondent to taste, trial and examine. Roughly,
two different candies were selected from each 6 main categories: covered sweets, foam,
hardboiled, jelly, liquorices, toffee category, most of them are Karamellkungen‟s current
popular exported product. Since the research is limited to examine only the sugar
confectionery products, chocolate categories of the loose candy was not selected. The list and
details of the selected candies was listed in Appendix B.
The different candies were purchased by the authors who was personally ensure that each
candy was in its best new condition by trying them before purchase as well as making sure
that the candy was store properly for the survey procedure. The authors were doing so by
putting each candy in a separate bag to prevent each candy and coating affecting each other
as well as putting the candies in an air tight bag in order to prevent the candy to change it
form or taste.
3.3.3.3 Distribution of survey
The questionnaire was distributed to potential respondents in person through personal contact
as well as though the network of relationship the two authors have with both the Thai student
college and the International office of Mälardalen University. The authors administrated every
surveys by themselves since the main part of the questionnaire require the authors to provide
the respondents with selected candy sample as well as it will allow the authors to minimized
answer error as well as being able to administrate the survey thoroughly.
3.3.4 Interview
For this research, an interview in English has been conducted with, Mr. Bahman Bahrami, the
store owner of “Gott Land”, a candy store in Västerås, Sweden with the help of translation
into Persian by his sale assistant. The interviewer was contacted face-to-face in the store by
the authors on May 17, 2011. The interviewee who was the owner of the store agreed to
participate in this research, so a list of questions had been asked. The answer to each question
was received back after all the questions have been asked.
A list of twelve interview questions was divided into four parts. All the questions were
opened answer questions and presented in Appendix C of this paper. This list of the questions
was created in advance by the authors regarding to the additional information required on the
product and concept of loose candy as well as other relevant factors, which the authors are
not able to retrieve from a reliable sources. The information was used so authors could collect
necessary data for performing analysis as well as suitable recommendation for the area of
study.
3.4 Data Analysis
In order to answer the research question for this paper, the authors had to analyze the
empirical data including both the interview as well as the survey data. Both of the data were
analyzed together in order to answer the research question and achieve the purpose of the
research.

19 | P a g e
3.4.1 Survey
In order to answer the stated research question mention earlier, the authors had to analyze
empirical data, which is focusing on the survey data. The survey data was analyzed using the
help of statistical software – SPSS, which was chosen because of the capability and variation
of the software as well as its easy to use feature (IBM Corporation, 2010).
The data was entered in SPSS program and each question was coded to make the data easier
to enter. After entering the data into the program, a selection of statistical tools were chosen
to interpret the data according to the type of the variable, the purpose of each question as well
as the conceptual framework of the study.
The statistical tools such as frequency were used for multiple-choice questions in order to
find the general data of the respondents as well as their basic candy consumption behavior.
While statistic tools such as descriptive were used to describe the respondents‟ perception
and preferences toward each sugar confectionary products and its features.
Since the main goal of this research is to identify and describe the consumer perception and
preference of the sugar confectionary products such that the suitable selection of candy for
Thai market can be recommended, when examine the similarities and differences among the
consumer, the authors will only investigate those products that are highly interested and rated
by the respondents. The mean that were used to select the products was the by looking at the
candy that were rated highest among each feature (taste, texture, smell, shape and color) as
well and the respondents‟ willingness to buy those products. After reviewing the top ranking
candies, only five will be selected and used to investigate for the similarities and differences
among different demographic and psychographic groups using a statistical tools such as
correlation, cross-tabulation, Chi-squared test and one-way ANOVA.
One-Way ANOVA Statistics
An analysis of variance test or ANOVA is a test used to compare variances in two or more
group of data. The test will tell whether there is significant different in the mean average of
the groups or not. The use of ANOVA test began with the construction of the null hypothesis:
assuming that there is no real different between each group of variables (Pallant, 2010, p
250). In this case, the null hypothesis is there is no real difference between the perception and
preferences for the product features of each demographic and psychographic group. If the
null hypothesis is rejected, it means that there is a difference in perception and preferences
between each group. When analyzed a Contingency Tables was product, which labeled
“One-way ANOVA” (Appendix D) to evaluate whether to rejected or accepted the null
hypothesis.
Interpreting ANOVA Statistics
The ANOVA test result is called F-statistics, which is the ration of variance and the greater
the value of F-statistic usually indicated that the result is significant. However, there is a need
to look at the level of significant of the result as well. The significant level is the probability
that the null hypothesis is true. It is measure with “Sig.” value in the ANOVA table, which is
probability value of getting those sample result if there is no difference between the variables.
20 | P a g e
In other words, if the significance level is large, it implies the absence of difference between
variables and the null hypothesis will not be rejected. In order to reject the null hypothesis,
the level of significant is expected to be no more than 0.05 (5 percent level). This basic
significant level of 5 percent will be used for all statistical analysis in this paper (Fisher,
2007, pp. 214-215)
Duncan‟s post hoc test is used to determine the significant between group means in the
ANOVA test. The result would divide the group of variables into different groups and it
would allow the researcher to be able to classify which group of respondents is different from
others as well as calculate the percentage of difference. (Pallant, 2010, p 254)
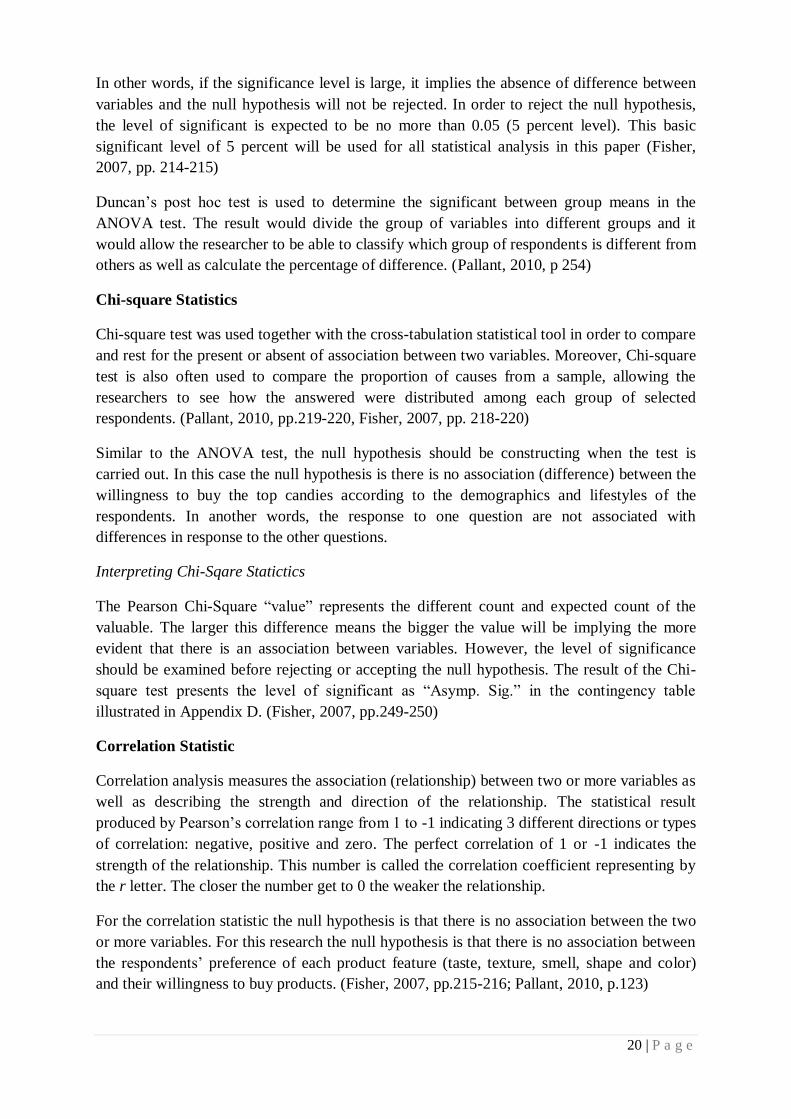
Chi-square Statistics
Chi-square test was used together with the cross-tabulation statistical tool in order to compare
and rest for the present or absent of association between two variables. Moreover, Chi-square
test is also often used to compare the proportion of causes from a sample, allowing the
researchers to see how the answered were distributed among each group of selected
respondents. (Pallant, 2010, pp.219-220, Fisher, 2007, pp. 218-220)
Similar to the ANOVA test, the null hypothesis should be constructing when the test is
carried out. In this case the null hypothesis is there is no association (difference) between the
willingness to buy the top candies according to the demographics and lifestyles of the
respondents. In another words, the response to one question are not associated with
differences in response to the other questions.
Interpreting Chi-Sqare Statictics
The Pearson Chi-Square “value” represents the different count and expected count of the
valuable. The larger this difference means the bigger the value will be implying the more
evident that there is an association between variables. However, the level of significance
should be examined before rejecting or accepting the null hypothesis. The result of the Chi-
square test presents the level of significant as “Asymp. Sig.” in the contingency table
illustrated in Appendix D. (Fisher, 2007, pp.249-250)
Correlation Statistic
Correlation analysis measures the association (relationship) between two or more variables as
well as describing the strength and direction of the relationship. The statistical result
produced by Pearson‟s correlation range from 1 to -1 indicating 3 different directions or types
of correlation: negative, positive and zero. The perfect correlation of 1 or -1 indicates the
strength of the relationship. This number is called the correlation coefficient representing by
the r letter. The closer the number get to 0 the weaker the relationship.
For the correlation statistic the null hypothesis is that there is no association between the two
or more variables. For this research the null hypothesis is that there is no association between
the respondents‟ preference of each product feature (taste, texture, smell, shape and color)
and their willingness to buy products. (Fisher, 2007, pp.215-216; Pallant, 2010, p.123)

21 | P a g e
Interpreting Correlation Statistic
First, the level of significance of the relationship should be examined like the other statistical
analysis mentioned earlier indicating the probability that there is a correlation between the
two or variables. If the null hypothesis is rejected the strength and direction of the
relationship can be analyzed by looking at the correlation coefficient value of each
relationship.
According to Rowntree (1991, p. 170) the interpretation of the correlation coefficients can be
described as below.
Correlation Coefficient Strength
0.0 - 0.2 Very weak, negligible
0.2 - 0.4 Weak, low
0.4 - 0.7 Moderate
0.7 - 0.9 Strong, high
0.9 - 1.0 Very strong, very high
3.4.2 Interview
Interview data revealed supplementary information that the authors have retrieved from
internet sources regarding additional product elements and the nature of product, with some
extensional facts that is not covered as well as the interviewee‟s personal opinions regarding
the area of the study. Combined with the surveys as well as the secondary data, the interview
data was analyzed according to the chosen theoretical framework.
3.5 Methodological Issues and Limitation
The authors faced several methodological problems during the course of this research. To
begin, time constraint played an important role throughout the different procedures of the
research. With only 10 weeks time frame of the research, the authors only conducted the
research among Thai students studying in Västerås area. As there was also a limited amount
of potential respondents in this area, this reduced the number of survey that could be
conducted.
On the other hand, by limited the respondents to those only living and studying in Sweden
create a boundary of possible respondent participating in the surveys to certain groups of
people with a certain similar background. Therefore, this limited range and variety of
respondents. However, the authors view it as an appropriate selection of respondents and
have very little effect on the result of the research due to varies reasons mention earlier in this
chapter.
Moreover, as the structure of the method selected for this research required the researcher to
be present at the time the survey took place, it limited the capability of mass distributing the
survey via sources like the internet or mail service, which as well limited the amount of
survey conducted. In addition to the effect of the structure of the survey having upon this
research, a large amount of candy sample cannot be selected. The main reason was because

22 | P a g e
loose candy consists of hundreds different kinds, to taste all of them would take the
respondent a large amount of time and there is less likely that anyone was willing to do so.
In addition, as the survey was done with a group of 2 to 9 people at the same time, this can
create some bias and leading answers that could affect the result of the surveys, since there is
a possibility that there will be a discussion among respondents while performing the survey
as well as a possibility that the answers be influence by one or two dominant participants in
the group. Furthermore, there is a possibility that there will be disagreements and irrelevant
discussion that could distract the respondents from the main focus of the research.
Moreover, different factors might have effects or influences on the results such as; the
literature chosen, the applied theories. Therefore, it was possible that with a different
literature sources and additional theoretical background the conclusion of the research could
be slightly different. However, the authors took the effort to construct the research in such a
way that the information received is at its most precise and avoid any biases.
Statistical problems were also taken into account of the writers that a sample size of 75
respondents may not be statistically representative of the population and which might lead to
certain errors and uncertainties in the results. However, it was believed that this sample size
was enough to receive the statistically significant result and be able to allow the authors to
draw conclusion.
3.6 Validity and Reliability
Validity and reliability were highly valuable in this research. Fisher (2007,p. 294-295) said
that the information provided in the study should be meaningful and is subject to validity.
This concept required the researchers to present carefully and logically the conclusion and
interpretations from the research empirical data with an appropriate research technique,
ensure that the result and the conclusion are valid, and fairly represent the area of the study.
With this concern in mind, the authors took several conscious steps that would ensure the
validity and reliability of the study.
First, the data was collected from both reliable primary and secondary sources. As, the survey
questions were constructed based on the literature review, it create both strong and concrete
foundation to the research. In additional, the authors both personally administrated the
surveys and be able to answer all of the respondents curiosity as well as their uncertainties.
Concerning the truth of explanation of data, the authors planned to follow the criteria for
interpretation recommended by Fisher, C. (2007, p.290) as well as selected a suitable method
and statistical tools to measure, analyze and interpret the data on the basis of the research
topic.

23 | P a g e
4. Empirical Data
This chapter is a presentation of the finding of data both from primary and secondary sources.
The finding is divided into 2 main sections. The first section gave the primary data from both
the survey and the interview. The second section present the data collected from external
secondary sources. Both sections were used to construct the analysis of data regarding the
research area of this study.
4.1 Interview Summary
This interview is based on the single store of candy, “Gott Land” which is located in the city
center of Västerås, Sweden. The topic of the interview was focused on the candy store itself
and some other relevant information of loose candies from the countries of origin, products
(candies), packaging, promotions, and other factors such as climate and temperatures that
might have effects on the candies as well as the way to keep them in a good condition. After
all the questions were asked to Mr. Bahman Bahrami, the store owner of “Gott Land”, below
was the summary of interview.
4.1.1 Store Background
Figure 6: Picture of Gott Land (Own Pictures)
“Gott Land” store has been established for almost 12 years ago by an Iranian owner named
Bahman Bahrami. This store is located in the city center of Västerås, Sweden; “Gott Land”
store is one of two candy shops in Västerås that offers just confectionery products including
various types of candies and it not a part of any chain. The store runs 6 days a week from
Monday to Saturday between 10.00 a.m. and 18.00 p.m., whereas on Saturday‟s opening
hours are shorter as it would open till 17.00 p.m.
“Gott Land” serves different types of customers that vary in age, gender, occupation and so
on. The owner indicated that the majority of the customers are adults aged at over 21 years
old; they are employees from the offices around the store who buys the candies for their
offices and of course children and teenagers.
Product range includes various types of candy, chocolate, gum, toys that come with candy,
soft drinks, and etc. All products are supplied from both local and international
manufacturers, but majority of them come from within Sweden.

24 | P a g e
4.1.2 Loose candy and other relevant factors
The countries of origin of loose candy are based on the type of candies. Most non-chocolate
candies (sugar confectionery) such as hard candies, jelly and gummy are produced by local
confectionery manufacturers in Sweden, while chocolate candies are mostly imported from
other European countries such as Germany, Belgium, and Italy.
All types of loose candy are generally packed in the square plastic boxes or sometimes in
large plastic bags before distributing to the store. The candies‟ boxes should be lift on every
time they are opened to prevent candies to turn bad. Candies have about two years of
expiration as an average if they are in good packages until they get hard and could no longer
be sold, but all of them are normally sold before the expiration has come.
The weather and temperatures have effects on candies. It is necessary to have air conditioner
to keep the weather in the store dry in such a high humidity periods or when it is raining, and
to release the heat in summer when the temperatures are higher than average in order to
ensure that candies would not be perishable easily. Selling loose candy in tropical countries is
also possible if there is an air conditioner in the store.
In general, there is no promotion in the store because the regular selling price of loose candy
at 79 SEK per kilogram (395THB, 13USD)2, which is relatively cheaper, compared with
some other countries like Norway that the price per kilograms is double. However,
sometimes the store gives a certain discount for customers who buy at large volume.
4.2 Thailand’s Confectionery Market
Thailand‟s confectionery manufacturers have faced a number of challenges in the recent
years due to the economic situations which resulted in the change in consumption pattern.
Nowadays, Thai people are concerned more about their health and shape and thus they would
rather eat healthy food and reduce their consumption in other kinds of unhealthy food such as
confectionery and snack. To cope with these challenges, despite of the taste and flavor of
confectionary, most manufacturers have attempted to offer Thai consumers with more variety
and healthy products in attractive package designs and effective marketing activities in order
to stimulate their demand. (Thansettakij Co., Ltd., 2009)
Thailand‟s confectionery market valued more than 10,000 Million THB or 331 million3 USD
in year 2008. Sugar confectionery contained the highest market share among three
confectionery categories with about 50% of the whole confectionary market, while the rest of
market share were equally shared by chocolate and gum at 25% each. (Thansettakij Co., Ltd.,
2009)
In addition, sugar confectionery section was categorized into other three sub levels -top,
middle, and low-. The top level was considered as the highest growth potential, so most
manufacturers were focusing more on this level instead of the other two levels. Sugar
2
30.18 THB/ 1 USD; 5.02 THB/ 1 SEK as of May the 4th 2011 (Kasikornbank, 2011) 3
30.18 THB/ 1 USD; 5.02 THB/ 1 SEK as of May the 4th 2011 (Kasikornbank, 2011)

25 | P a g e
confectionery products in Thai market consist of hard candy (54%) including refreshment
candy and fruity candy, gummy and jelly (25%) and other kinds of candies such as medicine
candy (21%), whereas refreshment and fruity candies had the highest growth with continuous
development of new product flavors and tastes. (Thansettakij Co., Ltd., 2009)
A marketing manager of General Candy Co., Ltd. -a leading confectionary company in
Thailand- stated that the total values of Thai confectionery market accounted for 6,500
million THB. It consisted of 3,575 million THB / 331 million USD of hard candies (55%),
1,300 million THB / 43 million USD of toffees (20%), 845 million THB / 28 million USD of
mint candies (13%), 650 million THB / 22 million USD of Gummy and Jelly (10%), and 130
million THB / 4 million USD of other kinds of candies (2%). He strongly believed that there
was a growth opportunity in Thailand‟s confectionery market at 5 to 7% in year 2010 with
the company‟s marketing strategy is to target more in other segments from college and
university students and teenagers to officers and elders together with a wide variety of
product ranges. (BrandAge, 2009)
4.3 Thailand’s Retailing Candy Chain, “aki-ko”
Simak Retail Company Limited has established since 1999 and positioned itself as a modern
retailer for snacks and confectionery business under trademark “aki-ko”. Today, there are a
total of 22 branches in Thailand within 3 years, 20 branches in Bangkok and the rest in other
major provincial cities. Moreover, “aki-ko” franchising business aims to grow not only
locally in Thailand, but worldwide as well. (aki-ko, 2011)
At every store of “aki-ko”, there are over 400 kinds of confectionery in which over million
pieces of aki-ko confectionery are sold to customers every month. Aki-ko emphasized on the
selection of the best quality of confectionery products with excellent packaging from all over
the world. (aki-ko, 2011)
The average selling price of aki-ko confectionery products are at about 500-700 THB / 100-
140 SEK per kilogram; however, the price of each candy are sometimes different based on
the types of candy such as the price for Halibo (450 THB / 90 SEK) which is cheaper than
other types of candy. (aki-ko, 2011)
4.4 Multi Sensory Experiences
“Sensory evaluation is a group of methodologies which use the human senses to evaluate and
analyze properties of foods. Knowledge of specific attributes can then be interpreted in the
context of consumer acceptance or preference. Psychophysics is the study of the relationship
between physical attributes such as food and flavors, and the human response (perception).”
(Raithatha, 2008)
Marketers are consciously aware and intend to use all the human senses to promote products
and brands. Marketing through the senses has been used by many companies whose products
are either high involvement or low involvement as it is considered as a way to differentiate
products from other existing products in the market. Marketers take advantage of the
connection between consumer‟s emotions and their sensory experiences with products or
brands. For example, attractive packaging and aromatic are used to create good sensory
experience through vision and smell in which these components work as emotional cues. This

26 | P a g e
means tastes and flavors as well, and their connection with other sensory stimuli will become
more important for marketers. (Raithatha, 2008)
The elements of multi-sensory experience (human senses) and consumer research are widely
used by many flavor and ingredient companies in their product development since sensory
concept would increase the depth of knowledge about perception of flavors and their impact
on the level of acceptance or liking of food product range offered and type of flavors needed.
It is important for food manufacturers to be aware that some flavors are likely to be more
complex, multifaceted or designed to be used with other sensory such as textures, colors and
sounds. Type of flavors is based on the food levels because food as an experience will require
a higher level of flavor than food as commodity or food in general. (Raithatha, 2008)
4.5 Eating Healthier
“Healthy foods as a concept incorporate a range of new product development potential;
including reduced foods and functional foods. Flavors in these foods need to be developed
and designed specifically to support the formulation.” (Raithatha, 2008)
Health issues are important for foods in all formats. Globally, consumers are becoming more
aware of the impact of food and beverages on their health. Healthy eating trend changes in
meal behavior and lead people to focus their attention on the effects of food they always eat.
Some studies show that US and European consumers at all ages are concerned more about
their health and take steps to eat healthier. This indicates all food manufacturers that the
strength of healthy eating trend and healthy products are likely to have more in the future.
(Raithatha, 2008)
Most large food manufacturers offers new products that contain functional benefits with
decreased levels of fat, sugar, salt and additional antioxidants. Because consumers would
demand food that is good for their health and also has good tastes, especially for snack that
taste is the most important factor in their choices of selection. Therefore, taste and flavor are
also being as major issues for healthy foods and it is challenging for food manufacturers to
offer healthy foods with great flavors. (Raithatha, 2008)

27 | P a g e
4.6 Top Flavors in Confectionery
The most mentioned flavors by food manufacturers in confectionery section are dark
chocolate, green tea, pomegranate, cranberry and caramel and these five emerging flavors
are significant in term of product launched in the recent years. (Raithatha, 2008)
Figure 7: Top 20 flavors in new confectionery product introductions, % of all products launched in 2004-2007
(Raithatha, 2008)
As the above figure, top 20 flavors in confectionery products were listed and ranked based on
its popularity so as to compare the growing and decreasing trend of each flavor from year
2004 to 2007. The top five flavors in terms of new product launched in year 2007 were
chocolate (8.4%), milk chocolate (6.8%), dark chocolate (4.4%), strawberry (4.2%) and mint
(2.9%). Additionally, the top 10 fastest growing flavors were dark chocolate, wafer, hazelnut,
peppermint, mango, marzipan, licorice, bitter chocolate, spearmint, and cranberry, while top
10 fastest decreasing flavors were milk chocolate, sour, white chocolate, fruit, strawberry,
peanut butter, grape, cherry, blue raspberry, and praline. (Raithatha, 2008)
Regarding the overall flavors trend in confectionery market, the flavors aimed at children‟s
market -sweet, sour, and simple- were moving away from dependence to the mature/adult‟s
market which were more complex and intense. Moreover, sour flavors containing high acid
could be perceived as unhealthier for teeth than normal sugar flavors. (Raithatha, 2008)
Fruit flavors such as mango, pomegranate, cranberry, and elderberry are often used to
promote healthy benefits of non-chocolate confectionery products because some of them
contain the real fruit juice or pulp that made from exotic or antioxidant fruits. Interestingly,
mango flavor was in the list of the 10 fasting growing fruit flavors. Similarly, green tea flavor
has grown by 0.2% from year 2004 to 2007, green tea has often been found as ingredients in
chewing gum and candies as it helped to inhibit bad breath and pathogen growth in the
mouth. (Raithatha, 2008)
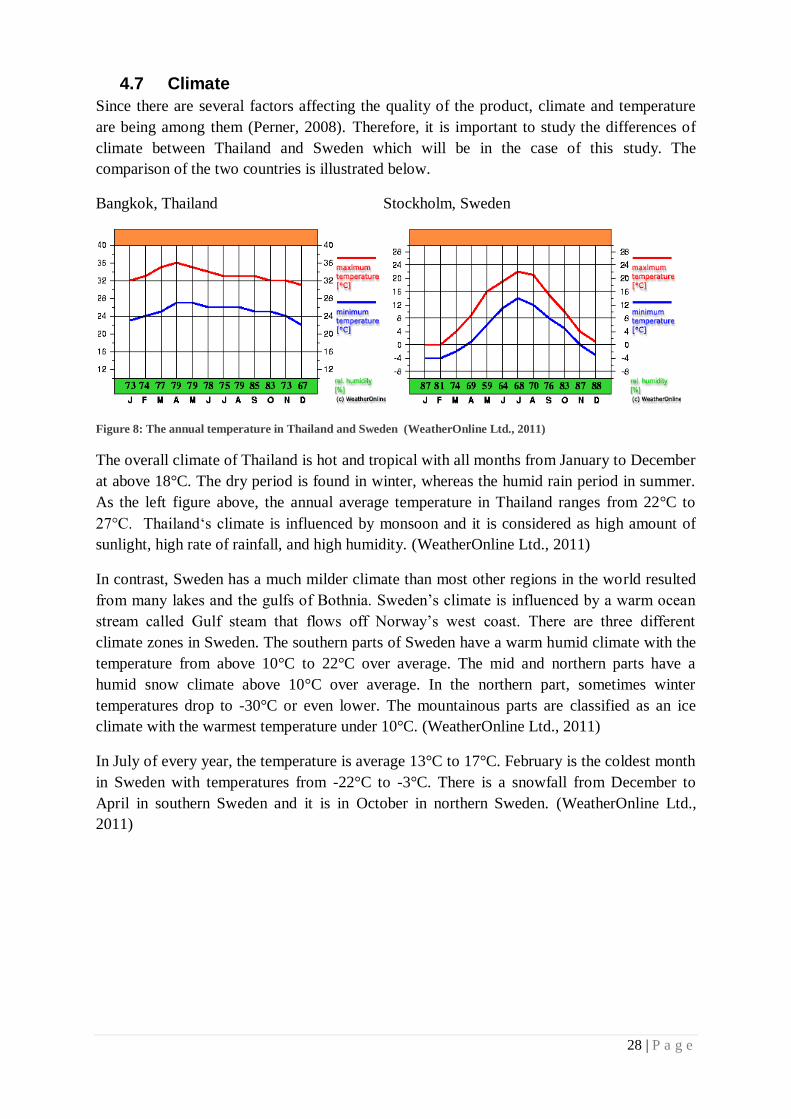
28 | P a g e
4.7 Climate
Since there are several factors affecting the quality of the product, climate and temperature
are being among them (Perner, 2008). Therefore, it is important to study the differences of
climate between Thailand and Sweden which will be in the case of this study. The
comparison of the two countries is illustrated below.
Bangkok, Thailand Stockholm, Sweden
Figure 8: The annual temperature in Thailand and Sweden (WeatherOnline Ltd., 2011)
The overall climate of Thailand is hot and tropical with all months from January to December
at above 18°C. The dry period is found in winter, whereas the humid rain period in summer.
As the left figure above, the annual average temperature in Thailand ranges from 22°C to
27°C. Thailand„s climate is influenced by monsoon and it is considered as high amount of
sunlight, high rate of rainfall, and high humidity. (WeatherOnline Ltd., 2011)
In contrast, Sweden has a much milder climate than most other regions in the world resulted
from many lakes and the gulfs of Bothnia. Sweden‟s climate is influenced by a warm ocean
stream called Gulf steam that flows off Norway‟s west coast. There are three different
climate zones in Sweden. The southern parts of Sweden have a warm humid climate with the
temperature from above 10°C to 22°C over average. The mid and northern parts have a
humid snow climate above 10°C over average. In the northern part, sometimes winter
temperatures drop to -30°C or even lower. The mountainous parts are classified as an ice
climate with the warmest temperature under 10°C. (WeatherOnline Ltd., 2011)
In July of every year, the temperature is average 13°C to 17°C. February is the coldest month
in Sweden with temperatures from -22°C to -3°C. There is a snowfall from December to
April in southern Sweden and it is in October in northern Sweden. (WeatherOnline Ltd.,
2011)

29 | P a g e
4.8 Survey data
Data obtain from the survey is presented in this section. It is divided into two differ parts,
starting off with the general information regarding the demographics of the respondents and
later the statistical data will be presented arranged by question parallel to the questionnaires.
Moreover, each question is accompanied with different type of figures illustrating the data
result where each question is cross-referenced to Appendix D, where the statistical
calculation from SPSS program is displayed.
4.8.1.1 General Information of the Respondents
Respondent Rate
The questionnaires were conducted with 75 Thai respondents in Vasteras, Sweden through a
face-to-face survey in a small group of 2-8 people in which all of the finished questionnaires
were completed without any error, and missing data found. Hence, the rate of valid
respondents was 100% and the details as shown on the table below.
Rate of Valid Respondents Person Percentage
Total respondents for the study 75 100
Table 1: Successful Rate of Valid Respondents
Profile of Respondents
The demographic characteristics of respondents were summarized in table 2. Most
respondents were female accounting for 69.3%, while the other 30.7 % of respondents were
male. The majority of respondents were aged at 23-25 years (58.7 %) and 26-28 years
(21.3%). The majority of respondents have the level of income or allowance at 10,000-20,000
THB per month accounting for 40% of the whole respondents. Interestingly, there were just
6.7% of respondents who have monthly income or allowance less than 10,000 THB.
Characteristics Frequency Percentage
Gender
Male 23 30.7
Female 52 69.3
Age
20 - 22 7 9.3
23 - 25 44 58.7
26 - 28 16 21.3
28 - 30 5 6.7
Older than 30 3 4
Income/Allowance (per
month)
Less than 10,000 THB 5 6.7
10,000 - 20,000 THB 20 26.7
20,001 - 30,000 THB 30 40
30,001 - 40,000 THB 12 16
More than 40,000 THB 8 10.7
Table 2: Profile of Respondents in this Survey

30 | P a g e
1.1.1.1 Statistical Data
For Q1 to Q4, the basic candy consumption of respondents was shown in the table 3 with the
details regarding their candy eating habit as well as the levels of their candy consumption.
Q 1 - Do you eat candy?
The result indicated that all 75 respondents eat candy accounting for 100%.
Q 2 -How often do you eat candy?
The result showed that the majority of respondents accounting for 48% eat candy 2-3 times a
week, while 21.3% of them eat candy every day, 12% eat once a week, and 18.7% eat less
than once a week.
Q 2 - How much do you like candy?
As below table, 44% which was almost half of respondents like candy, 28% of them
answered that they love candy, 26.7% said they neither like nor dislike candy, while there
was just one respondent accounted for 1.3% who dislike candy.
Q 4 - On average how much spend on candy?
Regarding to the average amount of money respondents spent for buying candy, the result
indicated that most of them spent at 50-100 THB (1.67 – 3.30 USD)4 on average which was
accounted for 46.7%.
Candy Consumption Frequency Percentage
Do you eat candy?
Yes 75 100
No 0 0
How often do you eat candy?
Less than once a week 14 18.7
Once a week 9 12
2 -3 times a week 36 48
Everyday 16 21.3
How much do you like candy?
I dislike candy 1 1.3
I neither like nor dislike candy 20 26.7
I like candy 33 44
I love candy 21 28
On average how much spend on candy?
Less than 50 THB 20 26.7
50 - 100 THB 35 46.7
101 - 150 THB 11 14.7
151 - 200 THB 3 4
More than 200 THB 6 8
Table 3: Candy Consumption
4
30.18 THB/ 1 USD; 5.02 THB/ 1 SEK as of May the 4th 2011 (Kasikornbank, 2011)

31 | P a g e
Q 5 - Where do you usually buy candy?
The places where respondents went for buying candy were summarized in table4. Most
respondents bought candy from supermarket, convenience store, and candy store accounting
for 65%, 48% and 35% of total respondents respectively. On the contrary, the places where
respondents rarely bought candy were specialty store (3%), restaurant and café (1%) and
other places which were grocery store (1%).
Places Frequency Percentage
Where do you usually buy candy?
Supermarket 65 86.7
Convenience store 48 64
Candy store 35 46.7
Specialty store 3 4
Gas station 12 16
Drug store 12 16
Restaurant and Café 1 1.3
Others 1 1.3
Table 4: Places to buy candy
Q 6 - How much do you like each feature of the fifteen products?
Descriptive Statistic
By using descriptive statistic function, it allowed authors to find the average mean of each
product‟s features including taste, texture, shape, color, and smell of 15 different candy
samples (shown in Appendix B). The perception and preferences of respondents toward each
product feature were summarized by mean average in the table. For product features (1 =
very bad, 5 = very good). For the choice of purchase, (1 = would not buy, 2 = less likely to
buy, 3 = uncertain to buy, 4 = likely to buy, 5 = most likely to buy)
Product1: Fried Egg
1. Fried Egg Taste Touch Vision Smell Average
Choice Taste Texture Shape Color Smell Feature
Mean 4.23 4.01 4.07 4.01 3.69 4.00 4.12
Std. 0.67 0.83 0.98 0.89 0.84 0.81
On average, people are likely to buy Fried Egg (4.12) because they think that
the overall features of this product are good (4.00). Each product feature is
scored higher than 3.69 and the mean average of taste is the highest (4.23)
compared with other features of this candy. This means people like taste of
Fried Egg the most. Interestingly, Fried egg is also the best among 15 candies
in term of texture (4.01) and smell (3.69) in which will be summarized in the
table later on.

32 | P a g e
Product 2: Red Meter
2. Red Meter Taste Touch Vision Smell Average
Choice Taste Texture Shape Color Smell Feature
Mean 4.32 3.84 3.52 4.05 3.8 3.91 4.15
Std. 1.03 0.92 1.08 0.93 1.04 1.05
On average, people are likely to buy Red Meter (4.15) because they think that
the overall features are good (3.91) in which all product features are scored
higher than 3.52 and taste is the highest (4.32). This means that taste is the
most preferred features for this candy. And Red Meter is also the best in term
of taste among 15 candies with the highest score at 4.32.
Product 3: Milk Teeth
3. Milk Teeth Taste Touch Vision Smell Average
Choice Taste Texture Shape Color Smell Feature
Mean 2.85 2.53 2.84 3.00 2.69 2.78 2.52
Std. 0.91 0.92 1.41 1.09 0.96 0.94
On average, people are less likely or uncertain to buy Milk Teeth (2.52).
Considering the overall features, people think that it is quite normal (2.78) in
which most product features except the color are lower than 3. Thus, for Milk
Teeth, color is the most preferred feature.
Product 4: Duo Fudge
4. Duo Fudge Taste Touch Vision Smell Average
Choice Taste Texture Shape Color Smell Feature
Mean 3.45 3.09 3.07 3.21 3.61 3.29 3.12
Std. 1.12 1.09 0.94 1.09 1.06 1.07
On average, people are uncertain to buy Duo Fudge (3.12). People think that
the overall features of this candy are quite normal (3.29) even though all
features are scored higher than 3.07. Smell is the most preferred feature for
Duo Fudge (3.61).
Product 5: Candy Cane
5. Candy Cane Taste Touch Vision Smell Average
Choice Taste Texture Shape Color Smell Feature
Mean 3.81 3.28 3.63 3.84 3.56 3.62 3.56
Std. 1.15 1.28 0.93 1.00 1.11 1.18
On average, people are uncertain to likely to buy Candy Cane (3.56) because
they think that the overall features are normal to good (3.62). The mean
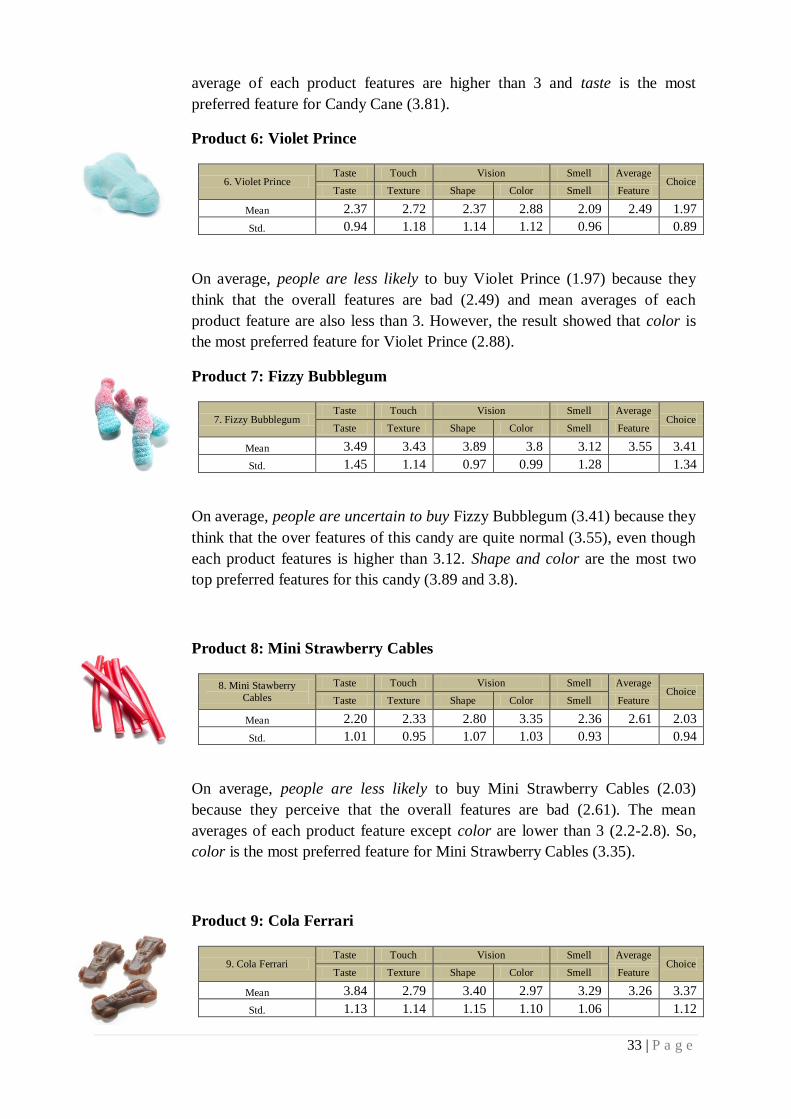
33 | P a g e
average of each product features are higher than 3 and taste is the most
preferred feature for Candy Cane (3.81).
Product 6: Violet Prince
6. Violet Prince Taste Touch Vision Smell Average
Choice Taste Texture Shape Color Smell Feature
Mean 2.37 2.72 2.37 2.88 2.09 2.49 1.97
Std. 0.94 1.18 1.14 1.12 0.96 0.89
On average, people are less likely to buy Violet Prince (1.97) because they
think that the overall features are bad (2.49) and mean averages of each
product feature are also less than 3. However, the result showed that color is
the most preferred feature for Violet Prince (2.88).
Product 7: Fizzy Bubblegum
7. Fizzy Bubblegum Taste Touch Vision Smell Average
Choice Taste Texture Shape Color Smell Feature
Mean 3.49 3.43 3.89 3.8 3.12 3.55 3.41
Std. 1.45 1.14 0.97 0.99 1.28 1.34
On average, people are uncertain to buy Fizzy Bubblegum (3.41) because they
think that the over features of this candy are quite normal (3.55), even though
each product features is higher than 3.12. Shape and color are the most two
top preferred features for this candy (3.89 and 3.8).
Product 8: Mini Strawberry Cables
8. Mini Stawberry
Cables
Taste Touch Vision Smell Average Choice
Taste Texture Shape Color Smell Feature
Mean 2.20 2.33 2.80 3.35 2.36 2.61 2.03
Std. 1.01 0.95 1.07 1.03 0.93 0.94
On average, people are less likely to buy Mini Strawberry Cables (2.03)
because they perceive that the overall features are bad (2.61). The mean
averages of each product feature except color are lower than 3 (2.2-2.8). So,
color is the most preferred feature for Mini Strawberry Cables (3.35).
Product 9: Cola Ferrari
9. Cola Ferrari Taste Touch Vision Smell Average
Choice Taste Texture Shape Color Smell Feature
Mean 3.84 2.79 3.40 2.97 3.29 3.26 3.37
Std. 1.13 1.14 1.15 1.10 1.06 1.12

34 | P a g e
On average, people are uncertain to buy Cola Ferrari (3.37) because they think
that the overall features of this candy are quite normal (3.26). The mean
averages of each product feature are at about 3. However, taste is considered
as the most preferred feature for this candy (3.84).
Product 10: Jelly Bean
10. Jelly Bean Taste Touch Vision Smell Average
Choice Taste Texture Shape Color Smell Feature
Mean 3.99 3.95 3.84 4.31 3.43 3.90 3.91
Std. 1.02 0.99 0.93 0.90 1.02 0.96
On average, people are likely to buy Jelly Bean (3.91) and they perceive that
the overall feature of Jelly Bean as good (3.90). The mean average of each
product feature is higher than 3.4 especially for color as it is the most
preferred feature for this candy. Jelly Bean is also perceived as the best in term
of color among 15 candies (4.31).
Product 11: Banana Foam
11. Banana Foam Taste Touch Vision Smell Average
Choice Taste Texture Shape Color Smell Feature
Mean 2.99 3.37 3.25 3.28 2.64 3.11 2.71
Std. 1.07 1.18 1.09 1.02 1.07 1.08
On average, people are uncertain to buy Banana Foam (2.71) because they
think that the overall feature is quite normal (3.11). The mean average of each
product features is at about 3 which means that there is no outstanding feature
for this candy.
Product 12: Twin Cherries
12. Twin Cherries Taste Touch Vision Smell Average
Choice Taste Texture Shape Color Smell Feature
Mean 3.17 3.19 4.11 3.99 2.80 3.45 3.00
Std. 1.11 1.22 0.99 0.99 1.10 1.20
On average, people are uncertain to buy Twin Cherries (3.00) and they think
that the overall features of this candy are quite simple (3.45). However, the
result showed that Twin Cherries are quite good in term of shape and color
(4.11 and 3.99).

35 | P a g e
Product13: Blue Shark
13. Blue Shark Taste Touch Vision Smell Average
Choice Taste Texture Shape Color Smell Feature
Mean 3.85 3.84 4.25 4.03 2.97 3.79 3.75
Std. 0.91 0.95 0.93 1.04 1.16 0.96
On average, people are likely to buy Blue Shark (3.75) because they think that
the overall features of this candy are good (3.79). The mean averages of most
product feature are higher than 3 except only smell. Shape is considered as the
highest among all features of this candy (4.25) and more importantly, Blue
Shark is the best among 15 candies in term of shape (4.25).
Product 14 and 15: Jumbo Liquorice & Salt Skull
14. Jumbo Liquorice Taste Touch Vision Smell Average
Choice Taste Texture Shape Color Smell Feature
Mean 1.44 2.09 2.27 1.87 1.51 1.84 1.31
Std. 1.02 1.21 1.25 1.17 0.91 0.89
15. Salt Skull
Taste Touch Vision Smell Average Choice
Taste Texture Shape Color Smell Feature
Mean 1.15 1.87 2.37 1.89 1.27 1.71 1.17
Std. 0.61 1.16 1.51 1.20 0.72 0.69
On average, people would not buy these two candies which are Jumbo
Liquorice and Salt Skull (1.31 and 1.17). The overall features of these two
candies are perceived as bad (1.83 and 1.71). Interestingly, the mean averages
of every product features are less than 2.27 for Jumbo Liquorice, and 2.37 for
Salt Skull. Among 15 candies, Salt Skull is perceived as the worst in term of
overall features (1.71) and it is a candy with the lowest buying intention
(1.17).
Taste Touch Vision Smell Average
Choice
Product Taste Texture Shape Color Smell Feature
1. Fried Egg 4.23 4.01 4.07 4.01 3.69 4.00 4.12
2. Red Meter 4.32 3.84 3.52 4.05 3.8 3.91 4.15
3. Milk Teeth 2.85 2.53 2.84 3 2.69 2.78 2.52
4. Duo Fudge 3.45 3.09 3.07 3.21 3.61 3.29 3.12
5. Candy Cane 3.81 3.28 3.63 3.84 3.56 3.62 3.56
6. Violet Prince 2.37 2.72 2.37 2.88 2.09 2.49 1.97
7. Fizzy Bubblegum 3.49 3.43 3.89 3.8 3.12 3.55 3.41
8. Mini Stawberry Cables 2.2 2.33 2.8 3.35 2.36 2.61 2.03
9. Cola Ferrari 3.84 2.79 3.4 2.97 3.29 3.26 3.37
10. Jelly Bean 3.99 3.95 3.84 4.31 3.43 3.90 3.91
11. Banana Foam 2.99 3.37 3.25 3.28 2.64 3.11 2.71
12. Twin Cherries 3.17 3.19 4.11 3.99 2.8 3.45 3
13. Blue Shark 3.85 3.84 4.25 4.03 2.97 3.79 3.75
14 Jumbo Liquorice 1.44 2.09 2.27 1.87 1.51 1.83 1.31
15 Salt Skull 1.15 1.87 2.37 1.89 1.27 1.71 1.17
Table 5: Descriptive Statistic of Product Features: 15 Candy

36 | P a g e
The summarized result showed the preferences of each product features (taste, texture, shape,
color, and smell) that was scored as the top 3 highest among 15 different candies.
Taste
Shape
Smell
Rank Candy Mean
Rank Candy Mean
Rank Candy Mean
1 Red Meter 4.32
1 Blue Shark 4.25
1 Fried Egg 3.69
2 Fried Egg 4.23
2 Twin Cherries 4.11
2 Duo Fudge 3.61
3 Jelly Bean 3.99
3 Fried Egg 4.07
3 Candy Cane 3.56
Texture
Color
Rank Candy Mean
Rank Candy Mean 1 Fried Egg 4.15
1 Jelly Bean 4.31
2 Jelly Bean 4.12
2 Red Meter 4.05
3 Blue Shark / Red Meter 3.84
3 Blue Shark 4.03
Table 6: Top 3 Candy by Each Product Feature
The top 3 products that people like their taste the most were Red Meter (4.32), Fried
Egg (4.23), and Jelly Bean (3.99).
The top 3 products that people like their texture the most were Fried Egg (4.01), Jelly
Bean (3.95), and Blue Shark and Red Meter (3.84).
The top 3 products that people like their shape the most were Blue Shark (4.25), Twin
Cherries (4.11), and Fried Egg (4.07)
The top 3 products that people like their color the most were Jelly Bean (4.31), Red
Meter (4.05), and Blue Shark (4.03).
The top 3 products that people like their smell the most were Fried Egg (3.69), Duo
Fudge (3.61), and Candy Cane (3.56)
Product Features
Buying Intention (Choice)
Rank Candy Mean
Rank Candy Mean
1 Fried Egg 4.00
1 Red Meter 4.15
2 Red Meter 3.91
2 Fried Egg 4.12
3 Jelly Bean 3.9
3 Jelly Bean 3.91
4 Blue Shark 3.79
4 Blue Shark 3.75
5 Candy Cane 3.62
5 Candy Cane 3.56 Table 7: Top 5 Candy by Overall Product Features and Buying Intention
To sum up, the top 5 candies people perceive that the overall product features are good are
Fried Egg (4.00), Red Meter (3.91), Jelly Bean (3.90), Blue Shark (3.79), and Candy Cane
(3.62).
By considering the buying intention summarized in the last column of the table “Choice”, the
top 5 candies that people are likely to buy were Red Meter (4.15), Fried Egg (4.12), Jelly
Bean (3.91), Blue Shark (3.75), and Candy Cane (3.56) respectively, while the bottom 5
candies that people are unlikely to buy were Salt Skull (1.17), Jumbo Liquorice (1.31), Violet
Prince (1.97), Mini Strawberry Cables (2.03), and Milk Teeth (2.52).

37 | P a g e
Correlation Statistic
The authors had performed a correlation statistic analysis between each the product features
and how likely the respondents would purchase each candy. The result of the correlation
statistic can be view in Appendix D- Question 6 correlation. The statistical shown a
significantly positive relationship between how the respondents who like each product feature
(taste, texture, shape color and smell) and their willingness to buy the product.
By looking at the correlation statistical result, it showed that all of its product features for
mostly every candy have a positive correlation it the respondent willing to buy. Out of 15
products, tastes have the highest level of correlation with the respondent‟s willing to buy
where as texture ranked at number two and the rest of the feature were various among
different types of candy based on both the correlation coefficient and the significant level of
the data.
All 15 candy sample‟s taste and the likeliness to buy all have a significant level at lower than
0.05 (2-tailed) rejecting the null hypothesis, there for indicated a positive association between
the product taste and the respondent‟s willing to buy candies. The results are summarized in
Table 7 below.
Product Taste r value
Product Taste r value
Fried Egg 0.55
Cola Ferrari 0.74
Red Meter 0.79
Jelly Bean 0.82
Milk Teeth 0.57
Banana Foam 0.81
Duo Fudge 0.85
Twin Cherry 0.79
Candy Cane 0.77
Blue Shark 0.76
Violet Prince 0.73
Jumbo Liquorices 0.91
Fizzy Bubblegum 0.89
Salt Skull 0.95
Mini Strawberry Cable 0.74
Table 7: Corellations Coefficient Value between Product Taste and Respondent's Willingness to Buy
Even though this correlation matrix cannot explain which value causes another, according to
Rowntree (1991) the correlation coefficient in between 0.5 to 0.9 was considered that the
relationship is range from moderate to strong. In another words, perception of the candy and
the respondent‟s willingness to the buy values are varies from moderately to strongly positive
correlated to each other.
The significant relationship of product‟s texture and the likeliness to buy candies were listed
in Table 8 below. The significant relationship have a correlation coefficient range from 0.30
to 0.73, which consider to range from weak to strong relationship.
Product Texture r value
Product Texture r value
Fried Egg 0.50
Cola Ferrari 0.72
Red Meter 0.57
Jelly Bean 0.59
Milk Teeth 0.65
Banana Foam 0.64
Duo Fudge 0.63
Twin Cherry 0.62
Candy Cane 0.68
Blue Shark 0.74
Violet Prince 0.47
Jumbo Liquorices 0.49

38 | P a g e
Fizzy Bubblegum 0.73
Salt Skull 0.41
Mini Strawberry Cable 0.30 Table 8:Corellations Coefficient Value between Product Texture and Respondent's Willingness to Buy
The significant relationship of product‟s shape and the likeliness to buy candies are listed in
Table 9 below. These correlations all have a positive correlation coefficient value ranging
from 0.37 to 0.69.
Product Shape r value
Product Shape r value
Fried Egg 0.69
Cola Ferrari 0.52
Red Meter 0.44
Jelly Bean 0.51
Milk Teeth 0.54
Banana Foam 0.49
Duo Fudge 0.58
Twin Cherry 0.37
Candy Cane 0,50
Blue Shark 0.54
Violet Prince 0.43
Jumbo Liquorices 0.43
Fizzy Bubblegum 0.66
Mini Strawberry Cable 0.42 Table 9: Corellations Coefficient Value between Product Shape and Respondent's Willingness to Buy
The output of the correlation between product‟s color and the likeliness to buy candies with a
level of significant less than 0.05 are listed in Table 10 below with the value of the
correlation coefficient range from 0.29 to 0.63.
Product Color r value
Product Color r value
Fried Egg 0.49
Cola Ferrari 0.39
Red Meter 0.30
Jelly Bean 0.53
Milk Teeth 0.61
Banana Foam 0.40
Duo Fudge 0.58
Twin Cherry 0.43
Candy Cane 0.39
Blue Shark 0.54
Violet Prince 0.38
Jumbo Liquorices 0.50
Fizzy Bubblegum 0.63
Salt Skull 0.29
Table 10: Correlations Coefficient Value between Product Color and Respondent's Willingness to Buy
Table 11 below is the list of a significant relationship between the product‟s smell and the
respondents‟ willingness to buy that product. All of the significantly related relationships
have a positive correlation coefficient value range from 0.24 to 0.78.
Product Smell r value
Product Smell r value
Fried Egg 0.24
Cola Ferrari 051
Red Meter 0.48
Jelly Bean 0.44
Milk Teeth 0.41
Banana Foam 0.54
Duo Fudge 0.50
Twin Cherry 0.51
Candy Cane 0.54
Blue Shark 0.49
Violet Prince 0.56
Jumbo Liquorices 0.78
Fizzy Bubblegum 0.77
Salt Skull 0.51
Mini Strawberry Cable 0.61 Table 11: Correlations Coefficient Value between Product Smell and Respondent's Willingness to Buy
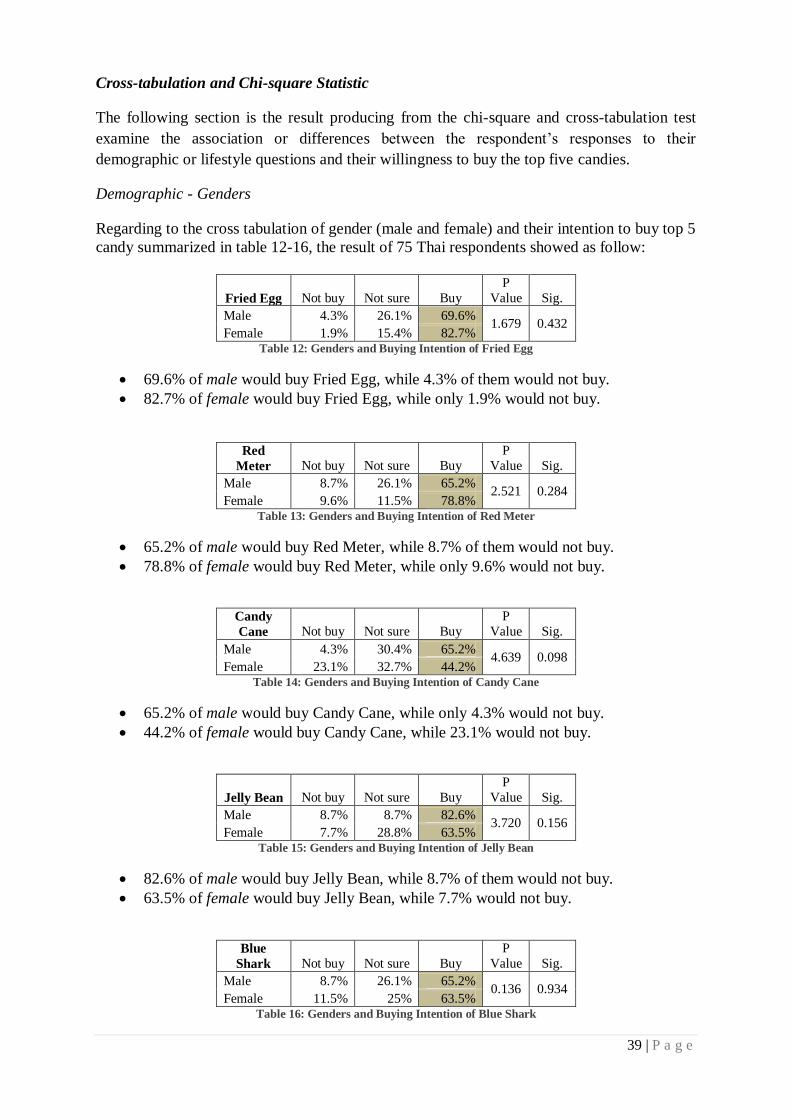
39 | P a g e
Cross-tabulation and Chi-square Statistic
The following section is the result producing from the chi-square and cross-tabulation test
examine the association or differences between the respondent‟s responses to their
demographic or lifestyle questions and their willingness to buy the top five candies.
Demographic - Genders
Regarding to the cross tabulation of gender (male and female) and their intention to buy top 5
candy summarized in table 12-16, the result of 75 Thai respondents showed as follow:
Fried Egg Not buy Not sure Buy
P
Value Sig.
Male 4.3% 26.1% 69.6% 1.679 0.432
Female 1.9% 15.4% 82.7% Table 12: Genders and Buying Intention of Fried Egg
69.6% of male would buy Fried Egg, while 4.3% of them would not buy.
82.7% of female would buy Fried Egg, while only 1.9% would not buy.
Red
Meter Not buy Not sure Buy
P
Value Sig.
Male 8.7% 26.1% 65.2% 2.521 0.284
Female 9.6% 11.5% 78.8% Table 13: Genders and Buying Intention of Red Meter
65.2% of male would buy Red Meter, while 8.7% of them would not buy.
78.8% of female would buy Red Meter, while only 9.6% would not buy.
Candy
Cane Not buy Not sure Buy
P
Value Sig.
Male 4.3% 30.4% 65.2% 4.639 0.098
Female 23.1% 32.7% 44.2% Table 14: Genders and Buying Intention of Candy Cane
65.2% of male would buy Candy Cane, while only 4.3% would not buy.
44.2% of female would buy Candy Cane, while 23.1% would not buy.
Jelly Bean Not buy Not sure Buy
P
Value Sig.
Male 8.7% 8.7% 82.6% 3.720 0.156
Female 7.7% 28.8% 63.5% Table 15: Genders and Buying Intention of Jelly Bean
82.6% of male would buy Jelly Bean, while 8.7% of them would not buy.
63.5% of female would buy Jelly Bean, while 7.7% would not buy.
Blue
Shark Not buy Not sure Buy
P
Value Sig.
Male 8.7% 26.1% 65.2% 0.136 0.934
Female 11.5% 25% 63.5% Table 16: Genders and Buying Intention of Blue Shark

40 | P a g e
65.2% of male would buy Blue Shark, while 8.7% of them would not buy.
63.5% of female would buy Blue Shark, while 11.5% would not buy.
Demographic – Age
Since there is an uneven distribution in the age range of the research, the authors had
transformed the age group into two different groups consisted of those who are younger than
26 and 26 years or older.
Regarding to the cross tabulation of two different age groups and their intention to buy top 5
candy summarized in table 17-21, the result of 75 Thai respondents showed as follow:
Fried Egg Not buy Not sure Buy P Value Sig.
Younger than 26 2.0% 17.6% 80.4% 0.447 0.8
26 and more than 4.2% 20.8% 75.0%
Table 17: Age Groups and Intention to Buy Fried Egg
80% of people whose age at younger than 26 years would buy Fried Egg, while only
2% of them would not buy.
75% of people whose age at 26 years and above would buy Fried Egg, while 4.2%
would not buy.
Red Meter Not buy Not sure Buy P Value Sig.
Younger than 26 5.9% 19.6% 74.5% 3.331 0.189
26 and more than 16.7% 8.3% 75.0%
Table 18: Age Groups and Intention to Buy Red Meter
74.5% of people whose age at younger than 26 years would buy Red Meter, while
5.9% of them would not buy.
75% of people whose age at 26 years and above would buy Red Meter, while 16.7%
would not buy.
Candy Cane Not buy Not sure Buy P Value Sig.
Younger than 26 13.7% 35.3% 51.0% 1.740 0.419
26 and more than 25.0% 25.0% 50.0%
Table 19: Age Groups and Intention to Buy Candy Cane
51% of people whose age at younger than 26 years would buy Candy Cane, while
13.7% of them would not buy.
50% of people whose age at 26 years and above would buy Candy Cane, while 25%
would not buy.
Jelly Bean Not buy Not sure Buy P Value Sig.
Younger than 26 5.9% 21.6% 72.5% 1.216 0.544
26 and more than 12.5% 25.0% 62.5%
Table 20: Age Groups and Intention to Buy Jelly Bean
72.5% of people whose age at younger than 26 years would buy Jelly Bean, while
5.9% of them would not buy.

41 | P a g e
62.5% of people whose age at 26 years and above would buy Jelly Bean, while 12.5%
would not buy.
Blue Shark Not buy Not sure Buy P Value Sig.
Younger than 26 9.8% 25.5% 64.7% 0.125 0.939
26 and more than 12.5% 25.0% 62.5%
Table 21: Age Groups and Intention to Buy Blue Shark
64.7% of people whose age at younger than 26 years would buy Jelly Bean, while
9.8% of them would not buy.
62.5% of people whose age at 26 years and above would buy Jelly Bean, while 12.5%
would not buy.
Demographic - Income
Regarding to the cross tabulated statistics of five different income levels and their intention to
buy top 5 candy summarized in table 22-26, the result of 75 Thai respondents showed as
follow:
Fried Egg Not buy Not sure Buy P Value Sig.
Less than 10,000 THB 0.0% 40.0% 60.0%
8.606 0.377
10,000 - 20,000 THB 0.0% 30.0% 70.0%
20,001 - 30000 THB 3.3% 13.3% 83.3%
30,001 - 40,000 THB 0.0% 8.3% 91.7%
More than 40,000 THB 12.5% 12.5% 75.0%
Table 22: Income Levels and Intention to Buy Fried Egg
60% of people whose income levels are less than 10,000 THB would buy Fried Egg,
while 0% would not buy it. This means that all the respondents with this income level
would buy this candy.
70% of people whose income levels are in between 10,000-20,000 THB would buy
Fried Egg, while 0% would not buy it. This means that all the respondents with this
income level would buy this candy.
83.3% of people whose income levels are in between 20,001-30,000 THB would buy
Fried Egg, while only 3.3% would not buy it.
91.7% of people whose income levels are in between 30,001-40,000 THB would buy
Fried Egg, while 0% would not buy it. This means that all the respondents with this
income level would buy this candy.
75% of people whose income levels are more than 40,000 THB would buy Fried Egg,
while only 12.5% would not buy it.
Red Meter Not buy Not sure Buy P Value Sig.
Less than 10,000 THB 0.0% 0.0% 100.0%
4.249 0.834
10,000 - 20,000 THB 10.0% 15.0% 75.0%
20,001 - 30000 THB 13.3% 13.3% 73.3%
30,001 - 40,000 THB 8.3% 25.0% 66.7%
More than 40,000 THB 0.0% 25.0% 75.0%
Table 23: Income Levels and Intention to Buy Red Meter

42 | P a g e
100% of people whose income levels are less than 10,000 THB would buy Red Meter,
while 0% would not buy it. This means that all the respondents with this income level
would buy this candy.
75% of people whose income levels are in between 10,000-20,000 THB would buy
Red Meter, while 10% would not buy it.
73.3% of people whose income levels are in between 20,001-30,000 THB would buy
Red Meter, while only 13.3% would not buy it.
66.7% of people whose income levels are in between 30,001-40,000 THB would buy
Red Meter, while 8.3% would not buy it.
75% of people whose income levels are more than 40,000 THB would buy Red Meter,
while only 0% would not buy it. This means that all the respondents with this income
level would buy this candy.
Candy Cane Not buy Not sure Buy P Value Sig.
Less than 10,000 THB 40.0% 40.0% 20.0%
6.699 0.569
10,000 - 20,000 THB 5.0% 30.0% 65.0%
20,001 - 30000 THB 20.0% 26.7% 53.3%
30,001 - 40,000 THB 16.7% 41.7% 41.7%
More than 40,000 THB 25.0% 37.5% 37.5%
Table 24: Income Levels and Intention to Buy Candy Cane
20% of people whose income levels are less than 10,000 THB would buy Candy
Cane, while 40% would not buy it.
65% of people whose income levels are in between 10,000-20,000 THB would buy
Candy Cane, while 5% would not buy it.
53.3% of people whose income levels are in between 20,001-30,000 THB would buy
Candy Cane, while only 20% would not buy it.
41.7% of people whose income levels are in between 30,001-40,000 THB would buy
Candy Cane, while 16.7% would not buy it.
37.5% of people whose income levels are more than 40,000 THB would buy Candy
Cane, while only 25% would not buy it.
Jelly Bean Not buy Not sure Buy P Value Sig.
Less than 10,000 THB 0.0% 40.0% 60.0%
7.424 0.492
10,000 - 20,000 THB 10.0% 35.0% 55.0%
20,001 - 30000 THB 6.7% 23.3% 70.0%
30,001 - 40,000 THB 8.3% 0.0% 91.7%
More than 40,000 THB 12.5% 12.5% 75.0%
Table 25: Income Levels and Intention to Buy Jelly Bean
60% of people whose income levels are less than 10,000 THB would buy Jelly Bean,
while 0% would not buy it. This means that all the respondents with this income level
would buy this candy.
55% of people whose income levels are in between 10,000-20,000 THB would buy
Jelly Bean, while 10% would not buy it.
70% of people whose income levels are in between 20,001-30,000 THB would buy
Jelly Bean, while only 6.7% would not buy it.
91.7% of people whose income levels are in between 30,001-40,000 THB would buy
Jelly Bean, while 8.3% would not buy it.

43 | P a g e
75% of people whose income levels are more than 40,000 THB would buy Jelly Bean,
while only 12.5% would not buy it.
Blue Shark Not buy Not sure Buy P Value Sig.
Less than 10,000 THB 40.0% 0.0% 60.0%
12.177 0.143
10,000 - 20,000 THB 0.0% 30.0% 70.0%
20,001 - 30000 THB 16.7% 20.0% 63.3%
30,001 - 40,000 THB 8.3% 25.0% 66.7%
More than 40,000 THB 0.0% 50.0% 50.0%
Table 26: Income Levels and Intention to Buy Blue Shark
60% of people whose income levels are less than 10,000 THB would buy Blue Shark,
while 40% would not buy it.
70% of people whose income levels are in between 10,000-20,000 THB would buy
Blue Shark, while 0% would not buy it. This means that all the respondents with this
income level would buy this candy.
63.3% of people whose income levels are in between 20,001-30,000 THB would buy
Blue Shark, while only 16.7% would not buy it.
66.7% of people whose income levels are in between 30,001-40,000 THB would buy
Blue Shark, while 8.3% would not buy it.
50% of people whose income levels are more than 40,000 THB would buy Blue
Shark, while only 0% would not buy it. This means that all the respondents with this
income level would buy this candy.
Cross-Tabulated Statistics showed that the groups of income levels that have the highest
possibility to buy each candy are as follow:
People who would buy “Fried Egg” the most are people whose income levels are in
between 30,001-40,000 THB (91.7%).
People who would buy “Red Meter” the most are people whose income levels are less
than 10,000 THB (100%).
People who would buy “Candy Cane” the most are people whose income levels are in
between 10,00-20,000 THB (65%).
People who would buy “Jelly Bean” the most are people whose income levels are in
between 30,001-40,000 THB (91.7%).
People who would buy “Blue Shark” the most are people whose income levels are in
between 10,000-20,000 THB (70%).
Psychographic
In order to easily categorize the group of respondents for all the psychographics or lifestyle
groups, new valuables were adjusted for the measurement of the Chi-Square and Cross-
Tabulation. The five level of agreement or the likert scale were decoded and group into three
different groups (1 = low, 2 = moderate, 3 = high). First group “low” consider of those
respondents who answered strongly disagree and disagree. The “moderate” groups are those
answered neutral and the “high” group represent those who answered agree and strongly
agree.

44 | P a g e
Green Lifestyle
Red Meter Not buy Not sure Buy P Value Sig.
Low 7.1% 28.6% 64.3%
9.765 0.045 Moderate 12.0% 28.0% 60.0%
High 8.3% 2.8% 88.9%
Table 27: Lifestyles and Intention to Buy Red Meter
People respond low in green lifestyle would buy Red Meter accounting for 64%.
People respond in moderate in green lifestyle would buy Red Meter accounting for
60%
People respond high in green lifestyle would buy Red Meter accounting for 88.9%
One-Way ANOVA Statistic (Compare mean)
This section will be giving the data retrieved from the ANOVA test, which illustrated in
Appendix D. However, due to the large amount of raw data processed from the calculation,
only the variables with a level of significant of less than 0.05 which reject the null hypothesis
(Ho) that the group differs in term of their preferences toward each product feature were
presented below divided by each demographic and psychographic groups. The average mean
value was measured by the respondent‟s rating toward each product preference were 1
represented a negative preference toward that product feature and 5 indicated their positive
preference toward that product feature.
Demographic – Gender
The null hypothesis was rejected with a significant level of lower then 0.05 for Fried Egg‟s
taste, Red Meter‟s color and Candy Canes‟ color. The average mean preference of each
product feature for male and female can be seen in the Table 28 below.
Sig.
Mean
Male Female
Fried Egg Taste 0.026 3.70 4.15
Red Meter Color 0.025 3.70 4.21
Candy Cane Color 0.036 3.48 4.00 Table 28: One-way Anova - Gender & Top product feature preference
Fried Egg‟s Taste
Male have an average mean of 3.70, while female have an average mean of 4.15
Significant level 0.026 < 0.05, F-statistic = 5.13
Red Meter‟s Color
Male have an average mean of 3.70, while female have an average mean of 4.21
Significant level 0.025 < 0.05, F-statistic = 5.20

45 | P a g e
Candy Cane‟s Color
Male have an average mean of 3.48, while female have an average mean of 4.00
Significant level 0.036 < 0.05, F-statistic = 4.54
Demographic – Age
Similar to the Chi-Square and Cross-Tabulation statistics, the new age groups were used in
this analysis. The result of the ANOVA test in Appendix D (One-Way ANOVA: Age and
Top product features preference) showed that all null hypothesis have been accepted.
Demographic – Income/ Allowance
The null hypothesis was rejected with a significant level of lower then 0.05 for Fried Egg‟s
smell, Red Meter‟s color, Candy Canes‟ shape and color. The average mean preference of
each product feature for the different income groups was summarized in the Table 29 below.
Sig.
Mean
Less than
10,000 THB
10,000-
20,000 THB
20,001-
30,000 THB
30,001-
40,000 THB
More than
40,000 THB
Fried Egg Smell 0.011 3.80 4.10 3.73 3.08 3.38
Red Meter Color 0.014 4.80 4.40 4.03 3.50 3.63
Candy Cane shape 0.020 3.40 4.10 3.67 3.25 3.00
Candy Cane color 0.030 3.40 4.35 3.87 3.50 3.25 Table 29: One-way Anova - Income/Allowance & Top product feature prefernce
Fried Egg‟s Smell
The average mean for respondents those income less than 10,000 THB, 10,000-
20,000 THB and 20,001 – 30,000 THB are 3.80, 4.10 and 3.73 respectively. While the
average mean for those income range from 30,001 – 40,000 THB and more than
40,000 THB are slightly lower at 3.08 and 3. 38 respectively.
Significant level 0.011 < 0.05, F-statistic = 3.51
Red Meter‟s Color
The average mean for respondents those income less than 10,000 THB, 10,000-
20,000 THB and 20,001 – 30,000 THB are 4.80, 4.40 and 4.03 respectively. While the
average mean for those income range from 30,001 – 40,000 TH and more than 40,000
THB are slightly lower at 3.50 and 3.63 respectively.
Significant level 0.024 < 0.05, F-statistic = 3.39
Candy Cane‟s Shape
The average mean for respondents those income less than 10,000 THB, 20,001 –
30,000 THB, 30,001 – 40,000 THB and more than 40,000 THB are 3.40, 3.67, 3.25
and 3.00 respectively. While the average mean for those income range from 10,001 –
20,000 THB are slightly higher at 4.10.
Significant level 0.020 < 0.05, F-statistic = 3.13

46 | P a g e
Candy Cane‟s Color
The average mean for respondents those income less than 10,000 THB, 20,001 –
30,000 THB, 30,001 – 40,000 THB and more than 40,000 THB are 3.40, 3.87, 3.50
and 3.25 respectively. While the average mean for those income range from 10,001 –
20,000 THB are slightly higher at 4.35.
Significant level 0.030 < 0.05, F-statistic = 2.85
Psychographic – Green lifestyle
In order to easily categorize the group of respondents for all the psychographics or lifestyle
groups, new valuables were adjusted for the measurement of the ANOVA test as well. The
five level of agreement or the likert scale were decoded and categorized into three different
groups (1 = low, 2 = moderate, 3 = high), as same as for the Cross-Tabulation and Chi-
Square test in the previous section.
For the green lifestyle psychographic groups, the null hypothesis was rejected for the Red
Meter‟s texture and shape as displayed in the Table 30 below.
Sig.
Mean
Disagree Neutral Agree
Red Meter Texture 0.021 3.64 3.52 4.14
Red Meter Shape 0.006 3.00 3.24 3.92 Table 30: One-way Anova - Green lifestyle & Top product feature prefernce
Red Meter‟s Texture
The average mean of those who responded low and moderate in green lifestyle are
3.64 and 3.52 respectively, while those who responded high have the average mean of
4.14
Significant level 0.0261< 0.05, F-statistic = 4.08
Red Meter‟s Shape
The average mean of those who responded low and moderate in green lifestyle are
3.00 and 3.24 respectively, while those who responded high have the average mean of
3.92
Significant level 0.006 < 0.05, F-statistic = 5.46
Psychographic – Healthy lifestyle
For this psychographic healthy lifestyle group, the null hypothesis was rejected for Fried
Egg‟s taste. The average preference mean of each product features was presented in the Table
31 below.
Sig.
Mean
Disagree Neutral Agree
Fried Egg Taste 0.022 4.63 4.06 4.15

47 | P a g e
Table 31: One-way Anova - Healthy lifestyle & Product feature preference
Fried Egg‟s Taste
The average mean of those response low in healthy lifestyle is 4.63, while those
whose response moderate and high have the mean average of 4.06 and 4.15
respectively.
Significant level 0.022< 0.05, F-statistic = 4.02
Psychographic – Fashion lifestyle
The One-Way ANOVA test result showed a significant level of less than 0.05 for 5 different
product features among the fashion lifestyle groups including the color of Fried Egg, Jelly
Bean‟s shape and color and both of the taste and shape of the Blue Shark. The value of
differences in the mean was summarized in the Table 32 below.
Sig.
Mean
Disagree Neutral Agree
Fried Egg Color 0.048 4.20 3.88 3.54
Jelly Bean Shape 0.004 3.08 4.06 3.98
Jelly Bean Color 0.002 3.62 4.13 4.57
Blue Shark Taste 0.037 3.54 3.50 4.07
Blue Shark Shape 0.009 3.69 4.00 4.50 Table 32: One-way Anova - Fashion lifestyle & Product feature preference
Fried Egg‟s Color
Those who responded low in the fashion lifestyle have an average mean of 4.20 while
those responded moderate and high have an average mean of 3.88 and 3.54
respectively.
Significant level 0.048< 0.05, F-statistic = 3.17
Jelly Bean‟s Shape
Those who responded low in the fashion lifestyle have an average mean of 3.08 while
those responded moderate and high have an average mean of 4.06 and 3.98
respectively.
Significant level 0.004 < 0.05, F-statistic = 6.07
Jelly Bean‟s Color
Those who responded low in the fashion lifestyle have an average mean of 3.62 while
those responded moderate and high have an average mean of 4.13 and 4.57
respectively.
Significant level 0.002< 0.05, F-statistic = 7.05

48 | P a g e
Blue Shark‟s Taste
Those who responded low and moderate in the fashion lifestyle have an average mean
of 3.54 and 3.50 respectively, while those responded high have an average mean of
4.07
Significant level 0.037 < 0.05, F-statistic = 3.44
Blue Shark‟s Shape
Those who responded low in the fashion lifestyle have an average mean of 3.69 while
those responded moderate and high have an average mean of 4.00 and 4.50
respectively.
Significant level 0.009 < 0.05, F-statistic = 5.07
Psychographic – Technology lifestyle
For this psychographic group, only two product preferences were being rejected for its null
hypothesis, which included Red Meter‟s smell and Jelly Bean‟s shape. The details regarding
the average mean of each group were summarized on the Table 33 below.
Sig.
Mean
Disagree Neutral Agree
Red Meter Smell 0.048 3.18 3.81 4.05
Jelly Bean Shape 0.016 3.36 3.63 4.14 Table 33: One-way Anova - Technology lifestyle & Product feature preference
Red Meter‟s smell
The average mean of those who responded low in technology lifestyle is 3.18,
whereas those responded moderate and high have an average mean of 3.81 and 4.05
respectively.
Significant level 0.048 < 0.05, F-statistic = 3.17
Jelly Bean‟s Shape
The average mean of those who responded low and moderate in technology lifestyle
are 3.36 and 3.63 respectively, whereas those responded high have an average mean
of 4.14.
Significant level 0.016< 0.05, F-statistic = 4.35
Psychographic – Outgoing lifestyle
The ANOVA statistical result showed no significant difference among outgoing lifestyle
psychographic groups and their preferences toward the product features of top five candies.

49 | P a g e
Question 7.1 – 7.6 Product Elements
As the below table 6, the average mean of such additional product features as sugar–free
ingredients, color, package, and brand are summarized by descriptive statistic function. (1 =
Strongly disagree, 2 = Disagree, 3 = Neutral, 4 = Agree, 5 = Strongly agree)
For product features, the mean average showed that respondents agreed with the statements
in Q.7.1, (I like to eat candy), Q. 7.3 (Candy should be colorful), and Q. 7.4 (The color
should represent its taste), while they neither agree nor disagree with other statements which
were Q. 7.2 (I prefer sugar-free candy), Q.7.5 (Candy should come in a package), and Q.7.6
(Candy with popular brand is better).
Question 7.7 – 7.9 Loose Candy Concept
For the concept of loose candy, respondents agreed with the statements in Q.7.7 (I like to
select the candy myself) and Q.7.8 (I like to be able to select the amount of each candy I
buy). They neither agreed nor disagreed or agreed with the statement in Q.7.9 (I like to try
new flavor of candy).
Candy and Features Mean
Q7.7 I like to eat candy 4.05
Q7.2 I prefer sugar-free candy 3.41
Q7.3 Candy should be colorful 4.19
Q7.4 The color should represent its taste 4.12
Q7.5 Candy should come in a package 3.55
Q7.6 Candy with popular band is better 3.27
Table 34: Descriptive Statistic of Candy Features
Loose candy concept Mean
Q7.7 I like to select the candy myself 4.53
Q7.8 I like to be able to select the amount of each candy I
buy 4.27
Q7.9 I like to try new flavor of candy 3.81
Table 35: Descriptive Statistic of Loose Candy Concept

50 | P a g e
5. Analysis
This section the authors showed the analysis of Thai consumer perception toward loose candy
and its relevant factors that lead them to purchase candies, which are used as the bases for the
recommendation and the answer to the research question of this study. The analysis was
performed according to each step of the conceptual framework of this research.
5.1 Concept of Loose Candy
The result in table 6-7 showed that Thai people like candy and the concept of loose candy
since they are able to select the candy they like and the amount of each candy themselves.
This can be seen as an opportunity for the loose candy and its concept to enter Thailand.
5.2 Preferences of Product Features through Multi Sensory
This section showed the analysis of the result based on the multi sensory systems that are
used by consumers to evaluate the candy features and other relevant attributes of candies.
5.2.1 Taste
Referring to the summarized descriptive statistics of product features in table 5, the top 3
candies that Thai people like their taste the most among 15 different candies were Fried Egg,
Red Meter, and Jelly Bean.
This means sour apple and fruity were the most preferred flavors for Thai people. A
statistical report of flavors in confectionery products as mentioned in findings chapter also
showed that a number of fruity flavors were ranked in the top 20 flavors in new confectionery
product launches in year 2004-2007. These fruity flavors are strawberry, fruit, orange,
cherry, raspberry, apple and grape. In addition, some fruity flavors such as mango,
pomegranate, cranberry, and elderberry are often used to promote healthy benefits for non-
chocolate candies because some of them contain the real fruit juice or pulp.
5.2.2 Texture
The top 4 candies that Thai people like their texture the most were Fried Egg, Jelly Bean,
Blue Shark, and Red Meter. It indicates that the preferred texture Thai people like were Soft
gummy, Hard-covered gummy and Gel sugar coated.
5.2.3 Shape and Color
Among 15 different candies, the top 3 candies that Thai people like their shape the most were
Blue Shark, Twin Cherries, and Fried Egg. It can be said that people would rather prefer the
shapes of candy that it would make them realize that it is eatable such as fish, food, and fruit
than geometric shapes like square, cylinder or circle. This statement is supported by the result
shown in the table of descriptive statistics of 15 candies, as a fish shape of Blue Shark is the
best and most preferred in term of shape among 15 candies as well as a fruit shape of Twin
Cherries and a food shape of Fried Egg.

51 | P a g e
The top 3 candies that Thai people like color the most were Red Meter, Blue Shark, and Jelly
Bean. This showed that Thai people would prefer colorful candies as these candies were
colored in blue, pink, green, orange, violet, yellow and white. By looking at the top preferred
colors, it can be said that people like colorful candies. This statement also supported by the
levels of agreement that people agreed that candies should be colorful from question 7.3 in
the questionnaire. Moreover, the research also suggested that the mean average of
respondents agreed that the color of each candy should represent its taste.
5.2.4 Smell
The top 3 candies that Thai people like their smell the most were Fried Egg, Duo Fudge, and
Candy Cane which all of them have a unique stand out smell rather than the other candies.
For example, Fried egg has fruity smell, Duo Fudge has chocolate and vanilla smell, and
Candy Cane has fresh mint smell.
5.2.5 Package
Packaging was seen as essential if candies are being sold in Thailand where an annual
average temperature is totally different from their country of origin in Sweden, because
package would help to keep candies last longer from the changes in weather and
temperatures. Furthermore, there is supporting information stated that an attractive packaging
is sometimes used to create good sensory experience through vision in which it works as an
emotional cues. Packaging would also lead to the modification of flavor perception and level
of food acceptance. However, the result showed that Thai people were not worried whether
candies should come in the package from question 7.5.
5.2.6 Brand
The result from the question 7.6 showed that Thai people were not worried about the brand of
candy if it is a product of well known brand or not. This can be said that they were concerned
more about the other product features such as taste, texture, shape, color, and smell than the
brand.
5.2.7 Place
The results showed that the places where Thai people often went for buying candies were
supermarket, convenience store, and candy store.
5.3 Consumer Sensory Attribute
As the earlier section, the authors have mentioned regarding the result of how the respondents
think about each attribute of the 15 candy samples. This section has been moving on through
the research‟s conceptual framework to analyze regarding the sensory systems that were used
by the respondents as a tool to evaluate the features of the candy.
From the correlation statistic information, it reveals that there is a strong positive relationship
between each sense and the respondents‟ likeliness to buy the product, which implies that the
respondents used four valid senses except sound (taste, touch, vision and smell) as a tool to
evaluate the attributes of the product.

52 | P a g e
The correlation statistical result shown that out of 15 products, tastes have the highest level of
correlation with the respondent‟s willingness to buy where as texture rank at number two and
the rest of the feature were various among different types of candy based on both the
correlation coefficient and the significant level of the data. Therefore, it can that the taste and
the texture of the candies are the two most highly associated product‟s attributes with the
level of likeliness that the respondents will buy the product. Even though the statistical result
does not indicate the cause and effect of the variable, the strong significant positive
correlation coefficient can still be an evident that these product features which the customer
evaluated through their multi senses do related to how willing consumers will buy the
product.
5.4 Segmentation
The following part analyzed the similarity and difference among each demographic and
psychographic group of respondents regarding their perception and preference toward the
product features as well as their choice of product.
5.4.1 Demographic
Gender
When making a comparison between genders, the result of cross-tabulated (Appendix D)
statistics showed that females have higher possibility to buy Fried Egg and Red Meter than
male, while males have a higher possibility to buy Candy Cane, Jelly Bean, and Blue Shark
than female. However, the statistical indicator (significance level) indicated that the
proportion of male who would buy prefer to purchase these top 5 candies is not significantly
different from the proportion of female. This means that there appears to be no association
between gender and their willingness to buy these top 5 candies.
Moreover, the result of ANOVA test indicated that there is a significant difference between
gender (male and female) and their preferences in term of the taste of fruity flavor of Fried
Egg, the color red for Red Meter and Candy Cane, where female tends to have higher mean
average than male among these three product features. This means that female would prefer
the candy with red color more than male.
Age
Considering the overall result of cross-tabulated statistics regarding age groups and their
willingness to buy candy, Thai people whose age at younger than 26 years have a higher
possibility to buy these top 5 candies than Thai people whose at age 26 years and above.
However, the proportion of people whose age at younger than 26 years is not significantly
different from the proportion of people at age 26 years and above because the significance of
Pearson Chi-Square is more than 0.05. Thus, there appears to be no association between
different age groups and their willingness to buy these top 5 candies.

53 | P a g e
Similarly, since all the null hypothesis have been accepted for the ANOVA test of the age
groups and their top products‟ feature preferences, it indicated that all the age groups have no
differences in term of their preferences toward any product features of all top 5 candies.
Income
Cross-Tabulated statistics of Income levels and their willingness to buy candies showed that
the proportions of people in different levels of income are not significantly different, as all of
their significant levels are more than 0.05. Therefore, it considered to be no association
between different income levels and their willingness to buy these top 5 candies.
According to the result of Duncan‟s Post Hoc table and the ANOVA test in Appendix D
under One-way ANOVA income/allowance and top product features preferences, the
rejection of the null hypothesis showed that there are slightly different levels of product
features‟ preference between customer income groups for four different valuables. First,
people whose incomes more than 30,000 THB tend to prefer the orangey fruity smell of Fried
Egg and the red color of the Red Meter less than people whose income lower than 30,000
THB with the percentage different higher than 10 percent. Whereas, there are relatively
difference in the preference for the rectangular shape and red color of Candy Cane for those
incomes range from 10,000 to 20,000 THB and other income groups.
5.4.2 Psychographic
Green lifestyle
Cross-Tabulated Statistics (Appendix D) showed that there is a significant difference between
the proportion of people who responded higher green lifestyle and their willingness to buy
Red Meter (Significant 0.045 < 0.05). In other words, there is an association between their
willingness to buy Red Meter and green lifestyle.
However, the rest of the statistical result indicated that the proportions of people who
responded high in green lifestyles are not significantly different in their willingness to buy
other 4 top candies, as all of them have a significant level of higher than 0.05. So, there is no
association between green lifestyles and the willingness to buy other top 4 candies.
The ANOVA statistical result indicated the significant level of differences among the green
life style group and their preference toward the texture and shape of the Red Meter. The
respondents rated high in the green lifestyle tend to have a higher preference toward both the
texture and shape of the Red Meter than those who respond low and moderate.
Healthy lifestyle
Referring to ANOVA test, the null hypothesis was rejected for the taste of Fried Egg, it
indicates that the groups of healthy lifestyle differ in term of their preferences toward the
fruity taste of Fried Egg. According to Duncan‟s Post Hoc result, there is a different level of
preferences for Fried Egg„s taste between the respondents who ranked low in healthy lifestyle

54 | P a g e
and those who ranked moderate and high, with the percentage difference higher than 10
percent; this mean that the low healthy lifestyle group tends to prefer the fruity taste of Fried
Egg more than the other two groups.
Fashion Lifestyle
The ANOVA statistical test showed a significant different among the fashion lifestyle groups
in term of the selected five sugar confectionary product features. First, there is a different
level of preference for the white & yellow color of Fried Egg between people who answered
high in fashion lifestyle and those responded low.
Secondly, for Jelly Bean, there are significant differences in the level of preference for its
bean shape and multi color between the people who responded low and the other two groups.
Interestingly, the more the respondents tend to be interested in fashion the more they seem to
prefer the white & yellow color of Fried Egg and the multi color of Jelly Bean, which consist
of colorful. Moreover, the fashion lifestyle group are also differ in term of their preference
toward the fruity taste and fish shape of Blue Shark, where there is a significant different
between those who respond high and the rest of the group.
Technology lifestyle
The null hypothesis was rejected for the smell of Red Meter and Jelly Bean‟s Shape,
indicated that the groups of technology lifestyle differ in term of their preferences toward Red
Meter‟s smell and Jelly Bean‟s shape. According to Duncan‟s Post Hoc result, there is a
different level of preference for the sour fruity smell of Red Meter between the respondents
who ranked low in technology lifestyle and those moderate and high, with the percentage
different higher than 10 percent. The low technology lifestyle group tends to have a lower
average mean then the other two groups.
As for the difference in preference for Jelly Bean‟s shape, those responded high in
technology lifestyle are different from the one who responded moderate and low. The high
technology lifestyle tends to have a higher level of preference for the bean shape of Jelly
Bean than the rest of the group.
Outgoing lifestyle
Since all the null hypothesis have been accepted for the ANOVA test of the outgoing lifestyle
group and their preferences toward product features of top five candies, it can be indicated
that there is no significant difference in the outgoing lifestyle groups in term of their
preferences toward all the top five product features.

55 | P a g e
6. Conclusion
This chapter concludes the research result of the study by answering the research question
regarding the perception of Thai consumer toward loose candy (lösgodis). The managerial
implication as well as the suggestion for future research will be discussed at the end of this
chapter.
The aim of this research was to identify and describe the perception of Thai consumers
toward sugar confectionery products with the concept of loose candy (lösgodis) by putting an
emphasis on the preferences of product features and the choices of product.
The research which included the combination of experimental product (candies) tasting with
a structured questionnaire conducting with a group of people from 2-9 people (75 people as
totally) and an interview with the salespeople of a candy store in Vasteras, Sweden together
with reliable sources of secondary data from textbook, online database, and internet.
The survey result confirmed that Thai people like candy as well as the concept of loose candy
and most of them eat candy 2-3 times a week.
By allowing people to try the sample candies and evaluate product features (taste, texture,
shape, color, and smell) through their multi senses (vision, taste, touch, and smell), the
research revealed that the most preferred flavor / taste for Thai people were fruity flavors,
meanwhile the texture was soft gummy. For shape and color, Thai people like colorful
candies and those colors should represent its taste, and they preferred the shape of candy that
they can easily relate to in the sense that it is eatable (food shape). Thai people also like the
smell of candy that was uniquely sweet-stands out. (fruity, chocolate/vanilla, and fresh mint).
As the purpose of this study is not only to identify the perception and preferences of
consumers toward sugar confectionery products, but to investigate the similarities and
differences among them. The demographics and psychographic information of respondents
were also examined. Demographic characteristics include age, gender, and income, while
psychographics are referred to as lifestyles. After investigating these elements, the result
showed as follow:
Different gender (male and female) does not have significant differences in their
choice of buying sugar confectionery products; however, there are minor differences
in their preferences of red color candy.
Different age groups do not have an effect or create any differences for their
preferences and their choices of sugar confectionery products. Age may not be used as
an indicator to describe how people prefer their candy.
Different levels of income do not have any differences in their choices of sugar
confectionery products. However, there are minimum differences between different
income groups in term of their preferences of product features, where people who
have income/allowance higher than 30,000 THB prefer the orangey fruity smell and
color red than other income group.
Different lifestyles of people indicate a minor difference in perception and
preferences toward sugar confectionary products and choice of candy. People who

56 | P a g e
responded high in green lifestyle would prefer to buy candy which have similar over
all feature to Red Meter, and they also have positive perception toward gel sugar-
coated texture and roll shape. Whereas, the respondents who responded to low healthy
lifestyle prefer the fruity taste of Fried Egg more than those who ranked higher in the
healthy lifestyle. In addition, people with high fashion lifestyle prefer candies that
have variety of colors. For the technology lifestyle, the people who responded high
tends to prefer the bean shape of the Jelly Bean then the rest of the groups.
Interestingly, there is no difference among the outgoing lifestyle groups in either their
choice of products or their preferences of the product features.
6.1 Managerial Implication
When the marketers see the opportunity in a new foreign market and decide to expand into
that market, they need to consider the uncertainty and unfamiliar problems that lies ahead.
This requires an adjustment of the marketing mix that will cope with the constraints. By
performing this research, the authors would like to recommend the marketers to set their
marketing plan according to some of the following suggestion below.
Product
Since there are more than 200 different types of loose candies sold in the market, the right
combination of candies should be selected. For Thai market, the authors recommended the
managers to select the candies with a familiar taste for Thai people such as fruity flavor
candies. Moreover, even though liquorices was not preferred by the Thai people when after
they tried it, but it may be wise to have a few selections of liquorices since it will be able to
be a differentiation point of the company with the existing local competitors in Thai market.
Additionally, this type of candy may as well attract experiential customers who are interested
in trying new products that they have never encountered before. Meanwhile, the introduction
of such healthy products as sugar free or less sweet candies as an alternative for Thai people
is considered as another wise idea, since people are becoming more aware of the impact of
food and the healthy trends are likely to be increase in the future.
Price
Regarding the current price of candy sold in Sweden is at around 79 SEK per kilogram (395
THB / 13 USD) which are cheaper than the average selling price in Thai market which are in
between 100-140 SEK per kilogram (500-700 THB / 16.5-23 USD).
Therefore, the recommended selling price for loose candy should be set within the same price
range as the current imported candies with the same quality in Thailand. However, import
taxes and other relevant costs must be taken into account in pricing of candy.
Place
The places where Thai people often went for buying candies were supermarket, convenience
store, and candy store. For every food marketing industry, accessibility is one the most
important factors; therefore, the store locations should be where the target market would be
able to access easily. As the research suggested that supermarket, convenience store, and

57 | P a g e
candy store and the famous outlet for the respondents to buy candy, this choice should not be
disregarded.
Promotion
Normally there were no promotions except the price discounts for loose candy. From the
research result, there is an indication that brand was not an important factor when consumers
were deciding to buy loose candy candies since the brand was usually not visible to the
customer. However, this does not mean that the promotions of the brand should be ignored.
Moreover, since the concept if loose candy is still relatively new to the Thai market in order
to let the customer understand and recognize the concept, some promotional campaign and
different advertising tools should be considered.
6.2 Suggestion for Future Research
As a recommendation, further research in the area of confectionery products or loose candy
can be suggested. The data from this research also allows interested individuals to also
conduct and examine the purchase intention of the Thai customers toward loose candy by
performing statistical regression analysis showing how each sense or product feature have an
effect on the customer‟s purchase intention. Since the purpose of this research was not
focused on the purchase intention of the consumers, this analysis was not performed.
Moreover, future researchers can also change the focus of research from product level of
loose candy to the company level by studying based on a particular company. Not only that,
the potential researcher can also expand the topic of just sugar confectionary products - loose
candy- to other types of confectionary products, such as chocolate or gum.
It is also interesting to conduct a further research by comparing the consumer preferences
between Thai and Swedish sugar confectionery products, which will allow the company or
the interesting partners to explore the similarities and differences of consumer preferences
and perception between the products from these two countries.

i | P a g e
REFERENCES
Aki-ko. (2011). aki-ko, the Modern Retailer for the Snacks and Confectionary. Retrieved June 7, 2011, from
aki-ko.com: http://www.aki-ko.com/eng/main.html
Borden, N. H. (1964). The concept of marketing mix. Journal of Advertising Research .
Bourne, A. C. (2002). Food Texture and Viscosity: Concept and Measurement. Academic Press.
BrandAge. (2009, November 25). BrandAge.com. Retrieved May 16, 2011, from Heart Beat “Legend of
Love Forever” - 25th years campaign with 25 percent growth in the first Quarter of year 2010:
http://www.brandage.com/Modules/DesktopModules/Article/ArticleDetail.aspx?tabID=6&ArticleID=
4725&ModuleID=6&GroupID=137
Business Insights. (2011). Future Directions in Confectionery: The impact of key trends on innovation and
growth opportunities in the global. Business Insights.
Cateora, P., Gilly, M., & Graham, J. (2009) International Marketing. (14th
ed) New York, NY: McGraw-Hill
Irwin.
CIA. (2011). People:Thailand. Retrieved April 26, 2011, from CIA:The World Factbook:
https://www.cia.gov/library/publications/the-world-factbook/geos/th.html
Datamonitor. (2010, October). Confectionery in Sweden - Market Forecast & Consumer Demographics.
Retrieved May 16, 2011 from Research and Markets:
http://www.researchandmarkets.com/reportinfo.asp?cat_id=0&report_id=1524245&q=Confectionery
%20in%20Sweden%20to%202014&p=1
Datamonitor. (2010, October). Confectionery in Thailand - Market Forecast & Consumer Demographics .
Retrieved April 22, 2011, from Research and Markets:
http://www.researchandmarkets.com/reportinfo.asp?cat_id=0&report_id=1524248&q=Confectionery
%20in%20Thailand&p=1
Datamonitor. (2010, October). Confectionery in Thailand to 2014. Retrieved May 16, 2011, from Research
and Markets:
http://www.researchandmarkets.com/reportinfo.asp?cat_id=0&report_id=1367281&q=Confectionery
%20in%20Thailand&p=1
Engel J. F., Blackwell R D and Miniard P W (1986) Consumer Behaviour, 5th edn, Dryden Press, Chicago;
8th edn, 1995
Evans et al. (2009). Consumer Behaviour. West Sussex, England: John Wiley & Sons Ltd.
Fisher, C. (2007) Researching and Writing a Dissertation for Business Students. (2th ed) Halow, England:
Pearson Education Limited.
Ghauri, R.N. (2010) Internation Marketing. (3rd
ed) Berkshire, UK: Mc Grae-Hill Education.
Hauser, J. R. and G. L Urban. (1993): Design and Marketing of New Products, Prentice-Hall, Second
Edition

ii | P a g e
Hult, Tomas, Cavusgi, T., Kiyak T., Deligonul S. & Lagerström K. (2007). What Drives Performance in
Globally Focused Marketing Organizations? A Three-Country Study. Journal of International
Marketing, 15, 58-85.
Hoyer, W.D. & MacInnis, D.J. (2001): Consumer Behavior, 2nd Ed. USA: Houghton Mifflin Company
IBM Corporation. (2010). IBM SPSS Statistics Products. Retrieved May 17, 2011, from IBM SPSS
Statistics: http://www.spss.com/software/statistics/products/
Imram, N., (1999), “The role of visual cues in consumer perception and acceptance of a food product”, Vol:
99, Issue: 5, pp. 224 – 230.
Jankowicz, A.D. (1991) Business Research Projects fro Students, London:Chapman & Hall.
Karamellkungen. (2011). About Candy King. Retrieved April 30, 2011, from Karamellkungen (Candy
King):
http://www.candyking.com/Candyking/templates/Candyking_Page.aspx?id=1592&epslanguage=EN
Karamellkungen. (2011). Product. Retrieved April 30, 2011, from Karamellkungen (Candy King):
http://www.candyking.com/Candyking/templates/Candyking_StartPage.aspx?id=1558&epslanguage=
EN
Kasikornbank. (2011). Foreign Exchange Rate. Retrieved May 5, 2011, from Kasikornbank:
http://www.kasikornbank.com/EN/RatesAndFees/ForeignExchange/Pages/ForeignExchangeHistory.as
px?d=4&m=5&y=2011&r=0
Kotler, P., & Armstrong, G. (2008). Principles of Marketing. New Jersey, USA.Louden D L and Della Bitta
A J (1993) Consumer Behaviour, McGraw Hill, New York
Lawless, H., & Heymann, H. (2010). Sensory Evaluation of Food: Principles and Practices. New York,
USA: Springers Science+Business Media, LLC.
Maxham, J. G. (2001). Service recovery‟s influence on consumer satisfaction, positive word-of-mouth, and
purchase intentions. Journal of Business Research , 11-24.
Montanari, Massimo, & Sonnenfeld. (2006). Food is Culture. New York, USA: Columbia University Press.
NSO. (1999). The gender statistics survey. Retrieved April 26, 2011, from National Statistic Office
Thailand: http://web.nso.go.th/en/survey/gender/gender.htm
Oliver R L (1980) Cognitive Model of the Antecedents and Consequences of Satisfaction Decisions, Journal
of Marketing Research, Vol 17, November, pp 460-469
Pallant, Julie. (2010), SPSS Survival Manual: A step by step guide to data analysis using SPSS ( 4th Ed.).
Berkshire: Open University Press.
Perner, L. (2008). Food Marketing. Retrieved May 13, 2011, from USC Marshall, University of Southern
California: http://www.consumerpsychologist.com/food_marketing.html
Raithatha, C. (2008). Future Flavor Trends in Food - New opportunities in sensory innovation. Business
Insights .
Ries A and Trout J (1986) Positioning: The Battle for Your Mind, McGraw Hill, New York

iii | P a g e
Rowntree, D. (1991). Statistic Without Tears, Harmondsworth: Prnguin.
Simpson, P. V. (2010, April 1). News & Features. Retrieved May 16, 2011, from The Local: Sweden's News
in English: http://www.thelocal.se/25854/20100401/
Snoj, B., Pisnik Korda, A. & Mumel, D., (2004): “The relationships among perceived quality, perceived risk
and perceived product value” Journal of Product & Brand Management, Vol 13, No 3, pp156-167.
Solomon, M. (2006). Consumer Behaviour “Buying, having and being, Prentice Hall, p. 7
Stone, H. and Sidel, J. L. 2004. Sensory Evaluation Practices, Third Edition. Academic, San Deigo.
Thansettakij Co., Ltd. (2009, September 30). Confectionery Market Faces a Number of Challenges.
Thansettakij .
The Local. (2011, April 17). Swedish Easter eggs contain slaughter waste. Retrieved May 16, 2011, from
The Local: Sweden's News in English: http://www.thelocal.se/33256/20110417/
WeatherOnline Ltd. (2011). Climate of the World - Sweden. Retrieved May 16, 2011, from WeatherOnline:
http://www.weatheronline.co.uk/reports/climate/Sweden.htm
WeatherOnline Ltd. (2011). Climate of the World - Thailand. Retrieved May 16, 2011, from WeatherOnline:
http://www.weatheronline.co.uk/reports/climate/Thailand.htm

iv | P a g e
BIBLIOGRAPHY
Bochkareva, A., & Petrova, K. (2010). Advertising as a Marketing Communication Tool - Differences and
similarities between customers' perception and company's expectation. Vasteras: Mälardalen
University.
Bruwer, J., Saliba, A., & Miller, B. (2011). Consumer Behaviour and Sensory Preference Differences:
Implications for Wine Product Marketing. Journal of Consumer Marketing , 5-18.
Ghauri, R.N. (2010) Internation Marketing. (3rd
ed) Berkshire, UK: Mc Grae-Hill Education.
Ghauri, P., Grønhaug, K. (2010) Research Methods in Business Studies. (4th ed) Harlow, UK: Pearson
Educaion Limited.
Lofving, P. (2005). Confectionary with Functional Ingredients - What does the Swedish consumer say?
Stockholm: Lund University.
Promdee, L., Trakulthong, J., & Kangwantrakul, W. (2007). Sucrose Consumption in Thai Undergraduate
Students. Asia Pac J Clin Nutr , 22-26.
Suwannaporn, P., Anita, L., & Chaveesuk, R. (2008). Consumer Preference Mapping for Rice Product
Concepts. British Food Journal , 595-606.

v | P a g e
APPENDIX
Appendix A – Draft Questionnaire
This questionnaire is a part of student master thesis at Mälardalen University. All information given in this
questionnaire will be used for research purpose only and they will be kept confidential. Thank you for your
kind cooperation.
Course Name: EFO705 Master Thesis Advisor: Tobias Eltebrandt
Candy Consumption
1. Do you eat candy? Yes No
2. How often do you eat candy?
everyday 2-3 times a week once a week less than once a week
3. On average, how much do you spend on purchasing candy per time? (THB)
less than 50 50 - 100 101 - 150 151 – 200 more than 200
4. How much do you like candy: (Please select only one)
I love candy I like candy I neither like nor dislike candy I dislike candy I hate candy
5. Where do you usually buy candy? (Can select more than one)
supermarket convenient store candy store specialty store
gas station drug store restaurant
Other (please specify) __________________
Perception
6. Please mark ‘X’ on how much do you like the following feature of each product (1 = the least, 5 = the
most)
7.

vi | P a g e

vii | P a g e
8. Do you agree or disagree with these following statements?
Personal information
9. What is your gender? Male Female
10. What is your age?
Younger than 20 20-22 23 - 25 26 - 28 28 - 30 Older then 30
11. What are your income / allowance per month (THB)?
Less than 10,000 10,000 – 20,000 20,001 – 30,000 30,001 – 40,000 More than 40,000

viii | P a g e
Appendix B – Selected Loose Candy Sample List
No. Category Name Picture Shape/Color Flavor Texture
1 Foam Fried Egg
(Stekta ägg)
Sunny side up
egg
Fruity Soft foamy
2 Jelly Red Meter
(Röd meter)
Long red tape Sour apple Gel sugar
coated
3 Jelly Milk Teeth
(Mjölktänder)
Teeth Fruity Chewy
4 Fudge Duo Fudge
Light and dark
brown square
chocolate and
vanilla
Soft grainy
5 Hardboiled Candy Cane
(Polkagrisar)
Rectangular Fresh Mint Hard Candy
6 Foam Violet Prince
(Violprins)
Blue Frog Sugar Foamy
7 Jelly Fizzy Bubblegum
(Bubblizz)
Blue and red
bottle
Sour & sweet
fruit
Sugary
coated

ix | P a g e
8 Jelly Mini Strawberry
cables
(Jordgubbskablar)
Long red stick Cream filled
strawberry
Soft gummy
9 Jelly Cola Ferrari
Cars Cola Chewy
gummy
10 Covered
Sweet
Jelly Bean
Multi color
beans
Multiple fruity
favor
Hard cover
gummy
11 Foam Banana Foam
(Skumbanan)
Banana Banana Foamy
12 Jelly Twin Cherries
Cherries Cherry Soft gummy
13 Foam BlueShark
Blue Shark Berry Soft gummy
14 Liquorices Jumbo Liquorice
(Jumbolakrits)
Black
geometric
shape
Sweet
liquorices
Gummy
15 Liquorices Salt Skull
(Saltskallar)
Black skull Salty
liquorices
Salt covered
gummy

x | P a g e
Appendix C – Interview Questions
Part one – Background information
1. What is your name?
2. How many years the store has been operated?
3. What are the opening hours of the store? Does the store open every day?
4. Do you own this store yourself or it is a part of any candy chain?
5. Who are your major customers?
6. What kind of products do you offer and where do you supply them from?
Part two – Candy feature
7. Does the candy available in the store are all from Sweden? If not what other country was it from?
8. In what kind of package do the candies come in when you buy it from the whole seller or the
producer? Can you show us?
9. How long can the candies last until it get hard or go bad?
Part Three– Factor effecting candy
10. Does weather have an effect on the candies?
11. Will a hot temperature let say 30°C make the candies turn bad or will affect the candies?
12. What do you do to prevent the candies from going bad or perishable?
Part Four – Promotional factor
13. What kind of promotion do you have?

xi | P a g e
Appendix D – Survey Empirical Data from SPSS
Correlation Statistic: Product feature and Choice
Correlations - Product 1 (Fried Egg)
Fried Egg
Taste
Fried Egg
Texture
Fried Egg
Shape
Fried Egg
Color
Fried Egg
Smell
How likely
you will
buy Fried
Egg
How likely
you will buy
product 1
Pearson
Correlation
0.551** 0.503** 0.694** 0.486** 0.235* 1
Sig. (2-
tailed)
.000 .000 .000 .000 .042
N 75 75 75 75 75 75
Correlations – Product 2 (Red Meter)
Red Meter
Taste
Red Meter
Texture
Red Meter
Shape
Red Meter
Color
Red Meter
Smell
How likely
you will
buy Red
Meter
How likely
you will buy
product 2
Pearson
Correlation
0.795 ** .573** .444** .297** .480** 1
Sig. (2-
tailed)
.000 .000 .000 .010 .000
N 75 75 75 75 75 75
Correlations – Product 3 ( Milk Teeth)
Milk Teeth
Taste
Milk Teeth
Texture
Milk Teeth
Shape
Milk Teeth
Color
Milk Teeth
Smell
How likely
you will
buy Milk
Teeth
How likely
you will buy
product 3
Pearson
Correlation
.567** .647** .537** .610** .407** 1
Sig. (2-
tailed)
.000 .000 .000 .000 .000
N 75 75 75 75 75 75
Correlations - Product 4 (Duo Fudge)
Duo Fudge
Taste
Duo Fudge
Texture
Duo Fudge
Shape
Duo Fudge
Color
Duo Fudge
Smell
How likely
you will
buy Duo
Fudge
How likely
you will buy
product 4
Pearson
Correlation
.850** .629** .576** .581** .495** 1
Sig. (2-
tailed)
.000 .000 .000 .000 .000
N 75 75 75 75 75 75

xii | P a g e
Correlations -Product 5 (Candy Cane)
Cady Cane
Taste
Cady Cane
Texture
Cady Cane
Shape
Cady Cane
Color
Cady Cane
Smell
How likely
you will
buy Cady
Cane
How likely
you will buy
product 5
Pearson
Correlation
.769** .684** .504** .387** .535** 1
Sig. (2-
tailed)
.000 .000 .000 .001 .000
N 75 75 75 75 75 75
Correlations -Product 6 ( Violet Prince)
Violet
Prince
Taste
Violet
Prince
Texture
Violet
Prince
Shape
Violet
Prince
Color
Violet
Prince
Smell
How likely
you will
buy Violet
Prince
How likely
you will buy
product 6
Pearson
Correlation
.726** .471** .427** .380** .559** 1
Sig. (2-
tailed)
.000 .000 .000 .001 .000
N 75 75 75 75 75 75
Correlations - Product 7 (Fizzy Bubblegum)
Fuzzy
Bubblegum
Taste
Fuzzy
Bubblegum
Texture
Fuzzy
Bubblegum
Shape
Fuzzy
Bubblegum
Color
Fuzzy
Bubblegum
Smell
How likely
you will
buy Fuzzy
Bubblegum
How likely
you will buy
product 7
Pearson
Correlation
.893** .725** .662** .627** .774** 1
Sig. (2-
tailed)
.000 .000 .000 .000 .000
N 75 75 75 75 75 75
Correlations - Product 8 (Mini Strawberry Cable)
Mini
Strawberry
Cable Taste
Mini
Strawberry
Cable
Texture
Mini
Strawberry
Cable
Shape
Mini
Strawberry
Cable Color
Mini
Strawberry
Cable
Smell
How likely
you will
buy Mini
Strawberry
Cable
How likely
you will buy
product 8
Pearson
Correlation
.743** .292* .422** .226 .608** 1
Sig. (2-
tailed)
.000 .011 .000 .051 .000
N 75 75 75 75 75 75
Correlations - Product 9 (Cola Ferry)

xiii | P a g e
Cola Ferry
Taste
Cola Ferry
Texture
Cola Ferry
Shape
Cola Ferry
Color
Cola Ferry
Smell
How likely
you will
buy Cola
Ferry
How likely
you will buy
product 9
Pearson
Correlation
.741** .715** .520** .390** .507** 1
Sig. (2-
tailed)
.000 .000 .000 .001 .000
N 75 75 75 75 75 75
Correlations - Product 10 (Jelly Bean)
Jelly Bean
Taste
Jelly Bean
Texture
Jelly Bean
Shape
Jelly Bean
Color
Jelly Bean
Smell
How likely
you will
buy Jelly
Bean
How likely
you will buy
product 10
Pearson
Correlation
.826** .594** .512** .533** .443** 1
Sig. (2-
tailed)
.000 .000 .000 .000 .000
N 75 75 75 75 75 75
Correlations - Product 11 (Banana Foam)
Banana
Foam Taste
Banana
Foam
Texture
Banana
Foam
Shape
Banana
Foam Color
Banana
Foam Smell
How likely
you will
buy Banana
Foam
How likely
you will buy
product 11
Pearson
Correlation
.806** .640** .490** .396** .539** 1
Sig. (2-
tailed)
.000 .000 .000 .000 .000
N 75 75 75 75 75 75
Correlations - Product 12 (Twin Cherry)
Twin
Cherry
Taste
Twin
Cherry
Texture
Twin
Cherry
Shape
Twin
Cherry
Color
Twin
Cherry
Smell
How likely
you will
buy Twin
Cherry
How likely
you will buy
product 12
Pearson
Correlation
.795** .622** .363** .432** .512** 1
Sig. (2-
tailed)
.000 .000 .001 .000 .000
N 75 75 75 75 75 75
Correlations - Product 13 (Blue Shark)

xiv | P a g e
Blue Shark
Taste
Blue Shark
Texture
Blue Shark
Shape
Blue Shark
Color
Blue Shark
Smell
How likely
you will
buy Blue
Shark
How likely
you will buy
product 13
Pearson
Correlation
.761** .744** .541** .535** .491** 1
Sig. (2-
tailed)
.000 .000 .000 .000 .000
N 75 75 75 75 75 75
Correlations - Product 14 (Jumbo Liquorices)
Jumbo
Liquorices
Taste
Jumbo
Liquorices
Texture
Jumbo
Liquorices
Shape
Jumbo
Liquorices
Color
Jumbo
Liquorices
Smell
How likely
you will
buy Jumbo
Liquorices
How likely
you will buy
product 14
Pearson
Correlation
.915** .490** .428** .498** .781** 1
Sig. (2-
tailed)
.000 .000 .000 .000 .000
N 75 75 75 75 75 75
Correlations - Product 15 (Salt Skull)
Salt Skull
Taste
Salt Skull
Texture
Salt Skull
Shape
Salt Skull
Color
Salt Skull
Smell
How likely
you will
buy Salt
Skull
How likely
you will buy
product 15
Pearson
Correlation
.943** .405** .132 .285* .506** 1
Sig. (2-
tailed)
.000 .000 .258 .013 .000
N 75 75 75 75 75 75
**. Correlation is significant at the 0.01 level (2-tailed).
*. Correlation is significant at the 0.05 level (2-tailed).

xv | P a g e
Cross-tabulated Statistics: Gender and Willingness to buy
Crosstab
Chi-Square Tests
How likely you will buy the product1
Total
Value df
Asymp. Sig.
(2-sided)
No Not sure Yes
Pearson Chi-Square 1.679 2 .432
Q8. Gender Male Count 1 6 16 23
Likelihood Ratio 1.604 2 .448
% within Q8.
Gender
4.3% 26.1% 69.6% 100.0%
Linear-by-Linear
Association
1.614 1 .204
% within How
likely you will buy
the product1
.5 .4 .3 .3
N of Valid Cases 75
% of Total .0 .1 .2 .3
Female Count 1 8 43 52
% within Q8.
Gender
1.9% 15.4% 82.7% 100.0%
% within How
likely you will buy
the product1
.5 .6 .7 .7
% of Total .0 .1 .6 .7
Total Count 2 14 59 75
% within Q8.
Gender
2.7% 18.7% 78.7% 100.0%
% within How
likely you will buy
the product1
1.0 1.0 1.0 1.0
% of Total .0 .2 .8 1.0
Crosstab
Chi-Square Tests
How likely you will buy product 2
Total
Value df
Asymp. Sig.
(2-sided)
No Not sure Yes
Pearson Chi-Square 2.521 2 .284
Q8. Gender Male Count 2 6 15 23
Likelihood Ratio 2.365 2 .307
% within Q8.
Gender
8.7% 26.1% 65.2% 100.0%
Linear-by-Linear
Association
.615 1 .433
% within How
likely you will buy
product 2
.3 .5 .3 .3
N of Valid Cases 75
% of Total .0 .1 .2 .3
Female Count 5 6 41 52
% within Q8.
Gender
9.6% 11.5% 78.8% 100.0%
% within How
likely you will buy
product 2
.7 .5 .7 .7
% of Total .1 .1 .5 .7
Total Count 7 12 56 75
% within Q8.
Gender
9.3% 16.0% 74.7% 100.0%
% within How
likely you will buy
product 2
1.0 1.0 1.0 1.0
% of Total .1 .2 .7 1.0
Crosstab
Chi-Square Tests
How likely you will buy the product
5
Total
Value df
Asymp. Sig.
(2-sided)
No Not sure Yes
Pearson Chi-Square 4.639 2 .098
Q8. Gender Male Count 1 7 15 23
Likelihood Ratio 5.453 2 .065
% within Q8.
Gender
4.3% 30.4% 65.2% 100.0%
Linear-by-Linear
Association
4.363 1 .037
% within How
likely you will buy
the product 5
.1 .3 .4 .3
N of Valid Cases 75
% of Total .0 .1 .2 .3
Female Count 12 17 23 52
% within Q8.
Gender
23.1% 32.7% 44.2% 100.0%
% within How
likely you will buy
the product 5
.9 .7 .6 .7
% of Total .2 .2 .3 .7

xvi | P a g e
Total Count 13 24 38 75
% within Q8.
Gender
17.3% 32.0% 50.7% 100.0%
% within How
likely you will buy
the product 5
1.0 1.0 1.0 1.0
% of Total .2 .3 .5 1.0
Crosstab
Chi-Square Tests
How likely you will buy product10
Total
Value df
Asymp. Sig.
(2-sided)
No Not sure Yes
Pearson Chi-Square 3.720 2 .156
Q8. Gender Male Count 2 2 19 23
Likelihood Ratio 4.237 2 .120
% within Q8.
Gender
8.7% 8.7% 82.6% 100.0%
Linear-by-Linear
Association
1.304 1 .253
% within How
likely you will buy
product10
.3 .1 .4 .3
N of Valid Cases 75
% of Total .0 .0 .3 .3
Female Count 4 15 33 52
% within Q8.
Gender
7.7% 28.8% 63.5% 100.0%
% within How
likely you will buy
product10
.7 .9 .6 .7
% of Total .1 .2 .4 .7
Total Count 6 17 52 75
% within Q8.
Gender
8.0% 22.7% 69.3% 100.0%
% within How
likely you will buy
product10
1.0 1.0 1.0 1.0
% of Total .1 .2 .7 1.0
Crosstab
Chi-Square Tests
How likely you will buy product 13
Total
Value df
Asymp. Sig.
(2-sided)
No Not sure Yes
Pearson Chi-Square .136 2 .934
Q8. Gender Male Count 2 6 15 23
Likelihood Ratio .141 2 .932
% within Q8.
Gender
8.7% 26.1% 65.2% 100.0%
Linear-by-Linear
Association
.072 1 .788
% within How
likely you will buy
product 13
.3 .3 .3 .3
N of Valid Cases 75
% of Total .0 .1 .2 .3
Female Count 6 13 33 52
% within Q8.
Gender
11.5% 25.0% 63.5% 100.0%
% within How
likely you will buy
product 13
.8 .7 .7 .7
% of Total .1 .2 .4 .7
Total Count 8 19 48 75
% within Q8.
Gender
.1 .3 .6 1.0
% within How
likely you will buy
product 13
1.0 1.0 1.0 1.0
% of Total .1 .3 .6 1.0

xvii | P a g e
Cross-tabulated Statistics: Age and Willingness to buy
Crosstab
Chi-Square Tests
How likely you will buy the
product1
Total
Value df
Asymp. Sig.
(2-sided)
No
Not
sure Yes
Pearson Chi-
Square
.447 2 .800
Q9. Age 2 Younger than 26 Count 1 9 41 51
Likelihood
Ratio
.426 2 .808
% within Q9. Age 2 2.0% 17.6% 80.4% 100.0%
Linear-by-
Linear
Association
.394 1 .530
% within How likely you
will buy the product1
.5 .6 .7 .7
N of Valid
Cases
75
% of Total .0 .1 .5 .7
26 and older Count 1 5 18 24
% within Q9. Age 2 4.2% 20.8% 75.0% 100.0%
% within How likely you
will buy the product1
.5 .4 .3 .3
% of Total .0 .1 .2 .3
Total Count 2 14 59 75
% within Q9. Age 2 2.7% 18.7% 78.7% 100.0%
% within How likely you
will buy the product1
1.0 1.0 1.0 1.0
% of Total .0 .2 .8 1.0
Crosstab
Chi-Square Tests
How likely you will buy
product 2
Total
Value df
Asymp. Sig.
(2-sided)
No
Not
sure Yes
Pearson Chi-
Square
3.331 2 .189
Q9. Age 2 Younger than 26 Count 3 10 38 51
Likelihood
Ratio
3.327 2 .189
% within Q9. Age 2 5.9% 19.6% 74.5% 100.0%
Linear-by-
Linear
Association
.413 1 .520
% within How likely you
will buy product 2
.4 .8 .7 .7
N of Valid
Cases
75
% of Total .0 .1 .5 .7
26 and older Count 4 2 18 24
% within Q9. Age 2 16.7% 8.3% 75.0% 100.0%
% within How likely you
will buy product 2
.6 .2 .3 .3
% of Total .1 .0 .2 .3
Total Count 7 12 56 75
% within Q9. Age 2 9.3% 16.0% 74.7% 100.0%
% within How likely you
will buy product 2
1.0 1.0 1.0 1.0
% of Total .1 .2 .7 1.0
Crosstab
Chi-Square Tests
How likely you will buy the
product 5
Total
Value df
Asymp. Sig.
(2-sided)
No
Not
sure Yes
Pearson Chi-
Square
1.740 2 .419
Q9. Age 2 Younger than 26 Count 7 18 26 51
Likelihood
Ratio
1.696 2 .428
% within Q9. Age 2 13.7% 35.3% 51.0% 100.0%
Linear-by-
Linear
Association
.425 1 .514
% within How likely you
will buy the product 5
.5 .8 .7 .7
N of Valid
Cases
75
% of Total .1 .2 .3 .7
26 and older Count 6 6 12 24
% within Q9. Age 2 25.0% 25.0% 50.0% 100.0%
% within How likely you
will buy the product 5
.5 .3 .3 .3
% of Total .1 .1 .2 .3
Total Count 13 24 38 75
% within Q9. Age 2 17.3% 32.0% 50.7% 100.0%

xviii | P a g e
% within How likely you
will buy the product 5
1.0 1.0 1.0 1.0
% of Total .2 .3 .5 1.0
Crosstab
Chi-Square Tests
How likely you will buy
product10
Total
Value df
Asymp. Sig.
(2-sided)
No
Not
sure Yes
Pearson Chi-
Square
1.216 2 .544
Q9. Age 2 Younger than 26 Count 3 11 37 51
Likelihood
Ratio
1.158 2 .560
% within Q9. Age 2 5.9% 21.6% 72.5% 100.0%
Linear-by-
Linear
Association
1.126 1 .289
% within How likely you
will buy product10
.5 .6 .7 .7
N of Valid
Cases
75
% of Total .0 .1 .5 .7
26 and older Count 3 6 15 24
% within Q9. Age 2 12.5% 25.0% 62.5% 100.0%
% within How likely you
will buy product10
.5 .4 .3 .3
% of Total .0 .1 .2 .3
Total Count 6 17 52 75
% within Q9. Age 2 .1 .2 .7 1.0
% within How likely you
will buy product10
1.0 1.0 1.0 1.0
% of Total .1 .2 .7 1.0
Crosstab
Chi-Square Tests
How likely you will buy
product 13
Total
Value df
Asymp. Sig.
(2-sided)
No
Not
sure Yes
Pearson Chi-
Square
.125 2 .939
Q9. Age 2 Younger than 26 Count 5 13 33 51
Likelihood
Ratio
.122 2 .941
% within Q9. Age 2 9.8% 25.5% 64.7% 100.0%
Linear-by-
Linear
Association
.084 1 .772
% within How likely you
will buy product 13
.6 .7 .7 .7
N of Valid
Cases
75
% of Total .1 .2 .4 .7
26 and older Count 3 6 15 24
% within Q9. Age 2 12.5% 25.0% 62.5% 100.0%
% within How likely you
will buy product 13
.4 .3 .3 .3
% of Total .0 .1 .2 .3
Total Count 8 19 48 75
% within Q9. Age 2 10.7% 25.3% 64.0% 100.0%
% within How likely you
will buy product 13
1.0 1.0 1.0 1.0
% of Total .1 .3 .6 1.0

xix | P a g e
Cross-tabulated Statistics: Income/ Allowance and Willingness to buy
Crosstab
Chi-Square Tests
How likely you will buy the
product1
Total
Value df
Asymp. Sig.
(2-sided)
No
Not
sure Yes
Pearson Chi-
Square
8.606 8 .377
Q10.
Income/
allowance
per month
Less than
10,000 THB
Count 0 2 3 5
Likelihood
Ratio
7.951 8 .438
% within Q10. Income/
allowance per month
0.0% 40.0% 60.0% 100.0%
Linear-by-
Linear
Association
.317 1 .574
% within How likely you
will buy the product1
.0 .1 .1 .1
N of Valid
Cases
75
% of Total .0 .0 .0 .1
10,000 -
20,000 THB
Count 0 6 14 20
% within Q10. Income/
allowance per month
0.0% 30.0% 70.0% 100.0%
% within How likely you
will buy the product1
.0 .4 .2 .3
% of Total .0 .1 .2 .3
20,001 -
30,000 THB
Count 1 4 25 30
% within Q10. Income/
allowance per month
3.3% 13.3% 83.3% 100.0%
% within How likely you
will buy the product1
.5 .3 .4 .4
% of Total .0 .1 .3 .4
30,001 -
40,000 THB
Count 0 1 11 12
% within Q10. Income/
allowance per month
0.0% 8.3% 91.7% 100.0%
% within How likely you
will buy the product1
.0 .1 .2 .2
% of Total .0 .0 .1 .2
More than
40,000 THB
Count 1 1 6 8
% within Q10. Income/
allowance per month
12.5% 12.5% 75.0% 100.0%
% within How likely you
will buy the product1
.5 .1 .1 .1
% of Total .0 .0 .1 .1
Total Count 2 14 59 75
% within Q10. Income/
allowance per month
2.7% 18.7% 78.7% 100.0%
% within How likely you
will buy the product1
1.0 1.0 1.0 1.0
% of Total .0 .2 .8 1.0
Crosstab
Chi-Square Tests
How likely you will buy
product 2
Total
Value df
Asymp. Sig.
(2-sided)
No
Not
sure Yes
Pearson Chi-
Square
4.249 8 .834
Q10.
Income/
allowance
per month
Less than
10,000 THB
Count 0 0 5 5
Likelihood
Ratio
6.022 8 .645
% within Q10. Income/
allowance per month
0.0% 0.0% 100.0% 100.0%
Linear-by-
Linear
Association
.206 1 .650
% within How likely you
will buy product 2
.0 .0 .1 .1
N of Valid
Cases
75
% of Total .0 .0 .1 .1
10,000 - Count 2 3 15 20

xx | P a g e
20,000 THB % within Q10. Income/
allowance per month
10.0% 15.0% 75.0% 100.0%
% within How likely you
will buy product 2
.3 .3 .3 .3
% of Total .0 .0 .2 .3
20,001 -
30,000 THB
Count 4 4 22 30
% within Q10. Income/
allowance per month
13.3% 13.3% 73.3% 100.0%
% within How likely you
will buy product 2
.6 .3 .4 .4
% of Total .1 .1 .3 .4
30,001 -
40,000 THB
Count 1 3 8 12
% within Q10. Income/
allowance per month
8.3% 25.0% 66.7% 100.0%
% within How likely you
will buy product 2
.1 .3 .1 .2
% of Total .0 .0 .1 .2
More than
40,000 THB
Count 0 2 6 8
% within Q10. Income/
allowance per month
0.0% 25.0% 75.0% 100.0%
% within How likely you
will buy product 2
.0 .2 .1 .1
% of Total .0 .0 .1 .1
Total Count 7 12 56 75
% within Q10. Income/
allowance per month
9.3% 16.0% 74.7% 100.0%
% within How likely you
will buy product 2
1.0 1.0 1.0 1.0
% of Total .1 .2 .7 1.0
Crosstab
Chi-Square Tests
How likely you will buy the
product 5
Total
Value df
Asymp. Sig.
(2-sided)
No
Not
sure Yes
Pearson Chi-
Square
6.699 8 .569
Q10.
Income/
allowance
per month
Less than
10,000 THB
Count 2 2 1 5
Likelihood
Ratio
7.174 8 .518
% within Q10. Income/
allowance per month
40.0% 40.0% 20.0% 100.0%
Linear-by-
Linear
Association
.388 1 .533
% within How likely you
will buy the product 5
.2 .1 .0 .1
N of Valid
Cases
75
% of Total .0 .0 .0 .1
10,000 -
20,000 THB
Count 1 6 13 20
% within Q10. Income/
allowance per month
5.0% 30.0% 65.0% 100.0%
% within How likely you
will buy the product 5
.1 .3 .3 .3
% of Total .0 .1 .2 .3
20,001 -
30,000 THB
Count 6 8 16 30
% within Q10. Income/
allowance per month
20.0% 26.7% 53.3% 100.0%
% within How likely you
will buy the product 5
.5 .3 .4 .4
% of Total .1 .1 .2 .4
30,001 -
40,000 THB
Count 2 5 5 12
% within Q10. Income/
allowance per month
16.7% 41.7% 41.7% 100.0%
% within How likely you
will buy the product 5
.2 .2 .1 .2
% of Total .0 .1 .1 .2
More than
40,000 THB
Count 2 3 3 8
% within Q10. Income/
allowance per month
25.0% 37.5% 37.5% 100.0%
% within How likely you
will buy the product 5
.2 .1 .1 .1
% of Total .0 .0 .0 .1
Total Count 13 24 38 75

xxi | P a g e
% within Q10. Income/
allowance per month
17.3% 32.0% 50.7% 100.0%
% within How likely you
will buy the product 5
1.0 1.0 1.0 1.0
% of Total .2 .3 .5 1.0
Crosstab
Chi-Square Tests
How likely you will buy
product10
Total
Value df
Asymp. Sig.
(2-sided)
No
Not
sure Yes
Pearson Chi-
Square
7.424 8 .492
Q10.
Income/
allowance
per month
Less than
10,000 THB
Count 0 2 3 5
Likelihood
Ratio
10.233 8 .249
% within Q10. Income/
allowance per month
0.0% 40.0% 60.0% 100.0%
Linear-by-
Linear
Association
1.147 1 .284
% within How likely you
will buy product10
.0 .1 .1 .1
N of Valid
Cases
75
% of Total .0 .0 .0 .1
10,000 -
20,000 THB
Count 2 7 11 20
% within Q10. Income/
allowance per month
10.0% 35.0% 55.0% 100.0%
% within How likely you
will buy product10
.3 .4 .2 .3
% of Total .0 .1 .1 .3
20,001 -
30,000 THB
Count 2 7 21 30
% within Q10. Income/
allowance per month
6.7% 23.3% 70.0% 100.0%
% within How likely you
will buy product10
.3 .4 .4 .4
% of Total .0 .1 .3 .4
30,001 -
40,000 THB
Count 1 0 11 12
% within Q10. Income/
allowance per month
8.3% 0.0% 91.7% 100.0%
% within How likely you
will buy product10
.2 .0 .2 .2
% of Total .0 .0 .1 .2
More than
40,000 THB
Count 1 1 6 8
% within Q10. Income/
allowance per month
12.5% 12.5% 75.0% 100.0%
% within How likely you
will buy product10
.2 .1 .1 .1
% of Total .0 .0 .1 .1
Total Count 6 17 52 75
% within Q10. Income/
allowance per month
8.0% 22.7% 69.3% 100.0%
% within How likely you
will buy product10
1.0 1.0 1.0 1.0
% of Total .1 .2 .7 1.0
Crosstab
Chi-Square Tests
How likely you will buy
product 13
Total
Value df
Asymp. Sig.
(2-sided)
No
Not
sure Yes
Pearson Chi-
Square
12.177 8 .143
Q10.
Income/
allowance
per month
Less than
10,000 THB
Count 2 0 3 5
Likelihood
Ratio
14.210 8 .076
% within Q10. Income/
allowance per month
40.0% 0.0% 60.0% 100.0%
Linear-by-
Linear
Association
.000 1 .992
% within How likely you
will buy product 13
.3 .0 .1 .1
N of Valid
Cases
75
% of Total .0 .0 .0 .1
10,000 -
20,000 THB
Count 0 6 14 20
% within Q10. Income/
allowance per month
0.0% 30.0% 70.0% 100.0%
% within How likely you
will buy product 13
.0 .3 .3 .3
% of Total .0 .1 .2 .3
20,001 - Count 5 6 19 30

xxii | P a g e
30,000 THB % within Q10. Income/
allowance per month
16.7% 20.0% 63.3% 100.0%
% within How likely you
will buy product 13
.6 .3 .4 .4
% of Total .1 .1 .3 .4
30,001 -
40,000 THB
Count 1 3 8 12
% within Q10. Income/
allowance per month
8.3% 25.0% 66.7% 100.0%
% within How likely you
will buy product 13
.1 .2 .2 .2
% of Total .0 .0 .1 .2
More than
40,000 THB
Count 0 4 4 8
% within Q10. Income/
allowance per month
0.0% 50.0% 50.0% 100.0%
% within How likely you
will buy product 13
.0 .2 .1 .1
% of Total .0 .1 .1 .1
Total Count 8 19 48 75
% within Q10. Income/
allowance per month
10.7% 25.3% 64.0% 100.0%
% within How likely you
will buy product 13
1.0 1.0 1.0 1.0
% of Total .1 .3 .6 1.0
Cross-tabulated Statistics: Green lifestyle and Willingness to buy
Crosstab
Chi-Square Tests
How likely you will buy the
product1
Total
Value df
Asymp. Sig.
(2-sided)
No Not sure Yes
Pearson Chi-
Square
4.545 4 .337
I am concern
about the
environment
Disagree Count 1 2 11 14
Likelihood
Ratio
5.057 4 .282
% within I am
concern about the
environment
7.1% 14.3% 78.6% 100.0%
Linear-by-
Linear
Association
1.761 1 .185
% within How likely
you will buy the
product1
50.0% 14.3% 18.6% .2
N of Valid
Cases
75
% of Total .0 .0 .1 .2
Neutral Count 1 7 17 25
% within I am
concern about the
environment
4.0% 28.0% 68.0% 100.0%
% within How likely
you will buy the
product1
.5 .5 .3 .3
% of Total .0 .1 .2 .3
Agree Count 0 5 31 36
% within I am
concern about the
environment
0.0% 13.9% 86.1% 100.0%
% within How likely
you will buy the
product1
.0 .4 .5 .5
% of Total .0 .1 .4 .5
Total Count 2 14 59 75
% within I am
concern about the
environment
2.7% 18.7% 78.7% 100.0%
% within How likely
you will buy the
product1
1.0 1.0 1.0 1.0
% of Total .0 .2 .8 1.0
Crosstab
Chi-Square Tests
How likely you will buy product 2
Total
Value df
Asymp. Sig.
(2-sided)
No Not sure Yes
Pearson Chi-
Square
9.765 4 .045
I am concern
about the
environment
Disagree Count 1 4 9 14
Likelihood
Ratio
11.168 4 .025
% within I am
concern about the
environment
7.1% 28.6% 64.3% 100.0%
Linear-by-
Linear
Association
2.408 1 .121

xxiii | P a g e
% within How likely
you will buy product
2
.1 .3 .2 .2
N of Valid
Cases
75
% of Total .0 .1 .1 .2
Neutral Count 3 7 15 25
% within I am
concern about the
environment
12.0% 28.0% 60.0% 100.0%
% within How likely
you will buy product
2
.4 .6 .3 .3
% of Total .0 .1 .2 .3
Agree Count 3 1 32 36
% within I am
concern about the
environment
8.3% 2.8% 88.9% 100.0%
% within How likely
you will buy product
2
.4 .1 .6 .5
% of Total .0 .0 .4 .5
Total Count 7 12 56 75
% within I am
concern about the
environment
.1 .2 .7 1.0
% within How likely
you will buy product
2
1.0 1.0 1.0 1.0
% of Total .1 .2 .7 1.0
Crosstab
Chi-Square Tests
How likely you will buy the product
5
Total
Value df
Asymp. Sig.
(2-sided)
No Not sure Yes
Pearson Chi-
Square
3.496 4 .478
I am concern
about the
environment
Disagree Count 1 3 10 14
Likelihood
Ratio
3.634 4 .458
% within I am
concern about the
environment
7.1% 21.4% 71.4% 100.0%
Linear-by-
Linear
Association
2.766 1 .096
% within How likely
you will buy the
product 5
.1 .1 .3 .2
N of Valid
Cases
75
% of Total .0 .0 .1 .2
Neutral Count 4 9 12 25
% within I am
concern about the
environment
16.0% 36.0% 48.0% 100.0%
% within How likely
you will buy the
product 5
.3 .4 .3 .3
% of Total .1 .1 .2 .3
Agree Count 8 12 16 36
% within I am
concern about the
environment
22.2% 33.3% 44.4% 100.0%
% within How likely
you will buy the
product 5
.6 .5 .4 .5
% of Total .1 .2 .2 .5
Total Count 13 24 38 75
% within I am
concern about the
environment
.2 .3 .5 1.0
% within How likely
you will buy the
product 5
1.0 1.0 1.0 1.0
% of Total .2 .3 .5 1.0
Crosstab
Chi-Square Tests
How likely you will buy product10
Total
Value df
Asymp. Sig.
(2-sided)
No Not sure Yes
Pearson Chi-
Square
3.046 4 .550
I am concern
about the
environment
Disagree Count 1 2 11 14
Likelihood
Ratio
3.033 4 .552
% within I am
concern about the
environment
7.1% 14.3% 78.6% 100.0%
Linear-by-
Linear
Association
.355 1 .551

xxiv | P a g e
% within How likely
you will buy
product10
.2 .1 .2 .2
N of Valid
Cases
75
% of Total .0 .0 .1 .2
Neutral Count 3 4 18 25
% within I am
concern about the
environment
12.0% 16.0% 72.0% 100.0%
% within How likely
you will buy
product10
.5 .2 .3 .3
% of Total .0 .1 .2 .3
Agree Count 2 11 23 36
% within I am
concern about the
environment
5.6% 30.6% 63.9% 100.0%
% within How likely
you will buy
product10
.3 .6 .4 .5
% of Total .0 .1 .3 .5
Total Count 6 17 52 75
% within I am
concern about the
environment
8.0% 22.7% 69.3% 100.0%
% within How likely
you will buy
product10
1.0 1.0 1.0 1.0
% of Total .1 .2 .7 1.0
Crosstab
Chi-Square Tests
How likely you will buy product 13
Total
Value df
Asymp. Sig.
(2-sided)
No Not sure Yes
Pearson Chi-
Square
2.863 4 .581
I am concern
about the
environment
Disagree Count 3 3 8 14
Likelihood
Ratio
2.524 4 .640
% within I am
concern about the
environment
21.4% 21.4% 57.1% 100.0%
Linear-by-
Linear
Association
1.360 1 .244
% within How likely
you will buy product
13
.4 .2 .2 .2
N of Valid
Cases
75
% of Total .0 .0 .1 .2
Neutral Count 2 8 15 25
% within I am
concern about the
environment
8.0% 32.0% 60.0% 100.0%
% within How likely
you will buy product
13
.3 .4 .3 .3
% of Total .0 .1 .2 .3
Agree Count 3 8 25 36
% within I am
concern about the
environment
8.3% 22.2% 69.4% 100.0%
% within How likely
you will buy product
13
.4 .4 .5 .5
% of Total .0 .1 .3 .5
Total Count 8 19 48 75
% within I am
concern about the
environment
10.7% 25.3% 64.0% 100.0%
% within How likely
you will buy product
13
1.0 1.0 1.0 1.0
% of Total .1 .3 .6 1.0

xxv | P a g e
Cross-tabulated Statistics: Healthy lifestyle and Willingness to buy
Crosstab
Chi-Square Tests
How likely you will buy the product1
Total
Value df
Asymp. Sig.
(2-sided)
No Not sure Yes
Pearson Chi-
Square
1.854 4 .763
I like to eat
healthy food
and
excercise
Disagree Count 0 3 13 16
Likelihood
Ratio
2.605 4 .626
% within I like to eat
healthy food and
excercise
.0 .2 .8 1.0
Linear-by-
Linear
Association
.344 1 .558
% within How likely you
will buy the product1
.0 .2 .2 .2
N of Valid
Cases
75
% of Total .0 .0 .2 .2
Neutral Count 0 4 14 18
% within I like to eat
healthy food and
excercise
.0 .2 .8 1.0
% within How likely you
will buy the product1
.0 .3 .2 .2
% of Total .0 .1 .2 .2
Agree Count 2 7 32 41
% within I like to eat
healthy food and
excercise
4.9% 17.1% 78.0% 100.0%
% within How likely you
will buy the product1
1.0 .5 .5 .5
% of Total .0 .1 .4 .5
Total Count 2 14 59 75
% within I like to eat
healthy food and
excercise
.0 .2 .8 1.0
% within How likely you
will buy the product1
1.0 1.0 1.0 1.0
% of Total .0 .2 .8 1.0
Crosstab
Chi-Square Tests
How likely you will buy product 2
Total
Value df
Asymp. Sig.
(2-sided)
No Not sure Yes
Pearson Chi-
Square
1.331 4 .856
I like to eat
healthy food
and
excercise
Disagree Count 1 3 12 16
Likelihood
Ratio
1.336 4 .855
% within I like to eat
healthy food and
excercise
.1 .2 .8 1.0
Linear-by-
Linear
Association
.022 1 .883
% within How likely you
will buy product 2
.1 .3 .2 .2
N of Valid
Cases
75
% of Total .0 .0 .2 .2
Neutral Count 2 4 12 18
% within I like to eat
healthy food and
excercise
.1 .2 .7 1.0
% within How likely you
will buy product 2
.3 .3 .2 .2
% of Total .0 .1 .2 .2
Agree Count 4 5 32 41
% within I like to eat
healthy food and
excercise
9.8% 12.2% 78.0% 100.0%

xxvi | P a g e
% within How likely you
will buy product 2
.6 .4 .6 .5
% of Total .1 .1 .4 .5
Total Count 7 12 56 75
% within I like to eat
healthy food and
excercise
.1 .2 .7 1.0
% within How likely you
will buy product 2
1.0 1.0 1.0 1.0
% of Total .1 .2 .7 1.0
Crosstab
Chi-Square Tests
How likely you will buy the product 5
Total
Value df
Asymp. Sig.
(2-sided)
No Not sure Yes
Pearson Chi-
Square
3.223 4 .521
I like to eat
healthy food
and
excercise
Disagree Count 2 3 11 16
Likelihood
Ratio
3.302 4 .509
% within I like to eat
healthy food and
excercise
.1 .2 .7 1.0
Linear-by-
Linear
Association
.669 1 .413
% within How likely you
will buy the product 5
.2 .1 .3 .2
N of Valid
Cases
75
% of Total .0 .0 .1 .2
Neutral Count 4 7 7 18
% within I like to eat
healthy food and
excercise
.2 .4 .4 1.0
% within How likely you
will buy the product 5
.3 .3 .2 .2
% of Total .1 .1 .1 .2
Agree Count 7 14 20 41
% within I like to eat
healthy food and
excercise
17.1% 34.1% 48.8% 100.0%
% within How likely you
will buy the product 5
.5 .6 .5 .5
% of Total .1 .2 .3 .5
Total Count 13 24 38 75
% within I like to eat
healthy food and
excercise
.2 .3 .5 1.0
% within How likely you
will buy the product 5
1.0 1.0 1.0 1.0
% of Total .2 .3 .5 1.0
Crosstab
Chi-Square Tests
How likely you will buy product10
Total
Value df
Asymp. Sig.
(2-sided)
No Not sure Yes
Pearson Chi-
Square
6.296 4 .178
I like to eat
healthy food
and
excercise
Disagree Count 3 2 11 16
Likelihood
Ratio
7.176 4 .127
% within I like to eat
healthy food and
excercise
.2 .1 .7 1.0
Linear-by-
Linear
Association
.006 1 .940
% within How likely you
will buy product10
.5 .1 .2 .2
N of Valid
Cases
75
% of Total .0 .0 .1 .2

xxvii | P a g e
Neutral Count 0 3 15 18
% within I like to eat
healthy food and
excercise
.0 .2 .8 1.0
% within How likely you
will buy product10
.0 .2 .3 .2
% of Total .0 .0 .2 .2
Agree Count 3 12 26 41
% within I like to eat
healthy food and
excercise
7.3% 29.3% 63.4% 100.0%
% within How likely you
will buy product10
.5 .7 .5 .5
% of Total .0 .2 .3 .5
Total Count 6 17 52 75
% within I like to eat
healthy food and
excercise
.1 .2 .7 1.0
% within How likely you
will buy product10
1.0 1.0 1.0 1.0
% of Total .1 .2 .7 1.0
Crosstab
Chi-Square Tests
How likely you will buy product 13
Total
Value df
Asymp. Sig.
(2-sided)
No Not sure Yes
Pearson Chi-
Square
6.721 4 .151
I like to eat
healthy food
and
excercise
Disagree Count 3 7 6 16
Likelihood
Ratio
6.604 4 .158
% within I like to eat
healthy food and
excercise
.2 .4 .4 1.0
Linear-by-
Linear
Association
2.578 1 .108
% within How likely you
will buy product 13
.4 .4 .1 .2
N of Valid
Cases
75
% of Total .0 .1 .1 .2
Neutral Count 1 3 14 18
% within I like to eat
healthy food and
excercise
.1 .2 .8 1.0
% within How likely you
will buy product 13
.1 .2 .3 .2
% of Total .0 .0 .2 .2
Agree Count 4 9 28 41
% within I like to eat
healthy food and
excercise
9.8% 22.0% 68.3% 100.0%
% within How likely you
will buy product 13
.5 .5 .6 .5
% of Total .1 .1 .4 .5
Total Count 8 19 48 75
% within I like to eat
healthy food and
excercise
.1 .3 .6 1.0
% within How likely you
will buy product 13
1.0 1.0 1.0 1.0
% of Total .1 .3 .6 1.0

xxviii | P a g e
Cross-tabulated Statistics: Fashion lifestyle and Willingness to buy
Crosstab
Chi-Square Tests
How likely you will buy the
product1
Total
Value df
Asymp. Sig.
(2-sided)
No
Not
sure Yes
Pearson Chi-
Square
3.721 4 .445
I keep up to
date with the
latest fashion
trends
Disagree Count 1 2 10 13
Likelihood
Ratio
3.533 4 .473
% within I keep up to
date with the latest
fashion trends
.1 .2 .8 1.0
Linear-by-
Linear
Association
.802 1 .370
% within How likely
you will buy the
product1
.5 .1 .2 .2
N of Valid
Cases
75
% of Total .0 .0 .1 .2
Neutral Count 0 5 11 16
% within I keep up to
date with the latest
fashion trends
.0 .3 .7 1.0
% within How likely
you will buy the
product1
.0 .4 .2 .2
% of Total .0 .1 .1 .2
Agree Count 1 7 38 46
% within I keep up to
date with the latest
fashion trends
2.2% 15.2% 82.6% 100.0%
% within How likely
you will buy the
product1
.5 .5 .6 .6
% of Total .0 .1 .5 .6
Total Count 2 14 59 75
% within I keep up to
date with the latest
fashion trends
.0 .2 .8 1.0
% within How likely
you will buy the
product1
1.0 1.0 1.0 1.0
% of Total .0 .2 .8 1.0
Crosstab
Chi-Square Tests
How likely you will buy
product 2
Total
Value df
Asymp. Sig.
(2-sided)
No
Not
sure Yes
Pearson Chi-
Square
1.398 4 .845
I keep up to
date with the
latest fashion
trends
Disagree Count 2 1 10 13
Likelihood
Ratio
1.464 4 .833
% within I keep up to
date with the latest
fashion trends
.2 .1 .8 1.0
Linear-by-
Linear
Association
.010 1 .919
% within How likely
you will buy product 2
.3 .1 .2 .2
N of Valid
Cases
75
% of Total .0 .0 .1 .2
Neutral Count 1 3 12 16
% within I keep up to
date with the latest
fashion trends
.1 .2 .8 1.0
% within How likely
you will buy product 2
.1 .3 .2 .2
% of Total .0 .0 .2 .2
Agree Count 4 8 34 46

xxix | P a g e
% within I keep up to
date with the latest
fashion trends
8.7% 17.4% 73.9% 100.0%
% within How likely
you will buy product 2
.6 .7 .6 .6
% of Total .1 .1 .5 .6
Total Count 7 12 56 75
% within I keep up to
date with the latest
fashion trends
.1 .2 .7 1.0
% within How likely
you will buy product 2
1.0 1.0 1.0 1.0
% of Total .1 .2 .7 1.0
Crosstab
Chi-Square Tests
How likely you will buy the
product 5
Total
Value df
Asymp. Sig.
(2-sided)
No
Not
sure Yes
Pearson Chi-
Square
3.709 4 .447
I keep up to
date with the
latest fashion
trends
Disagree Count 3 2 8 13
Likelihood
Ratio
4.231 4 .376
% within I keep up to
date with the latest
fashion trends
.2 .2 .6 1.0
Linear-by-
Linear
Association
.351 1 .554
% within How likely
you will buy the
product 5
.2 .1 .2 .2
N of Valid
Cases
75
% of Total .0 .0 .1 .2
Neutral Count 1 7 8 16
% within I keep up to
date with the latest
fashion trends
.1 .4 .5 1.0
% within How likely
you will buy the
product 5
.1 .3 .2 .2
% of Total .0 .1 .1 .2
Agree Count 9 15 22 46
% within I keep up to
date with the latest
fashion trends
19.6% 32.6% 47.8% 100.0%
% within How likely
you will buy the
product 5
.7 .6 .6 .6
% of Total .1 .2 .3 .6
Total Count 13 24 38 75
% within I keep up to
date with the latest
fashion trends
.2 .3 .5 1.0
% within How likely
you will buy the
product 5
1.0 1.0 1.0 1.0
% of Total .2 .3 .5 1.0
Crosstab
Chi-Square Tests
How likely you will buy
product10
Total
Value df
Asymp. Sig.
(2-sided)
No
Not
sure Yes
Pearson Chi-
Square
5.169 4 .270
I keep up to
date with the
latest fashion
trends
Disagree Count 3 3 7 13
Likelihood
Ratio
4.104 4 .392
% within I keep up to
date with the latest
fashion trends
.2 .2 .5 1.0
Linear-by-
Linear
Association
3.363 1 .067
% within How likely
you will buy product10
.5 .2 .1 .2
N of Valid
Cases
75
% of Total .0 .0 .1 .2
Neutral Count 1 4 11 16
% within I keep up to
date with the latest
fashion trends
.1 .3 .7 1.0
% within How likely
you will buy product10
.2 .2 .2 .2
% of Total .0 .1 .1 .2
Agree Count 2 10 34 46

xxx | P a g e
% within I keep up to
date with the latest
fashion trends
4.3% 21.7% 73.9% 100.0%
% within How likely
you will buy product10
.3 .6 .7 .6
% of Total .0 .1 .5 .6
Total Count 6 17 52 75
% within I keep up to
date with the latest
fashion trends
.1 .2 .7 1.0
% within How likely
you will buy product10
1.0 1.0 1.0 1.0
% of Total .1 .2 .7 1.0
Crosstab
Chi-Square Tests
How likely you will buy
product 13
Total
Value df
Asymp. Sig.
(2-sided)
No
Not
sure Yes
Pearson Chi-
Square
3.820 4 .431
I keep up to
date with the
latest fashion
trends
Disagree Count 3 4 6 13
Likelihood
Ratio
3.460 4 .484
% within I keep up to
date with the latest
fashion trends
.2 .3 .5 1.0
Linear-by-
Linear
Association
2.628 1 .105
% within How likely
you will buy product
13
.4 .2 .1 .2
N of Valid
Cases
75
% of Total .0 .1 .1 .2
Neutral Count 1 5 10 16
% within I keep up to
date with the latest
fashion trends
.1 .3 .6 1.0
% within How likely
you will buy product
13
.1 .3 .2 .2
% of Total .0 .1 .1 .2
Agree Count 4 10 32 46
% within I keep up to
date with the latest
fashion trends
8.7% 21.7% 69.6% 100.0%
% within How likely
you will buy product
13
.5 .5 .7 .6
% of Total .1 .1 .4 .6
Total Count 8 19 48 75
% within I keep up to
date with the latest
fashion trends
.1 .3 .6 1.0
% within How likely
you will buy product
13
1.0 1.0 1.0 1.0
% of Total .1 .3 .6 1.0
Cross-tabulated Statistics: Technology lifestyle and Willingness to buy
Crosstab
Chi-Square Tests
How likely you will buy the
product1
Total
Value df
Asymp. Sig.
(2-sided)
No
Not
sure Yes
Pearson Chi-
Square
3.957 4 .412
I keep up tp
date with the
latest
technology
Disagree Count 1 2 8 11
Likelihood
Ratio
3.988 4 .408
% within I keep up tp date
with the latest technology
.1 .2 .7 1.0
Linear-by-
Linear
Association
1.127 1 .288
% within How likely you
will buy the product1
.5 .1 .1 .1
N of Valid
Cases
75
% of Total .0 .0 .1 .1
Neutral Count 0 7 20 27
% within I keep up tp date
with the latest technology
.0 .3 .7 1.0
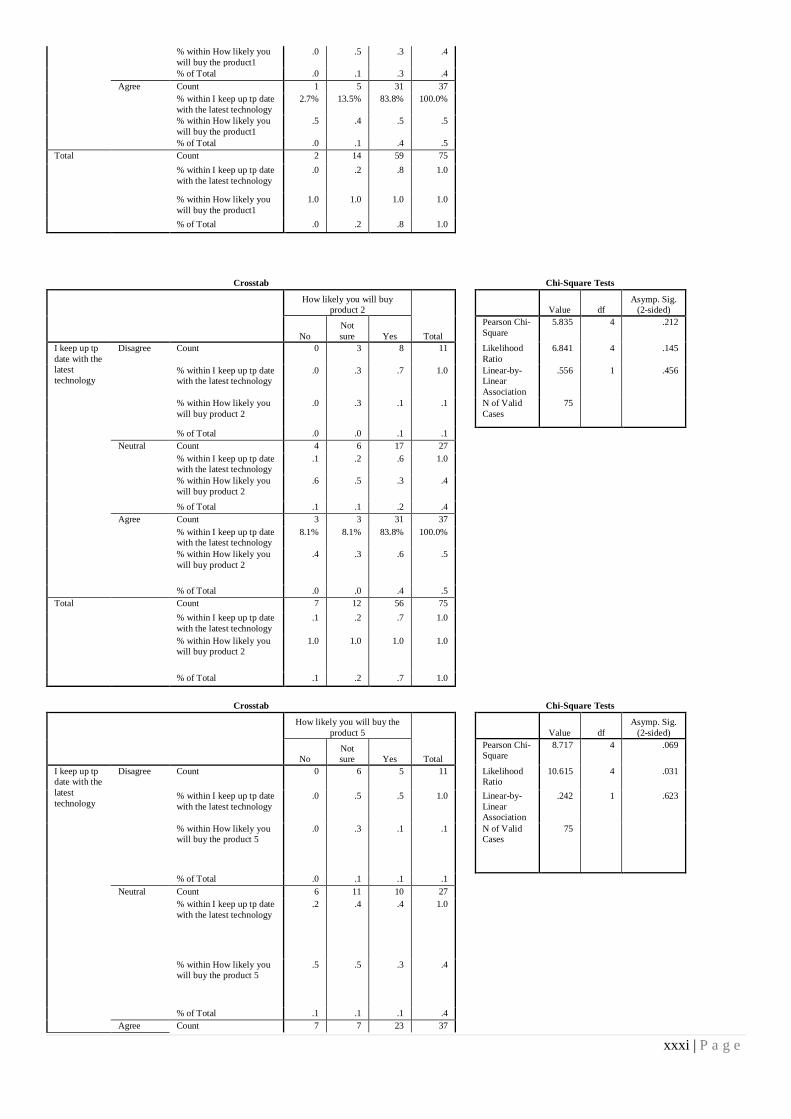
xxxi | P a g e
% within How likely you
will buy the product1
.0 .5 .3 .4
% of Total .0 .1 .3 .4
Agree Count 1 5 31 37
% within I keep up tp date
with the latest technology
2.7% 13.5% 83.8% 100.0%
% within How likely you
will buy the product1
.5 .4 .5 .5
% of Total .0 .1 .4 .5
Total Count 2 14 59 75
% within I keep up tp date
with the latest technology
.0 .2 .8 1.0
% within How likely you
will buy the product1
1.0 1.0 1.0 1.0
% of Total .0 .2 .8 1.0
Crosstab
Chi-Square Tests
How likely you will buy
product 2
Total
Value df
Asymp. Sig.
(2-sided)
No
Not
sure Yes
Pearson Chi-
Square
5.835 4 .212
I keep up tp
date with the
latest
technology
Disagree Count 0 3 8 11
Likelihood
Ratio
6.841 4 .145
% within I keep up tp date
with the latest technology
.0 .3 .7 1.0
Linear-by-
Linear
Association
.556 1 .456
% within How likely you
will buy product 2
.0 .3 .1 .1
N of Valid
Cases
75
% of Total .0 .0 .1 .1
Neutral Count 4 6 17 27
% within I keep up tp date
with the latest technology
.1 .2 .6 1.0
% within How likely you
will buy product 2
.6 .5 .3 .4
% of Total .1 .1 .2 .4
Agree Count 3 3 31 37
% within I keep up tp date
with the latest technology
8.1% 8.1% 83.8% 100.0%
% within How likely you
will buy product 2
.4 .3 .6 .5
% of Total .0 .0 .4 .5
Total Count 7 12 56 75
% within I keep up tp date
with the latest technology
.1 .2 .7 1.0
% within How likely you
will buy product 2
1.0 1.0 1.0 1.0
% of Total .1 .2 .7 1.0
Crosstab
Chi-Square Tests
How likely you will buy the
product 5
Total
Value df
Asymp. Sig.
(2-sided)
No
Not
sure Yes
Pearson Chi-
Square
8.717 4 .069
I keep up tp
date with the
latest
technology
Disagree Count 0 6 5 11
Likelihood
Ratio
10.615 4 .031
% within I keep up tp date
with the latest technology
.0 .5 .5 1.0
Linear-by-
Linear
Association
.242 1 .623
% within How likely you
will buy the product 5
.0 .3 .1 .1
N of Valid
Cases
75
% of Total .0 .1 .1 .1
Neutral Count 6 11 10 27
% within I keep up tp date
with the latest technology
.2 .4 .4 1.0
% within How likely you
will buy the product 5
.5 .5 .3 .4
% of Total .1 .1 .1 .4
Agree Count 7 7 23 37

xxxii | P a g e
% within I keep up tp date
with the latest technology
18.9% 18.9% 62.2% 100.0%
% within How likely you
will buy the product 5
.5 .3 .6 .5
% of Total .1 .1 .3 .5
Total Count 13 24 38 75
% within I keep up tp date
with the latest technology
.2 .3 .5 1.0
% within How likely you
will buy the product 5
1.0 1.0 1.0 1.0
% of Total .2 .3 .5 1.0
Crosstab
Chi-Square Tests
How likely you will buy
product10
Total
Value df
Asymp. Sig.
(2-sided)
No
Not
sure Yes
Pearson Chi-
Square
.537 4 .970
I keep up tp
date with the
latest
technology
Disagree Count 1 3 7 11
Likelihood
Ratio
.543 4 .969
% within I keep up tp date
with the latest technology
.1 .3 .6 1.0
Linear-by-
Linear
Association
.000 1 .989
% within How likely you
will buy product10
.2 .2 .1 .1
N of Valid
Cases
75
% of Total .0 .0 .1 .1
Neutral Count 2 5 20 27
% within I keep up tp date
with the latest technology
.1 .2 .7 1.0
% within How likely you
will buy product10
.3 .3 .4 .4
% of Total .0 .1 .3 .4
Agree Count 3 9 25 37
% within I keep up tp date
with the latest technology
8.1% 24.3% 67.6% 100.0%
% within How likely you
will buy product10
.5 .5 .5 .5
% of Total .0 .1 .3 .5
Total Count 6 17 52 75
% within I keep up tp date
with the latest technology
.1 .2 .7 1.0
% within How likely you
will buy product10
1.0 1.0 1.0 1.0
% of Total .1 .2 .7 1.0
Crosstab
Chi-Square Tests
How likely you will buy
product 13
Total
Value df
Asymp. Sig.
(2-sided)
No
Not
sure Yes
Pearson Chi-
Square
1.897 4 .755
I keep up tp
date with the
latest
technology
Disagree Count 1 4 6 11
Likelihood
Ratio
1.823 4 .768
% within I keep up tp date
with the latest technology
.1 .4 .5 1.0
Linear-by-
Linear
Association
.935 1 .333
% within How likely you
will buy product 13
.1 .2 .1 .1
N of Valid
Cases
75
% of Total .0 .1 .1 .1
Neutral Count 4 7 16 27
% within I keep up tp date
with the latest technology
.1 .3 .6 1.0
% within How likely you
will buy product 13
.5 .4 .3 .4

xxxiii | P a g e
% of Total .1 .1 .2 .4
Agree Count 3 8 26 37
% within I keep up tp date
with the latest technology
8.1% 21.6% 70.3% 100.0%
% within How likely you
will buy product 13
.4 .4 .5 .5
% of Total .0 .1 .3 .5
Total Count 8 19 48 75
% within I keep up tp date
with the latest technology
.1 .3 .6 1.0
% within How likely you
will buy product 13
1.0 1.0 1.0 1.0
% of Total .1 .3 .6 1.0
Cross-tabulated Statistics: Outgoing lifestyle and Willingness to buy
Crosstab
Chi-Square Tests
How likely you will buy the
product1
Total
Value df
Asymp. Sig.
(2-sided)
No
Not
sure Yes
Pearson Chi-
Square
6.881 4 .142
I would
rather spend
a night out
than stay
home
Disagree Count 1 0 18 19
Likelihood
Ratio
10.879 4 .028
% within I would rather
spend a night out than
stay home
.1 .0 .9 1.0
Linear-by-
Linear
Association
.879 1 .348
% within How likely you
will buy the product1
.5 .0 .3 .3
N of Valid
Cases
75
% of Total .0 .0 .2 .3
Neutral Count 1 7 21 29
% within I would rather
spend a night out than
stay home
.0 .2 .7 1.0
% within How likely you
will buy the product1
.5 .5 .4 .4
% of Total .0 .1 .3 .4
Agree Count 0 7 20 27
% within I would rather
spend a night out than
stay home
0.0% 25.9% 74.1% 100.0%
% within How likely you
will buy the product1
.0 .5 .3 .4
% of Total .0 .1 .3 .4
Total Count 2 14 59 75
% within I would rather
spend a night out than
stay home
.0 .2 .8 1.0
% within How likely you
will buy the product1
1.0 1.0 1.0 1.0
% of Total .0 .2 .8 1.0
Crosstab
Chi-Square Tests
How likely you will buy
product 2
Total
Value df
Asymp. Sig.
(2-sided)
No
Not
sure Yes
Pearson Chi-
Square
2.434 4 .657
I would
rather spend
a night out
than stay
home
Disagree Count 2 5 12 19
Likelihood
Ratio
2.299 4 .681
% within I would rather
spend a night out than
stay home
.1 .3 .6 1.0
Linear-by-
Linear
Association
1.205 1 .272
% within How likely you
will buy product 2
.3 .4 .2 .3
N of Valid
Cases
75
% of Total .0 .1 .2 .3
Neutral Count 3 4 22 29
% within I would rather
spend a night out than
stay home
.1 .1 .8 1.0
% within How likely you
will buy product 2
.4 .3 .4 .4
% of Total .0 .1 .3 .4

xxxiv | P a g e
Agree Count 2 3 22 27
% within I would rather
spend a night out than
stay home
7.4% 11.1% 81.5% 100.0%
% within How likely you
will buy product 2
.3 .3 .4 .4
% of Total .0 .0 .3 .4
Total Count 7 12 56 75
% within I would rather
spend a night out than
stay home
.1 .2 .7 1.0
% within How likely you
will buy product 2
1.0 1.0 1.0 1.0
% of Total .1 .2 .7 1.0
Crosstab
Chi-Square Tests
How likely you will buy the
product 5
Total
Value df
Asymp. Sig.
(2-sided)
No
Not
sure Yes
Pearson Chi-
Square
4.107 4 .392
I would
rather spend
a night out
than stay
home
Disagree Count 6 5 8 19
Likelihood
Ratio
3.821 4 .431
% within I would rather
spend a night out than
stay home
.3 .3 .4 1.0
Linear-by-
Linear
Association
1.541 1 .214
% within How likely you
will buy the product 5
.5 .2 .2 .3
N of Valid
Cases
75
% of Total .1 .1 .1 .3
Neutral Count 3 11 15 29
% within I would rather
spend a night out than
stay home
.1 .4 .5 1.0
% within How likely you
will buy the product 5
.2 .5 .4 .4
% of Total .0 .1 .2 .4
Agree Count 4 8 15 27
% within I would rather
spend a night out than
stay home
14.8% 29.6% 55.6% 100.0%
% within How likely you
will buy the product 5
.3 .3 .4 .4
% of Total .1 .1 .2 .4
Total Count 13 24 38 75
% within I would rather
spend a night out than
stay home
.2 .3 .5 1.0
% within How likely you
will buy the product 5
1.0 1.0 1.0 1.0
% of Total .2 .3 .5 1.0
Crosstab
Chi-Square Tests
How likely you will buy
product10
Total
Value df
Asymp. Sig.
(2-sided)
No
Not
sure Yes
Pearson Chi-
Square
5.010 4 .286
I would
rather spend
a night out
than stay
home
Disagree Count 3 3 13 19
Likelihood
Ratio
6.856 4 .144
% within I would rather
spend a night out than
stay home
.2 .2 .7 1.0
Linear-by-
Linear
Association
2.043 1 .153
% within How likely you
will buy product10
.5 .2 .3 .3
N of Valid
Cases
75
% of Total .0 .0 .2 .3
Neutral Count 3 8 18 29

xxxv | P a g e
% within I would rather
spend a night out than
stay home
.1 .3 .6 1.0
% within How likely you
will buy product10
.5 .5 .3 .4
% of Total .0 .1 .2 .4
Agree Count 0 6 21 27
% within I would rather
spend a night out than
stay home
0.0% 22.2% 77.8% 100.0%
% within How likely you
will buy product10
.0 .4 .4 .4
% of Total .0 .1 .3 .4
Total Count 6 17 52 75
% within I would rather
spend a night out than
stay home
.1 .2 .7 1.0
% within How likely you
will buy product10
1.0 1.0 1.0 1.0
% of Total .1 .2 .7 1.0
Crosstab
Chi-Square Tests
How likely you will buy
product 13
Total
Value df
Asymp. Sig.
(2-sided)
No
Not
sure Yes
Pearson Chi-
Square
.571 4 .966
I would
rather spend
a night out
than stay
home
Disagree Count 2 6 11 19
Likelihood
Ratio
.558 4 .968
% within I would rather
spend a night out than
stay home
.1 .3 .6 1.0
Linear-by-
Linear
Association
.142 1 .706
% within How likely you
will buy product 13
.3 .3 .2 .3
N of Valid
Cases
75
% of Total .0 .1 .1 .3
Neutral Count 3 7 19 29
% within I would rather
spend a night out than
stay home
.1 .2 .7 1.0
% within How likely you
will buy product 13
.4 .4 .4 .4
% of Total .0 .1 .3 .4
Agree Count 3 6 18 27
% within I would rather
spend a night out than
stay home
11.1% 22.2% 66.7% 100.0%
% within How likely you
will buy product 13
.4 .3 .4 .4
% of Total .0 .1 .2 .4
Total Count 8 19 48 75
% within I would rather
spend a night out than
stay home
.1 .3 .6 1.0
% within How likely you
will buy product 13
1.0 1.0 1.0 1.0
% of Total .1 .3 .6 1.0

xxxvi | P a g e

xxxvii | P a g e
One-Way ANOVA: Gender and Top product features preference
ANOVA
Sum of
Squares df Mean Square F Sig.
Sum of
Squares df
Mean
Square F Sig.
Fried egg Taste Between
Groups
.092 1 .092 .204 .653
Candy Cane
Taste
Between
Groups
.680 1 .680 .513 .476
Within Groups 33.054 73 .453
Within Groups 96.707 73 1.325
Total 33.147 74
Total 97.387 74
Fried egg
Texture
Between
Groups
3.348 1 3.348 5.130 .026
Candy Cane
Texture
Between
Groups
.795 1 .795 .482 .490
Within Groups 47.639 73 .653
Within Groups 120.325 73 1.648
Total 50.987 74
Total 121.120 74
Fried egg Shape Between
Groups
2.677 1 2.677 2.874 .094
Candy Cane
Shape
Between
Groups
.365 1 .365 .422 .518
Within Groups 67.990 73 .931
Within Groups 63.181 73 .865
Total 70.667 74
Total 63.547 74
Fried egg Color Between
Groups
1.163 1 1.163 1.468 .230
Candy Cane
Color
Between
Groups
4.341 1 4.341 4.544 .036
Within Groups 57.824 73 .792
Within Groups 69.739 73 .955
Total 58.987 74
Total 74.080 74
Fried egg Smell Between
Groups
.977 1 .977 1.399 .241
Candy Cane
Smell
Between
Groups
.520 1 .520 .422 .518
Within Groups 50.970 73 .698
Within Groups 89.960 73 1.232
Total 51.947 74
Total 90.480 74
How likely you
will buy Fried
egg
Between
Groups
1.421 1 1.421 2.231 .140
How likely
you will buy
Candy Cane
Between
Groups
4.135 1 4.135 3.069 .084
Within Groups 46.499 73 .637
Within Groups 98.345 73 1.347
Total 47.920 74
Total 102.480 74
Red Meter
Taste
Between
Groups
.116 1 .116 .108 .743
Jelly Beans
Taste
Between
Groups
.686 1 .686 .656 .421
Within Groups 78.204 73 1.071
Within Groups 76.301 73 1.045
Total 78.320 74
Total 76.987 74
Red Meter
Texture
Between
Groups
.006 1 .006 .008 .931
Jelly Beans
Texture
Between
Groups
.653 1 .653 .670 .416
Within Groups 62.074 73 .850
Within Groups 71.134 73 .974
Total 62.080 74
Total 71.787 74
Red Meter
Shape
Between
Groups
.549 1 .549 .465 .497
Jelly Beans
Shape
Between
Groups
.029 1 .029 .033 .856
Within Groups 86.171 73 1.180
Within Groups 64.051 73 .877
Total 86.720 74
Total 64.080 74
Red Meter
Color
Between
Groups
4.244 1 4.244 5.203 .025
Jelly Beans
Color
Between
Groups
1.601 1 1.601 2.004 .161
Within Groups 59.543 73 .816
Within Groups 58.345 73 .799
Total 63.787 74
Total 59.947 74

xxxviii | P a g e
Red Meter
Smell
Between
Groups
.691 1 .691 .636 .428
Jelly Beans
Smell
Between
Groups
.300 1 .300 .288 .593
Within Groups 79.389 73 1.088
Within Groups 76.047 73 1.042
Total 80.080 74
Total 76.347 74
How likely you
will buy Red
Meter
Between
Groups
.714 1 .714 .646 .424
How likely
you will buy
Jelly Beans
Between
Groups
.621 1 .621 .669 .416
Within Groups 80.673 73 1.105
Within Groups 67.726 73 .928
Total 81.387 74
Total 68.347 74
Duo Fudge
Taste
Between
Groups
1.229 1 1.229 .982 .325
Blue Shark
Taste
Between
Groups
.825 1 .825 .994 .322
Within Groups 91.358 73 1.251
Within Groups 60.562 73 .830
Total 92.587 74
Total 61.387 74
Duo Fudge
Texture
Between
Groups
1.661 1 1.661 1.399 .241
Blue Shark
Texture
Between
Groups
.691 1 .691 .772 .383
Within Groups 86.686 73 1.187
Within Groups 65.389 73 .896
Total 88.347 74
Total 66.080 74
Duo Fudge
Shape
Between
Groups
.754 1 .754 .861 .357
Blue Shark
Shape
Between
Groups
.918 1 .918 1.060 .307
Within Groups 63.913 73 .876
Within Groups 63.268 73 .867
Total 64.667 74
Total 64.187 74
Duo Fudge
Color
Between
Groups
.001 1 .001 .000 .983
Blue Shark
Color
Between
Groups
.428 1 .428 .393 .533
Within Groups 88.586 73 1.214
Within Groups 79.518 73 1.089
Total 88.587 74
Total 79.947 74
Duo Fudge
Smell
Between
Groups
1.635 1 1.635 1.453 .232
Blue Shark
Smell
Between
Groups
.357 1 .357 .262 .610
Within Groups 82.151 73 1.125
Within Groups 99.589 73 1.364
Total 83.787 74
Total 99.947 74
How likely you
will buy Duo
Fudge
Between
Groups
.887 1 .887 .779 .380
How likely
you will buy
Blue Shark
Between
Groups
.002 1 .002 .002 .964
Within Groups 83.033 73 1.137
Within Groups 68.185 73 .934
Total 83.920 74
Total 68.187 74
N Mean Std. Deviation
Std.
Error
95% Confidence
Interval for Mean
Minimum Maximum
Lower
Bound
Upper
Bound
Fried Egg
Texture
Male 23 3.70 .974 .203 3.27 4.12 2 5
Female 52 4.15 .724 .100 3.95 4.36 3 5
Total 75 4.01 .830 .096 3.82 4.20 2 5
Red Meter
Color
Male 23 3.70 .926 .193 3.30 4.10 2 5
Female 52 4.21 .893 .124 3.96 4.46 2 5
Total 75 4.05 .928 .107 3.84 4.27 2 5
Candy Cane
Color
Male 23 3.48 1.123 .234 2.99 3.96 2 5
Female 52 4.00 .907 .126 3.75 4.25 1 5
Total 75 3.84 1.001 .116 3.61 4.07 1 5

xxxix | P a g e
One-Way ANOVA: Age and Top product features preference
ANOVA
Sum of
Squares df Mean Square F Sig.
Sum of
Squares df Mean Square F Sig.
Fried egg
Taste
Between
Groups
.019 1 .019 .042 .838
Candy Cane
Taste
Between
Groups
.014 1 .014 .011 .918
Within
Groups
33.127 73 .454
Within Groups 97.373 73 1.334
Total 33.147 74
Total 97.387 74
Fried egg
Texture
Between
Groups
.107 1 .107 .153 .697
Candy Cane
Texture
Between
Groups
2.005 1 2.005 1.229 .271
Within
Groups
50.880 73 .697
Within Groups 119.115 73 1.632
Total 50.987 74
Total 121.120 74
Fried egg
Shape
Between
Groups
.794 1 .794 .830 .365
Candy Cane
Shape
Between
Groups
.000 1 .000 .000 .992
Within
Groups
69.873 73 .957
Within Groups 63.547 73 .871
Total 70.667 74
Total 63.547 74
Fried egg
Color
Between
Groups
.330 1 .330 .410 .524
Candy Cane
Color
Between
Groups
.082 1 .082 .081 .776
Within
Groups
58.657 73 .804
Within Groups 73.998 73 1.014
Total 58.987 74
Total 74.080 74
Fried egg
Smell
Between
Groups
.341 1 .341 .483 .489
Candy Cane
Smell
Between
Groups
.149 1 .149 .121 .729
Within
Groups
51.605 73 .707
Within Groups 90.331 73 1.237
Total 51.947 74
Total 90.480 74
How likely
you will buy
Fried egg
Between
Groups
.217 1 .217 .331 .567
How likely you
will buy Candy
Cane
Between
Groups
.012 1 .012 .008 .927
Within
Groups
47.703 73 .653
Within Groups 102.468 73 1.404
Total 47.920 74
Total 102.480 74
Red Meter
Taste
Between
Groups
2.734 1 2.734 2.641 .108
Jelly Beans
Taste
Between
Groups
.028 1 .028 .027 .870
Within
Groups
75.586 73 1.035
Within Groups 76.958 73 1.054
Total 78.320 74
Total 76.987 74

xl | P a g e
Red Meter
Texture
Between
Groups
.612 1 .612 .727 .397
Jelly Beans
Texture
Between
Groups
.848 1 .848 .873 .353
Within
Groups
61.468 73 .842
Within Groups 70.939 73 .972
Total 62.080 74
Total 71.787 74
Red Meter
Shape
Between
Groups
.742 1 .742 .630 .430
Jelly Beans
Shape
Between
Groups
1.060 1 1.060 1.228 .271
Within
Groups
85.978 73 1.178
Within Groups 63.020 73 .863
Total 86.720 74
Total 64.080 74
Red Meter
Color
Between
Groups
.100 1 .100 .115 .735
Jelly Beans
Color
Between
Groups
.341 1 .341 .418 .520
Within
Groups
63.686 73 .872
Within Groups 59.605 73 .817
Total 63.787 74
Total 59.947 74
Red Meter
Smell
Between
Groups
.612 1 .612 .562 .456
Jelly Beans
Smell
Between
Groups
1.102 1 1.102 1.069 .305
Within
Groups
79.468 73 1.089
Within Groups 75.245 73 1.031
Total 80.080 74
Total 76.347 74
How likely
you will buy
Red Meter
Between
Groups
.759 1 .759 .687 .410
How likely you
will buy Jelly
Beans
Between
Groups
2.033 1 2.033 2.238 .139
Within
Groups
80.627 73 1.104
Within Groups 66.314 73 .908
Total 81.387 74
Total 68.347 74
Duo Fudge
Taste
Between
Groups
.001 1 .001 .001 .979
Blue Shark
Taste
Between
Groups
.014 1 .014 .017 .897
Within
Groups
92.586 73 1.268
Within Groups 61.373 73 .841
Total 92.587 74
Total 61.387 74
Duo Fudge
Texture
Between
Groups
.643 1 .643 .535 .467
Blue Shark
Texture
Between
Groups
.082 1 .082 .091 .764
Within
Groups
87.703 73 1.201
Within Groups 65.998 73 .904
Total 88.347 74
Total 66.080 74
Duo Fudge
Shape
Between
Groups
.708 1 .708 .808 .372
Blue Shark
Shape
Between
Groups
.581 1 .581 .667 .417
Within
Groups
63.958 73 .876
Within Groups 63.605 73 .871
Total 64.667 74
Total 64.187 74
Duo Fudge
Color
Between
Groups
.275 1 .275 .228 .635
Blue Shark
Color
Between
Groups
.427 1 .427 .392 .533

xli | P a g e
Within
Groups
88.311 73 1.210
Within Groups 79.520 73 1.089
Total 88.587 74
Total 79.947 74
Duo Fudge
Smell
Between
Groups
1.122 1 1.122 .991 .323
Blue Shark
Smell
Between
Groups
.692 1 .692 .509 .478
Within
Groups
82.664 73 1.132
Within Groups 99.255 73 1.360
Total 83.787 74
Total 99.947 74
How likely
you will buy
Duo Fudge
Between
Groups
.001 1 .001 .001 .978
How likely you
will buy Blue
Shark
Between
Groups
.942 1 .942 1.022 .315
Within
Groups
83.919 73 1.150
Within Groups 67.245 73 .921
Total 83.920 74
Total 68.187 74
One-Way ANOVA: Income/ Allowance and Top product features preference
ANOVA
Sum of Squares df Mean Square F Sig.
Sum of Squares df Mean Square F Sig.
Fried egg
Taste
Between Groups 2.688 4 .672 1.545 .199
Candy Cane
Taste
Between
Groups
10.645 4 2.661 2.148 .084
Within Groups 30.458 70 .435
Within Groups 86.742 70 1.239
Total 33.147 74
Total 97.387 74
Fried egg
Texture
Between Groups 3.620 4 .905 1.337 .265
Candy Cane
Texture
Between
Groups
12.503 4 3.126 2.015 .102
Within Groups 47.367 70 .677
Within Groups 108.617 70 1.552
Total 50.987 74
Total 121.120 74
Fried egg
Shape
Between Groups 2.258 4 .565 .578 .680
Candy Cane
Shape
Between
Groups
9.630 4 2.408 3.126 .020
Within Groups 68.408 70 .977
Within Groups 53.917 70 .770
Total 70.667 74
Total 63.547 74
Fried egg
Color
Between Groups 3.128 4 .782 .980 .424
Candy Cane
Color
Between
Groups
10.363 4 2.591 2.846 .030
Within Groups 55.858 70 .798
Within Groups 63.717 70 .910
Total 58.987 74
Total 74.080 74
Fried egg
Smell
Between Groups 8.688 4 2.172 3.515 .011
Candy Cane
Smell
Between
Groups
4.663 4 1.166 .951 .440
Within Groups 43.258 70 .618
Within Groups 85.817 70 1.226
Total 51.947 74
Total 90.480 74
How likely
you will buy
Fried egg
Between Groups 1.828 4 .457 .694 .598
How likely you
will buy Candy
Cane
Between
Groups
10.588 4 2.647 2.016 .102
Within Groups 46.092 70 .658
Within Groups 91.892 70 1.313
Total 47.920 74
Total 102.480 74
Red Meter
Taste
Between Groups 2.162 4 .540 .497 .738
Jelly Beans Taste Between
Groups
1.312 4 .328 .303 .875

xlii | P a g e
Within Groups 76.158 70 1.088
Within Groups 75.675 70 1.081
Total 78.320 74
Total 76.987 74
Red Meter
Texture
Between Groups 6.838 4 1.710 2.166 .082
Jelly Beans
Texture
Between
Groups
2.720 4 .680 .689 .602
Within Groups 55.242 70 .789
Within Groups 69.067 70 .987
Total 62.080 74
Total 71.787 74
Red Meter
Shape
Between Groups 6.912 4 1.728 1.516 .207
Jelly Beans Shape Between
Groups
2.947 4 .737 .844 .502
Within Groups 79.808 70 1.140
Within Groups 61.133 70 .873
Total 86.720 74
Total 64.080 74
Red Meter
Color
Between Groups 10.345 4 2.586 3.388 .014
Jelly Beans Color Between
Groups
5.605 4 1.401 1.805 .138
Within Groups 53.442 70 .763
Within Groups 54.342 70 .776
Total 63.787 74
Total 59.947 74
Red Meter
Smell
Between Groups 6.313 4 1.578 1.498 .212
Jelly Beans Smell Between
Groups
3.255 4 .814 .779 .542
Within Groups 73.767 70 1.054
Within Groups 73.092 70 1.044
Total 80.080 74
Total 76.347 74
How likely
you will buy
Red Meter
Between Groups 2.970 4 .743 .663 .620
How likely you
will buy Jelly
Beans
Between
Groups
.963 4 .241 .250 .909
Within Groups 78.417 70 1.120
Within Groups 67.383 70 .963
Total 81.387 74
Total 68.347 74
Duo Fudge
Taste
Between Groups 3.970 4 .993 .784 .539
Blue Shark Taste Between
Groups
1.645 4 .411 .482 .749
Within Groups 88.617 70 1.266
Within Groups 59.742 70 .853
Total 92.587 74
Total 61.387 74
Duo Fudge
Texture
Between Groups 4.113 4 1.028 .855 .496
Blue Shark
Texture
Between
Groups
3.138 4 .785 .873 .485
Within Groups 84.233 70 1.203
Within Groups 62.942 70 .899
Total 88.347 74
Total 66.080 74
Duo Fudge
Shape
Between Groups 1.783 4 .446 .496 .738
Blue Shark Shape Between
Groups
1.978 4 .495 .557 .695
Within Groups 62.883 70 .898
Within Groups 62.208 70 .889
Total 64.667 74
Total 64.187 74
Duo Fudge
Color
Between Groups 14.953 4 3.738 3.554 .011
Blue Shark Color Between
Groups
1.513 4 .378 .338 .852
Within Groups 73.633 70 1.052
Within Groups 78.433 70 1.120
Total 88.587 74
Total 79.947 74
Duo Fudge
Smell
Between Groups 15.495 4 3.874 3.971 .006
Blue Shark Smell Between
Groups
6.447 4 1.612 1.207 .316
Within Groups 68.292 70 .976
Within Groups 93.500 70 1.336
Total 83.787 74
Total 99.947 74
How likely
you will buy
Duo Fudge
Between Groups 6.103 4 1.526 1.373 .252
How likely you
will buy Blue
Shark
Between
Groups
2.020 4 .505 .534 .711
Within Groups 77.817 70 1.112
Within Groups 66.167 70 .945
Total 83.920 74
Total 68.187 74

xliii | P a g e
Fried egg Smell
Q10. Income/ allowance per month
N
Subset for alpha = 0.05
1 2
Duncana,b
30,001 - 40,000
THB
12 3.08
More than 40,000
THB
8 3.38 3.38
20,001 - 30,000
THB
30 3.73 3.73
Less than 10,000
THB
5 3.80 3.80
10,000 - 20,000
THB
20
4.10
Sig. .063 .060
Red Meter Color
Candy Cane Shape
Q10. Income/ allowance per month
N
Subset for alpha = 0.05
Q10. Income/ allowance per month
N
Subset for alpha = 0.05
1 2 3
1 2
Duncana,b
30,001 - 40,000
THB
12 3.50
Duncana,b
More than 40,000
THB
8 3.00
More than 40,000
THB
8 3.63 3.63
30,001 - 40,000
THB
12 3.25
20,001 - 30,000
THB
30 4.03 4.03 4.03
Less than 10,000
THB
5 3.40 3.40
10,000 - 20,000
THB
20
4.40 4.40
20,001 - 30,000
THB
30 3.67 3.67
Less than 10,000
THB
5
4.80
10,000 - 20,000
THB
20
4.10
Sig. .199 .062 .065
Sig. .123 .093
Candy Cane Color
Q10. Income/ allowance per month
N
Subset for alpha = 0.05
1 2
Duncana,b
More than 40,000
THB
8 3.25
Less than 10,000
THB
5 3.40
30,001 - 40,000
THB
12 3.50 3.50
20,001 - 30,000
THB
30 3.87 3.87
10,000 - 20,000
THB
20
4.35
Sig.
.190 .061

xliv | P a g e
One-Way ANOVA: Green lifestyle and Top product features preference
ANOVA
Sum of
Squares df Mean Square F Sig.
Sum of
Squares df Mean Square F Sig.
Fried egg
Taste
Between Groups .718 2 .359 .797 .455
Candy
Cane Taste
Between
Groups
.596 2 .298 .222 .802
Within Groups 32.429 72 .450
Within Groups 96.791 72 1.344
Total 33.147 74
Total 97.387 74
Fried egg
Texture
Between Groups 1.632 2 .816 1.191 .310
Candy
Cane
Texture
Between
Groups
1.493 2 .746 .449 .640
Within Groups 49.354 72 .685
Within Groups 119.627 72 1.661
Total 50.987 74
Total 121.120 74
Fried egg
Shape
Between Groups 3.090 2 1.545 1.646 .200
Candy
Cane
Shape
Between
Groups
2.850 2 1.425 1.690 .192
Within Groups 67.577 72 .939
Within Groups 60.697 72 .843
Total 70.667 74
Total 63.547 74
Fried egg
Color
Between Groups 1.143 2 .571 .711 .495
Candy
Cane Color
Between
Groups
1.037 2 .518 .511 .602
Within Groups 57.844 72 .803
Within Groups 73.043 72 1.014
Total 58.987 74
Total 74.080 74
Fried egg
Smell
Between Groups 1.048 2 .524 .741 .480
Candy
Cane Smell
Between
Groups
1.829 2 .915 .743 .479
Within Groups 50.899 72 .707
Within Groups 88.651 72 1.231
Total 51.947 74
Total 90.480 74
How likely
you will buy
Fried egg
Between Groups 1.023 2 .512 .786 .460
How likely
you will
buy Candy
Cane
Between
Groups
2.339 2 1.170 .841 .436
Within Groups 46.897 72 .651
Within Groups 100.141 72 1.391
Total 47.920 74
Total 102.480 74
Red Meter
Taste
Between Groups 3.891 2 1.946 1.882 .160
Jelly Beans
Taste
Between
Groups
1.017 2 .509 .482 .619
Within Groups 74.429 72 1.034
Within Groups 75.969 72 1.055
Total 78.320 74
Total 76.987 74
Red Meter
Texture
Between Groups 6.320 2 3.160 4.080 .021
Jelly Beans
Texture
Between
Groups
.898 2 .449 .456 .636
Within Groups 55.760 72 .774
Within Groups 70.889 72 .985
Total 62.080 74
Total 71.787 74
Red Meter
Shape
Between Groups 11.410 2 5.705 5.454 .006
Jelly Beans
Shape
Between
Groups
.794 2 .397 .452 .638
Within Groups 75.310 72 1.046
Within Groups 63.286 72 .879
Total 86.720 74
Total 64.080 74
Red Meter
Color
Between Groups 2.840 2 1.420 1.677 .194
Jelly Beans
Color
Between
Groups
.150 2 .075 .090 .914
Within Groups 60.947 72 .846
Within Groups 59.797 72 .831
Total 63.787 74
Total 59.947 74
Red Meter
Smell
Between Groups .794 2 .397 .361 .699
Jelly Beans
Smell
Between
Groups
.434 2 .217 .206 .814
Within Groups 79.286 72 1.101
Within Groups 75.912 72 1.054
Total 80.080 74
Total 76.347 74

xlv | P a g e
How likely
you will buy
Red Meter
Between Groups 5.117 2 2.558 2.415 .097
How likely
you will
buy Jelly
Beans
Between
Groups
.503 2 .251 .267 .767
Within Groups 76.270 72 1.059
Within Groups 67.844 72 .942
Total 81.387 74
Total 68.347 74
Duo Fudge
Taste
Between Groups 12.329 2 6.165 5.530 .006
Blue Shark
Taste
Between
Groups
.782 2 .391 .465 .630
Within Groups 80.257 72 1.115
Within Groups 60.604 72 .842
Total 92.587 74
Total 61.387 74
Duo Fudge
Texture
Between Groups 4.723 2 2.361 2.033 .138
Blue Shark
Texture
Between
Groups
.756 2 .378 .416 .661
Within Groups 83.624 72 1.161
Within Groups 65.324 72 .907
Total 88.347 74
Total 66.080 74
Duo Fudge
Shape
Between Groups 1.289 2 .645 .732 .484
Blue Shark
Shape
Between
Groups
.251 2 .125 .141 .869
Within Groups 63.377 72 .880
Within Groups 63.936 72 .888
Total 64.667 74
Total 64.187 74
Duo Fudge
Color
Between Groups .348 2 .174 .142 .868
Blue Shark
Color
Between
Groups
.503 2 .252 .228 .797
Within Groups 88.239 72 1.226
Within Groups 79.443 72 1.103
Total 88.587 74
Total 79.947 74
Duo Fudge
Smell
Between Groups 1.227 2 .613 .535 .588
Blue Shark
Smell
Between
Groups
1.394 2 .697 .509 .603
Within Groups 82.560 72 1.147
Within Groups 98.553 72 1.369
Total 83.787 74
Total 99.947 74
How likely
you will buy
Duo Fudge
Between Groups 3.710 2 1.855 1.665 .196
How likely
you will
buy Blue
Shark
Between
Groups
1.127 2 .563 .605 .549
Within Groups 80.210 72 1.114
Within Groups 67.060 72 .931
Total 83.920 74
Total 68.187 74
Red Meter Texture
I am concern about the environment
N
Subset for alpha = 0.05
1 2
Duncana,b
Neutral 25 3.52
Disagree 14 3.64 3.64
Agree 36 4.14
Sig. .648 .068
Red Meter Shape
I am concern about the environment
N
Subset for alpha = 0.05
1 2
Duncana,b
Disagree 14 3.00
Neutral 25 3.24
Agree 36 3.92
Sig. .444 1.000

xlvi | P a g e
One-Way ANOVA: Healthy lifestyle and Top product features preference
ANOVA
Sum of Squares df Mean Square F Sig.
Sum of Squares df
Mean
Square F Sig.
Fried egg Taste Between
Groups
3.330 2 1.665 4.021 .022
Candy Cane Taste Between
Groups
.087 2 .043 .032 .969
Within Groups 29.816 72 .414
Within Groups 97.300 72 1.351
Total 33.147 74
Total 97.387 74
Fried egg Texture Between
Groups
.834 2 .417 .599 .552
Candy Cane
Texture
Between
Groups
.917 2 .458 .275 .761
Within Groups 50.152 72 .697
Within Groups 120.203 72 1.669
Total 50.987 74
Total 121.120 74
Fried egg Shape Between
Groups
.417 2 .208 .214 .808
Candy Cane Shape Between
Groups
.133 2 .066 .075 .928
Within Groups 70.250 72 .976
Within Groups 63.414 72 .881
Total 70.667 74
Total 63.547 74
Fried egg Color Between
Groups
2.048 2 1.024 1.295 .280
Candy Cane Color Between
Groups
.533 2 .266 .261 .771
Within Groups 56.939 72 .791
Within Groups 73.547 72 1.021
Total 58.987 74
Total 74.080 74
Fried egg Smell Between
Groups
.684 2 .342 .481 .620
Candy Cane Smell Between
Groups
5.018 2 2.509 2.114 .128
Within Groups 51.262 72 .712
Within Groups 85.462 72 1.187
Total 51.947 74
Total 90.480 74
How likely you
will buy Fried egg
Between
Groups
1.417 2 .708 1.097 .340
How likely you
will buy Candy
Cane
Between
Groups
2.113 2 1.056 .758 .472
Within Groups 46.503 72 .646
Within Groups 100.367 72 1.394
Total 47.920 74
Total 102.480 74
Red Meter Taste Between
Groups
1.445 2 .722 .677 .512
Jelly Beans Taste Between
Groups
.662 2 .331 .312 .733
Within Groups 76.875 72 1.068
Within Groups 76.325 72 1.060
Total 78.320 74
Total 76.987 74
Red Meter Texture Between
Groups
.533 2 .266 .312 .733
Jelly Beans
Texture
Between
Groups
1.933 2 .967 .996 .374
Within Groups 61.547 72 .855
Within Groups 69.853 72 .970
Total 62.080 74
Total 71.787 74
Red Meter Shape Between
Groups
4.234 2 2.117 1.848 .165
Jelly Beans Shape Between
Groups
1.752 2 .876 1.012 .369
Within Groups 82.486 72 1.146
Within Groups 62.328 72 .866
Total 86.720 74
Total 64.080 74
Red Meter Color Between
Groups
.062 2 .031 .035 .966
Jelly Beans Color Between
Groups
1.478 2 .739 .910 .407
Within Groups 63.725 72 .885
Within Groups 58.469 72 .812
Total 63.787 74
Total 59.947 74
Red Meter Smell Between
Groups
.769 2 .385 .349 .707
Jelly Beans Smell Between
Groups
1.034 2 .517 .494 .612

xlvii | P a g e
Within Groups 79.311 72 1.102
Within Groups 75.312 72 1.046
Total 80.080 74
Total 76.347 74
How likely you
will buy Red
Meter
Between
Groups
2.425 2 1.212 1.105 .337
How likely you
will buy Jelly
Beans
Between
Groups
2.359 2 1.180 1.287 .282
Within Groups 78.962 72 1.097
Within Groups 65.988 72 .916
Total 81.387 74
Total 68.347 74
Duo Fudge Taste Between
Groups
5.393 2 2.697 2.227 .115
Blue Shark Taste Between
Groups
1.246 2 .623 .746 .478
Within Groups 87.194 72 1.211
Within Groups 60.140 72 .835
Total 92.587 74
Total 61.387 74
Duo Fudge
Texture
Between
Groups
1.750 2 .875 .727 .487
Blue Shark
Texture
Between
Groups
1.752 2 .876 .981 .380
Within Groups 86.597 72 1.203
Within Groups 64.328 72 .893
Total 88.347 74
Total 66.080 74
Duo Fudge Shape Between
Groups
.342 2 .171 .191 .826
Blue Shark Shape Between
Groups
.338 2 .169 .190 .827
Within Groups 64.325 72 .893
Within Groups 63.849 72 .887
Total 64.667 74
Total 64.187 74
Duo Fudge Color Between
Groups
1.930 2 .965 .802 .453
Blue Shark Color Between
Groups
.472 2 .236 .214 .808
Within Groups 86.657 72 1.204
Within Groups 79.475 72 1.104
Total 88.587 74
Total 79.947 74
Duo Fudge Smell Between
Groups
1.206 2 .603 .526 .593
Blue Shark Smell Between
Groups
.277 2 .138 .100 .905
Within Groups 82.581 72 1.147
Within Groups 99.670 72 1.384
Total 83.787 74
Total 99.947 74
How likely you
will buy Duo
Fudge
Between
Groups
1.148 2 .574 .499 .609
How likely you
will buy Blue
Shark
Between
Groups
3.412 2 1.706 1.896 .158
Within Groups 82.772 72 1.150
Within Groups 64.774 72 .900
Total 83.920 74
Total 68.187 74
Fried egg Taste
I like to eat healthy food and
excercise N
Subset for alpha = 0.05
1 2
Duncana,b
Neutral 18 4.06
Agree 41 4.15
Disagree 16 4.63
Sig. .648 1.000

xlviii | P a g e
One-Way ANOVA: Fashion lifestyle and Top product features preference
ANOVA
Sum of
Squares df Mean Square F Sig.
Sum of
Squares df Mean Square F Sig.
Fried egg
Taste
Between
Groups
.461 2 .231 .508 .604
Candy Cane
Taste
Between
Groups
1.310 2 .655 .491 .614
Within Groups 32.686 72 .454
Within Groups 96.076 72 1.334
Total 33.147 74
Total 97.387 74
Fried egg
Texture
Between
Groups
1.846 2 .923 1.353 .265
Candy Cane
Texture
Between
Groups
.866 2 .433 .259 .772
Within Groups 49.140 72 .683
Within Groups 120.254 72 1.670
Total 50.987 74
Total 121.120 74
Fried egg
Shape
Between
Groups
2.918 2 1.459 1.550 .219
Candy Cane
Shape
Between
Groups
.071 2 .035 .040 .961
Within Groups 67.749 72 .941
Within Groups 63.476 72 .882
Total 70.667 74
Total 63.547 74
Fried egg
Color
Between
Groups
4.767 2 2.383 3.165 .048
Candy Cane
Color
Between
Groups
.659 2 .329 .323 .725
Within Groups 54.220 72 .753
Within Groups 73.421 72 1.020
Total 58.987 74
Total 74.080 74
Fried egg
Smell
Between
Groups
.409 2 .204 .286 .752
Candy Cane
Smell
Between
Groups
3.067 2 1.533 1.263 .289
Within Groups 51.538 72 .716
Within Groups 87.413 72 1.214
Total 51.947 74
Total 90.480 74
How likely
you will buy
Fried egg
Between
Groups
.388 2 .194 .294 .746
How likely
you will buy
Candy Cane
Between
Groups
2.046 2 1.023 .733 .484
Within Groups 47.532 72 .660
Within Groups 100.434 72 1.395
Total 47.920 74
Total 102.480 74
Red Meter
Taste
Between
Groups
3.538 2 1.769 1.703 .189
Jelly Beans
Taste
Between
Groups
4.171 2 2.086 2.062 .135
Within Groups 74.782 72 1.039
Within Groups 72.815 72 1.011
Total 78.320 74
Total 76.987 74
Red Meter
Texture
Between
Groups
1.455 2 .728 .864 .426
Jelly Beans
Texture
Between
Groups
3.752 2 1.876 1.985 .145
Within Groups 60.625 72 .842
Within Groups 68.035 72 .945
Total 62.080 74
Total 71.787 74
Red Meter
Shape
Between
Groups
2.078 2 1.039 .884 .418
Jelly Beans
Shape
Between
Groups
9.241 2 4.621 6.067 .004
Within Groups 84.642 72 1.176
Within Groups 54.839 72 .762
Total 86.720 74
Total 64.080 74
Red Meter
Color
Between
Groups
2.022 2 1.011 1.179 .314
Jelly Beans
Color
Between
Groups
9.815 2 4.908 7.049 .002
Within Groups 61.764 72 .858
Within Groups 50.131 72 .696
Total 63.787 74
Total 59.947 74
Red Meter
Smell
Between
Groups
2.871 2 1.435 1.339 .269
Jelly Beans
Smell
Between
Groups
.789 2 .394 .376 .688
Within Groups 77.209 72 1.072
Within Groups 75.558 72 1.049
Total 80.080 74
Total 76.347 74
How likely Between .287 2 .143 .127 .881
How likely Between 3.874 2 1.937 2.163 .122

xlix | P a g e
you will buy
Red Meter
Groups you will buy
Jelly Beans
Groups
Within Groups 81.100 72 1.126
Within Groups 64.473 72 .895
Total 81.387 74
Total 68.347 74
Duo Fudge
Taste
Between
Groups
4.204 2 2.102 1.712 .188
Blue Shark
Taste
Between
Groups
5.352 2 2.676 3.438 .037
Within Groups 88.383 72 1.228
Within Groups 56.035 72 .778
Total 92.587 74
Total 61.387 74
Duo Fudge
Texture
Between
Groups
.021 2 .011 .009 .991
Blue Shark
Texture
Between
Groups
2.871 2 1.435 1.635 .202
Within Groups 88.325 72 1.227
Within Groups 63.209 72 .878
Total 88.347 74
Total 66.080 74
Duo Fudge
Shape
Between
Groups
.443 2 .222 .248 .781
Blue Shark
Shape
Between
Groups
7.917 2 3.959 5.065 .009
Within Groups 64.223 72 .892
Within Groups 56.269 72 .782
Total 64.667 74
Total 64.187 74
Duo Fudge
Color
Between
Groups
.068 2 .034 .028 .973
Blue Shark
Color
Between
Groups
5.952 2 2.976 2.896 .062
Within Groups 88.518 72 1.229
Within Groups 73.994 72 1.028
Total 88.587 74
Total 79.947 74
Duo Fudge
Smell
Between
Groups
.522 2 .261 .226 .798
Blue Shark
Smell
Between
Groups
1.549 2 .775 .567 .570
Within Groups 83.264 72 1.156
Within Groups 98.397 72 1.367
Total 83.787 74
Total 99.947 74
How likely
you will buy
Duo Fudge
Between
Groups
.073 2 .036 .031 .969
How likely
you will buy
Blue Shark
Between
Groups
3.523 2 1.762 1.962 .148
Within Groups 83.847 72 1.165
Within Groups 64.663 72 .898
Total 83.920 74
Total 68.187 74
Fried egg Color
Blue Shark Taste
I keep up to date with the latest
fashion trends
N
Subset for alpha = 0.05
I keep up to date with the latest
fashion trends
N
Subset for
alpha = 0.05
1 2
1
Duncana,b
Disagree 13 3.54
Duncana,b
Neutral 16 3.50
Neutral 16 3.88 3.88
Disagree 13 3.54
Agree 46 4.20
Agree 46 4.07
Sig. .241 .263
Sig. .068
Jelly Beans Shape
Blue Shark Shape
I keep up to date with the latest
fashion trends N
Subset for alpha = 0.05
I keep up to date with the latest
fashion trends N
Subset for alpha = 0.05
1 2
1 2
Duncana,b
Disagree 13 3.08
Duncana,b
Disagree 13 3.69
Agree 46 3.98
Neutral 16 4.00 4.00
Neutral 16 4.06
Agree 46 4.50
Sig. 1.000 .769
Sig. .292 .089
Jelly Beans Color
I keep up to date with the latest
fashion trends N
Subset for alpha = 0.05
1 2
Duncana,b Disagree 13 3.62
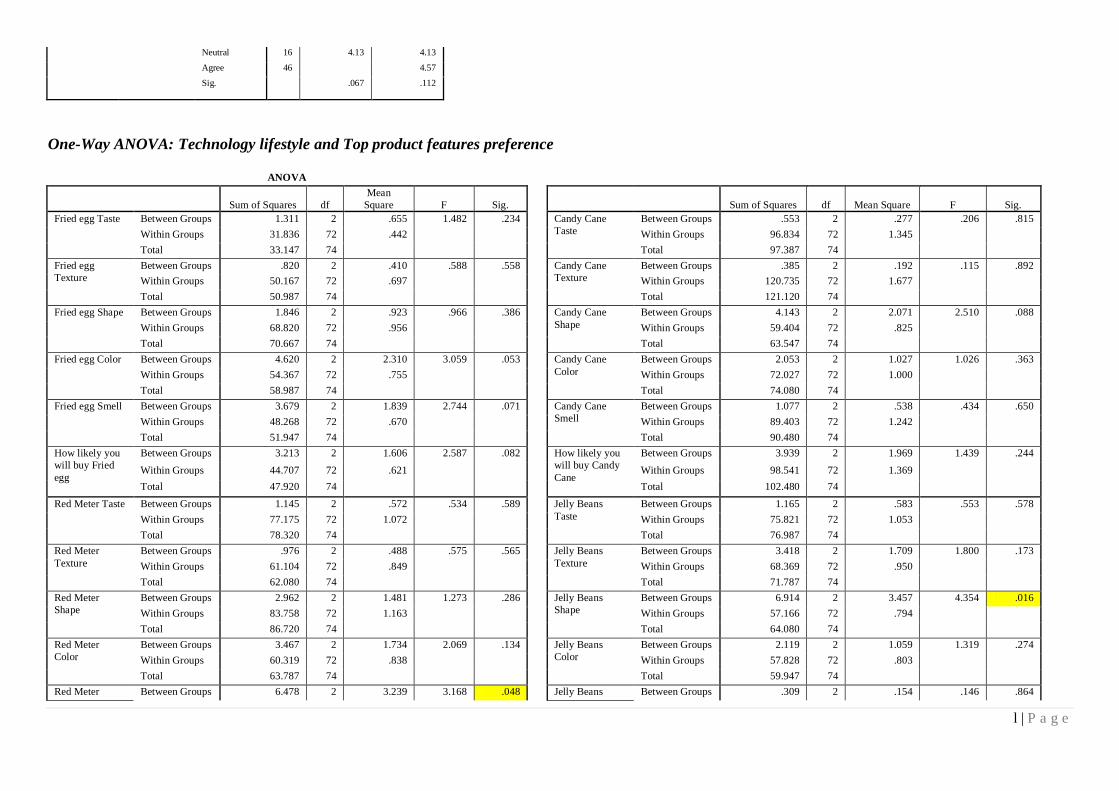
l | P a g e
Neutral 16 4.13 4.13
Agree 46 4.57
Sig.
.067 .112
One-Way ANOVA: Technology lifestyle and Top product features preference
ANOVA
Sum of Squares df
Mean
Square F Sig.
Sum of Squares df Mean Square F Sig.
Fried egg Taste Between Groups 1.311 2 .655 1.482 .234
Candy Cane
Taste
Between Groups .553 2 .277 .206 .815
Within Groups 31.836 72 .442
Within Groups 96.834 72 1.345
Total 33.147 74
Total 97.387 74
Fried egg
Texture
Between Groups .820 2 .410 .588 .558
Candy Cane
Texture
Between Groups .385 2 .192 .115 .892
Within Groups 50.167 72 .697
Within Groups 120.735 72 1.677
Total 50.987 74
Total 121.120 74
Fried egg Shape Between Groups 1.846 2 .923 .966 .386
Candy Cane
Shape
Between Groups 4.143 2 2.071 2.510 .088
Within Groups 68.820 72 .956
Within Groups 59.404 72 .825
Total 70.667 74
Total 63.547 74
Fried egg Color Between Groups 4.620 2 2.310 3.059 .053
Candy Cane
Color
Between Groups 2.053 2 1.027 1.026 .363
Within Groups 54.367 72 .755
Within Groups 72.027 72 1.000
Total 58.987 74
Total 74.080 74
Fried egg Smell Between Groups 3.679 2 1.839 2.744 .071
Candy Cane
Smell
Between Groups 1.077 2 .538 .434 .650
Within Groups 48.268 72 .670
Within Groups 89.403 72 1.242
Total 51.947 74
Total 90.480 74
How likely you
will buy Fried
egg
Between Groups 3.213 2 1.606 2.587 .082
How likely you
will buy Candy
Cane
Between Groups 3.939 2 1.969 1.439 .244
Within Groups 44.707 72 .621
Within Groups 98.541 72 1.369
Total 47.920 74
Total 102.480 74
Red Meter Taste Between Groups 1.145 2 .572 .534 .589
Jelly Beans
Taste
Between Groups 1.165 2 .583 .553 .578
Within Groups 77.175 72 1.072
Within Groups 75.821 72 1.053
Total 78.320 74
Total 76.987 74
Red Meter
Texture
Between Groups .976 2 .488 .575 .565
Jelly Beans
Texture
Between Groups 3.418 2 1.709 1.800 .173
Within Groups 61.104 72 .849
Within Groups 68.369 72 .950
Total 62.080 74
Total 71.787 74
Red Meter
Shape
Between Groups 2.962 2 1.481 1.273 .286
Jelly Beans
Shape
Between Groups 6.914 2 3.457 4.354 .016
Within Groups 83.758 72 1.163
Within Groups 57.166 72 .794
Total 86.720 74
Total 64.080 74
Red Meter
Color
Between Groups 3.467 2 1.734 2.069 .134
Jelly Beans
Color
Between Groups 2.119 2 1.059 1.319 .274
Within Groups 60.319 72 .838
Within Groups 57.828 72 .803
Total 63.787 74
Total 59.947 74
Red Meter Between Groups 6.478 2 3.239 3.168 .048
Jelly Beans Between Groups .309 2 .154 .146 .864

li | P a g e
Smell Within Groups 73.602 72 1.022
Smell Within Groups 76.038 72 1.056
Total 80.080 74
Total 76.347 74
How likely you
will buy Red
Meter
Between Groups 3.102 2 1.551 1.427 .247
How likely you
will buy Jelly
Beans
Between Groups .445 2 .223 .236 .790
Within Groups 78.284 72 1.087
Within Groups 67.902 72 .943
Total 81.387 74
Total 68.347 74
Duo Fudge
Taste
Between Groups 4.344 2 2.172 1.772 .177
Blue Shark
Taste
Between Groups 1.656 2 .828 .998 .374
Within Groups 88.243 72 1.226
Within Groups 59.731 72 .830
Total 92.587 74
Total 61.387 74
Duo Fudge
Texture
Between Groups 3.472 2 1.736 1.473 .236
Blue Shark
Texture
Between Groups 1.296 2 .648 .720 .490
Within Groups 84.875 72 1.179
Within Groups 64.784 72 .900
Total 88.347 74
Total 66.080 74
Duo Fudge
Shape
Between Groups 5.979 2 2.990 3.668 .030
Blue Shark
Shape
Between Groups .363 2 .181 .205 .815
Within Groups 58.687 72 .815
Within Groups 63.824 72 .886
Total 64.667 74
Total 64.187 74
Duo Fudge
Color
Between Groups 2.739 2 1.370 1.149 .323
Blue Shark
Color
Between Groups 1.431 2 .716 .656 .522
Within Groups 85.847 72 1.192
Within Groups 78.515 72 1.090
Total 88.587 74
Total 79.947 74
Duo Fudge
Smell
Between Groups 4.300 2 2.150 1.947 .150
Blue Shark
Smell
Between Groups .873 2 .437 .317 .729
Within Groups 79.487 72 1.104
Within Groups 99.073 72 1.376
Total 83.787 74
Total 99.947 74
How likely you
will buy Duo
Fudge
Between Groups 3.146 2 1.573 1.402 .253
How likely you
will buy Blue
Shark
Between Groups .336 2 .168 .178 .837
Within Groups 80.774 72 1.122
Within Groups 67.851 72 .942
Total 83.920 74
Total 68.187 74
Red Meter Smell
Jelly Beans Shape
I keep up tp date with the latest
technology N
Subset for alpha = 0.05
I keep up tp date with the latest
technology N
Subset for alpha = 0.05
1 2
1 2
Duncana,b
Disagree 11 3.18
Duncana,b
Disagree 11 3.36
Neutral 27 3.81 3.81
Neutral 27 3.63 3.63
Agree 37 4.05
Agree 37 4.14
Sig. .055 .464
Sig. .356 .082

lii | P a g e
One-Way ANOVA: Outgoing lifestyle and Top product features preference
ANOVA
Sum of Squares df Mean Square F Sig.
Sum of Squares df
Mean
Square F Sig.
Fried egg Taste Between
Groups
1.090 2 .545 1.224 .300
Candy Cane
Taste
Between
Groups
6.316 2 3.158 2.497 .089
Within Groups 32.057 72 .445
Within Groups 91.071 72 1.265
Total 33.147 74
Total 97.387 74
Fried egg
Texture
Between
Groups
2.202 2 1.101 1.625 .204
Candy Cane
Texture
Between
Groups
1.815 2 .908 .548 .581
Within Groups 48.785 72 .678
Within Groups 119.305 72 1.657
Total 50.987 74
Total 121.120 74
Fried egg
Shape
Between
Groups
.684 2 .342 .352 .705
Candy Cane
Shape
Between
Groups
.190 2 .095 .108 .898
Within Groups 69.983 72 .972
Within Groups 63.357 72 .880
Total 70.667 74
Total 63.547 74
Fried egg Color Between
Groups
.325 2 .163 .200 .819
Candy Cane
Color
Between
Groups
.128 2 .064 .063 .939
Within Groups 58.661 72 .815
Within Groups 73.952 72 1.027
Total 58.987 74
Total 74.080 74
Fried egg Smell Between
Groups
1.284 2 .642 .912 .406
Candy Cane
Smell
Between
Groups
1.283 2 .642 .518 .598
Within Groups 50.663 72 .704
Within Groups 89.197 72 1.239
Total 51.947 74
Total 90.480 74
How likely you
will buy Fried
egg
Between
Groups
.997 2 .499 .765 .469
How likely you
will buy Candy
Cane
Between
Groups
2.244 2 1.122 .806 .451
Within Groups 46.923 72 .652
Within Groups 100.236 72 1.392
Total 47.920 74
Total 102.480 74
Red Meter
Taste
Between
Groups
5.036 2 2.518 2.474 .091
Jelly Beans
Taste
Between
Groups
5.150 2 2.575 2.581 .083
Within Groups 73.284 72 1.018
Within Groups 71.837 72 .998
Total 78.320 74
Total 76.987 74
Red Meter
Texture
Between
Groups
1.286 2 .643 .762 .471
Jelly Beans
Texture
Between
Groups
2.005 2 1.003 1.035 .361
Within Groups 60.794 72 .844
Within Groups 69.781 72 .969
Total 62.080 74
Total 71.787 74
Red Meter
Shape
Between
Groups
3.511 2 1.756 1.519 .226
Jelly Beans
Shape
Between
Groups
4.043 2 2.022 2.424 .096
Within Groups 83.209 72 1.156
Within Groups 60.037 72 .834
Total 86.720 74
Total 64.080 74
Red Meter
Color
Between
Groups
1.271 2 .635 .732 .485
Jelly Beans
Color
Between
Groups
2.052 2 1.026 1.276 .285
Within Groups 62.516 72 .868
Within Groups 57.895 72 .804
Total 63.787 74
Total 59.947 74
Red Meter Between 1.117 2 .559 .509 .603
Jelly Beans Between 1.350 2 .675 .648 .526

liii | P a g e
Smell Groups Smell Groups
Within Groups 78.963 72 1.097
Within Groups 74.997 72 1.042
Total 80.080 74
Total 76.347 74
How likely you
will buy Red
Meter
Between
Groups
3.116 2 1.558 1.433 .245
How likely you
will buy Jelly
Beans
Between
Groups
3.539 2 1.770 1.966 .147
Within Groups 78.271 72 1.087
Within Groups 64.807 72 .900
Total 81.387 74
Total 68.347 74
Duo Fudge
Taste
Between
Groups
1.124 2 .562 .443 .644
Blue Shark
Taste
Between
Groups
1.560 2 .780 .939 .396
Within Groups 91.462 72 1.270
Within Groups 59.827 72 .831
Total 92.587 74
Total 61.387 74
Duo Fudge
Texture
Between
Groups
.028 2 .014 .012 .988
Blue Shark
Texture
Between
Groups
1.085 2 .543 .601 .551
Within Groups 88.318 72 1.227
Within Groups 64.995 72 .903
Total 88.347 74
Total 66.080 74
Duo Fudge
Shape
Between
Groups
1.446 2 .723 .823 .443
Blue Shark
Shape
Between
Groups
1.545 2 .773 .888 .416
Within Groups 63.221 72 .878
Within Groups 62.641 72 .870
Total 64.667 74
Total 64.187 74
Duo Fudge
Color
Between
Groups
2.615 2 1.308 1.095 .340
Blue Shark
Color
Between
Groups
3.667 2 1.834 1.731 .184
Within Groups 85.972 72 1.194
Within Groups 76.279 72 1.059
Total 88.587 74
Total 79.947 74
Duo Fudge
Smell
Between
Groups
2.371 2 1.186 1.048 .356
Blue Shark
Smell
Between
Groups
3.893 2 1.947 1.459 .239
Within Groups 81.416 72 1.131
Within Groups 96.053 72 1.334
Total 83.787 74
Total 99.947 74
How likely you
will buy Duo
Fudge
Between
Groups
.033 2 .017 .014 .986
How likely you
will buy Blue
Shark
Between
Groups
1.095 2 .548 .588 .558
Within Groups 83.887 72 1.165
Within Groups 67.091 72 .932
Total 83.920 74
Total 68.187 74


![Loose Rock Landscape Path[THAI]](https://img.pdfslide.net/doc/110x75/55a96ac01a28ab516e8b47e0/loose-rock-landscape-paththai.jpg)