Embed Size (px)
Citation preview
Cognition 162 (2017) 124–132
Contents lists available at ScienceDirect
Cognition
journal homepage: www.elsevier .com/locate /COGNIT
Original Articles
The perceptual and phenomenal capacity of mental imagery
http://dx.doi.org/10.1016/j.cognition.2017.02.0040010-0277/� 2017 Elsevier B.V. All rights reserved.
⇑ Corresponding author.E-mail address: [email protected] (R. Keogh).
Rebecca Keogh ⇑, Joel PearsonSchool of Psychology, University of New South Wales, Sydney 2052, Australia
a r t i c l e i n f o a b s t r a c t
Article history:Received 20 July 2016Revised 6 February 2017Accepted 8 February 2017
Keywords:Visual imageryCapacity limitsMental representationsBinocular rivalry
Despite the brain’s immense processing power, it has finite resources. Where do these resource limitscome from? Little research has examined possible low-level sensory contributions to these limitations.Mental imagery is a fundamental part of human cognition that bridges cognition with sensory represen-tations. Hence, imagery serves as a good candidate sensory process for probing how low capacity limita-tions might extend down the processing hierarchy. Here we introduce a novel technique to measure thesensory capacity of mental imagery, while removing the need for memory and any direct subjectivereports. Contrary to our dynamic phenomenological experience, we demonstrate that visual imagery isseverely limited by the perceptual and phenomenal bottleneck of visual representation. These capacitylimits appear to be independent of generation time, depend on visual feature heterogeneity, are attenu-ated by concurrent retinal stimulation and are endowed with good metacognition. Additionally, the pre-cision of visual representation declines rapidly with the number of stimuli, which is governed by a simplepower law. We anticipate that this assay will be important for mapping the limits of human informationprocessing.
� 2017 Elsevier B.V. All rights reserved.
1. Introduction visual process to utilize for probing how low these capacity limita-
Despite the great processing power of the human brain, whenwe are asked to remember or process multiple things at once ourperformance tends to decline with more items (Cowan, 2001;Franconeri, Alvarez, & Cavanagh, 2013; Halford, Cowan, &Andrews, 2007; Miller, 1956). These capacity limits are foundacross most cognitive domains, such as general intelligence(Neubauer & Fink, 2009), multi-tasking (Monsell, 2003; Rogers &Monsell, 1995), auditory and visual short-term memory (Bays &Husain, 2008; Grimault et al., 2014; Luck & Vogel, 1997; Vogel &Machizawa, 2004) and visual attention (Fougnie & Marois, 2006;Palmer, 1990). Much of the research into human cognitive capacitylimits to date has focused on high-level working memory andattentional capacity limits, however exactly where these capacitylimits originate is still an open question. Surprisingly, relatively lit-tle research has examined any low-level sensory contributions tothese limitations, such as the inherent two-dimensional map-likerepresentation of the visual cortex, which likely intrinsically limitsthe amount of visual information that can be concurrently held.Mental imagery is a primary part of human cognition that bridgeshigh-level cognition with low-level sensory representations viafunctional sensory simulations. Hence, imagery serves as a good
tions might extend down the processing hierarchy.Mental imagery research suggests that both the vividness and
sensory strength of mental imagery plays an important role inalmost any cognitive function that involves some form of sensorysimulation. For example, evidence suggests visual imagery is uti-lized during visual working memory maintenance (Albers, Kok,Toni, Dijkerman, & de Lange, 2013; Keogh & Pearson, 2011,2014), when remembering the past or thinking about the future(Byrne, Becker, & Burgess, 2007; D’Argembeau & Van der Linden,2006), making moral decisions (Gaesser & Schacter, 2014), lan-guage comprehension (Bergen, Lindsay, Matlock, & Narayanan,2007; Zwaan, Stanfield, & Yaxley, 2002), spatial navigation(Ghaem et al., 1997), affective forecasting and eye witness memory(Dobson & Markham, 1993; Gilbert & Wilson, 2007). Surprisinglyimagery vividness and strength is somewhat elevated in many psy-chiatric and neurological populations (Matthews, Collins, Thakkar,& Park, 2014; Sack, van de Ven, Etschenberg, Schatz, & Linden,2005; Shine et al., 2015). However, despite the overarching impor-tance of visual imagery in daily life, very little research has inves-tigated the capacity limits to what can be imagined. Here weattempt to examine the capacity limits of creating and maintainingmental images in mind in isolation of overt memory.
Much mental imagery research is dependent on self-reportedvividness ratings, sensory strength measures, performance on amental rotation or manipulation task, or through the indirectimpact of imagery on other stimuli. Many early visual imagery
R. Keogh, J. Pearson / Cognition 162 (2017) 124–132 125
studies also asked participants to imagine real-world objects andmake comparative judgments about the images. For example, aclassic imagery study by Kosslyn, Ball, and Reiser (1978) found thatscanning larger images in mind took longer than smaller items,similar to how scanning larger images presented perceptually takeslonger than smaller ones. Numerous studies since then have foundthat imagining a simple picture results in very similar neural andbehavioral processes to perception (Ishai & Sagi, 1995; Kosslyn,1999, 2005; Kosslyn, Alpert, & Thompson, 1997; Kosslyn,Thompson, & Alpert, 1997; Pearson, Clifford, & Tong, 2008). Someearly research also delved into the construction of complex visualimages, and found evidence that when participants were instructedto imagine an image of an animal as a whole, or to construct thesame imagewhich had been broken into parts or ‘units’ to be ‘glued’back together, they took longer in the ‘gluing’ condition, suggestingit was possible for people to combine multiple units of an image inthe mind’s eye (Kosslyn, Reiser, Farah, & Fliegel, 1983).
Another experiment found that participants took longer toimagine identical geometric shapes when they were described asbeing composed of multiple shapes rather than only a few. A fur-ther experiment in this paper found that participants were ableto construct a scene of multiple images placed close or far fromeach other based on a verbal description. They found that whena participant scanned from one image to another in the imaginedscene it took longer for far versus close images. These studies showthat individuals have the capacity to imagine multiple images or‘units’ at once however, they do not provide any information aboutthe quality, or capacity limits, of the units the individuals in thesestudies imagined.
To objectively assess potential capacity limits of visual imagery,independently of limits to working memory, we devised a novelversion of the binocular rivalry paradigm, previously used to mea-sure the sensory strength of a single mental image (Chang, Lewis, &Pearson, 2013; Keogh & Pearson, 2011, 2014; Pearson, 2014;Pearson et al., 2008; Sherwood & Pearson, 2010). This methodhas previously been used to assess the sensory strength of a singlemental image through its effect on subsequent binocular rivalry. Inthis paradigm individuals are cued to imagine one of two binocularrivalry patterns for a few seconds prior to a brief rivalry presenta-tion. Following the imagery formation, there is a higher probabilityof the imagined pattern being dominant during this brief rivalrypresentation. This effect is known as priming and allows us toobtain an objective measure of sensory imagery strength (mea-sured as the percentage of trials primed by imagery, see Pearson,2014 for a review of the method). This measure of imagery allowsus to avoid a reliance on self-report, reaction times, simple featuraljudgments and any possible effects of concurrent visual attention(Pearson, 2014; Pearson, Naselaris, Holmes, & Kosslyn, 2015).
In the new technique for measuring visual imagery capacity,instead of only imagining a single pattern, participants are cuedto imagine from one to seven colored Gabor patches simultane-ously for 6 s. To eliminate an overt reliance on memory for thelocation and structure of each imagined item we presented partic-ipants with multiple imagery ‘placeholders’. These placeholdercues were two small dark grey lines that informed participants ofthe horizontal or vertical orientation, color and location for eachto-be-imagined colored Gabor pattern around an invisible circulararray (Fig. 1A; color cues shown). The logic behind using such cueplaceholders was to negate contributions of memory for the loca-tion and orientation of the imagined patterns. Following a periodof image generation, participants were presented with a brief(750 ms), small, single binocular rivalry display at only one of themany placeholder locations (chosen at random), to probe the priorimage strength at that single location, participants then reportedthe dominant rivalry pattern (red-horizontal, green-vertical or amix; see Section 2 for stimulus details).
As in prior work (Chang et al., 2013; Keogh & Pearson, 2011,2014; Pearson, 2014; Pearson, Rademaker, & Tong, 2011b;Pearson et al., 2008; Sherwood & Pearson, 2010), the strength ofthe mental image was taken as percent primed (i.e. the percentof trials in which the imagined pattern matched the reported pat-tern in subsequent rivalry), compared to the chance score of 50%(equal number of red and green patterns) collapsed across the mul-tiple placeholder locations. We then grouped the data based on theset size of the imagined array to look for any capacity-like set sizeeffects. If there are limitations to what we can imagine we shouldexpect that when subjects are required to imagine multiple imagesthe priming effect of imagery should decrease, while if imagery islimitless, priming should remain constant across all set sizes.
2. Materials and methods
2.1. Participants
A total of 72 participants participated in these experiments(aged from 18 to 35): experiment 1 (N = 4, 2 female), experiment2 (N = 4, 2 female), experiment 3 (Analyzed participants: N = 13,9 female, 2 participants were not used in analysis due to attritionand 2 for very high mock priming), experiment 4 (Analyzed partic-ipants: N = 7, 3 female, 4 participants were removed from the anal-ysis due to too many mixed percept reports (more than 33%, N = 3)and attrition (N = 1)), experiment 5 (N = 15, 9 female, 7 partici-pants removed due to too many mixed percepts (33%) or low prim-ing (less than 50% for one item)), and experiment 6 (Analyzedparticipants: N = 6, 4 female, 8 participants were removed due toattrition (N = 2) and due to too many mixed percepts or low prim-ing (more than 33% or priming for one image less than 55%, N = 6).
The majority of participants were students who completed theexperiments in exchange for course credit; five of the participantswere experienced psychophysical subjects and one of the authors(RK) participated in all of the experiments (except for the back-ground luminance experiment). To ensure the data are not drivenby the inclusion of one of the authors all experiments were alsoanalyzed without RK’s data in the Supplementary material. Allexperiments were approved by the UNSW Human Research EthicsAdvisory Panel (Psychology) and written consent was obtainedfrom all participants.
2.2. Statistical analysis
For experiments 1–5 repeated measures ANOVA’s were carriedout in SPSS. All post hoc analysis were two-tailed and controlledfor multiple comparisons using the Bonferroni correction.
For experiment 3 the data was normalized using the followingequation:
Percent Primedðset size ðnÞÞ=Percent Primedðset size ð1ÞÞ
To analyze the homogeneity data only set sizes 2, 3 and 4 wereused. A participant’s data was discarded if for any of homogeneityvalues (100, 75, 66.67 or 50%) there were less than 3 data points.This resulted in a total of 28 participant’s homogeneity data beingincluded in the analysis.
For experiment 6 all data functions were fit in MATLAB using asum of Gaussians and all data was first anchored to 50% priming atthe 37 degrees point.
2.3. Apparatus
All experiments were performed in a blackened room on a 27 in.iMac with a resolution of 2560 � 1440 pixels, with a frame rate of60 Hz. A chin rest was used to maintain a fixed viewing distance of
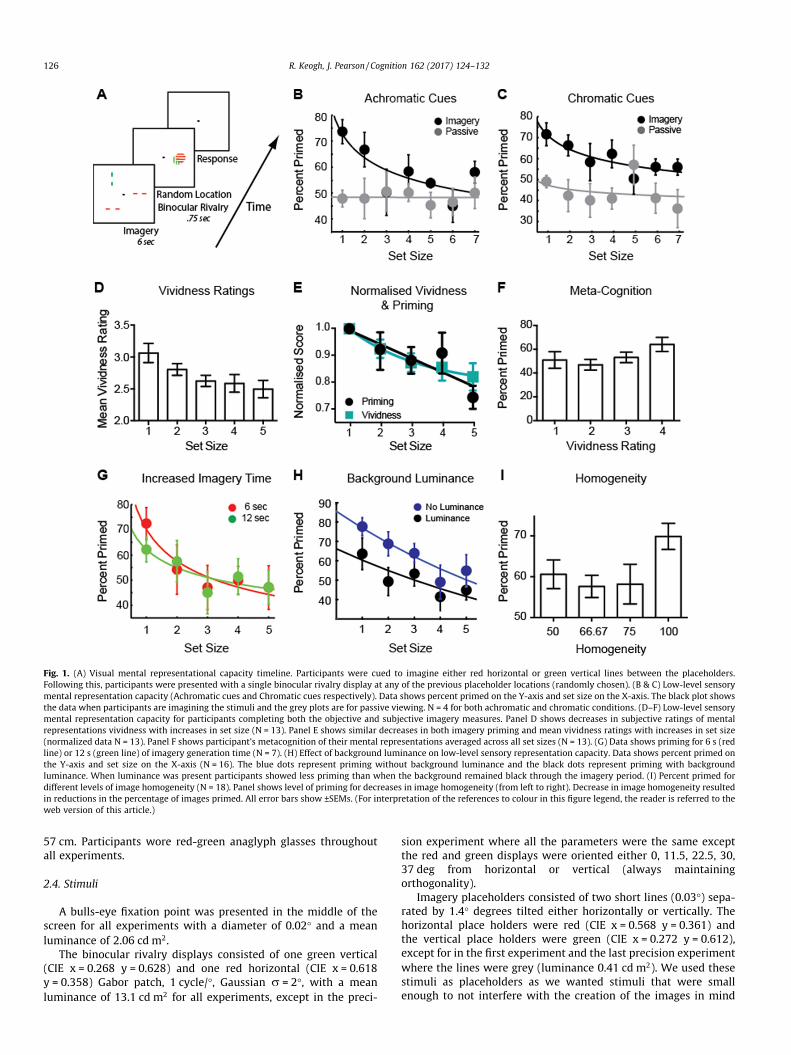
Fig. 1. (A) Visual mental representational capacity timeline. Participants were cued to imagine either red horizontal or green vertical lines between the placeholders.Following this, participants were presented with a single binocular rivalry display at any of the previous placeholder locations (randomly chosen). (B & C) Low-level sensorymental representation capacity (Achromatic cues and Chromatic cues respectively). Data shows percent primed on the Y-axis and set size on the X-axis. The black plot showsthe data when participants are imagining the stimuli and the grey plots are for passive viewing. N = 4 for both achromatic and chromatic conditions. (D–F) Low-level sensorymental representation capacity for participants completing both the objective and subjective imagery measures. Panel D shows decreases in subjective ratings of mentalrepresentations vividness with increases in set size (N = 13). Panel E shows similar decreases in both imagery priming and mean vividness ratings with increases in set size(normalized data N = 13). Panel F shows participant’s metacognition of their mental representations averaged across all set sizes (N = 13). (G) Data shows priming for 6 s (redline) or 12 s (green line) of imagery generation time (N = 7). (H) Effect of background luminance on low-level sensory representation capacity. Data shows percent primed onthe Y-axis and set size on the X-axis (N = 16). The blue dots represent priming without background luminance and the black dots represent priming with backgroundluminance. When luminance was present participants showed less priming than when the background remained black through the imagery period. (I) Percent primed fordifferent levels of image homogeneity (N = 18). Panel shows level of priming for decreases in image homogeneity (from left to right). Decrease in image homogeneity resultedin reductions in the percentage of images primed. All error bars show ±SEMs. (For interpretation of the references to colour in this figure legend, the reader is referred to theweb version of this article.)
126 R. Keogh, J. Pearson / Cognition 162 (2017) 124–132
57 cm. Participants wore red-green anaglyph glasses throughoutall experiments.
2.4. Stimuli
A bulls-eye fixation point was presented in the middle of thescreen for all experiments with a diameter of 0.02� and a meanluminance of 2.06 cd m2.
The binocular rivalry displays consisted of one green vertical(CIE x = 0.268 y = 0.628) and one red horizontal (CIE x = 0.618y = 0.358) Gabor patch, 1 cycle/�, Gaussian r = 2�, with a meanluminance of 13.1 cd m2 for all experiments, except in the preci-
sion experiment where all the parameters were the same exceptthe red and green displays were oriented either 0, 11.5, 22.5, 30,37 deg from horizontal or vertical (always maintainingorthogonality).
Imagery placeholders consisted of two short lines (0.03�) sepa-rated by 1.4� degrees tilted either horizontally or vertically. Thehorizontal place holders were red (CIE x = 0.568 y = 0.361) andthe vertical place holders were green (CIE x = 0.272 y = 0.612),except for in the first experiment and the last precision experimentwhere the lines were grey (luminance 0.41 cd m2). We used thesestimuli as placeholders as we wanted stimuli that were smallenough to not interfere with the creation of the images in mind
R. Keogh, J. Pearson / Cognition 162 (2017) 124–132 127
(previous work has shown that incoming visual information thatoverlaps with the location of the imagined patterns can corruptimagery generation). The placeholders also needed to be able tosupply both the orientation and color information to the partici-pants so they did not need to overtly use memory. The reasoningbehind our attempt to remove overt memory from the experimentis that memory is known to have strict capacity limits, and for thisreason it would be difficult to tell which part of our observedcapacity limits would be driven by general memory and whichparts were specific to the creation of low-level sensory images.The placeholders were presented in a circular array (radius of5.5�) around a bull’s eye fixation point. The placeholders wereplaced on this circular array as far from each other as possible toavoid crowding. The distance between each Gabor patch dependedon the set size and was set to 360/number of stimuli. i.e. whenthere we 3 placeholders each of the 3 images were presented120 deg from each other in the circular array. The backgroundwas black in all of the experiments except for the luminance con-dition of the fifth experiment. During the luminance condition thebackground was ramped up to yellow (a mix of the green and redcolors used in binocular rivalry patterns, with a luminance of44 cd m2). This was done smoothly over the first and last secondof the imagery period to avoid visual transients.
Mock trials were included for 25% of trials in all experiments(except the precision experiment due to time constraints). Mocktrials were included to assess demand characteristics. Mock trialsconsisted of a spatial mix of a half red-horizontal and green-vertical Gabor patch. These displays had blurred edges and theexact split varied on each trial to resemble actual piecemeal riv-alry. These mock patterns shared the same color, and size param-eters as the real binocular rivalry displays.
2.5. Procedure
2.5.1. Eye dominance taskIt is well documented that most people have one eye that is
more ‘dominant’ during binocular rivalry, meaning that they willsee one of the two images more often than the other. This eye dom-inance can have an effect on our measure of mental imagery,because if a participant primarily sees just one image, this eye-dominance will prevent any priming effect due to even strong ima-gery. To minimize this possibility, the perceptual strength of eachrivalry pattern was adjusted to null any eye dominance, using atest-procedure prior to the actual imagery task, as previously doc-umented (see Pearson, 2014 for discussion; Pearson, Rademaker, &Tong, 2011a; Pearson et al., 2008; Rademaker & Pearson, 2012;Sherwood & Pearson, 2010).
This eye dominance procedure involves adjusting the contrastof the two patterns until the perceptual competition between thetwo is ‘balanced’. During this procedure, participants are presentedwith a brief binocular rivalry display (750 ms) followed by theselected dominant image at full contrast for 4 s, which results inan increased likelihood that an individual will see the opposite pat-tern in the subsequent rivalry presentation (due to weakened neu-ral responses from the full contrast adaptor pattern e.g. due toadaptation). If this did not lead to a perceptual switch (if partici-pants reported green and were presented with a full contrast greenand then reported green again), the dominant rivalry pattern con-trast was decreased by 2% and the suppressed pattern’s contrastincreased by 2%, a simple type of staircase procedure. This wasdone until the participants had perceptual switches on 80–100%of trials.
Following this pre-task test, the intensity (contrast and meanluminance) values from this first test were put into a peripheraleye dominance trial-run. In this trial-run participants were pre-
sented with a binocular rivalry display at a random location onan invisible circle with a radius of 5.5 deg for 750 ms and wereasked to report which color they saw by pressing ‘1’ for green, ‘2’for mixed, and ‘3’ for red. They were instructed to keep their eyeson the bull’s eye fixation point throughout the task and only viewthe binocular rivalry display in their peripheral vision. Participant’scompleted a block of 12 trials. If there was still heavy eye/patterndominance for one of the two colors (i.e. the participant saw one ofthe two colors more than approximately 60% of the time) the prioreye-dominance test was run again until the perceptual competi-tion between the two was more balanced in the peripheral vision.If a participant only ever saw one of the two colors, they did notcontinue onto the imagery capacity experiments.
2.5.2. Imagery capacity experimentsFor the first two experiments participants were presented with
1–7 place holders for 6 s, the place holders were presented inter-mittently 1.5 s on/1.5 s off to prevent peripheral fading from occur-ring, which was an issue in pilot trials. Following this imageryperiod, binocular rivalry was displayed randomly at one of theprior placeholder locations for 750 ms and participants reportedwhich pattern was dominant (1 = green vertical, 2 = equally mixed,3 = red horizontal). Participants completed 5 blocks of 42 trialsresulting in a total of 210 trials. In the passive condition of exper-iment 1 and 2 the procedure and timeline were the same exceptduring the imagery condition participants were instructed to justpassively fixate on the bulls-eye in the center of the placeholders.For the passive condition participants completed 5 blocks of 42 tri-als resulting in a total of 210 trials.
2.5.3. Phenomenal capacity limits and metacognition experimentFor the third experiment the procedure and stimuli was exactly
the same as experiment one and two plus the inclusion trial-by-trial vividness ratings and the number of images to imagine were1–5 (the number of images participants had to imagine wasreduced as data from experiment 1 and 2 suggested that partici-pants could not imagine more than 5 items simultaneously). In thiscondition after the 6 s imagery period participants were presentedwith the word ‘vividness’ which prompted them to rate the vivid-ness of the image(s) they had just imagined on a scale of 1–4, with1 = least vivid and 4 = most vivid. Participants completed 3 blocksof 40 trials, resulting in a total of 120 trials.
2.5.4. Increased time experimentFor experiment four the procedure was the same as experiment
one and two (with no vividness rating and only 1–5 placeholders)with the addition of a 12 s imagery period as well as the original6-s imagery period. Participants completed a total of 2 blocks of40 trials per imagery time (2 six-second and 2 twelve-secondimagery blocks), resulting in a total of 160 trials.
2.5.5. Irrelevant visual information (background luminance)experiment
For experiment five the procedure was the same as experimentone and two except there was the inclusion of a condition with aluminous background. During the imagery generation period thebackground ramped up to a yellow color and then back down toblack over the first and last second of the imagery interval. Otherthan this all other parameters were the same. Participants com-pleted 40 trials for both the luminance and no luminance condi-tions, resulting in a total of 80 trials.
2.5.6. Precision and imagery capacity experimentFor the precision experiment the parameters/time course of the
experiment was exactly the same as experiment one and twoexcept the binocular rivalry display that was presented was tilted
128 R. Keogh, J. Pearson / Cognition 162 (2017) 124–132
either 0, 11.5, 22.5, 30, 37 from horizontal or vertical (alwaysmaintaining orthogonality) and participants were only presentedwith 1–4 placeholder cues. Participants completed 12 blocks of40 trials resulting in a total of 480 trials.
3. Results
3.1. Imagery capacity
We found that our measure of visual imagery (percent of trialsprimed) decreased with increases in set size (Fig. 1B, black plot),with a main effect of set size (F(6,18) = 4.20, p < 0.001). To ensurethat the oriented placeholders were not explicitly affecting subse-quent rivalry, we also ran a passive condition with the same partic-ipants. Here all task parameters were the same, with the exceptionthat participants only had to passively fixate (without generatingany mental images). There was no reliable effect of the numberof placeholder cues on binocular rivalry (Fig. 1B, grey plot; F(6,18) = 0.12, p = 0.99). When directly comparing priming in theimagery and passive conditions there was no main effect of condi-tion (F(1,3) = 3.17, p = 0.17). However, post hoc analysis with aBonferroni correction for multiple comparisons found that therewas significantly more priming at set size one when participantswere imagining compared to passive viewing (p < 0.01). We alsoperformed a Bayesian analysis of the data and found that therewas a moderate Bayes factor (BF = 8.85) supporting the hypothesisthat imagery was driving our observed capacity functions, whereasin the passive condition there was moderate support for the nullhypothesis (BF = 0.14), with passive viewing of the cues not leadingto any effect on subsequent binocular rivalry. Prior work hasdemonstrated that the sensory strength, or visual energy, of a priorstimulus (perceptual or imagined) predicts the degree of the effecton subsequent rivalry (Brascamp, Knapen, Kanai, van Ee, & van denBerg, 2007; Pearson, 2014; Pearson & Brascamp, 2008; Pearsonet al., 2008). As such, we interpret these data as a possible declinein the sensory strength of visual imagery as a function of set-size.That is, as subjects imagine more images, the images becomeweaker.
In the first experiment participants were still required to‘remember’ the color of each imagined stimulus. To reduce anyinfluence of color memory we ran a second experiment in whichwe added color to the oriented placeholder cues. This removedthe need for participants to hold the color-orientation combinationin memory. Again we found that priming decreased as a function ofset size (F(6,18) = 2.91, p < 0.05; Fig. 1C), while the passive condi-tion again remained flat (F(6,18) = 1.15, p > 0.38). When comparingpriming in the imagery and passive conditions, there was a maineffect of condition (F(1,3) = 652.92, p < 0.0001), with participantsshowing significantly more priming when they were imaginingcompared to passively viewing the cues. There was a small BayesFactor (BF = 2.52) supporting the hypothesis that imagery wasdriving our observed capacity limits, whereas in the passive condi-tion there was moderate support for the null hypothesis(BF = 0.47).
Is it possible that these decreases in mental image strength as afunction of set size are due to demand characteristics? To assessthis possibility, we included mock trials in all of our experiments(except the precision experiment due to time constraints). Ourmock trials consisted of a fake binocular rivalry stimulus, manufac-tured from a physical blend of two colored Gabor patches that waspresented to both eyes therefore avoiding any real binocular riv-alry. If the data was driven by demand or a non-sensory bias toreport rivalry dominance in line with the prior cue independentlyof the actual percept, then these physical blend stimuli should bereported incorrectly as either red or green. We did not observe
any significant priming for mock trials across all participants(mock-trial priming compared to 50%: t(34) = 1.47, p = 0.15,M = 51.32, SD = 5.34; Sup. Fig. 1; see Section 2) suggesting thatthe observed results cannot be explained by demandcharacteristics.
3.2. Phenomenal capacity limits and metacognition
Next we asked whether the sensory imagery capacity limitswere accompanied by a reduction in subjective ratings of vivid-ness, which would suggest good metacognition (awareness of thedecline in mental image strength) of internally generated imagerycapacity-limits. To assess any changes in phenomenal vividnessacross set sizes participants performed the same task with theadditional requirement that they rate the vividness for the wholeimagined array on each individual trial. After imagery generation,participants reported their vividness on a scale of 1–4 (4 = mostvivid, 1 = least vivid), with the left hand, before being presentedwith the single binocular rivalry display at one of the cued loca-tions (Pearson et al., 2011b; Rademaker & Pearson, 2012) andreporting dominance with the right hand.
We found a similar pattern to the priming data, with the ‘on-line’ reports of imagery vividness also decreasing as a function ofset size (F(4,48 = 7.31, p < 0.001); Fig. 1D). Additionally, thedecreases in percent primed and mean vividness ratings were verysimilar with a main effect of set size (F(4,48) = 6.61, p < 0.001) andno significant difference between the two conditions (F(1,12) =0.03, p = 0.87, Fig. 1E). To assess metacognition (Flavel, 1979) ofthe representational capacity-limits we grouped the primingscores by the four levels of reported vividness. We found a maineffect of the vividness category (F(3,36) = 3.20, p < 0.05), with par-ticipants having significantly more priming for items they rated asmore vivid. These data suggest that the sensory capacity functionsreported above are not epiphenomenal to the subjective sensationsof forming mental images, as both appear to have similar attenua-tion with greater capacity.
3.3. Increased imagery time experiments
Next we tested if the observed capacity function of mental rep-resentations might simply be caused by larger arrays requiringmore generation time to reach the same level of priming. In afourth experiment we tested if these capacity functions werespecific to the 6 s generation time or generalized to longer imagi-nation periods. Participants again performed the same task, gener-ating the required number of patterns for either 6 or 12 s. Wefound that there was no clear difference between set-size functionsin the 6 or 12 s conditions (Main effect of condition (6 or 12 s):F(1,6) = 0.06, p = 0.81, Fig. 1G).
3.4. Irrelevant visual information (background luminance)
Our data suggest that capacity limits for both the sensorystrength and phenomenal vividness of mental visual representa-tions exist, and increases in generation time do not significantlyaffect these capacity limits. However it may still be possible thatattentional limitations (Palmer, 1990) may be contributing to thesensory capacity functions. To assess whether attentional capacitylimits might contribute to our results we ran a fifth study in whichparticipants performed the same imagery task with or without abright luminous background. Previous work has shown that thepassive presence of a uniform luminous background during ima-gery generation attenuates its strength (Keogh & Pearson, 2011,2014; Sherwood & Pearson, 2010), likely due to afferent visualstimulation’s obligatory access to early visual areas, which mightinterfere with the voluntary formation of visual images. However,
R. Keogh, J. Pearson / Cognition 162 (2017) 124–132 129
the passive presence of background luminance does not disrupt theeffects of visual attention on subsequent rivalry (Pearson et al.,2008). As such, if our results are driven by limits to visual attentionspread across the place holders we should not expect concurrentluminance to have any effect on the imagery capacity functions.Fig. 1H shows that the presence of luminance reduced the levelof priming across all set sizes, suggesting that sensory capacityfunctions are likely due to limited image-generation resourcesand not attention (Main effect of luminance: F(1,14) = 6.9,p < 0.05). The decrease in priming in the presence of backgroundluminance also provides further evidence that our findings arenot due to demand characteristics, as one should not expect uni-form, passive luminance to affect non-sensory mechanisms.
These data demonstrate that the ability to intentionally gener-ate visual images in mind, independent of task related memory,has its own severe capacity limits, but what exactly imposes theserepresentational capacity limits on non-retinal imagery? As theimagery array becomes larger, are individuals simply excludingcertain stimuli as they breach their capacity limit or do theyattempt to create representations of all patterns, but at a lower res-olution? One way to approach this question is to probe the effectsof featural homogeneity across the stimuli array. If participantsonly imagine a subset of the images (limited by a rigid numberof available ‘slots’ or ‘generators’) the degree of featural homogene-ity across the array should not affect the capacity functions,whereas if participants have a flexible resource that is able to bespread out and generate multiple representations in mind, onewould predict an interaction between capacity functions and feat-ural homogeneity.
To investigate the effect of array homogeneity on the capacity oflow-level sensory visual representations we looked at priming as afunction of array homogeneity. When participants had to create arepresentation consisting of all the same features, e.g. green verti-cal at all locations, (proportion the same = 1; a purely homoge-neous array), priming was higher than when participants had tocreate images of different orientations and colors (Fig. 1I). (Maineffect of homogeneity F(3,81) = 2.76, p < 0.05). These data showan interaction between priming, or imagery strength, and imagerycontent, e.g. the homogeneity of the information, supporting adynamic resource model of visual image generation.
3.5. Precision and imagery capacity
If dynamic imagery resources are responsible for the observedcapacity limits, the precision of each item’s representation shoulddecline as the array size increases due to resources being spreadthinly across more and more items. Whereas if imagery generationutilizes a strict rigid ‘slot’-like resource, we should expect stableprecision of each pattern’s representation, as once an individual’snumber of rigid slots is exceeded no more items can be generated.Such a scenario would result in fewer images being generated, butwith no loss in the precision of the items that are generated.
To measure the precision of these mental representations wetook advantage of a known property of visual imagery, its selectiv-ity for spatial orientation (Bergmann, Genc, Kohler, Singer, &Pearson, 2015; Pearson et al., 2008). Early physiology researchhas shown that cells in the visual cortex are selective for orienta-tion (Hubel & Wiesel, 1962, 1968). That is, a given cell in primaryvisual cortex responds optimally for a certain spatial orientationand will fire less as this orientation moves further from the cell’spreferred orientation. This results in a Gaussian shaped ‘orienta-tion tuning curve’ when the orientation is plotted against cell fir-ing. Previous work by Pearson et al. (2008) has shown thatimagery strength (priming rivalry) is similarly orientation specific.This study first demonstrated that when an individual is presentedwith a weak Gabor pattern of a certain orientation, say vertical,
subsequent rivalry is primed, i.e. they are more likely to see thevertical display, however the further away the images in the binoc-ular rivalry display are tilted from the presented orientation prim-ing drops off. Interestingly, this same orientation specificity wasshown to occur with imagined Gabor patterns. We reasoned thatthe bandwidth for orientation selectivity might serve as a usefulmeasure of a pattern’s representational precision. The broaderthe imagery orientation-tuning curve, the lower the precisionof the imagined stimulus, and conversely the narrower the func-tion, the higher the precision.
To obtain psychophysical orientation-tuning functions for men-tal images, we adapted our capacity procedure by changing the ori-entation of both rivalry patterns together by 0, 11.5, 22.5, 30 and37 deg, while always maintaining orthogonality (Fig. 2C). This psy-chophysical technique has produced orientation-tuning curves forimagery of a single stimulus that closely mirror perceptualorientation-tuning curves (Bergmann et al., 2015; Pearson et al.,2008).
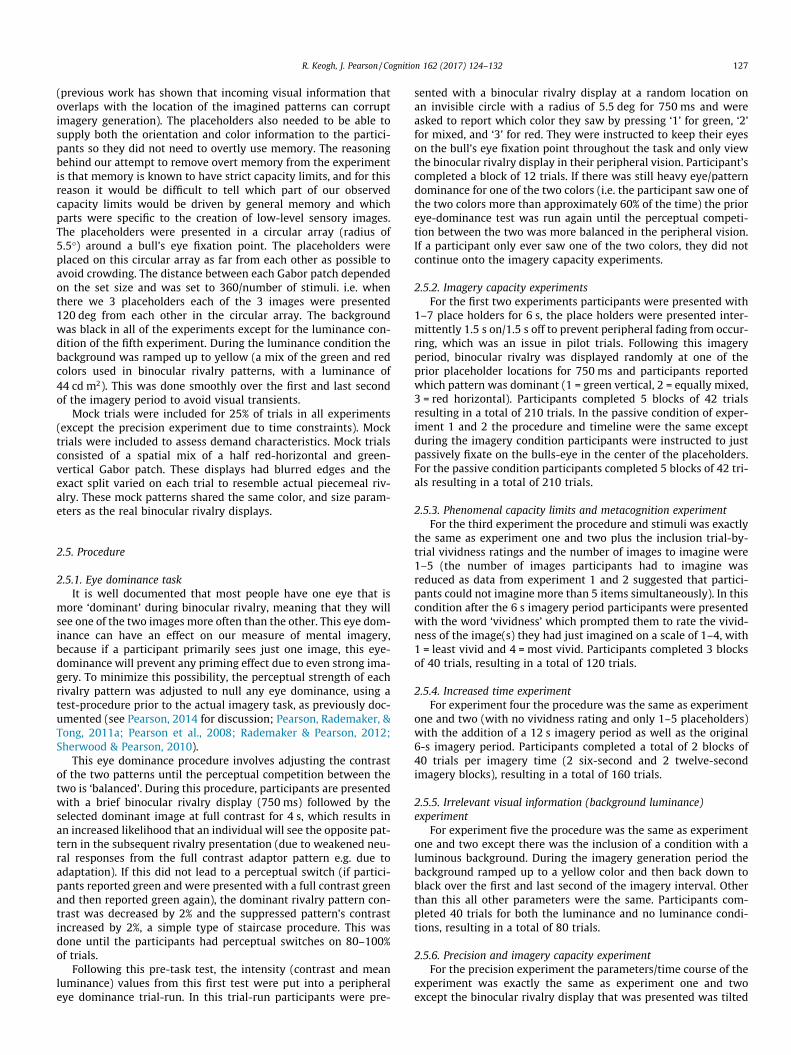
The two mental representation models: dynamic vs. strict rigidmental resources are exemplified in their extremes inFig. 2A and B. The peak, or amplitude, of the orientation tuningfunction relates to the strength of the images in mind, while thewidth, or standard deviation, of the tuning curve provides informa-tion about the precision of the images generated in mind. Accord-ing to a very strict rigid slot model once an individual’s fixedcapacity is exceeded any new information cannot be represented.This would result in a drop in priming for that particular pattern(e.g. towards 50%), without a corresponding reduction in the band-width of the tuning function (see Fig. 2A for hypothetical data).
However, if the source of a participant’s sensory representationswere a dynamic resource spread across multiple image representa-tions, which interact and compete with each other for neural space,one would expect numerous representations to be held at everdecreasing levels of precision and strength. This would present aschanges in both amplitude and bandwidth of the orientation tun-ing curves (see Fig. 2B for hypothetical data).
Fig. 2D shows orientation tuning curves for our experimentaldata for set sizes 1–4, data points fit with a difference of Gaussian.Both the amplitude and bandwidth of the tuning curves changesharply from set size 1–2 and stabilize across set sizes 3–4. Criti-cally, the bandwidth of the tuning curves increased as a functionof set size, suggesting image precision decreases when multiplepatterns are generated.
To further quantify the relation between set size and imageryprecision, we plotted precision (1/SD (set size n))/1/SD (set size1), as a function of set size. Again we see a pronounced drop in ima-gery precision between one and two items with the results nicelyfit by a simple power law (f(x) = 0.968x�1.306, R2 = 0.817, Fig. 2E).Likewise, all our raw priming data together is fit well by a simplepower law (f(x) = 70.61x�0.2096, R2 = 0.946, Fig. 2F).
4. Discussion
Together our data suggests that visual imagery has severecapacity limits to the amount of content that can be simultane-ously generated. It is unlikely that a strict rigid ‘slot’-like modeldrives these limits, with decreases in both strength and precisionemerging with increases in total content. Further, the heterogene-ity of the content places further limitations on representationalsensory strength suggesting that the type of information beingimagined, and not just the number of items, influences capacitylimits. It is unlikely that such capacity limitations are driven bylimits to attentional resources for two reasons. First, the perceptualcapacity limits were accompanied by phenomenal limits, with par-ticipants reporting lower levels of imagery vividness with larger
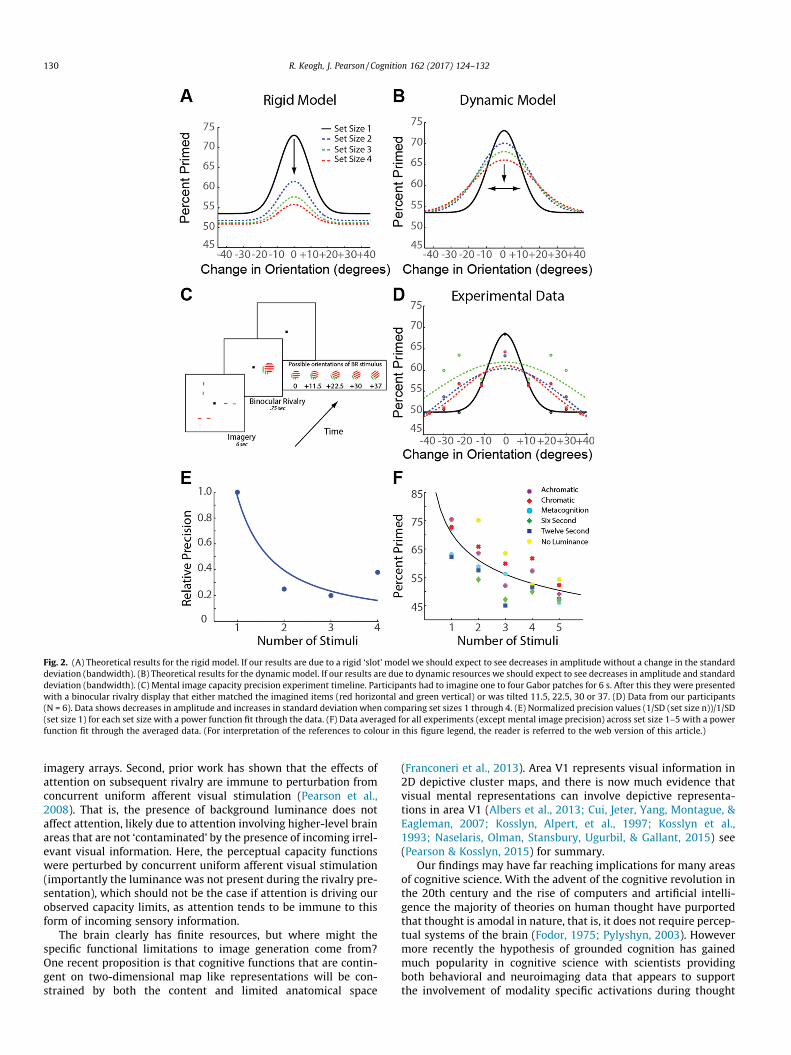
Fig. 2. (A) Theoretical results for the rigid model. If our results are due to a rigid ‘slot’ model we should expect to see decreases in amplitude without a change in the standarddeviation (bandwidth). (B) Theoretical results for the dynamic model. If our results are due to dynamic resources we should expect to see decreases in amplitude and standarddeviation (bandwidth). (C) Mental image capacity precision experiment timeline. Participants had to imagine one to four Gabor patches for 6 s. After this they were presentedwith a binocular rivalry display that either matched the imagined items (red horizontal and green vertical) or was tilted 11.5, 22.5, 30 or 37. (D) Data from our participants(N = 6). Data shows decreases in amplitude and increases in standard deviation when comparing set sizes 1 through 4. (E) Normalized precision values (1/SD (set size n))/1/SD(set size 1) for each set size with a power function fit through the data. (F) Data averaged for all experiments (except mental image precision) across set size 1–5 with a powerfunction fit through the averaged data. (For interpretation of the references to colour in this figure legend, the reader is referred to the web version of this article.)
130 R. Keogh, J. Pearson / Cognition 162 (2017) 124–132
imagery arrays. Second, prior work has shown that the effects ofattention on subsequent rivalry are immune to perturbation fromconcurrent uniform afferent visual stimulation (Pearson et al.,2008). That is, the presence of background luminance does notaffect attention, likely due to attention involving higher-level brainareas that are not ‘contaminated’ by the presence of incoming irrel-evant visual information. Here, the perceptual capacity functionswere perturbed by concurrent uniform afferent visual stimulation(importantly the luminance was not present during the rivalry pre-sentation), which should not be the case if attention is driving ourobserved capacity limits, as attention tends to be immune to thisform of incoming sensory information.
The brain clearly has finite resources, but where might thespecific functional limitations to image generation come from?One recent proposition is that cognitive functions that are contin-gent on two-dimensional map like representations will be con-strained by both the content and limited anatomical space
(Franconeri et al., 2013). Area V1 represents visual information in2D depictive cluster maps, and there is now much evidence thatvisual mental representations can involve depictive representa-tions in area V1 (Albers et al., 2013; Cui, Jeter, Yang, Montague, &Eagleman, 2007; Kosslyn, Alpert, et al., 1997; Kosslyn et al.,1993; Naselaris, Olman, Stansbury, Ugurbil, & Gallant, 2015) see(Pearson & Kosslyn, 2015) for summary.
Our findings may have far reaching implications for many areasof cognitive science. With the advent of the cognitive revolution inthe 20th century and the rise of computers and artificial intelli-gence the majority of theories on human thought have purportedthat thought is amodal in nature, that is, it does not require percep-tual systems of the brain (Fodor, 1975; Pylyshyn, 2003). Howevermore recently the hypothesis of grounded cognition has gainedmuch popularity in cognitive science with scientists providingboth behavioral and neuroimaging data that appears to supportthe involvement of modality specific activations during thought
R. Keogh, J. Pearson / Cognition 162 (2017) 124–132 131
(Amsel, Urbach, & Kutas, 2014; Barsalou, 2008, 2010). These theo-ries suggest that the brain creates mental simulations during mostcognitive activities. Mental simulations are described as the re-enactment of the modal states involved during perception andare a central feature for the majority of theories of various typesof cognition such as working memory, language comprehensionand reading, action intentions, implicit memory and even concep-tual knowledge (Barsalou, 2009). These theories however tend toinvolve complex mental simulations made up of numerous fea-tures and items unconstrained by any representational capacitylimits. Here we show that the ability to create mental representa-tions, or images, is extremely limited by the content of the repre-sentation. These findings help to explain the limitations anderrors routinely observed during mental simulations and guidebetter models and theories of grounded cognition.
5. Conclusions
In conclusion, our studies have demonstrated that visualimagery appears to have its own capacity limits with decreasesin strength (Fig. 2F), vividness (Fig. 1E) and precision(Fig. 2D and E) with increases in set size. We propose that thesecapacity limits are due, in part, to an individual’s ability, or lackthere of, to create precise ‘maps’ of the mental representations inthe early visual cortex. Competition between generated contentimposed by the inherent anatomical limitations of the two-dimensional representational architecture of V1, likely results inthe observed limitations to visual representations in thought.
Author contributions
JP and RK developed the study concept. Testing and data collec-tion was performed by RK. All data analysis was performed by RK.RK and JP wrote the manuscript.
Acknowledgements
JP is supported by Australian NHMRC grants APP1024800,APP1046198 and APP1085404; and a Career Development Fellow-ship APP1049596; and an ARC discovery project DP140101560.
Appendix A. Supplementary material
Supplementary data associated with this article can be found, inthe online version, at http://dx.doi.org/10.1016/j.cognition.2017.02.004.
References
Albers, A. M., Kok, P., Toni, I., Dijkerman, H. C., & de Lange, F. P. (2013). Sharedrepresentations for working memory and mental imagery in early visual cortex.Current Biology, 23(15), 1427–1431. http://dx.doi.org/10.1016/j.cub.2013.05.065.
Amsel, B. D., Urbach, T. P., & Kutas, M. (2014). Empirically grounding groundedcognition: The case of color. Neuroimage, 99, 149–157. http://dx.doi.org/10.1016/j.neuroimage.2014.05.025.
Barsalou, L. W. (2008). Grounded cognition. Annual Review of Psychology, 59,617–645. http://dx.doi.org/10.1146/annurev.psych.59.103006.093639.
Barsalou, L. W. (2009). Simulation, situated conceptualization, and prediction.Philosophical Transactions of the Royal Society of London. Series B, BiologicalSciences, 364(1521), 1281–1289. http://dx.doi.org/10.1098/rstb.2008.0319.
Barsalou, L. W. (2010). Grounded cognition: Past, present, and future. Topics inCognitive Science, 2(4), 716–724. http://dx.doi.org/10.1111/j.1756-8765.2010.01115.x.
Bays, P. M., & Husain, M. (2008). Dynamic shifts of limited working memoryresources in human vision. Science, 321(5890), 851–854. http://dx.doi.org/10.1126/science.1158023, pii: 321/5890/851.
Bergen, B. K., Lindsay, S., Matlock, T., & Narayanan, S. (2007). Spatial and linguisticaspects of visual imagery in sentence comprehension. Cognitive Science, 31(5),733–764. http://dx.doi.org/10.1080/03640210701530748.
Bergmann, J., Genc, E., Kohler, A., Singer, W., & Pearson, J. (2015). Smaller primaryvisual cortex is associated with stronger, but less precise mental imagery.Cerebral Cortex. http://dx.doi.org/10.1093/cercor/bhv186.
Brascamp, J. W., Knapen, T. H., Kanai, R., van Ee, R., & van den Berg, A. V. (2007).Flash suppression and flash facilitation in binocular rivalry. Journal of Vision, 7(12), 11–12. 10.1167/7.12.12.
Byrne, P., Becker, S., & Burgess, N. (2007). Remembering the past and imagining thefuture: A neural model of spatial memory and imagery. Psychological Review,114(2), 340–375. http://dx.doi.org/10.1037/0033-295X.114.2.340.
Chang, S., Lewis, D. E., & Pearson, J. (2013). The functional effects of colorperception and color imagery. Journal of Vision, 13(10). http://dx.doi.org/10.1167/13.10.4.
Cowan, N. (2001). The magical number 4 in short-term memory: A reconsiderationof mental storage capacity. Behavioral and Brain Sciences, 24(1), 87–114.discussion 114–185.
Cui, X., Jeter, C. B., Yang, D., Montague, P. R., & Eagleman, D. M. (2007). Vividness ofmental imagery: Individual variability can be measured objectively. VisionResearch, 47(4), 474–478. http://dx.doi.org/10.1016/j.visres.2006.11.013, pii:S0042-6989(06)00556-6.
D’Argembeau, A., & Van der Linden, M. (2006). Individual differences in thephenomenology of mental time travel: The effect of vivid visual imagery andemotion regulation strategies. Consciousness and Cognition, 15(2), 342–350.http://dx.doi.org/10.1016/j.concog.2005.09.001.
Dobson, M., & Markham, R. (1993). Imagery ability and source monitoring:Implications for eyewitness memory. British Journal of Psychology, 84(Pt 1),111–118.
Flavel, J. H. (1979). Metacognition and cognitive monitoring: A new area ofcognitive-developmental inquiry. American Psychologist, 34(10), 6.
Fodor, J. A. (1975). The language of thought. Massachusetts: Harvard UniversityPress.
Fougnie, D., & Marois, R. (2006). Distinct capacity limits for attention and workingmemory: Evidence from attentive tracking and visual working memoryparadigms. Psychological Science, 17(6), 526–534. http://dx.doi.org/10.1111/j.1467-9280.2006.01739.x.
Franconeri, S. L., Alvarez, G. A., & Cavanagh, P. (2013). Flexible cognitive resources:Competitive content maps for attention and memory. Trends in CognitiveSciences, 17(3), 134–141. http://dx.doi.org/10.1016/j.tics.2013.01.010.
Gaesser, B., & Schacter, D. L. (2014). Episodic simulation and episodic memory canincrease intentions to help others. Proceedings of the National Academy ofSciences of the United States of America, 111(12), 4415–4420. http://dx.doi.org/10.1073/pnas.1402461111.
Ghaem, O., Mellet, E., Crivello, F., Tzourio, N., Mazoyer, B., Berthoz, A., & Denis, M.(1997). Mental navigation along memorized routes activates the hippocampus,precuneus, and insula. NeuroReport, 8(3), 739–744.
Gilbert, D. T., & Wilson, T. D. (2007). Prospection: Experiencing the future. Science,317(5843), 1351–1354. http://dx.doi.org/10.1126/science.1144161.
Grimault, S., Nolden, S., Lefebvre, C., Vachon, F., Hyde, K., Peretz, I., ... Jolicoeur, P.(2014). Brain activity is related to individual differences in the number of itemsstored in auditory short-term memory for pitch: Evidence frommagnetoencephalography. Neuroimage, 94, 96–106. http://dx.doi.org/10.1016/j.neuroimage.2014.03.020.
Halford, G. S., Cowan, N., & Andrews, G. (2007). Separating cognitive capacity fromknowledge: A new hypothesis. Trends in Cognitive Sciences, 11(6), 236–242.http://dx.doi.org/10.1016/j.tics.2007.04.001.
Hubel, D. H., & Wiesel, T. N. (1962). Receptive fields, binocular interaction andfunctional architecture in the cat’s visual cortex. Journal of Physiology, 160,106–154.
Hubel, D. H., & Wiesel, T. N. (1968). Receptive fields and functional architecture ofmonkey striate cortex. Journal of Physiology, 195(1), 215–243.
Ishai, A., & Sagi, D. (1995). Common mechanisms of visual imagery and perception.Science, 268(5218), 1772–1774.
Keogh, R., & Pearson, J. (2011). Mental imagery and visual working memory. PLoSONE, 6(12), e29221. http://dx.doi.org/10.1371/journal.pone.0029221.
Keogh, R., & Pearson, J. (2014). The sensory strength of voluntary visual imagerypredicts visual working memory capacity. Journal of Vision, 14(12). http://dx.doi.org/10.1167/14.12.7.
Kosslyn, S. M. (1999). The role of Area 17 in visual imagery: Convergent evidencefrom PET and rTMS (vol 284, pg 167, 1999). Science, 284(5416), 917.
Kosslyn, S. M. (2005). Mental images and the brain. Cognitive Neuropsychology, 22(3), 333–347. http://dx.doi.org/10.1080/02643290442000130, pii: 769488928.
Kosslyn, S. M., Alpert, N. M., & Thompson, W. L. (1997). Neural systems that underlievisual imagery and visual perception: A PET study. Journal of Nuclear Medicine,38(5), 1205.
Kosslyn, S. M., Alpert, N. M., Thompson, W. L., Maljkovic, V., Weise, S. B., Chabris, C.F., ... Buonanno, F. S. (1993). Visual mental-imagery activates topographicallyorganized visual-cortex – Pet investigations. Journal of Cognitive Neuroscience, 5(3), 263–287.
Kosslyn, S. M., Ball, T. M., & Reiser, B. J. (1978). Visual images preserve metric spatialinformation: Evidence from studies of image scanning. Journal of ExperimentalPsychology: Human Perception and Performance, 4(1), 47–60.
Kosslyn, S. M., Reiser, B. J., Farah, M. J., & Fliegel, S. L. (1983). Generating visualimages: Units and relations. Journal of Experimental Psychology: General, 112(2),278–303.
Kosslyn, S. M., Thompson, W. L., & Alpert, N. M. (1997). Neural systems shared byvisual imagery and visual perception: A positron emission tomography study.Neuroimage, 6(4), 320–334. http://dx.doi.org/10.1006/nimg.1997.0295.
132 R. Keogh, J. Pearson / Cognition 162 (2017) 124–132
Luck, S. J., & Vogel, E. K. (1997). The capacity of visual working memory for featuresand conjunctions. Nature, 390(6657), 279–281. http://dx.doi.org/10.1038/36846.
Matthews, N. L., Collins, K. P., Thakkar, K. N., & Park, S. (2014). Visuospatial imageryand working memory in schizophrenia. Cognitive Neuropsychiatry, 19(1), 17–35.http://dx.doi.org/10.1080/13546805.2013.779577.
Miller, G. A. (1956). The magical number seven plus or minus two: Some limits onour capacity for processing information. Psychological Review, 63(2), 81–97.
Monsell, S. (2003). Task switching. Trends in Cognitive Sciences, 7(3), 134–140.Naselaris, T., Olman, C. A., Stansbury, D. E., Ugurbil, K., & Gallant, J. L. (2015). A
voxel-wise encoding model for early visual areas decodes mental images ofremembered scenes. Neuroimage, 105, 215–228. http://dx.doi.org/10.1016/j.neuroimage.2014.10.018.
Neubauer, A. C., & Fink, A. (2009). Intelligence and neural efficiency. Neuroscienceand Biobehavioral Reviews, 33(7), 1004–1023. http://dx.doi.org/10.1016/J.Neubiorev. 2009.04.001.
Palmer, J. (1990). Attentional limits on the perception and memory of visualinformation. Journal of Experimental Psychology: Human Perception andPerformance, 16(2), 332–350.
Pearson, J. (2014). New directions in mental-imagery research: The binocular-rivalry technique and decoding fMRI patterns. Current Directions in PsychologicalScience, 23(3), 178–183. http://dx.doi.org/10.1177/0963721414532287.
Pearson, J., & Brascamp, J. (2008). Sensory memory for ambiguous vision. Trends inCognitive Sciences, 12(9), 334–341. http://dx.doi.org/10.1016/j.tics.2008.05.006.
Pearson, J., Clifford, C. W. G., & Tong, F. (2008). The functional impact of mentalimagery on conscious perception. Current Biology, 18(13), 982–986. http://dx.doi.org/10.1016/J.Cub. 2008.05.048.
Pearson, J., & Kosslyn, S. M. (2015). The heterogeneity of mental representation:Ending the imagery debate. Proceedings of the National Academy of Sciences of theUnited States of America, 112(33), 10089–10092. http://dx.doi.org/10.1073/pnas.1504933112.
Pearson, J., Naselaris, T., Holmes, E. A., & Kosslyn, S. M. (2015). Mental imagery:Functional mechanisms and clinical applications. Trends in Cognitive Sciences.
Pearson, J., Rademaker, R. L., & Tong, F. (2011a). Evaluating the mind’s eye: Themetacognition of visual imagery. Psychological Science, 22(12), 1535–1542.http://dx.doi.org/10.1177/0956797611417134.
Pearson, J., Rademaker, R. L., & Tong, F. (2011b). Evaluating the mind’s eye: Themetacognition of visual imagery. Psychological Science, 22(12), 1535–1542.http://dx.doi.org/10.1177/0956797611417134.
Pylyshyn, Z. (2003). Return of the mental image: Are there really pictures in thebrain? Trends in Cognitive Sciences, 7(3), 113–118.
Rademaker, R. L., & Pearson, J. (2012). Training visual imagery: Improvements ofmetacognition, but not imagery strength. Frontiers in Psychology, 3, 224. http://dx.doi.org/10.3389/fpsyg.2012.00224.
Rogers, R. D., & Monsell, S. (1995). Costs of a predictable switch between simplecognitive tasks. Journal of Experimental Psychology: General, 124(2), 24.
Sack, A. T., van de Ven, V. G., Etschenberg, S., Schatz, D., & Linden, D. E. (2005).Enhanced vividness of mental imagery as a trait marker of schizophrenia?Schizophrenia Bulletin, 31(1), 97–104. http://dx.doi.org/10.1093/schbul/sbi011.
Sherwood, R., & Pearson, J. (2010). Closing the mind’s eye: Incoming luminancesignals disrupt visual imagery. PLoS ONE, 5(12), e15217. http://dx.doi.org/10.1371/journal.pone.0015217.
Shine, J. M., Keogh, R., O’Callaghan, C., Muller, A. J., Lewis, S. J., & Pearson, J. (2015).Imagine that: Elevated sensory strength of mental imagery in individuals withParkinson’s disease and visual hallucinations. Proceedings of the Royal Society B:Biological Sciences, 282(1798), 20142047. http://dx.doi.org/10.1098/rspb.2014.2047.
Vogel, E. K., & Machizawa, M. G. (2004). Neural activity predicts individualdifferences in visual working memory capacity. Nature, 428(6984), 748–751.http://dx.doi.org/10.1038/nature02447nature02447, pii.
Zwaan, R. A., Stanfield, R. A., & Yaxley, R. H. (2002). Language comprehendersmentally represent the shapes of objects. Psychological Science, 13(2), 168–171.