Embed Size (px)
Citation preview

Kennesaw State UniversityDigitalCommons@Kennesaw State University
Faculty Publications
2008
The Perceptual NorthwestJames LowryUniversity of New Orleans
Mark PattersonKennesaw State University, [email protected]
William ForbesStephen F. Austin State University
Follow this and additional works at: https://digitalcommons.kennesaw.edu/facpubs
Part of the Human Geography Commons
This Article is brought to you for free and open access by DigitalCommons@Kennesaw State University. It has been accepted for inclusion in FacultyPublications by an authorized administrator of DigitalCommons@Kennesaw State University. For more information, please [email protected].
Recommended CitationJames Lowry, Mark Patterson, and William Forbes. "The Perceptual Northwest." Yearbook of the Association of Pacific CoastGeographers 70.1 (2008): 112-126. Print.

© 2008 by the Association of Pacifi c Coast Geographers. All rights reserved.
112
The Perceptual Northwest
James LowryUniversity of New Orleans
Mark PattersonKennesaw State University
William ForbesStephen F. Austin State University
ABSTRACT
Our goal is to survey cultural perceptions defi ning the U.S. Northwest
region. As geographers, we should concern ourselves with mental
constructs of regions, as they can easily impede or facilitate commu-
nication. Assumptions of others’ regional boundaries and images may
be erroneous. Over the past several decades, a handful of geographers
have begun to examine these perceptual (or vernacular) maps and re-
gions. Students at 21 colleges and universities were asked to identify:
(1) boundaries of the U.S. Northwest region; (2) Northwest regional char-
acteristics and symbols; and (3) what cities or other places best represent
the Northwest.
Nationally, student respondents largely followed the “offi cial” area of the
region regarding state boundaries, with Washington, Oregon, and Idaho as
the core area. Student perception of characteristic cities and places followed
this pattern, with referenced population centers spread across the three-
state landscape. Regarding descriptive words and symbols, more emphasis
is placed on Garreau’s coastal perception of the Northwest through terms
such as rainy, trees, and mountainous. Regional diff erences showed up in
perception of area, descriptive words, and symbols of the Northwest. Prox-
imity led to diff erent perceptions. Northwest students showed the smallest
perception of the Northwest in geographic area, while those farthest away
(Southeast students) mapped the largest Northwest. Diff erence from the
home region also led to diff erent perceptions. Students from less-forested
regions emphasized trees more than students from more forested regions,
who emphasized open and vast characteristics of the Northwest.
All of us carry around with us in our minds mental maps and images
of the world (Downs and Stea 1977; Gould and White 1974; Saarinen 1976;
Tolman 1948). Psychologists focus on how these images form, while geogra-

113Lowry, Patterson, and Forbes: Th e Perceptual Northwest
phers tend to focus more on how these maps and images infl uence behavior.
As geographers, we should concern ourselves with these mental constructs,
as they can easily impede or facilitate communication. Over the past several
decades, a handful of geographers (Good 1981; Hale 1971; Jordan 1978;
Lamme and Oldakowski 1982; Lowry 1999; Lowry and Zonn 1989; Raitz and
Ulack 1981; Shortridge 1980; Shortridge 1985; Zelinsky 1980) have begun
to examine these perceptual (or vernacular) maps and regions.
Th e most common means of examination has been via surveys of col-
lege students (Good 1981; Jordan 1978; Lowry 1999; Lowry and Zonn 1989;
Shortridge 1980; Shortridge 1985), although Lamme and Oldakowski (1982)
surveyed a more general population at a folk festival. Lowenthal and Prince
have called the college-educated the articulate minority most infl uential in
creating such images (in Saarinen 1976). In addition they are a “captive”
audience and make it easy to achieve large numbers of respondents. Th ere
are other means of discovering perceptual regionalizations (or maps). Hale
(1971) surveyed postmasters, county extension agents, and newspaper
editors in every county and parish in the United States. Zelinsky (1980)
examined the use of regional terms in business names via a survey of the
business white pages of the Metropolitan Statistical Areas of the United
States, as did Lowry (1994) for the Southwest. Th e most common method,
however, is the survey of college students.
Perhaps the best statement concerning diff erent ways of defi ning regions
comes from Jordan’s work on perceptual regions. He states, “perceptual or
vernacular regions are those perceived to exist by their inhabitants and
other members of the population at large. Th ey exist as part of popular or
folk culture. Rather than being the intellectual creation of the professional
geographer, the vernacular region is the product of spatial perception of
average people. Rather than being based on carefully chosen, quantifi able
criteria, such regions are composites of the mental maps of the population”
(1978, p. 293). Th us the diff erence in defi nitions, but of what importance is
this? Should vernacular regions be of importance to geographers?
Th e importance of the examination of vernacular regions by geogra-
phers has been stated by Zelinsky (1980). In his examination of vernacular
regions of North America, he poses the question, “How seriously should the
serious geographer take the vernacular, or popular, regions of his country?”
(p. 1). His answer is that “identifying and understanding our vernacular
regions is a justifi able, even necessary, pursuit if we wish to apprehend the

114 APCG YEARBOOK • Volume 70 • 2008
major social and geographical realities of late Twentieth-Century America”
(Zelinsky 1980, p. 2).
Jordan (1978) has also commented on the importance of perceptual
regions. He states: “As geographers, we ought to know more about percep-
tual regions than we do, at various scales and in diff erent parts of the world.
Spatial patterns, behavior, organization, and fl ows are among our traditional
concerns, and we should be able to understand these better if we know how
populations perceive regions” (p. 307).
Th e term “Pacifi c Northwest” originates from a need to identify the Or-
egon Territory diff erently aft er the states of Washington, Oregon, and Idaho
were created from it. Th e term has always been used in an offi cial capacity to
include only those states (Hardwick 2006). Th e best historical treatments of the
region are Meinig’s four-volume (1988, 1995, 1999, 2006) work and Johanson
and Gates’ (1957) Empire of Columbia, although a textbook by Hardwick et
al. (2007) also off ers insight.
Occasional modifi cations in popular literature include Garreau (1981),
who termed the coastal part of the Northwest “Ecotopia,” stretching from
Alaska in the north to just south of San Francisco. Eastern portions of Cali-
fornia, Oregon, and Washington, along with Idaho, were lumped by Garreau
with Nevada, Utah, Wyoming, Montana, and most of Alaska, Alberta, British
Columbia, and Northern Canada in an “Empty Quarter.”
To meet the objectives of this research, a survey was compiled and ad-
ministered to 1,818 students at 21 universities across the United States. Th e
universities were spread out across the country, ranging from Massachusetts
to Florida and Arizona to Washington, and all students were enrolled in a
freshman geography class. Th e survey consists of two parts: for part one,
students were provided with a map of the coterminous United States with
the states outlined, and were asked to draw/shade the area they believed to
be the Northwest; for part two, students were asked three general questions
about their perceptions of the Northwest.
Once the maps from the fi rst part of the survey were returned, they
were analyzed by overlaying each map with a grid composed of cells of 50
square miles per cell. Th is cell size was selected aft er testing various sizes:
while smaller cells (e.g., 25 miles square) provide slightly smoother maps,
the extra time needed for analysis made this size prohibitive. Larger cells
(e.g., 75 miles square) could dramatically cut time requirements, but at the
expense of maps with higher resolution and visual quality. Each cell was
115Lowry, Patterson, and Forbes: Th e Perceptual Northwest
given a unique label and was included in the region if any part of the cell
was included in a map returned by the respondent.
Th e results were then entered into a database. Th ey were fi rst entered
separately, such that a map could be constructed that represents the re-
spondents from that university (thus we can compare where people from
Oregon, for example, place the Northwest vis-à-vis those from Wyoming).
Th e universities were grouped by states to allow for a regional comparison
as follows: Pacifi c Coast (WA, OR); Southeast (NC, GA, FL); Midwest (OH,
IL, WI), South Central (TX, OK); Great Plains (NE, MT); and Northeast
(MA). Secondly, all of the respondents’ maps were then combined together
so that one composite map of the region could be constructed. Th is simple
mapping exercise enabled us to determine where the Northwest exists in
the minds of U.S. students.
For part two of the survey, students were asked three questions:
1. List up to fi ve words which you feel are most descriptive of the
Northwest.
2. Are there particular cities, or other places, which you feel best
represent the Northwest? If so, what are they?
3. Is there anything which stands as a symbol of the Northwest? If so,
what?
Th e survey and instructions were sent to a collaborator at each selected
institution, administered, and returned. Th e results from the part two ques-
tionnaire were entered into a database so that results from diff erent sites can
be compared and a composite view can then be developed.
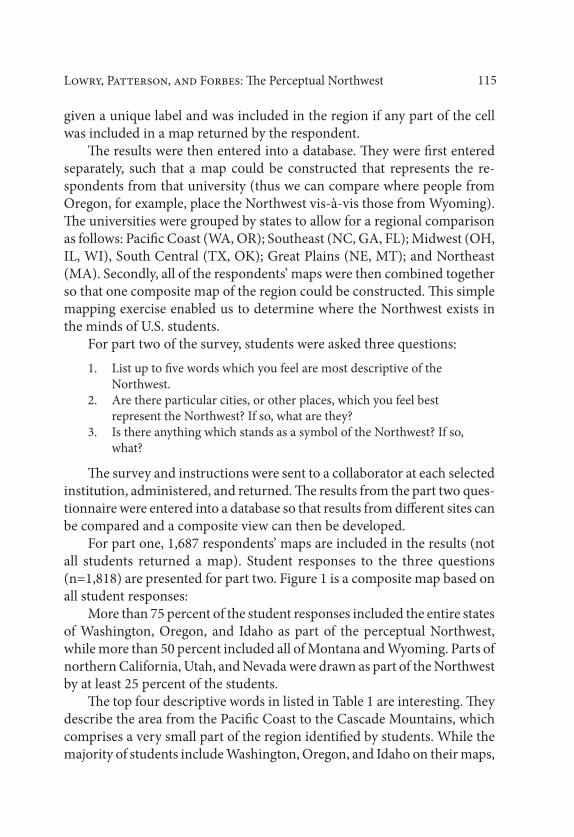
For part one, 1,687 respondents’ maps are included in the results (not
all students returned a map). Student responses to the three questions
(n=1,818) are presented for part two. Figure 1 is a composite map based on
all student responses:
More than 75 percent of the student responses included the entire states
of Washington, Oregon, and Idaho as part of the perceptual Northwest,
while more than 50 percent included all of Montana and Wyoming. Parts of
northern California, Utah, and Nevada were drawn as part of the Northwest
by at least 25 percent of the students.
Th e top four descriptive words in listed in Table 1 are interesting. Th ey
describe the area from the Pacifi c Coast to the Cascade Mountains, which
comprises a very small part of the region identifi ed by students. While the
majority of students include Washington, Oregon, and Idaho on their maps,
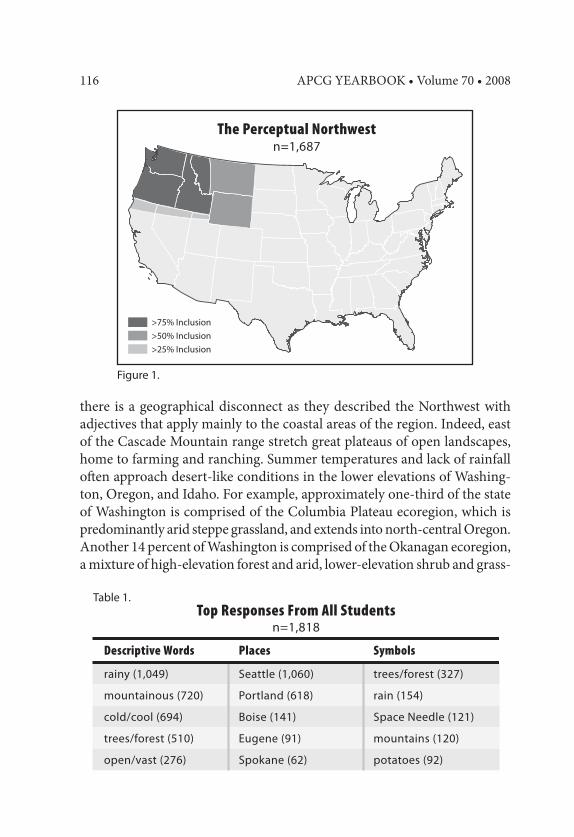
116 APCG YEARBOOK • Volume 70 • 2008
there is a geographical disconnect as they described the Northwest with
adjectives that apply mainly to the coastal areas of the region. Indeed, east
of the Cascade Mountain range stretch great plateaus of open landscapes,
home to farming and ranching. Summer temperatures and lack of rainfall
oft en approach desert-like conditions in the lower elevations of Washing-
ton, Oregon, and Idaho. For example, approximately one-third of the state
of Washington is comprised of the Columbia Plateau ecoregion, which is
predominantly arid steppe grassland, and extends into north-central Oregon.
Another 14 percent of Washington is comprised of the Okanagan ecoregion,
a mixture of high-elevation forest and arid, lower-elevation shrub and grass-
n=1,687
>75% Inclusion
>50% Inclusion
>25% Inclusion
The Perceptual Northwest
n=1,818Top Responses From All Students
rainy (1,049)
mountainous (720)
cold/cool (694)
trees/forest (510)
open/vast (276)
Descriptive Words
Seattle (1,060)
Portland (618)
Boise (141)
Eugene (91)
Spokane (62)
Places
trees/forest (327)
rain (154)
Space Needle (121)
mountains (120)
potatoes (92)
Symbols
Figure 1.
Table 1.

117Lowry, Patterson, and Forbes: Th e Perceptual Northwest
land (Washington Department of Natural Resources 2003). Th e southeastern
quarter of Oregon is predominantly within the Northern Basin and Range
ecoregion, which also contains a natural vegetation of arid steppe grassland.
Th is ecoregion, along with the Snake River Basin (arid steppe grassland)
ecoregion, covers the southern one-third of Idaho (Omernik 1987).
Th e top fi ve cities/places (Seattle, Portland, Boise, Eugene, Spokane)
come as little surprise because these are the larger metropolitan areas in
the Northwest. Tacoma, WA, and Vancouver, WA, (located near Seattle and
Portland, respectively) are not listed in the top fi ve, yet Tacoma and Boise
(approximately 190,000 residents) and Vancouver, WA, and Eugene (ap-
proximately 140,000 residents) have similar population sizes (United States
Census Bureau 2002). Another interesting note: Washington, D.C., was listed
by 10 students. Th e top fi ve symbols of the Northwest as reported by the
surveys are a blend of nature and culture. Th e Space Needle is synonymous
with Seattle, as is the potato with Idaho.
Interesting diff erences emerge when comparing results from individual
universities. Previous research (Lowry 1996) showed location to be the single
most important factor in such perceptions. Race, gender, and geography
of respondents were examined, and only the respondents’ geography had
a statistically signifi cant role in perception of the Southwest. Th us, in the
present study, survey sites were divided into geographic regions that most
closely follow the perceptual and vernacular regionalizations of Hale (1971),
Zelinsky (1973), Garreau (1981), and others.
Pacifi c Coast RegionIn general, universities in the Northwest (i.e., Washington and Oregon) had
the smallest area outlined as being part of the Northwest (Figure 2). Th is
was not unexpected, as past research has shown respondents from what is
ultimately defi ned as the “heart” of a region generally are more protective
of their home. Th ese respondents know the region better than do others,
and they are more “stingy” in what they include—indeed, Portland State
University had the smallest area overall.
Of these four schools, only Eastern Washington University (Cheney,
WA) did not include northern parts of California and Nevada. Students from
Southern Oregon University (Ashland, OR) and the University of Oregon

118 APCG YEARBOOK • Volume 70 • 2008
(Eugene, OR) include most, if not all,
of Montana.
Th e 408 student responses from
this grouping are summarized in
Table 2. Th e results are not surpris-
ing, as three of the four universities
are located on the coastal side of the
Cascades (Eastern Washington be-
ing the exception) and the top three
characteristics describe the landscape
found there. Th e top fi ve places/cit-
ies, as identified by students from
this Northwest group, follow the top
five of the larger U.S. group, with
the exception of Spokane, which is
replaced by Missoula. Eugene and
Boise also switch places in the rank-
ing. Missoula’s inclusion here, and
exclusion elsewhere, is a refl ection
of the knowledge these respondents
have of the area that others, especially
those great distances away, do not
(i.e., respondents in Oregon know
Missoula while those in Texas and
Georgia are far less likely to know any
city in Montana).
Lastly, three of the top symbols
of the region, as listed by the North-
west students, were also found on the
overall top symbols list. “Salmon” and
“green” were found in the top symbols
list for this region only. Interestingly,
students from the Pacifi c Coast region
did not perceive the Northwest to be
cool/cold.
>75% Inclusion >50% Inclusion >25% Inclusion
Maps From Students in the
Pacific Coast Regionn=387
The Perceptual Northwest
n=245University of Oregon
n=55Southern Oregon
n=17Portland State University
n=70Eastern Washington University
Figure 2.

119Lowry, Patterson, and Forbes: Th e Perceptual Northwest
Southeast RegionStudents from universities in the southeastern U.S. drew maps that encom-
passed the largest area (Figure 3). Th ese students are the greatest distance
from the Northwest, so this is not surprising. Th ey have, in general, less
knowledge of the region, they hear less about it, and they are less likely to
travel in the region. Th ey are thus more likely to see some generic north-
western quadrant of the country.
More than 25 percent of the students from Kennesaw State University
(Kennesaw, GA), Georgia Southern (Statesboro, GA), Georgia College and
State University (Milledgeville, GA), and the University of South Florida
(Tampa, FL) included some or all of North and South Dakota as part of
the Northwest. Northern Nevada and Utah were also labeled by at least 25
percent of the students from the southern U.S. as belonging to the North-
west.
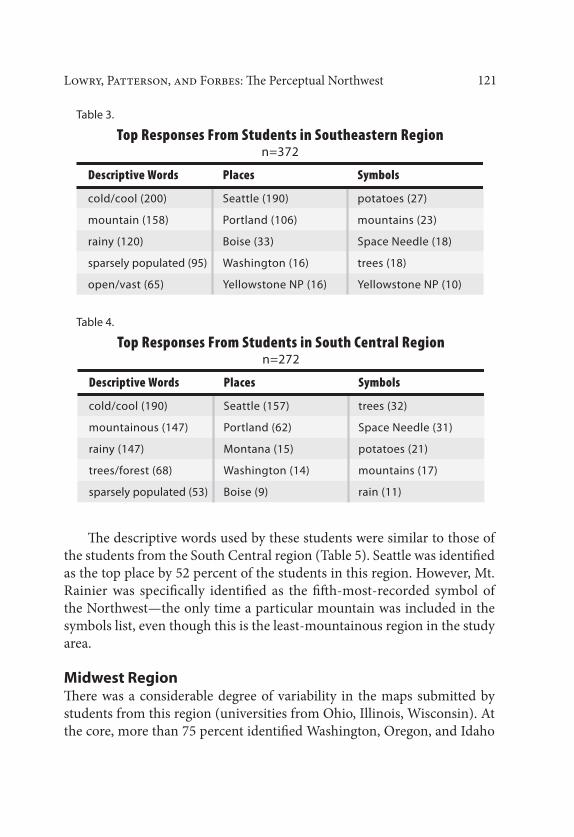
Four of the top fi ve characteristics listed by students from the southern
U.S. were also included on the overall descriptive list (Table 3). “Sparsely
populated,” however, was listed on only one other list: the South Central
U.S. region (see below). Again, these characteristics look at the coastal areas
(cool, mountains, rainy) and the interior (cold winters, sparsely populated
and open). Th is largely forested region of the southeastern U.S. used the
terms “open” and “vast” to describe the Northwest, while ranking symbols
such as trees lower on the list than students from less-forested regions.
Four of the top fi ve symbols of the Northwest, as documented by students
from the southern U.S., were found on the overall list. Yellowstone National
Park was number fi ve on the list, which may explain why over 50 percent
n=408Top Responses From Students in Pacific Coast Region
rainy (252)
green (159)
mountainous (111)
sparsely populated (95)
beautiful/scenic (60)
Descriptive Words
Seattle (247)
Portland (233)
Eugene (69)
Boise (17)
Missoula (11)
Places
trees (137)
rain (47)
mountains (30)
salmon (28)
green (16)
Symbols
Table 2.

120 APCG YEARBOOK • Volume 70 • 2008
of the student maps from this region
included Wyoming. Several students
oft en provided the adjective “Idaho”
when listing potatoes as a symbol of
the region. It is perhaps surprising to
fi nd potatoes on the list, let alone at
the top of the list, when only nine per-
cent of the respondents listed Boise as
a city in the region.
South Central RegionMaps from more than 75 percent of
students at the two South Central uni-
versities showed all of Washington,
Oregon, Idaho, and Montana as part
of the Northwest. In addition, at least
25 percent of the students from Texas
included parts of northern California,
Nevada, and Utah in the Northwest.
More than 70 percent of the
students responding said that the
Northwest was cold/cool, while 50
percent also described the region
as mountainous and rainy. As was
the case for all regions, Seattle and
Portland were the top two places
listed by respondents from this region
(Table 4).
Great Plains RegionMaps from students in this region
were consistent. At least 25 percent
included all of Washington, Oregon,
Idaho, Montana, and Wyoming, and
parts of northern California, Nevada,
and Utah.
n=27Kennesaw State University
n=105East Carolina University
n=82Georgia Southern University
n=72University of South Florida
n=70Georgia College and State University
Maps From Students in the
Southern United Statesn=356
The Perceptual Northwest
>75% Inclusion >50% Inclusion >25% Inclusion Figure 3.
121Lowry, Patterson, and Forbes: Th e Perceptual Northwest
Th e descriptive words used by these students were similar to those of
the students from the South Central region (Table 5). Seattle was identifi ed
as the top place by 52 percent of the students in this region. However, Mt.
Rainier was specifi cally identifi ed as the fi ft h-most-recorded symbol of
the Northwest—the only time a particular mountain was included in the
symbols list, even though this is the least-mountainous region in the study
area.
Midwest RegionTh ere was a considerable degree of variability in the maps submitted by
students from this region (universities from Ohio, Illinois, Wisconsin). At
the core, more than 75 percent identifi ed Washington, Oregon, and Idaho
n=372Top Responses From Students in Southeastern Region
cold/cool (200)
mountain (158)
rainy (120)
sparsely populated (95)
open/vast (65)
Descriptive Words
Seattle (190)
Portland (106)
Boise (33)
Washington (16)
Yellowstone NP (16)
Places
potatoes (27)
mountains (23)
Space Needle (18)
trees (18)
Yellowstone NP (10)
Symbols
n=272Top Responses From Students in South Central Region
cold/cool (190)
mountainous (147)
rainy (147)
trees/forest (68)
sparsely populated (53)
Descriptive Words
Seattle (157)
Portland (62)
Montana (15)
Washington (14)
Boise (9)
Places
trees (32)
Space Needle (31)
potatoes (21)
mountains (17)
rain (11)
Symbols
Table 3.
Table 4.

122 APCG YEARBOOK • Volume 70 • 2008
as part of the Northwest. From here, the maps start to appear diff erent, as
25 percent of the students from Chicago State, for example, included parts
of California, Nevada, Utah, Wyoming, Nebraska, Colorado, South Dakota,
and North Dakota.
More than 50 percent of the students described the Northwest as rainy,
but as a whole, trees/forest was not included on the description list (Table
6). Open and vast were descriptive word used by students from this largely
forested region. Interestingly, the most commonly listed symbol was a tree.
Seattle and Portland were fi rst and second, respectively, on the place list.
Southwest RegionMaps produced by students from the Southwest portion of the country were
more consistent. More than 50 percent of students from the University of
Arizona (Tucson), and 25 percent from Northern Arizona University (Flag-
staff ) had all of Idaho, Montana, and Wyoming as part of the Northwest.
In some respects, the top fi ve descriptive words appear be an antithesis
of the southern region, though Flagstaff is at a high elevation and gets cold
in the winter (Table 7). Surprisingly, Idaho and Boise were not included in
the most recorded places despite the fact that more than 75 percent of the
students included Idaho in their map. Four of the most common symbols
listed were identical to the overall list. Th e region is the only one to have
included Starbucks/coff ee on the symbols list – the only proprietary symbols
to make any list in the survey.
n=374Top Responses From Students in Great Plains Region
rainy (197)
mountainous (136)
cold/cool (93)
sparsely populated (52)
trees/forest (42)
Descriptive Words
Seattle (234)
Portland (120)
Boise (34)
Eugene (13)
Spokane (12)
Places
trees (45)
rain (40)
mountains (33)
Space Needle (32)
Mt. Rainier (7)
Symbols
Table 5.

123Lowry, Patterson, and Forbes: Th e Perceptual Northwest
Northeast RegionStudents from the lone northeastern U.S. university were the most consistent
in their maps. Greater than 75 percent of students from Bridgewater State
College (Bridgewater, MA) included all of Washington, Oregon, Idaho,
Montana, and Wyoming as being in the Northwest. In addition, this north-
eastern group was the only one to include the Oregon Trail as a symbol of
the Northwest, though parts of the Trail are found in Nebraska, Kansas, and
Missouri (Table 8).
Interestingly, the student group from the northeastern U.S. was the
only group to describe the Northwest as agricultural. Students from the
Northeast, the region with the highest percentage of tree cover in the United
States, used the terms “vast” and “open” to describe the U.S. Northwest,
while rating trees and forest lowest in Northwest symbols. Th is is similar to
respondents from the largely forested Midwest and Southeast and counter
n=132Top Responses From Students in Southwestern Region
rainy (92)
cold/cool (58)
green (44)
mountainous (36)
sparsely populated (36)
Descriptive Words
Seattle (89)
Portland (53)
Montana (18)
Oregon (11)
Washington (6)
Places
rain (20)
trees/forest (18)
mountains (15)
Space Needle (12)
Starbucks/coffee (8)
Symbols
n=156Top Responses From Students in Midwest Region
rainy (82)
mountainous (53)
cold/cool (41)
open/big/vast (31)
sparsely populated (26)
Descriptive Words
Seattle (81)
Portland (37)
Boise (18)
Washington (6)
Montana (7)
Places
trees (22)
mountains (20)
potatoes (11)
Space Needle (10)
rain (8)
Symbols
Table 6.
Table 7.

124 APCG YEARBOOK • Volume 70 • 2008
to respondents from the more-open Great Plains and Southwest. Ironically,
students from the largely forested Northwest did emphasize trees and not
the terms “vast” and “open.”
ConclusionsNationally, student respondents largely followed the “offi cial” area of the
region regarding state boundaries, with Washington, Oregon, and Idaho as
the core area. Student perception of characteristic cities and places followed
this pattern, with referenced population centers spread across the three-
state landscape. Regarding descriptive words and symbols, more emphasis
is placed on Garreau’s coastal perception of the Northwest through terms
such as “rainy,” “trees,” and “mountainous.”
Regional differences showed up in perception of area, descriptive
words, and symbols of the Northwest. Proximity led to diff erent percep-
tions. Northwest students showed the smallest perception of the Northwest
in geographic area, while those farthest away (Southeast students) mapped
the largest Northwest. Diff erence from the home region also led to diff erent
perceptions. Students from less-forested regions emphasized trees more than
students from more-forested regions, who tended to emphasize the open and
vast characteristics of the Northwest.
In summary, we can be fairly certain when using the term “Northwest” or
“Pacifi c Northwest” that our students are thinking of the same region others
have in mind when using similar terminology. We can also be fairly certain we
can use the terminology in class and know we are communicating eff ectively
vis-à-vis the location of the region.
n=71Top Responses From Students in Northeastern Region
mountainous (28)
rainy (23)
cold/cool (19)
agricultural/farming (13)
vast/open (11)
Descriptive Words
Seattle (28)
Portland (14)
Idaho (8)
Washington (5)
Boise (5)
Places
potatoes (8)
Oregon trail (6)
Space Needle (4)
mountains (4)
trees/forest (3)
Symbols
Table 8.

125Lowry, Patterson, and Forbes: Th e Perceptual Northwest
However, further geographic education on the natural and human land-
scapes of the region, including less-publicized steppe grassland and second-tier
population centers within metropolitan areas would improve knowledge of the
region. Simplifi cation of regions can limit understanding of not only natural
diversity and population density but cultural diversity. Many would guess
Asians are the primary immigrant to the region. Although most Mexican-
Americans are urban, the Pacifi c Northwest has a high percentage of rural
Hispanics, largely due to employment in agricultural industries such as apple
and cherry harvesting. Similarly, the World War II defense industry, includ-
ing Boeing aircraft , attracted numerous African-Americans to the region.
With an increased understanding of the additional knowledge pertaining to
the Northwest, students and citizens can make better-informed decisions on
issues such as population base and environmental conditions.
References CitedDowns, R. M. and D. Stea. 1977. Maps in Minds: Refl ections on Cognitive
Mapping. New York: Harper & Row.
Garreau, J. 1981. Th e Nine Nations of North America. New York: Avon Books.
Good, J. K. 1981. “Th e Vernacular Regions of Arkansas.” Th e Journal of Geography
80(5):179–185.
Gould, P. and R. White. 1974. Mental Maps. Baltimore: Penguin.
Hale, R. F. 1971. A Map of Vernacular Regions in America. Ph.D. dissertation,
University of Minnesota.
Hardwick, S. W. October 30, 2006. Personal communication via e-mail.
Hardwick, S. W., F. M. Shelley, and D. P. Holtgrieve. 2007. Th e Geography of North
America: Environment, Political Economy, and Culture. Upper Saddle River,
New Jersey: Prentice Hall.
Johanson, D. O. and C. M. Gates. 1957. Empire of Columbia. Harper & Brothers.
Jordan, T. G. 1978. “Perceptual Regions in Texas.” Th e Geographical Review
68(3):293–307.
Lamme, A. J., III and R. K. Oldakowski. 1982. “Vernacular Areas of Florida.”
Southeastern Geographer 22:99–109.
Lowry, J. D. 1999. “Th e Southwest in the American Mind.” Southwestern
Geographer 3:1–20.
———. 1996. Mapping the Vernacular Southwest. Ph.D. dissertation. University
of Arizona.
———. 1994. “Th e Vernacular Southwest.” Bulletin: Special Libraries Association,
Geography & Map Division, 176:2–11.
Lowry, J. D. and L. E. Zonn. 1989. “Cognitive Images of the South: Th e Insider’s
View.” Southeastern Geographer 29(1):42–54.

126 APCG YEARBOOK • Volume 70 • 2008
Meinig, D. W. 2006. Th e Shaping of America: A Geographical Perspective on 500
Years of History, Volume 4: Global America, 1915–2000. New Haven: Yale
University Press.
———. 1999. Th e Shaping of America: A Geographical Perspective on 500 Years of
History, Volume 3: Transcontinental America, 1850–1915. New Haven: Yale
University Press.
———. 1995. Th e Shaping of America: A Geographical Perspective on 500 Years
of History, Volume 2: Continental America, 1800–1867. New Haven: Yale
University Press.
———. 1988. Th e Shaping of America: A Geographical Perspective on 500 Years of
History, Volume 1: Atlantic America, 1492–1800. New Haven: Yale University
Press.
Omernik, J. M. 1987. Ecoregions of the conterminous United States. Map (scale
1:7,500,000). Annals of the Association of American Geographers 77(1):118–
125.
Raitz, K. B. and R. Ulack. 1981. “Cognitive Maps of Appalachia.” Th e Geographical
Review 71(2):201–213.
Saarinen, T. F. 1976. Environmental Planning: Perception and Behavior. Boston:
Houghton Miffl in Co.
Shortridge, J. R. 1985. “Th e Vernacular Middle West.” Annals of the Association of
American Geographers 75(1):48–57.
———. 1980. “Vernacular Regions in Kansas.” American Studies 21(1):73–94.
Tolman E. C. 1948. “Cognitive Maps in Rats and Men.” Psychological Review
55:189–208.
United States Census Bureau. 2002. United States Census 2000. Washington, D.C:
United States Census Bureau; http://www.census.gov/main/www/cen2000.
html (accessed January 7, 2007).
Washington Department of Natural Resources. 2003. Natural Heritage Plan,
pp. 52–60. Olympia, Washington: Washington Department of Natural
Resources.
Zelinksy, W. 1973. Th e Cultural Geography of the United States. Englewood Cliff s,
New Jersey: Prentice-Hall.
———. 1980. “North America’s Vernacular Regions.” Annals of the Association of
American Geographers 70(1):1–16.