Embed Size (px)
Citation preview

THE PERFORMANCE OF SILICA-TITANIA COMPOSITES
IN A PACKED-BED REACTOR FOR PHOTOCATALYTIC DEGRADATION OF GRAY WATER
By
CHRISTINA YVETTE LUDWIG
A THESIS PRESENTED TO THE GRADUATE SCHOOL OF THE UNIVERSITY OF FLORIDA IN PARTIAL FULFILLMENT
OF THE REQUIREMENTS FOR THE DEGREE OF MASTER OF ENGINEERING
UNIVERSITY OF FLORIDA
2004

Copyright 2004
by
Christina Yvette Ludwig

ACKNOWLEDGMENTS
I would like to thank my advisor, Dr. David Mazyck, for the opportunity to perform
this research and for his guidance. It has been a challenging and rewarding experience to
learn from him. I would also like to thank the other members of my committee, Dr. Paul
Chadik, Dr. Kevin Powers, and Dr. Chang-Yu Wu, for their constant supply of
knowledge and suggestions throughout the duration of this research.
I am grateful for the opportunity to work as part of an excellent research group. I
thank Ameena Khan, Matt Tennant, Thomas Chestnutt, Jack Drwiega, Jennifer Hobbs,
Jennifer Stokke, Morgana Bach, and Danielle Londeree for their ideas and suggestions as
well as their general support and advice. Each group member contributed to this research
as well as my education.
I must also thank my family for all their love and support. Special thanks go to my
husband, Matthew, for his constant encouragement and support throughout all of my
education.
iii
TABLE OF CONTENTS page ACKNOWLEDGMENTS ................................................................................................. iii
LIST OF TABLES............................................................................................................. vi
LIST OF FIGURES .......................................................................................................... vii
ABSTRACT....................................................................................................................... ix
CHAPTER
1 INTRODUCTION ........................................................................................................1
2 LITERATURE REVIEW .............................................................................................5
Photocatalysis ...............................................................................................................5 Titanium Dioxide...................................................................................................6 Kinetics..................................................................................................................7
Catalyst Supports ..........................................................................................................8 Activated Carbon ........................................................................................................10 Silica ...........................................................................................................................12
Regeneration........................................................................................................14 Synthesis by Sol-Gel Method..............................................................................14 Silica Gel Properties ............................................................................................17
Silica-Carbon Composites ..........................................................................................17 3 MATERIALS AND METHODS ...............................................................................19
SiO2-TiO2 Composites................................................................................................19 Reactor System ...........................................................................................................22 Simulated Wastewater ................................................................................................24 Reactor Dynamics.......................................................................................................25 Experimental Procedures ............................................................................................27
Adsorption and Destruction.................................................................................27 Adsorption of Intermediates ................................................................................29
iv
4 RESULTS...................................................................................................................30
System Optimization ..................................................................................................30 Flow Rate.............................................................................................................30 Pore Size..............................................................................................................35 Titanium Dioxide Loading ..................................................................................38 Activated Carbon Loading ..................................................................................40
Kinetics .......................................................................................................................46 5 SUMMARY AND CONCLUSION ...........................................................................49
APPENDIX SILICA-TITANIA COMPOSITE CHARACTERIZATION ......................51
LIST OF REFERENCES...................................................................................................52
BIOGRAPHICAL SKETCH .............................................................................................56
v

LIST OF TABLES
Table page 1 Chemicals Used for Silica Gel Synthesis .................................................................19
2 Properties of Degussa P25 TiO2...............................................................................20
3 Reactor Specifications..............................................................................................23
4 Simulated Wastewater Composition ........................................................................24
5 Rate Constants for TOC Mineralization to 500 ppb ................................................48
A-1 Surface Area, Pore Volume, and Pore Size of Composites Tested..........................51
vi

LIST OF FIGURES
Figure page 1 Illustrations of TiO2 crystalline structures: rutile (left) and anatase (right)...............6
2 Particle size distribution of activated carbon used in AC-SiO2-TiO2 composites ....20
3 Silica sols doped with titanium dioxide were mixed using magnetic stir plates and transferred to 96 well assay plates before forming a gel. .........................................21
4 Reactor packed with SiO2-TiO2 composites with a UV light through the center. ....22
5 Treatment system consisting of reactor packed with SiO2-TiO2 composites, UV lamp, pump, and reservoir of simulated wastewater.................................................23
6 Calibration of conductivity meter .............................................................................25
7 This figure compares the residence time distribution of the reactor as compared to a CSTR-in-series model........................................................................................27
8 This figure compares the residence time distribution of the reactor as compared to a CSTR-in-series model........................................................................................27
9 Diagram of the system used to test the adsorption of the intermediates formed from photocatalysis at different EBCTs. ..................................................................29
10 TOC removal by adsorption at flow rates of 5, 10, 20, and 30 mL/min, corresponding to EBCTs of 28, 14, 7, and 5.25 minutes and hydraulic loading rates of 0.55, 1.1, 2.2, and 3.3 cm3/cm2-min, respectively. ......................................31
11 TOC removal by destruction in a recirculating system at flow rates of 5, 10, 20, and 30 mL/min, corresponding to EBCTs of 28, 14, 7, and 5.25 minutes and hydraulic loading rates of 0.55, 1.1, 2.2, and 3.3 cm3/cm2-min, respectively. .........32
12 TOC removal by adsorption of wastewater effluents resulting from destruction at various EBCTs. .........................................................................................................34
13 Effect of pellet size on adsorption of the wastewater. ..............................................36
14 Effect of pellet size on destruction of the wastewater. .............................................36
15 Effect of pore size on adsorption of the wastewater. ................................................37
vii

16 Effect of pore size on the destruction of the wastewater. .........................................37
17 Effect of TiO2 loading on adsorption of the wastewater...........................................39
18 Effect of TiO2 loading on destruction of the wastewater..........................................39
19 Effect of activated carbon addition to the adsorption properties of the pellets. .......42
20 Effect of activated carbon loading on the destruction performance of the pellets....42
21 Comparison of the first adsorption cycle (ads1) to the adsorption of the pellets after the destruction cycle (ads2), using pellets of 24% TiO2 loading, 118 angstroms, and 1.3wt% activated carbon loading.....................................................43
22 Comparison of the first adsorption cycle (ads1) to the adsorption fo the pellets after the destruction cycle (ads2), using pellets of 24% TiO2 loading, 118 angstroms, and 3.9wt% activated carbon loading.....................................................43
23 Effect of activated carbon loading on the adsorption properties of the pellets.........45
24 Effect of activated carbon loading on the destruction performance of the pellets....45
25 Comparison of the first adsorption cycle (ads1) to the adsorption of the pellets after the destruction cycle (ads2), using pellets of 12% TiO2 loading, 118 angstroms, and 9.6wt% activated carbon loading.....................................................46
viii
Abstract of Thesis Presented to the Graduate School
of the University of Florida in Partial Fulfillment of the Requirements for the Degree of Master of Engineering
THE PERFORMANCE OF SILICA-TITANIA COMPOSITES IN A PACKED-BED REACTOR FOR PHOTOCATALYTIC DEGRADATION OF GRAY WATER
By
Christina Yvette Ludwig
August 2004
Chair: David Mazyck Major Department: Environmental Engineering Sciences
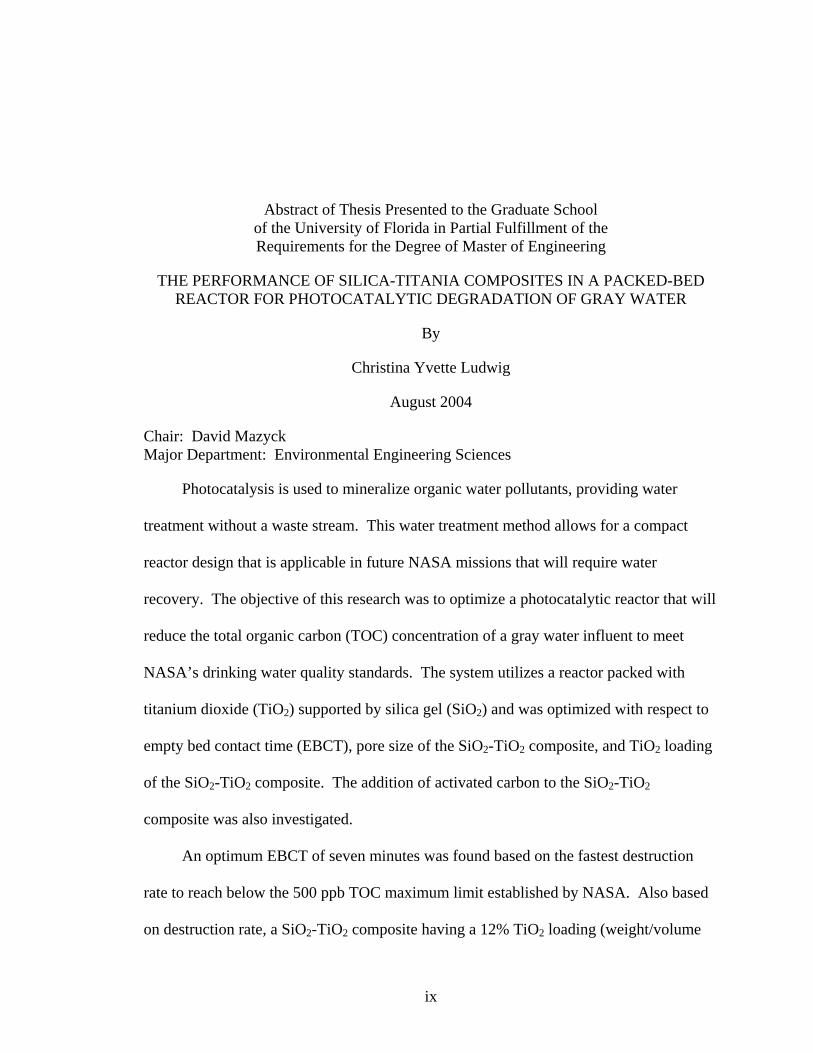
Photocatalysis is used to mineralize organic water pollutants, providing water
treatment without a waste stream. This water treatment method allows for a compact
reactor design that is applicable in future NASA missions that will require water
recovery. The objective of this research was to optimize a photocatalytic reactor that will
reduce the total organic carbon (TOC) concentration of a gray water influent to meet
NASA’s drinking water quality standards. The system utilizes a reactor packed with
titanium dioxide (TiO2) supported by silica gel (SiO2) and was optimized with respect to
empty bed contact time (EBCT), pore size of the SiO2-TiO2 composite, and TiO2 loading
of the SiO2-TiO2 composite. The addition of activated carbon to the SiO2-TiO2
composite was also investigated.
An optimum EBCT of seven minutes was found based on the fastest destruction
rate to reach below the 500 ppb TOC maximum limit established by NASA. Also based
on destruction rate, a SiO2-TiO2 composite having a 12% TiO2 loading (weight/volume
ix

basis) and 118 angstrom pore size was shown to have the best performance. Activated
carbon was found to improve the overall performance of the system through its increase
to the composite’s adsorption capabilities. Greater adsorption capabilities can allow for
lower energy requirements, enabling the UV light to be turned off during a period of
contaminant adsorption and turned on for mineralization of the contaminants already
surrounding the photocatalyst.
Adsorption capabilities of the support can lead to more efficient, complete
destruction of the contaminants by surrounding the photocatalyst with a high
concentration of contaminants; therefore, it was predicted that increasing the ability of
the photocatalyst composite to adsorb the organic contaminants would increase the rate of
photocatalytic destruction. Adsorption was shown to be an important system parameter,
but increasing adsorption did not always lead to a better destruction rate due to the
contribution of other parameters controlling the system, such as UV light exposure and
hydraulic flow through the reactor.
x

CHAPTER 1 INTRODUCTION
Contamination of our water, air and soil by various agricultural and industrial
processes has traditionally been controlled through ultrafiltration, extraction, air
stripping, carbon adsorption, incineration, and oxidation via ozonation or via hydrogen
peroxide (Serpone, 1995). Problems with the successful and efficient removal of toxic
pollutants from our environment have led to the search for more advanced methods
(Hoffmann et al., 1995). Groundwater contamination is expected to be a primary source
of human contact with a majority of the toxic pollutants in our environment, many of
which are organic compounds, such as solvents, pesticides, chlorophenols, and volatile
organics (Hoffman et al., 1995). Photocatalysis offers an advanced technology for the
removal of toxic organics from our water. Many of the previously mentioned
technologies simply transfer the pollutant out of the water, requiring additional treatment
and/or disposal of the compound. In photocatalysis, the organic contaminants are
oxidized, ultimately to carbon dioxide and water, leaving no waste to dispose. Utilizing
UV irradiation, photocatalysis has the added advantage of being able to simultaneously
disinfect and destroy organics (Serpone, 1995). Because of its promise as a more
advanced environmental technology, photocatalysis is being developed for the
destruction of toxic organic compounds in water. Given its ability to eliminate organic
compounds in one process, this technology has a variety of applications.
Its potential to be a compact, low maintenance system makes it particularly useful
for small-scale water recovery. Water recovery is a vital component of NASA space
1

2
missions. The reclamation of water from gray sources, which include shower waste,
hand wash waste, oral hygiene waste, urine, urine flush waste, and spacecraft humidity
condensate, enables long-term presence in space without the penalty of transporting large
masses of clean water to the crew members. It is also a necessity for missions involving
long flight distances, such as a mission to Mars. It is important that the water recovery
system be compact and reliable with as little energy requirements as possible, allowing
crew members to direct time and resources toward scientific investigations. A
photocatalytic system that meets NASA’s water recovery system requirements is being
developed to be used as a post processor for the destruction of organic compounds that
may not be removed in preceding water subsystems. These subsystems may include
biological reactors, ion exchange, and reverse osmosis. The objective of the post
processor is to ensure that the total organic carbon (TOC) concentration remains below
the maximum limit required by NASA water quality standards, which is 500 ppb (Lange
and Lin, 1998). The post-processor must also be able to treat the wastewater at a rate of
11.5 L/person/day, which is the quantity of wastewater produced by each person per day
(Campbell et al., 2003).
A system that destroys organic contaminants would also be applicable in a home
water treatment system. Some homeowners, particularly those with well water as their
water supply source, choose to use additional treatment processes, such as an activated
carbon filter, before consumption. Depending on the water quality, it is suggested that 10
to 20 L/day of water for drinking or cooking could be processed using a 15 W to 40 W
photocatalytic unit at a cost comparable to other treatment processes (Matthews, 1993).
3
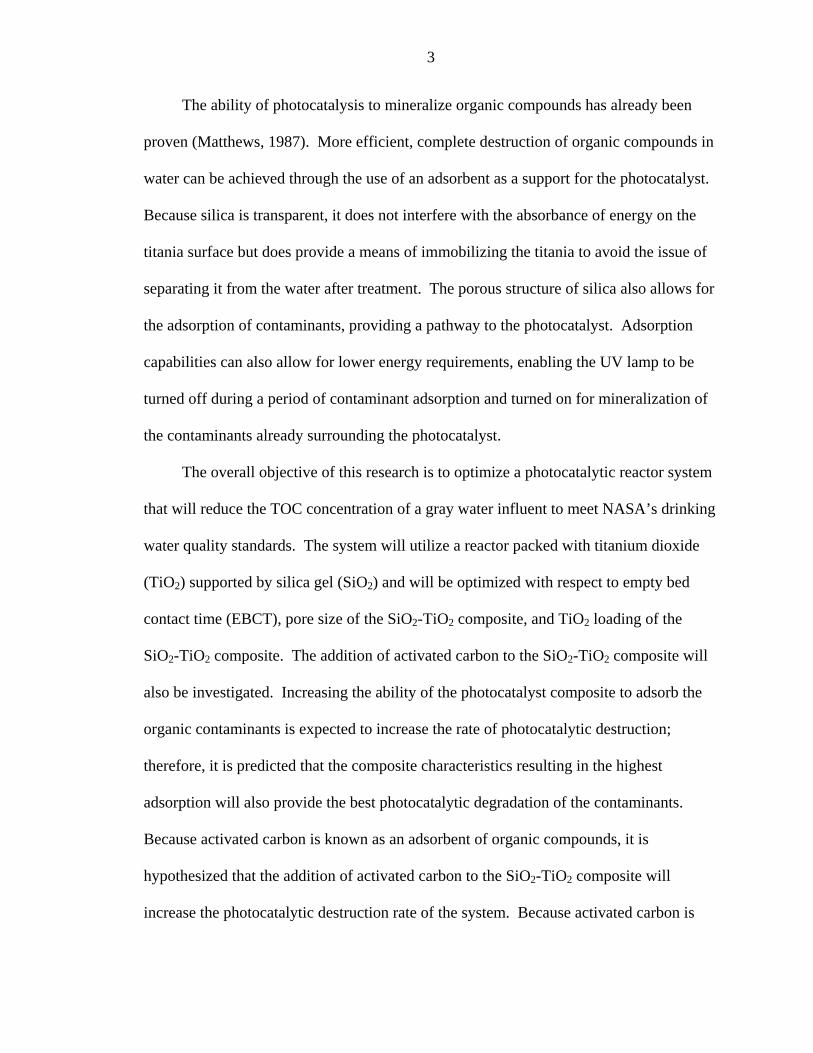
The ability of photocatalysis to mineralize organic compounds has already been
proven (Matthews, 1987). More efficient, complete destruction of organic compounds in
water can be achieved through the use of an adsorbent as a support for the photocatalyst.
Because silica is transparent, it does not interfere with the absorbance of energy on the
titania surface but does provide a means of immobilizing the titania to avoid the issue of
separating it from the water after treatment. The porous structure of silica also allows for
the adsorption of contaminants, providing a pathway to the photocatalyst. Adsorption
capabilities can also allow for lower energy requirements, enabling the UV lamp to be
turned off during a period of contaminant adsorption and turned on for mineralization of
the contaminants already surrounding the photocatalyst.
The overall objective of this research is to optimize a photocatalytic reactor system
that will reduce the TOC concentration of a gray water influent to meet NASA’s drinking
water quality standards. The system will utilize a reactor packed with titanium dioxide
(TiO2) supported by silica gel (SiO2) and will be optimized with respect to empty bed
contact time (EBCT), pore size of the SiO2-TiO2 composite, and TiO2 loading of the
SiO2-TiO2 composite. The addition of activated carbon to the SiO2-TiO2 composite will
also be investigated. Increasing the ability of the photocatalyst composite to adsorb the
organic contaminants is expected to increase the rate of photocatalytic destruction;
therefore, it is predicted that the composite characteristics resulting in the highest
adsorption will also provide the best photocatalytic degradation of the contaminants.
Because activated carbon is known as an adsorbent of organic compounds, it is
hypothesized that the addition of activated carbon to the SiO2-TiO2 composite will
increase the photocatalytic destruction rate of the system. Because activated carbon is

4
opaque, it may prevent some of the UV light from reaching the photocatalyst. There may
be a need to balance the adsorption and the opacity, resulting in an optimum activated
carbon loading.
CHAPTER 2 LITERATURE REVIEW
Photocatalysis
Heterogeneous photocatalysis involves more than one phase. In this discussion, the
media involved in the reaction are a solid phase catalyst and a liquid solution containing
the organic contaminants. The photocatalytic process begins with the excitation of an
electron (Eq. 1).
TiO2 + hv e- + h+ (Eq. 1)
When light of the appropriate wavelength is absorbed by the catalyst (e.g., TiO2),
an electron (e-) is transferred from the valence band to the conduction band, leaving a
positively charged hole behind (h+). The wavelength of light necessary to provide the
energy to move the electron into the conduction band varies with the specific
photocatalyst; for titanium dioxide (TiO2), UV light of less than 388 nm is required. The
electron can then recombine with the electron hole, or the hole can react with other
species. Oxygen plays an important role as an electron acceptor, thus preventing the
electrons from recombining and keeping the electron holes open for reaction. Water and
hydroxide ions react with the electron holes to form hydroxyl radicals, proven the
primary oxidant in the photocatalytic oxidation of organics (Turchi and Ollis, 1990).
Repeated hydroxyl radical attack can eventually lead to complete oxidation of the
contaminant.
5
6
Titanium Dioxide
Titanium dioxide is the photocatalyst most often used due to its low cost and better
activation over other photoactive metal oxides. It has also shown stability in that the
TiO2 itself does not change over time, unlike other photocatalysts. Zinc oxide has shown
good photocatalytic abilities, but has been found to be unstable due to
photodecomposition (Peral et al., 1988).
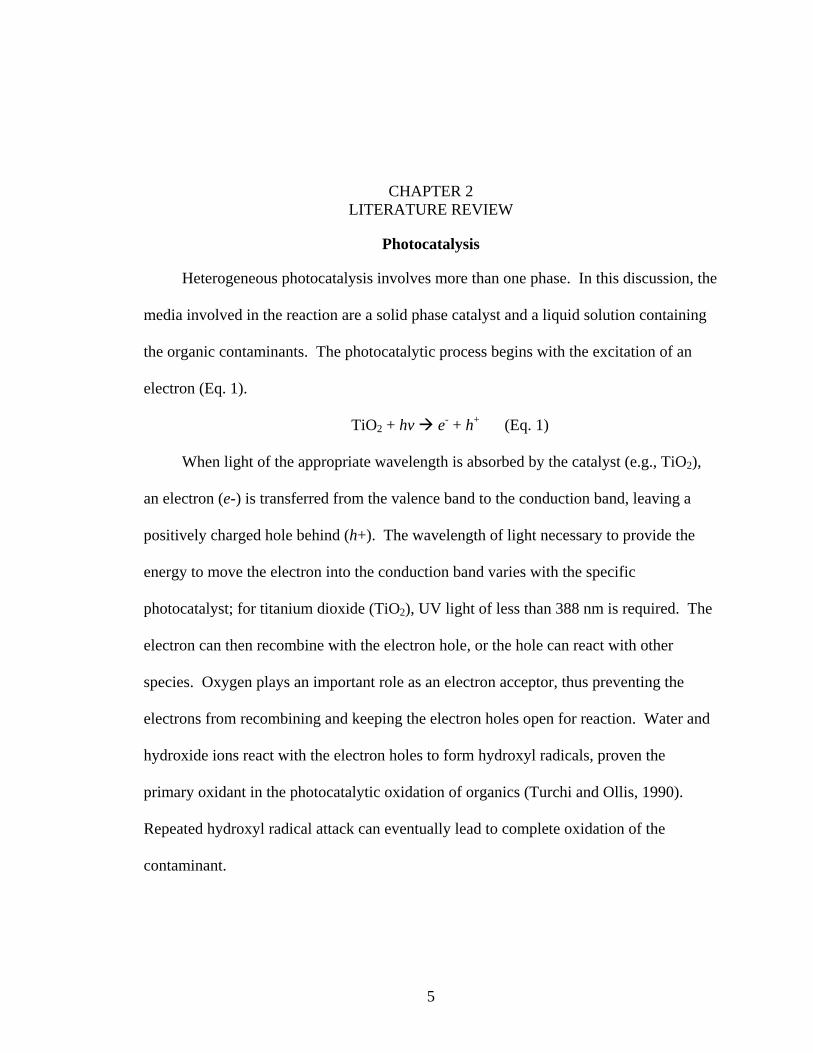
TiO2 can be synthesized in different crystalline forms. The two most applicable
structures are anatase and rutile. Both consist of titanium atoms surrounded by six
oxygen atoms in different octahedron formations (Figure 1).
Figure 1. Illustrations of TiO2 crystalline structures: rutile (left) and anatase (right).
Rutile Anatase
Diebold, 2003
The anatase structure has been found to be more photocatalytically active (Ohtani
and Nishimoto, 1993; Tanaka et al., 1993). Degussa P-25 is a commercially available
TiO2 with a structure that is 70% anatase and 30% rutile. This particular TiO2 is

7
commonly used as it has repeatedly demonstrated successful photocatalytic degradation
of organics.
Kinetics
Langmuir-Hinshelwood (LH) kinetics has been shown to successfully describe the
photocatalytic degradation of organic contaminants (Al-Ekabi and Serpone, 1988; Turchi
and Ollis, 1989). The LH model assumes the reactions take place at the surface of the
catalyst, and the reaction rate is proportional to the fraction of the surface covered by the
reactant.
KCkKCk
dtdCr
+==−=
1θ (Eq. 2)
Where r is the rate of the reaction, C is the concentration of the contaminant, t is
time, k is the rate constant, Ө is the fraction of the surface covered by the reactant, and K
is the adsorption equilibrium constant.
Eq. 2 can be simplified when the concentration is either very high (KC >> 1) or
very low (KC << 1). Under conditions of low concentration, KC becomes negligible
compared to 1 and Eq. 2 reduces to a first order reaction:
kKCdtdC
=− (Eq. 3)
Similarly, under conditions of high concentration, 1 becomes negligible compared
to KC. Eq. 2 reduces to a zero order reaction, where the reaction rate is equal to the rate
constant, k. This simplification is illustrated in the photocatalytic degredation of 4-
chlorophenol, where no additional increase in rate was observed with an increase in
initial concentration above 0.2 millimoles (Al-Ekabi and Serpone, 1989). It was reasoned
that at a high enough contaminant concentration, the surface sites of the catalyst are

8
completely saturated, so further increase in concentration cannot further increase the rate
of reaction, according to LH kinetics. Conversely, below the specified concentration, the
catalyst surface sites are not completely saturated; therefore, the fraction of the surface
covered by the contaminant will vary with concentration, thereby varying the reaction
rate.
The applicability of the LH model can be validated by inverting Eq. 2 and plotting
1/r vs. 1/C. The slope of a linear plot provides 1/kK and the 1/k value is given by the y-
intercept.
kCkKdtdC111
/1
+⎟⎠⎞
⎜⎝⎛=− (Eq. 4)
This equation has been found to be accurate for the reaction rate in a single
component system, with no competition for reactive sites, but must be expanded to
accurately describe a multi-component system (Turchi and Ollis, 1989).
Catalyst Supports
The utilization of a photocatalyst as a slurry can be effective, but creates difficulties
in recovering the catalyst due to its small particle size. For this reason, the use of a
variety of supports, such as glass beads, carbon, sand, clay, and silica gel, have been
investigated (Matthews, 1993). There are additional advantages to using a support that is
capable of adsorbing the organic contaminants. The rate of destruction is generally
controlled by the concentration of the contaminant; therefore, the rate of mineralization
will decrease as the contaminant concentration decreases. This makes reducing the
concentration of organics to low levels a slow process. If an adsorbent is used as a
support, a high concentration of the contaminant is created around the photocatalyst,
which increases the rate of mineralization (Yoneyama and Torimoto, 2000). The

9
adsorbent support can also retain intermediates that are formed during the destruction
process. The possibility of creating toxic intermediates during photocatalysis is a
concern, but if the intermediates are held near the catalyst they are more likely to be
completely destroyed.
Silica gel and activated carbon are two porous media that are being investigated as
catalyst supports. Activated carbon is commonly used in water treatment to adsorb
undesired organic components. Its proven adsorption capabilities make it a good
candidate for a photocatalyst support. An obvious adverse affect of the addition of
activated carbon is its opaque nature. The activated carbon could prevent photons from
reaching the photocatalyst, decreasing activation and subsequently reducing
mineralization. Silica gel generally has a lower surface area than carbon, but has the
advantage of being transparent, allowing the light to penetrate and activate the titanium
dioxide.
There is some disagreement in the literature as to the level of adsorption desired in
the catalyst support. A study of the photocatalytic destruction of propionaldehyde in the
air phase revealed that a catalyst support with medium level adsorption abilities
compared to the other adsorbents used in the study (carbon having high adsorption and
zeolum having low adsorption) showed the fastest degradation (Yoneyama and Torimoto,
2000). The reasoning was based on the longer time needed for diffusion from composites
involving strong adsorption. Similarly, it was found that the use of activated carbon as a
catalyst support was not advantageous in the destruction of dichloromethane in water
(Torimoto et al., 1997). The reason for this result was attributed to slower diffusion of
dichlormethane from the adsorbent compared to the bulk solution. However, an

10
investigation of a single compound, methylene blue, using various activated carbon types
as catalyst supports for TiO2 was completed (Khan, 2003). Here it was found that the
stronger adsorbents led to better destruction. Further analysis as to the cause of varied
destruction levels resulting from different activated carbon supports revealed that higher
metal content led to enhanced photocatalysis. Khan explains that the metals contained in
the AC could act as electron acceptors, reducing the recombination of electron/hole pairs
and leading to increased photocatalysis.
Activated Carbon
Activated carbon (AC) can be made from a variety of carbonaceous materials,
including coal, peat, peanut shells, and wood, which are charred and subsequently
activated through a chemical or physical process, such as the application of steam or CO2
at temperatures typically around 900°C and higher. The final product is a material that
has a high surface area (generally 500-1500 m2/g) and high energy for removing
pollutants.
AC is a well-known technology for the removal of organic compounds from water
through adsorption. The drawback of AC is that once its adsorption capacity is reached,
it must either be replaced or regenerated, a process that usually involves burning off the
adsorbed pollutants and a corresponding loss of carbon mass. This drawback could be
overcome through a combination of AC and TiO2. The AC adsorbs the contaminants,
leading to more efficient photocatalysis, and the photocatalysis destroys the pollutants,
leading to regeneration of the adsorbent. This concept has been investigated by
generating composites of AC coated with titanium dioxide (Lu et al., 1999; Torimoto et
al., 1996; Torimoto et al., 1997; Yoneyama and Torimoto, 2000; Khan, 2003). The TiO2
can be coated on the AC through various methods, such as impregnation or boiling

11
deposition. Different methods will lead to AC-TiO2 composites with different properties.
The disappearance of contaminants as well as the disappearance of total organic carbon
has been monitored (Lu et al., 1999; Torimoto et al., 1996) and found that although TiO2
alone decreased contaminant concentrations at a faster rate, the overall decomposition of
the contaminants and intermediates was faster with the AC-TiO2 composite. This
supports the idea that the AC will adsorb the intermediates, holding them close to the
photocatalyst until completely mineralized.
Several studies claim enhanced photocatalysis through the addition of AC in an
aqueous suspension of TiO2 (Matos et al., 1998; Herrmann et al., 1999; Matos et al.,
2001; Gomes da Silva and Faria, 2003). The location of the degradation process in
aqueous suspensions has been studied (Minero et al., 1992) and shows that the oxidation
reaction takes place close to the catalyst surface; therefore, the use of the two materials in
an aqueous suspension relies on the transfer of the pollutants from the adsorbent to the
photocatalyst. This creates an added step compared to the AC-TiO2 composites; the
contaminants must be somehow transferred, possibly during a collision, from the AC to
the TiO2. Two studies directly compared the use of a mixture versus a composite using
the same quantity of carbon and TiO2 in each experiment with the same organic
compound (Torimoto et al., 1997; Nagaoka et al., 2002). These authors agreed that
enhanced removal occurred with the addition of carbon compared to TiO2 alone, but
found that physically combining the two materials was more advantageous. Torimoto
reasons that the photodecomposition of the adsorbed species must take place during
collisions, and this occurrence is simply not high enough to compete with the AC-TiO2
composite. In addition, the aqueous suspension defeats the original purpose of

12
supporting TiO2 in the first place, which is to enable the TiO2 particles to be easily
separated from the solution after photocatalysis.
The regeneration of AC-TiO2 has been studied and shown to be difficult.
Regeneration after adsorption of an organic dye, methylene blue, of two composites that
differed in the type of AC was studied (Khan, 2003). The first attempt at regeneration of
one AC-TiO2 composite showed a loss of its capacity with each 24-hour regeneration
cycle. Khan reasoned that some of the carbon may not be exposed to UV light,
preventing photocatalysis; therefore, a second regeneration attempt involved
simultaneous fluidization with UV irradiation. This succeeded in regenerating the AC-
TiO2 back to its initial uptake, but the AC-TiO2 reached exhaustion faster than in the first
cycle. The other AC-TiO2 composite, made with a different AC, was regenerated only
through intermittent 12 hour irradiation, but was not restored to its original level.
Another study that focused on the regeneration of AC-TiO2 also showed long
regeneration times (Crittenden et al., 1997). In order to increase the regeneration rate,
Crittenden tried heating the AC-TiO2 during regeneration with the idea that this would
increase the desorption rate, which was thought to be a limiting step in the regeneration
rate. The regeneration of AC-TiO2 was found to be only 10% more efficient than the
regeneration of the control, which was AC without TiO2. This indicated that the
efficiency was based on simple desorption rather than oxidation of the organic
compounds.
Silica
Silica (SiO2) is a transparent material that can be synthesized through various
chemical methods, providing several options for the creation of SiO2-TiO2 composites.
Synthesis can occur through preparation of the two oxides simultaneously, as one mixed

13
material, or through deposition of TiO2 on SiO2. Sol-gel hydrolysis, coprecipitation, and
flame hydrolysis are the most popular mixed oxide methods, while impregnation,
chemical vapor deposition, and precipitation are the methods used for supported oxides,
though the supported oxide methods have not received as much attention (Gao and
Wachs, 1999). Each method will lead to composites with different behaviors based on
differences in surface area, pore size, dispersion of TiO2 on or in the silica, and bonding
between the silica and photocatalyst.
SiO2-TiO2 composites have been proven successful in the photocatalytic
degradation of a variety of organic compounds (Matthews, 1988; Anderson and Bard,
1995; Anderson and Bard, 1997; Xu et al., 1999; Vohra and Tanaka, 2003). In some
studies, SiO2-TiO2 has been compared directly to bare TiO2 and shown to be more
advantageous for specified compounds (Xu et al., 1999; Anderson and Bard, 1995). Xu
and co-workers synthesized particles from a titania sol and silica powder and tested for
photocatalytic destruction of acetophenone. SiO2-TiO2 was found to be at least 10%
more effective than bare TiO2. This increased destruction was related to higher
adsorption of acetophenone and better dispersion of TiO2 due to the presence of silica. A
similar comparison was performed using SiO2-TiO2 and bare TiO2 particles prepared by a
sol-gel technique and tested for the removal of rhodamine-6G (Anderson and Bard,
1995). Again, SiO2-TiO2 was found to have a faster degradation rate, which was related
to the increased adsorption of the contaminant. These studies demonstrate the idea that
increasing adsorption will increase the concentration of the contaminant around the TiO2
and lead to faster destruction of the contaminant.

14
Regeneration
Multiple studies have been performed that prove the ability of SiO2-TiO2 to be used
over and over again. Phenol was repeatedly degraded by greater than 99% in a reactor
packed with SiO2-TiO2 particles (Matthews, 1988). Cycles of adsorption and destruction
of phenol were performed four times without loss of capacity. A series of adsorption and
destruction tests were also performed using SiO2-TiO2 pellets for the photocatalytic
degradation of volatile organics (Holmes, 2003). At least ten runs were performed using
the same pellets and achieving 80% or more removal of each of the contaminants. No
decrease in the system’s original photocatalytic ability was observed in the data. SiO2-
TiO2 pellets are used in four adsorption and destruction cycles for the removal of an
organic dye, crystal violet (Londeree, 2002). No decrease in the pellets’ performance is
shown; in fact, the adsorption ability of the pellets actually increased with each cycle.
Synthesis by Sol-Gel Method
Compared to other synthesis processes, the sol-gel technique is the most widely
used based on its potential for control over the textural and surface properties of the final
material (Gao and Wachs, 1999). In addition, because this preparation method begins
with high purity chemical precursors, it produces high purity, homogeneous materials
(Kirk and Othmer, 1991). Starting from a liquid also has the advantage of shaping the
material in a mold, making it easier to produce particles of the size and shape needed for
a specific application.
A sol is a suspension of colloidal particles dispersed in a liquid. Under the proper
conditions, the sol will form a gel, which is a solid network that holds the liquid in its
pores. A sol-gel can be formed through a series of hydrolysis and condensation reactions

15
of alkoxide precursors. Once the gel is formed, it may undergo aging and drying steps to
allow the gel to mature to the desired structure and expel the liquid held in its pores.
Commonly used silica precursors are tetra methyl ortho silicate (TMOS) and tetra
ethyl ortho silicate (TEOS). The chemical formulas for these silica precursors are
Si(OCH3)4 and Si(OC2H5)4 for TMOS and TEOS, respectively. These can be represented
by Si(OR)4 in equations 5 and 6. The alkoxide precursor reacts with water in a
hydrolysis reaction (Eq. 5) and the silica network begins to form through condensation
reactions (Eq. 6). The network continues to grow through polycondensation. Because
the alkoxide precursor is not readily soluble in water, an alcohol is generally used as a
solvent in the mixing of these reactants. Depending on the precursor, methanol or
ethanol is formed as a byproduct of the hydrolysis reaction and water is produced in the
condensation reactions.
Si(OR)4 + 4H2O Si(OH)4 + 4ROH (Eq. 5)
Si(OH)4 + Si(OH)4 (OH)3Si – O – Si(OH)3 + H2O (Eq. 6)
The rates of the hydrolysis and condensation reactions that begin formation of the
gel have a strong impact on the structure of the final material. These reaction rates will
vary with temperature, nature of the solvent, type of alkoxide precursor, and nature and
concentration of the acid or base (Hench and West, 1990). The acid or base
concentration has been shown to be the dominant factor (Orcel, 1987). In general,
increasing the concentration of H+ or H3O+ in acidic conditions or increasing the
concentration of OH- in basic conditions will increase the rate of hydrolysis. The ratio of
water to the alkoxide precursor, the R ratio, also affects the rate of hydrolysis. Water can
be used in excess to promote hydrolysis. The rate of the hydrolysis and condensation

16
reactions will ultimately affect the gel time and the structure of the gel. Hydrofluoric
acid has been used to decrease the gel time and increase the pore size of the resulting gel
(Powers, 1998).
After gelation, at which point the three dimensional silica network has formed and
the sol ceases to move as a liquid, the polycondensation reactions continue as the silica
network further develops. Syneresis and Ostwald ripening also contribute to this aging
process. Syneresis involves the contraction of the silica gel network as a result of the
condensation reactions, which create additional silica network links and cause more
liquid to be expelled. Ostwald ripening describes the formation of the silica gel network
in the areas of negative curvature, filling in these crevices on the surface of the silica gel.
This process strengthens the gel, which helps to protect the gel against cracking during
drying. The time and temperature under which the aging process is allowed to occur will
impact the surface area and pore size of the gel.
Alcohol and water produced in the aforementioned reactions remain in the pores of
the gel. The gel must be dried, typically at temperatures between 100ºC and 180ºC, to
remove the liquid from the pores. Capillary forces are created by the evaporation of the
liquid, causing some of the pores to collapse and the gel to shrink. Silica gels dried in
this manner are termed xerogels and will generally be reduced in volume by 40-60% (El
Shafei, 2000). Steps can be taken to reduce the amount of shrinking and create a silica
gel of higher surface area and pore volume. One method involves replacing the water
with a liquid of lower surface tension, such as an alcohol, before drying. A gel can also
be supercritically dried to completely eliminate the destructive forces of surface tension,
minimizing the amount that the gel shrinks.

17
Silica Gel Properties
The silica network consists of four oxygen atoms bonded to each silicon atom,
forming a tetrahedron, and each oxygen atom is shared by two silicon atoms. These Si-
O-Si, or siloxane, bonds make up the bulk silica structure. The surface of the silica is
hydroxylated in the presence of water, forming Si-OH, or silanol, groups. It is these
silanol groups that make the silica surface hydrophilic and determine the reactivity of the
silica (El Shafei, 2000). The silanol groups can be defined as single, geminal, or vincinal.
Single silanol groups are isolated and formed with a silicon atom that is bonded to three
other oxygen atoms in siloxane bonds. When at a close enough distance, the hydroxyl
groups can interact with each other through hydrogen bonding, creating vincinal silanols.
Geminal silanols exist when two hydroxyl groups are linked to the same silicon atom.
The silica surface can be dehydroxylated through heating above temperatures of 200ºC.
The silanol groups will condense to form siloxane bonds. Dehydroxylation will occur at
a greater degree as the temperature is increased.
In the presence of water, the silanol groups become ionized and the hydrogen atom
will associate or dissociate depending on the pH of the solution (Icenhower and Dove,
2000). The point of zero charge (PZC) of silica is between a pH of 2 and 3; therefore, at
pH values above this PZC, the hydrogen atoms will begin to dissociate. This
deprotonation will leave a negative charge on the surface of the silica (Eq. 7).
Si-OH Si-O- + H+ (Eq. 7)
Silica-Carbon Composites
Combining silica and carbon can potentially combine the advantages of each
material to create a composite with improved adsorption capabilities. These composites
may possess a heterogeneous surface through combination of the properties of the

18
nonpolar, hydrophobic carbon with the polar, hydrophilic silica to create a material that
can adsorb both inorganic and organic contaminants (Skubiszewska-Zieba, 2002).
Carbon-silica composites have been successfully created through several methods,
including pyrolysis of methylene chloride on the surface of silica gel (Villieras et al.,
1998), pyrolyzed elutrilithe in a sol-gel (Deng et al., 1998), and coating of silica gel on
the carbon surface through hydrolysis of a silica precursor (Cheong et al., 2003). Deng
showed that combining the carbon and silica created a composite with different
adsorption capacities than the individual materials. For certain adsorbates, namely water,
cyclohexane, acetone, and pyridine, carbon-silica composites had superior uptake when
compared to silica or carbon alone (Deng et al., 1998). Composites consisting of carbon,
silica and titanium dioxide have also been generated for the epoxidation of cyclohexene
(Cheong, 2003). The titanium dioxide supported by both carbon and silica was found to
provide greater conversion of cyclohexene compared to titanium dioxide support by silica
or carbon alone. The advantages of each material were successfully combined: the
carbon provided higher selectivity for the epoxide due to its hydrophobic nature, and the
silica provided a better environment for catalytic activity.

CHAPTER 3 MATERIALS AND METHODS
SiO2-TiO2 Composites
The SiO2-TiO2 composites were created using a sol-gel method (Londeree, 2002).
The silica precursor was tetra-ethyl-ortho-silicate (TEOS) (Fisher Scientific, reagent
grade). It was mixed with nanopure water using a water to TEOS mole ratio of 16:1.
Ethanol (Aaper Alcohol, 200 proof) was used as the solvent to facilitate the miscibility
between the TEOS and water. Two acid catalysts were used: a 1 M nitric acid solution,
made from 15.8 M nitric acid (Fisher Scientific, certified A.C.S.) and nanopure water,
and a 3% solution of hydroflouric acid, formulated from 49% hydrofluoric acid (Fisher
Scientific, reagent A.C.S.) and nanopure water. Table 1 summarizes the quantity of each
chemical used to make one batch, approximately 10 g, of silica gel. The volume of
hydrofluoric acid was varied to control the pore size of the gel. Volumes of 2, 3, and 4
mL correspond to approximate pore diameters of 70, 118, and 234 angstroms,
respectively.
Table 1. Chemicals Used for Silica Gel Synthesis Chemical Volume Nanopure water 25 mL Ethanol 50 mL TEOS 35 mL 1 M Nitric Acid 4 mL 3% Hydrofluoric Acid 2-4 mL
The chemicals in Table 1 were mixed in polystyrene containers in the order listed
using a magnetic stir plate. While mixing, the liquid was doped with the desired quantity
19

20
of Degussa P25 TiO2. According to Degussa, the TiO2 possesses the properties listed in
Table 2.
Table 2. Properties of Degussa P25 TiO2 Property Value Specific surface area (BET) 50 +/- 15 m2/g Average primary particle size 30 nm Tapped density 130 g/L pH value in 4% dispersion 3.5-4.5
For the composites that included activated carbon, the mixture was doped with
activated carbon after the addition of TiO2. The activated carbon used in the composites
was ground to an average particle diameter between 1 and 2 microns as determined by
the LS2 13 320 Laser Diffraction Particle Size Analyzer. The distribution of the particle
size is shown in Figure 2.
Figure 2. Particle size distribution of activated carbon used in AC-SiO2-TiO2 composites. Analysis A and Analysis B are duplicates of the particle size distribution analysis.
0123456789
10
0 2 4 6 8 10 12 14 16 18 20
Particle Diameter (micron)
Num
ber (
%)
Analysis AAnalysis B
21
The TiO2 and activated carbon loadings stated throughout this document are
referred to as percentages. The TiO2 loadings are reported on a basis of TiO2 weight per
TEOS volume. For example, the 12% TiO2 loading is determined using 4.2 g of TiO2 per
35 mL of TEOS as a percentage. The activated carbon loadings are reported by a weight
percentage using the activated carbon mass per total mass of the pellets.
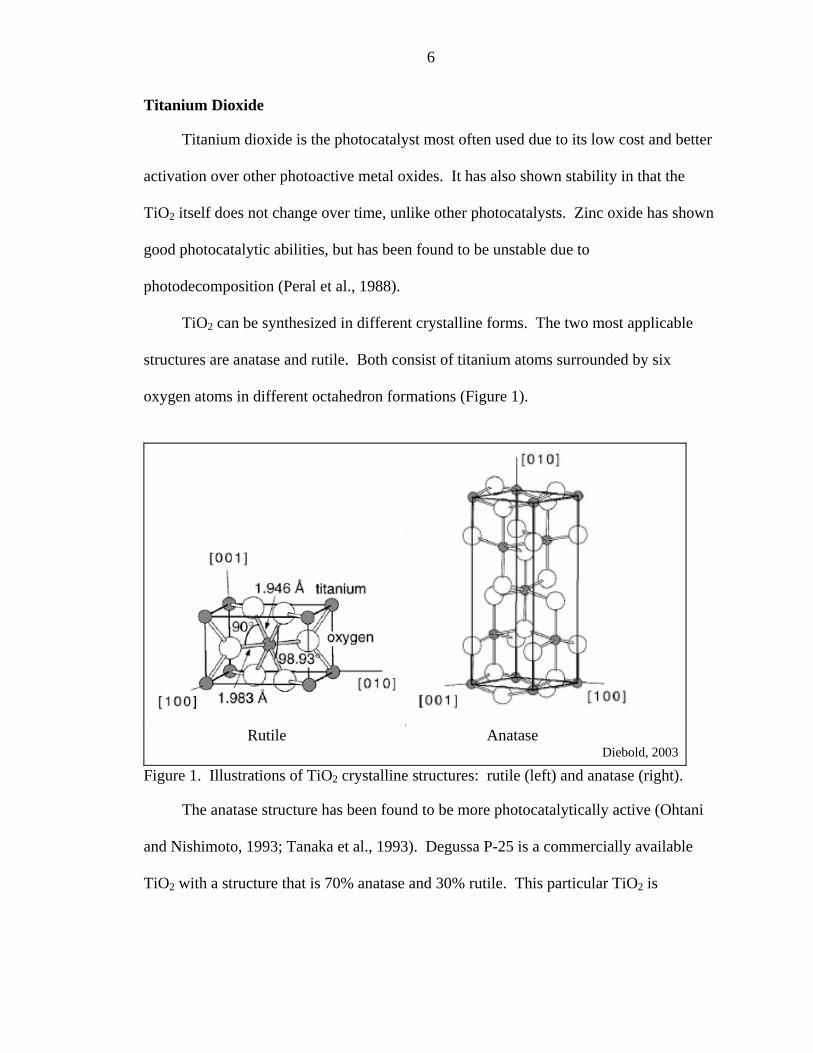
The sol was allowed to mix between 0.5 and 7 hours, depending on the amount of
3% HF used. For the amounts of 2, 3, and 4 mL, approximate mixing times of 7, 2, and
0.5 hours were used, respectively. The liquid was then transferred to 96-well assay plates
and allowed to gel (Figure 3). The assay plates were Fisherbrand, polystyrene plates that
contained 0.45 mL in each well.
Figure 3. Silicaand
Upon rea
trays were capp
volatilizing dur
temperature and
the pellets were
sols doped with titanium dioxide were mixed using magnetic stir plates transferred to 96 well assay plates before forming a gel.
ching the gel point, at which point the sol no longer moved as a liquid, the
ed and wrapped in aluminum foil to prevent any of the contents from
ing the aging process. The gels were aged for 48 hours at room
48 hours at 65ºC in an Oakton Stable Temperature oven. After aging,
removed from the assay plates and transferred into Teflon screw cap jars.

22
Each lid had a small hole to allow the liquid expelled from the gel’s pores to slowly
escape as vapor during the drying process. The drying process involved heating at 103ºC
for 18 hours and 180ºC for 6 hours in a Yamato DVS 400 Drying Oven. The BET
(Brunauer, Emmett, and Teller equation) surface areas and pore volumes of the gels were
analyzed using a Quantachrome NOVA 1200 Gas Sorption Analyzer.
Reactor System
The pellets were packed into a cylindrical reactor (Figure 4). The reactor was
designed with a hollow center and thin annulus to allow the UV lamp to be placed in the
center, providing maximum UV light exposure to the pellets. The inner wall of the
annulus was a quartz tube that could be completely removed, making it simple to remove
the pellets after testing. The lamp in the center of the quartz tube provided UV light at a
wavelength of 365 nm. As measured at the center of the lamp, the intensity was 7.4
mW/cm2 at the inner diameter of the annulus and decreased to 5 mW/cm2 at the outer
diameter. Specifications of the reactor are listed in Table 3. The reactor was enclosed in
a box to provide control over its exposure to ambient light.
Figure 4. Reactor packed with SiO2-TiO2 composites with a UV light through the center.

23
Table 3. Reactor Specifications Specification Value Length of Reactor 19 cm Inner Diameter 2.5 cm Outer Diameter 4.2 cm Empty Bed Volume of Pellets 138.6 mL
The system consisted of the reactor, 6 mm PTFE tubing, a Masterflex L/S Digital
Standard Drive peristaltic pump, and a reservoir of simulated wastewater (Figure 5). The
system was used in two different configurations. One system configuration allowed the
wastewater to pass through the reactor only once, and the other formed a closed loop
system in which the wastewater was recirculated through the reactor. A cover (not
shown in figure 5) was placed over the front of the reactor to completely enclose it during
operation of the system. The reservoir was a one liter flask that was covered with
aluminum foil to prevent any outside UV light exposure and capped with parafilm to
create a closed system.
Figure 5. Treatment system consisting of reactor packed with SiO2-TiO2 composites, UV lamp, pump, and reservoir of simulated wastewater.

24
Simulated Wastewater
The wastewater feed was created using a formula for typical wastewater provided
by Johnson Space Center (JSC). The chemical composition includes the shower waste,
hand wash waste, oral hygiene waste, urine, and urine flush waste that would be expected
from a crew of four people. Table 4 lists the amounts of each constituent present in the
simulated wastewater.
Table 4. Simulated Wastewater Composition Wastewater Component Quantity Pert Plus for Kids 1.2 g Deionized water 999.4 ml Ammonium bicarbonate, NH4HCO3 2726 mg Sodium chloride, NaCl 850 mg Potassium bicarbonate, KHCO3 378 mg Creatinine, C4H7N3O 248 mg Hippuric acid, C9H9NO3 174 mg Potassium dihydrogen phosphate, KH2PO4 173 mg Potassium bisulfate, KHSO4 111 mg Citric acid monohydrate, C6H8O7·H2O 92 mg Tyrosine, C9H11NO3 66 mg Glucuronic acid, C6H10O7 60 mg 1.48N Ammonium hydroxide, NH4OH 10 ml
This formula represents the raw wastewater that would be the influent for the
beginning of the water treatment system; therefore, it would be treated by several
processes before actually becoming the feed for the post-processor. To account for
pretreatment, the simulated wastewater is diluted using 9 mL of the concentrated solution
with 991 mL of deionized water to make each liter of wastewater feed. This creates a
solution of approximately 3 ppm of total organic carbon (TOC), which is within the range
of the TOC concentration expected of the post processor influent (Cambel et al., 2003).
It was found that the wastewater was not stable over long periods of time, particularly at
room temperature. The liquid would change in color, from a cloudy, white mixture to

25
yellow, and the TOC concentration decreased over time. Therefore, a new solution of the
concentrated wastewater was created each week and stored in an amber bottle at 4ºC. A
small fraction of the wastewater was found to be volatile, so the wastewater feed was
mixed for approximately 1 hour before use to allow the volatiles to be removed and the
TOC concentration to stabilize.
Reactor Dynamics
A tracer analysis was conducted to determine the behavior of the reactor. Sodium
chloride was chosen as a tracer because it was not expected to be adsorbed by the media
and had been used successfully as a tracer in a previous study (Holmes, 2002). The
sodium chloride concentration was measured using conductivity measurements read by a
Fisher Scientific conductivity probe. A linear correlation between conductivity and
sodium chloride concentration was observed and used to translate conductivity
measurements to a sodium chloride concentration (Figure 6).
y = 2.589x + 0.7543R2 = 0.9997
0
20
40
60
80
100
120
140
0 20 40NaCl concentration (mg/L)
Con
duct
ivity
(um
ho)
60
Figure 6. Calibration of conductivity meter

26
DI water was pumped through the reactor until a stable conductivity was achieved.
For the tracer analysis, this conductivity was subtracted from effluent readings to
determine the sodium chloride concentration exiting the reactor. The tracer analysis was
performed two ways to provide a duplicate study. First, a solution of 50 mg/L sodium
chloride was pumped through the reactor and the conductivity of the effluent was
monitored until the concentration of the effluent reached 50 mg/L. A second experiment
was conducted in which DI water was pumped through the reactor and the effluent
conductivity was monitored until it indicated that all the sodium chloride had been
washed out of the reactor. The flow rate used for both tests was 10 mL/min.
The data collected from the tracer analysis were used to calculate a mean residence
time and to model the reactor behavior. The mean residence time was determined to be
12.5 minutes. A fractional age distribution (E-curve) of the sodium chloride in the
reactor was created for both reactor tests. This distribution was then compared to that of
the model of continuously stirred tank reactors (CSTRs) in series to determine the
number of tanks in series the reactor behavior was approximately equivalent to (Figures 7
and 8). The E-curve for the CSTR-in-series model was created using Eq. 8.
1
)!1(
−−
⎟⎠⎞
⎜⎝⎛
−=
ntnt
tnt
ntneE Eq. 8
Where n is the number of CSTRs in series, t is the time in the reactor, and tbar is the
mean residence time.
A comparison of the data with the CSTR-in-series model reveals that the reactor
behaves as five CSTRs in series.
27
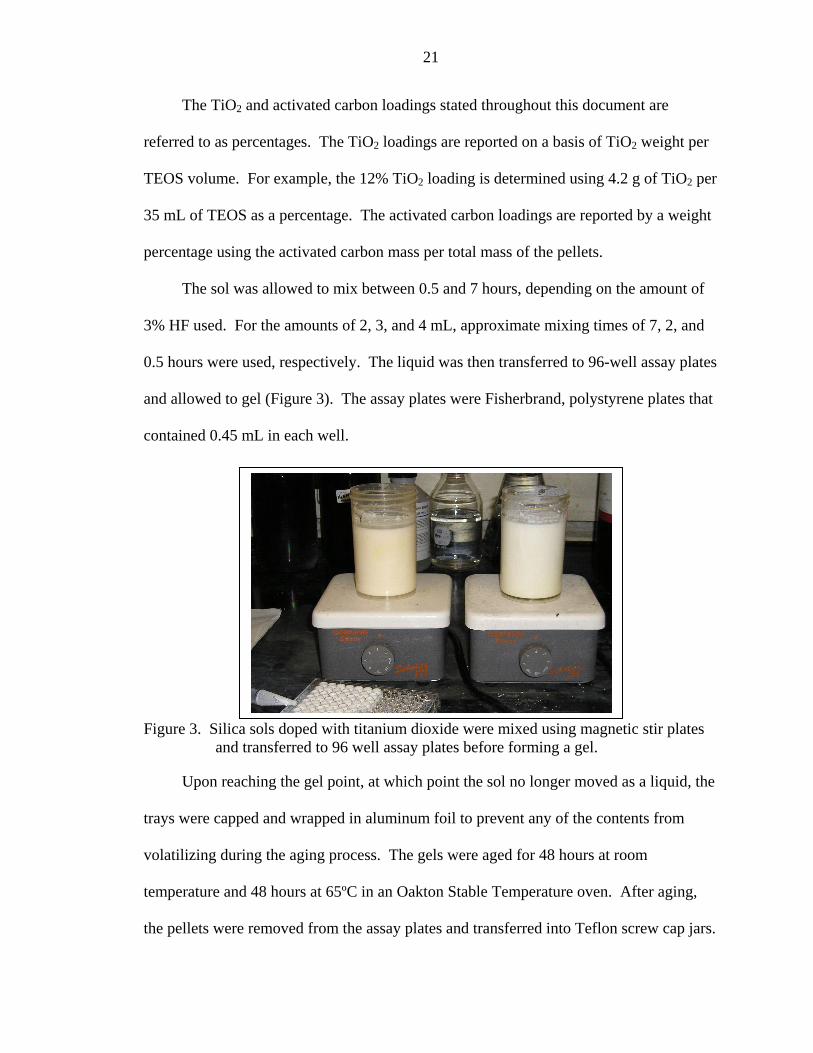
Figure 7. This figure compares the residence time distribution of the reactor as compared to a CSTR-in-series model. Test A was performed by pumping 50 mg/L of NaCl through the reactor until the effluent reached the same concentration.
Residence Time Distribution, Test A
0.000.020.040.060.080.100.120.14
0 10 20 30 40Time (min)
dF/d
t
ActualModel, n =5
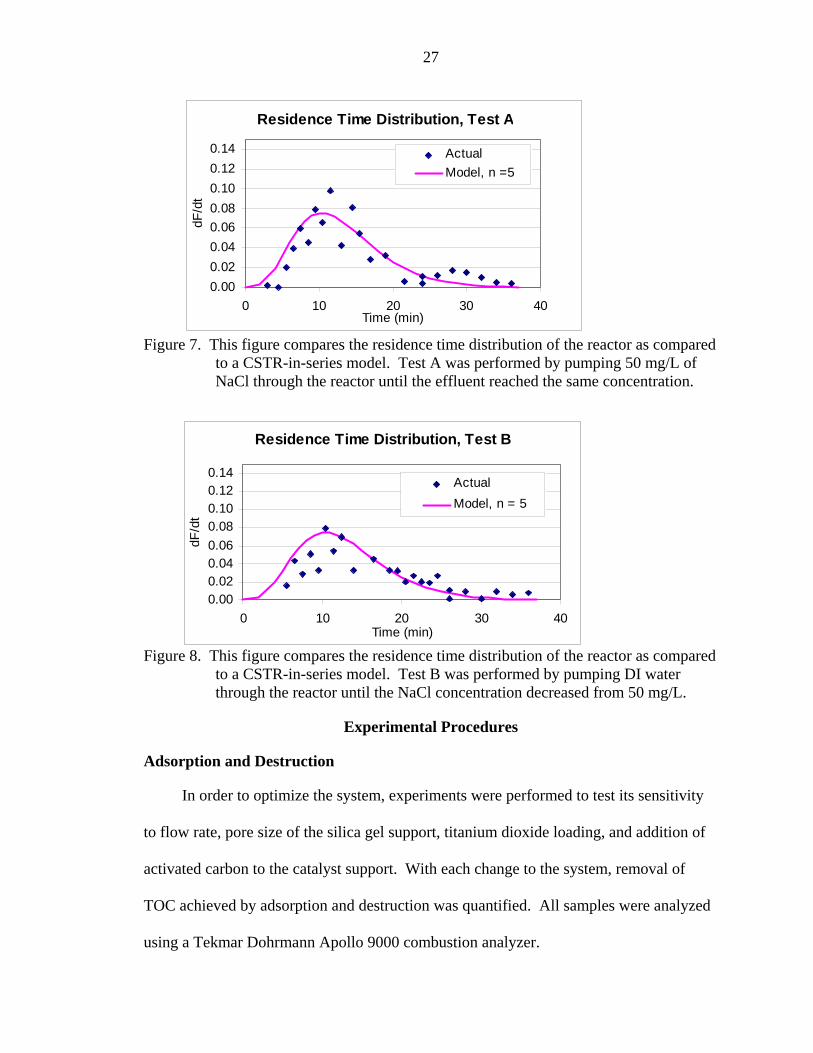
Figure 8. This figure compares the residence time distribution of the reactor as compared to a CSTR-in-series model. Test B was performed by pumping DI water through the reactor until the NaCl concentration decreased from 50 mg/L.
Residence Time Distribution, Test B
0.000.020.040.060.080.100.120.14
0 10 20 30 4Time (min)
dF/d
t
0
ActualModel, n = 5
Experimental Procedures
Adsorption and Destruction
In order to optimize the system, experiments were performed to test its sensitivity
to flow rate, pore size of the silica gel support, titanium dioxide loading, and addition of
activated carbon to the catalyst support. With each change to the system, removal of
TOC achieved by adsorption and destruction was quantified. All samples were analyzed
using a Tekmar Dohrmann Apollo 9000 combustion analyzer.

28
The amount of pellets packed in the reactor was measured by volume as 115 mL in
a 100 mL graduated cylinder and held constant for each experiment. The regeneration
ability and effects of the experiments on the pellets was unknown; therefore, the reactor
was packed with new pellets for each experiment. Because of the acidic properties of the
silica gel, all pellets were pre-washed with a sodium hydroxide solution (pH = 8.5) to
reduce the pH changed caused by the pellets. The pellets were washed until a pH of 4
was reached in the effluent stream.
To study TOC removal by adsorption, wastewater was first pumped through the
reactor in a single-pass configuration, in the dark, until the pellets were exhausted,
meaning that the influent TOC concentration equaled the effluent TOC concentration.
After the adsorption capacity had been reached, the system, including the reactor and
tubing, remained full of 264 mL of wastewater and the reservoir was filled with 1 liter of
wastewater. The wastewater was recirculated and the UV lamp was turned on. Because
the pellets were previously exhausted with respect to TOC adsorption, TOC removal
during this experiment was assumed to be due to destruction. Samples of 25 mL were
taken from the reservoir every few hours until the TOC concentration reached below 500
ppb.
Because the pellets were still acidic, even after a period of washing, the pellets
changed the pH of the wastewater as it flowed through the reactor. For the single pass
adsorption experiments, the pH was decreased from 8 at the influent to 6 at the effluent.
Recirculation of the wastewater for the destruction tests decreased the initial pH of 8 to a
final pH of 4. The pH of the influent and effluent was monitored in all experiments using

29
a Fisher Scientific pH meter and these pH changes remained consistent throughout all the
tests.
Adsorption of Intermediates
Experiments were performed to test the adsorption of the intermediates formed
after UV exposure in the reactor at different empty bed contact times (EBCTs), which is
defined as the time needed for one bed volume of water to pass through the reactor
(calculated using the empty bed volume divided by the flow rate). The pre-washed
pellets in the reactor were first exhausted in the dark. The UV light was then turned on
and the effluent was collected in a reservoir. This experiment was performed at flow
rates of 5, 10, 20, and 30 mL/min. A 1 inch glass tube packed with 65 mL of pre-washed
pellets was used to test the adsorption of the effluent. In each case, the adsorption
experiment was performed at a flow rate of 10 mL/min with a new set of pellets and
conducted immediately following collection of the effluent. A diagram of the apparatus
is shown in Figure 9.
Reactor 1(constant UV)
Destruction at various EBCTs
Reactor 2(no UV)
Adsorption at same EBCT
Wastewater Wastewater and Intermediates
Reactor 1(constant UV)
Destruction at various EBCTs
Reactor 2(no UV)
Adsorption at same EBCT
Wastewater Wastewater and Intermediates
Figure 9. Diagram of the system used to test the adsorption of the intermediates formed from photocatalysis at different EBCTs.
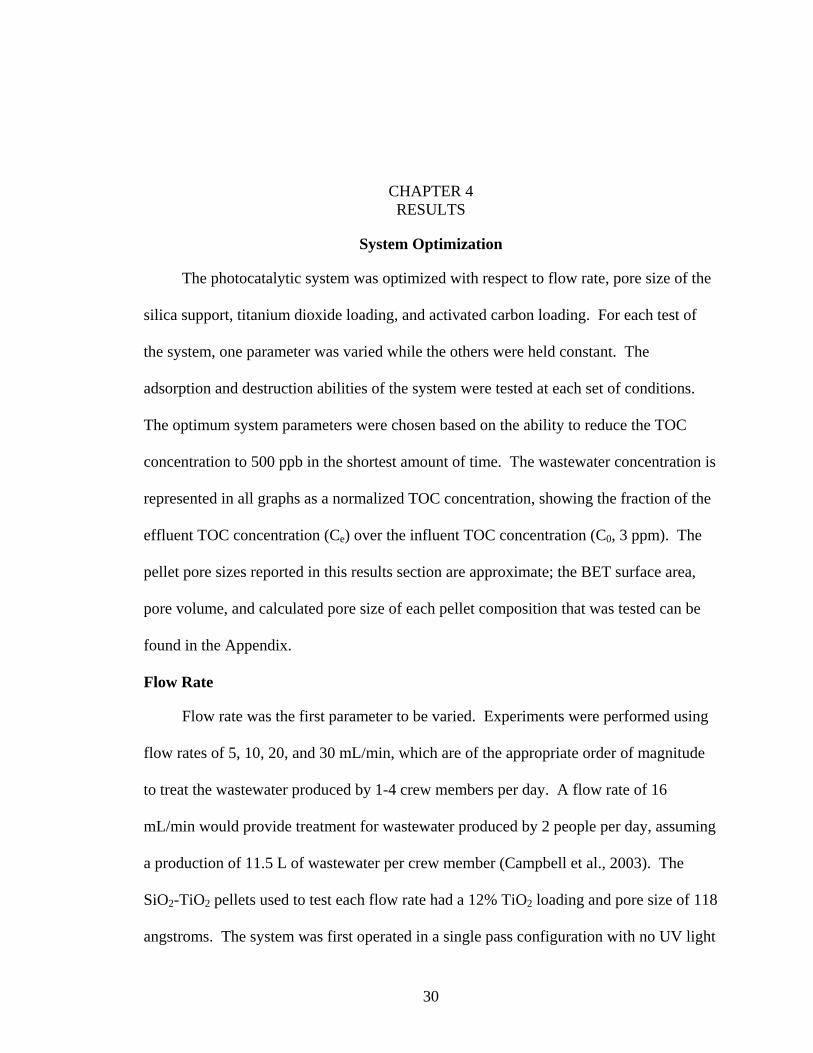
CHAPTER 4 RESULTS
System Optimization
The photocatalytic system was optimized with respect to flow rate, pore size of the
silica support, titanium dioxide loading, and activated carbon loading. For each test of
the system, one parameter was varied while the others were held constant. The
adsorption and destruction abilities of the system were tested at each set of conditions.
The optimum system parameters were chosen based on the ability to reduce the TOC
concentration to 500 ppb in the shortest amount of time. The wastewater concentration is
represented in all graphs as a normalized TOC concentration, showing the fraction of the
effluent TOC concentration (Ce) over the influent TOC concentration (C0, 3 ppm). The
pellet pore sizes reported in this results section are approximate; the BET surface area,
pore volume, and calculated pore size of each pellet composition that was tested can be
found in the Appendix.
Flow Rate
Flow rate was the first parameter to be varied. Experiments were performed using
flow rates of 5, 10, 20, and 30 mL/min, which are of the appropriate order of magnitude
to treat the wastewater produced by 1-4 crew members per day. A flow rate of 16
mL/min would provide treatment for wastewater produced by 2 people per day, assuming
a production of 11.5 L of wastewater per crew member (Campbell et al., 2003). The
SiO2-TiO2 pellets used to test each flow rate had a 12% TiO2 loading and pore size of 118
angstroms. The system was first operated in a single pass configuration with no UV light
30

31
to test the adsorption behavior of the pellets. The results are displayed in Figure 10. The
adsorption curves at each flow rate are compared directly using bed volumes as the
independent variable. Figure 10 shows that lower flow rates lead to lower effluent
concentrations in the first few bed volumes. The lower flow rates create longer EBCTs,
allowing more time for diffusion of the wastewater through the pores of the silica and
then subsequent adsorption. The 5, 10, and 20 mL/min flow rates cause exhaustion of the
pellets after approximately 6 bed volumes, while the pellets tested at the 30 mL/min flow
rate reach exhaustion sooner, at 3 bed volumes.
0.00.10.20.30.40.50.60.70.80.91.0
0.0 2.0 4.0 6.0 8.0 10.0Bed Volumes
Ce/
Co
5 mL/min10 mL/min20 mL/min30 mL/min
Figure 10. TOC removal by adsorption at flow rates of 5, 10, 20, and 30 mL/min, corresponding to EBCTs of 28, 14, 7, and 5.25 minutes and hydraulic loading rates of 0.55, 1.1, 2.2, and 3.3 cm3/cm2-min, respectively.
After the pellets were exhausted, or close to exhaustion, the system was
reconfigured from a single pass to a recirculating mode, with constant UV light exposure
in the reactor. Because the pellets were previously exhausted, it was assumed that TOC
removal during this testing period was due to complete mineralization. Figure 11 shows

32
that the rate of destruction depends on the flow rate, with the 20 mL/min flow rate
reaching below the desired 500 ppb in the shortest amount of time. Despite the fact that
the pellets tested at 5 mL/min were not entirely exhausted, meaning that some of the
removal during the destruction period could be due to adsorption, the destruction test
conducted at 5 mL/min required the longest time to reach 500 ppb. This is surprising,
since the slower flow rates are shown to allow more time for the contaminants to adsorb,
and increased adsorption was expected to lead to increased destruction.
0.0
0.1
0.2
0.3
0.4
0.5
0.6
0.7
0.8
0.9
1.0
0 5 10 15 20 25
Time (hours)
Ce/
Co
5 mL/min10 mL/min20 mL/min30 mL/min500 ppb
Figure 11. TOC removal by destruction in a recirculating system at flow rates of 5, 10, 20, and 30 mL/min, corresponding to EBCTs of 28, 14, 7, and 5.25 minutes and hydraulic loading rates of 0.55, 1.1, 2.2, and 3.3 cm3/cm2-min, respectively.
It is important to realize that the recirculation means that the total time the
wastewater is in the reactor is approximately equal, regardless of the flow rate. For
example, at a flow rate of 20 mL/min, the wastewater might pass through the reactor 4
times as fast compared to a 5 mL/min flow rate, but it would also experience 4 times as
33
many passes. Therefore, one of the differences between the flow rates is that the
wastewater spends intermittent time in the reactor at the higher flow rates compared to
longer, continuous passes through the reactor at slower flow rates. It is possible that
different intermediates, or quantity of intermediates, are created at different EBCTs,
which could change the adsorption of the wastewater after the first pass through the
reactor.
In order to test the adsorption of the intermediate wastewater (i.e., wastewater and
intermediates created after contact with the irradiated SiO2-TiO2 composites), the
wastewater was first passed through the reactor with constant UV light at a certain
EBCT. Then, the effluent from the first reactor was passed through a second reactor,
which was in the dark, to test for adsorption of these intermediates. The EBCT of the
first reactor was varied to create effluents equivalent to that after a single pass through
the reactor at the flow rates used during the recirculating destruction test. The EBCT in
the second reactor was held constant so that the adsorption of the various wastewater
effluents could be directly compared. Figure 12 presents the adsorption curves for the
intermediate wastewater created from the single pass through the second reactor. The
data show no difference in the adsorption of the wastewater after passing through the
reactor at different EBCTs. Therefore, the better performance at 20 mL/min shown in
Figure 11 did not result from the formation of intermediates that were more adsorbable.
A second hypothesis based on diffusion of the wastewater was formulated to
explain the variation in the destruction rates as the flow rate was changed. The rate of
destruction depends on the ability of the contaminants to reach the titanium dioxide in the
porous surface of the pellets and the ability of the products resulting from the oxidation

34
reactions to travel out of the pores. It is possible that the higher flow rates increase the
diffusion of the molecules in and out of the pellets. The transport of the wastewater
contaminants and the photocatalysis products in and out of the pellets’ pores depends on
several steps. These steps include transport through the bulk solution, transport through
the film layer formed by stationary water surrounding the pellet, and travel through the
pores. Higher flow rates decrease the film layer surrounding the pellet; thus, decreasing
the distance the molecules must diffuse to approach the pellet surface. While higher flow
rates were shown to have a negative impact on adsorption behavior in a single pass
system, the impact of higher flow rates on the adsorption behavior of intermediate
products as well as the transport of final products out of the pores and into the bulk
solution is unknown.
0.0
0.2
0.4
0.6
0.8
1.0
1.2
0 20 40 60 80 100Time (min)
Ce/
Co
5.25 min EBCT28 min EBCT14 min EBCT7 min EBCT
Figure 12. TOC removal by adsorption of wastewater effluents resulting from destruction at various EBCTs.

35
In order to test the hypothesis of diffusion being a limiting factor in the system,
pellets of the same composition but approximately half the size (smaller diameter, same
length) were tested using a flow rate of 20 mL/min. If diffusion were a limiting factor,
the expectation was that the smaller pellets would increase the bulk surface area and
decrease the distance a contaminant must travel inside the pellet, leading to a faster
destruction rate. The results presented in Figures 13 and 14 show that the smaller pellets
performed worse than the original size pellets. These data indicate that diffusion is not
the limiting factor controlling the destruction rate. It is possible that changing the size of
the pellets also changed another system parameter, such as the light penetration or the
hydraulic flow through the reactor, which decreased the destruction rate of the system.
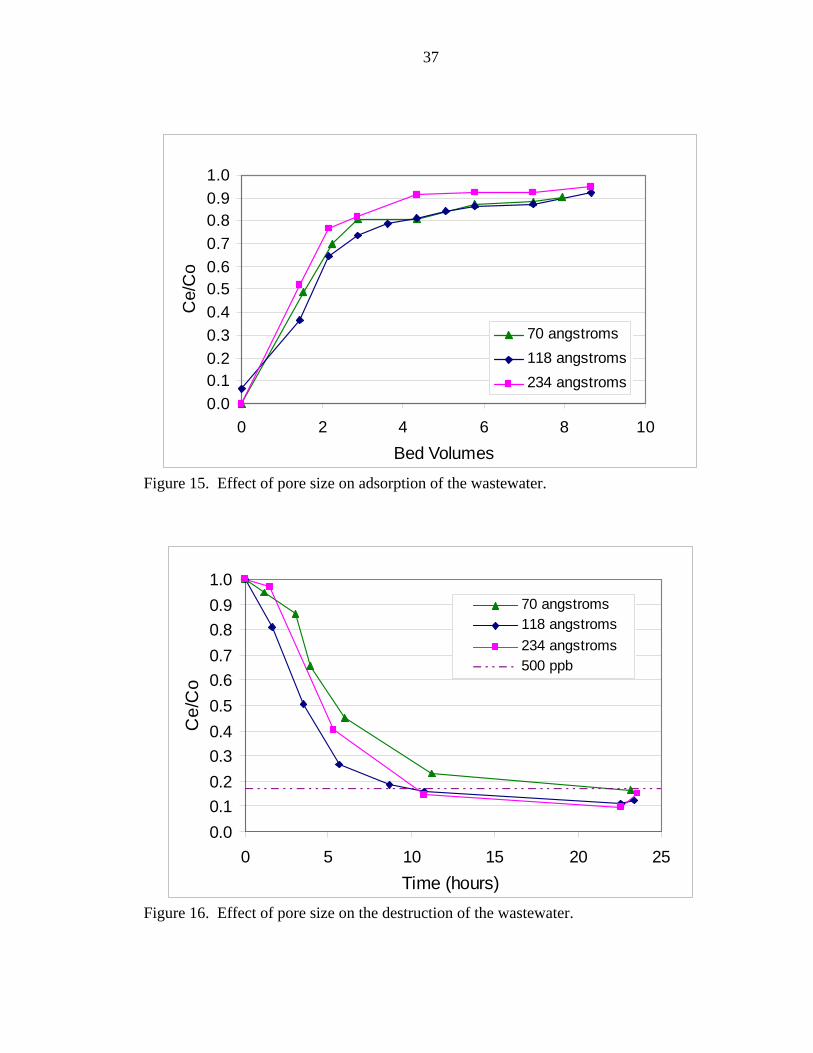
Pore Size
Using the optimum flow rate of 20 mL/min and the same 12% TiO2 loading, the
pore size was varied to determine its effect on the adsorption and destruction capabilities
of the system. Figure 15 shows the adsorption curves for three different pore sizes: 70,
118, and 234 angstroms.
The surface area of the gels decreased with increasing pore size. The 234 angstrom
gel, with the lowest surface area, exhibited the worst adsorption, exhausting at 4 bed
volumes. All the curves show exhaustion of the pellets by 8 bed volumes, indicating that
only a small amount of adsorption is occurring with any of the three pore sizes. This is
not unexpected since the surface of the silica gel is hydrophilic, and the contaminants
being adsorbed are hydrophobic. In addition, the adsorption is occurring at a pH of 6,
which is well above silica’s isoelectric point of 2-3; therefore, the surface of the silica is
likely to be negatively charged. The main ingredient in the wastewater is soap, which is
an anionic surfactant, and some of the other organics are carboxylic acids, which will also

36
form anions when dissociated. Charge repulsion could also be a reason for the low
adsorption.
0.00.10.20.30.40.50.60.70.80.91.0
0 2 4 6 8 10
Bed Volumes
Ce/
Co
3mm x 6mm Pellets
4mm x 6mm Pellets
Figure 13. Effect of pellet size on adsorption of the wastewater.
0.00.10.20.30.40.50.60.70.80.91.0
0 5 10 15 20 25
Time (hours)
Ce/
Co
3mm x 6mm Pellets
4mm x 6mm Pellets
Figure 14. Effect of pellet size on destruction of the wastewater.
37
0.00.10.20.30.40.50.60.70.80.91.0
0 2 4 6 8 10Bed Volumes
Ce/
Co
70 angstroms118 angstroms234 angstroms
Figure 15. Effect of pore size on adsorption of the wastewater.
0.00.10.20.30.40.50.60.70.80.91.0
0 5 10 15 20 25Time (hours)
Ce/
Co
70 angstroms118 angstroms234 angstroms500 ppb
Figure 16. Effect of pore size on the destruction of the wastewater.
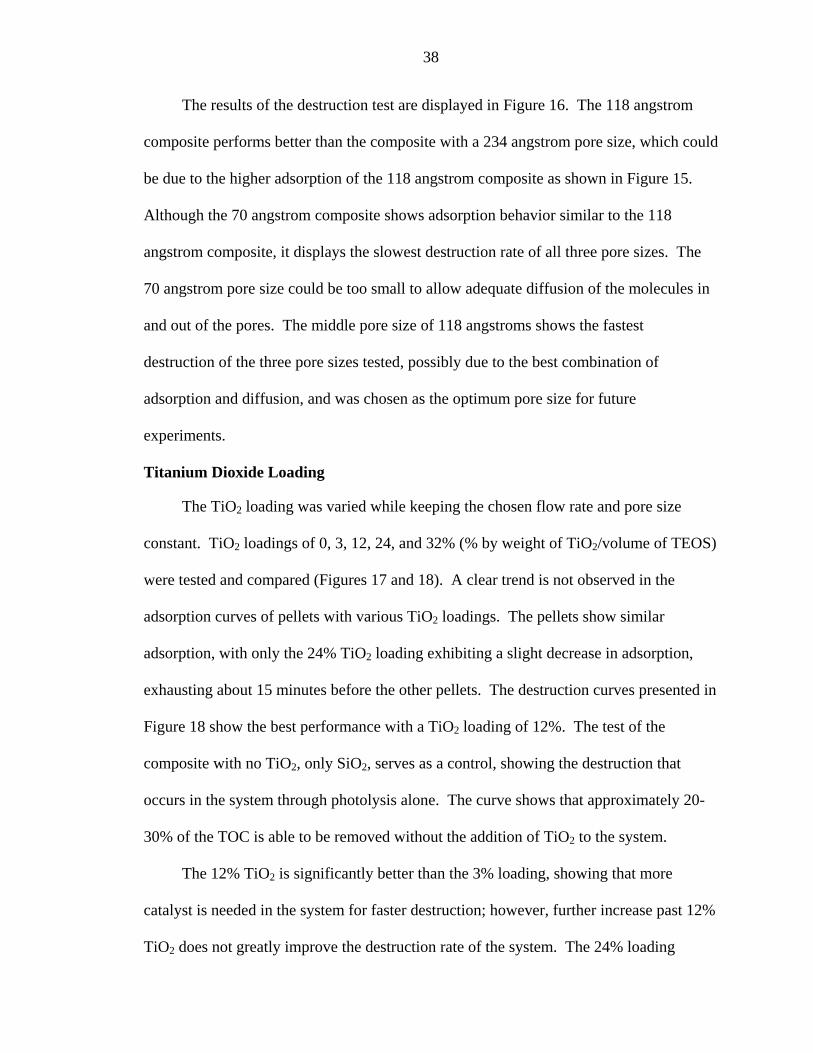
38
The results of the destruction test are displayed in Figure 16. The 118 angstrom
composite performs better than the composite with a 234 angstrom pore size, which could
be due to the higher adsorption of the 118 angstrom composite as shown in Figure 15.
Although the 70 angstrom composite shows adsorption behavior similar to the 118
angstrom composite, it displays the slowest destruction rate of all three pore sizes. The
70 angstrom pore size could be too small to allow adequate diffusion of the molecules in
and out of the pores. The middle pore size of 118 angstroms shows the fastest
destruction of the three pore sizes tested, possibly due to the best combination of
adsorption and diffusion, and was chosen as the optimum pore size for future
experiments.
Titanium Dioxide Loading
The TiO2 loading was varied while keeping the chosen flow rate and pore size
constant. TiO2 loadings of 0, 3, 12, 24, and 32% (% by weight of TiO2/volume of TEOS)
were tested and compared (Figures 17 and 18). A clear trend is not observed in the
adsorption curves of pellets with various TiO2 loadings. The pellets show similar
adsorption, with only the 24% TiO2 loading exhibiting a slight decrease in adsorption,
exhausting about 15 minutes before the other pellets. The destruction curves presented in
Figure 18 show the best performance with a TiO2 loading of 12%. The test of the
composite with no TiO2, only SiO2, serves as a control, showing the destruction that
occurs in the system through photolysis alone. The curve shows that approximately 20-
30% of the TOC is able to be removed without the addition of TiO2 to the system.
The 12% TiO2 is significantly better than the 3% loading, showing that more
catalyst is needed in the system for faster destruction; however, further increase past 12%
TiO2 does not greatly improve the destruction rate of the system. The 24% loading

39
0.00.10.20.30.40.50.60.70.80.91.0
0 10 20 30 40 50 60 70
Time (minutes)
Ce/
Co
No TiO2
3% TiO2
12% TiO2
24% TiO2
32% TiO2
Figure 17. Effect of TiO2 loading on adsorption of the wastewater.
0.00.10.20.30.40.50.60.70.80.91.0
0 5 10 15 20 25Time (hours)
Ce/
Co
No TiO2 3% TiO212% TiO2 24% TiO232% TiO2 500 ppb
Figure 18. Effect of TiO2 loading on destruction of the wastewater.

40
actually exhibits slower degradation, and the 32% loading decreased the TOC
concentration to 500 ppb about an hour sooner than the 12% loading. It is possible that
there is a limit to the amount of TiO2 that can be effectively dispersed near the surface of
the silica gel, and at higher loadings the TiO2 will agglomerate and some of the TiO2 will
be blocked from the UV light. The 32% TiO2 pellet shows that the addition of more TiO2
can lead to better performance; however, 2.5 times the amount of TiO2 in the 12% TiO2
composite was required to decrease the destruction time by approximately 20%. Because
this level of improvement in the destruction rate does not justify such a large increase in
TiO2 loading, the 12% TiO2 loading was chosen as the optimum TiO2 loading.
Activated Carbon Loading
Activated carbon was added to the SiO2-TiO2 pellets to explore its effect on the
performance of the system. It was expected that the adsorption of the organic
contaminants would increase, but it was difficult to predict the effects on the system’s
destruction abilities. The increased adsorption could enhance the destruction rate, but the
activated carbon could also have a negative impact on the system by blocking the UV
light needed to activate the catalyst. In order to find the optimum activated carbon
loading that increased adsorption without blocking too much UV light, several different
activated carbon loadings were tested at two different TiO2 loadings of 12% and 24%.
The increase in adsorption with the addition of activated carbon to pellets of 24% TiO2 is
illustrated in Figure 19. The time needed to exhaust the pellets doubles with even the
lowest activated carbon loading, 1.3wt%.
The destruction performance of the pellets containing activated carbon is compared
to pellets without any carbon in Figure 20. It is interesting to find that in the two lowest
carbon loadings, 1.3wt% and 2.6wt%, the carbon addition had no impact on the time

41
needed to reach the 500 ppb TOC limit. At the higher loading of 3.9wt%, the carbon
begins to negatively impact the destruction rate, most likely due to blocking of UV light
needed to activate the catalyst.
Because practical operation of the system would involve exhaustion of the carbon
in the dark, destruction of the organics under constant UV, and then repeating, the cycle,
it was important to test the ability of the activated carbon to be used again. For this
reason, an additional adsorption test was conducted after the usual adsorption and
destruction cycle. The second adsorption cycle showed complete regeneration for the
1.3% and 3.9% activated carbon loadings (Figures 21 and 22). Regeneration was not
tested for the 2.6% carbon loading.
The effect of activated carbon addition was also tested with a 12% TiO2 loading. A
higher carbon loading of 9.6wt% was explored, and the results are shown in Figures 23
and 24. It is clear that the 9.6wt% greatly increases the adsorption of the organic
contaminants. After more than 6 hours, the system was not yet exhausted. The
destruction test shows that the carbon does inhibit the destruction rate, though the
concentration still reaches the necessary 500 ppb level.
Because the carbon was exhausted only to a Ce/C0 ratio of 0.6, it is possible that the
some of the removal shown in Figure 24 was due to adsorption. A second adsorption
experiment was conducted after the destruction cycle to determine if the carbon had been
regenerated. Figure 25 shows complete regeneration of the carbon. The regeneration
displayed in Figure 25 indicates that destruction was also occurring, and enough of the
organic contaminants were destroyed to clean the surface of the activated carbon.

42
0.00.10.20.30.40.50.60.70.80.91.0
0 50 100 150 200
Time (min)
Ce/
Co
24% TiO2, No C24% TiO2, 1.3wt% AC24% TiO2, 2.6wt% AC24% TiO2, 3.9wt% AC
Figure 19. Effect of activated carbon addition to the adsorption properties of the pellets.
0.00.10.20.30.40.50.60.70.80.91.0
0 5 10 15 20 25 30
Time (hours)
Ce/
Co
24% TiO2, No C24% TiO2, 1.3wt% AC24% TiO2, 2.6wt% AC24% TiO2, 3.9wt% AC500 ppb
Figure 20. Effect of activated carbon loading on the destruction performance of the pellets.

43
0.0
0.2
0.4
0.6
0.8
1.0
1.2
0 50 100 150 200
Time (min)
Ce/
Co
Ads1Ads2
Figure 21. Comparison of the first adsorption cycle (ads1) to the adsorption of the pellets after the destruction cycle (ads2), using pellets of 24% TiO2 loading, 118 angstroms, and 1.3wt% activated carbon loading.
0.00.10.20.30.40.50.60.70.80.9
0 50 100 150 200
Time (min)
Ce/
Co
Ads1
Ads2
Figure 22. Comparison of the first adsorption cycle (ads1) to the adsorption fo the pellets after the destruction cycle (ads2), using pellets of 24% TiO2 loading, 118 angstroms, and 3.9wt% activated carbon loading.

44
Similar to the trend in the 3.9wt% carbon loading in Figure 20, the destruction
curve for the 9.6wt% carbon shows an increase in the TOC concentration to a Ce/C0 ratio
of 0.3 just before decreasing to 500 ppb. It is possible that this phenomenon seen in the
destruction tests of the highest activated carbon loadings could be due to desorption of
the organics from the carbon. Because the destruction cycle is performed following
exhaustion of the pellets, the pellets with higher activated carbon loadings have more
organic contaminants contained in the pores at the start of the destruction test. It is
possible that as the TOC concentration of the contaminants in solution decreases to a
certain level, some of the contaminants held within the pores desorb into solution before
becoming completely mineralized.
The advantage of the activated carbon addition is the increase in the adsorption
cycle with the ability to regenerate the carbon surface, meaning that the system could be
operated in repeated cycles of adsorption and destruction. The increased adsorption
properties allow longer periods in the absence of UV light, which decreases the energy
requirements of the system. When considering this type of system operation, the 2.6wt%
exhibits the most potential compared to the other activated carbon loadings that were
tested. Although the 3.9% and 9.6% loadings were shown to require the longest times to
reach exhaustion, creating longer dark periods, the destruction periods were lengthened
by more then double, increasing the time requiring the presence of UV light by about 15
hours. The destruction period was the same for the composites containing zero, 1.3%,
and 2.6% activated carbon loading. Of these three composite compositions, the
composite containing 2.6% carbon is the best choice because it exhibited the longest
period of adsorption.
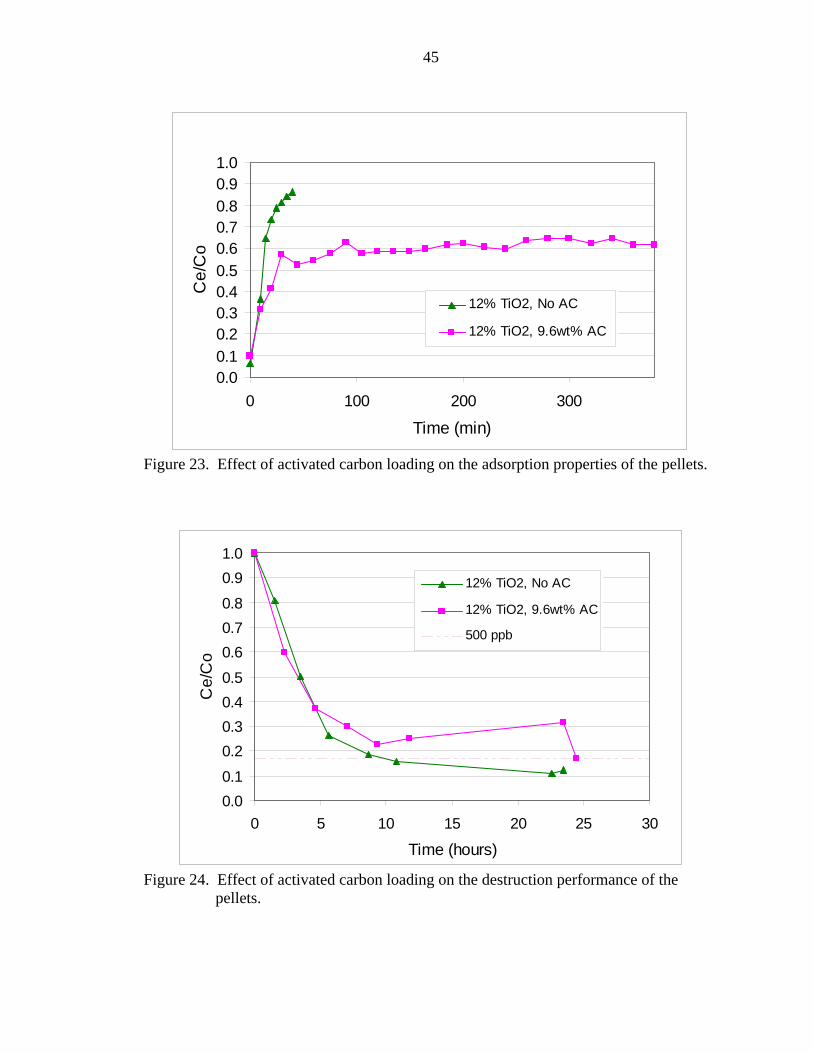
45
0.00.10.20.30.40.50.60.70.80.91.0
0 100 200 300
Time (min)
Ce/
Co
12% TiO2, No AC
12% TiO2, 9.6wt% AC
Figure 23. Effect of activated carbon loading on the adsorption properties of the pellets.
0.00.1
0.20.30.40.5
0.60.70.8
0.91.0
0 5 10 15 20 25 30
Time (hours)
Ce/
Co
12% TiO2, No AC
12% TiO2, 9.6wt% AC
500 ppb
Figure 24. Effect of activated carbon loading on the destruction performance of the pellets.

46
0.0
0.1
0.2
0.3
0.4
0.5
0.6
0.7
0.8
0.9
1.0
0 100 200 300 400
Time (min)
Ce/
Co
Ads1Ads2
Figure 25. Comparison of the first adsorption cycle (ads1) to the adsorption of the pellets after the destruction cycle (ads2), using pellets of 12% TiO2 loading, 118 angstroms, and 9.6wt% activated carbon loading.
Kinetics
The rate constants for the destruction performance at each set of system conditions
were calculated using LH kinetics. It was assumed that the concentration was low
enough to reduce the LH equation to a first order reaction, although no experiments were
performed to verify first order behavior. Using the number of CSTRs in series, n,
determined through the tracer analysis to be 5, and assuming a first order reaction, the
equation for the effluent concentration at any particular time, t, is described by the
following equation:
n
e nktCC
−
⎟⎠⎞
⎜⎝⎛ += 10 Eq. 9
where k is the rate constant. In this discussion, the k values that are calculated
describe the destruction behavior of the photocatalytic system and represent the product

47
of the rate constant and the equilibrium adsorption constant, or the kK term shown in the
reduced LH equation (Eq. 3).
The time each plug of wastewater spent in the reactor was estimated for use in Eq.
9. This time was calculated from the time at which the destruction curve crossed the 500
ppb threshold. The k constants resulting from these calculations are shown in Table 5.
The rate constants quantify the optimum choice for each system property: 20 ml/min flow
rate, 118 angstrom pore size, and 12% TiO2 loading. For the TiO2 loading, the 32%
loading actually provides the highest destruction rate, but it is only slightly higher than
the 12% loading. Because the 32% loading requires 2.5 times the weight of TiO2 in the
system to reach the higher destruction rate, the 12% TiO2 loading is considered optimum.
The rate constants for the composites containing activated carbon are also
displayed in Table 5. Because the composites containing activated carbon have a higher
adsorption capacity than composites without activated carbon, more organic carbon will
be held in the pores of the composite at the of the adsorption period. This increase in the
amount of organic carbon contained within the composite signifies a higher quantity of
TOC in the system at the start of the destruction period. It is important to consider the
additional organic carbon that was photocatalytically degraded as well as the longer dark
adsorption periods when comparing the kinetics of the composites containing activated
carbon. The 2.6% activated carbon composite shows the same rate constant as the
composite with a lower activated carbon loading, but it would allow for a longer dark
adsorption period; therefore, the 2.6% activated carbon loading is considered the best
choice out of the activated carbon loadings that were tested.

48
Table 5. Rate Constants for TOC Mineralization to 500 ppb Flow Rate (mL/min) Avg. Time in Reactor
(min) k (min-1)
5 128.8 0.017 20 56.4 0.038 30 143.4 0.015
Pore Size (angstroms) 60 133.5 0.016 140 56.4 0.038 320 59.3 0.036
Titanium Dioxide Loading (%) 3 >148.3 <0.014 12 56.4 0.038 24 62.3 0.034 32 47.5 0.045
Activated Carbon Loading (%) 1.3% (24% TiO2) 62.3 0.034 2.6% (24% TiO2) 83.1 0.034 3.9% (24% TiO2) 148.3 0.014 9.6% (12% TiO2) 148.3 0.014

CHAPTER 5 SUMMARY AND CONCLUSION
SiO2-TiO2 composites were tested for their ability to photocatalytically degrade the
organic contaminants in gray water. The composites were tested in a packed-bed reactor,
and the system was optimized with respect to flow rate, TiO2 loading, and pore size of the
SiO2-TiO2 composite. Activated carbon was also added to the composites and the effect
on the performance of the system was investigated.
The SiO2-TiO2 composites were successful in photocatalytically degrading the gray
water influent in a recirculating system to a TOC concentration below the 500 ppb
maximum limit. The optimum pore size and TiO2 loading were found to be 118
angstroms and 12% (wt/vol), respectively. The system performed best when operated at
a flow rate of 20 mL/min. Activated carbon was found to be capable of improving the
overall system performance through increased adsorption, which decreases the energy
requirements of the system.
It was hypothesized that increasing the adsorption of the SiO2-TiO2 composites
would increase the destruction rate of the system. Adsorption was shown to be an
important system parameter, but increasing adsorption did not always lead to a better
destruction rate. The performances of the 234 angstrom composite and the 30 mL/min
flow rate condition illustrate situations where adsorption became a limiting factor and the
decreased adsorption led to slower destruction. However, adsorption was not always the
limiting factor. Adsorption was increased by lowering the flow rate to 5 mL/min and by
adding activated carbon. In each of these cases, other factors, such as UV light exposure,
49

50
were affected and the destruction rate did not improve. Adsorption is one of several
factors that must be considered in order to optimize the system performance.
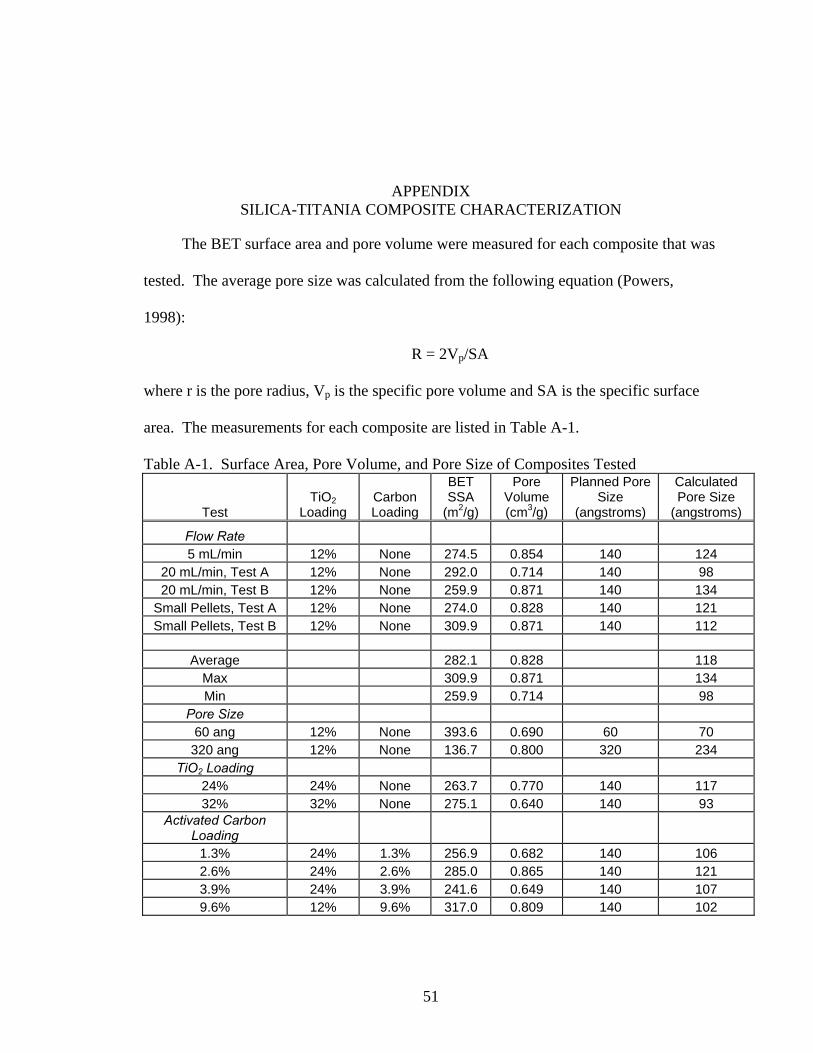
APPENDIX SILICA-TITANIA COMPOSITE CHARACTERIZATION
The BET surface area and pore volume were measured for each composite that was
tested. The average pore size was calculated from the following equation (Powers,
1998):
R = 2Vp/SA
where r is the pore radius, Vp is the specific pore volume and SA is the specific surface
area. The measurements for each composite are listed in Table A-1.
Table A-1. Surface Area, Pore Volume, and Pore Size of Composites Tested
Test TiO2
Loading Carbon Loading
BET SSA
(m2/g)
Pore Volume (cm3/g)
Planned Pore Size
(angstroms)
Calculated Pore Size
(angstroms)
Flow Rate 5 mL/min 12% None 274.5 0.854 140 124
20 mL/min, Test A 12% None 292.0 0.714 140 98 20 mL/min, Test B 12% None 259.9 0.871 140 134
Small Pellets, Test A 12% None 274.0 0.828 140 121 Small Pellets, Test B 12% None 309.9 0.871 140 112
Average 282.1 0.828 118
Max 309.9 0.871 134 Min 259.9 0.714 98
Pore Size 60 ang 12% None 393.6 0.690 60 70 320 ang 12% None 136.7 0.800 320 234
TiO2 Loading 24% 24% None 263.7 0.770 140 117 32% 32% None 275.1 0.640 140 93
Activated Carbon Loading
1.3% 24% 1.3% 256.9 0.682 140 106 2.6% 24% 2.6% 285.0 0.865 140 121 3.9% 24% 3.9% 241.6 0.649 140 107 9.6% 12% 9.6% 317.0 0.809 140 102
51

LIST OF REFERENCES
Al-Ekabi H, Serpone N. Kinetic studies in heterogeneous photocatalysis. 1. Photocatalytic degradation of chlorinated phenols in aerated aqueous solutions over TiO2 supported on a glass matrix. Journal of Physical Chemistry, 1988, 92, 5726-5731.
Al-Ekabi H, Serpone N. Kinetic studies in heterogeneous photocatalysis. 2. TiO2-Mediated degradation of 4-chlorophenol alone and in a three-component mixture of 4-chlorophenol, 2, 4-dichlorophenol, and 2,4,5-trichlorophenol in air-equilibrated aqueous media. Langmuir, 1989, 5, 250-255.
Anderson C, Bard A. An improved photocatalyst of TiO2/SiO2 prepared by a sol-gel synthesis. Journal of Physical Chemistry, 1995, 99, 9882-9885.
Anderson C, Bard A. Improved photocatalytic activity and characterization of mixed TiO2/SiO2 and TiO2/AlO3 materials. Journal of Physical Chemistry B, 1997, 101, 2611-2616.
Campbell M, Finger B, Verostko C, Wines K, Pariani G, Pickering K. Integrated Water Recovery System Test. International Conference on Environmental Systems, July, 2003.
Cheong H, Kang K, Rhee H. Preparation of titanium-containing carbon silica composite catalysts and their liquid-phase epoxidation activity. Catalysis Letters, 2003, 86, 1-3, 145-149.
Crittenden J, Suri R, Perram D, Hand D. Decontamination of water using adsorption and photocatalysis. Water Research, 1997, 31, 3, 411-418.
Deng X, Yue Y, Gao Z. New carbon-silica composite adsorbents from elutrilithe. Journal of Colloid and Interface Science, 1998, 206, 52-57.
Diebold U. The surface science of titanium dioxide. Surface Science Reports, 2003, 48, 53-229.
Ding Z, Hu X, Yue P, Lu G, Greenfield P. Synthesis of anatase TiO2 supported on porous solids by chemical vapor deposition. Catalysis Today, 2001, 68, 173-182.
El Shafei G. Silica surface chemical properties. Adsorption on Silica Surfaces. E. Papirer, Ed. Surfactant Science Series, 2000, 90, 35-61.
52

53
Gao X, Wachs I. Titania-silica as catalysts: molecular structural characteristics and physico-chemical properties. Catalysis Today, 1999, 51, 233-254.
Gomes da Silva C, Faria JL. Photochemical and photocatalytic degradation of an azo dye in aqueous solution by UV irradiation. Journal of Photochemistry and Photobiology A: Chemistry, 2003, 155, 133-143.
Hench L, West J. The sol-gel process. Chemical Review, 1990, 90, 33-72.
Herrmann JM, Matos J, Disdier J, Guillard C, Laine J, Malato S, Blanco J. Solar photocatalytic degradation of 4-chlorophenol using the synergistic effect between titania and activated carbon in aqueous suspension. Catalysis Today, 1999, 54, 255-265.
Hoffmann M, Martin S, Choi W, Bahnemann D. Environmental applications of semiconductor photocatalysis. Chemical Review, 1995, 69-96.
Holmes F. The performance of a reactor using photocatalysis to degrade a mixture of organic contaminants in aqueous solution. Master’s Thesis, University of Florida, 2003.
Icenhower J, Dove P. Water behavior at silica surfaces. Adsorption on Silica Surfaces. E. Papirer, Ed. Surfactant Science Series, 2000, 90, 280.
Khan A. Titanium dioxide coated activated carbon: A regenerative technology for water recovery. Master’s Thesis, University of Florida, 2003.
Kirk R, Othmer D. Sol-gel technology. Kirk-Othmer Encyclopedia of Chemical Technology, 4th Ed. J. Kroschwitz, M Howe-Grant, Eds. New York: Wiley, 1991, 22, 497.
Lange KE, Lin CH. Advanced Life Support Program: Requirements Definition and Design considerations. Document #CTSD-ADV-245 (REV A) presented for the Crew and Thermal Systems Division in Houston, TX.
Liu T, Cheng T. Effects of SiO2 on the catalytic properties of TiO2 for the incineration of chloroform. Catalysis Today, 1995, 26, 71-77.
Londeree D. Silica-titania composites for water treatment. Master’s Thesis, University of Florida, 2002.
Lu M, Chen J, Chang K. Effect of adsorbents coated with titanium dioxide on the photocatalytic degradation of propoxur. Chemosphere, 1999, 38, 3, 617-627.
Matos J, Laine J, Herrmann JM. Synergy effect in the photocatalytic degradation of phenol on a suspended mixture of titania and activated carbon. Applied Catalysis B: Environmental 1998, 18, 281-291.
54
Matos J, Laine J, Herrmann JM. Effect of the type of activated carbons on the photocatalytic degradation of aqueous organic pollutants by UV-irradiated titania. Journal of Catalysis, 2001, 200, 10-20.
Matthews R. Photooxidation of organic impurities in water using thin films of titanium dioxide. Journal of Physical Chemistry, 1987, 91, 3328-3333.
Matthews R. An adsorption water purifier with in situ photocatalytic regeneration. Journal of Catalysis, 1988, 113, 549-555.
Matthews R. Photocatalysis in water purification: Possibilities, problems and prospects. Photocatalytic Purification and Treatment of Water and Air, 1993, 121.
Minero C, Catozzo F, Pelizzetti E. Role of adsorption in photocatalyzed reactions of organic molecules in aqueous TiO2 suspensions. Langmuir, 1992, 8, 481-486.
Nagaoka S, Hamasaki Y, Ishihara S, Nagata M, Iio K, Nagasawa C, Ihara H. Preparation of carbon/TiO2 microsphere composites from cellulose/TiO2 microsphere composites and their evaluation. Journal of Molecular Catalysis A: Chemical, 2002, 177, 255-263.
Ohtani B, Nishimoto S. Effect of surface adsorption of aliphatic alcohols and silver ion on the photocatalytic activity of TiO2 suspended in aqueous solutions. Journal of Physical Chemistry, 1993, 97, 920-926.
Orcel G. The chemistry of silica sol-gel. Ph.D. Dissertation. University of Florida, Gainesville, Fl, 1987.
Peral J, Casado J, Domenech J. Light-induced oxidation of phenol over ZnO powder. Journal of Photochemistry and Photobiology A: Chemistry, 1988, 44, 209-217.
Powers K. The development and characterization of sol gel substrates for chemical and optical applications. Ph.D. Dissertation. University of Florida, Gainesville, FL, 1998.
Serpone N. Brief introductory remarks on heterogeneous photocatalysis. Solar Energy Material and Solar Cells, 1995, 38, 369-379.
Skubiszewska-Zieba J, Charmas B, Leboda R, Staszczuk P, Kowalczyk P, Oleszczuk P. Effect of hydrothermal modification on the porous structure and thermal properties of carbon-silica adsorbents (carbosils). Materials Chemistry and Physics, 2002, 78, 486-494.
Tanaka K, Hisanaga T, Rivera P. Effect of crystal form of TiO2 on the photocatalytic degradation of pollutants. Photocatalytic purification and treatment of water and air, 1993, 169.
55
Torimoto T, Ito S, Kuwabata S, Yoneyama H. Effects of adsorbents used as supports for titanium dioxide loading on photocatalytic degradation of propyzamide. Environmental Science and Technology, 1996, 30, 1275-1281.
Torimoto T, Okawa Y, Takeda N, Yoneyama H. Effect of activated carbon content in TiO2-loaded activated carbon on photodegradation behaviors of dichloromethane. Journal of Photochemistry and Photobiology A: Chemistry, 1997, 103, 153-157.
Turchi C, Ollis D. Mixed reactant photocatalysis: Intermediates and mutual rate inhibition. Journal of Catalysis, 1989, 119, 483-496.
Turchi C, Ollis D. Photocatalytic degradation of organic water contaminant mechanisms involving hydroxyl radical attack. Journal of Catalysis, 1990, 122, 178-192.
Villieras F, Leboda R, Charmas B, Bardot F, Gerard G, Rudzinski W. High resolution argon and nitrogen adsorption assessment of the surface heterogeneity of carbosils. Carbon, 1998, 36, 10, 1501-1510.
Vohra M, Tanaka K. Photocatalytic degradation of aqueous pollutants using silica-modified TiO2. Water Research, 2003, 37, 3992-3996.
Xu Y, Zheng W, Liu W. Enhanced photocatalystic activity of supported TiO2 dispersing effect of SiO2. Journal of Photochemistry and Photobiology A: Chemistry, 1999, 122, 57-60.
Yoneyama H, Torimoto T. Titanium dioxide/adsorbent hybrid photocatalysts for photodestruction of organic substances of dilute concentrations. Catalysis Today, 2000, 58, 133-140.

BIOGRAPHICAL SKETCH
Christina Yvette TerMaath was born in Lafayette, Indiana, on January 7, 1977. Her
family spent a few years in Lafayette and Panama City, Florida, before relocating to
Springfield, Virginia, where Christina graduated from West Springfield High School in
1995. She pursued a Bachelor of Science degree in Chemical Engineering from the
Pennsylvania State University with a focus on energy and fuels. Her interest in
environmental engineering was realized as she studied the pollution and control of
emissions from the use of fossil fuels. Upon graduation in December 1999, Christina
began an eight month internship with the US Environmental Protection Agency in
Washington, DC, where her interest in environmental engineering grew. After two years
at an energy consulting company in Washington, DC, where she learned about hydrogen
fuel technologies through her work with the Department of Energy’s Hydrogen Program,
Christina decided to pursue graduate school in the Environmental Engineering Sciences
Department at the University of Florida.
56

![SYNTHESIS AND CHARACTERIZATION OF CORE/SHELL ......Functionalized nanoparticles such as core/shell silica coated gold [2], alumina coated Titania [3], silver coated magnetite [4],](https://img.pdfslide.net/doc/110x75/60bd533bb67f6c68462c9209/synthesis-and-characterization-of-coreshell-functionalized-nanoparticles.jpg)