Embed Size (px)
DESCRIPTION
THE PERMANENT EFFECTS OF RECESSIONS ON CHILD HEALTH: EVIDENCE FROM PERU. Jorge AgüeroMartín Valdivia UC at RiversideGRADE, Peru XIV Meetings of the LACEA/ IADB/ WB/ UNDP Research Network on Inequality and Poverty (NIP) Tulane University, New Orleans April 9, 2010. - PowerPoint PPT Presentation
Citation preview
THE PERMANENT EFFECTS OF RECESSIONS ON CHILD HEALTH:
EVIDENCE FROM PERU
Jorge Agüero Martín Valdivia UC at Riverside GRADE, Peru
XIV Meetings of the LACEA/ IADB/ WB/ UNDP Research Network on Inequality and Poverty (NIP)
Tulane University, New Orleans
April 9, 2010
Conceptual setup• Macroeconomics shocks are temporary by definition.
However, duration and limitations of public and private safety nets may lead to permanent effects, especially to the most vulnerable (poor, uninsured)– Infant mortality– Child malnutrition
• Fiscal effects also limit the capacity of public safety net to respond accordingly
• In turn, negative shock on human capital also negatively affect the long-run growth path of the economy
• Main goal: learn from previous crises about the potential of the current crisis to negatively affect child health now
Empirical strategy
• Data: All available rounds of the Peruvian DHS– Years: 1986, 92, 96, 2000, 2004-05– Nationally representative sample of women in
reproductive age (15-49)• We estimate GDP effects on:
– Infant mortality (all birth history)– Child nutrition– Maternal mortality (prenatal controls)
• Key identification strategy: Mother´s fixed effects• Extrapolation issues
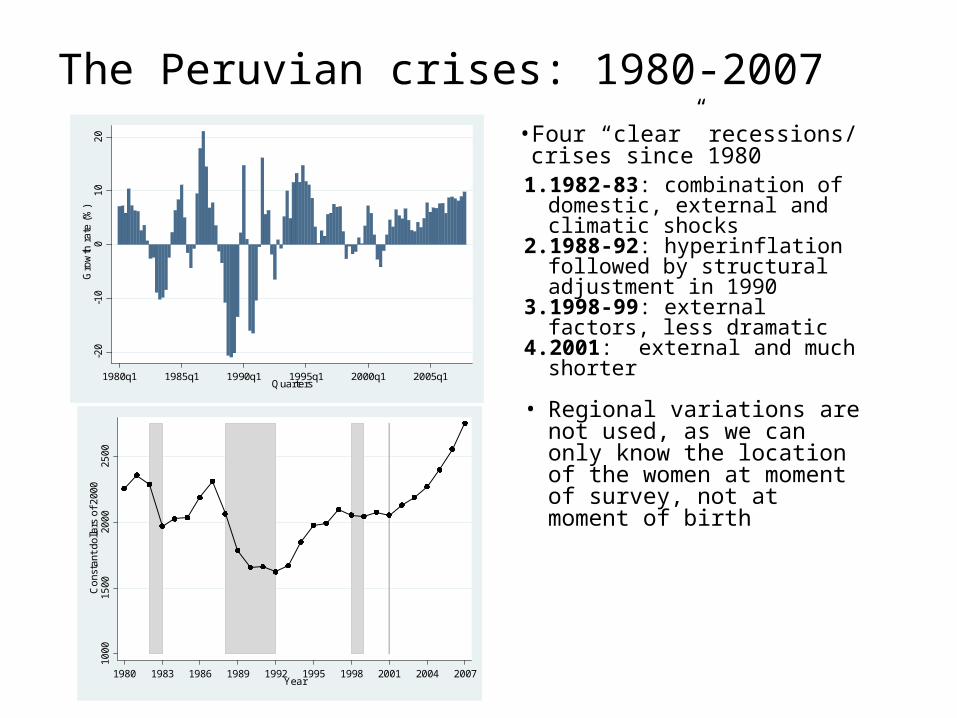
The Peruvian crises: 1980-200710
0015
0020
0025
00C
ons
tant
dol
lars
of 2
000
1980 1983 1986 1989 1992 1995 1998 2001 2004 2007Year
• Four “clear” recessions/ crises since 19801. 1982-83: combination of domestic,
external and climatic shocks2. 1988-92: hyperinflation followed by
structural adjustment in 19903. 1998-99: external factors, less
dramatic4. 2001: external and much shorter
• Regional variations are not used, as we can only know the location of the women at moment of survey, not at moment of birth
-20
-10
010
20
Gro
wth
rate
(%
)
1980q1 1985q1 1990q1 1995q1 2000q1 2005q1Quarters

Conceptual framework: Income and substitution effects• Income effect (IE):
– Households see their income go down during macroeconomic crisis (unemployment, lower wages)
– Households are less able to purchase health-improving inputs• Substitution effect (SE):
– Lower wages allows family members to dedicate more time to health-promoting activities
• Thus, in principle, net effect is ambiguous– Efficiency of public and private safety nets are key– Fiscal shock limit ability of public safety net
• Heterogeneous effects– Importance of private safety nets (precautionary savings, credit,
insurance, diversification) may lead to heterogeneous effects– Transaction costs may isolate some households from market
fluctuations
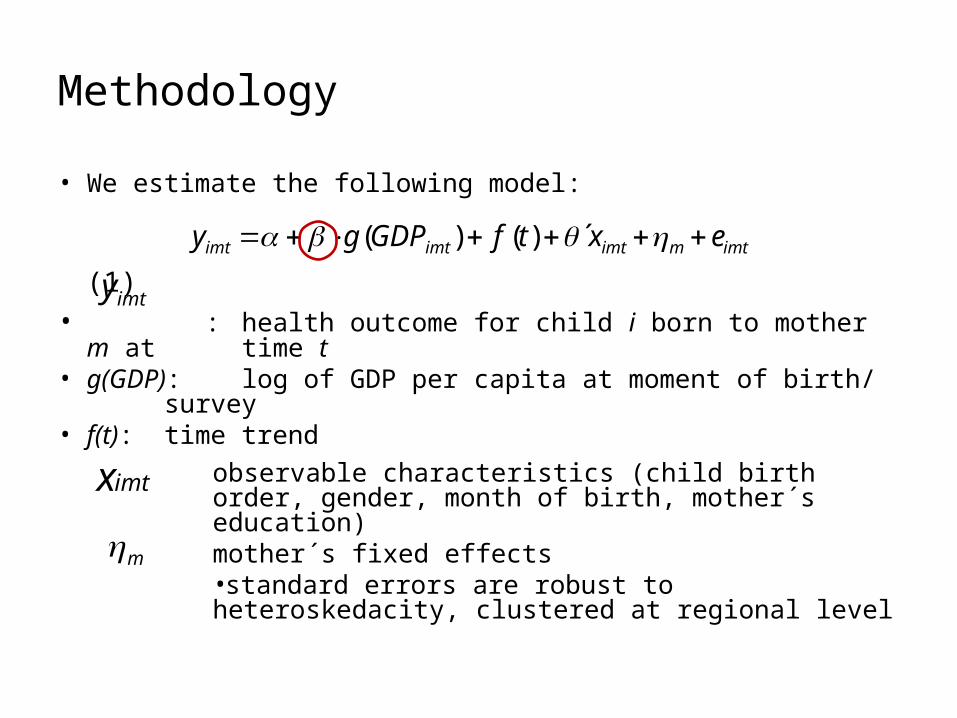
Methodology
• We estimate the following model:
(1) • : health outcome for child i born to mother m at
time t• g(GDP): log of GDP per capita at moment of birth/
survey• f(t): time trend
observable characteristics (child birth order, gender, month of birth, mother´s education)mother´s fixed effects•standard errors are robust to heteroskedacity, clustered at regional level
imtmimtimtimt extfGDPgy ´)()(
imty
m
imtx
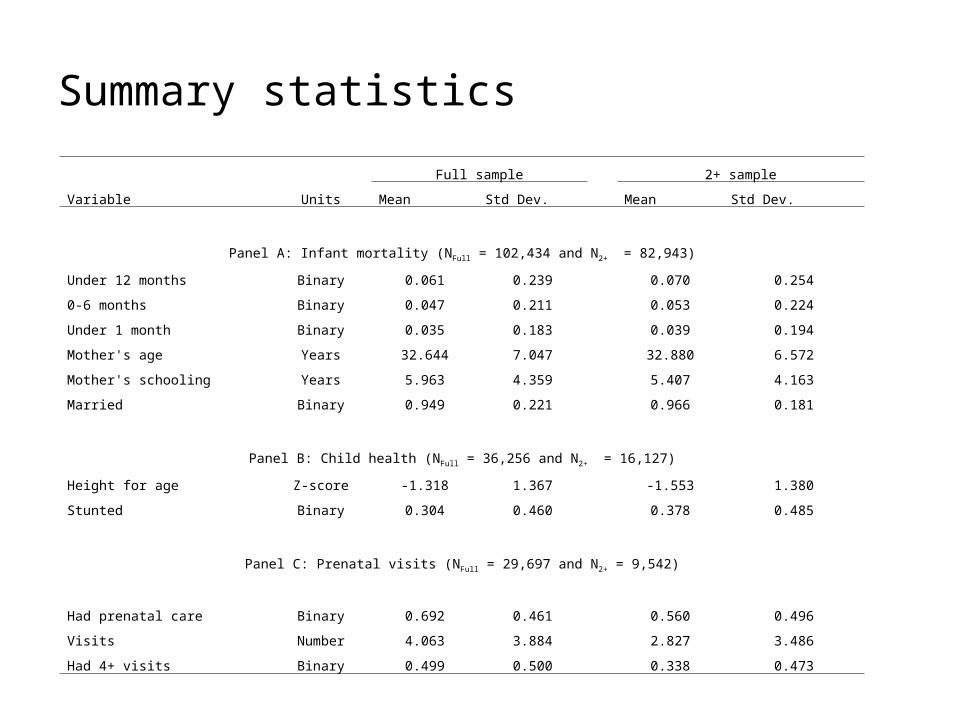
Summary statistics
Full sample 2+ sample
Variable Units Mean Std Dev. Mean Std Dev.
Panel A: Infant mortality (NFull = 102,434 and N2+ = 82,943)
Under 12 months Binary 0.061 0.239 0.070 0.254
0-6 months Binary 0.047 0.211 0.053 0.224
Under 1 month Binary 0.035 0.183 0.039 0.194
Mother's age Years 32.644 7.047 32.880 6.572
Mother's schooling Years 5.963 4.359 5.407 4.163
Married Binary 0.949 0.221 0.966 0.181
Panel B: Child health (NFull = 36,256 and N2+ = 16,127)
Height for age Z-score -1.318 1.367 -1.553 1.380
Stunted Binary 0.304 0.460 0.378 0.485
Panel C: Prenatal visits (NFull = 29,697 and N2+ = 9,542)
Had prenatal care Binary 0.692 0.461 0.560 0.496
Visits Number 4.063 3.884 2.827 3.486
Had 4+ visits Binary 0.499 0.500 0.338 0.473
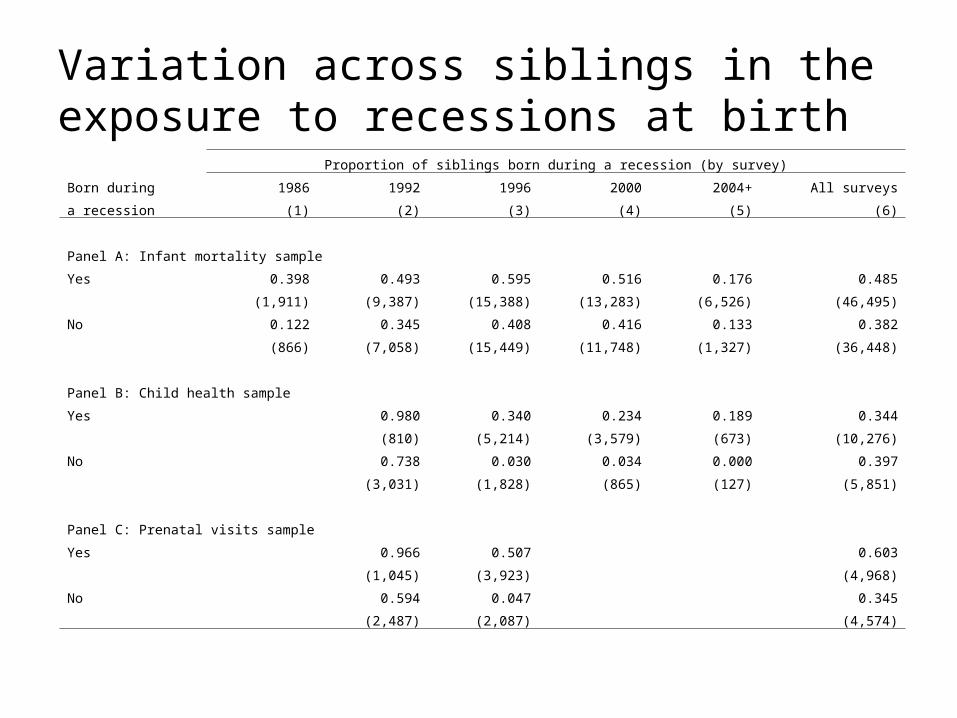
Variation across siblings in the exposure to recessions at birth
Proportion of siblings born during a recession (by survey)
Born during 1986 1992 1996 2000 2004+ All surveys
a recession (1) (2) (3) (4) (5) (6)
Panel A: Infant mortality sample
Yes 0.398 0.493 0.595 0.516 0.176 0.485
(1,911) (9,387) (15,388) (13,283) (6,526) (46,495)
No 0.122 0.345 0.408 0.416 0.133 0.382
(866) (7,058) (15,449) (11,748) (1,327) (36,448)
Panel B: Child health sample
Yes 0.980 0.340 0.234 0.189 0.344
(810) (5,214) (3,579) (673) (10,276)
No 0.738 0.030 0.034 0.000 0.397
(3,031) (1,828) (865) (127) (5,851)
Panel C: Prenatal visits sample
Yes 0.966 0.507 0.603
(1,045) (3,923) (4,968)
No 0.594 0.047 0.345
(2,487) (2,087) (4,574)
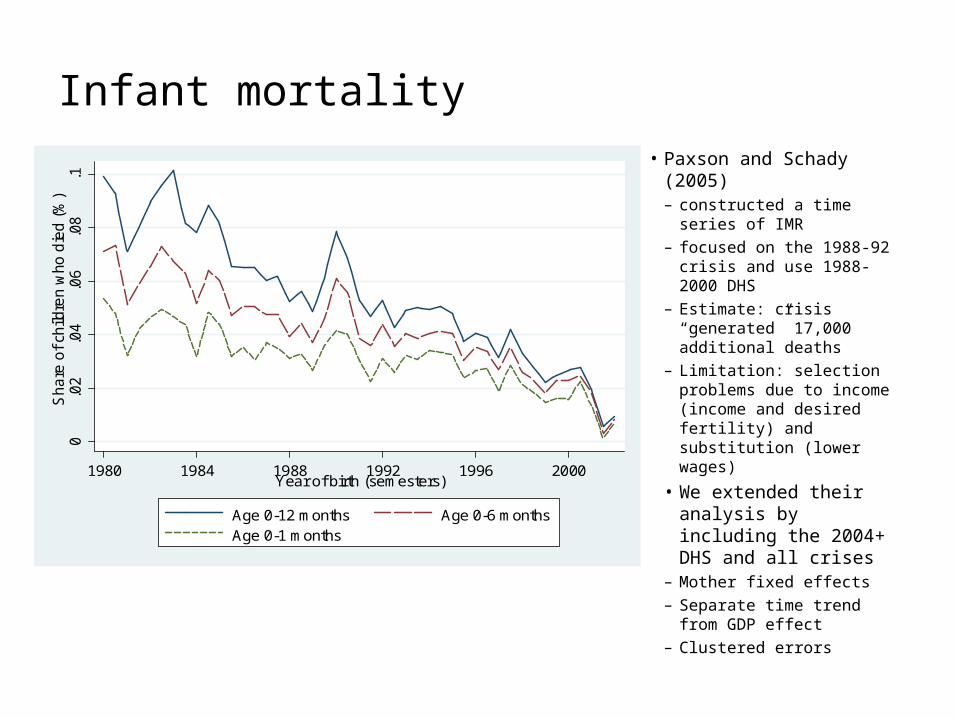
Infant mortality• Paxson and Schady (2005)
– constructed a time series of IMR
– focused on the 1988-92 crisis and use 1988-2000 DHS
– Estimate: crisis “generated” 17,000 additional deaths
– Limitation: selection problems due to income (income and desired fertility) and substitution (lower wages)
• We extended their analysis by including the 2004+ DHS and all crises
– Mother fixed effects– Separate time trend from
GDP effect– Clustered errors
0.0
2.0
4.0
6.0
8.1
Sha
re o
f ch
ildre
n w
ho d
ied
(%
)
1980 1984 1988 1992 1996 2000Year of birth (semesters)
Age 0-12 months Age 0-6 monthsAge 0-1 months
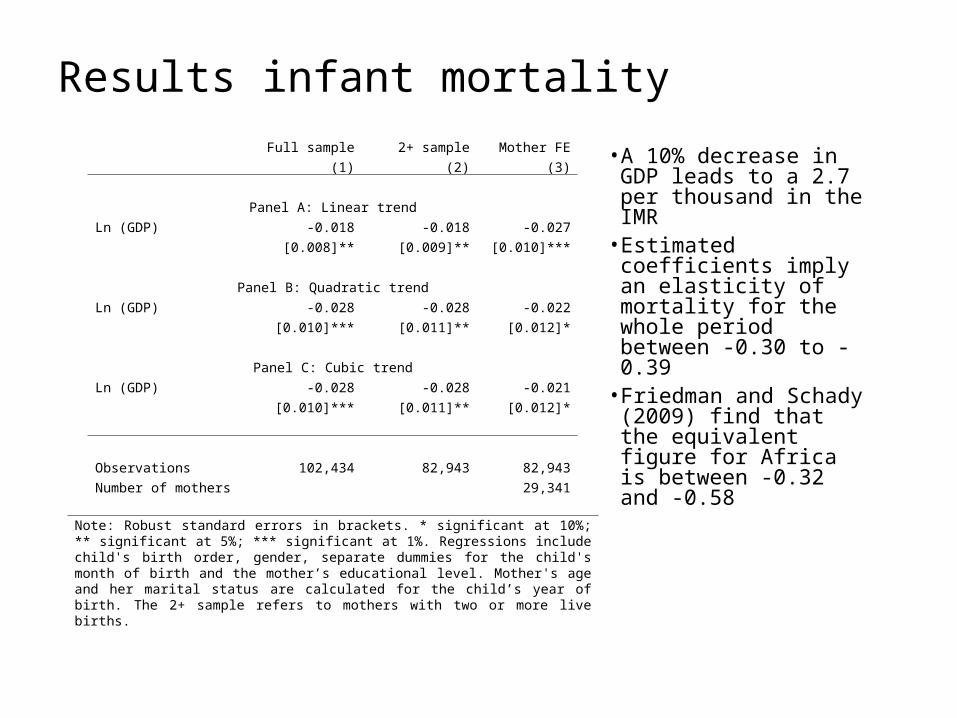
Results infant mortalityFull sample 2+ sample Mother FE
(1) (2) (3)
Panel A: Linear trend
Ln (GDP) -0.018 -0.018 -0.027
[0.008]** [0.009]** [0.010]***
Panel B: Quadratic trend
Ln (GDP) -0.028 -0.028 -0.022
[0.010]*** [0.011]** [0.012]*
Panel C: Cubic trend
Ln (GDP) -0.028 -0.028 -0.021
[0.010]*** [0.011]** [0.012]*
Observations 102,434 82,943 82,943
Number of mothers 29,341
Note: Robust standard errors in brackets. * significant at 10%; ** significant at 5%; *** significant at 1%. Regressions include child's birth order, gender, separate dummies for the child's month of birth and the mother’s educational level. Mother's age and her marital status are calculated for the child’s year of birth. The 2+ sample refers to mothers with two or more live births.
• A 10% decrease in GDP leads to a 2.7 per thousand in the IMR
• Estimated coefficients imply an elasticity of mortality for the whole period between -0.30 to -0.39
• Friedman and Schady (2009) find that the equivalent figure for Africa is between -0.32 and -0.58
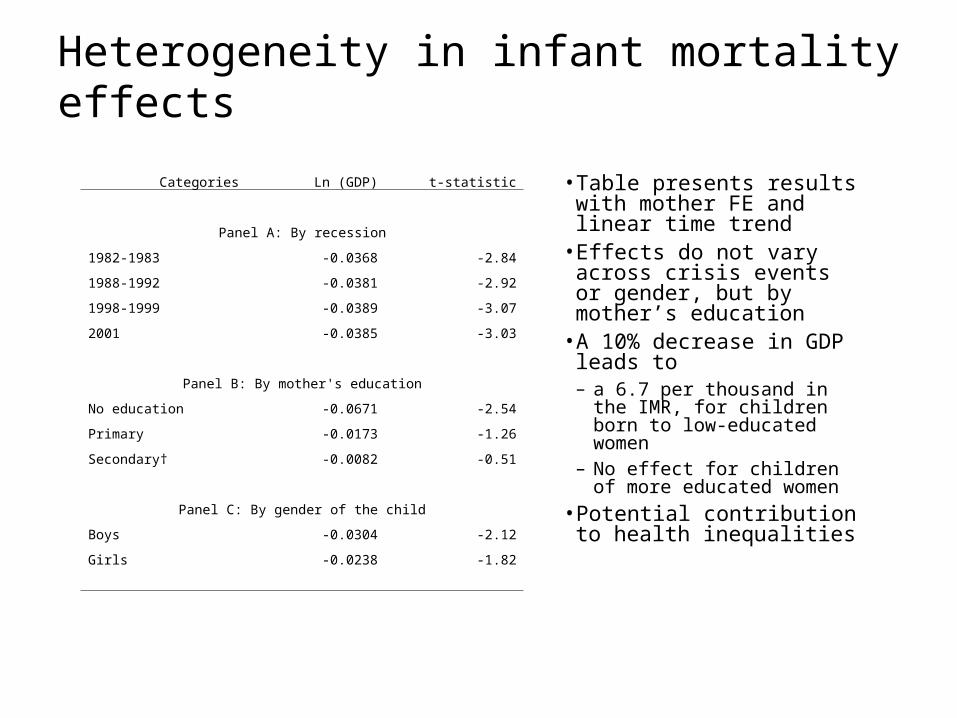
Heterogeneity in infant mortality effects
• Table presents results with mother FE and linear time trend
• Effects do not vary across crisis events or gender, but by mother’s education
• A 10% decrease in GDP leads to – a 6.7 per thousand in the IMR, for
children born to low-educated women
– No effect for children of more educated women
• Potential contribution to health inequalities
Categories Ln (GDP) t-statistic
Panel A: By recession
1982-1983 -0.0368 -2.84
1988-1992 -0.0381 -2.92
1998-1999 -0.0389 -3.07
2001 -0.0385 -3.03
Panel B: By mother's education
No education -0.0671 -2.54
Primary -0.0173 -1.26
Secondary† -0.0082 -0.51
Panel C: By gender of the child
Boys -0.0304 -2.12
Girls -0.0238 -1.82
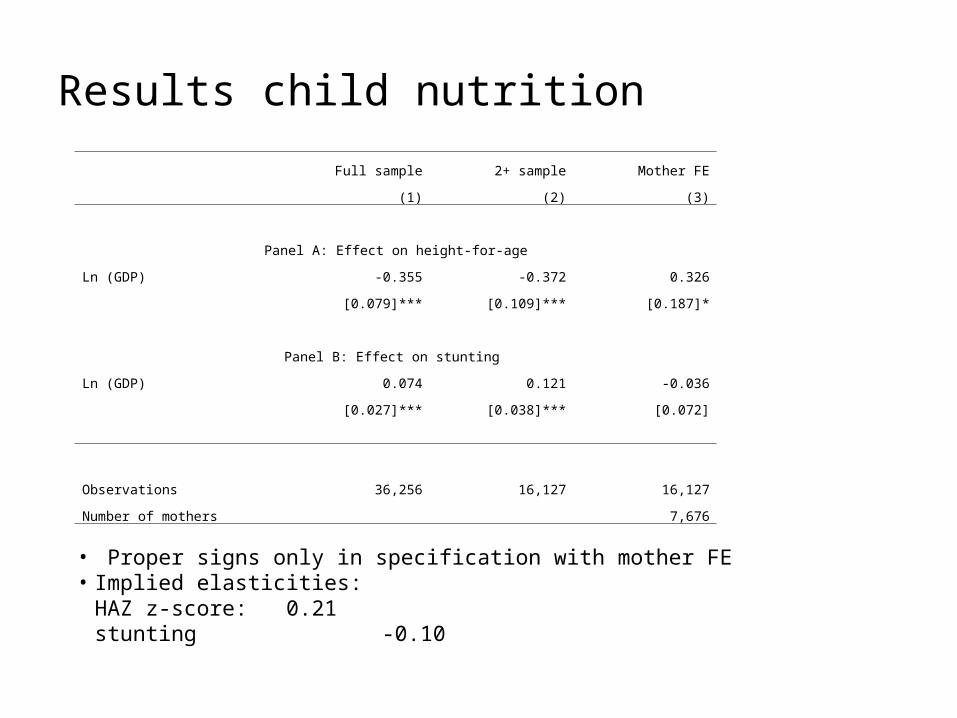
Results child nutrition
Full sample 2+ sample Mother FE
(1) (2) (3)
Panel A: Effect on height-for-age
Ln (GDP) -0.355 -0.372 0.326
[0.079]*** [0.109]*** [0.187]*
Panel B: Effect on stunting
Ln (GDP) 0.074 0.121 -0.036
[0.027]*** [0.038]*** [0.072]
Observations 36,256 16,127 16,127
Number of mothers 7,676
• Proper signs only in specification with mother FE• Implied elasticities:
HAZ z-score: 0.21stunting -0.10
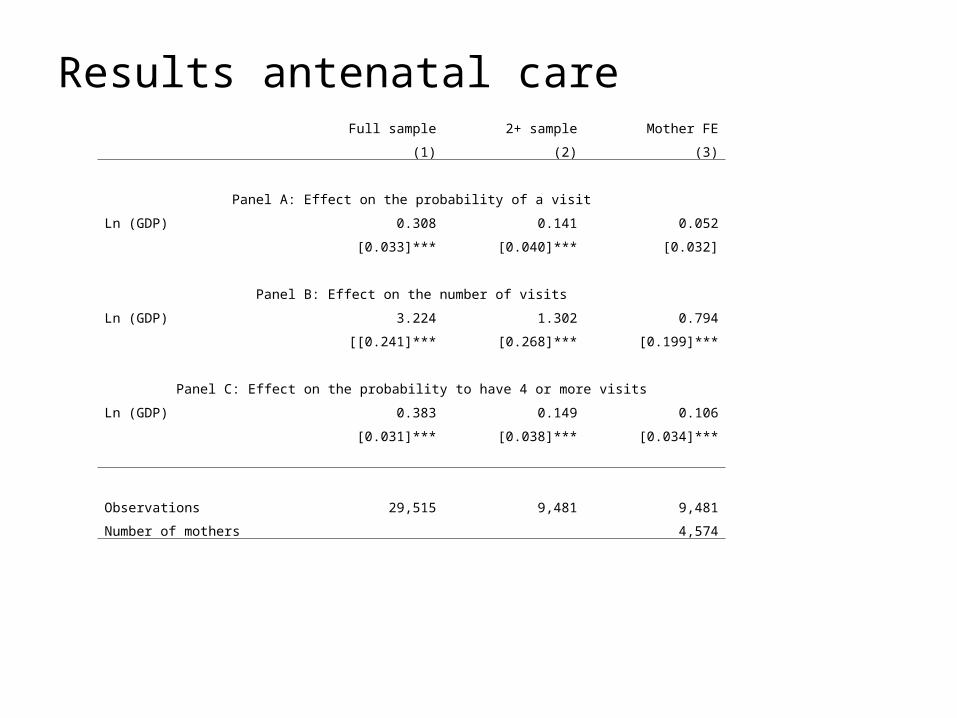
Results antenatal care Full sample 2+ sample Mother FE
(1) (2) (3)
Panel A: Effect on the probability of a visit
Ln (GDP) 0.308 0.141 0.052
[0.033]*** [0.040]*** [0.032]
Panel B: Effect on the number of visits
Ln (GDP) 3.224 1.302 0.794
[[0.241]*** [0.268]*** [0.199]***
Panel C: Effect on the probability to have 4 or more visits
Ln (GDP) 0.383 0.149 0.106
[0.031]*** [0.038]*** [0.034]***
Observations 29,515 9,481 9,481
Number of mothers 4,574
Summary• We explore the effect of past crises on health related
outcomes of mothers and children– This paper compares outcomes between children born to the same
mother as way to obtain estimates that are closer to the “causal“ effect of the crisis
• Our results show that past macroeconomic crises increased infant mortality, child malnutrition and reduce the prevalence of antenatal care– That is, macroeconomic shocks have important permanent effects
(affecting human capital of children of today, the adults of tomorrow)– Effects are higher for children born to low-educated women
• Finally, we discussed how these results could help us estimate the effect of the current crisis on the achievement of the MDGs in Peru
Lessons for the current crisis?• We hope effects of the current crisis are smaller
– Younger cohorts are more educated– Improved health information for women of all levels of education– Increased fiscal resources may help sustain or improve public
safety net– Improved technologies to protect mother-child (CCT – Juntos)
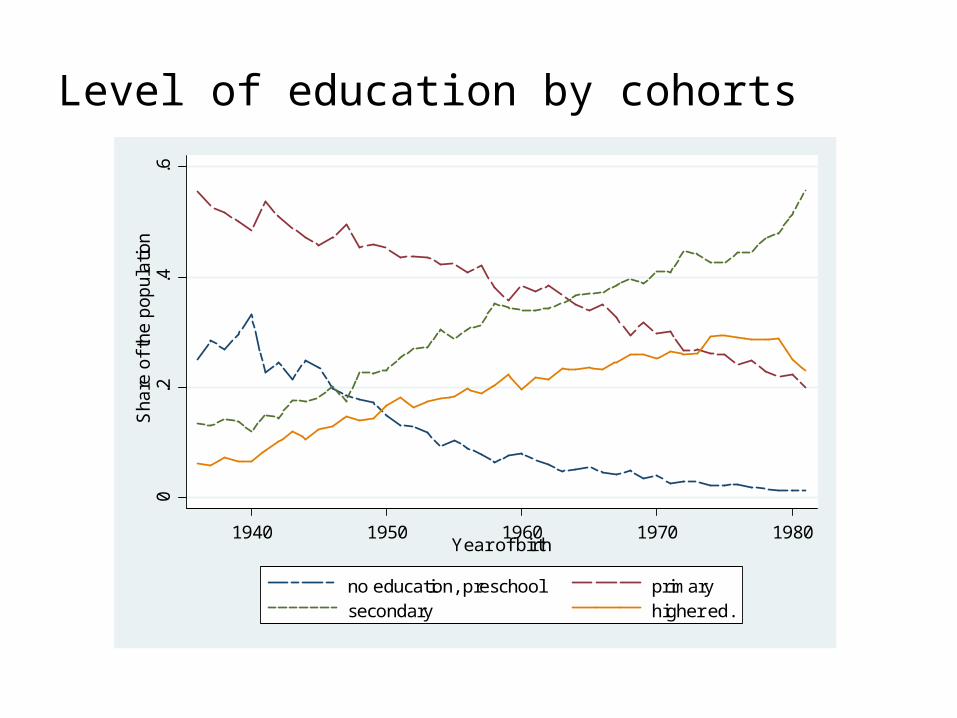
Level of education by cohorts
0.2
.4.6
Sha
re o
f th
e p
op
ula
tion
1940 1950 1960 1970 1980Year of birth
no education, preschool primarysecondary higher ed.
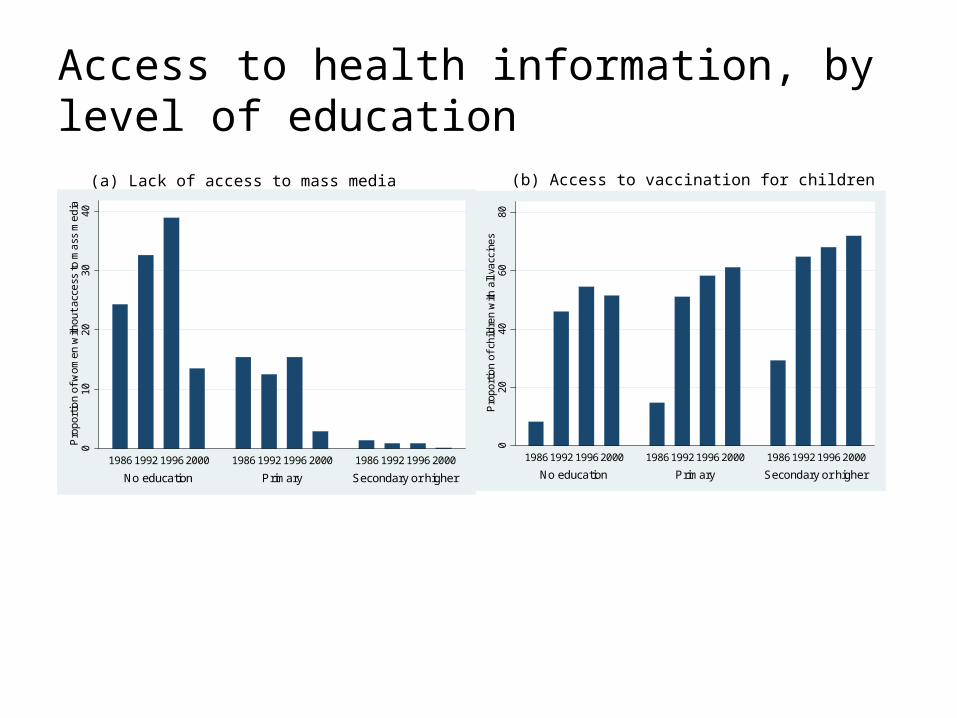
Access to health information, by level of education
010
2030
40P
rop
ortio
n of
wo
men
with
out
acc
ess
to m
ass
me
dia
No education Primary Secondary or higher
1986 1992 1996 2000 1986 1992 1996 2000 1986 1992 1996 2000
(a) Lack of access to mass media
020
4060
80P
rop
ortio
n of
chi
ldre
n w
ith a
ll va
ccin
es
No education Primary Secondary or higher
1986 1992 1996 2000 1986 1992 1996 2000 1986 1992 1996 2000
(b) Access to vaccination for children