Embed Size (px)
Citation preview

THE PHARMACEUTICAL INDUSTRY IN KENYA
BY
PIUS S. W. OWINO
Research Paper submitted to the Department of Economics, University of Nairobi, in partial fulfilment of the requirements for the degree Masters of Arts in Economics.
J U L Y , 1 9 8 5 .
Y
JMlVERSTTY OF NATKOr

This research paper is my original work and has not been presented for a degree in another University.
PIUS S. W..OWINO
This research paper has been submitted for examination with our approval as University Supervisors.

TABLE OF CONTENTSPAGE
Acknowledgement ivList of Tables viList of Figures viiiList of Appendices ixList of Abbreviations xAbstract xi
CHAPTERSI Introduction - 1
1.1 Goals of the study 21*2 Importance of the study 31.3 Organisation of the study 4
II Literature Reyiew 62.1 Definition of the Pharmaceutical Industry 62.2 An Overview of the Worldwide ,
Pharmaceutical Industry '/ 72.3 The Position of the Third World in
Pharmaceutical Production 102.4 Capacity Utilisation 142.5 Causes of Capacity Underutilisation in
LDCs . 232.6 Technology 262.7 Transfer Pricing 292.8 Use of Brand and Generic Names in the' „ Pharmaceutical Industry 38
2.9 Bulk Purchasing 42
- ii
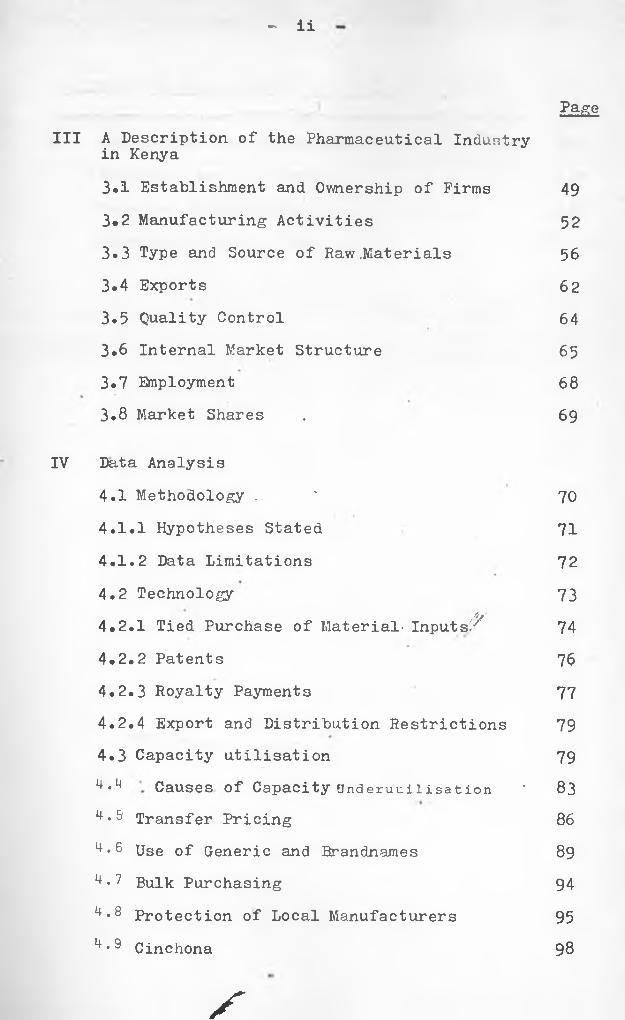
III A Description of the Pharmaceutical Industry in Kenya3.1 Establishment and Ownership of Firms 493*2 Manufacturing Activities 523.3 Type and Source of Raw .Materials 563.4 Exports 623.5 Quality Control 643.6 Internal Market Structure 65
3.7 Employment 68
3.8 Market Shares . 69
IV Data Analysis4.1 Methodology . ' 704.1.1 Hypotheses Stated 71
4.1.2 Data Limitations 724.2 Technology 73
A/4.2.1 Tied Purchase of Material- Inputs/ 744.2.2 Patents 764.2.3 Royalty Payments 77
4.2.4 Export and Distribution Restrictions 794.3 Capacity utilisation 79
4 •4 Causes Of Capacity gnderuuilisation * 83
4,5 Transfer Pricing 86
4 *6 Use of Generic and Brandnames 89
4 • 7 Bulk Purchasing 94
4 •8 Protection of Local Manufacturers 954•9 Cinchona 98
f
Page

iii
V Conclusions and Recommendations 107Footnotes and References 120Selected Bibliography ‘ 126Appendices One to Four 127-188
Page
X*

iv
ACKNOWLEDGEMENTThis study began one year ago, and it is a pleasure
to be able to acknowledge all those who assisted in its\
completion.
I should like to thank my supervisors, Dr. P.E,Coughlin and Dr. S.W. Masai, who often put aside their work to accomodate my needs. Their unfailing help, encouragement and stimulating suggestions have undoubtedly helped to develop this study.
I also with to thank the Government of the Federal Republic of Germany which through its Academic Exchange Service (DAAD) funded my graduate studies. I am also grateful to International Development Research Centre (IDRC) for funding part of this Research.
. • </ rMy research would have been impossible without the
kindness and co-operation of all the manufacturers in the(
Pharmaceutical Industry in Kenya, to whom I owe an immense debt of gratitude. In particular Dr. M. Cine of Dawa Pharmaceuticals, Mr. W. Chaudhry of Mac's Pharmaceuticals and Mr. M. Patel of Lab. and Allied Equipment, showed me great kindness and trust which I hope I have not abused.
I thank the staff who helped me at the Central Medical Stores, Central Bank of Kenya, and Ministry of Health, for their help in obtaining some documents.

In Tanzania, my appreciation goes to Tanzania NationalScientific Research Council and National PharmaceuticalCompany (NAPCO) for organising my study in Tanzania,During the fieldwork in Tanzania, I made many friends andthe courtesy they accorded me, made my fieldwork the
of.most pleasurable part £ this study. Special thanks go to Alex Hagila of TANESCO, Francis Lutende of NAPCO and Mr. Chiliko of Ministry of Health, Tanzania.
My classmates, Master of Arts (Economics) II, 1984-8 5, were not only a constant source of support during my postgraduate studies, but they also communicated to me the challenge and excitement of doing Industrial studies. Especially, Hassan Kerre has been a vigorous and a construct critic and I thank him for- both. I also owe a special debt of gratitude to other friends, especially Paul Odundo,Jared Abagi, and Joseph Orabok. The assistance from Mr, Ocholla Okeyo, a pharmacist, was also crucial in the times of great need. He always gave me professional assistance related to my study, especially by identifying identical generic drugs.
Another vote of thanks go to Jenipher Akeyo, and E. Kariuki for typing this research paper.
•* *My deepest appreciation and gratitude also go to my parents for all they have forgone and continue to forgo to educate their children.
Y
Finally, I remain accountable for any mistakes or shortcomings that may be in this study.
Pius S.W. Owino August, 1985«

- vi
LIST OF TABLES gageTABLE NO TITLE2.1 The Top 15 Pharmaceutical Companies,
(1983-84) 92.2 Levels of Development of the Pharmaceutical
Industry in Third World Countries, 1979 122.3 Overpricing of Imports in the Mexican
Steroid Hormone Industry, 1974 332.4 Estimated Annual Foreign Exchange Loss
for Selected Commodities, 1976-78 362.5a Comparative f.o.b. Price per Unit Paid by '
EPHARMECOR and by a Private Importer, (1979) 432.5b Comparative C & F values of drugs Imported by
EPHARMECOR and by a Private Sector, 1980 443.1 Establishment of Pharmaceutical Firms in
Kenya, 1936-85 • . 503.2 Formulations and Productive Capacities in the
Kenyan Pharmaceutical Industry, 1985 513.3 Products Manufactured by the Pharmaceutical
Industry in Kenya 543.4 Imports of Medicinal and Pharmaceutical/?''
Products, 1975-83 583.5 Exports of Pharmaceutical Products by Kenya,
1964-83 633.6 Annual Drug Consumption of Main Pharmaceutical
Categories by the Central Medical Stores,1983-84 66
4.1 Royalty Payments as a Percentage of Net Sales in the Kenyan Pharmaceutical' Industry,1984 78
4.2 Capacity Utilisation in the KenyanPharmaceutical Industry, 1985 81
4o3 Capacity Utilisation for SelectedProcesses 83
vii
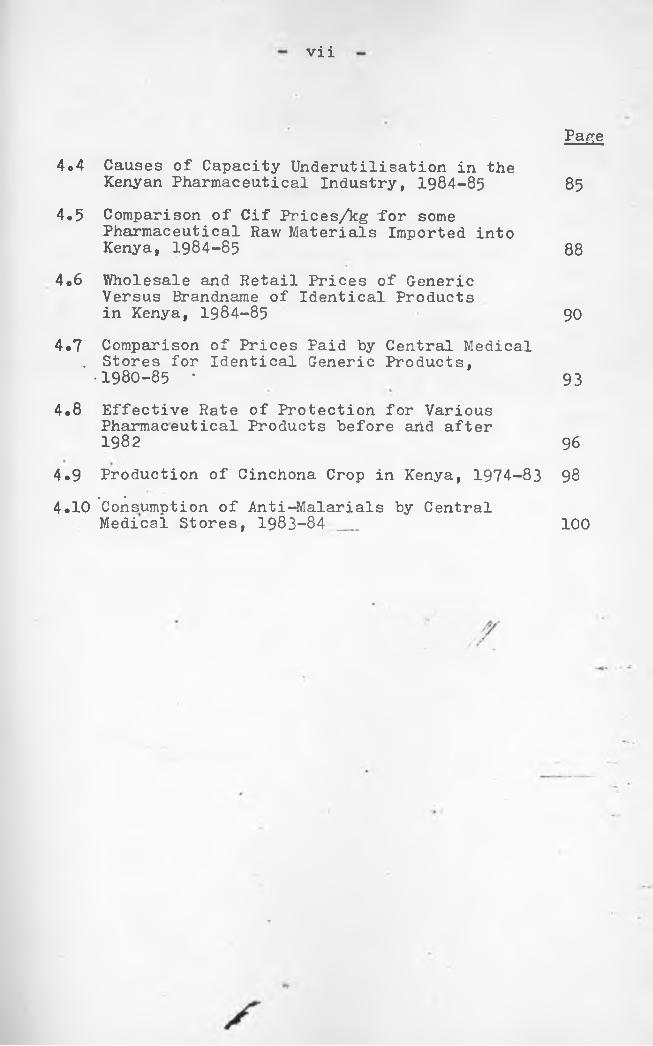
Page4*4 Causes of Capacity Underutilisation in the
Kenyan Pharmaceutical Industry, 1984-85 85
4.5 Comparison of Cif Prices/kg -for somePharmaceutical Raw Materials Imported into Kenya, 1984-85 88
4*6 Y/holesale and Retail Prices of Generic Versus Brandname of Identical Products in Kenya, 1984-85 90
4*7 Comparison of Prices Paid by Central Medical . Stores for Identical Generic Products,•1980-85 * 93
4*8 Effective Rate of Protection for Various Pharmaceutical Products before arid after 1982 96
4*9 Production of Cinchona Crop in Kenya, 1974-83 98• •4*10 Consumption of Anti-Malarials by CentralMedical Stores, 1983-84 __ 100
T

viii
t
FIGURE NO. TITLE * PAGEFlow Chart for the Manufacture of Tablets 153
"11 Flow Chart for the Manufacture of Capsules 156III Flow Chart for the Manufacture of Syrups,
Elixirs, and Solutions ’ 159IV Flow Chart for Parenterals 161V Flow Chart for Transfusion Fluids 163
Flow Chart for the Manufacture ofOintments, Emulsions, Lotions, and Suspensions I65
VII Flow Rhart for Powder Filling 166
LIST OF FIGURES
ix -
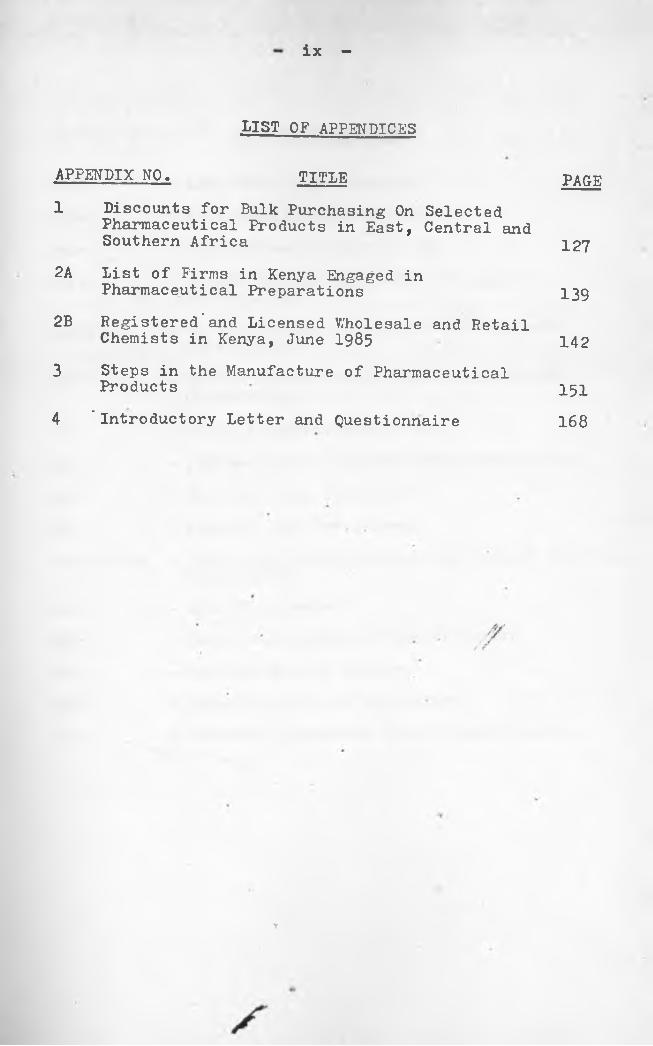
LIST OF APPENDICES
APPENDIX NO. TITLE1 Discounts for Bulk Purchasing On Selected
Pharmaceutical Products in East, Central and Southern Africa2A List of Firms in Kenya Engaged in
Pharmaceutical Preparations2B Registered’and Licensed Wholesale and Retail
Chemists in Kenya, June 1985
3 Steps in the Manufacture of Pharmaceutical Products4 ’Introductory Letter and Questionnaire
PAGE
127
139
142
151168
Y

ABBREVIATIONS USED
LDCsMDCsMNCsUNIDO
UNCTAD
UNCTC
SGSPMAFDAR&DEPHARMECOR
O-T-CKAMCMSERPSITC
- Less Developed Countries- More Developed Countries- Multinational Corporations- United Nations Industrial’ Development Organisation
- United Nations Conference on Trade and Development
- United Nations Centre on Transnatiqnal Corporations
- General Superitendence Co.- Pharmaceutical Manufacturers Association- Food1 and Drug Association- Research and Development- Ethiopian Pharmaceutical and Medical Suppli Corporation
- Over The Counter- Kenya Association of Manufacturers- Central Medical Stores- Effective Rate of Protection- Standard Industrial Trade Classification

- xi
ABSTRACT
Kenya's Pharmaceutical sector has grown significantly since 1936. Most of the manufacturing units were established in the 1970's. Currently, the sector is dominated by foreign firms.
This study investigates various issues that have proven significant in the development of the Pharmaceutical sector in other Less Developed Countries (LDCs) . These issues relate to technology transfer, capacity utilisation, transfer pricing, use of generic and brandnames, bulk purchasing, and protection of local manufacturers.
This study demonstrates that, whereas the rate of capacit utilisation is only 21%,,the local manufacturers are not l protected by the tariff structure, when competing against imports. 'V
Through restrictive technology transfers, Kenya has lost a lot of foreign exchange. In addition, many pharmaceutical raw materials and finished drugs importedinto Kenya are highly overpriced, especially by Multi-
• • »
national Corporations (MNCs). This raises the strong suspicion that some MNCs could be involved in transfer pricing.
Also, the investigation reveals wide price differencesbetween generic and branded drugs distributed in Kenya. Thus, the
•%consumers who buy drugs mider brandnames are burdened.

CHAPTER ONE
1.0 INTRODUCTION
Men search for a longer and happier life, but diseases remain part of their existence. In the Less Developed Countrie (LDCs), communicable diseases are among the major causes of infant mortality rates.^ To prevent and cure diseases, nations need to provide adequate but cheap drugs to their population.
According to studies by UNIDO, most LDCs have limited orno manufacturing facilities and are therefore dependent on . 2imported pharmaceuticals. To escape dependence, they are currently starting or expanding the manufacture of pharmaceutical products in their own countries. In the process, they encounter difficulties such as: a) unfavourable terms of
' At'technology commercialisation and transfer, b).- inability to shop carefully for cheaper raw materials and finished drugs, c) inability to fully utilise their productive capacities, and d) competition by importers of finished pharmaceutical products.
This study showsthat these problems, exist in the' pharmaceutical industry in Kenya. To accelerate development of the industry, Kenya should: a) encourage better utilisation oflocal resources b) strengthen bargaining regarding technology importation c) encourage the use of generic names and bulk purchasing to cut costs for consumers and d) provide adequate protection for local n^nufacturers against imports.
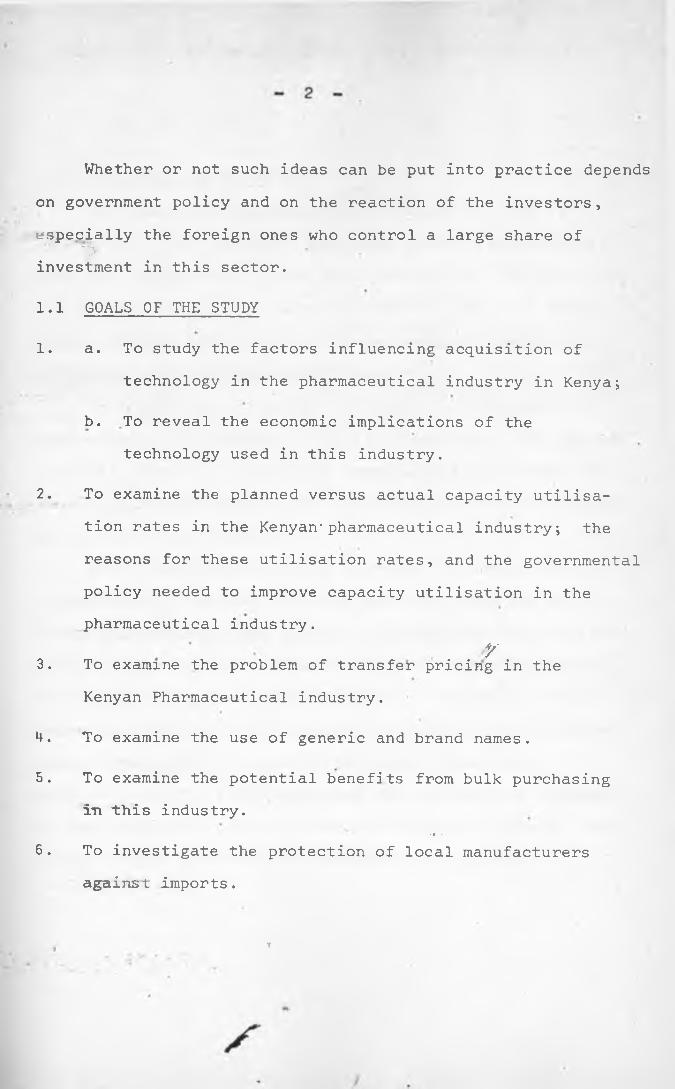
Whether or not such ideas can be put into practice depends on government policy and on the reaction of the investors,especially the foreign ones who control a large share of' >investment in this sector.
1.1 GOALS OF THE STUDY
1. a. To study the factors influencing acquisition oftechnology in the pharmaceutical industry in Kenya;
b. To reveal the economic implications of the technology used in this industry.
2.
3.
To examine the planned versus actual capacity utilisation rates in the Kenyan-pharmaceutical industry; the reasons for these utilisation rates, and the governmental policy needed to improve capacity utilisation in the pharmaceutical industry.
'o '/To examine the problem of transfer pricing in the Kenyan Pharmaceutical industry.
4. To examine the use of generic and brand names.
5. To examine the potential benefits from bulk purchasing in this industry.
■ • «
6. To investigate the protection of local manufacturers against imports.
T

1.2 IMPORTANCE OF THE STUDYThe demand for pharmaceutical products in LDCs is
increasing. For instance, according to WHO's projections,LDCs will require 5-10 times more vaccines by 1990 than they
. 3did in mid-1970's. To meet this demand, LDCs like Kenya should quickly embark on studies to reveal the problems affecting their pharmaceutical industry.
In Kenya, drug shortages in medical institutions are experienced simultaneously with idle capacity in the pharmaceutical industry. This study investigates the extent andcauses of excess capacity and how to improve the utilisation • •of the existing resources.
Whilst the country should increase the production of pharmaceutical products with the existing plant and equipment, the country cannot afford to’ignore the issue of tech-
Vnology choice and use. This concern is further expressed inu 5the Kenyan development plans (1979-83, 1984-88 ). Kenya
depends on imported technology and therefore, strong guidelines are needed to regulate technology acquisition. In view of this, the study evaluates-the restrictions contained in the contracts related to the acquisition of foreign technology in the production of pharmaceuticals in Kenya.
r
4
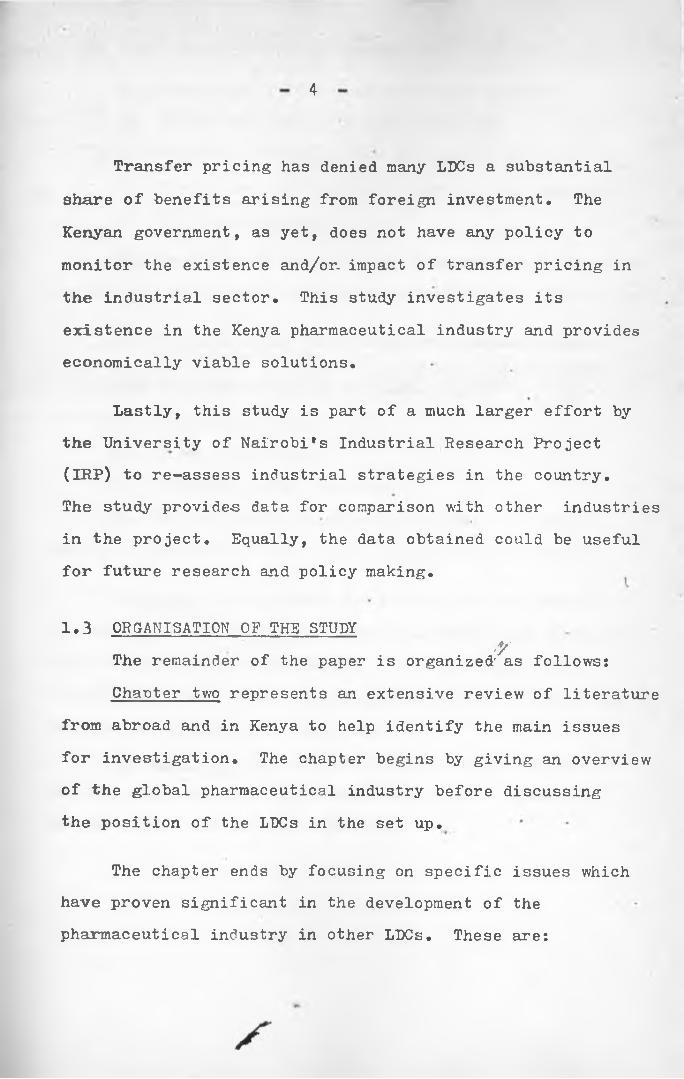
Transfer pricing has denied many LDCs a substantial share of benefits arising from foreign investment. The Kenyan government, as yet, does not have any policy to monitor the existence and/or. impact of transfer pricing in the industrial sector. This study investigates its existence in the Kenya pharmaceutical industry and provides economically viable solutions.
Lastly, this study is part of a much larger effort by the University of Nairobi's Industrial Research Project (IRP) to re-assess industrial strategies in the country.The study provide-s data for comparison with other industries in the project. Equally, the data obtained could be useful for future research and policy making.
&
1.3 ORGANISATION OF THE STUDYThe remainder of the paper is organized'"as follows: Chanter two represents an extensive review of literature
from abroad and in Kenya to help identify the main issues for investigation. The chapter begins by giving an overview of the global pharmaceutical industry before discussing the position of the LDCs in the set up.
The chapter ends by focusing on specific issues which have proven significant in the development of the pharmaceutical industry in other LDCs. These are:

i) Technology commercialisation and transfer.ii) Extent and causes of idle capacity,
iii) Transfer pricing in the pharmaceutical industry.iv) Use of generic and brand name in drugs purchase,v) Bulk purchasing.
Chapter 3 describes the_Kenyan pharmaceutical industry and market. The items included in describing the industry are
i) Establishment, Ownership, and manufacturing activities of the firm.
ii) Type and source of raw materials,iii) Exports and Imports.iv) Quality Control,v) Internal market structure.
The chapter ends by examining employment and market shares of the firms in the Kenyan pharmaceutical industry.
I\In chapter we present the survey data and empirical
results. The methodology and data limitations are considered before examining the hypotheses. The main issues to be investigated have proven significant in other LDCs and have not been investigated in Kenya yet.
Chapter 5 provides the conclusions and policy recommendations pertaining to the research objectives. These are discussed in light of each hypothesis.

CHAPTER TWO
LITERATURE REVIEW
This chapter surveys the literature on the development of the pharmaceutical industry in’ LDCs. After defining the pharmaceutical industry, the chapter proceeds to examine the global operations and the position of LDCs in pharmaceutical production. Next* the chapter focuses on the measurement, extent and causes of excess capacity, the market for. and characteristics of technology commercialization and transfer, forms and impacts of transfer pricing, use of generic and brand names in the pharmaceutical sector and bulk purchasing in LDCs.
2.1 DEFINITION QF THE PHARMACEUTICAL INDUSTRYThe pharmaceutical industry is a.formulation industry
that dosages and packages medicaments ready for use by patients and doctors.'*' It takes the therapeutically active agents supplied by the pharmochemical industry and dosages them into tablets, injectables, syrups, drops and other preparations. The final formulation contains one or more active substances together with flavouring agents, stabilizers and other excipients.
In accordance with the United Nations Standard Inter- «a>-Lonal Trade Classification (SITC) pharmaceutical products are classified under Code«No. 541. These include items such

as: alkaloids, antibiotics eg. penicillin; streptomycin;tryocidine, bacterial products; sera and vaccines, vitamins and provitamins, glands and other therapeutic organs, bandages (pharmaceutical), absorbent cotton wading white. This study concentrates on products- for humans but excludes the last two categories.
2.2 AN OVERVIEW OF THE WORLDWIDE PHARMACEUTICAL INDUSTRYBefore 1939, the pharmaceutical industry was considered
as a commodity business. Companies manufactured and sold nearly all ingredients needed to compound doctor's prescriptions.’ There was little research and slow therapeutic advance. The discovery of new "wonder drugs" after theSecond World War marked the emergence of the modern pharma-
2ceutical industry. Afterwards, this industry grew to be research intensive and specialised on product;^ which are protected by patents and expensive promotion. This has ~ made the industry one of the most profitable, ranking first or second among all industries in the world since mid-
For the development of a strong pharmaceutical sector , country requires 1) an established basic chemical industry 2) sufficient finance to train research personnel and for research programs 3) strong technological base to provide the necessary equipments and machines 4) state control to ensure the quality and safety of the pharmaceutical products
1950's 3

and lastly a good consumer market to purchase the products.
Currently, the pharmaceutical industry in the world is dominated by a few MNCs. There are more than 10,000 companies in the world producing a wide range of pharmaceutical products (ethical drugs, nutritional products, Veterinary products etc.). Of these manufacturers, only one hundred are significant.* They produce about 90% of the global pharmaceutical output valued at US$ 7 2b. in late 19 70's.4
The leading 50 companies in terms of pharmaceutical sales, profitability and research intensity are MNCs mostly from U.S.A., U.K. and Federal Republic of Germany. According to James, most of these MNCs entered the field from technologically related industries'or started as pharmaceu
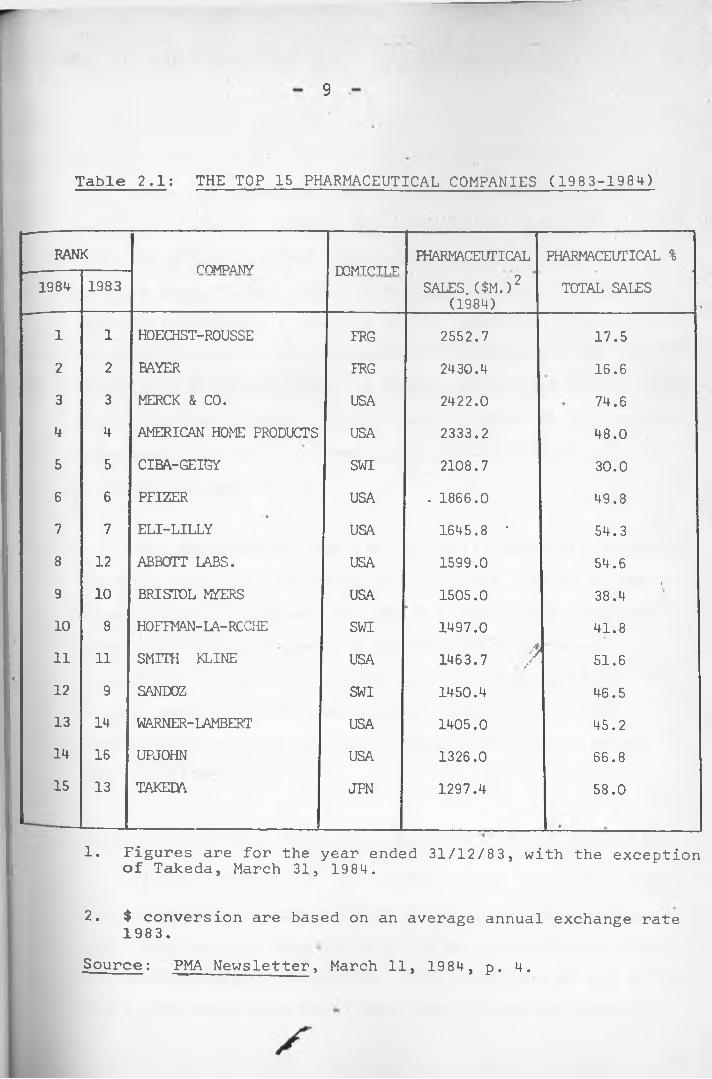
Table 2.1 provides a list of the top 15 pharmaceutical companies according to their pharmaceutical sales volume in 1984. • __ __
tical supply houses.^
9
Table 2.1: THE TOP 15 PHARMACEUTICAL COMPANIES (1983-1984)
RANK COMPANY PDMTPTT T? PHARMACEUTICAL PHARMACEUTICAL %1984 1983
lA/i 1 I V -. 1 1 il .SALES. ($M.)2
(1984)TOTAL SALES
1 1 HOECHST-ROUSSE FRG 2552.7 17.52 2 BAYER FRG 2430.4 16.63 3 MERCK & CO. USA 2422.0 74.64 4 AMERICAN HOME PRODUCTS USA 2333.2 48.05 5 CIBA-GEIGY SWI 2108.7 30.06 6 PFIZER USA . 1866.0 49.87 7 ELI-LILLY USA 1645.8 • 54.38 12 ABBOTT LABS. USA 1599.0 54.69 10 BRISTOL MYERS USA 1505.0 38.4 110 8 HOFFMAN-LA-RCCHE SWI 1497.0 41.811 11 SMITH KLINE USA A1463.7 / 51.612 9 SANDOZ SWI 1450.4 46.513 14 WARNER-LAMBERT USA 1405.0 45.214 16 UPJOHN USA 1326.0 66.815 13 TAKEDA JPN 1297.4 58.0
1. Figures are for the year ended 31/12/83, with the exception of Takeda, March 31, 1984.
2. $ conversion are based on an average annual exchange rate1983.Source: PMA Newsletter, March 11, 1984, p. 4.

10
Table 2.1 shows that the top 15 positions in the world pharmaceutical market are dominated by nine USA MNCs, MNCs have extended their operations in foreign markets mostly to the LDCs. Their participation in those countries include: 1) selling active ingredients used inthe formulations by local industry 2) distribution and high promotion of finished drugs 3) direct manufacture of pharmaceutical products through their subsdiaries or license agreements with the local manufacturers and 4) intensive R & D in the foreign market.
This participation has significantly contributed towards the MNC's sales and profitability. In 1978, 40% of 'global sales of ethical products for the U.S. based drug companies came from overseas sales. In addition, foreign, sales7 0accounted for about 50% of their total-profits in 19 74.In most cases these. MNC make higher profits in the LDCswhen compared to locally owned companies with less foreign
, 7participation.
2.3 THE POSITION OF THE THIRD WORLD IN PHARMACEUTICAL PRODUCTION
In late 1970's, the LDCs produced only 11% of the total value of pharmaceutical products in the world (Asia 5.6%, Latin America 5.2%, and Africa 0.5%) as opposed to 70% from the developed market economies. Over two-thirds of the third world production came from India, Brazil, Mexico, Argentina,

oEgypt and the Republic of Korea .
Table 2.2 shows that very few LDCs manufacture many intermediates required for a pharmaceutical industry.The rest are completely dependent on More Developed Countries (MDCs)’ for the supply of finished drugs, inter- mediates (raw materials, equipment and packaging material). About 40-60% of intermediates used in LDCs come fromUnited States, Great Britain, Switzerland, France and
. *9Federal Republic of Germany.
The countries that have 'started local formulationshave another problem associated with technology. MNCs haveestablished their own technology in the LDCs. This has hadadverse effects in these countries. The production processes
* mdesigns and plants are mostly based on importe'd raw materialswhich limits the use of local imports.
The development of the pharmaceutical industry in the third world variesbetween countries and is further explained in five stages (see table 2.2).
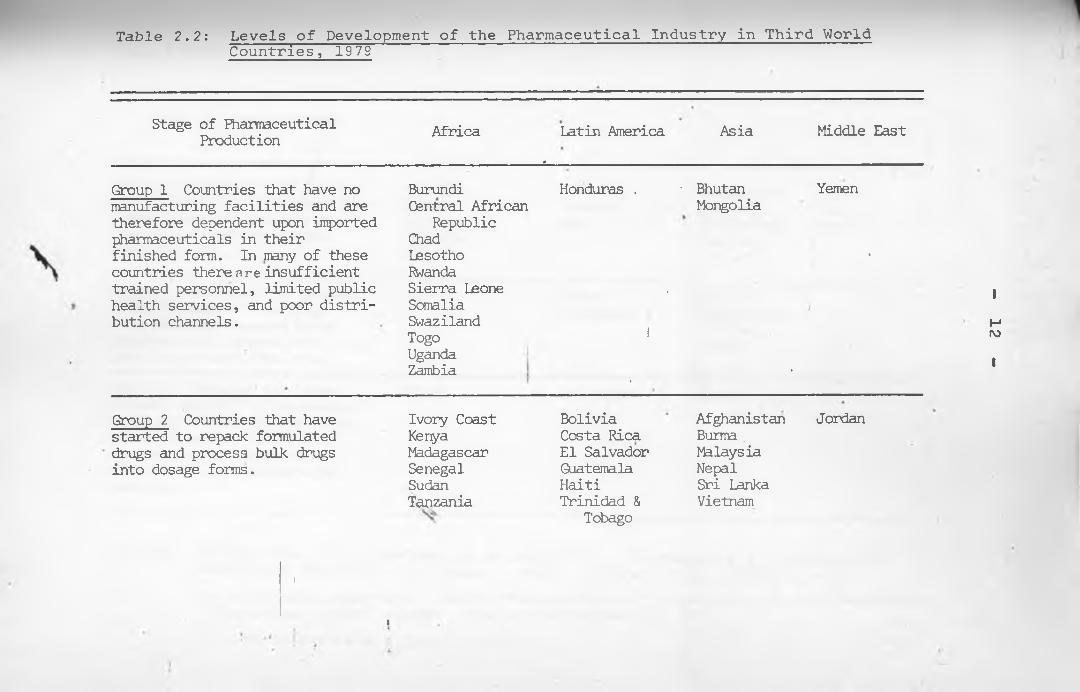
Table 2.2: Levels of Development of the Pharmaceutical Industry in Third WorldCountries, 1979
Stage of Pharmaceutical Production Africa Latin America
*Asia Middle East
Group 1 Countries that have no Burundi Honduras . ■ Bhutan Yemenmanufacturing facilities and are Central African Mongoliatherefore dependent upon imported Republicpharmaceuticals in their Chadfinished form. In many of these Lesotho •countries there nre insufficient Rwandatrained personnel, limited public Sierra Leone . 1/health services, and poor distri- Somaliabution channels. Swaziland H
Togo 1 rv>UgandaZambia . • 1
Group 2 Countries that have Ivory Coast Bolivia Afghanistan Jordanstarted to repack formulated Kenya Costa Rica Burma .drugs and process bulk drugs Madagascar El Salvador Malaysiainto dosage forms. Senegal Guatemala Nepal
Sudan Haiti Sri LankaTanzania Trinidad & Vietnam
Tobago
I
4

Table 2.2 Cont.
Stage of Fharmaceutical Production Africa Latin America Asia Middle East
Group 3 Countries that process a broad range of bulk drugs into dosage forms and manufacture sane simple bulk drugs from Intermediates.
AlgeriaChanaMoroccoNigeriaTunisia
ColombiaEcuadorPeru
BangladeshIndonesiaPhilippinesSingaporeThailand
IranIragSyria
Group 4 Countries that produce a broad range of bulk drugs fran intermediates and manufacture some intermediates using locally produced chemicals.
ChileVenezuela
Pakistan Republic of
Korea Turkey 4
Group 5 Countries that manu- facture most of the intermediate required for the pharmaceutical industry and undertake local research on the development of products and manufacturing processes
Egypt
-------------
ArgentinaBrazilMexico
India <
Source: UNIDO, "The steps involved in establishing a Pharmaceutical Industry inDeveloping Countries." Vienna: UNIDO. (ID/WG.267/3). 1978, p. 3.IMS Vtorld Publications Ltd. "Health, Pharmaceutical and Development Indicators World-wide: A Statistical Survey". London: IMSworld Publications Ltd. 1979as cited in Gereffi, G., op.cit., ppv-184-5.

14
(see Table 2.2) The pharmaceutical industry in the third world, especially Africa, is still in the first two stages of development characterised by dependency on finished pharmaceutical products. Only five countries, three of which are in Latin America have reached stage five.
Inspite of low development, studies of the pharmaceutical industry in many LDCs elicit significant issues which merit attention. These are capacity utilisation, technology transfer and commercialization, transfer pricing, use of brand and generic names, and bulk purchasing. These issues are discussed in more detail in the next section.
2.4 CAPACITY UTILISATION
This section begins by defining capacity, before. . .' ?examining various measures extent and causes of idle
capacity in selected LDCs. •
DEFINING CAPACITY
The term capacity is generally viewed from two perspectives, namely technical or Economic. Klein11"* defines
. •» » — .
technical capacity as the maximum physical output produced per unit of time with a given fixed stock of capacity facilities. By contrast, economic capacity does not necessarily refer to maximum output. It considers costs and limitations imposed by different sectors of the economy. For

15.
an individual firm, Klein11 defines capacity as the output level which can be produced at the minimum of the average cost given the existing plant and equipment, techniques and factor prices.
MEASUREMENT OF CAPACITY UTILIZATIONVarious measures of capacity utilisation have been
advanced by many economists. Each has merits and- limitations. This section reviews five methods. The McGraw- Hill measure; Wharton School Econometric Unit; National Industrial Conference Board; the Federal Reserve approach (production function) and the weighted average time-based method.
12The McGraw-Hill Measure
In 1947, the McGraw-Hill department of Economics used cross-sectional data obtained from an industrial survey to come up with a measure of capacity. 'The survey which used a questionnaire, compared: 1) actual production forprevious years 2) actual time operated to the hours the firms preferred to operate. The individual findings were later aggregated at the industrial level by using employment weights.
Limitations
Despite its useful contributions, the method has been
S

16 -
attacked due to its inability to define "capacity" and "physical volume" adequately. According to A. Philliphs, the McGraw-Hill measure could suffer from four sources of bias. These include (1) inclusion' of changes in capacity resulting from mergers and consolidations- (2) occurence of errors due to incorrect industrial classification (3) inability to account for bankruptcies of firms and retirement of facilities and (4) bias caused by an overweighting of•thfe replies by large firms.
13Wharton School Econometric Unit
.This -method involves plotting quarterly output figures %constructed from three-month av.erages against time and
peaks for inspection. Each peak is defined as capacity and a straight line joining intervening peaks represents the capacity during the respective period. ,y
Major criticisms to this this method have been advanced by
Limitations
14 15among others A. Philliphs; G. Perry; G. Briscoej__P. O'Brien and D. Smyth; and K. Hilton^. These are
. •» >18summarised by N. Phan-Thuy as:
"(1) Peaks may not represent the same level of utilisation in each cycle and capacity may not follow a straight line between peaks;

17
2) the Wharton process implies that capacities increase smoothly between two peaks, without regard to the increase in labour and 'capital availability;
3) there is a possibility that peaks inoutput represent different levels of utilisation. In the aggregate index this can arise from two sources: firstthe changing strength of peaks in individual countries; second, the changing degree of synchronisation;
4) the*method is unable to distinguish any difference in the intensity of utilisation at different peaks in an industry's output;
• 5) there is a problem with industries whose output series show a declining trend,
- ‘ for them the rules for selection of. peaks and interpolation between them
are. liable to generate distinctly implausible results;
6 ) the Wharton method treats capacity output as a single function of time and does not relate output to input's."
The National Industrial Conference Board19
This measure uses the balance sheets and any other income statement to collect data on fixed capital. This data is later deflated, after which capital/output ratios

18
of the firms are calculated. Using a base year the highest reciprocal capital-output ratio is assumed to be the full capacity utilisation index, from which all other ratios can be calculated. The lowest capital-output ratio is taken to indicate the highest capacity utilisation.
The major principal objection to the method is that it does' not estimate capacity directly.
20Production function Approach
The'production function approach involves the estimation »of cost or production functionary sector. The point of minimum average cost is usually taken to represent full capacity output in a competitive environment. For each sector, actual output is defined by the conventional production function relationship:
X = A rtLa id. V. t e et Ut t
where: = Actual Output at time t.L = Man hours employed at time t.K . = Real capital utilized at time t. rt _e = Proxy for technical change.
=.Disturbance at time t.
full capacity output is defined as:

19
The problem with the method is usually'related to the errors obtained when estimating ; such errors are caused by 1) measurement error and K_ 2) mis-specification of the equation'or 3) biased parameter estimates of . As a result it may be difficult to get an accurate measure of actual output for various reasons.
Weighted Average Time-based Measure
In Kenya, P. Coughlin measured capacity utilisationin the Kenyan foundries and metal engineering workshops
21using a time based measure. The method uses a questionnaire to obtain information on (1) working time (2) level of actual and theoretical production and (3) slackness in the use of labour and capital during the•
Yrespective period. With this information, the' weighted average capacity utilisation with slack variable (U^) and without slack variable (l^) is calculated using the formula below:
1 XnE
/ L. H . V ]/ is l a
X U h s * )n i-1 120E E L .
i=l s=l 15— — — 1

20
1n
x E - f a - q ^ )ni r l . i=l s=l 18
i=l . (1+Ai) x 120i- U #
where U,
U,
Weighted average utilisation rate (without slack)Weighted average utilisation rate (with a slack)
s = 1 , 2 , ... number of shifts per dayi = 1 , 2 , ... number of firms interviewedL. = Labourers in plant "i" during shift "s”L. * = Number of the labourers on the biggest shift
in plant i.H. - Average hours worked per week at plant "i"
during shift s.•=■ A measure of slack during the current^hift.
It shows additional work that could b'e realized withou’t/additional work hours, employees or plant and equipment.
Limitations
(i) The measure relies on data from those interviewed, such information might be inaccurate, subjective or based on mere approximations.
(ii) The measure is only good for calculating the rate 3^ capacity utilisation at a point in time. To overcome this, various points in time should beobserved.

iii) In cases where the slack is omitted, the capacity r. utilisation may be overstated.
iv) The approach also overlooks the cost and profit implications of increased production.
THE EXTENT OF CAPACITY UTILISATION IN SELECTED LDCs
LDCs- stress the economic importance of better utilisation of industrial capacity as a factor of acceleratingindustrial development. By contrast, LDCs rarely use more
2 2than 60% of their productive industrial capacity. . A survey of many LDCs reveal the existence of massive underutilisation of productive resources coupled with low employment and output growth rates. This section explores the
selected LDCs in- Africa, Latin America and Asia.
23M.V. Raghavachari's study on the excess capacity and production potential in selected industries in India, revealed that the degree- of • underutilisation of industrial capacity increased considerably in late 1360's. The overall rate of capacity utilisation was about 75% based on one shift. The chemical industries and the metal andengineering industries had the lowest capacity utilisation*rates of 53.8% and 67.7% respectively.

- 22.
In Pakistan (1965-66), G.C. Winston , estimated the capacity utilisation for the whole manufacturing sector to be 64% and 33% based on the existing shift and desirable shift basis (2j shifts) respectively.
• 24
L. Currie's study on Latin American countries showthat most equipment la not in operation more 'than 10-15%of the time. Host firms operate only one shift and theworking days in a year-are not more than 2 20 days. Thissituation was seen by many economists to be responsible for
26the slow and uneven economic development in Latin America.
27 .28 29Studies in Israel , Malaysia , Columbia , and30Philippines indicate an average capacity utilisation
(unweighted) of 35%, 50%, 36%, and 42% respectively. *
In Tanzania, S.M. Wangwe, estimated the capacityutilisation at 35% for the capital goods sector and 50-60%
. 31for the manufacturing sector.
In Kenya, the existing surveys on idle capacity revealmassive underutilisation. These studies Tiave been done by(1) P. Coughlin for the Kenyan foundries (23%)32 and
3 3metal engineering workshops (34%) (2) H. Mwangi for34plastics (53%) and I.L.0. for the entire Kenyan
manufacturing firms (34%)33.

23
Although the measurements of capacity utilisation in- Ithe above countries differ, the general conclusion is that
there is usually enormous’ underutilisation of scarce and productive resources in LDCs.- Firms cannot 'produce as much as they would like with the existing investment. This leads
to slow growth and stagnation of the industrial sector in many LDCs- To curb this, many countries have.launched studies to examine the factors responsible for the idle capacity. Some of the major factors are reviewed in the next section.
2 - 5 CAUSES OF CAPACITY UNDERUTILISATION IN LDCs
An investigation of the causes of excess capacity is a step towards devising adequate policies aimed at fuller
Aj'utilisation of plant and equipment in any nation. This section examines the major factors generally attributed to the massive underutilisation of productive resources in LDCs
Studies on the causes of capacity underutilisation inLDCs have bean done by among others (1) A. Baily for-Kenya
•» •
(1974)^6 (2) S.M. Wangwe for Tanzania (1977)37 (3) R.K. Koti3 8for India (1967/68) (4) "Brazilian Institute of Economics"
39for Brazil (1968) (5) M.S. Brodersohn for Argentina(1971)40.

24 \
In all the surveys, entrepreneurs were asked to rank, in order of importance, the causes hindering the attainment of. maximum production. These factors were first weighted before obtaining a cross sectional analysis.
The major causes identified, which are typical of other LDCs can be grouped into the following categories:
(A) Supply Bottlenecks .
These include restrictions in the supply of intermediate inputs and capital goods. This often shows up in form of:
i) infrastructural problems (shortage of electricity, water and technical services);
ii) restrictions on the provision of imported and domestic raw material;
&
iii) inadequate provision of imported equipment and*«-• • - ~
machinery.
(B) Demand Limitations
The demand limitations includes the deficiency and/or seasonal demand for products manufactured. This is prevalent in various ways, first, it may be serious, implying that the production capacity is far in excess of what the present economy can absorb or some industries might have the policy of keeping reserve capacity to meet future or
ssudden demand.

Other limitations include :i) Restrictions in monetary and credit facilities,
ii) Restrictions resulting from inappropriate taxation and tariff policy.
Whereas most of the enterpreneurs interviewed in the above studies ranked demand limitations as a major factor, this may. not always be the case. According to a study done
41by M. Kabaj , long run underutilisation is often associated with problems regarding the government's industrial policy especially its investment policy. These are summarised by M. Kabaj as:-^
(1) Lack of feasibility studies and/or overestimation of demand; (2) Lack of concepts of optimum'capacity utilisation, reliance a single shift basis and so-called '"normal / practice" of capacity utilisation'during the period of plan designing; (3) Lack of longterm co-ordination of investment policy; lack of information about the degree of capacity utilisation in existing plants; licensing policy; (4) Existence of an oligopolistic situation.
Brazil serves as an example of a country where much excess capacity was built due to improper planning strategies in the early 1960's. The government's restriction on imports (1951-64) was not coupled with policies to control investment in local productive capacity. The entrepreneurs rushed into heavy investments without proper

26
projection or pre-feasibility study. The industrial4 3sector . finally ended up with much idle capacity.
Israel’s experience reveals cases where excess capacity can even create further excess capacity due to an improper Government Policy on long-term investment.
indicates that excess capacity which exists in an oligopolistic structure can be worsened through new investments.For example, generous government policies, attracted additional investments and increased the productive capacity as new investors came into production. This increased the rate of excess capacity. (
After considering the nature extent and causes of excess capacity in LDCs, the next sections examines the issue of technology commercialisation and transfer.
2 * 6 TECHNOLOGYK r
The technological gap between the LDts and MDCs is one of the critical problems in industrial development. LDCs rely on imported technology for the development of their industries. The contractual terms for the acquisition of "technology financially burden the LDCs and deny them a substantial share of benefits from foreign investment.
4 4M. Merhav's study. of selected industries in Israel (1969)
27
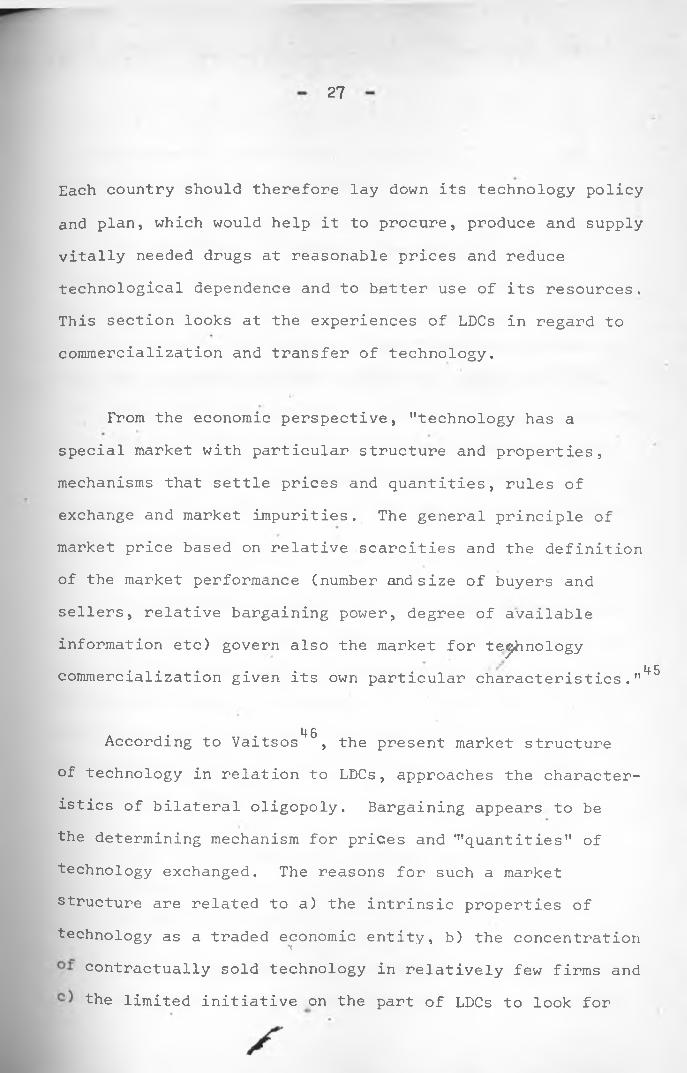
Each country should therefore lay down its technology policy and plan, which would help it to procure, produce and supply vitally needed drugs at reasonable prices and reduce technological dependence and to better use of its resources. This section looks at the experiences of LDCs in regard to commercialization and transfer of technology.
From the economic perspective, "technology has a special market with particular structure and properties, mechanisms that settle prices and quantities, rules of exchange and market impurities. The general principle of market price based on relative scarcities and the definition of the market performance (number and size of buyers and sellers, relative bargaining power, degree of available information etc) govern also the market for technology commercialization given its own particular characteristics." 45
. . 46According to Vaitsos , the present market structure of technology in relation to LDCs, approaches the characteristics of bilateral oligopoly. Bargaining appears to be the determining mechanism for prices and '"quantities" of technology exchanged. The reasons for such a market structure are related to a) the intrinsic properties of technology as a traded economic entity, b) the concentration
y
contractually sold technology in relatively few firms and the limited initiative on the part of LDCs to look for

28
alternative sources of technology.
In bargaining, LDCs should have comprehensive information to strengthen their negotiation strategy.This should include the conditions that they are likely to accept or reject. By contrast, this is not always the case. Most LDCs are confronted with structural weaknesses. TheyIlack institutions to 'intervene in the negotiations. Furthermore, the contracts regarding technology commercialisation are usually treated as "confidential" and "secret" documents. This limits the data for both intra-and intercountry comparisons.
The experiences in regard to technology commercialization is similar among LDCs. Their inability to adequately evaluate technology contracts subjects them tc/acceptunfavourable terms and conditions in bargaining. Studies of
47the Phillipines and the Andean Countries (Bolivia,noColombia, Chile, Ecuador, Peru). show the most common
restrictions. These include:-•t *
i) Registering payments for technology for periods longer than actual learning period and absorption of new technology.
ii) Registering high royalty payments especially in countries lacking state control.
s

29
iii) Registering restrictive clauses, especially in regard to the purchase of intermediate inputs, exports, distribution and marketing of the products.
The above terms and conditions have had negative impacts on the development of LDCs. These include excessive payments for royalties, technical fees, management, consultancy fees etc.. The undesirable terms and conditions also render LDCs to be dependent on parent licensors for the supply of intermediate inputs..
4.9 50From this experience, India, Latin America and Andean countries^ have strengthened their screening capacity for acquiring imported technology. Irj all cases,
■ 'jr
the policies aim at (1 ) discouraging restrictive practices (2) lowering or abolishing royalty payments (3) limiting the duration of licence and (4) unpackaging the technology.
Only 20% of the LDCs control the acquisition of imported technology. The rest should learn from this experience. It is the purpose of the study to investigate this issue in the case of the Kenyan lharmaceutical industry.
2 , 7 TRANSFER PRICING5 2Transfer pricing is„common with intra-firm trade
s

30
though unrelated concerns may also collude to transfer53funds across boundaries. In Lall's terms , the problem
has remained a curious blind spot in the rapidly growing academic literature on transnational corporations and its effects on trade and development.
The task of checking transfer pricing is complex and requires specialised knowledge over a broad range, of commodities. Any discussion on transfer pricing has to assume that there exists a yardstick by which the price can be measured inorder to determine whether the goods and services are either overpriced or underpriced.
Many subsidiaries of MNCs are dependent on their parent companies for the supply (or approval of the source) of raw materials and' technology they use. Fory*these, they are required to make payments such as management, technical and trade mark fees, royalties, contributions to parentoverheads, buying commissions etc. These payments can be
cquite high. Moreover such dependence facilitates transfer pricing through collusion between the mother company and the subsidiary.
When a local subsidiary buys raw materials from the parent company or any approved agent, the practice of paying large buying commissions is common. This is sometimes

31
calculated as a percentage of all imports or sales and it can be sizeable in relation to book profits. As one Kenyan subsidiary noted it could easily form the main returns to some mother companies. 54 Langdon came'across an extreme case where the commissions to the parent company were as high as 80-90% of local capital employed, compared to after-tax profits of 3% of capital employed. 55
Studies of the drug industry in various countries showMNCs making huge profits at the home base by raising pricesfor materials supplied and services rendered to subsidiarycompanies. For example, findings in 1973 by the MonopoliesCommission investigating transfer pricing on Roche product^(chlordiazepoxide and Diazepam) in U.K. show that profitsfrom transfer pricing accounted for 76% of the^'total profitsin 1966-72, and came to over six times the amount of
5 6declared profits.
In 1968, the Columbian Government estimated theweighted average of over-pricing for various pharmaceuticalproducts to be between 87%and 155%. For some industrial
5 7products it was as high as 3000%. These results were based on the formula down:
Overpricing was defined as Pc - Pw Pw x 100

32
where Pc = Cif Price (home port)Pw = Cif Price (from cheapest source)
The investigators took the average of available quotations rather than the lowest one and allowed for transportation costs and a 2 0% margin error.
In 1980, another study in Columbia revealed MNCs
The MNCs sold• chlordiazepoxide (Librium-) for $ 1250 per kg.but the same substance could be obtained from other sourcesfor $ 18.9 per kg. and MNCs sold Diazepam (Valium) for$ 2500 per*kg., but it could be_obtained at $ 30 per kg.from other sources. Nitrazepam (mogadon) was sold by theMNCs at $ 2088 per kg. but it could be secured at $ 108 per
5 8,kg. from other, sources .
at a price 1500% higher than the cheapest source.
In Mexico, the average rate of over-pricing for—five steroid hormone imports (progesterone, prednisone, prednisolone, estradiol and hydrocortisone) ranged from
charging higher prices on various pharmaceutical products.
5 9 .In early 1970’s , in Argentina, Diazepam was imported
160% to about 290c£° compared to the. cheapest For further details, see table (2 .3 )..
source.

Table 2.3Overpricing of Imports in the Mexican Steroid Hormone Industry, 1974
Product Countryof Origin Kilograms Pesos Unit
PriceRate of
Overpricing3(percentage)
Amount of Overpricing(pesos)
Progesterone Federal Republic of Germany
2 1,032 516 _c 0
France 35 67,745 1,936 375 49,685Spain 5 32,060 • 6,412 1,243 29,480Nethelands 37 1,078,620 29,152 5,650 1,059,528
. Total 79 1,179,457 14,930 2,893 1,138,693
Prednisone Italy 3 6,026 2,009 _c 0France 137 1,037,565 7,573 377 762,332Brzil 10 102,660 10,266 511 82,570Netherlands' 20 350,365 17,518 872 310,185
Total « 170 1,496,616 8,804 • 438. 1,155,087
Prednisolone United Kingdom \v 5 31,250 6,250 _c 0Panama X 29 292,750 10,095 . 162 111,500France 21 246,150 1 1 , 7 2 1 188 114,900Federal Republic
of Germany1 1 171,725 15,611 250 102,975

Table 2.3: Cont.
Product Country of Origin Kilograms Pesos Unit
PriceRate of
Overpricing3 (percentage
Amount of . Overpricing
(pesos)
Italy 6 118,063 19,677 315 80,563Netherlands 23 620,223 .26,966 431 476,473Total 95 1,480,161 15,581 249 886,411Estradiol Prance 5 56,999 11,400 _c 0Federal Republic
of Germany10 309*466 30,947 271 195,466
Total 15 366,465 24,431 214 195,466Hydrocortisone Netherlands 5 35,919 7,184 _c 0Federal Republic
of Germany7 68,330 9,761 136 18,042
Bermuda 9 601,020 66,780 930 536,364Switzerland 13 . 1,006,355 77,412 1,078 912,963Total 34 1,711,624 50,342 701 1,467,369
aThe rate of overpricing is based on a minimum price at which a selected steroid hormone product was imported into Mexico in 1974. Any excess over this minimum price is considered to be an overprice. To reduce the possibility of bias frcm low discount prices for bulk purchases, the selected minimum (or reference) price for each product is derived from import totals whose volume is always lcwer than that of any of the other import sources used in the comparison.The amount of overpricing is calculated ''by multiplying the minimum unit price by the number of kilograms received from each importing country and then subtracting this result from each country's actual import total pesos.°The unit price from this import source is the minimum, or reference, price.Source; Mexico, secretaria de Industria y Comercio, Direccion General de Estadistica, 1975, Annuario estadistico
del ccmmercio exterior. Mexico, D.F. pp. 166-168 as cited in Gereffi, G., op. cit. pp. 148-9.

35
In Brazil, the Government's inquiry revealed cases ofoverpricing ranging between 500% to 1000% compared to arm's
6 2length prices.
In Kenya, the IL0 noted cases where parent inputsimported by subsidiaries were being priced at 20-30% higher
6 3than they could fetch on the open markets.
Survey evidence by Langdon showed that until recently, a subsidiary of a large textile firm purchased all inputs from the parent company at a price much higher than competi-
64tive prices. Soft drink subsidiaries reported considerable parent profits on the sale of imported concentrates. Three pharmaceutical firms reported that they (or their head offices) had considered using transfer pricing but had rejected the option for the moment. The subsidiaries surveyed purchased an average of 23% of imports from their affliate boards.
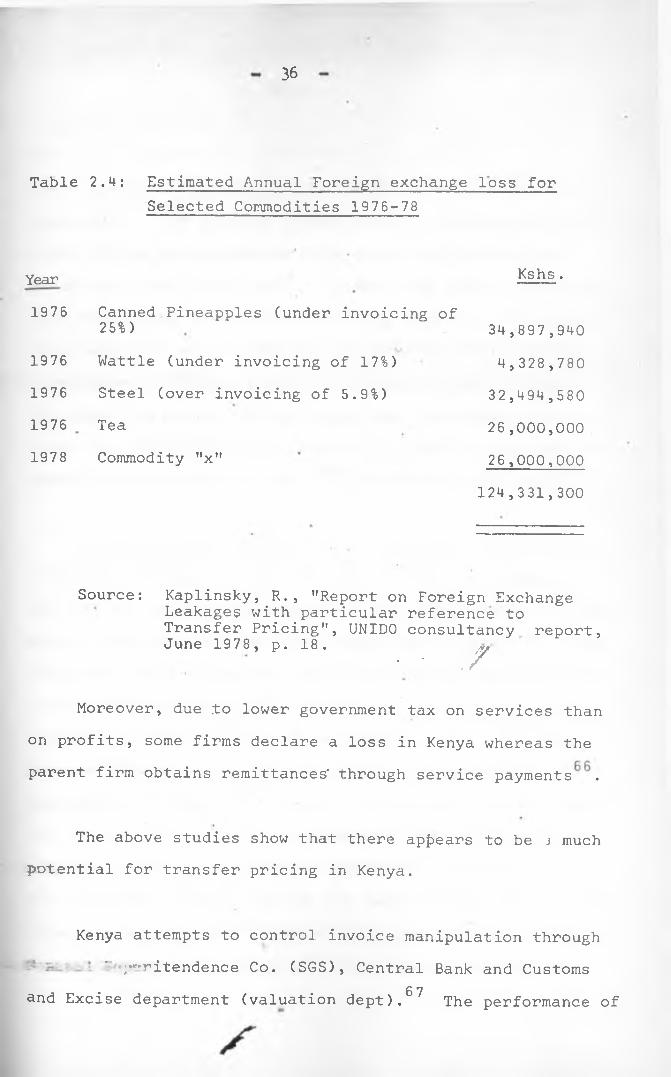
6 5Another study by Kaplinsky reveals that, Kenya has lost about Ksh 130m through invoice manipulation on just five commodities (see Table 2.4) between 1976-78.
UNIVERSITY of NaiKOU.ubbajbw
36
Table 2.4: Estimated Annual Foreign exchange loss forSelected Commodities 1976-78
Year1976
1976197619761978
Kshs .
Canned Pineapples (under invoicing of 25%)Wattle (under invoicing of 17%)Steel (over invoicing of 5.9%)TeaCommodity "x"
34,897,9404,328,78032,494,58026,000,00026,000,000
124,331,300
Source: Kaplinsky, R., "Report on Foreign ExchangeLeakages with particular reference to Transfer Pricing", UNIDO consultancy report, June 19 78 , p. 18 .
• • . /
Moreover, due .to lower government tax on services than on profits, some firms declare a loss in Kenya whereas the parent firm obtains remittances' through service payments .
The above studies show that there appears to be j much potential for transfer pricing in Kenya.
Kenya attempts to control invoice manipulation through' /'-ritendence Co. (SGS), Central Bank and Customs
6 7and Excise department (valuation dept). The performance of

these institutions, especially the SGS, has not been very impressive. For example, between 1972-77, Kenya paid SGS, Kshs. 138.9m but savings arising from their activities amounted to only Ksh. 40m^. Vaitsos and Golemis conclude that the present system of monitoring transfer pricing has been described as re-inforcing a condition of continued dependence on foreign expertise through the SGS contract. The major deficiency of the system has been identified asinability to develop a' local base of expertise and adminis-
*/but 0 9trative capabilities to carry the monitoring functions.
When practiced, transfer pricing denies the developing countries substantial benefits from foreign investments. , The use of transfer pricing means that the net gains in the country are less and the losses more than they^,would otherwise have been. The loss caused by transfer pricing may be borne by 1) the Government through loss of taxes 2) local shareholders through loss of legitimate share of profits 3) trade unions, if it deprives them of higher wages 4 )
iconsumers, through high prices. In the long run, the problem deprives the economy the benefits of ‘forgone investment and may distort the pattern of investment or worsen the existing distortions. If the low levels of declared profits, deters perspective local competition then transfer pricing
yalso perpetuates the economy’s dependence on foreigners.

38
With the present institutional structure of MNCs, high corporate taxes, and increasing local state or private shareholding in the Kenyan subsidiaries, the problem of transfer pricing could exist in the- Kenyan pharmaceutical industry. Hence an investigation should be carried out and careful regulations should be imposed to monitor its impacts so as to increase the net social benefits from the pharmaceutical industry.
USE OF BRAND AND GENERIC NAMES IN THE PHARMACEUTICAL INDUSTRY
Generic names as applied to pharmaceuticals refers to the common chemical name (established or non proprietary .name) by which, a drug is known as an isolated substance of
, / nr\a drug product irrespective of its manufacturer. A trand name, refers to any word, name, symbol or device or any combination thereof adopted and used by a manufacturer or merchant to identify his goods and distinguish them from those manufactured or sold by others. It is the manufacturer's chosen name for his product.
The debate on the use of brand and generic names in the pharmaceutical industry has brought much controversy in the medical profession all over the world. The advocates of the use of generic names contend that substantial savings
s

could result for consumers if drugs were prescribed using generic names. Other observers argue that generic names do not automatically assure economy.
Whereas more than 40% of all trademarks used in the7 2world relate to the pharmaceutical and associated goods,
the use of generic prescriptions is increasing in importance.According to an estimate by Hemant Shah, a drug-industryspecialist; .by 1987, 25% of all prescriptions in the world
7 3will be filled with generic drugs compared to 15% in 1983.This has been estimated by the Food and Drug Association(FDA) to yield about US $ 1 billion in savings to the
74consumers over the next 1 2 years. (
The observers favouring brand-names argu^/ that a manufacturer should be able to identify his products and distinguish them from those manufactured or sold by others since they consider anonymity to be an advantage for the manufacturers whose production is of poor quality. This is believed to ensure that the manufacturers are given credit for whatever reputation for reliability they have developed, encouraging greater research and development.On the other hand, there is little R & D in LDCs. Also theUse of brand names has been attacked for involving lar> expenditures on sales promotions leading to escalating Prices for drugs. A priq,e survey carried at an Eckerd Drug
s

40
store in Atlanta revealed that generic named drugs were much cheaper as shown below:
Brand Name Generic Name Use
Achromycin v.$ 9.79 /250 mg.
Tetracyline $ 5.59 Antibiotic'
Erythrocin Erythromycin Antibiotic$20.95 /25 mg. $ 15.29Dimetapp $ 23.99
Brompheniramine $ 8.55 Antihistamine
Librium.$ 21.95 710 mg. Chlordiazepoxide $ 6.75Tranquilizer
Mellaril Thioridazine • Tranquilizer$ 19.29 710 mg. $ 14.79Las ix$ 15.59 y40 mg.
Furosemide $ 9.85 Diuretic
Hygroton $ 29.29 y50 mg. Chlorthalidone
$ 11.55 Diuretic
Isordil Isosorbide Anti-anginal$ 13.39 yiO mg. $ 5.89Persantine $ 17.45 y25 mg. Dipyridamole
$ 7.35 Anti-anginal
Elavil$ 16.99 y25 mg.
Amitriptyline $ 8.55 y25 mg. Antidepressant
In addition, the use of brand names has also been seen as a key obstacle to the preparation of national drug lists The use of brand names create undesirable monopoly or market power making entry into the industry difficult especially when the consumers have developed brand royalty towards some products. This can contribute to stagnation °f the pharmaceutical industry in the developing countries.
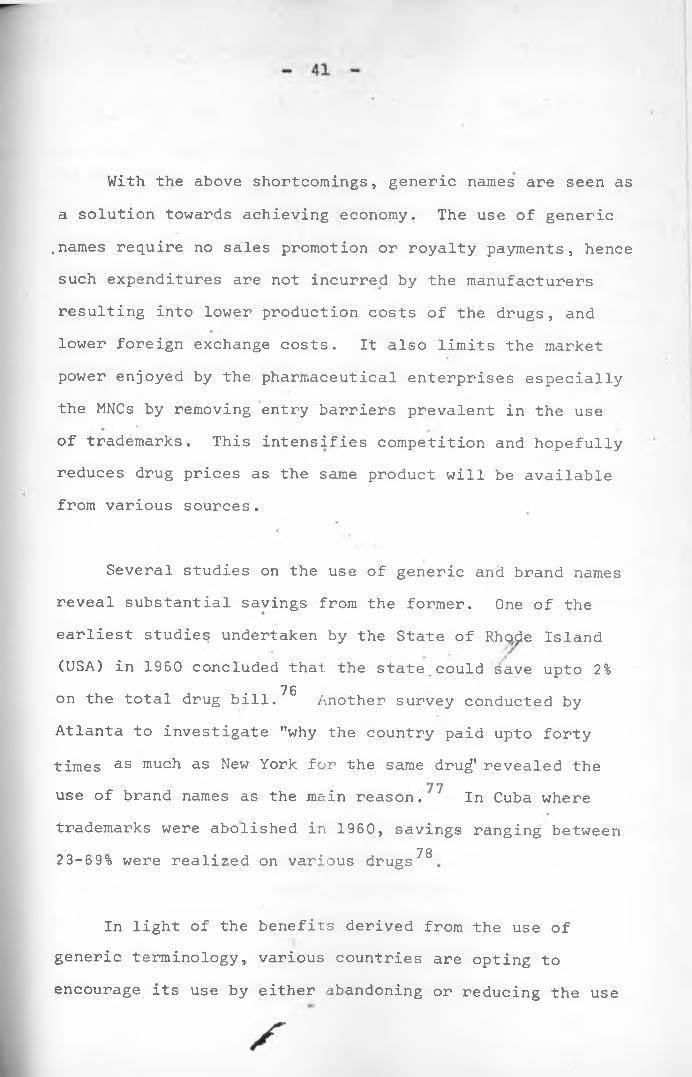
With the above shortcomings, generic names are seen asa solution towards achieving economy. The use of generic .names require no sales promotion or royalty payments, hence such expenditures are not incurred by the manufacturers resulting into lower production costs of the drugs, and lower foreign exchange costs. It also limits the market power enjoyed by the pharmaceutical enterprises especially the MNCs by removing entry barriers prevalent in the use of trademarks. This intensifies competition and hopefully reduces drug prices as the same product will be available from various sources.
Several studies on the use of generic and brand namesreveal substantial savings from the former. One of theearliest studies undertaken by the State of Rhq ie Island(USA) in 1960 concluded that the state.could save upto 2%
7 6on the total drug bill. Another survey conducted byAtlanta to investigate "why the country paid upto fortytimes as much as New York for the same drugf revealed theuse of brand names as the main reason. In Cuba wheretrademarks were abolished in 1960, savings ranging between
7 823-69% were realized on various drugs
In light of the benefits derived from the use of generic terminology, various countries are opting to encourage its use by either abandoning or reducing the use

42
of trademarks. In Florida, for example, druggists arerequired to tell the consumers how much they will save by
79using generic products. Besides, several insurancecompanies in U.S. (Aetna, Metropolitan, Prudential, BlueCross/Blue shield) have notified policy holders that theywill be reimbursed for 1 0 0 % of the cost of generic drugs,
8 0but only 80% of the price of brand-name pills.
2 , 9 PULK PURCHASING *
A centralised bulk procurement system for pharmaceutical products, with many sources of supply through onen interna- tional tenders, has many economic advantages, as has been proven in many countries. This section examines the experiences of certain LDCs in this connection.
The establishment of a centralised purchasing agency in the procurement of pharmaceutical products- using generic names strengthens bargaining power. Since the agency deals with a large volume of purchases, it could have better market and product information through worldwide shopping. The agency could obtain large discounts and better procurement conditions. In addition, centralised purchasing could

43
limit the practice of paying large buying commissions and overpricing of intermediate inputs by MNCs subsidiaries*
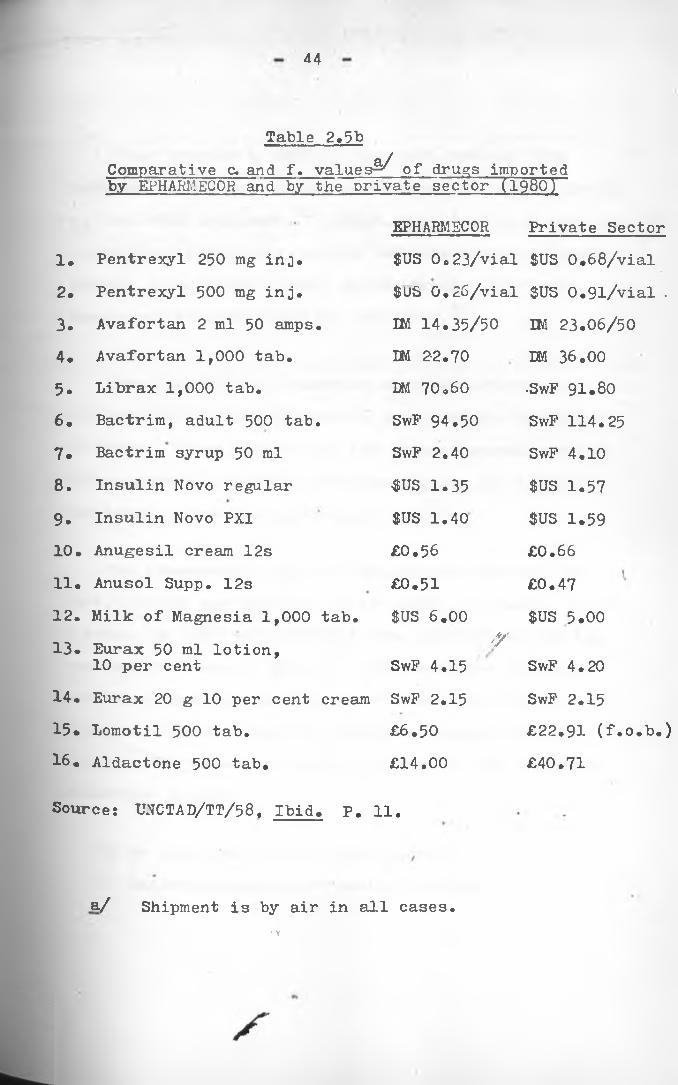
Ethiopia has realized substantial savings on some drugs through bulk purchasing using generic names. This is demonstrated by wide differentials between prices paid by, Ethiopian Pharmaceutical and Medical Supplies Corporation (EPHARMECOR), and by private importers. Table 2.5a and 2.5b gives details on comparison of prices for selected drugs in 1979 and 1980.
Table 2.5aComparative f.o.b. -price per unit paid by EPHARMECOR and by a private importer (1979)
(Equivalent in birr)Products and EPHARMECOR• Private importerdosage form Supplier Price Supplier PriceAmpicillin 500 mg cap.
EPHARM 0.14 TEVA 'Y 0.22
Chloropropamide 250 mg tab.
Pfizer 1.40 Pfizer 1.85
Erythromycin 250 mg cap
Upjohn 0.04 Pfizer 0.35
Phenylbutazone 200 mg tab.
EPHARM 0.06 • Ciba-Geigy 0.28
Reserpine 0.1 mg tab.
Pharmchemi 0.08 Ciba-Geigy 1.40
Tetracycline 60 ml syrup
Medichemi 1.30 Pfizer 3.74
Sources UNCTAD "Technology and Development Perspectives of the Pharmaceutical Sector in Ethiopia", UNCTAD/TT/58, United Nations Publication, Geneva, 1984. P.H.
44
Table 2.5bComparative c. and f. values^ of drugs imported by EPHARMECOR and by the private sector (1980)
EPHARMECOR Private Sector1. Pentrexyl 250 mg inj. $US Oo 23/vial $US 0.68/vial2. Pentrexyl 500 mg inj. $US 0.26/vial $US 0.9l/vial .3. Avafortan 2 ml 50 amps. IM 14.35/50 IM 23.06/504. Avafortan 1,000 tab. LM 22.70 DM 36.005. Librax 1,000 tab. DM 70.60 •SwF 91.806 . Bactrim, adult 500 tab. SwF 94.50 SwF 114.257 . Bactrim syrup 50 ml SwP 2.40 SwF 4.108 . Insulin Novo regular ^US 1.35 $US 1.579 . Insulin Novo PXI $US 1.40 $US 1.5910. Anugesil cream 12s £0.56 £0.6611. Anusol Supp. 12s £0.51 £0.4712. Milk of Magnesia 1,000 tab. $US 6.00 $US 5.0013. Eurax 50 ml lotion,
10 per cent'Y
SwF 4.15 SwF 4.2014. Eurax 20 g 10 per cent cream SwF 2.15 SwF 2.1515. Lomotil 500 tab. £6.50 £22.91 (f.o.b.)16. Aldactone 500 tab. £14.00 £40.71
Source; UNCTAD/TT/58, Ibid. P. 11.
a/ Shipment is by air in all cases.• \

45
Other studies by UNCTAD show that, through bulk purchasing, Guyana, Sri-Lanka and Cuba save about 30-40$
o-]on the total drug cost. x Other countries which have adopted centralised purchasing include Tanzania, India, Algeria, Zambia, Iraq, Guinea, Chad, Egypt, Brazil, Sri-Lanka,
O pUganda and the South Pacific countries.
Some neighbouring countries have had experience pooling their drug purchases so as to achieve economies of scale. These include (i) the former Central American common market (2) the former Andean group and (3) the Caribbean centre for pharmaceuticals. J
The commonwealth regional Health secretariat, for East, Central and Southern Africa based in Arusha, set up a scheme in 1977 to investigate the possibility for the
Oa / <regional purchase of drugs. The countries included are Kenya, Lesotho, Malawi, Mauritious, Sychelles,Botswana, Tanzania, Zambia, Zimbabwe, Swaziland and Uganda. The possible benefits noted from the scheme are summarised below:
•
i) An organised market intelligence,ii) Easier management of quality control,
S

iii) Benefits of economics in regard to volume of purchases,
iv) Easier control of unhealthy practices*
v) Purchase of raw materials at low prices for all manufacturers ,
vi) Easier adoption of generic names to build the country's health services program and essential drugs.
Another investigation on the possible savings through bulk purchasing using generic names reveal substantial savings. The method used here was based on a study ^by Mr. Mathenge (Chief Pharmacist in Kenya, 1977). He collected data from three pharmaceutical companies in Kenya regarding the discounts from bulk purchasing on seven pharmaceutical products (See Appendix 1, Table IVa).After this, he investigated the reductions in prices if che companies increased their purchases from one million to
Y100 million units. The results are shown below:
Discounts for large quant ities
Unitslm--5m — 10m5 0m — 100m --
Discounts------ 0%------ 2%------- 4%--------6%---------8%
- 47.
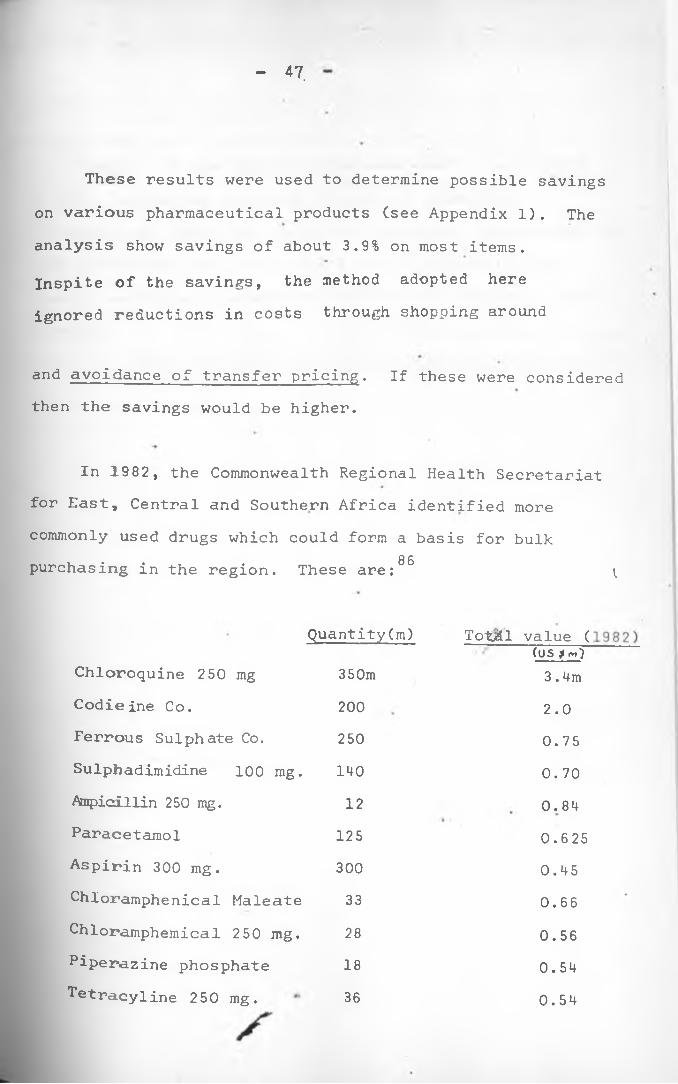
These results were used to determine possible savings on various pharmaceutical products (see Appendix 1). The analysis show savings of about 3.9% on most items.Inspite of the savings, the method adopted here ignored reductions in costs through shopping around
and avoidance of transfer pricing. If these were considered then the savings would be higher.
In 1982, the Commonwealth Regional Health Secretariatfor East, Central and Southern Africa identified morecommonly used drugs which could form a basis for bulk
8 6purchasing in the region. These are: ^
Quantity(m) Tot/ill value ((US $ rn)
Chloroquine 250 mg 350m 3.4mCodieine Co. 200 2.0Ferrous Sulphate Co. 250 0.75Sulpbadimidine 100 mg. 140 0.70Ampicillin 250 mg. 12 0.84Paracetamol 125 0.625Aspirin 300 mg. 300 0.45Chloramphenical Maleate 33 0.66Chloramphemical 250 mg. 28 0.56Piperazine phosphate 18 0.54^tracyline 250 mg. 36 0.54

48
Inspite of the benefits discussed above, the successof bulk purchasing crucially depends on effective co-operation, among the countries concerned. The success of bulk purchasing will also depend on the reliability of foreign exchange allocations made for this purpose by each country.

49
CHAPTER THREE
A DESCRIPTION OF THE PHARMACEUTICAL INDUSTRY IN KENYA
The Pharmaceutical Industry in Kenya is dominated by foreign firms both for imported and locally manufactured preparations. This chapter starts by examining- the structure of the industry: establishment, ownership, and manufacturingactivities of the firms. Next, the chapter looks at imports, exports, the internal market structure for pharmaceutical products. Lastly, the chapter examines employment and market shares of the firms.
3.1 Establishment and Ownership .of firms
Kenya’s pharmaceutical industry is still/young and has twenty five manufacturers all located in Nairobi (see appendix 2A). From the survey, all the firms entered the industry as importers and/or distributors of imported finished drugs before going into manufacturing.
Table 3.1 shows the establishment of the pharmaceutical firms in Kenya between 1936 and 1985. Didy harmaceutical Company was the first to be registered in Q r* . y* By I960, there were two additional manufacturers,
ster>ling Product s and Boots. Nine manufacturers came into
i s

production in the 1970’s bringing the total number to seventeen. These included four local manufacturers, three subsidiaries of MNCs and two under joint ventures with India and Yugoslavia. Late entries include Novelty Manufacturing (1982), Pharmaceutical Products (1981), and Regal Pharmaceuticals (1981). Inspite of the rapid growth of the number of firms in the industry, two have already closed down or turned to wholesaling. Reasons given for their exit include high competition, inadequate quality control equipments, inadequate finance and disagreement among the directors.
Table 3.1
Establishment of Pharmaceutical Firms in KenV^.- 19 36-8 5;
Year Entries Exit Total
Before 1950 2 - 21950 - 59 1 - 31960 - 69 4 - 71970 - 79 9 - 161980 - 85 3 2 17
Source: Extracted from appendix 2 which wasobtained through Field Surveys by the author,. *
*Only for the^fims visited by the author.

Table 3.2Formulations and Productive Capacities in the Kenyan Pharmaceutical Industry, 1985
FIRMFORMULATIONS
SYRUPC’OOO Litres)
TABLETS (Millions)
OINTMENTS ('000 Kgs)
CAPSULES(Millions)
INJECTABLES(Millions)
INFUSIONS (*000 Litres)
1 50 130 5 ' 48 ' 0.72 300 1150 63 120 223 2000 500 8 50 10148 120 12 24 _5 80 310 15 64 —6 15 760 48 • 807 358 55 40 0.19 t mm *8 1200 200 25 22 _9 44 18 1-5 — _
10 200 400 60 — mm11 200 . 300 45 — _12 256 - 10.8 — __ ,13 300 1155 - — • _ •14 210. - o • CD _15 300 - - - —16 5 - - — — —17 - 120 \ - — —18 - - 50019 “ 150
TOTAL«
5661 5268 347 388 32.7 650
Source: Own Survey

52.
During the survey, entrepreneurs were also asked who owns the registered firms. Their responses indicate that,ten are local manufacturers wholly owned by Kenyan Asians, thirteen by subsidiaries of MNCs and two are joint ventures. Of the joint ventures, one is Dawa Pharmaceuticals, between the governments of Kenya and Yugoslavia. The other is Kensara between private partners in Kenya and Sarabhai of India.
Inspite of the government's effort to encourage africanisation in the industrial sector, this data reveals the non-existence of Africans in the manufacture of pharmaceuticals. Dr. Muriuki was the only African who was once 1 engaged in the manufacture of pharmaceutical products in Kenya by mid-1970's.' He was a partner in Cosnu s Ltd. but due to a disagreement in 1979, he shifted to E.T. Monks &Co. Ltd., former affiliate of Cosmos.
3•2 Manufacturing activities
Local production accounts for about /?5% of the total consumption of pharmaceutical products in Kenya.^ Not all the registered firms are manufacturers. Some are simply regional distribution organisations. According to statistics by Ministry of Health, there are 152 registered and

53
licensed retail chemists, and 1 2 2 registered and licensed
retailers and 80$ of the wholesalers are located in Nairobi (for more details see appendix 2B). .
The majority of the existing manufacturers concentrateon oyer-the-counter (O-T-C) products, especially fast movinglines such as aspirin, multi-vitamins, paracetamol. Mostpreparations are non-sterile products (-syrup, suspensions,lotions., liniments, tablets, capsules, ointments etc.)which ,do.not require strict and expensive conditions of
»sterility and quality control. Tables 3.2 and 3.3 summarises the products manufactured ly the pharmaceutical industry in Kenya. Only two firms (Dawa and Mac's)are currently -manufacturing sterile products (vials and/injectables). However, during the survey, Cosmos and Laboratory and Allieds were planning to commence the production of sterile products in late 1985.
The production of intravenous infusion solutions is done in Kenyatta National Hospital (Sterile preparation unit) and Infusions Kenya Ltd. The former supplies government's medical institutions while the latter concentrates on sales to missionary and private hospitals.
wholesale dealers operating in Kenya. Porty-three

Table 3.2 categorises the formulations and productive capacity in the Kenyan pharmaceutical industry. The table was derived by asking entrepreneurs their major manufacturing processes and potential productive capacities. The process technology used in the manufacture of pharmaceutical products is similar across the industry. Appendix 3 is
provided to acquaint the reader with the variousmanufacturing processes in the pharmaceutical industry.
Table 3.3
Products Manufactured by the Pharmaceutical Industry in Kenya
Firm Products Manufactured
Chemafric Ethical pharmaceutical products: antibiotics, antimalariais, vitamins and minerals, ointments' analgesics, antirheumatics and veterinary products
Cosmos Human and veterinary pharmaceuticals
£*awa Sterile and non-sterile pharmaceuticalproducts: antimicrobials, diuretics,'anthelmintics diuretics, analgesics, corticosteroids, tranquilizers and vitamin preparations.
Dldy Over-the-Counter (O-T-C) medicinals, cosmetics and sale of pharmaceutical raw materials.
Elys Pharmaceuticals: capsules.
tablets, syrups, and

55
Table 3.3 Cont.
FirmInfusions (K) Ltd.
Lab. & Allieds
Mac’s •
Manhar Bros • •
Nicholas .Kiwi %
Novelty
P.A.C.
Regal
Sterling
Wellcome
PharmaceuticalProducts
Products ManufacturedInfusion solutions for intravenous application.by medical profession.
Pharmaceuticals and drugs: antibioticsanalgesics, anti-protozoa, tranquilizer.
Pharmaceutical and aerosol products
Pharmaceutical chemists (more of a wholesaling function).
Pharmaceuticals and cosmetics
Pharmaceutical and medical products (syrups only)Pharmaceutical preparations: analgesics,cough syrups antibiotics, antimalarials anthelmintics, multivitamins antiscabies, antidiarrhoeals, antifung-als.Pharmaceuticals: antibacterials, ant-i—malarials analgescs, antitussives.Pharmaceuticals: analgesics: anthelmi-ntics; antimalarials; gastric ailments, toiletaries and Industrial products.
Veterinary preparations, household insecticides; industrial and public health disinfectant and human pharmaceutical products.
Pharmaceuticals (syrup).

56
Table 3.3 Cont.
Boots Pharmaceutical preparations, cosmetics and veterinary products.
Glaxo Pharmaceutical preparations mostly Glaxo group of ethical items.
Source: Own Survey
Notes: 'Chemafric^Kensara} stopped production in March 1985-
Veterinary drugs
The pharmaceutical industry in Kenya is also engaged in veterinary preparations. This is currently done by five firms: Cosmos, Mac's, Wellcome,.Boots an^ Dawa(See Table 3.3). Since veterinary preparations require the •same equipment as used in the production of pharmaceuticals, many firms in the industry are planning to introduce these preparations to improve capacity utilisation.
3 * 3 Type and Source of Raw Materials
Imports
■reduction of pharmaceuticals require a broad ran^e of packing and raw materials. Nearly 7 5% of the value
s

57
of raw materials for pharmaceuticals are currcntl>7imported 2 Tradedata shows that about 95% of these originate from U.K.,
’ 3W. Germany, and Switzerland . The medicinal and pharmaceutical products imported by Kenya include both raw materials and finished drugs. These products fall under the following categories:
SITC Code No. Item541.00 Provitamins and vitamins541.300
541. **00
Antibiotics (penicillins, streptomycin,. tetracyclines etc).Alkaloids
541.500
541.600
541.700
Hormones (insulin, adrenal, hormones etc.) I
Glycosides, organo-therapeutics, antisera and bacterial vaccines, toxins, microbial cultures, etc. yJ
Medicaments with antibiotics, hormones; or alkaloids, infusipn solutions.
Between 1975 and 1983, the value of medicinal andpharmaceutical products imported by Kenya rose from Kshs. 150 m.t<
•* *Kshs. 390m, an increase of 160%. On the other hand, the percentage of Kenya's imports which were for the Pharmaceutical industry fluctuated between 1 .6% to 2 .2% ln the same period. For further details see Table 3.4.

58
Table 3.4
Imports of Medicinal and Pharmaceutical Products, 1975-83
Year Quantity (•000 Kgs.)
Value Ksh. (m)
Percentage of Total Imports by Pharmaceutical Industry
1975 25 150 2.1 %*1976 26 130 1.7%1977 . 33 200 1.9%1978 49 260 2.0%1979 n/a 220 1 .8%1980 4972 320 1 .6%1981 2512 350 1.9%1982 3905 370 - 2.0%1983 2191 390
2 ‘2% f
n/a Not AvailableSource: Kenya, Annual Trade Reports (1975 to 1983), op.cit.
Due to the rising trend in pharmaceutical imports, the government is encouraging the use of local inputs snd manufactured goods to save foreign exchange.- The.fissures adopted to discourage imports include registration
°f drugs, limiting foreign exchange allocation* and charging tgh customsduties on -products which can be obtained locally.

59
Inspite of these efforts aimed at discouraging imports, many finished drugs especially antibiotics, which can be produced locally are still imported. In the 1983/84,Kenya Association of Manufacturers' (KAM) budget proposal, various brand items, which are produced locally and should not be imported, were identified. These include:
Asafen granules Beserol granules Capiyof in ClioquinolCVC medicated ointments (vicks)Ergot granules
Milk of Magnesia Miranol C2MVicks Inhaler Medication Vicks vaporoub Medication Zinc oxide
Analgin
Despite the association's request to restrict imports of the above items, these drugs continue to be imported. Irv-a second case, a foreign based firm is currently importing the following finished drugs: Emdopa (methyldopa B.P.),Indicin (Indomethacin B.P.) and Sulphadimidine B.P.However, a local firm manufacturing similar products using
. *imported raw materials alleges that it would not begranted a license to import the same finished drugse°ause of its capacity to manufacture locally. Elsewhere,
IfHe author documented that in 1979, the same firm applied for l ■?«senses to import drugs for the Ministry of Health
s

long before the tenders had been adjudicated. ’This meansthat the firm was certain of getting the tender, andstrongly suggests corruption in the administration and/or
uCentral Tender Board . Infact, they did get the tender later.
Furthermore, many injections are being imported while the injections departments in Dawa, and Mac's pharmaceuticals are running well below their full capacities.
Local Inputs
According to the entrepreneurs interviewed, 70-75% of packing and raw materials used by the Kenyan pharmaceutical industry are imported. This leaves only 25-30% inputs to be'purchased locally. The local inputs are.mostly packaging materials, flavours, sugar, alcohol', maize starch, and glass bottles.
The use of local inputs out production costs to some manufacturers. For example, Sterling Products has managed to cut expenditure by 50% on "Philliphs mom 83ml" plastic bottles through importation of moulds from the mother company and contracting a local firm (Pan Plastics) tomanufacture the bottles. The mould which cost Ksh.• *120,000 (1970), is capable of producing about 1 0 million bottles. With a consumption of only 72,000 bottles per

61
month, the mould could be used at least for several decades. Furthermore, the mould can be repaired locally.
Sterling products has also cut expenditure by 40% on 'Pluvarit PFB' and 'Andrews Liver Salt' laminate papers by obtaining them locally from Colour Packaging, Print Pak» and Cosmos.
There still exists potential for further import substitution of various inputs in the pharmaceutical industry in Kenya. Many local manufacturers still prefer imported bottles to local ones produced by EMCO Glass Works. According to the manufacturers interviewed, imported bottles are of higher quality and 50% cheaper than EMCO bottles. Poor quality, is evidenced by the reaction rate given by individual manufacturers. Out of the total bottles supplied to the pharmaceutical manufacturers in Kenya, between 10-37.5% are rejected because of broken necks, or rough faces. However, EMCO reports that they have purchased new moulds which should improve the quality once the old inventory is used up6. EMCO Glass Works is also unpopular^ong many pharmaceutical manufacturers because it does not Provide credit to customers, transport* or refundsagainst broken bottles . v

62
Usage of local sugar provides another example of efforts by the local industry to encourage local inputs.Ten pharmaceutical firms are currently using local sugar in making dry syrups. Three *MNCs , however, stillbelieve that the local refined sugar is of poorer quality and thus prefer to import.
.The above data shows that Kenya needs to develop more inputs for use by the pharmaceutical industry and to improve on the quality of existing ones. Additional inputs that could be produced by Kenya include aluminium caps, gelatine capsules, rubber caps,and laminate papers.
3.4 Exports
From Table 3.5 the exports of Kenya pharmaceutical products show an expansion from ksh. 3,3m in 1964 to kshs. 77m in 1983. It’s significance in relation to total Kenyan exports has also increased from 0 .2% to 0 .6% in thesame period. According to the trade reports , the only
•* »Markets available for Kenya pharmaceutical products are the sorrounding African countries such as Uganda, Tanzania, Malawi, Zaire, Somalia, Ethiopia, Zambia and Burundi.

63
Table 3.5
Exports of Pharmaceutical Products by Kenya, 196*1-83
Year Quantity ('000 kgs.) Value
Kshs. (m) Pharmaceutical Industry Exports as a Percentage of Total Kenya Exports
1964•
1
•3 •0.3%
•
1974
•
t5% • 40 0.3%
• . • _____• • • •• • • •1977 1 1 44 0.5%1978 8 • 42 0 .6% y
1979 2137 47 0 .6%1980 1368 66 0.7%1981 975 74 0.6%1982 737 63 0.6%1983 1022 78 0.6%
---______ _ . , . -J. ------ --- --— — <Source for 1964 and *974: East African Canmunity, .Annual Trade
Reports for Kenya Uganda and Tanzania, Custom and Trade Department.
”CUrce 1977-83: Kenya, Annual Trade Reports, op.dit.

In 1974, Kenya introduced a 10% export compensation scheme to stimulate exports but this scheme has not influenced marketing decisions according to the entrepreneursinterviewed. Exporting is regarded by many firms as a secondary or relatively unimportant activity. The reasons given for this include: stiff foreign competition,limited markets, uncerta.inity regarding political situations, commercial policies in importing countries, and lack of foreign exchange by those countries.
3.5 Quality Control
There are between 5000-6000 pharmaceutical products manufactured and/or sold in Kenya. Some of these products
Odo not conform to required international standards.As documented by A.S. Tawfik, many of -the local manufacturers do not have•a well functioning quality control laboratory for quality assurance. Since 1980, the Ministry of Health (Drugs Inspectorate Department) has recommended the closure of two firms, Pharmaceutical Manufacturing Co. and Didy Pharmaceutical Co. The first firm was closed in 1982 , while the latter continues to operate despite recommendations by the Drug Inspectorate Department to close it.
N

65
Sources by the Ministry of Health indicate" that many other firms, both foreign and local, produce and/or distribute sub-standard drugs in Kenya.. These include, among others, the manufacture of paracetamol, trimox,c zole, magnesium trisilicate and ferrous suplhate.
Inspite of the efforts by the Ministry of Health to crackdown on unprofessional manufacturers, lack of physical, financial! and human resources remain a serious constraint in carrying some regulatory quality control programs.
3.6 Internal Market Structure
The market, for pharmaceutical products in^Kenya is about Kshs. 600m , of which, imports cover three-quartersForeign firms (importers and manufacturers) control about 90% in value11.
Drugs sold in the internal market include both ethical and non-ethical drugs. The former require a physician’s prescription while the latter do not. Thus, the medical ■practitioners are responsible for determining the sale of e"thical medicines while the non-ethical (0-T-C) drugs can
• Y
r | . '.sold by anyone in the open market.

66
The most widely used drugs in Kenya are antibiotics (31.6%), antimalarials (8.6%), cytotoxics (6.3%) bronchial relaxants (5.4%) and sulphonamides (5.2%). This is reflected by the consumption pattern of the public sector (Central Medical Stores) as indicated in Table 3.6.
Table 3.6
Annual Drug Consumption of Main Pharmaceutical Categories By the Central Medical Stores During 1983-1984 (12 Months
1 .2 .3.4.5.6 .7.8 . 9.
1 0 .11.12.13.14.15.
AntibioticsAntimalarialsCytotoxicsBronchial RelaxantsSulphonamidesAntidepressantsAntispasmodicsAnalgesics/Antiinflammatories Tranquilizers/Sedatives Cough/Cold Remedies Dermatologicals hypoglycemics Antihypertensives Antifungals Hormones
Central Medical Stores in Menesea* E., op.cit
VALUE £K % TOTAL2,214,219 31.56
599,730 8.55441,047. 6.28381,649 5.44365,195 _ 5.20•3 39,341 '' 4.83285,140 4.06246,342 3.51185,644 2.64134,332 1.91111,028 1.66111,187 1.59110,637 1.57109,427 1.56107,407 1.53
, as cited ., Annex XIV,
81.89 p . 53 .

67
The pharmaceutical market in Kenya is characterised by much product differentiation, which sustains price
attitudes also support product differen/tiation. According to the entrepreneurs, local consumers prefer imported goods and are accustomed to particular brands. This attitude
and cheaper generics.
The largest buyer of drugs in Kenya has been theCentral Medical Stores, now Medical Supplies Co-ordinatingUnit. This organisation has been buying about 75% of thedrugs in the Kenyan market, through an open tender system. ,These drugs are then distributed 'to government medical
13institutions. Because of the deficiencies inj the system, high-priced brand-named pharmaceutical products continue to form a large share of public and private sector supplies. By contrast, generically named drugs are seldom used.
The remaining products are sold to local pharmacies, dispensaries, private doctors or missionary hospitals B-rectly through distributors or company representatives.
of Competition in the market
The market for pharmaceutical products in Kenya exhibits
variability between drug substitutes.12 The consumers'
inhibits consumers from changing or trying equally effective

68
features characteristic of monopolistic competition. Firstly there are many manufacturers and distributors in the market. Secondly, pharmaceutical products in the market are highly differentiated by shape, colour, or brandnames. For instance, septrin (anti-bacterial) is sold in different colours and packages. Furthermore, septrin is sold under different brand names such as sulphamethoxazole, trimethoprim, sulfot- rim, co-trimethoxazole, trimoxol etc. Additional examples like this are provided in chapter 4. Through differentiation similar generic products appear unique and advertising might even make it worse. Differentiation also creates monopoly power to enable manufacturers to influence the price structure for specific products. Whereas many firms manufacture and/or sell their own specialities, these firms adapt aggresive price policies when necessary. This is often practised in government tenders. Beecham, for/example, has two sets of prices, one for the government and the other for the private sector.^ Another firm, Aspro Nicholas, had to reduce the retail prices on Aspro tablets by 33^% when faced with stiff competition.^
3 • 7 Employment
The pharmaceutical manufacturing firms in Kenya employ about 1500 people. Of this, about 65% are engaged in i^ect production of pharmaceutical products. The leading

69
employers in the sector are Sterling (20%), Dawa (13%), Wellcome (13%), Mac's (7.-3%) and Laboratory and Allieds (7.3%). Together, these firms constitute about 60% of total employment in the industry. Besides all the pharmaceutical manufacturers are capable of employing about 200 casual employees depending on the work .load.
3.8 Market Shares
The market share of the pharmaceutical firms in Kenya can be analysed by looking at the firms' sales. During the survey, data on sales was either obtained from the company files at Central Bank of Kenya or directly from the entrepreneurs. The information available indicate that
•were approximately, Kshs. 700m. The leading firms ranked by pharmaceutical sales were Dawa (1.6%), Sterling (11%), Wellcome (11%), Glaxo (8%) and Boots (9%). The foreign
m 1983, the sales by the pharmaceutical firms/in Kenya
based firms made 70% of the pharmaceutical sales whilethe local manufacturers and joint ventures made JL5% each.
•* •fpi #ese figures demonstrate the dominance of the pharmaceutical industry by foreign based firms.

70
CHAPTER FOURDATA ANALYSIS
4 . 1 METHODOLOGY/The list of firms engaged in pharmaceutical production
was compiled from the Ministry of Health files, Register of
competitors. These sources identified twenty five manufacturers. Of these, the author visited eighteen (see appendix 2A)• The other seven firms are known to be small.
The author interviewed ’the eighteen manufacturers between January and May 1 9 8 5 , The interviews were administered through a questionnaire structured to obtain the following information*
l) history of the firm
ii) working time and slackness in the factors of'Yproduction, ’ . • ,/
iii) productive capacity,iv) terms of technology contracts in license agreements,v) prices of imported raw materials and finished drugs,vi) local production potentials for cinchona alkaloids,
vii) financial statements, (see appendix 4).
The interviews normally lasted two to four hours. Inases v.’here sufficient information was not obtained, the
L Uthor re-visited the firms. Additional data on contracts, fin■ ancial statements and imports was gathered through an
manufacturing firms'^, Register of Kenya Association of 2
M a n u fa c tu r e rs . and by a s k i n g the f i r m s to identify t h e i r

71
examination of company files at the Central Bank of Kenya.The author also visited several firms in Tanzania to compare invoices on imported pharmacutical raw materials.
Secondary data was collected from Central Bureau of Statistics Publications, Ministry of Commerce and Industry (Industrial Promotion Department), Economic Journals, Medical Abstracts, UNIDO; GATT; UNCTAD, and other publications.
4.1.1 HYPOTHESES STATEDThis study will investigate technology transfers,
capacity utilisation, transfer pricing, use of generic and brand names, protection of local manufacturers, and production of cinchona alkaloids in Kenya. The following hypotheses are used in the investigation:
Hypothesis one
Kenyan jjiarmaceutical industry retard the development of the industry in Kenya’1.
.Hypothesis two"Capacity underutilisation exists in the Kenyan pharmaceutical industry".
©sponsible for the existing capacity underutilisation".
"The contractual terms of technology transfer into the
tlProm a micro perception, dremand factors are mainly

72
Hypothesis four"Transfer pricing exists in the Kenyan Pharmaceutical Industry”o
Hypothesis five"Brandname drugs cost much more than their generic counterparts in Kenya”*
Hypothesis six”The local pharmaceutical manufacturers are hot protected against.imports of finished drugs”*
Hypothesis seven"Local processing of cinchona alkaloids could yield substantial foreign exchange earnings and savings to Kenya”. 1
4.1.2 Data LimitationsThe following are the major limitations of the study:i) It was difficult to get a comparison of invoices
on many imports. This is because the firms do not necessarily import similar items during the same period. Consequently, the author obtained additional quotations on pharmaceutical raw materials from the local manufacturers to supplement information obtained from the Central Bank's files.
too confidential to be released to outsiders. Hence,**) Also, some entrepreneurs considered the survey to be

73
they were reluctant to give some information.
iii) In some cases, it was not easy to distinguishbetween those raw materials used in veterinary and pharmaceutical preparations. For this reason, some firms could not give accurate data on raw materials usage for some preparations.
4.2. TECHNOLOGYNearly all the technology used- in the preparation of
pharmaceuticals in Kenya is imported. ' This section examinesthe restrictions contained in the contractual agreements fortechnology transfers in Kenya.
%
The technology used in the manufacture of pharmaceutical- products in Kenya is mainly imported from U.S.A., WestGermany, England, Yugoslavia, India, and Italy. This
,ytechnology is imported through subsidiaries a-f MNCs, or contractual agreements with reputable pharmaceutical manufacturers.
Due to government pressure to encourage local manufacturing through import restrictions, several MNCs have contracted some local manufacturers to process theif products in Kenya through licensing agreements. This entails the provision
technology and guidelines related to the manufacture, licensed products. As shown in chapter two, contractual
agTeements for the transfer of technology to the third world

74
contain many terms which limit the operations of, and inhibit the development of the pharmaceutical sector in LDCs.
related to the manufacture of pharmaceutical products in Kenya at the Central Bank of Kenya. Twelve of the contracts relate to MNCs and their subsidiaries operating in Kenya.The remaining contracts are between local firms and various MNCs,. The analysis confirms (1) the existence of requirements to purchase raw materials exclusively from the parent or licensing MNC, (2) inflated royalty payments and (3) export and distribution restrictions. These restrictions are examined in detail below.
4.2.1 Tied purchase of material inputsThe manufacture of licensed pharmaceutical products
require specific know-how and technical assistance.
This includes working instructions and specifications Tor quality control. To conform with the required standards, 80$ of the contracts analysed state that the licensee must obtain raw materials and specific components from the licensor or sources approved by the licensor. All the MNCs r®quired their subsidiaries to obtain packaging and raw materials from the parent or sister companies.
During the survey, the author analysed twenty contracts
Tied purchases of materials inputs has many advantages 0 The licensor. The licensor can engage an affiliate or

75
parent company to purchase the required raw materials for the licensee. At times, this enables the licensor to increase the prices of raw materials and the level of commissions for negotiation or buying.
More than half of the licensees in Kenya pay about 3$ of total purchases in negotiation or buying commission to their licensors or approved sources. Inspite of this, many firms press for an increase in the commissions. For example, in 1973, a MNC with a subsidiary in Kenya demanded an increase in the buying commission from 3°!° to 6$ of total purchases. Reasons given for the increase were related to alleged -high costs in performing the following activities^.
i) Receiving and processing the orders,ii) Negotiating prices and purchasing the goods,
iii) Receiving and warehousing- the goods,*iv) Arranging inspection by General Superintendence Co.,
v) Delivering the goods to the port for shipment.
The proposal was rejected by the Central Bank of Kenya and the MNC continue servicing Kenya.
Tied purchases of raw materials also inhibit the local opacity to produce inputs. Whereas, some packaging
Materials like cartons, glass bottles, laminate papers,brainium caps and gelatine capsules can be obtained locally, any firms manufacturing licensed products have to rely on licensors* sources.
s

76
4.2.2 PatentsKenya grants patent protection for some pharmaceutical
products. Out of the 3550 patents registered in Kenya, about 15/S relate to pharmaceuticals.^ During the period of protection the patentee is granted monopoly on the production . and importation of the patented product. Due to the protection, other manufacturers are restricted from importing, compounding or even distributing the patented product within the protected territory. This situation does hinder the importation of cheaper raw materials and finished drugs, thus providing an obstacle to industrial development. This is further demonstrated by the following example from Kenya.
In 1981, the government changed its decision to buy amoxycillin trihydrate from a cheaper source to a high cost
Ajtsupplier because of the existing patent laws.,- The government tender no. 11/80-81, for the supply of 4.47m capsules of amoxycillin trihydrate had earlier been awarded to a local company who had the lowest quotation, K.Shs.,395 per 1000 capsules. Later, a MNC patent holder, claimedthat amoxycillin trihydrate was patented in Kenya and deserved
• • • * *
monopoly rights over the product.'* Even though the local company had earlier confirmed by a letter from the Registrar of Patents and Trademarks that the product was not registered n Kenya, the MNC prevented the local company from dealing in
product. Consequently, the government was forced to buy

77
amoxycillin trihydrate under the brandname Amoxil, from an agent of the MNC patent holder. The product was bought at K.Shs. 1074 per 1000 capsules. In total, the government could have saved about K.Shs. 3 million had it bought the product from the cheaper source (local company)•
4.2.3 Royalty payments• Royalty payments for the manufacture of pharmaceutical
products in Kenya range from lf° to 8.37^> of the net sales (see table 4.1). This study further reveals that royalty payments depend on bargaining. Inspite of the fact that most licensors request for royalty payments of about lOfS (net sales), stronger negotiation can .lower the figure. Table 4.1 shows that in cases where the Central Bank of Kenya has intervened, the royalties which were previously more than 5$ have been reduced. This organisation has been forceful despite limitations in the number and quality of personnel used in negotiation.
The data below confirms findings by Kaplinsky that the Central Bank of Kenya is committed to reduce service ^ee payments in technology contracts to less than 5$ of net sales. 6
. X

78
Table 4.1
Royalty Payment s as a Percentage of Net Shies in the KenyanPharmaceutical Industry, 1984.
Contracts Original Payment Payment in December 1984
1+ 2.5 / 2.5/2+ 3.3/o 3.3/3+ 1.0/ 1.0/4+ 12.5 Z 12.5/5+ 12.5/ 4.;o/
6+ 10.0/- 3.0/7+ . 9.0/ 4.0/8+ 10.0/ 2.5/9+ 5o0/ 4.0/• 10 — 8.37/
11 1 0./ 5.0/12 — 7.5/13 — 3.0/14 — 4.0/15 4/ 1.0/16 . , 2.5/17 — # 6 /18 — 1.0/19 — 2.0/20 - 2.5/
Source: extracted from Central Bank Company files, December1984©
+ Contracts re-negotiated by the Central Bank - No information.
79
4.2.4 Export and distribution restrictionsExport restrictive clauses frustrate the Kenyan
pharmaceutical sector by limiting the market size and productive capacity. Prom the twenty contracts evaluated in the Kenyan pharmaceutical Industry, fourteen contained restrictions to approved markets, especially Somalia,Burundi, Tanzania, Uganda and Ethiopia* This partially explains how MNCs use Kenya as a base to promote their products in East and Central Africa, while the same time restricting sales elsewhere.
Besides the export restrictions, many licensed products are channelled through distributors appointed by the licensor. These distributors earn export or sales commissions ranging from 5-10^ on sales. Thirteen of the contracts studied had specific appointed distributors that were usually affiliated to the MNCs • (licensors) • . '/
4.3 CAPACITY UTILISATIONCapacity underutilisation is common in developing countries.
This section demonstrates the extent of underutilisedcapacity in the pharmaceutical Industry in Kenya.• The
■ • -
method adopted here is the Weighted Average Time Based Measure illustrated in chapter 2. During the survey, data related to working time, and productive capacity were
°btained from the entrepreneurs in this industry. This data was used to estimate the extent of idle capacity.

Three overall measures of capacity utilisation were obtained using the number of production workers in each plant as the weight.
U- measures the weighted average utilisation ratewithout slack (Ai =0). The measure uses 120 hours as thepotential maximum hours entrepreneurs are willing tooperate. This is based on findings by' the ILO Mission to
7 ftKenya, and by Coughlin, that firms are willing torun a second shift plus an overtime of four hours if demand were to increase permanently.
introduces the slack variable. It. assumes that there is some slack in the use of labour and capital. For this reason Ai = 0. Data relating to the slack (Ai) was. obtained by asking entrepreneurs the potential increase in production (a) with the same number of hours, Ifame labour, same plaht and equipment and (b) with the same number of hours, same plant and equipment but additional labourers.The potential maximum hours firms are willing to operate Per week still remains at 120 hours.
U3 slightly differs from and * During the survey, 78$ of the firms in the pharmaceutical
industry in Kenya preferred operating 96 hours per week instead of 120 hours. Consequently, 98 hours is used as the Potential maximum hours in U- . Thus U3 is expressed as:

Table 4.2Capacity utilisation in the Kenyan pharmaceutical Industry, 1985
* The overall measures of capacity utilisation were obtained using the number of production workers in each plant as the weight.
Source: Own survey
82
Table 4.2 shows that all the'firms in the pharmaceutical industry in Kenya are currently operating one shift of 40-45 hours per week. If demand were to increase, fourteen
three firms, a third shift. The remaining firm would not operate additional shifts. All the entrepreneurs interviewed expressed that additional shifts would not lower the productivity. Thus productivity in the first, second and third shifts is assumed to he constant.
The capacity utilisation rates for individual firms and the entire industry are presented in Table 4.2. In this study, U- is chosen to best represent the capacity utilisation in the pharmaceutical industry in Kenya. This is because it uses a slack variable and the potential maximum working hours which were .preferred by a majorityof entrepreneurs in this industry. gives e lowestcapacity utilisation rate because it exaggerates the number of hours pharmaceutical manufacturers are willing to operate.
The rate of capacity utilisation was also calculated for five processes, namely, tabletting, labelling, granulation, capsulation, and ointments filling. For each section the V/eighted Average Time Based Measure is Used, though with the number of production workers in ®ach process as the weight. Also, data relating to the
firms would be willing to operate a second shift, and

productive capacities and slackness in the use of labour and capital were arranged according to firm and process* The results obtained are presented in Table 4*3* These results show a significant difference between the rates of capacity utilisation in the various processes*
- 83 -
Table 4.3Capacity utilisation for selected processes
Process Production Capacity utilisation rates• Labourers % U2 USTabletting 65 50# 36# 45#Labelling 30 44# 15# 19#Granulation 64 . 30# 10# 13%
Capsulating 71 20# 8# 10#Ointments
filling 25 5# !#• 2#
Source: Own survey
Vhe study shows that by any measure there is massive underutilisation of labour, plant, and equipment in the pharmaceutical industry in Kenya* Firms use far less than half of their productive capacities* This result demonstrates hypothesis two.
| Causes of capacity UiiJern>;ii j sat ionThe preceding section demonstrated the underutilisation
productive capacity in the pharmaceutical industry in enya. This section examines in detail the causes of the

84
idle capacity as perceived by the plant mahaSers#
During the survey, the author suggested six causes of excess capacity to the entrepreneurs. These causes were derived from the literature review of other LDCs.They include:
i) Demand factorsa) Market limitations (inadequate seasonal
demand)b) Competition from imports,
ii) Supply factorsc) difficulties encountered in obtainin£ raw ma'fcerialbd) Plant breakdownse) Shortage of skilled personnel. ^
iii) f) Other factors---------- ------- „J
Next, the entrepreneurs were asked to rank each of the above causes inorder of importance. The raliking was as follows:
(1) Very important (3) Just important(2) Important (4) Not impo**'bant
The results by entrepreneurs is represented an
Table 4.4 shows the ranking of causes of capacity underutilisation as very important is as f o H ovvS: Demandfactors 56$, competition from imports 56$, dif^ encountered in obtaining spare parts 0$, dif^icities
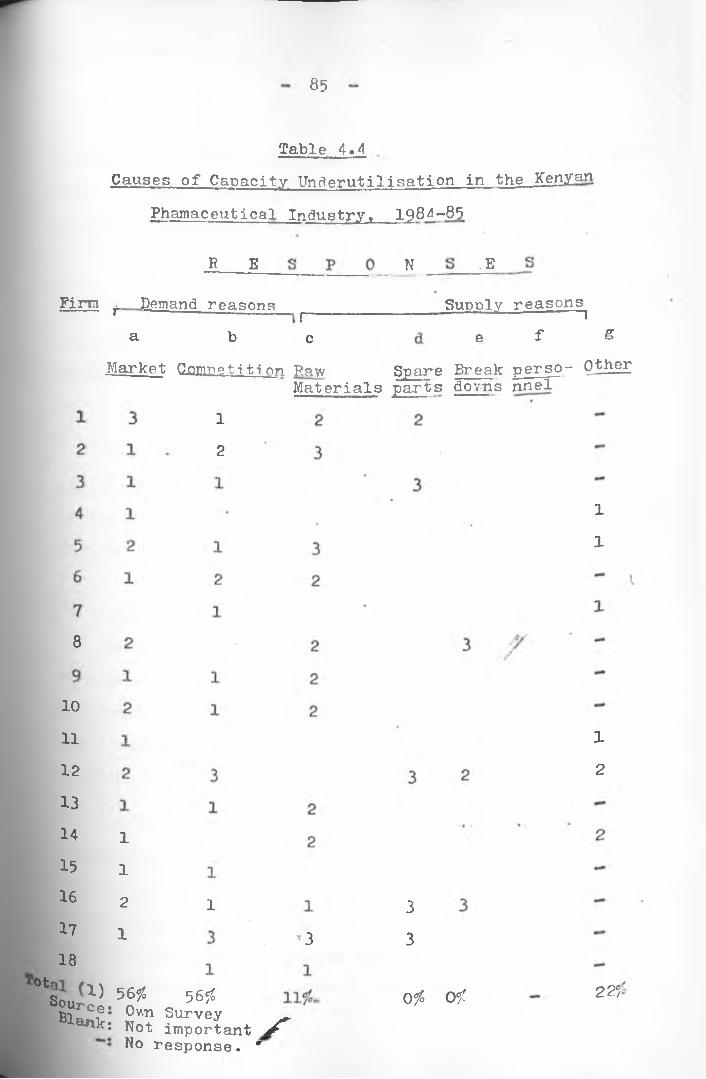
85
Table 4»4Causes of Capacity Underutilisation in the Kenyan
Phamaceutical Industry» 1984-85
R E N .E
Firta Demand reasons _a b e
Supply reasons^e f g
Market Qomretition Raw
12
rnw Spare Break perso- OtherMaterials parts do m s nnel
1
1
8
10
11
12131415161718
1
1
21
1
v3
0tS o u r ^ . 56?S 5 6 °l°Bl Ce: Own SurveyBlank: Not important S No response. *
33
Ofc O f
1
2
225

- 86 -\1
encountered in obtaining raw materials 11$, plant breakdowns 0$, shortage of skilled personnel o$, and other factors not mentioned by the author 22$.
In the last category (g), the plant managers mentioned many factors related to the inconsistency of the investments into the industry. Many plant managers were against the policy of allowing investments in areas already running below their potential capacities* .
This result clearly indicates that the
plant managers in this industry considerdemand rather than supply factors to be the ma^or constraint
%in utilising their productive capacity to the maximum.
4*5 TRANSFER PRICINGThere is' much overpricing of some pharmanjeutical raw
materials in Kenya, especially those containted in license agreements. Some MNCs also inflate service payments to remit funds abroad. This section provides more discussion on these issues.
The author obtained prices on pharmaceutical raw materials (1983 and 1984) by examining: l) company invoices at Central Bank of Kenya 2) invoices in Tanzania 3) supplier*s quotations directly or from individual manufacturers. Next, ^alysis was done by comparing the invoices and quotations or identical generic products. The invoices within

87
three months were considered comparable due to fluctuations in world prices of pharmaceutical raw materials.
The analysis indicates that some MNCs paid much higher prices for raw materials than were obtained by other Kenyan firms. This has been more prevalent in contracts where the licensee was tied to obtain raw materials from the licensors* source. The following examples will suffice.
In 1984, a MNC quoted a price of U.S. $ 115 for a kilogram of Methyldopa to a-licensed local manufacturer, while the same product could be obtained elsewhere at U.S.$ 68. Another MNC sold Diazepam at U.S. Z 600/k-g to a local licensee while the same product could be obtained from the free market at U.S. Z 60/kg. Also, Ampicillin was sold at U.S. S POO per kilogram while the free market price was between U.S. $ 55-64 per kilogram. These and either comparisons obtained during the survey are presented in Table 4.5.
From the sixteen imports contained in Table 4.5 overpricing ranges from 3$ to 2038$, Much of the overpricing relates to tied agreements. Even excluding Diazepam, the average rate of overpricing is 102$. Contrasted to 40$ for the other contracts. Besides Diazepam, other raw materials that are highly overpriced are Frusemide, Ampicillin and Sulphamethoxazole. These products are specialities and are Produced in Kenya under license from big MNCs.

Table 4.5Comparison of CIF Prices/kg for Some Pharmaceutical RawMaterials Imported into Kenya, 1984-85
Generic namesaHighest
PriceTK7Shs)/kg.
bLowestPrice Shs ./kg
cOverpricin(S)
1. Diazepam 9000*2. Ampicillin Trihydrate
Compacted 2329*.3. Wethyldopa 1666*4. Oxytetracycline Hydrochloride 339*5. Sulphamethoxazole 430*6. Frusemide 881*7. L-Ephedrine Hcl Crystalline 542*8o Codeine Phosphate 5665*9. Tetracycline Hd B.P. 462*
421 2038*'
897 lFO^T985. 6956
329 3 1
120 2581
298 1961
341 5 9 1
4491 261
323 43<
10. Chloroquine 366 • 2 ^11. Paracetamol 76 4 130*
Aspirin 45 35 2 9 1
13. Acetylsalicylic Acid 50 35 431
14. Caffaine Anahydrons B.P. 125 115 91
15. Sulphadimidine 210 175 201
16. Metronidazole 355 270 ' 3l£x Tied agreementsk* Highest price paid by a Kenyan importer k. Lowest price paid by a Kenya importer or the cheapest
supplier.c* Overpricing is calculated as: , a b\
( b ) x 100SourCes Central Bank Comply files,
individual manufacturers.man^feand quotations from

89
This overpricing could possibly be due to transfer pricing or high costs in production. This evidence is quite strong and certainly consistent with a pattern of transfer pricing.
4 , 6 USB OF GENERIC AND BRANDNAMESUsing hypothesis five, this section examines the price
difference between similar products sold under generic and brandnames. Ten products obtained from the price lists of some manufacturers and importers are used for comparison. The products were selected to represent some group of medicines. The price lists contain ex-factory, wholesale, and retail prices as agreed by the Price Control Department in the Ministry of Finance and Planning. i,
The prices of pharamaceutical products in Kenya are'Ycontrolled by the Price Control Department which negotiates
with the suppliers. However, in government tenders the Price Control Department is not included in analysing the quotations. The price lists studied indicate that the wholesaler is allowed a 15$ profit margin while the retailer 33$. In addition, the Pharmacies charge a - dispensing fee of K.Shs. 10/- per prescription. This substantially increases the charge for clients. The author did not systematically study to what extent the controlled prices are obeyed. However, seven pharmaceutical retail distributors in Nairobi asserted that they sold drugs at controlled prices.

Table 4<61V/holesale and Retail Prices of Generic Versus Brand Name of IdenticalProducts in Kenya, 184—85.
Product Generic Manufacturer Packing Wholesale Retail Ratio of thejferand Distributor Units Price Price most exnensive(K.Shs,) TK.Shs.) to the cheapest1. Septrin Tabs 500 mg. G —
Unitrim B Regal 1000 Tabs 450.00 600.00Ultrasept+ B Assia 1000 9 9 558.00 744.50Co-Trimoxazole B Mac1 s 1000 9 9 405.00 540.00Trimoxol B Dawa 1000 9 9 411.80 547.70 1.38:12. Diazepam Tabs (5 mg.) G Dawa 1000 Tabs 55.00 73.30Diazepam G Mac * s 1000 9 1 67.00 89.30Diazepam G Didy 1000 9 9 55.00 73.30Assival B Assia 1000 H 85.00 113.30 1.55:1
3. Frusemide Tabs (40mg.) G Mac' s 1000 Tabs 300.00 • 400.00Frusemide G Dawa 1000 9 9 200.00 266.00Fusid+ B Assia 1000 9 1 350.00 466.70 ,Lasix*+ B Hoechst 1000 t» 2842.05 3789.40 14.2:1
4, Franol Tabs (150 mg.) G Sterling 1000 Tabs ■ 210.00 279.90Tephedral+ B Assia 1000 i i 126.95 169.25 1.65:1
5. Magnesium TrisilicateTabs (500 mg.) -
Magnomint * TB Regal 1000 Tabs 50.00 67.00Actal* B Sterling 1000 • 9 231.60 308.70 4.62:1
6. Chloroquine Tabs (250mg.) G Dawa 1000 Tabs 170.60 226.10Chloroquine G Mac * s 1000 »» 180.00 240.00Aralen B Sterling 1000 9 9 450.00 600.00Intaclor B 'Regal 1000 9 9 160.00 213.30 2.8:1
aC

7. Metronidazole Tabs (200 mg. )
EflaronMegyl
8 • Benzyl Benzoate 25$(emulsion)Benzyl Benzoate 25$
(emulsion)Scabil application
9. Paracetamol Tabs (500 mg.) Paracetamol ParacetamolCetamolPanadol.
10. Aspirin Tabs (300 mg.) . AspirinDawaspirin
Gr Mac * s 1 0 0 0 TabsB Dawa 1000 tt
B Regal 10 0 0 ft
Gr Mac * s • 5 LitresG Regal • 5 • IB Novelty' 5 •t
G Mac * s 1000 TabsG Dawa 1000 IIG Didy 1000 91B Regal 1000 IIB Sterling 1000 II
G Mac' s 1000 TabsG Didy 1000 ftB Dawa 1000 19
150.00175.00180.00
200.00233.30240.00 1.2:1
80.00 106.60130.00100.00 173.30
133.30 1.6:1
70.0094.1065.0075.0047.55
93.30125.4086.60
100.0063.40 1.98:1
26o0030.0036.40
34.6040.0048.50 1.4:1
Source: Published Price lists as agreed by the Price Controller(Ministry of Finance and Planning
* Drugs specially developed by the Parent Comany through R & D (specialities) + Imported.

92
The survey of ten products distributed in Kenya demonstrates wide price differentials between generic and brandname drugs. The ratio of the most expensive brand to the cheapest generic equivalent ranges from 1 . 2 to14.2* For further details see table 4 .6 .
As shown in Table 4.6, generic products are cheaper than their branded items. Furthermore, imported and/or speciality branded items appear to be much more expensive than their local counterparts, Far example, Lasix, a Hoechst speciality is fourteen times more expensive than frusemide from Lawa. . Actal-, a Vfrnthrop product, is about five times more 'expensive than Magnomint from Regal. Table 4.6 gives a true representation of the pricing of drugs in the Kenyan market. The many brand items in the market also permit price variation even though, the items are the same generically
paid by the Central Medical Stores (CMS) on some finished drugs since 1980. This data reveals that the CMS has often bought expensive branded drugs which could be obtained
items were obtained at K.Shs. 9/65 per 1000. Also in March 1982, Frusemide tablets (40mg.) were bought at K.Shs.
/ >Luring the survey, the author had access to the prices
elsewhere cheaply using generic names. For example, in October I9 8I, the CMS bought Diazepam Tablets (5rag) at K.Shs. 173/26 per 1000, but in November 1981 the same
^50/- per 1000 while in May 1983, they were obtained at K.Shs. 45/— per 1 0 0 0 . These and other examples are provided in table 4o7.

Comparison of Prices Paid by Central Medical Stores forIdentical Generic Products, 1980—65
Product Date Manufacturers/ Generic Units Distributor Brand Selling
PriceO h s.
Ratio of themost expensive to the cheapest
Methyldopa Tabs (250 mg.)
Mar. 1985 Anpi Pharma Gr 1000 Tabs. 360.00Dec. 1980 Dav/a G 1000 " 570.00 1.6:1
Ampicillin cloxacillin Aug. 1983 Mac*s G 1000 Tabs. 779.50(Anpiclox) 500 mg. caps. July 1980 Vr'estco B 1000 " 1223.60 1.6:1Penbrittin syrup May 1983 Biochemie B 5 Litres 7.32-(5 litres pack; May 1983 Rhino 3 5 Litres 7.2
Aug. 1982 V/estco B 5 11.52 •Nov. 1981 MaC * s G 5 ” 7.15 1.6:1
Frusemide Tabs May 1983 Kensara G 1000 Tabs. 45.00(40 mg.) Mar* 1982 Hoechst B 1000 " 650.00 14:1Diazepam Tabs
(5 mg.)May 1985 Nat mo G 1000 Tabs. 45 -.00Nov.
1981
Globe G 1000 " 9.65Oct. Ho-.-wse & JfcGeorge B 1000 " 173.26 IS*. 1
Source: Central Medical Stores.
94
It is asserted that the above products were earlier obtained at much higher prices because of a preference for branded drugs. Many doctors prefer brandname drugs, This influences the decisions by the Central Tender Board.
4.7 BULK PUBCHASINGExperience from many countries show substantial savings
through bulk purchasing using generic names. (Section 2-9). In this study, entrepreneurs were asked about theestablishment of a central agency to procure all pharmaceutical raw materials and finished drugs. Their response indicate mixed feelings between the local and foreign based firms.
All the subsidiaries of MNCs disliked the idea. To them, raw materials bought through centralised agency would not conform to the specifications required by the parent companies. Consequently, this would lead to in thequality of drugs they produce. By contrast, 80$ of the local firms supported the idea so long as (l) the purchases were from reputable organisations and (2) the buying agency was run by a non-profit, government agency.
The local firms identified commonly .used drugs which could be bought jointly. These include aspirin, codeine, ohloroquine, ferrous sulphate, t'etracycline and sulphadimidine. Asked about the savings, that would result, the entrepreneurs indicated figures ranging from 1 5 - 20$.

95
4.8 PROTECTION OF LOCAL MANUFACTURERSThe need to protect Kenyan pharmaceutical manufacturers
have been documented by P.Low, 1 0 A.S. Tawfik1 1 and J.F.12Jordan . Before 1982, local manufacturers were burdened
by heavy taxation (30-40/6 of- their cif values) levied on pharmaceutical raw materials, whereas finished drugs came in duty free. This policy created a situation where local manufacturers could not compete‘favourably with imports. However, in 1982, the Government reversed the policy by exempting from custom duties all pharmaceutical raw materials not used in other industries. In this section we examine the effective rate of protection (ERP) for some pharmaceutical products before and after 1 9 8 2 .
Hypothesis six is used to investigate the extent towhich the local manufacturers are currently protectedagainst competing imports. This study uses Bal&ssa'sframework v/here ERP is defined as a percentage excess of
IPdomestic value added over its world price. That is:ERP — value added in the domestic market \'Net value added by international standards'This can also be presented algebraically as:ERP$6 o C 1 * V ~ £j aji ( 1 * V ~ (1 ~ ^ ajjl. ^
. 1 - 1 . a..3 nwhere: = nominal rate of tariffa = material input co-effecients
- 1
100
1 - I. a..j n= The proportion of value added to
all measured at world prices foroutputcommodities.

96
The formula vdll indicate the excess in domestic value added obtainable by reason of imposition of tariffs, as a percentage -of value added in a free trade situation. If the weighted average of duties on material- inputs is the same as the tariffs on the final product, the effective and nominal rates of duty will be identical. On the other hand, the effective rate will be higher than the nominal rate of duty if the product bears a higher tariff than its inputs. ■ —
Bata relating to the variables contained in Balassa's formula, were obtained during the field survey. Table 4.8presents the data together with the ERP for tablets, infuinjectables and capsules, before and after 1982.
Table 4.8 ‘ A/ERP For Vsrious Pha /rmaceutical Products
Before ana After 1982Product *imoort Duty Duty on raw' Effective rati
Content on materi als of ProtectionFinished Before Product 1982
Aft er 1962
Before After 1 9 6 2 1 9 8 2
Tablets 68?i Of lOf 0# -64.0#— . OfInfusions 0f 30£ o f -1 .08% o f
Capsules 7 Wo Of 3 0 f Of - 85% o f
Injectables 7/4 095 30?c O f -85% 0*
the tariffs are subtracted from the c°sts to estimate the International
domestic ex-factory costs of production.

97
Table 4.8 demonstrates that for all the pharmaceutical products considered, the local manufacturers were negatively protected before 1982. After the exemption of duties on raw materials in 1982, the ERP is zero for all products. This means that the local manufacturers are neither pro.tected nor discriminated against competing imports.

98
4.9 CINCHONACinchona bark is a biologically active plant containing
more than twenty alkaloids, of which quinine and quinidine are the most commonly used in the pharmaceutical industry. Quinine is used as an anti-malarial drug, \ hile quinidine as a cardiac depressent (anti-arrhythmics agent). The alkaloids are also used in the soft drinks industry as a bitter.
In Kenya, cinchona is grown' on a 300 hectare farm in Kericho belonging to BrookeBond Leigbig. Between 1974-83, BrookeBond produced an average, 550 tons of cinchona .bank annually. The individual production per year is presented in Table 4.8.
Table 4.8 .Production of Cinchona Crop in
Year-
Ouantity (•ooo;kgs.
1974 4061975 5471976 • 5851977 9 5081978 * 6631979 7681980 3931981 72519821983
Source: BrookeBond fKenya Limited,
471439 .Annual Report June 30 1983.

99
The average production of 550 tons per annum isadequate to support a local industry producing about49500 kgs of cinchona alkaloids. This is assuming an • •alkaloid content of at least 9$ in the cinchona bank in
quinine and quinidine, between Jan. 1981 - October 1982, of about K.Shs. (970-2282) per kilogram, the country could earn between K.Shs. 48 m. - 113 m. through local processing of the plant to extract alkaloids,'especially quinine and
Statistics by the Central Medical Stores (CMS) indicate .that anti-malarials are the second leading drugs consumed by the public sector. As shown in Table 4.10 In 1983-84, CMS spent about K.Shs. 12 m. in the purchase of antimalarials. This value was almost 9$ of the totaldrug purchases by the CMS. In addition, the private sector also buys anti-malarials.
The data below indicate that there exists a big marketfor quinine^/in Kenya. Since all the raw materials used in the preparation of anti-malarials in Kenya are imported, the country could earn foreign exchange by extracting cinchona alkaloids.
Kenya^ Based on the lowest and highest world prices of
. . . ISquinidine. ^
derivatives

100
Table 4.10.Consumption of Anti-Malarials by Central
Medical Stores, 1983-84
Dru g Quantity (•000 Unit)
Value ( '0 0 0 K.3
Chloroquine Phosphate Tabs, 150 mg. Base
88 8104
Chloroquine Phosphate inj. 40 mg/2 ml (Amps)
920 . 432
Chloroquine Phosphate inj. 40mg./5ml. (Amps) 783 775
Chloroquine Phospahte Syrup 50 mg. $ase/5ml
* 36 1906
Primaquine Phosphate Tabs. 7*5 mg. Base
0.3 15
Quinine Bisulphate Tabs. 300 mg.
1 605
Priquanil Hydrochloinde Tabs. B.P. 100 mg. '
3.8 546
Total 12383 ,,
Source: Central Medical Stores.
Y
■*
s

101
CHAPTER FIVECONCLUSIONS AND RECOMMENDATIONS
This chapter presents the conclusions, recommendations and a summary of the study. The issues explored relate to development of the pharmaceutical sector in Kenya.
5.1 TechnologyThis study demonstrates the existence of many restrictive
clauses in the contractual transfer of technology in the pharmaceutical industry in Kenya. These include restrictions on exports, distribution, and the source of raw materials. Besides, some MNCs charge high royalties for the manufacture of their products. Other MNCs register their products as patents in Kenya to frustrate local firms, and yet the products of the MNCs are imported.
Recommendation 4/7
It is necessary for Kenya to establish an independent organisation to scrutinise and monitor technology transfers. The organisation should set up conditions for evaluating imported technology. After this, all contractual agreements in technology transfers should be channeled through theorganisation. Preferably, the Central Bank of Kenya could be used since it is the only government agency that has been forceful in decreasing service fee payments.

10 2
5*2 Capacity UtilisationThe pharmaceutical industry in Kenya uses only 21$
of its productive capacity. According to the factory managers, demand factors explain much of the underutilisation*
partly responsible for the underutilisation.
RecommendationsThe government should adopt the following policies
*to improve capacity utilisation in this industry:
i) Kenya should encourage firms to produce veterinary preparations along with human pharmaceuticals*
ii) Future investments into this industry should be vetted by the government, priorities should be given to firms wishing to make different products from the existing ones.
iii) The government should consistently moi^ltor thelevels and causes of capacity utilisation in this industry* This will provide adequate data for future planning of the industry.
5*3 Transfer PricingThe study demonstrates the tendency- of MNGs, especially
to overprice some pharmaceutical raw materials. This is more common with tied agreements where the average overpricing is about 102$* This raises the suspicion that the MNCs could be transfer pricing. This evidence
Moreover, the absence of consistent government planning is

103
strongly supports the hypothesis though' this needs further research*
RecommendationsTo curb the overpricing of pharmaceutical products,
all exports and imports should be channeled through a a central agency. The agency should have skilled personnel and adequate facilities to be able to scrutinize the prices. Also close supervision by .the government is necessary to. ensure effeciency in the .operations of the organisation. Since much of the overpricing is related to tied agreements, recommendations in section 5 * 1 are also useful.
The formation of a central agency is likely to have strong opposition from some MNCs, especially those involved in overpricing. Besides, no matter what the structure is, it is likely to be corrupted.
5.4 Use of Generic and BrandnamesMany brandnamed drugs are much more expensive than
their generic counterparts in Kenya. Through this,Kenyan consumers are burdened by paying high prices.
RecommendationsTo cut drug costs, Kenya should encourage the medical
supplies co-ordinating unit, formerly the Central Medical Stores to purchase drugs strictly using generic names.

104
Prices of drugs in Kenya should be determined jointly by the Ministry of Health, Price Control Department and the manufacturer or distributor. Also Price Control Department should be involved in analysing quotations received by
lastly, th-e government should encourage the doctors to give prescriptions using generic names though some doctors who prefer using generic names might resist.
5.5 Bulk PurchasingWhereas many local firms support the establishment of
a Central Procurement agency to purchase all raw materials and finished drugs, all the MNCs are against it.
KecommendationA Central Procurement agency would cut costs for
consumers, especially if it uses generic nam^. The agency should be a non-profit organisation run by the government. Preferably, the agency could be attached to big organisations like W.H.O., to help in the procurement. More benefits would also accrue if Kenya pooled its drugpurchases with other countries in Astern, Central and Southern
•* •
Africa.
5.6 Protection of Local ManufacturersThis study reveals that the local manufacturers of
Pharmaceutical products are not protected against competing
CMS.

105
imports. Though the local manufacturers are better off duringthan^the period before 1982 when they were negatively
protected.
5*7 Production of Cinchona AlkaloidsExtraction of cinchona alkaloids locally might yield
substantialoarn'ings to Kenya. The large number of anti-malarials currently imported by Kenya could also be reduced drastically.
5,8 Areas for Further Research1) This study indicates that some sub-standard drugs
are distributed in Kenya. Another study is necessary to investigate the extent and causes of this.
2) The mechanisms and operations of the medical supplies. • '¥co-ordinating unit need further investigation,
3) Y/hereas the prices of pharmaceutical products are controlled by the Price Controller (Ministry of Finance and Planning) a scudy of the criteria forestablishing the prices is necessary.
•• «
4) The author did not conduct a pre-feasibility study of the possibility of establishing an extractionunit to process Cinchona alkaloids in Kenya.
*rther research is necessary to establish the technical, economic, and financial feasibility of
to

106
producing cinchona alkaloids locally. If the project is feasible, then it should be implemented.
5.9 Summary of the ResultsKenya's pharmaceutical sector has grown rapidly since
1936, with most of the firms establishing manufacturing units in the 1970's. This sector currently consists of twenty-five local manufacturers and about 1 5 0 pharmaceutical distributing houses. Foreign firms continue to dominate the sector both for imports and local production. The productive capacity of the pharmaceutical industry in Kenya is massively underutilised. Factors responsible for the underutilisation include market limitations, competing imports, difficulties in obtaining raw materials and spare parts, and ineffeciency in government planning#
by MNCs. This raises the strong suspicion that some MNCs could be involved in transfer pricing.
The market for pharmaceuticals in Kenya is dominated by wide product differentiation in the various shapes, colour, and brandnames for identical products. This is also reflected by the price differentials for identicalgeneric products. Thus, the consumers are burdened by
\
P&ying high prices for branded items which can be obtained
More than half of the raw materials and finished drugs are imported. Some of these are overpriced especially

107
cheaply under generic names. To cut drug costs, bulk purchasing using generic names is essential.
The local manufacturers need'some protection against . competing imports.
Lastly, Kenya should look into the possibility of exploiting its medicinal plants. For example, more research is necessary on the production of cinchona alkaloids to reduce the large value of anti-malarials imported by Kenya*
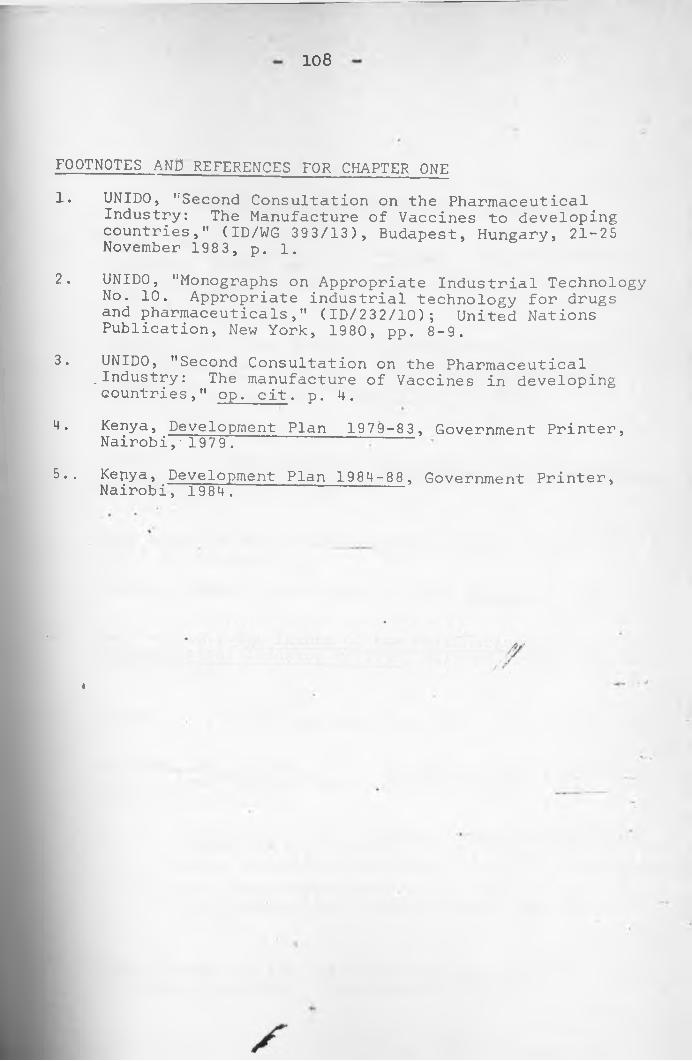
108
FOOTNOTES AND REFERENCES FOR CHAPTER ONE1. UNIDO, "Second Consultation on the Pharmaceutical
Industry: The Manufacture of Vaccines to developingcountries," (ID/WG 393/13), Budapest, Hungary, 21-25 November 1983, p. 1 .
2. UNIDO, "Monographs on Appropriate Industrial Technology No. 10. Appropriate industrial technology for drugs and pharmaceuticals," (ID/232/10); United Nations Publication, New York, 1980, pp. 8-9 .
3. UNIDO, "Second Consultation on the Pharmaceutical.Industry: The manufacture of Vaccines in developingcountries," op. cit. p. 4 .
4. Kenya, Development Plan 1979-83, Government Printer, Nairobi,- 1979 .5.. Kepya, Development Plan 1984-88, Government Printer, Nairobi, 1984.
I

“FOOTNOTES AND REFERENCES FOR CHAPTER TWO
UNIDO, "First consultation meeting on the Pharmaceutical Industry: Global study of the PharmaceuticalIndustry", (ID/WG 331/6), Lisbon, Portugal, 1-5 Dec. 1980, p. 3 — M-.
Clymer, H.A., "The Economic and Regulatory Climate:U.S. and Overseas Trends". In Drug Development and Marketing, edited by Helms, R.B., American Institute for Public Policy Research, Washington D.C., 1975, pp. 138-155.
Gereffi, G., The Pharmaceutical Industry and Dependency in the Third World, Princeton University Press, Princeton New Jersey, 1983, p. 190.
Data based on World Pharmaceutical Output in 1980 (US $ 84 billion) * .Source: UNIDO, (ID/WG 331/6), 1980, op. cit. p. 25.
Barrie, J.G., The future of the Multinational Pharmaceutical Industry to 1990, -Halsted press, New York, p.81, p . 255 .
Gereffi, G., (1983), op. cit., p. 191.
In India, for example, MNC subsidiaries made significantly higher profits than the joint ventures with -little participation.Source: Deolalikar, A.B., "Foreign Technology in India
Pharmaceutical Industry: It's impact onLocal Innovation and Social Equity". Mimeograph9 9pp. paper presented for the Council on International and Public Affairs, New York, p. 76 .
UNIDO., "Growth of the Developing Countries:'"Growth of the Pharmaceutical Industry in
ling Countries: Problems and Prospects".

110
Vienna: United Nations Publication, Sales No. E. 78II. B.4., 1980.
b UNCTC, "Transnational Corporation in the Pharmaceutical Industry of Developing Countries". New York:UNCTC (E/C.10/85), 1980, p. 4.
9. Gereffi G., op. cit. p. 187.
10. Klein, L.R., "Some theoretical issues on the measurement .of capacity", Econometrica, Vol. 28, 1960, p. 275.
11. Ibid., p. 275.
12.. Business Plans for New Plants and Equipment, (1961-64) 14th Annual survey by the McGraw-Hill Department of Economics, New York, 1961.
13. Philliphs, A., "Industrial capacity: An appraisal ofmeasures of capacity", American Economic Review, March- May 1963, Vol. 53, pp. 275-313.
14. Philliphs, A., ibid, pp. 275-313.
15. Perry, G., "Capacity in Manufacturing", Brooking Papers on Economic Activity, Vol. 3, 1973.
Hr /#16. Briscoe, G., O’Brien, p. 9 and Smyth, D.J., "The
measurement of capacity utilisation in the United Kingdom", The Manchester School of Economic and Social Studies, No. 2, June 1970, pp. 91-117.
Hilton, K., "Capital and Capacity Utilisation in the United Kingdom: their measurement and reconciliation",Bulletin of Oxford University Institute of Economics and Statistics, Vol. 32 (3) , August 1970, p~I 197.
C
Phan-Thuy, V. et. al, Industrial Capacity and Employment Promotion: case studies of Sri-Lanka, Nigeria, Morocco-and over-all survey or other developing countries, Westmead, Farnborough, Hants, England: Gower PublishingCo. Ltd., 1981, p. 6 .

Ill
19. Phillips, A., op.cit. p. 275-313.
20. ibid, p. 275-313.
21. Coughlin, P.E., "Converting'Crisis to Boom for Kenyan Foundries and Metal Engineering Industries, Technical versus Political and Bureaucratic Obstacles",IDS Working Paper No. 398, University of Nairobi, August 1983.
22. United Nations,'Journal of Development Planning,"Some elements in the strategy of employment promotion in developing countries", New York, 1972. p. 69.
23. Raghavachari, M.V., "Excess Capacity and Production Potential in selected Industries in India",Reserve Bank of India Bulletin, April 1969, p. 479.
24. Winston, G.C., Capital Utilisation in Economic Development," Economic Journal, Vol. 81, No. 321, March 1971, p. 55.
25. Currie, L., Accelerating Development, The Necessity and Means,' New York, McGraw-Hill, 1967 , p,/54.
26. Currie, L., "New Perspective in Teaching and Research in Economics in Latin America", Social and Economic Studies, Jamaica, Vol. 18, No. 1, March 1969, p. 101.
27. Morawetz, D-, Capital Utilisation in Israeli Industry, TheMaurice Falk Institute for Economic Research in Israel, Jerusalem, June 1975 pp. 117-120.
Lim, D., "Capital Utilisation of Local and Foreign establishments in Malaysian Manufacturing", The Review of Economics and Statistics, Vol. LVIII, No. 2, May 1976, p. 212.
Thoumi, F.E., "Fixed Capital Utilisation in Columbian Manufacture", IBRD, 25 September 1973.

30. Bautista, R.M., "The NEDA World Bank Capital Utilisation Survey of Phillipines Manufacturing", The Phillipine Review of Business and Economics, Vol. XII, No. 1, June 1975.
31. Wangwe, S.M., "Technology Issues in the Capital goods sector: a case study of the United Republic ofTanzania", UNCTAD, (TD/B/C. 6/AC/7/4), May 14, 1982,pp. 1 -2 .
32. Coughlin, P.E., op.cit, pp. 2-3.
33. ' ibid. pp. 2-3.
34. Mwangi, H., The Plastics Processing Industry inKenya, University of Nairobi, Unpublished Economics M.A. Thesis, 1984, p. 159.
35. ILO, Employment, Incomes and Equality: a strategy forIncreasing Productive Employment in Kenya, ILO:Geneva, 1972, p. 183.
36. Baily, M.A., Capital Utilisation in Kenya, Manufacturing Industry, Unpublished Ph.D. Dissertation/ Department of Economics, Massachusetts Institute of Technology,
37. Wangwe, S.M., "Factors Influencing Capacity Utilisation in Tanzanian Manufacturing", International Labour Review, Vol. 115, No. 1,'Jan-Feb. 1977 , pp. 6 6 - 68 .
38. Koti, R.K., Utilisation of Industrial Capacity in India, 1967-68, Gokhale Institute of Politics and Economics, Poona, 1968, p. 124.
Con;]uctura Economica, Vol. XVI, No. 11, 1969 . pp. 62-72.
Brodersohn, M.S., Utilisation of Production Capacity in Argentine Industry^ UNIDO, Expert Group Meeting on Utilization of Excess Capacity for Export, Rio-de-Janeiro, March 1969, p. 35.
1974

113
41.
42.
43.
44.
45.
46.
47.
48.
49.
50.
51.
52.
Kabaj, M., "Utilisation of Industrial Capacity Shift Work and Employment Promotion in Developing Countries" in Phan-Thuy, N., op.cit., p. 296.
ibid., p. 296.
Ruy Aguiar da Silva Leme, Excess Capacity in Brazilian Industry, UNIDO, Expert Group Meeting, ibid., p. 21.
Merhav, M., Excess Capacity -- Me'asurement, Causes and Uses: A case study of Selected Industries in Israel,UNIDO Expert Group Meeting, Rio-de-Janeiro,' March 1969, p. 13.
Vaitsos, C., "The Process of Commercialization of Technology in the Andean Pact", in International Firms and Modern Imperialism (ed.) ’Hugo Kadice, Penguin Books Ltd. , New York, .1979, p. 183.
ibid, p. 185
UNCTAD "Technology Policies in the Pharmaceutical sector in Phillipines", UNCTAD/TT/36, New York,. 1980, pp. 13-14.* * -vy
/
Vaitsos, C., op. cit., pp. 191-210
1
Venkataburamanian, P.B., "The Law of Trademarks in India", World Development, 1979, Vol. 7, pp. 736-747.
Correa, C., "Main Issues in the Regulation of Licence Arrangements on Foreign Trademarks: The Latin AmericanExperience, World Development, 1979, .Vol. 7, pp. 704-711.
UNIDO, "A Basic Technological Disaggregation Model:The Petro Chemical Industry", (UNIDO/15-283), Jan. 28,- 1982, p. 7.
Transfer Pricing is an accounting procedure usually designed to lower taxes paid by MNCs in which intracorporate sales and purchases of goods and services

114
are artificially invoiced so that profits accrue to those branch offices located in ;low tax countries 'tax havens' while offices in high tax countries show little or no taxable profits. Lall, S. , "Transfer Pricing by Multinational Manufacturing Firms,"Oxford Bulletins; of Economics and Statistics. Vol. 35, Mo. 3, 1973, pp. 174-5.
53. Lall, S., ibid., pp. 174-6.
54. Langdon, S.W., Multinational Corporation in the Political Economy of Kenya, The Mac Millan Press Ltd., Hongkong, 1981, p. 159.
55. ibid.,*p. 159 .
56. Monopolies Commission, "Chlordiazapoxide and Diazepam", Her Majesty's Stationery Office (HMSO-) , London, 1973.
57. Lall, s., op. cit., p. 185.
58. UNCTAD, (UNCTAD/TT/36) op. cit. p. 15.
60. Katz, J.M., Oligopolio, firmas nacionales"' y empresasmultinacionales: la industria formaceutica argentina.Buenos Aires: Siglo XXI, 1974, p. 33.
61. Gereffi, G., op. cit., pp. 148-9.
Ledogar, R.J., Hungry for Profits: U.S. Food and DrugMultinationals in Latin America. New York: IDOC/North' America, 1975 , p. 54~
ILO Report, Employment Incomes and Equality, op. cit., p. 454.
Langdon, S.W., op. c,jt. , p. 1 2 8 .
Kaplinsky, R., "Report on Foreign Exchange Leakages with particular reference to Transfer Pricing"

115
UNIDO Consultant, June 1978. p. 18.
6 6. ibid., p. 17.
67. ibid., pp. 20-33.
6 8. ibid., •
iHCMp
.
CD CD
• Vaitsos , C.V., and Golemis, C., "Control of Transfer• Pricing Practices in Kenya", UNCTC, Feb. 1981, p. 2.
70. Pharmaceutical Manufacturers' Association (PMA), Brands Generics, Prices and Quality",Washington D.C., 1971, pp. 2-3.
71. ibid. , pp. 2-3.
72. UNCTAD, "Examination of the Economic, Commercial and Developmental Aspects of Industrial Property in the Transfer of Technology to Developing Nations: Trademarks and Generic names of Pharmaceutical and ConsumerProtection", UNCTAD (TD/B/C.6/90) p. iv-v." Geneva, 1982,
,y/73. Alexander, C.P. "Prescriptions for cheap drugs",
Time, New York, September 17, 1984. pp. 76-77.
74. ibid., p. 76 .
75. ibid., p . 77.
76. PMA, "Brand, Generics, Prices andp. 6 .
•* •Quality", op. cit.,
77. ibid., p. 8 .
00
Y
UNCTAD, (UNCTAD/TT/36) , op. cit. , p . 8 .

116
7 9 .
80.
81.
82.
82.
8 3 a .
b
84.
85.
86.
Alexander, C.P., op. cit., p. 77.
ibid., p. 77.
UNCTAD, "Technology Policies in the Pharmaceutical Sector in Nepal", (UNCTAD/TT/34), 27 October 1980,p. 28. •
UNCTC, "Transnational Corporations' and The Pharmaceutical Industry". New York: UNCTC, 1981,pp. 51-52.
UNCTC, "Transnational .Corporations and the Pharmaceutical Industry". New York: UNCTC, Sales No.E. 7 9 . I I . A . 3 . p p . 8 8 - 8 9 .
UNCTC, "Transnational Corporations in the Pharmaceutical Industry of Developing Countries: A Technical Study".New York: UNCTC 1981, pp. 51-52.
Aggarwal, A., Drugs and the Third World, London: Earthscan, 1978, pp. 36-38.
• • /Commonwealth Regional Health Secretarial for East, Central and Southern Africa, "Report of the Investigation on Regional Procurement and Bulk Purchasing of Drugs", Arusha, 9 October 1978.
The Calculations on savings are based on Tables extracted from the above report (Report of the Investigation on Regional Procurement and Bulk Purchasing of Drugs).
Commonwealth Regional Health Secretariat for East, Central and Southern Africa, "Report of the first of the Regional Advisory Committee on Drugs and Pharmaceuticals", Arusha, 23-26 Feb. 1982, p. 7.

117
Footnotes and Reference for Chapter Three
1. Gereffi, G., op. cit., p. 217
2. Meneses, E., "Assistance for the development of the Pharmaceutical Industry in Kenya", Report for the Government of Kenya (Ministry of Commerce and Industry", October, 1984, p. 3.
3. Kenya, Annual Trade Reports, op. cit., (1980 to 1983)
4. Tawfik, A., S. , p.22.
5. Mwangi H., K., op. cit., p. 113
6 . Field Survey of Mr. Thomas, Production Manager ofEMCO Glassworks, conducted by P. Coughlin, May 1985.
7. Kenya, Annual Trade Reports,, op, cit.
8 . Ministry of Health files, June 1985.
Tawfik, A., S., op. cit., p. 75The exact market for pharmaceutical products in Kenya is not known This figure is based on estimated population of 18m (1984) and drug consumption per capita of US$ 2.20 (1978). This estimate is weak and inconsistentwith other methodologies of estimating the market.The data on population and consumption pe,r capita were obtained from:•population United States Bureau of Census, "International
Population Dynamics ( 1 9 5 0 - 2 ^ ) " , IS P - ' . . 'P -7 9 (A ) , Washington D.C.consumption, rer capita
u. Qereffi G«
UNCTC, "Transnational Corporations in the Pharmaceutic Industry of Developing Countries". New York:
• UNCTC (E/C. 10/85). 1981.

For a detailed discussion on this issue refer to "the use of generic and brand names" in chapter 4 .
Gereffi, G., op. cit., p. 217.In 1984, for example, Beecham quoted US$ 57-65/kg for Ampicillin Trihydrate compacted for Government tender, while US$ 200/kg for the private sector.
. Personal Interview with Mr. Patel, Production Manager, Aspro Nicholas, January, 1985.
Tawfik, A., S., op. cit., p. i

119
FOOTNOTES AND REFERENCES FOR CHAPTER FOUR
1* Kenya, Ministry of Finance and Economic Planning,Central Bureau of Statistics, Register of Manufacturing Firms. 1970, 1974 and 1978
2. Kenya Association of Manufacturers (K.A.M.), The Kenya Association of Manufacturers Register.
3. Company Files at Central Bank of Kenya, December 1984*
4. Data from the Registrar of Patents and Trademarks in Kenya indicate that by July 1985, they had registered about 3550 patents.
5. Due to the patent protection the MNC (patent holder) demanded an immediate•withdrawal of Amoxycillin Trihydrate from the price list of the local firm.The patent holder also demanded a written undertaking to the following effect:a) That the local firm should not import, compound,
convert, manufacture,.sell distribute or offer for sale Amoxycillin Trihydrate at any time during the pendency of the relevant MNC Kenya Patent into or in Kenya.
b) That the local firm should destroy any existingstocks of Amoxycillin Trihydrate imported or held by the' company at that time, in the presence of a representative of the MNC. ' ' /
C) That the local company should recover all stocks of the product distributed by them throughout Kenya.
d) That the local company should provide a detailed audited statements of the stocks of Amoxycillin Trihydrate imported into, manufactured and sold by the company.
In this example, patent protection restricts the manufacture of patented products to those manufacturers approved by the patent holder. Also patent protection permits inflating prices on drugs.
8. Kaplinsky, R., op. cit. p. 22.
7. International Labour Office, "Employment, Incomes and Inequality: a strategy for Increasing Productive Employment in Kenya", op. cit, pp. 182.

120
Coughlin, P.E., op. cit.
Confidentiality requested.
Low, P., p.18.
Tawfik, A.S., o p. cit. $. iii.
Jordan, J.F., "Structural Determinants of the Kenyan Pharmaceutical Industry, 1960-81", unpublished Ph.D. Thesis, Howard University, Y-ashington D.C., August 1983. pp. 192-195.
Balassa, B., "Tariff Protection in Industrial Countries"* Journal of Political Economy. Vol. 75, Feb-Dec. 1965 PP. 573-94.
Meneses, E., op. cit. p. 21.Calculation based on:a) Lowest and highest World Prices of. Quinine and
Quinidine (Jan. 1981 - Oct. 1982) i.e. US$ I.85/OZ - US$ 4.35"OZ.
b) 1 oz. is equal 28.35 g. 1
c) US$ = 14.8698 (K.Shs.) exchange on 22/9/84.For further information on prices seeUNCTAD/GATT, Market for Selected Medicinal,Plants and their derivatives". United Nations Publication,Geneva, 1982,’p. 101.
> > r N A U l O U
_ LIBiiAiW

121
Agarwal, A
Alexander,
Baily, M .A
Balassa, B,
Barrie, J.(
Bautista, P
Briscoe, G.
Brodersohn,
Clymer, H.A,
SELECTED BIBLIOGRAPHY
• , Drugs and the Third World, London:Earthscan, 197$^
C.P., "Prescriptions for cheap drugs", Time,New York, September 17, 1984.
•» Capital Utilisation in Kenya Manufacturing Industry. Unpublished Ph.D. Dissertation, Department of Economics, Massachusets Institute of Technology, 1974.
., "Tariff Protection in Industrial Countries", Journal of Political Economy, Vol. 75, Feb,Dec. 1965,
'., The Future of the Multinational Pharmaceutical• Industry "to 1QQO. HalstPri Press. New York,
1 9 7 7 . ------The NEDA World Bank Capital Utilisation
Survey of Phillipines Manufacturing", The Phillipine Review' of Business and Economics,Vol. XII, No. 1, June 1975.
, O'Brien and Smyth, D.J., "The Measurement of Capacity Utilisation in the United Kingdom",The Manchester School of Economic and Social .Studies. No. 2, June 1970.
M • S., Utilisation of Production/Capacity-'in Argentine Industry, UNIDO, Expert Group Meeting on Utilisation of Excess Capacity for Export, Rio-de-Janeiro, March, 1 9 6 9.Business Plans for New Plants and Equipment, (1961-64 14th Annual Survey by the Me Graw—Hill Department of Economics, New York,
, "The Economic and Regulatory Climate: U.S.and Overseas Trends", In Drug Development and Marketing, edited by Helms, R.B., American Institute for Public Policy Research, Washington D.C., 1 9 7 5 .Commonwealth Regional Health Secretariat for East Central and Southern Africa, "Report of the Investigation on Regional Procurement and Bulk Purchasing of Drugs", Arusha, October 9 , 1978. 6 '

122
Correa, C.,
Coughlin, P
Currie, L.,
Deolalikar,• •
%
Gereffi, G.
Hilton, K.,
Jordan J.F.,
Kaplinsky, P
Con.juctura Economica, Vol. XVI, No. 11, 1969*"Main Issues in the Regulation of License Arrangraents on Foreign Trade Marks: TheLatin American Experience, World Development,Vol. 7, 1979.
.E., "Converting Crisis to Boom for Kenya Foundries and Metal Engineering Industries, Technical Versus Political and Bureaucratic Obstacles", IDS V.'orking Paper No. 398, University of Nairobi, August 1983.
Accelerating Development. The Necessity and Means, New York, Me Graw-Hill,1957.
. "New Perspective in Teaching and Research in Economics in Latin America", Social and Economic Studies. Jamaica, Vol. 18, No. 1, March 1969.
A.B., "Foreign Technology in India Pharmaceutical Industry: It’s Impact on Local Innovationand Social Equity", Mimeograph, p. 99, paper presented for the Council on International and Public Affairs, New York.
, The Pharmaceutical Industry and Dependencyin the Third World. Princeton University Press, Princeton, New Jersey, 1983."Capital and Capacity Utilisation in the United Kingdom: their measurement and reconciliation", Bulletin of Oxford University Institute of Economics and Statistics, Vo}..T2 (3), August, 1970.International Labour Office (ILO), Employment, Incomes and Inequality; A Strategy for Increasing Productive Employment in Kenya.ILO: Geneva, 1972.
, "Structural Determinants of the Kenyan Pharmaceutical Industry, 1960-81", Unpublished Ph.D. Thesis, Howard University, Washington D.C., August 1983.
!., "Report on Foreign Exchange Leakages with Particular Reference to Transfer Pricing",UNIDO Consultant, June 1978.

123
Katz, J.M
Kenya,
Kotis R.l
Lall, S.,
Langdon, f
Ledogar, E
Lim, D.,
low, P. ,
Merhav, M.
., Oligopolio, firmas nacionales y empresas Multinacionales: la industria formaceutica argentina. Buenos Aires: Siglo XXI, 1974.Annual Trade Reports, Customs and Excise Department (Ministry of Finance and Planning), Government Printer, Nairobi, I98O to 1983, yearly.Development Plan, 1979-83. Government Printer Nairobi, 1979.Development Plan, 1984-88, Government Printer, Nairobi, 1984.Register of Manufacturing Firms, Ministry of Finance and Planning, Central Bureau of Statistics. 1970, 1974 and 1978.Kenya Association of Manufacturers (K.A.M.),The Kenya Association of Manufacturers Register. 1 9 H 4 . ---------------------------------- ------
C., Utilisation of Industrial Capacity in India, 1967-6 8, Ookhale Institute of Politics and Economics, Poona, 1 9 6 8."Transfer Pricing by Multinational Manufacturing; Firms", Oxford Bulletin of Economics and Statistics. Vol. 35, No. 3, 1973.
5.W., Multinational Corporation inj^he Political Economy of Kenya. The Mac Millan Press Ltd., Hongkong, 1981.
. J., Hungry for Profits: U.S. Food and DrugMultinationals in Latin America. New York:IPOC/ North America, 1975•"Capital Utilisation of Local and Foreign Establishments in Malaysian Manufacturing",The Review of Economics and Statistics, Vol. LVIII, No. 2, May 1976. ~"Trade Policy as a Determinant of Industrial Structure: The case of the Kenya PharmaceuticalIndustry", IDS Working Paper No. 329, University of Nairobi, November, 1977.
» Excess Capacity Measurement. Causes and Uses:A Case Study of Selected Industries in Israel,UNIDO Expert Group Meeting, Rio-de-Janeiro,March, 1969.*
s

124
Meneses, E., "Assistance for the Development of thePharmaceutical Industry in Kenya", Report for the Government of Kenya (Ministry of Commerce and Industry", October 1984*
Mwangi, H., The Plastics Processing Industry in Kenya, Unpublished M .A. Thesis, University of Nairobi, 1984.Monopolies Commission "Chlordiazepoxide and DiaKepam", Her Majesty's Stationery Office (HMSO), London 1973.
Morawetz, D., Capital Utilisation in Israeli Industry,The Maurice Falk Institute for Economic Research in Israel, Jerusalem, June 1975.
Perry, G., "Capacity in Manufacturing", Brookings Papers on Economic Activity. Vol. 3, 1973Pharmaceutical Manufacturers' Association (PMA), Brands, Generics, Prices and Quality", PMA, Washington D.C. 1971.
Phan-Thuy, V. et. al, Industrial Capacity and Employment Promotion: Case Studies of Sri-Lanka, Nigeria, Morocco, and Over-all Survey of other Developing Countries. Gower Publishing Co.Ltd. Y/estmead, Farnborough, Hants, England 1981.
Philliphs, A.,"Industrial Capacity: An Appraisal of•Measures of Capacity", American Economic Review. Vol. 53, March - May, 19#3.
Raghavachari, M.V., "Excess Capacity and Production Potential in Selected industries in India", Reserve Bank of India Bulletin. April 1989.
Ruy Aguiar da Silva Leme, Excess Capacity in BrazilianIndustry, UNIDO Export Group Meeting, March 1969. . _____
Tawfik, A.S., "Studies on the Development of Pharmaceutical Sector and Related Industries in Kenya", (Technical Report), Ministry of Commerce and Industry, Nairobi, January 1980.
Thoumi, F.E., "Fixed Capital Utilisation in Columbian Manufacture", IBRD, September, 1973.
United Nations, Journal of Development Planning, "Some Elements in the Strategy of Employment Promotion in Development Countries", New York, 1972.

125
UNCTAD,
UNCTAD/GATT,
UNCTC,
UNIDO,
"Examination of the Economic, Commercial and Developmental Aspects of Industrial Property in the Transfer of Technology to Developing Nations: Trade Marks and Generic names ofPharmaceutical and Consumer Protection",UNCTAD (TD/B/C. 6/90)., Geneva, 1982."Technology Policies in the Pharmaceutical Sector in Phillipines", UNCTAD/TT/36, New York, 1980."Technology Policies in the Pharmaceutical Sector in Nepal", UNCTAD/TT/34, Geneva,October, I98O."Technology and Development Perspectives of the Pharmaceutical Sector in Ethiopia", UNCTAD/TT/5 8, Geneva, 1984.Market for Selected Medicinal Plants and their Derivatives", United Nations Publication,Geneva, 1982."Transnational Corporation in the Pharmaceutical Industry of Developing Countries", UNCT (E/C IO/8 5), New York, 1980."Transnational Corporations and the Pharmaceutical Industry", UNCTC, Sales No. E-79, II A.3, 1981."First ConsultationMeeting on the Pharmaceutical Industry: Global Study of the Pharmaceutical Industry", (ID/WG 331/6), Lisbonj Portugal Dec. 1980."A Basic Technological Disaggregation Model:The Petro Chemical Industry", (UNIDO/15-283),Jan. 1982."Growth of the Pharmaceutical Industry in Developing Countries: Problems and Prospects".Vienna. United Nations Publication, Sales No. E78 II.B.4 Vienna 1 9 8 0. ..."Monographs on Appropriate Industrial Technology No. 10. Appropriate Industrial Technology for Drugs and Pharmaceutical", (ID/232/10), United Nations Publication, New York, I98O."Second Consulation on the Pharmaceutical Industry: The Manufacture of Caccines toDeveloping Countries", ID/WG 393/13), Budapest, Hungary, November 1983.

126»
UNIDO, "Arrangements for the Transfer of Technologyfor the Formulation of Pharmaceutical Forms; Contractual Conditions and Background Notes", (ID/WG. 385/2), UNIDO Secretariat, Vienna, Austria, Dec. 1982.
Vaitsos, C.V., and Golemis, C,, "Control of TransferPricing Practices in Kenya", UNCTC, Feb. 1981*
Venkataburamanian, P.B., "The Law of Trademarks in India", Y/orld Development Vol. 7, 1979*
Y'angwe, S.M., "Technology Issues in the Capital GoodsSector: A Case Study of the United Republic of Tanzania", UNCTAD, (TD/B/C. 6/AC/7/4), May 1982. . _
----, "Factors Influencing Capacity Utilisation inTanzania Manufacturing", International Labour Review. Vol. 115, No. 1, Jan., Feb. 1977*
Winston,*G.C., "Capacity Utilisation in Economic Development", Economic Journal. Vol. 81 (321), March. 1971*

- 127 -a p p e n d i x 1*
rqTIMATED COSTS AND SAVINGS ON SELECTED HIGH-VALUE PHARMACEUTICAL TTEHS ------ REQUIRED RY FASTERN CENTRAL AND SOUTHERN A1TRIUA.
injectionsoral dosage
formspreparations for external use
chemicalssurgicaldressings
totals:
items costing 0.05 million dollars and
aboveitems costing 0.10 million dollars and
aboveitems costing 0.15 million dollars and
above
no. of items
value in US $ m
no. of items
value in US $ m
no. of items
value in US $ m
15 4.09 13 3.95 9 3.0
32 . 15.05 ~29 14.88- 23? 1 14.155
1 0.42 1 0.42 1 0.42•
8 0.83 5— “ 0.58 1 0.15
10 2.87 6 2.58 5 2.28
66 23.26 54 22.41 39J 20.005
total values expressed as a percentage' of total expenditure for the ►j region on drugs and dressings
total expenditure on drugs and dressings% of expenditure on 66 items (US $ 23.26 m)% of expenditure on 54 items (US $22.41 m)
«% of expenditure on 39 items (US $20.61 m)
= US $ 63.4 m = 36.68%= 35.34%= 32.50%
**
.
‘ Thi.«is annendix is extracted from: Commonwealth Regional Health Secretariat and&ulhcm Africa, "Report of the Inveatigatron ,tocurement and Bulk Purchasing of Drugs”, Arusha, October . , • * r

SELECTED HIGH VALUE DRUGS AND SURGICAL DRESSINGS*A. INJECTABLES
Item No. description (generic)\
Unit prevailing unit price (US $)•
estimated regional annual requirement
(millions)
estimated value of regional annual requirements
(million US $)
1. Ampicillin Injection 250 mg ea. 0.2 0.7 0.14• 2. Chloroquine 40 mg/lml. in 5 ml,
(or nearest)ea. 0.05 4.2 0.21
3. Cloxacillin Injection 250 mg ea. .0.3 0.4 0.124. Diazepam 10 mg/ml. I.M./I.V. ea. 0.35 0.45 0.155. Ergometrine Malaete 0.5 mg/ml. ea. 0.03 1.13 0.346. Frusemide 20 mg/2ml. ea. 0.09 0.27 0.247. Gentamicin sulphate 10 mg. ea. 1.09 0.09 0.098. Hydrocortisone Succinate 100 mg
I.M/I.V. ea. 0.6 0.385 0.239. Insulin soluble 40 U/ml x 10
ml. ea.i. 1
1.2 0.085 0.10
* Commonwealth Regional Health Secretariat for Eastern, Central and Southern Africa, "Report of the Investigation on Regional Procurement -and Bulk Purchasing of Drugs", ibid, Table II, p-Z-
128

1B. ORAL DOSAGE FORMS
Item No. description (generic) unit prevailing unit price- (US $)
•
#
estimated regional annual requirement
(millions)
estimated value of regional annual
requirement (million US $ )
16 Abscorbic acid 100 mg . 1000 2.0 60 0.1217 Ampicillin 250 mg 100 7.0 12 0.8418 Ampicillin syrup x 100 ml bottle 1.5 0.15 0.225
.19 Aspirin 300 mg 1000 1.5 ' 300 0.4520 Bendrofluazide 5 mg 100 1.5 1 7.0 0.10521. Chloramphenicol suspension
1 Litrebottle 2.0
10.07 0.14
22. . Chloramphenicol 250 mg 100 2.0 • 28 0.5623. Chloroquine 200 mg 1000 10.0 340 3.424. Chlorpheniramine malaete
4 mg 100 0.2 33 0.6625. Chlorprcmaz inechydrochloridei
100 mg 1000 6.0 14 0.08426. Chlorpropamide 25 mg
or nearest) 100 2.0 4 0.084t
. i i
I
I
129
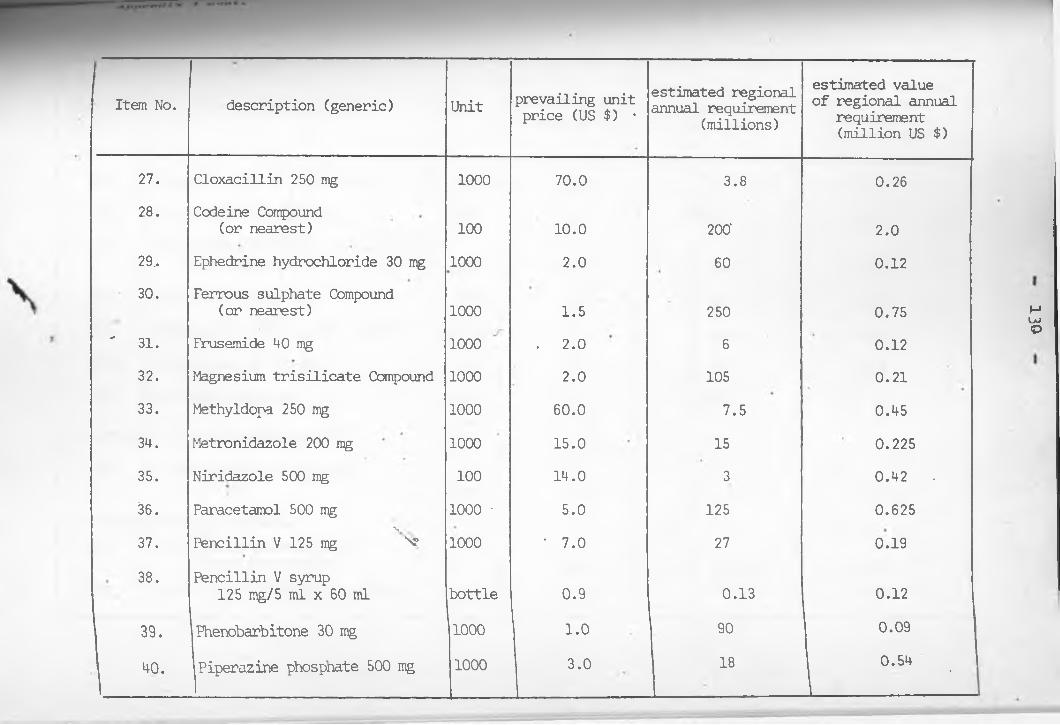
'
Item No. description (generic) Unit prevailing unit price (US $) •
estimated regional annual requirement
(millions)
estimated value of regional annual
requirement (million US $)
27. Cloxacillin 250 mg 1000 70.0 3.8 0.2628. Codeine Compound
(or nearest) 100 10.0 200' 2.029, Ephedrine hydrochloride 30 mg 1000 2.0 60 0.1230. Ferrous sulphate Compound
(or nearest) 1000 1.5 250 0.75' 31. Frusemide 40 mg 1000 . 2.0 6 0.12
32. Magnesium trisilicate Compound 1000 2.0 105 0.2133. Methyldopa 250 mg 1000 60.0 7.5 0.4534. Metronidazole 200 mg 1000 15.0 15 0.22535. Niridazole 500 mg 100 14.0 3 0.42 •36. Paracetamol 500 mg 1000 ■ 5.0 125 0.62537.
%Pencillin V 125 mg “v 1000 ' 7.0 27 0.19
38. Pencillin V syrup125 mg/5 ml x 60 ml bottle 0.9 0.13 0.12
39. Phenobarbitone 30 mg 1000 1.0 90 0.09
40. Piperazine phosphate 500 mg 1000 3.0 18 0.54'
130

Item No. description (generic Unit prevailing unit price (US $)
•
estimated regional annual requirement
(millions)
estimated value of regional annual requirement (million US $)
4 1. Propantheline bromide 15 mg 1000«
’ 2-5.0 8 0.2042. Sulphadimidine 500 mg 1000 5.0 140 0.743. Sulphamethoxazole and trimethoprim
adult tables 100 15.0 2.5 0.3744.
*
Tetracycline 250 mg 100 1.5 36 0.5445. Tetracycline 125 mg/5ml 1 Litre bottle 3.5 | 0.07 0.2446. Thiabendazole 500 mg 100 7.0 2.2 0.1547. Vitamins Multiple ■ 1000
l •1.5 100 . 0.15
C. FREPAINATION FOR EXTERNAL USE. 48. Tetracycline eye ointment
x 3.5 Gm tube 0.6 0.7 0.42D. PHARW
49.VCEUTICAL CHEMICALS '\vXCetrimide c Chlorhexidine
concentrate (savlon) 5L 12.0 0.05L 0.1250. Cresol and soap solution (Lysol) L 1.3 0.06 0.078

item No. description unit prevailing unit price (US $)
. estimated regional annual requirement
(millions)
estimated value of regional annual
requirement (million US $)
51. Ethylchloride x 60 ml tube 2.0 0.05 0.1052. General purpose disinfectant L 0.6 0.22 0.1353. - Glycerine Kg. 1.5 0.05 0.07554. Halothane 250 ml bottle 15.0 0.01 0.1555. Liquid Paraffin L 1.0 0.08 0.0856. Dextrose anhydrous Kg. 2.0 0.05 0.1
E. SURGICAL DRESSINGS • •
57. Absorbent Cotton Wool x 500 Gm roll 1.4 0.5 0.758. Absorbent Gauze BPC 36" 6 yds' roll 0.5 0.25 0.1259.. Absorbent Gauze BPC 36" 100 yds roll 6.5 0.14 0.9160. Bandage WOW 7.5 cm daz 1.0 0.20 0.2061. Bandage Crepe 7.5 cm ea. 0.3 0.175 0.5262. Elastic Adhensive Bandage
7.5 am ea. 1.5 0.275 0.41
132

item No. descriptionunit
prevailing unitprice (US $)
•
0
estimated regional annual requirement
(millions)
estimated value of regional annual
requirement (million US $)
63. Paraffin Gauze Dressing with antibiotic 10 cm x 10 cm x 10's tin 1.5 0.050 0.075
64. Plaster of Paris Bandage 10 cm x 3 yds doz 6.0 0.015 0.09
65. Plaster of Paris Bandage 12.6 cm x 3 yds (or nearest) doz 8.0 0.01 0.08
66.1
Zinc oxide adhensive plaster 7.5 cm x 5 yds
ea. i . 0.20 0.24
I4
K
133

134Appendix 1 cont.
SAVINGS EASED ON PERCENTAGE DISCOUNTS ON LARGE QUANTITIES OF REGIONAL REQUIREMENTS
item no.
1.2.3.4.5.6 .
7.8 .
9.10.11.12.13.14.15.16.17.18.
regional requirement (millions) .
value of regional requirement in US $ (millions)
percentagediscount
savings in US $ (from the discount)
0.7 0.14 - -
4.2 0.21 - -
0.4 0.12 - -
0.45 0.15 - -
1.13 0.34 - -
0.27 0.24- • - -0.385 0.23 - -
0.085 0.10 - -0.074 • 0.11 4''1.6 0.48 / r -3.8 1.14 - -
5.4 0.27 2% 5,4001.0 0.16* - -60.00 0.12 6% 7,20012.0 0.84 6%’ 50,4000.15 0.225 - -
300.0 0.45 8% 36,0007.0 0.15
Y2% 3,000
0.07 0.14 - -28.0 0.56 4% 22,400340.0 3.4 8% 272,000

135Appendix 1 cunt.
Item no. regional requirement (millions)
value of regional requirement in US $ (millions)
percentagediscount
savings in US $ (from the discount)
22. 33.0 0.66 ’ 4% 26,40023. 3.8 0.26 - —
24. 200.0 2.0 8% 160,00025. 60.0 0.12 ' 6% 7,20026. 250.0 0.75 8% • 60,00027. 6.0 0.12 2% 2,40028. 105.0 0.21 8% 16,80029. 7.5 0.45 2% 9,00030. 15.0 0.225 4% . 9,00031. 3.00 0.42 - . —
32. 125.0 0.625 8% 50,00033. 27.0 0.19 4% 7,60034* 0.13 0.12 -
35. 18.0 0.54 4% 21,60036. 8.0 0.20 2% 4,00037. 140.0 0.7 8% .• 56,00038. 2.5 0.37 —
39. 36.0 0.54 4% 21,60040. 0.01 0.24 — —
HI. 2.2 0.15 — —
42. 100.0 0.15 8% 12,00043. 0.7 0.42 __
44. 0.05 0.12 “ * . $ •• —
45. 0.05 0.10 — —
46. 0.22 0.13 — —
47. 0.01 0.15 _ _48. 0.05 0.1-9. 0.5 0.7 _
0. 0.25 0.12 - —
0.14 0.91to - -

136
Appendix 1 cont.
item no. regional requirement (millions)
value of regional requirement in US $ (millions) .
percentagediscount
savings in US $ (from the discount)
52.53.54.
0.200.2750.2
0.20.41
-0.24 'tota
_______________________1
1 savings: 860,000x

QUANTITY DISCOUNTS *
item no. description unit 1 million (unit cost)
5 million (unit cost)
10 million (unit cost)
50 million (unit cost)
100 million (unit cost)
1. Tab. Penicillin V K 125 mg 1000*s 5.53 5.31 5.20 5.09 4.872. Tab. Acetyl salicylic acid
300-mg (Asprin) 1000’s 1.73 1.66 1.63 1.59 1.523. Tab. Codeine Co. B P 1000’s 12.92 12.42 12.16 11.90 11.38
Tab. Sulphadimidine 0. 5 g 1000's 5.64 5.42 5.30 5.19. 4.97 .» ‘ 5. Tab. Ferrous Sulphate Co. 1000's 1.46 1.41 1.38 1.35 .1.29
6. Tab. Multivitamin STB 1000*s 2.98 2.86 2.80 2.74 2.627. Tab. Ascorbic acid 100 mgf 1000's 2.49 . 2.39 2.34 2.29
•
2.19
* Commonwealth Regional Health Secretariat for Eastern, Central and Southern Africa, "Report of the Investigation on Regional Procurement and Bulk Purchasing of Drugs",ibid, Table IVa, V.if. :
137
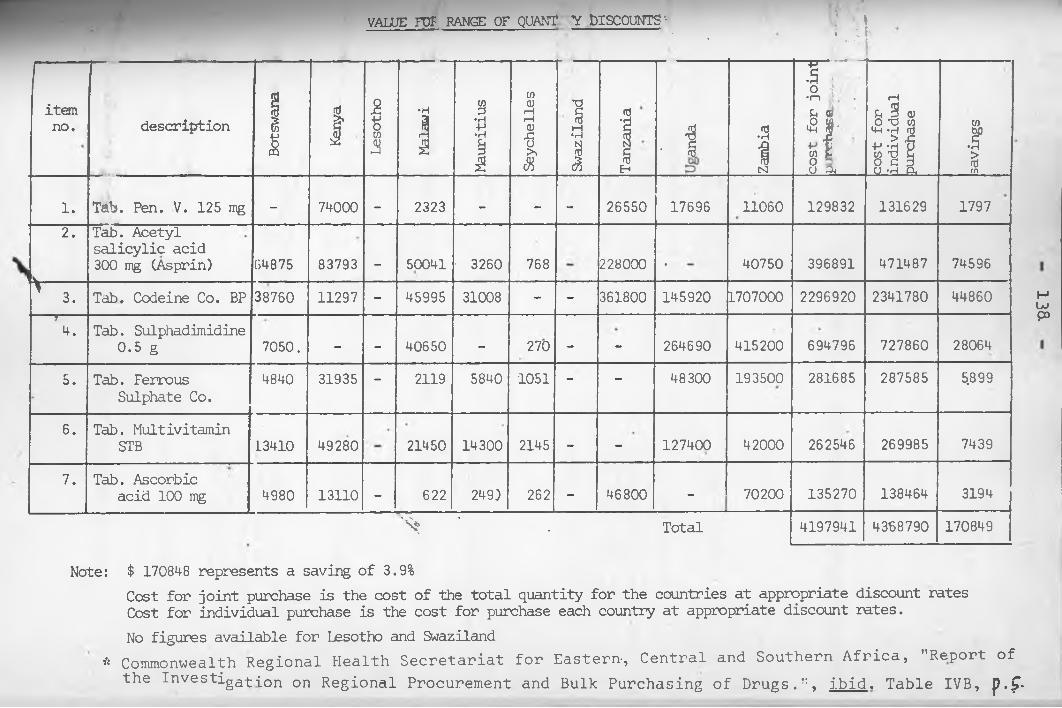
VALUE E O T RANGE OF QUANT Y DISCOUNTS '• V \* * i l lJ . . * •* *• * i I
itemno. description
Botswana
Kenya
Lesotho
Malawi
1Mauritius
Seychelles
Id1 Ta
nzania
- 1& Za
mbia
T "•n „ •u a!•8 jjj'to b8 04 co
st for
individual
purchase
saving
s
1. Tab. Pen. V. 125 mg - 74000 - 2323 - - - 26550 17696 11060 129832 131629 17972. Tab. Acetyl
salicylic acid 300 mg (Asprin) 84875 83793 - 50041 ’ 3260 768 228000 • 40750 396891 471487 74596
^ 3. Tab. Codeine Co. BP 38760 11297 - 45995 31008 - - 361800 145920 L707000 2296920 2341780 44860— »--4. Tab. Sulphadimidine
0.5 g 7050. - - 40650 - 270 - - 264690 415200 694796 727860 280645. Tab. Ferrous
Sulphate Co.4840 31935 - 2119 5840 1051 - - 48300 193500 281685 287585 5.899
6. Tab. Multivitamin STB i3410 49280 21450 14300 2145 - - 127400 42000 262546 269985 7439
7. Tab. Ascorbic acid 100 mg 4980 13110 - 622 249) 262 - 46800 ' 70200 135270 138464 3194
^ ' . Total 4197941 4368790 170849
Note: $ 170848 represents a saving of 3.9%Cost for joint purchase is the cost of the total quantity for the countries at appropriate discount rates Cost for individual purchase is the cost for purchase each country at appropriate discount rates.No figures available for Lesotho and Swaziland
* Commonwealth Regional Health Secretariat for Eastern-, Central and Southern Africa, "Report of the Investiga-£-[on on Regional Procurement and Bulk Purchasing of Drugs.", ibid. Table IVB, p.f•
13^

139
APPENDIX 2A
JLIST OF IIRMS IN KENYA ENGAGED IN PHARMACEUTICAL PREPARATIONS
FIRMS VISITED
FIRM LOCATION AND YEAR OF ESTABLISHMENT OWNERSHIP
Chemafric Pharmaceutical division of Kensara Ltd.
• P.O. Box 44993 NRB Tel. 20845, 26509 (clossed down in 1985)
(1974) A joint-venture between Ambalal Sarabhai Enterprises (India) and Kenya Private partners
Cosmos Ltd. (1976) Kenyan AsiansP.O. Box 41433 NRB Tel 340630
3. Dawa Pharmaceutical Ltd. (1975) P.O. Box 47105 NRB Tel. 80-2401-6 (Ruaraka)
4. Eddy Pharmaceutical Ltd (1936) P.O. Box 41426 NRB Tel 23108, 332962
Joint-venture KRKA (Yugoslavia), Kenya Government and private' investorsKenyan A^ans
5. Elys Chemical Industries Ltd(1971) Kenyan AsiansP.O. Box 40411 NRB
Tel. 20244-56.
7.
Infusion Kenya Ltd. (1976) P.D. Box 30467 NRB Tel. 557744 .
Laboratory and Allied Equipment Ltd. (1969)P.O. Box 42875 NRB Tel. 556367
Hoechst E.A. (MNC Subsidiary),Dr. E. Fre'senius (Germany), ICDC and DFCK (Kenya)
Kenyan Asians
- Pharmaceutical Ltd. (19 77) Kenyan Asians P.O. box 43912 NRB Tel. 555013, 558936

Manhar Brothers (Kenya) Ltd. (1961)
P.0. Box 40447 NRB Tel. 558842, 555883
Kenyan Asians
Nicholas Kiwi (Kenya) Ltd. (1966)
P.0. Box 18194 NRB Tel. 540510
A subsidiary of Nicholas International from Australia
Novelty Manufacturing Ltd (1982) P.0. Box 42708 NRB Tel. 554260
Kenyan Asians
P.A.C. Laboratories Ltd. (1972) P.0. Box 18352 NRB ~Tel. 559906, 556966
Kenyan Asians
Regal Pharmaceuticals (1981) P.0. Box 44421 NRB Tel-. 5418 6 3
Kenyan Asians
%
Sterling Products International Ltd, (1959)
P.0. Box 40942 NRB Tel. 555688
A subsidiary of MNC (USA)
Wellcome Kenya Ltd. (1973) P.0. Private Bag (Kabete) Tel. 592031 (NRB).
An affliate of Wellcome foundat^n (England)
Pharmaceutical Products Ltd. (1981)
P.0. Box-18835 NRB Tel. 553050
Kenyan Asians
The Boots Company (K) Ltd. (1942)
P.O. Box 18195 NRB Tel. 556402
A subsidiary_of MNC (England).
Glaxo E . A. (Ltd. )' (1964) P.O. Box 18288 NRB Tel. 558444
A subsidiary of MNC (England)

141
23.
24.
25.
NOT VISITED
Cussons & Co. Limited P.0. Box 48497 NRBVicks Products (E.A.) Ltd P.0. Box 30454 NRBConsumer Products'(K) Ltd P.0. Box 40478 NRBWestco Laboratories P.0. Box 49691'NRBUnga Feeds Ltd P.0. Box 41788 NRBAshford Laboratories P.0. Box 78142 NRBBeecham of Kenya' Ltd P.0. Box 18195 NRB
Source: Own survey.

142
APPENDIX 2BREGISTERED AND LICENSED RETAIL AND
WHOLESALE CHEMIST ”RETAIL CHEMISTS
1. Howse and MeGeorge Ltd. .P.0. Box , 9, Eldoret2. Howse and McGeorge Ltd. P.0. Box 47, Nakuru3. Abbey Pharmacy Ltd P.0. Box 47618, Nairobi4. Eros Chemist Ltd. . P.0. Box 46676, Nairobi5. Edwart St, Ros & Co. Ltd. P.0. Box 80353, Mombasa6. Opa Limited P.0. Box 43948, Nairobi7. Chemitex Limited P.0. Box 11492, Nairobi8. Jacaranda Chemists P.0. Box 40468, Nairobi9. Harleys Limited P.0. Box 581, Kisumu
10. E.T. Monks Lt.d. P.0. Box 30069 , Nairobi11. Tealands Chemists P.0'. Box 222, Kericho12. Mombasa Chemists P.0. Box 81356, Mombasa13. Nakuru Medical Stores P.0. Box 141, Nakuru14. National Pharmacy Ltd. P.0. Box 11096, Nairobi15. Chhanis Pharmacy Ltd. P.0. Box 49606, Nairobi16. London Pharmacy Ltd. P.0. Bo# 82422, Mombasa17. Portal Pharmacy Ltd. P.0. Box 44029, Nairobi18. Mansion Pharmacy Ltd. P.0. Box 49480, Nairobi19. Central Pharmacy Ltd. P.0. Box 80085, Mombasa20. Ngong Road Chemists Ltd. P.0. Box 24748, Nairobi21. Makupa Chemists Ltd. P.0. Box 98300, Mombasa22. Nyer.i Chemists Ltd. P.0. Box 446, Nyeri23. Kam Pharmacy Ltd. P . 0 . Box .44300, Nairobi24. C. Mehta & Co. Chemists Ltd. ■ » *P.0. Box 81366, Mombasa25. Kilindini Chemists Ltd. P.0. Box 83977, Mombasa26. Nanyuki Chemists P.0. Box 90, Nyanyuki27. Eldochem P.0. Box 417, Eldoret28. City Square Pharmacy Ltd. P.0. Box 41614, Nairobi29. Metro Pharmacy Ltd. P. 0. Box 47158, Nairobi30. Ring Road Chemists P.0. Box 14387, Nairobi

143
31. Kona Chemists P.0. Box 457, Nairobi32. The Nairobi Hospital P.0. Box 30026, Nairobi33. Malindi Chemists Ltd P.0. Box 47, Malindi34. Sega Chemists P.0. Box 46270, Nairobi35. Peoples Chemists P.0. Box 42405, Nairobi36. Nakami Chemists P.0. Box 982, Kitale37. Poly Chemists P.0. Box 41525, Nairobi38. Triochemists Ltd P.0. Box 46713, Nairobi39. Avenue Pharmacy Ltd. P.0. Box 46166, Nairobi40. '. Pharmafrica (K) Ltd. P.0. Box 40192, Nairobi41. Teens Chemists P.0. Box 45267, Nairobi42. Pharmadex (E.A.) Ltd. P’.O. Box 72783, Nairobi43. Karuri Stores (K) Ltd. P.0. Box 41742, Nairobi44. Mombasa Medical Stores (K) Ltd P.0. Box 40428, Nairobi45. •Muthaiga Pharmaceutical
Agencies Ltd P.0. Box 48349, Nairobi46. Meru Chemists Ltd. P.0. Box 728, Meru47. Glove Pharmacy P.0. Box 43912, Nairobi48. Sipril Pharmaceuticals Ltd. P.0. Box 1555, Kisumu49. Kencity Pharmacy (1977) Ltd. P.0. Box 30075, Nairobi50. Kisii Chemist Ltd P.0. Box IfOl, Kisii51. Lady Myra Chemists P.0. Box 51410, Nairobi52. Westwood Pharmacy P.0. Box 45636, Nairobi
cn GO • Lords Pharmacy P.0. Box 49397, Nairobi
54. Cospharm Ltd. P.0. Box 41795, Nairobi55. Thorn Tree Chemists P.0. Box 42351, Nairobi56. Thika Chemists (K) Ltd. P.0. Box 74 , Thika57. Tononoka Chemists P.0. Box 83418, Mombasa58. Care Chemists P.0. Box 333, Nakuru59. Apsyn Pharmacy Ltd. P.0. Box 98618 , Mombasa60. Faizi Pharmacy P.0. Box 86463, Mombasa61. Howse & McGeorge Ltd P.0. Box 641, Kisumu62. Foto-Medica Chemists P.0. Box 40297, Nairobi63. Pangani Chemists Ltd. P.0. Box 42936, Nairobi64. Coast Medical Stores Ltd. P.0. Box 80294, Mombasa

144
65. Abardare Chemists P.0. Box 875, Embu66. Kentons Chemists P.0. Box 176, Kisumu67. Howse & McGeorge Ltd P.0. Box 873, Embu68. Kuweka Chemists P.0. Box 103, Eldoret69. Karatina Chemists P.0. Box 68, Karatina70. Lake Naivasha Chemists P.0. Box 412, Naivasha71. Pharmaceutica P.0. Box 16216, Nairobi72. Western Pharmacy P.0. Box 561, Kakamega
00 • Maendeleo Pharmacy Ltd. P.0. Box 54422, Nairobi74. Meru Medical Stores P.0. Box 786, Meru75. Pharvetag (K) Ltd. P.0. Box 65, Kerugoya76. Furaha Pharmacy Ltd. P.0. Box 110, Thika77. Westons Chemists P.0. Box 45424, Nairobi78. Sears Dispensing Chemists P.0. Box 14168, Nairobi79. Lyntons Pharmacy Ltd.' P.0. Box 58788, Nairobi
CD o • Kam Pharmacy (Westlands) Ltd. P.0. Box 40375, Nairobi
81. Bandari Chemists Ltd. P.0. Box 82040, Mombasa82. Popular Chemists Ltd. P.0. Box \86677, Mombasa83. Westlands Chemists (K) Ltd. P.0. Box 47613, Nairobi
00 •F . Muranga Chemists Ltd. P.0. Box .0, Muranga85. Kitale Chemists Ltd. P.0. Box-' 1579, Kitale
•
to00 Super Pharmaceuticals P.0. Box 60763, Nairobi87. Eastern Drug House P.0. Box 901, Machakos
CD
CD
• Supershem P.0. Box 82696, Mombasa89. Karen Chemists P.0. Box 74573, Nairobi
CD o • Unique Laboratories Ltd. P.0. Box 40918, Nairobi
91. Medichem P.0. Box 8 8016 ,_Mombasa92. Rup Pharmaceuticals Ltd. P. 0*. Box 12906, Nairobi93. Rafiki Chemists P.0. Box 28, Malindi94. Undwewood (K) Ltd. P.0. Box 46923, Nairobi95. Digo Chemists Ltd. P.0. Box 88554, Mombasa96. Huplan (K) Ltd.
•P.0. Box 51598, Nairobi
97. South B. Chemists Ltd. P.0. Box 26294, Nairobi98. Central Drug Co. Ltd. P.0. Box 595, Nyeri

145
99 . 100.
101.
102.
103.104.105.106.107.108.109.110. 111. 112. 113. 114 ,115.116. 117. 118 . 119 . 120 .
121 .
122 .
123. 124 .125.126. 127. 128 .129.130.131.132.
Eastleigh ChemistMedic-Vet. Pharmaceuticals LtdKugoi?ani Chemists LtdOlago PharmaceuticalsAfya Chemists Ltd.NEP Pharmacy.City Chemists Ltd.Leo PharmaThuji ChemistsKilimanjaro Pharmacy Ltd.Voi Chemists Ltd. _Cospharm (Westlands) Ltd.-Karibu PharmacieKitui' Chemists (K) Ltd.Breymer Pharmacy Ltd.
%
Shah Chemists Ltd. ___Niks PharmacyNorth Coast ChemistsNyambene Chemists Ltd.Riverside Pharmacy Ltd.Maragua PharmacyKapsabet Chemists Ltd.Kaya Pharmacy Ltd.Bungoma Chemists Ltd.Tropical Pharmaceuticals Ltd.Saganko LimitedEquitor Dawa Ltd.Saced PharmacyBoma Laboratories Ltd.Ngong Hills ChemistsRawan Chemists LtdDema Pharmaceuticals Ltd.Gatundu LaboratoriesHomes Lab. & Dispensing
Chemists
P.0. Box 73487, NairobiP.O. Box 86595,.NairobiP.0. Box 98300, MombasaP.0. Box 47422, NairobiP.0. Box 59851, NairobiP.0. Box 29, Garissap.o. Box 74041, NairobiP.0. Box 40959, NairobiP.O. Box 1147, ThikaP.O. Box 43106, NairobiP.O. Box 207, VoiP.O. Box 41795, NairobiP.O. Box 47508, NairobiP.O. Box 399, KituiP.O. Box 43912, NairobiP.O. Box 14387, NairobiP.O. Box 90311, NairobiP.O. Box 50, MalindiP.O. Box 598, MeruP.O. Box ^492, ThikaP.O. Box''487, MaraguaP.O. Box 302, KapsabetP.O. Box 87018, MombasaP.O. Box 1053, BungomaP.O. Box 57001, NairobiP.O. Box 206, BusiaP.O. Box 156, NyahururuP.O; Box 88780, MombasaP.O. Box 17, MigoriP.O. Box 56091, NairobiP.O. Box 20085, NairobiP.O. Box 307, Limuru-P.O. Box 454, Gatundu
P.O. Box 2233, Kisii

146
133. Mathingira Kenda Medical Stores P.0. Box 67113, Nairobi134. Highlands Chemists P.0. Box 671, Nakuru135. Olympic Pharmaceutical Ltd. P.0. Box 144, Kisumu136. Famret Supplies Retail Ltd. P.0. Box 23335, Nairobi137. Midlife Pha!rmaceuticals Ltd. P.0. Box 49433, Nairobi138. Chuka Chemists P.0. Box 14, Chuka139. Usonga Chemists Ltd. P.0. Box 253, Bungoma140. Blue Cross Pharmacy Ltd. P.0. Box 83195, Mombasa141. Laikipia Pharmacy Ltd. P.0. Box 169, Nanyuki142. Trichem Limited P.0. Box 18788, Nairobi143.- Metropolitan Chemists Ltd. P.0. Box 2170, Nakuru144. Athi Chemists Ltd. P.0. Box 547, Machakos145. Boma Chemists Ltd. P.0. Box 335, Kericho146 . Cresent Medical Aid P.0. Box 22320, Nairobi147. Nandi Hills Chemists • P.0. Box 2383, Kitale148. Midwest Chemists • • P.0. Box 471, Molo149 . Kitale Chemists Ltd. P.0. Box 44, Eldoret150. Rurago Chemists P.0. Box 70, Maragua151. Upendo Naendelea Chemists P.0. Box 537, Busia152. Majengo'Chemists P.0. Boty Mombasa
' ' ,/
|
Source: Ministry of Health Statistics, June 1985
V

147
WHOLESALE CHEMISTS1. Didy Pharmaceutical Ltd. P.0. Box 41426, Nairobi2. Kemipharma Ltd. P.0. Box 40918, Nairobi3. Universal Pharmacy CK) Ltd. P.0. Box 44555, Nairobi4 . Pfizer Laboratories Ltd._ P.0. Box 10244, Nairobi5. Pangani Chemists Ltd. P..0. Box 42936, Nairobi6. Dawa Pharmaceuticals Ltd. P.0. Box 47105, Nairobi7. E.T. Monks & Co. Ltd. P.0. Box 30069 , Nairobi8. Station Pharmaceuticals Ltd. P.0. Box 41556 , Nairobi9. Century Chemicals & Pharmaceu
ticals Ltd. P.0. Box 59851, Nairobi10. Elys Chemical Industries P.0. Box 40411, Nairobi11. Chemafr.ic Pharmaceuticals P.0. Box 44993, Nairobi12. Ray Pharmaceuticals P.0. Box 22830, Nairobi13. Anpi Pharma Ltd. P.0. Box 46517, Nairobi14. Kaino (K) Limited P.0. Box 67360, Nairobi15. Orbit Chemical Industries P.0. Box 48870, Nairobi16. Medipharma Limited P.0. Box 49678 , Nairobi
Nairobi17. Westco (K) Limited P.0. Box 49691,18. Fura’na Pharmacy Ltd. P.0. Box 110, Thika19. Metro Pharmacy•Ltd. P.0. Box 4j715 8 , Nairobi
•
oCM Sampharma P.0. Box •'2 275 6, Nairobi
21. Nicholas Overseas Ltd. P.0. Box 18194, Nairobi
•CM
CM Jos Hansen & Soehne (E.A.) Ltd._ P.0. Box 82561, Nairobi
fO CO
• Jos Hansen & Soehne (E.A.) Ltd. P.0. Box 30196, Nairobi24. Harleys' Limited P.0. Box 581, Kisumu25. Edward St. Rose & Co. Ltd. P.0. Box 80353, Nairobi26. Sigma Laboratories (K) Ltd. P.0. Box 50543, Nairobi27. Twokay Chemicals P.0. •Box 46189 , Nairobi28. Natmo Chemicals Ltd. P.0. Box 32762, Nairobi29. Twiga Chemical Industries P.0. Box 30172, Nairobi30. May & Baker Ltd. P.0. Box 30104, Nairobi31. Boots Company (K) Ltd. P.0. Box 42569, Nairobi32. Popular Chemists Ltd. P.0. Box 86677, Nairobi

148
33.34.35.36.37.38.
39 .40.41.42.43.44.45. 46 .47.48.49.50.51.52.53.54.55.56.57.58.59.60. 61.
62.63.64.65.
Regal Pharmaceuticals Ltd.Hoechst (E.A.) Ltd.Sipri Pharmaceuticals Ltd.Rup Pharm Ltd.Stuart Pharmaceuticals -Pharmaceutical Manufacturing
Co. Ltd.Apomed ProductsNaheel Sales (K) Ltd.Huplan (K) LimitedWarner-Lambert (E.A.) Ltd.Galxo (E.A.) Ltd.Globe Pharmacy Ltd.Medic-vet PharmaceuticalSantowels LimitedKaruri Stores (K) Ltd.Aberdare ChemistsPharmad (E.A.) Ltd.PMG Medical Products Ltd..Pac Laboratories Ltd.National Pharmacy Ltd.Howse & McGeorge Ltd.Pac Laboratories Ltd.Am-FricMimea-Mifugo Protection Ltd.South B Chemists Ltd.Unique Laboratories Ltd.Denken Pharmaceuticals Ltd.Vista PharmaceuticalsSterling Products Interna
tionalNimikam Limited Pharmaceutical Pan Pharmaceuticals Ltd. Bakpharm Ltd.
p.o. Box 44421, NairobiP.0. Box 30487, NairobiP.O. Box 1555 , KisumuP.O. Box 12906, NairobiP.O. Box 40057, Nairobi
P.O. Box 47211, NairobiP.O. Box 26027, NairobiP.O. Box 43480, NairobiP.O. Box 51598, NairobiP.O. Box 49^10, NairobiP.O. Box 19288, NairobiP.O. Box 58171, NairobiP.O. Box 86595, NairobiP.O. Box 45484 , NairobiP.O. Box 41743, NairobiP.O. Box 875, EmbuP.O. Box 72788 , NairobiP.O. Box 73609, NairobiP.O. Box 18352, Nairobi
. P.O. Box 1,109 6 , NairobiP.O. Box'‘72030, NairobiP.O. Box 18434, Nairobi
- P.O. Box 68029, NairobiP.O. Box 55056 , NairobiP.O. Box 26294 , NairobiP.O. Box 45461, NaiorbiP.O. Box 51550, .NairobiP.O.’ Box 49475 , Nairobi
P.O. Box 40942, NairobiP.O. Box 46381, NairobiP.O. Box 16216 , NairobiP.O. Box 47393, NairobiP.O. Box 53442, Nairobi
\

149
66. Coast Medical Stores Ltd. P.0. Box 80294, Nairobi67. Olago Pharmaceutical Ltd. P.0. Box 47422, Nairobi68. Assia Pharmaceutical's Ltd. P.0. Box 30620, Nairobi69. Westco (K) Ltd. P.0. Box 87626 , Nairobi70. Westco (K) Ltd. •71. Wellcome (K) Ltd. Private Bag, Kabete72. Laboratory & Allied Equip
ment Ltd. P.0. Box 42875 , Nairobi73. Faiz Pharmacy P.O. Box 86463, Nairobi74. Phillip Harisson & Cross-
field Ltd. P.0. Box 463, Kisumu75. Phillip Harrison &
Crossfield Ltd. P.O. Box 90244, Mombasa76. Phillip Harrison &
Crossfield. Ltd. P.O. Box 10212, Nairobi77. Howse McGeorge Ltd. P.O. Box 80370, Mombasa78. Kenya Swiss Chemical Co. Ltd. P.O. Box 30393, Nairobi79. Manhar Brothers (K) Ltd. P.O. Box 40447 , Nairobi80. Westlands Chemists (K) Ltd.* P.O. Box 47613 , Nairobi81. Nairobi Pharmaceutical Ltd. P.O. Box 41633, Nairobi82. Salama Chemists Ltd. P.O. Box , 806 9 , Nairobi83. Mac's Pharmaceutical Ltd. P.O. Box' 43912, Nairobi84. City Chemists Ltd. P.O. Box 74041, Nairobi85. West Chemist • P.O. Box 55715, Nairobi86. Karibu Pharmacie P.O. Box 47508, Nairobi87. Kilimanjaro Pharmacy Ltd. P.O. Box 34106 -, Nairobi88. Nairobi Dental Supply Co. Ltd. P.O. Box 40875, Nairobi89. Harleys Limited P.O. Box 4 2.718 , .Nairobi90. Chhanis Pharmacy (K) Ltd. P.O.’ Box 42606, Nairobi91. Breymer Pharmacy Ltd. P.O. Box 43912 , Nairobi92. Fanvet Supplies Ltd. P.O. Box 23335, Nairobi93. Naheel International Ltd. P.O. Box 14224 , Nairobi94. Saganko Limited P.O. Box 206, Busia95. Bungoma Cehemists P.O. Box 1053, Bungoma96. Meru Chemists Ltd. P.O. Box 728, Meru
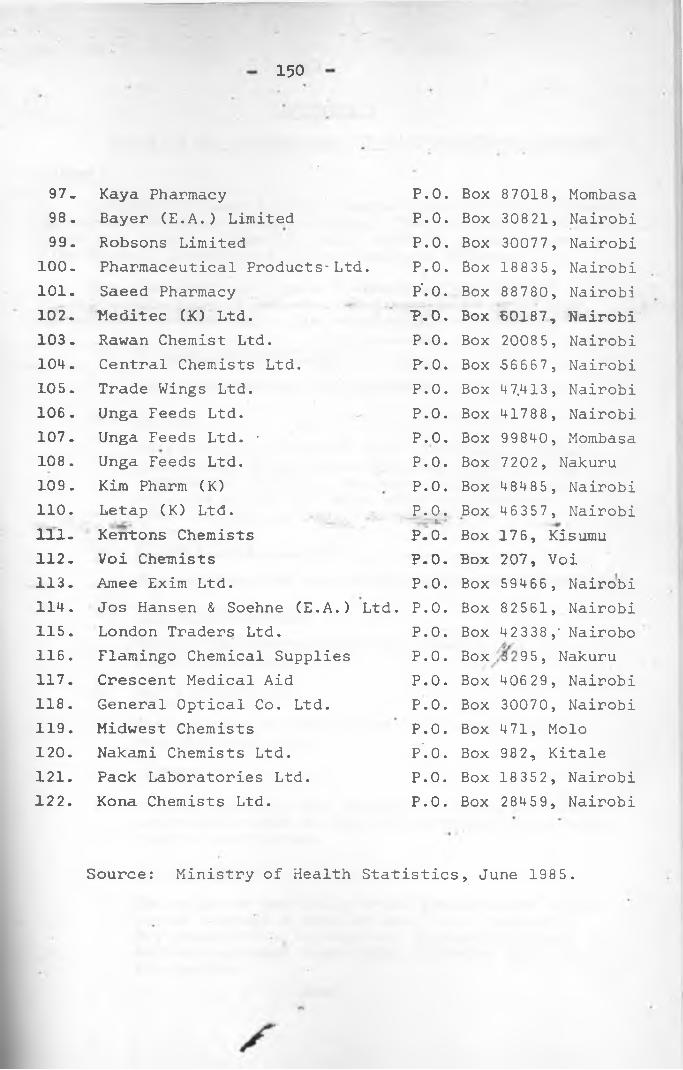
150
97. Kaya Pharmacy P.0. Box 87018, Mombasa98. Bayer (E.A.) Limited P.0. Box 30821, Nairobi99. Robsons Limited P.0. Box 30077, Nairobi
100. Pharmaceutical Products-Ltd. P.0. Box 18835, Nairobi101. Saeed Pharmacy P'.O. Box 88780, Nairobi102. Meditec (JO Ltd. P . 0 . Box £0187, Nairobi103. Rawan Chemist Ltd. P.0. Box 20085, Nairobi104 . Central Chemists Ltd. P.0. Box -56667 , Nairobi105. Trade Wings Ltd. P.0. Box 47.413, Nairobi106 . Unga Feeds Ltd. P.0. Box 41788, Nairobi107. Unga Feeds Ltd. • P.0. Box 99840, Mombasa108 . Unga Feeds Ltd. P.0. Box 7202, Nakuru109. Kim Pharm (K) P.0. Box 48485, Nairobi110. Letap (K) Ltd. P.0. Box 46357, Nairobi•111. Kentons Chemists P.0. Box 176, Kisumu112. Voi Chemists P.0. Box 207, Voi113. Amee Exim Ltd. P.0. Box 59466, Nairobi114. Jos Hansen & Soehne (E.A.) Ltd. P.0. Box 82561, Nairobi115. London Traders Ltd. P.0. Box 42338 ,‘ Nairobo116. Flamingo Chemical Supplies P.0. Box 9 5 , Nakuru117. Crescent Medical Aid P.0. Box 40629, Nairobi118. General Optical Co. Ltd. P.0. Box 30070, Nairobi119. Midwest Chemists P.0. Box 471, Molo120. Nakami Chemists Ltd. p'.o. Box 982, Kitale121. Pack Laboratories Ltd. P.0. Box 18352, Nairobi122. Kona Chemists Ltd. P.0. Box 28459, Nairobi
Source: Ministry of Health Statistics, June 1985.

151
APPENDIX 3STEPS IN THE MANUFACTURE OF-PHARMACEUTICAL PRODUCTS1
TabletsTablets are used in oral dosage forms and are produced
by various degrees of compression.. They can be of various types e.g. plain, chewable, sugar coated, enteric coated, film coated, layered and sustain release tablets.
The flow-chart in Figure I describes the various steps in the manufacture of tablets. Following are major unit operations carried out in the manufacture of tablets.
(a) Milling and shiftingBasic ingredients are pulverised and sieved.
(b) Mixing _Depending on the batch size, carefully weighed quantities of various ingredients like active components diluents, binders, colouring agents etc. are mixed in a mass mixer or planetary
• • mixer as per the requirement.•
(c) Preparations of paste—The solution for granulation is prepared separately
(d) Dry and wet mixingThe ‘granulation solution is added to , he mass and fixed thoroughly. ,/
- • »(e) Wet granulation •The wet mass is granulated in a machine to required mesh size.
(f) DryingThe wet granules are dried in a thermostatically controlled dryer so that the potency of the drug, remains uneffected.
(g) GranulationThe dried of partially dried granules are again passed through a smaller mesh in a granulator.Dry granulation is required in case of single action component comprising the major part of the product.

(h) BlendingThe granules are blended with the lubricating and disintegrating agents.
(i) TablettingThe lubricated granules' are fed to tabletting machine where tablets are formed by compression. During tabletting quality control tests for disintegration, hardness, friability, uniformity etc. are carried out.
j ) Inspection .• Tablets are passed through inspection belts for
checking of uniformity, coating etc.(k) Packing
Depending on the requirements, tablets- are %packed either in glass, plastic, PVC or tin containers or strip packed or blister packed in suitable foils made of paper, plastics, aluminium, etc., counting is done either manually or by machine.
(i) LabellingThe packed tablets are labelled properly by puttin the batch number, manufacturing and expiry dates - in case of Vitamins, antibiotics etc., the pack should indicate the composition of active ingredients and average doses’.
There can be sugarcoating, compression coating, or dry coating, enteric coating, film coating. The tabletting and packing process is the same as described in case of tablets (see Figure 1).(a) Sugar coating
The coating is applied in successive layers to the tablets by deposition from a solution of sucrose.The coating shall be chiefly of sucrose together with purified talc, starch and shellac.
(b) Dry coatingThe granules of different substances are prepared
COATED TABLETS

Quality control department
Raw materials store Binder’s paste
Raw materials tablet depot --5 Disintegrator Powder mixer --■? Mass mixer
f• >
Lubrication of granules 4-- Sizing of dry
granules t-- Thermo stat ically controlled drying <-- Granulation
fTablet compression and de-dusting <-- Coating pan *-- Jacketed kettle for
coating solution •
Visual inspection e— Polishing par (-- ! .Polishing solution•
•Finished product store — > Packing department — •? Strip-packing
Tin or bottle packing --> Final packed store, ready for dispatch
Lable and carton and packaging materials store
Lable and carton printing and checking
Figure I Flow chart for manufacture of tablets i

separately and fed to rotary machine, the core from one rotary machine is being transferred to the other rotary machine by transfer mechanism, and further compressed with the granules of second active drug more stable for atmospheric conditions or with the granule-s of inert auxiliary material forming the outer layer of the tablet.
(c) Enteric coatingA suitable coating is applied such that the tablets comply with the disintegration test for enteric coated tablets, i.e. delayed release in the gastric juice.
(d) Film coatingThe coating which normally comprises less than 10 per cent by weight of the finished tablet is applied by deposition from a suitable solvent. It may consist of any suitable synthetic or natural filming form.
CAToUi-iLbThe capsules are used for keeping the potency of the drug
It protects the same from atmosphere and also masks the taste •and odour of the drugs. It is easier to be swallowed. The capsules are of three types - hard gelatine, s<j£t gelatine and seamless capsules.
As capsules are made out of gelatine, these have to be stored in a dry and cool place. The flow charts in Figure II describe the various steps in the manufacture of capsules. The following major operations are involved in filling the empty hard gelating capsule: (a) sieving andpowdering, (b) blending, (c) sealing, (d) filling, weighing and blending, (e) packing and (f) labelling.(a) Milling and sieving
Basic ingredients are powdered and sieved through suitable mesh.
(b) MixingAs per the batch size, the required ingredients are weighed and mixed thoroughly in mass, mixer or plentary mixer.

V
155
(c) Preparation of solutionIf small granules are required the granulation solution is prepared separately. •
(d) Wet mixingThe solution is added to the iriasc and mixed thoroughly.
(e) Wet granulationThe wet mass is granulated to required mesh size.
(f) Drying •The wet granules are dried in a thermostatically controlled dryer without affecting the potency of the drug. Steps (e) and (f) are not commonly followed unless otherwise required for special type of preparations. However, granulation is done in all cases* .
(g) . BlendingThe granules are blended with the lubricants.
(h) Sorting and cleaning of empty capsulesThe empty hard gelatine capsules are stor^ in humidity- controlled air conditioned area. They ar f sorted out and cleaned before filling.
(i) Filling of capsulesThe empty gelatine capsules are taken in the hopper of automatic capsule filling and closing machine and after adjusting the weight, the mass is filled by the machine. Hand-operated mach.ines are also used for filling the capsules. These operations require himidity- controlled air-'conditioned area. Weight variations are to be eliminated by properly adjusting the machine.
(j) Polishing and inspectionThe filled and sealed capsules' are put in polishing pans and after that, the capsules are subjected to inspection and quality control before packing.
(k) PackingDepending on the requirements, the capsules are filled in glass, plastic, PVC or tin containers or strip-

Quality control de

157
packed in suitable foils made of aluminium or paper. Counting is done either mannually or by machine.
(1) LabellingThe packed capsules are labelled properly by putting batch number, manufacturing and expiry dates in case of vitamins and antibiotics. This also should indicate the composition of aGtive components and average doses. The finished products after quality control tests are transferred to commercial stores. Steps (h) and (1) and storing require a himidity- controlled air-conditioned area.
.ORAL LIQUIDS.The liquid preparations are also oral dosage forms of
single or .'combinations of drugs. These preparations include syrups, elixirs and suspensions. Figure III shows th'e fldw-chart for the manufacture of liquid orals. The following pperations, in principle, are followed in themanufacture of liquids.%(a) Preparation of demineralized water
All the liquid preparations require demineralized water of particular specifications with respect to ionic concentrations, pH and.conductivity . This is producedby passing the potable water through a series of ion-exchange columns and finally degassing the water. ,/
(b) Preparation of solution or uspensionThe active ingredients are weighed carefully. The base materials are measured carefully and dimineralized water, if required, added into the solution preparation tank. The active ingredients are also put into the tank fitted with stirrer and mixed thoroughly. In case of suspensions, the product is passed through colloid-mill or homogenizer. For preparation of ethical products,. percolators or extractors are used. Depending on the process-permitted preservatives, stabilizers, colouring and flavouring materials are added during mixing.
(c) Adjustment of parametersYTo get the suitable quality of product, the pH, viscosity
and volumes are adjusted as per the requirements.
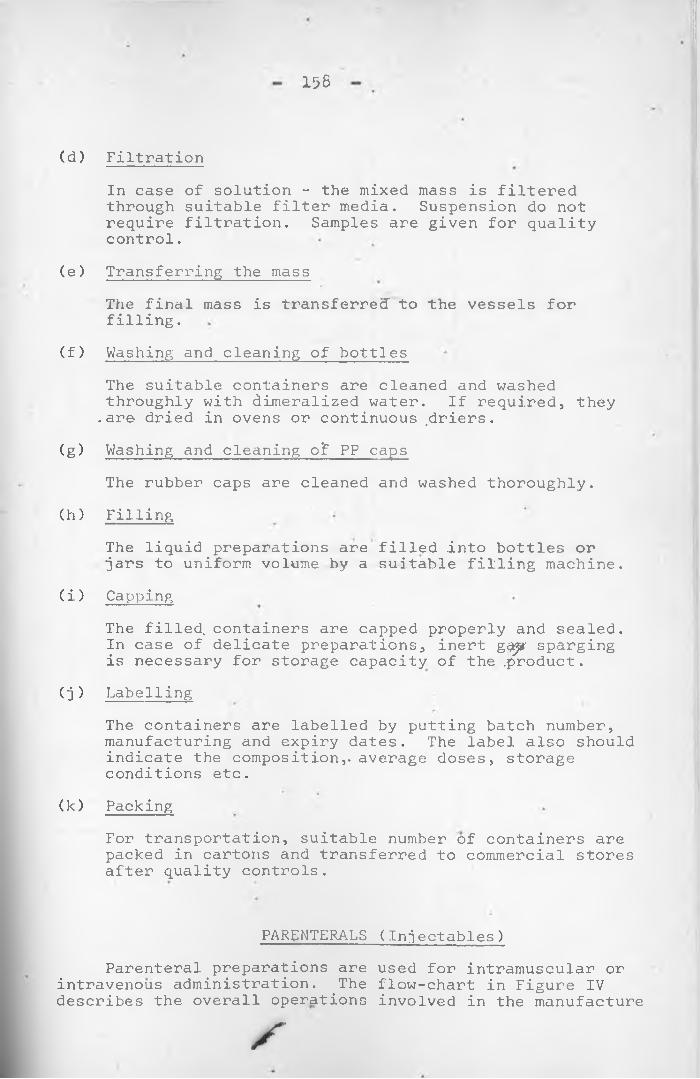
156
(d) FiltrationIn case of solution - the mixed mass is filtered through suitable filter media. Suspension do not require filtration. Samples are given for quality control.
(e ) Transferring the massThe final mass is transferred" to the vessels for filling.
(f) Washing and cleaning of bottlesThe suitable containers are cleaned and washed throughly with dimeralized water. If required, they .are dried in ovens or continuous .driers.
(g) Washing and cleaning of PP capsThe rubber caps are cleaned and washed thoroughly.
(h) FillingThe liquid preparations are filled into bottles or jars to uniform volume by a suitable filling machine.
(i) CappingThe filled, containers are capped properly and sealed. In case of delicate preparations, inert g^ sparging is necessary for storage capacity of the .product.
(j) LabellingThe containers are labelled by putting batch number, manufacturing and expiry dates. The label also should indicate the composition,, average doses, storage conditions etc.
(k) PackingFor transportation, suitable number of containers are packed in cartons and transferred to commercial stores after quality controls.
Parenteral preparations are used for intramuscular or intravenous administration. The flow-chart in Figure IV describes the overall operations involved in the manufacture
PARENTERALS (Injectables)

Figure III Flew chart for the manufacture of syrups, elixirs and solutions
1*39
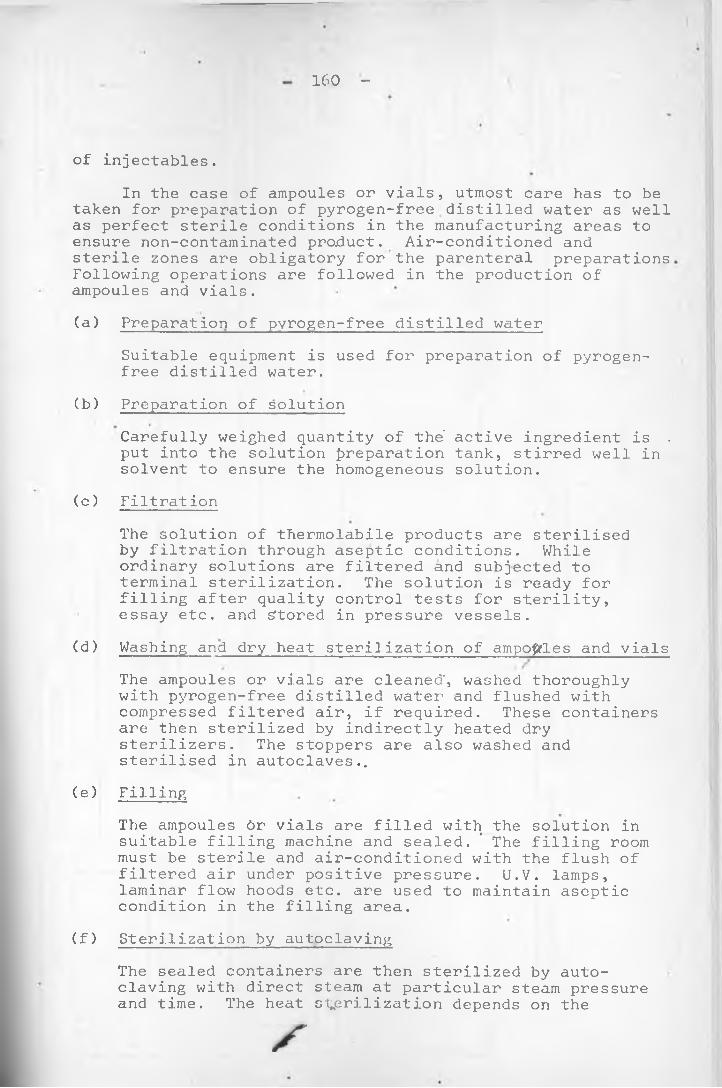
1 6 0 -
of injectables.In the case of ampoules or vials, utmost care has to be
taken for preparation of pyrogen-free distilled water as well as perfect sterile conditions in the manufacturing areas to ensure non-contaminated product. Air-conditioned and sterile zones are obligatory for the parenteral preparations Following operations are followed in the production of ampoules and vials.(a) Preparation of pyrogen-free distilled water
Suitable equipment is used for preparation of pyrogen- free distilled water.
(b) Preparation of solutionCarefully weighed quantity of the’ active ingredient is . put into the solution preparation tank, stirred well in solvent to ensure the homogeneous solution.
(c) Filtrat ionThe solution of thermolabile products are sterilised by filtration through aseptic conditions. While ordinary solutions are filtered and subjected to terminal sterilization. The solution is ready for filling after quality control tests for sterility, essay etc. and stored in pressure vessels.
(d) Washing and dry heat sterilization of ampoules and vialsThe ampoules or vials are cleaned', washed thoroughly with pyrogen-free distilled water and flushed with compressed filtered air, if required. These containers are then sterilized by indirectly heated dry sterilizers. The stoppers are also washed and sterilised in autoclaves..
(e) FillingThe ampoules 6r vials are filled with the solution in suitable filling machine and sealed. ’ The filling room must be sterile and air-conditioned with the flush of filtered air under positive pressure. U.V. lamps, laminar flow hoods etc. are used to maintain aseptic condition in the filling area.
(f) Sterilization by autoclavingThe sealed containers are then sterilized by autoclaving with direct steam at particular steam pressure and time. The heat sterilization depends on the
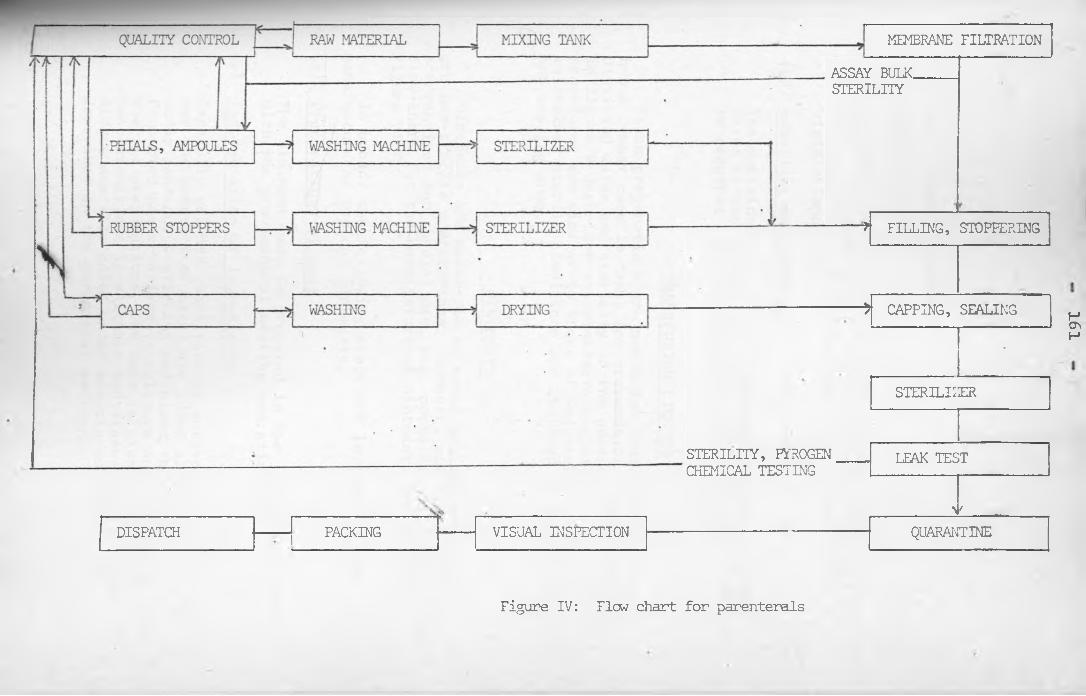
DISPATCH PACKING
MEMBRANE FILTRATIONASSAY BULK. STERILITY
STERILITY, PYROGEN CHEMICAL TESTING
VISUAL INSPECTION
* FILLING, STOPPERING
5 CAPPING, SEALING- •
STERILIZER
LEAK TEST
>>QUARANTINE
Figure IV: Flew chart for parenterals
161

1 6 2
particular type of products.(g) Leak testing
The ampoules or vials are tested under vacuum for leak test. Rigorous quality control tests are carried out for sterility. Visual inspection is conducted for visible impurities.
(h) Labelling and packingThe containers are labelled by putting batch number, dates of manufacture and expiry etc. Isolated area is required for penicilling group of products.
TRANSFUSION LIQUIDSThese preparations are'meant for intravenous use and
hence utmost care is taken for preparation of pyrogen-free distilled water and sterility of the product. The flow-chart in Figure V describes the manufacturing steps. All the procedures are similar to those of injectables. Strictly maintained sterile conditions are required in the filling and sealing area.
OINTMENTSOintments are meant for external use and hence these
are non-sterile preparations. However, steril^'preparations are required for special use, e.g. opthalmic ointments. The flow-chart for the manufacture of ointments is shown in Figure VI.
In broad, the following steps are involved in the manufacture of topical ointments..(a) Preparations of base
The ointment base is prepared in the jacketted vessels with the provision of heating and stirring.
(b) Incorporation of ingredientsCarefully weighed quantities of active ingredients (as per the quantity of base) are added slowly into the base under continuous stirring and mixed thoroughly.Permitted preservatives, stablizers are added here. For sterile preparations, the base is sterilized in dry heat sterilizer in suitable container and the ingredients are also added under aseptic conditions as described in the parenteral section.
/

RAW MATERIALS — ------------------ / LAIm
■3----WASHING MACHINE-- V- •STERILIZER — FILTER PRESS AND PUMP
A S S A Y
RUBBER STOPPERS•< ’ ----> WASHING MACHINE-------- STERILIZER — FILLING
PACKING-
DIS
CHECKING•
3ATCH lSAMPLING
QUARANTINE c---- S'FERILIZERISTERILITY, PYROGEN AND
CHEMICAL TESTING
Figure V: Flew chart for transfusion fluids
163

V «. 164
(c) SmoothingThe mixture is passed through a colloid mill/triple roller mill and sampled for quality control tests.
(d) FillingThe ointment is then filled into the collabsible tubes by automatic filled and crimping machine. For sterile preparations, smoothing is done under sterile condition and tubes are also sterilized after filling.
(e) LabellingApart from the tubes are printed with the necessary information like composition, warning etc., these are labelled after filling with batch number, date of manufacture and expiry.
POWDERS AND GRANULESPowders and granules are used for oral, topical or
parenteral administration. The flow chart for the manufacture and filling is shown in Figure VII. The major operations are similar to those for tablet manufacture. After milling, sieving, granulation, drying, blending, quality control tests are conducted. The granules are then filled into bottles by automatic filling machine and capped. Sampling is done for weight variations. The bottles are then labelled and packed. After quality control tests they are/'stored. Depending on the nature of product and final use, sterile and air-conditioned areas are required for final product and filling.
S'

/ Quality control
L— — j— ^
\
Dispatch • e
Tube Cleaning
Jars and bottles — Washing
Cap
Packing
e>J Washing
Sample
Checking e
Sterilizer for — sterile products
Sterilizer for sterile products
Drying
•Sterility testing for sterile products
Chemical testing
Quarantine
Mixing tank
Colloidal mill triple mill emulsiler
\t1 Filling tubes, bottles, jars
► Capping, campingHcr.VJI
Figure VI Flow chart for the manufacture of ointments, emulsions, lotions and suspensions
i

Quality Control
* Granulator
Figure VII Flow chart for powder filling

-----5, Thermos controlstatically Lied over
______ 2:____ -___Sieving
Active ingredients to be blended
-------¥—
Mixing

167
FOOTNOTE FOR APPENDIX 3
1. This entire appendix is copied from:UNIDO, "Arrangements for the transfer of Technology for the formulation of Pharmaceutical forms. Contractual Conditions and Background notes", (ID/WG. 385/2), UNIDO Secretariat, Vienna Austria, 15-17 Dec. 1982. pp. 69-83.
\

APPENDIX 4INTRODUCTORY LETTER
University of Nairobi, Economics Department, P.0. Box 30197, NAIROBI.
Date
Dear Sir,RE: STUDY VISIT
I am a post-graduate student in the Department of Economics, University, of Nairobi. Currently, I am doing an in-depth study of the Kenyan Pharmaceutical Industry for my M.A. -thesis, with the approval of the Office of the President. As part of my research, I would appreciate it, if I could interview you about the operations of your firm.
My study focuses on aspects such as capacity utilisation, labour utilisation and protection of local manufacturers.The interview might take about: I-I5 hours. I would also wish to tour the plant briefly.
The result of the research will be presented to the Department of Planning in the Ministry of Finance and Planning We will also recommend policy changes to better- assist the development of your industry. This report is part of a much larger effort by the Industrial Research Project to re-assess Kenya’s industrialization strategy. . AS
f4
If convenient I would like to visit your plant on.................. . Please confirm if this suggested timeis convenient. If not, please suggest an alternative time.
Perhaps to quicken the interview, you could go through the attached questionnaire in advance and fill in parts.................... I am sure you will provide me withevery assistance to enable me produce an empirical- contribution to the development of the Kenyan Pharmaceutical Industry.
Thanking you in advance.Yours sincerely,
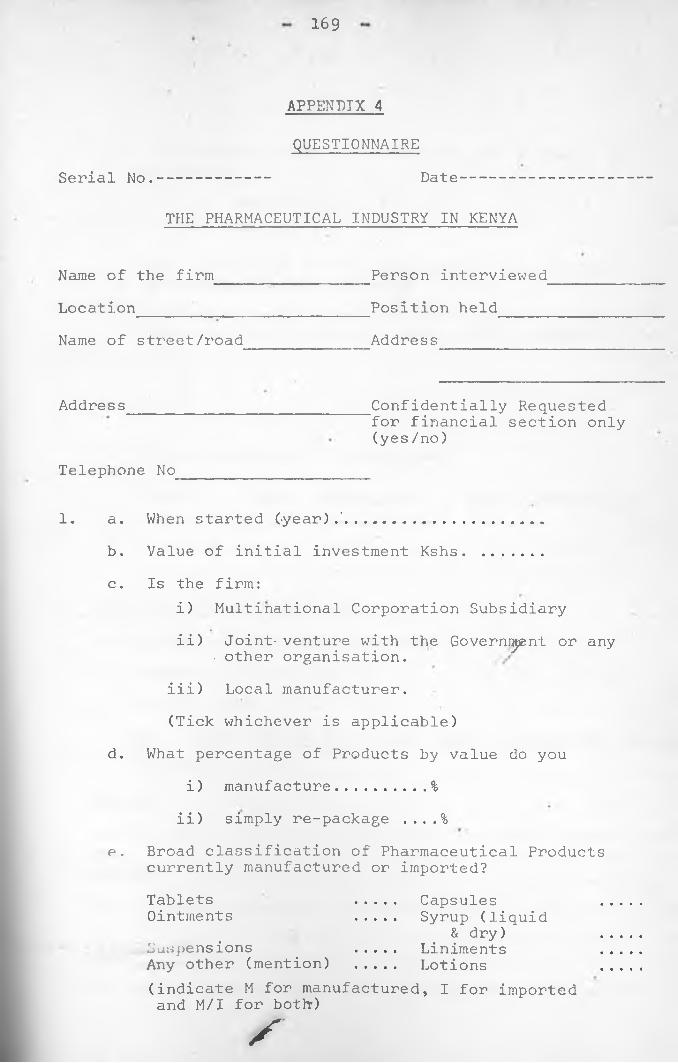
169
APPENDIX 4QUESTIONNAIRE
Serial No.----------- Date---------
THE PHARMACEUTICAL INDUSTRY IN KENYA
Name of the firm________________Person interviewedLocation_____ __________________Position held_____Name of street/road Address
Address Confidentially Requested for financial section only (yes/no)
Telephone No
1. a. When started (-year).'................... .b. Value of initial investment Kshs. .......c. Is the firm:
i) Multinational Corporation Subsidiaryii) Joint- venture with the Governi^nt or any
• other organisation.iii) Local manufacturer.(Tick whichever is applicable)
d. What percentage of Products by value do youi) manufacture......... %
ii) simply re-package ....%e. Broad classification of Pharmaceutical Products
currently manufactured or imported?Tablets .... CapsulesOintments .... Syrup (liquid
& dry)Suspensions .... LinimentsAny other (mention) .... Lotions(indicate M for manufactured, I for imported and M/I for both-)f

1 7 0
f. Approximately what percentage of your products by value are:
i. Sterile ...... %• ii. Non-Sterile ...%'
g. What percentage of the total production (by value)are Pharmaceutical products ....... %
h. List other products manufactured apart from thepharmaceutical products: (e.g. foods, cosmeticsetc. )
i. Later expansions to Investments:
Year Type Value Kshs. Line of production
WORKING TIME DECEMBER 198^a. Number of days worked per week ..... ,y.............b. Number of shifts per day ...................... %c. Usual length of each shift ........................
DAY SHIFT STARTING TIME BREAKS ENDING OVERTIME NO. OF ADMIN.1 ..............................................
MON-FRI. 2 ........... ..........................: ....
1SATURDAY . 2
1 __ ....................................SUNMY 2 ........................................d. Does the equipment continue running during the breaks? (yes/no)
/

171
3. LABOUR (DECEMBER 1984)CLASS SHIFT 1 SHIFT 2 SHIFT 3Managers ......... . ...... ......Supervisors ....... ...... ......Technicians ....... ...... ......Skilled labourers ....... ...... ......Semi-skilled labourers ....... ...... ......Unskilled ....... ...... ......Casual labourers ........ ...... ......Other office workers ....... ...... ......(show the number of expartriates in each cateogory, for example, if there are 10 supervisors in the first shift and 4 expatriates; write 10(4))
4. LABOUR AND WORKING TIME PER PROCESS e.g. capsulating,t a b l e t t i n g , p a c k in g e t c .
a. Section................ Process.................• ^b. No. of machines used for the process../........
c. For each machine give the data below:CAPACITY WORKERS
MACHINE MAXIMUM ACTUAL MAXIMUM ACTUAL COST.KSHS.1 ...... ......................................2 ...............................• ...........3 ......................... • ..................4 ................................................5 ................................................

172
d. The number of hours the machines are operated per day MACHINE START BREAKS STOP HOURS WORKED/DAY
1 .........................................2
3 .... ..... .... .................4 .........................................
e. When were the above machines inoperational in 1984?MACHINE MONTHS INOPERATIONAL REASON
1 • .............. -......................
3 .....................................*4 .....................................5 .....................................
f. How much additional work can the machines handle withthe existing labourers and capital stock?
CAPACITY UNDERUTILISATIONTo what extent are the following factors important in explaining the current underutilisation of plant and equipment in your firm:a. Market limitations (inadequate + seasonaldemand) ............
•* •
b. Difficulties encountered in obtainingraw materials ............
c. Difficulties entered in obtainingspare parts ............d. Plant breakdowns ............e. shortage of skilled personnel ............
/

173
f. Competition from importersg. Any other (mention)
Indicate: 1 for very important2 for important3 for just important4 for not important
6. CHOICE AND COST OF TECHNOLOGYa. How do you choose the technology and machinery
to use in your firm?
b. How does your production techniques compare with those of the mother company?
c. Enumerate the factors considered in determining the equipment/machinery/material inputs/s|&re parts etc.
i...................... .........................i i......................... ......................iii................................................iv................................................v..... ...........................................
d. Where do you obtain your purchases from (explain)item country & company reason
e.g. machinery e.g. cheaper priceraw materials better quality

174
e. What has the firm done to adapt the imported equipments for the local environment?
f. Who controls i.
ii.
the production techniques
marketing techniques
iii. Personnel policies
g. How much royalty and fees do you pay under licenceand service agreements for.the products you manufacture (give examples) ........... Kshs.
Fees Amount Paid to Periode.g. technical Product (as a % of) Co. & country) from to
mgt. i.
h. Do the mother company or Licensors insist that you obtain sane spares, inputs, equipment etc. from them or "approved" sources? (yes/no)........... •..Explain:..............................................
i. What % of your sales is allocated for local Research and Development? ..................................Do you contribute some money for any foreign R&D? yes/noIf yes, to which organisation and of what value:....
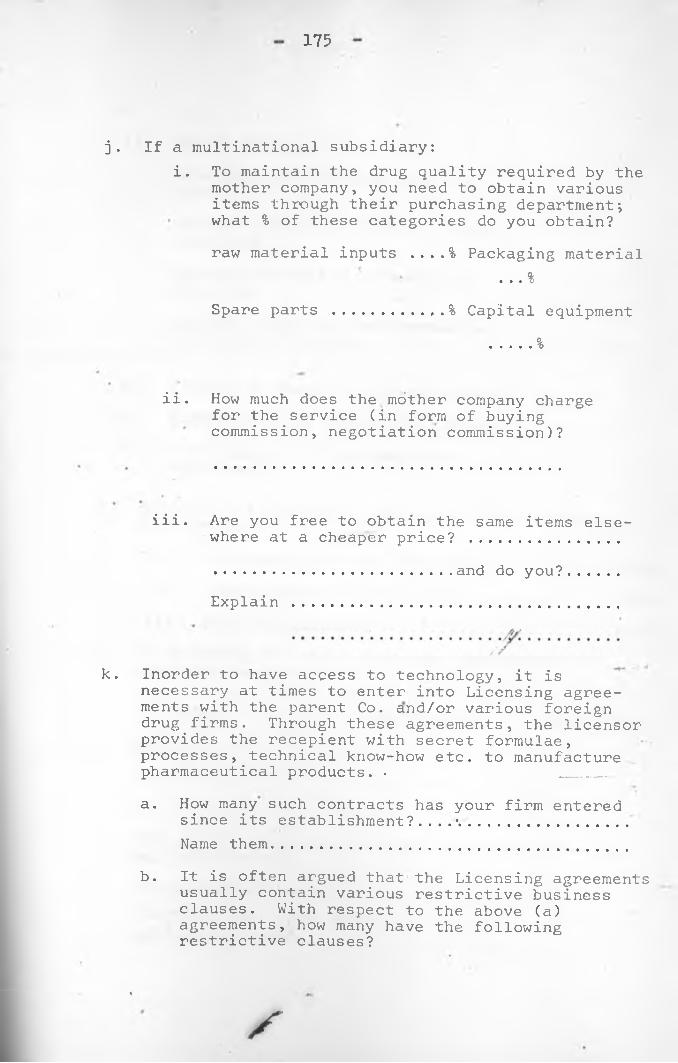
175
j. If a multinational subsidiary:i. To maintain the drug quality required by the
mother company, you need to obtain various items through their purchasing department; what % of these categories do you obtain?raw material inputs ....% Packaging material
... %Spare parts ........... % Capital equipment
............ %
ii. How much does the mother company charge for the service (in form of buying commission, negotiation commission)?
iii. Are you free to obtain the same items elsewhere at a cheaper price? ....................................... and do you?.....Explain
k. Inorder to have access to technology, it isnecessary at times to enter into Licensing agreements with the parent Co. and/or various foreign drug firms. Through these agreements, the licensor provides the recepient with secret formulae, processes, technical know-how etc. to manufacture pharmaceutical products. • _____a. How many such contracts has your firm entered
since its establishment?....*.................Name them.....................................
b. It is often argued that the Licensing agreements usually contain various restrictive business clauses. With respect to the above (a) agreements, how many have the following restrictive clauses?

176
i. Export restrictions .....permission of licensor prior toexport .....exports permitted only to certain countries .....exports prohibited to'certaincountries .....exports restricted to licensor’s agents/distributors • .....
ii. Tied-in purchases of raw materials .....'iii. Restrictions on production patterns .....
iv. Restrictions on termination ofagreements .....
7. a. How much did you spend last year (1984) in theimportation of:
i. Pharmaceutical raw materials............. kshs .ii. Pharma.ceutical spare parts .............. kshs.
iii. Capital equipment ............ ^ .........kshs.b. In importing the above products, what amount of duties do you pay?
Item Custom duty Sales tax
c. What are the weighted averages of import duties you pay on the above:Pharmaceutical products ...............Pharmaceutical spare parts ............
# \Capital equipment .....................

177
d. Did you experience any problems in obtaining import licence and foreign exchange to purchase the above products? (yes/no)..........explain ..........................................
e. List the additional expenses you incur to bring the items above (a) to your factory stores:
f. What is the weighted average of duties you pay on imported pharmaceutical inputs + spares together?
g. Does the current level of custom duties favour importers of finished drugs? (yes/no).......explain ......................................
h. What are the duties and sales tax tax ghargedagainst importers of finished drugs competing with your products?Item cif (Msa/Nrb) EXity Sales fax Price for your
domestic product
i. The weighted average of duties against competingimports .... %
j. Is this sufficient to protect your products?.............. (yes/no).If no, what should be a favourable duty ........ %
k. Are competing imports banned? ......... (yes/no).

1 7 8
i. Approximately what % of the local market issupplied by the imports? ....... % Of this,what % can- be supplied by the local manufacturers .................. %
m. How do your ex-factory, prices compare to the cif cost (before duties) of competing imports .................... ,..............
n. Do you give any suggestions to the government in regard to tarriff establishment? Explain,
_Li.st the problems you encounter when competing against imports:
i.ii.
iii iv, v, Y
1 1 ,
About how much of Cinchona alkaloids is imported into the country? i.e. quinine, quinidine etc. ............. Kg. ) ................Kshs .
What amounts do you use...... Quantity....... Value
BRAND AND GENERIC NAMESa. May I obtain the Wholesale Price list of the
products manufactured and/or sold by the companyb. Approximately what % of your products are sold
under:i. generic names....'% ii. brand names %

179
c. It is often argued that if doctors prescribed drugs under generic names it could yield some savings to the consumers: Do you agree, explain
d. What are the advantages and disadvantages of using generic and brand names:
9. a. INTE-R AND INTRA-FIRM TRADEFor a selected range of pharmaceutical raw materials and finished drugs commonly used in the firm, give the following information:Raw material/Finished drug ................ .......(indicate the generic name)Use ...... .........................................Country of origin ..................................Sellers ............. Relationship to ^he firm.....
Quantity bought ........ e.g’. kgs./litres unit price..F.O.B. Value Ksh.................Freight/Shipping charges ...............Insurance ...............C&F/C.I.F. Msa, Nrb (specify).......... *....;
• ■
Duty rate ...............Sales tax ...............Any other duty ...............Amount payable ...............
\
b. BULK PURCHASINGi. Suppose you purchased the above products in
/

180\
large quantities, what level of Quantiy discount could you obtain (give examples)
ii) What benefits would accrue if the Government established a centralised purchasing agency to buy all intermediate imports and finished drugs ............................
iii) What are the likely problems to be faced by the Agency ................................
* iv) How can they be solved
10. QUESTIONS FOR MANAGING DIRECTORSa. What were your reasons for investing in Kenya?
7
b. Have you invested in any other countries that use what you produce as an input? If yes, give the following details: (country/input/value)
c. Give details of your negotiation process with the Government during your original investment (i.e. details of entry, any protection promised by the Govt. etc.)......................................
s

181
d. Did any of the firms or the Government resist to your entry? Explain........ ...................
e. Suppose you were to expand your operations, what procedures are you required to.follow?.........
f. Do you need to inform the Govt*, in advance?Yes/no) ................................,.........
g. What is the target return on capital required byyourselves or the mother company (if a subsidiary of a multinational Co.) to justify your investment in Kenya? Explain ....... :.......................
h. What problems does your firm encounter while operating in Kenya? i.e. Technical, Economic,
i. How often do you experience .firm shut downs? Explain giving reasons .....................................
j. How will the following benefit your firm?• •
i. Border opening with Uganda and Tanzania
ii. The recently concluded PTA (Preferential Trade Area) involving some countries in East and Central Africa ...............................
Social
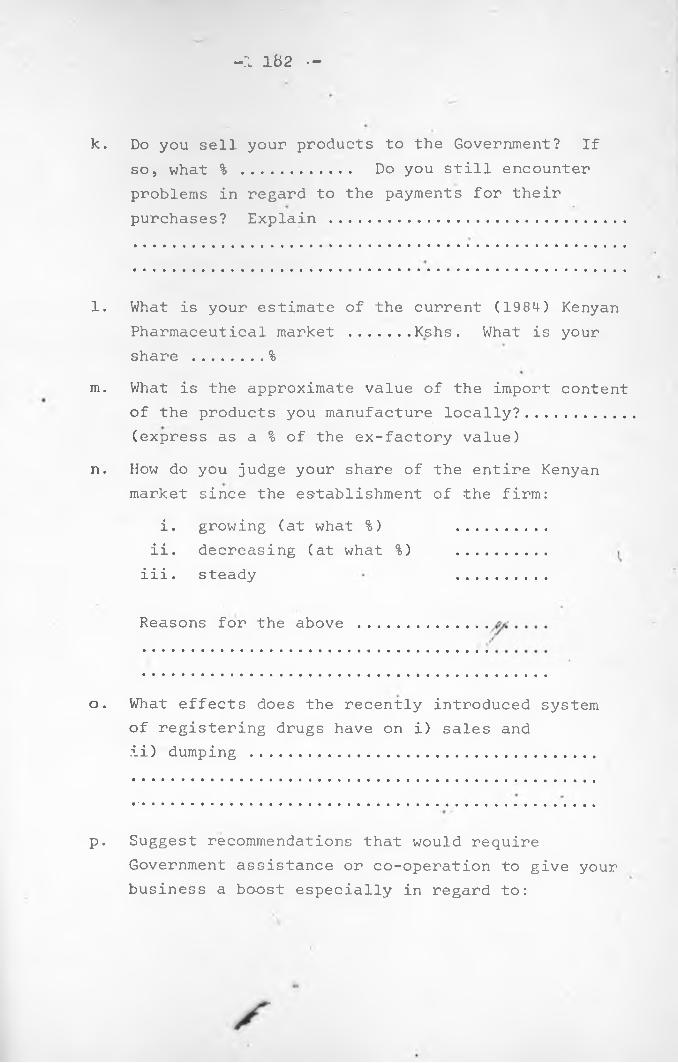
k.
- 1 182 • -
Do you sell your products to the Government? Ifso, what % ........... Do you still encounterproblems in regard to the payments for their purchases? Explain ...........................
l. What is your estimate of the current (1984) KenyanPharmaceutical market ...... Kshs. What is yourshare ....... %
m. What is the approximate value of the import contentof the products you manufacture locally?..........(express as a % of the ex-factory value)
n. How do you judge your share of the entire Kenyan market since the establishment of the firm:
i. growing (at what %) ii. decreasing (at what %)
iii. steady
Reasons for the above .....
o. What effects does the recently introduced system of registering drugs have on i) sales and ii) dumping ....................................
p. Suggest recommendations that would requireGovernment assistance or co-operation to give your business a bo-ost especially in regard to:

% 183
Problems Suggestions for improvement
i. Import licensing ...........................
ii. Foreign exchange allocation ....
iii. Obtaining material inputs ..........
iv. Obtaining spare parts
v.'Any other (mention) ..

184
BALANCE SHEET (1984)
Kshs. • Kshs.CURRENT ASSETS LONG TERM ASSETS
Equipment ....... ......Less'Depreciation ......Land ......Building ......Motor-vehicles • • ......Other long-term assets
Total -lohg term assets • TOTAL ASSETS
LIABILITIESShort term liabilities
Domestic Foreign
Long term liabilitiesDomesticForeign
TOTAL LIABILITIES
TOTAL EQUITY
/
f
Kshs .

185
INCOME STATEMENT ■Kshs.
SALESLess COST OF SALES
Domestically purchased raw materials
Imported raw materials Domestically purchased spares Imported spares •Wages +• Fringe benefits Salaries + Fringe benefits • RentElectricityFuelOther items ...........
Add Opening inventories Shs Less Closing inventories
GROSS PROFIT ON SALESLess EXPENSES />/
Overhead ''Interest paid in foreign exchange ....Interest paid locally ....Depreciation ....Administrative salaries ....Other administrative Overheads ....Other Overheads • ....
Other Expenses
NET PROFIT FOR THE YEAR BEFORE TAXATIONY
Kshs.

186
CINCHONA PRODUCTION (only for Cinchona producers)
1. When did you start growing cinchona bark ..... (year)2. Area occupied ................ (Acres or Hectares)3. First output realised in which year/month ..........9. How grown (e.g. interplanted with other crops)......
5. Alkaloid content of the bark ...... (% of total weight)6. Number of workers employed in the production of
Cinchona'bark ...............
7.
8 .
9.
10. Do you expect your production in 1985 to increase,decrease or remain constant? Explain ...........
*
11. Approximately what •% of your Cinchona Bark is sold to:a. Soft drink industry ... % ..... ...... Ksh.b. Pharmaceutical industry .. . . .% .....c. Any other (mention ......
PRODUCTION
value (ksh)
How_do you measure your production (e.g. Kgs. Tons,Ksh.) .......................Actual production
quantity (kgsO1984 .................1983 .................1982 ................ .1981 .....................1980 ................. r
With the existing investment outlay (labourers, equipment etc.) By how much can you increase the production without additional facilities ..............................

187 -
12. Major export marketsCountry Volume/value Use
13. Do you supply any of the local firms with the product (yes/no) ............................If yes, name the:
Firm . ’ Volume/Value Use
14. Do you have a plant to extract the Cinchona' alkaloids?yes/no....... If yes, name a. the plant ..............
b. capacity ......(tons per year)If not, why not? ......................... •.............
15. How much could it .cost you to establish a/local extractionunit ......-.Ksh. How judged ............................
16. Have you done a Feasibility study? yes/no.............May I have a copy?
17. List the major problems hindering the establishment of a local processing unit:
i.......... ................................ '..........ii....................................................iii....................................................iv............................................

188
18. Suppose the above problems were solved and that there existed sufficient world demand for the Cinchona alkaloids, approximately how much could a localextraction unit produce?, volume ....’. . .kg/ton
value ...... kshs.How judged ........................................
19. Do you know of any firm/firms in Kenya who couldprocess the product? mention if any ..... ...........
20. What is the estimated current consumption of cinchonaalkaloids in Kenya? .................................
21. What is the current estimated world market growth rate for:
i. Cinchona bark ......... %ii. Cinchona alkaloids .....% ,
O*