Embed Size (px)
Citation preview

The Philippine New
Industrial Policy
Rafaelita M. AldabaAssistant Secretary
Industry Development & Trade Policy Group
12 November 2015
1

Outline of Presentation
1. Strategic Industrial Policy for the Philippines
• Opportunities & Challenges
• Manufacturing Industry Roadmap
• Comprehensive National Industry Strategy
2. Implications for Region V
• Industry Cluster Roadmaps: inclusive & sustainable regional growth & development
2

Part 1: Opportunities & ChallengesShort-term Outlook
• PH growth rate: 6.8 (‘12), 7.2% (’13), 6.1% (‘14)
• H1 2015: China 7%, VN 6.6% , PH 5.3%, MAL 3.4%, TH
0.35%, INO 4.7%
• PH impressive growth: Asia’s new economic tiger
• 2015 Forecasts - NEDA: 6-6.5%, WB: 5.8%, ADB: 6%,
OECD: 6.2%, JPMorgan: 5%, Moody’s: 6%
-4.0
-2.0
0.0
2.0
4.0
6.0
8.0
10.0
12.0
14.0
16.0
2000 2001 2002 2003 2004 2005 2006 2007 2008 2009 2010 2011 2012 2013 2014
GDP Growth
PH TH INO VN PRC MAL
3

PH a new growth area
PH Industry growth: 7.3% (‘12); 9.3% (’13, highest),
7.5% (‘14 highest)
-10.0
-5.0
0.0
5.0
10.0
15.0
20.0
2000 2001 2002 2003 2004 2005 2006 2007 2008 2009 2010 2011 2012 2013 2014
in %
Year
Industry Growth: PH vs Selected East & Southeast
Asian Countries
PH
TH
INO
VN
PRC
MAL
4

Manufacturing Resurgence
• Manufacturing resurgence: 5.4% (‘12);
10.3% (‘13); 8.1% (‘14); 5.3% (‘15H1)
-10.0
-5.0
0.0
5.0
10.0
15.0
20.0
Quarterly Growth 2009-2015
AGRI., HUNTING, FORESTRY AND FISHING MANUFACTURING
SERVICE SECTOR GROSS DOMESTIC PRODUCT
5

WHAT MAKES PH DIFFERENT
Market Opportunities
• Growing market & middle class: demographic sweet spot
Labor
• Young, English speaking, highly trainable workforce
• Moderate wage increases
Operating Environment
• Strong macroeconomic fundamentals
• Political stability, business/consumer confidence
Policy Focus
• New Industrial Policy & a more pro-active Government
• IPA rules & regulations, incentives & investor care
Improved competitiveness ranking (WEF)
• Rank #47/140 countries in 2015-16 from rank #52
6

Growth ChallengesArea Major Constraints
Regulation • Complex/costly business procedures
• Policy consistency, transparency, predictability
• 60-40% foreign equity rule
Infrastructure/
Logistics
• High cost of power, domestic shipping
• Lack of ports, airports, road infrastructure
SME • Access to finance, technology, support for start-
ups, standards, marketing, network links
HRD • Lack of skilled workers, limited standards &
certifications
Innovation • Industry-academe linkages, R&D facilities
Supply/value
chain
• Limited linkages in manufacturing, agriculture,
& services, weak parts & components sector
7

Strategic Industrial PolicyGoal: improve competitiveness & productivity
Growth oriented action to upgrade industries
Remove obstacles to growth Investments
Deepen participation in regional production networks
Role of Government: coordination/facilitation
Create proper environment for private sector
development, strengthen industries
Private sector, investment & entrepreneurship:
proximate cause of growth
Cluster-based industrial strategy
Promote clusters for inter-firm cooperation &
agglomeration of activities
Industry agglomeration to build strong & competitive
regional economies
GVC-focused industrial policy 8

MANUFACTURING DRIVER for
STRUCTURAL CHANGE
-automotive, aerospace parts electronics, garments, food, resource-based industries, chemicals, furniture, tool & die, shipbuilding
-move to high tech transport equipment, chemicals, electrical machinery-manufacturing hubs in regional & global production networks for auto, electronics, machinery, garments, food
-high value added activities upstream industries (chemicals, iron & steel), med-tech basic & fabricated metal
Phase I 2014-2017
Phase II 2018-2021
Phase III 2022-2025
VISION: globally competitive with strong linkages within
both domestic & global economies
9

Strategy to make manufacturing an engine of growth
& source of more & better Jobs
30% value added; 15% employment
Horizontal measures
Coordination mechanism
Vertical measures
• Close supply chain gaps
• Expand domestic market & exports
• HRD & skills• SME development• Innovation & green
growth
• Promotion• Power, smuggling,
logistics, infrastructure
• Improve regulation, reduce cost of doing business
• Competitive exchange rate
open trade regime, sustainable macro policies, sound tax policies & administration,efficient bureaucracy, secure property rights, institutions 10

AGRIBUSINESS: CATALYST TO DRIVE
REGIONAL ECONOMIC TRANSFORMATION
Transform & upgrade agriculture from traditional farming
to a globally competitive agribusiness sector
-rubber, coconut, mangoes, coffee, cacao, banana, palm oil; high value crops; supply chain gaps
-deepen participation in GVC -PH as agribusiness regional hub
-strengthen links between agro-processing & production: R&D; strengthen supply chains, upgrade commodity clusters; access to technologies, finance; regulatory & certification system
Phase I 2014-2017
Phase II 2018-2021
Phase III 2022-2025
11

SERVICES: GLUE THAT BINDS ALL
SECTORS TOGETHER
-labor-intensive sectors: tourism, construction, ship repair, MRO-accelerate infrastructure investments -move up ITBPM GVC
- PH as regional hub: training - upgrade services, manufacturing related services to sustain growth & job creation
-education, design, R&D, finance, infrastructure-engineering & services embedded in manufacturing-HRD & skills training, innovation ecosystem linked with manufacturing
Phase I 2014-2017
Phase II 2018-2021
Phase III 2022-2025
Globally competitive services, create quality jobs, move
up the value chain
12

Comprehensive National Industrial
Strategy (CNIS)
• Globally competitive industries, strong domestic & global linkages
• 3 Major Channels: COMPETITION, INNOVATION, PRODUCTIVITY
• Cluster-based industrial strategy to build strong & competitive
regional economies
MANUFACTURING SERVICES
AGRICULTURE FISHING,
FORESTRYMINING
INTERNAL FACTORS: GOVERNMENT POLICIES &PROGRAMS, INSTITUTIONS, INFRASTRUCTURE, MACRO STABILITY, RULE OF LAW,
PEACE & ORDER, POLITICAL CLIMATE
EXTERNAL FACTORS: GLOBALIZATION, REGIONAL/BILATERAL/MULTILATERAL TRADING ARRANGEMENTS, GLOBAL & REGIONAL PRODUCTION NETWORKS
13

Part 2: Regional Development
PlanGRDP STRUCTURE (%) 2010 2011 2012 2013 2014
AGRIC, HUNTING, FORESTRY,
FISHING 25.6 24.4 25.3 24.4 23.7
INDUSTRY 18.9 18.0 19.1 19.5 19.8
Manufacturing 2.7 3.2 3.1 3.2 3.6
SERVICES 56.5 56.6 55.6 56.0 56.6
GRDP growth rate 1.9 7.1 8.1 4.2
Unemployment rate: 6.2%; Underemployment rate: 33.8% (Jul 2015)
14
Vision: a prime mover of trade & industry development,
progressive agro-industrial economy, an investment hub with
globally-competitive and environment-friendly industries
Industry Clustering Strategy: investments, exports, jobs, SME
development
Horizontal Measures: infrastructure & logistics support,
incentives, marketing, financing, R&D

NCR
CAR
ILOCOSCAGAYAN VALLEY
CENTRAL LUZON
CALABARZON
MIMAROPA BICOL
WESTERN VISAYAS
CENTRAL VISAYAS
EASTERN VISAYAS
ZAMBOANGA PENINSULA
NORTHERN MINDANAO
DAVAO REGION
SOCCSKSARGEN
CARAGAARMM
-10.00%
0.00%
10.00%
20.00%
30.00%
40.00%
50.00%
60.00%
70.00%
-5.00% 0.00% 5.00% 10.00% 15.00% 20.00%Average Growth Rate (’12-’14)
Transforming Region V
• Average manufacturing growth rate is 14.31% from 2012-2014 while share of manufacturing to GRDP is 3.63% in 2014
Man
ufa
ctu
rin
g as
% o
f G
RD
P Note:
poverty
incidence
persistently
high

Competitiveness Agenda
• Agriculture development
• Responsible mining
• Manufacturing: food processing, fiber craft, potter, coco-based products, marineproducts, furniture, shell craft, piliconfectionary, minerals
• Tourism
• Industry Cluster Roadmaps: constraints preventing growth,
what kind of incentives are needed, SME inclusion, how to
upgrade clusters, move up value chain
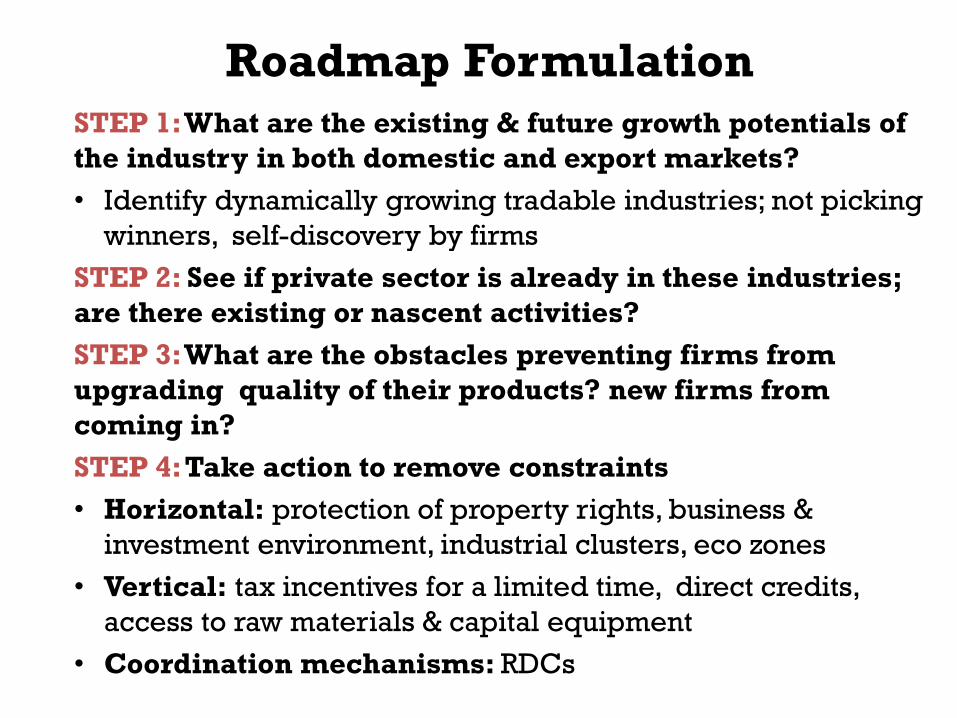
Roadmap Formulation
STEP 1: What are the existing & future growth potentials of
the industry in both domestic and export markets?
• Identify dynamically growing tradable industries; not picking
winners, self-discovery by firms
STEP 2: See if private sector is already in these industries;
are there existing or nascent activities?
STEP 3:What are the obstacles preventing firms from
upgrading quality of their products? new firms from
coming in?
STEP 4:Take action to remove constraints
• Horizontal: protection of property rights, business &
investment environment, industrial clusters, eco zones
• Vertical: tax incentives for a limited time, direct credits,
access to raw materials & capital equipment
• Coordination mechanisms: RDCs

Region XI: Priority Industry Clusters• 17 Industry
clusters: 13 agri
• abaca, banana, bangus, cacao, coconut, durian, mango, ICT, seaweeds, mining, renewable energy, tourism, livestock & poultry, oil palm, wood, rubber, rice
• State of industry, opportunities, constraints, value chain mapping

Most Binding Constraints to UpgradingGrowing Processing
Cacao Lack of postharvest facilities, quality
planting materials, supply gap, of
FMR, limited GAP
Lack of supply of beans &
cacao preparations, weak
linkage (bean & grinding)
Coconut Limited access to quality planting
material, high input costs, old
technologies in harvesting
Low productivity, lack of
technology in processing
Durian High input cost, inadequate post
harvest, poor harvesting, packaging
technology, handling; diseases
High cost of investment in
processing equipment
Mango Limited access to planting
materials, limited number of
nursery operators, high cost of
inputs, absence of post harvest
facilities, poor implementation GAP
Insufficient supply of
mangoes, VHT facility
underutilized, lack of research
on high value added
processed products
Seaweed High cost of inputs, lack of post
harvest facilities at the farmers’
level, absence of testing labs,
presence of diseases
Insufficient supply of dried
seaweeds

For more information, visit our website
industry.gov.ph
Thank You!
Through a new industrial policy, we can make
our industries competitive and create an
environment conducive to private sector
development.
With industry roadmaps’ clear vision to
transform economy, Region V will be in a better
position to attract more investments, create
more & better jobs, & reduce poverty.
20