Embed Size (px)
Citation preview
The Phonon Entropy of Metals and Alloys: The
effects of thermal and chemical disorder
Thesis by
Peter David Bogdanoff
In Partial Fulfillment of the Requirements
for the Degree of
Doctor of Philosophy
California Institute of Technology
Pasadena, California
2001
(Submitted November 30, 2001)

@ 2001
Peter David Bogdanoff
All Rights Reserved
Acknowledgements
I would like to thank my advisor, Brent Fultz, for his encouragement, support and
outstanding research group. I count myself fortunate beyond words for having Brent
as a research advisor and intellectual collaborator these many years. I also owe an
enduring debt to those in whose resea,rch footsteps I followed: Lawrence Anthony,
Laura Nagel and Heather Frase being chief among these at Caltech.
My research would not have been possible without the help and wisdom of our
many collaborators at Argonne and Oak Ridge national labs: Stefan Rosenkranz,
Ray Osborn and Lee Robertson. In addition, I owe much to the many people at
Caltech who helped with experiments over the years: Channing Ahn, Tab Stephens,
Carol Garland, Chuck Witham, Stephen Glade, Adrian Hightower, Andy Waniuk and
many others who I have undoubtedly forgotten. Many thanks to my colleague Mike
Manley, who contributed much to my underst anding of vibrational entropy.
My thanks and best wishes to Alexander Papandrew, Olivier Delaire and Tabitha
Swan-Wood for showing an interest in phonons and for many interesting discussions
this past year. Good luck!
I would like to thank my long time friend and co-conspirator Adrian Hightower,
as well as Stephen Glade, Ben Shapiro, Jason Graetz and others for keeping me
sane and productive over the years. Many thanks to Heather Frase for introducing
me to swing dancing. To my Harvey Mudd friends: Daniel "Hole" Hyman, Adam
"Lithuanian High Command7' Rakunas, John "Trager" Trager, Paul "Leo" Parker,
Ben Melhuish and many others who I best not identify by name.
To my friend Jeffrey Drummond I offer my heartfelt appreciation and gratitude
for his support over the years. I am in your debt.
Lastly, a real special thanks to neutrons 27,890-94,051. These guys did all the
real work.
Abstract
Vibrational entropy is important for the thermodynamics of alloying, alloy formation,
phase transitions and pha-se stability at high temperature. Vibrational entropies of
alloying and alloy formation were calculated for 32 binary alloys and intermetallic
compounds using phonon DOS curves taken from the literature. The vibrational
entropies of formation span a wide range from -0.64 to $0.55 k ~ / a t o m , and the
vibrational entropies of alloying ranged from -0.39 to $1.0 ks/atom. This range ex-
ceeds the range of configurational entropy of a binary alloy, which reaches a maximum
value of $0.69 kB/atom and a minimum value of 0 kB/atom.
The vibrational entropy of the NiTi rnartensitic transition was measured using low-
temperature calorimetry and inelastic neutron-scattering. The high-temperature B2
phase of NiTi has a vibrational entropy 0.5 kB/atom larger than the low-temperature
martensitic phase. The difference in vibrational entropy accounts for the total entropy
of the austenitic-martensitic phase transition.
Inelastic neutron scattering was used to show that the phonon DOS of V is un-
changed between 20 and 1000 " C, inconsistent with the phonon softening expected
from thermal expansion. It is found that the effects of volume expansion and rising
temperature exert equal and opposite shifts on the phonon DOS. The pure temper-
ature dependence of the phonon DOS is due to strong phonon-phonon scattering,
which in turn leads to a large anharmonic vibrational entropy contribution at high
temperature.
The vibrational entropy of eight chemically disordered Cu-Au alloys was measured
using inelastic neutron scattering. The analysis of the phonon entropy of a disordered
alloy was performed in a novel way by modeling the partial vibrational entropies of
Cu and Au. The partial vibrational entropies of Cu and Au were shown to be slowly
varying and smooth functions of composition. The vibrational entropy of disordering
in CuSAu is calculated as 0.24 & 0.02 kB/atom, substantially larger than results

v
predicted from recent theoretical work.
Contents
... Acknowledgements 111
Abstract iv
1 Introduction 1
1.1 Overview . . . . . . . . . . . . . . . . . . . . . . . . . . . . . . . . . . 1
. . . . . . . . . . . . . . . . . . . . . . . . . . 1.2 Experimental Met hods 5
1.2.1 Calorimetry . . . . . . . . . . . . . . . . . . . . . . . . . . . . 5
. . . . . . . . . . . . . . . . . . . 1.2.2 Inelastic Neutron Scattering 5
1.3 Anharmonic Entropy . . . . . . . . . . . . . . . . . . . . . . . . . . . 8
. . . . . . . . . . . . . . . . . . . . . 1.4 Chemically Disordered Materials 9
1.5 Summary . . . . . . . . . . . . . . . . . . . . . . . . . . . . . . . . . 11
2 Experimental Trends in Vibrational Entropy 12
2.1 Introduction . . . . . . . . . . . . . . . . . . . . . . . . . . . . . . . . 12
2.2 Methods and Results . . . . . . . . . . . . . . . . . . . . . . . . . . . 14
2.3 Correlations . . . . . . . . . . . . . . . . . . . . . . . . . . . . . . . . 16
2.3.1 Vibrational Entropy of Formation . . . . . . . . . . . . . . . . 16
2.3.2 Vibrational Entropy of Alloying . . . . . . . . . . . . . . . . . 21
2.4 Summary . . . . . . . . . . . . . . . . . . . . . . . . . . . . . . . . . 29
3 The Role of Phonons in the Thermodynamics of the NiTi Marten-
sitic Transformation 30
3.1 Introduction . . . . . . . . . . . . . . . . . . . . . . . . . . . . . . . . 30
3.2 Experimental Methods . . . . . . . . . . . . . . . . . . . . . . . . . . 31
3.3 Results . . . . . . . . . . . . . . . . . . . . . . . . . . . . . . . . . . . 35
3.3.1 Calorimetry . . . . . . . . . . . . . . . . . . . . . . . . . . . . 35
. . . . . . . . . . . . . . . . . . . . . . . . 3.3.2 Thermal Expansion
. . . . . . . . . . . . . . . . . . . . . . . . 3.3.3 Neutron Scattering
. . . . . . . . . . . . . . . . . . . . . . . . . . . . . . . . . 3.4 Discussion
. . . . . . . . . . . . . . . . . . . . . . . 3.4.1 Vibrational Entropy
. . . . . . . . . . . . . . . . 3.4.2 Premartensitic Phonon Softening
. . . . . . . . . . . . . 3.4.3 Soft Acoustic Phonons in B2 Austenite
. . . . . . . . . . . . . . . . . . . . . . . . . . . . . . . . 3.5 Conclusions
4 The Temperature Dependence of the Phonon Entropy of Vanadium
. . . . . . . . . . . . . . . . . . . . . . . . . . . . . . . . 4.1 Introduction
. . . . . . . . . . . . . . . . . . . . . . . . . . . . . . . 4.2 Experimental
. . . . . . . . . . . . . . . . . . . . . . . . . . . 4.3 Analysis and Results
. . . . . . . . . . . . . . . . . . . . 4.3.1 Phonon Density of States
. . . . . . . . . . . . . . . . . . . . . . . 4.3.2 Vibrational Entropy
. . . . . . . . . . . . . . . . . . . . . . . . 4.3.3 Phonon Broadening
. . . . . . . . . . . . . . . . . . . . . . . . . . . . . . . . . 4.4 Discussion
. . . . . . . . . . . . . . . . . . . . . . . 4.4.1 Phonon DOS Curves
. . . . . . . . . . . . . . . . . . . . . . . 4.4.2 Anharmonic Entropy
. . . . . . . . . 4.4.3 Chromium, Niobium, Titanium and Zirconium
. . . . . . . . . . . . . . . . . . . . . . . . . . . . . . . . 4.5 Conclusions
. . . . . . . . . . . . . . . . . . . . . . . . . . . . 4.6 Acknowledgements
5 The Vibrational Entropy of Alloying and Ordering in Cu-Au
. . . . . . . . . . . . . . . . . . . . . . . . . . . . . . . . 5.1 Introduction
5.1.1 Alloying in Cu-Au . . . . . . . . . . . . . . . . . . . . . . . .
. . . . . . . . . . . . . . . . . . . . . . . . 5.1.2 Ordering in Cu3Au
5.2 Experimental Methods . . . . . . . . . . . . . . . . . . . . . . . . . .
. . . . . . . . . . . . . . . . . . . . . 5.2.1 Disordered Cu- Au Alloys
5.2.2 Ordered Cu3Au . . . . . . . . . . . . . . . . . . . . . . . . . .
5.3 Analysis and Results . . . . . . . . . . . . . . . . . . . . . . . . . . .
. . . . . . . . . . . . . . . . . . . . 5.3.1 Phonon Density of States
. . . . . . . . . . . . . 5.3.2 Neutron-Weighted Vibrational Entropy
. . . . . . . 5.3.3 Neutron-Weight Corrections for Disordered Alloys
5.3.4 Vibrational Entropy of Ordering of Lla CusAu . . . . . . . . .
. . . . . . . . . . . . . . . . . . . . . . . . . . . . . . . . . 5.4 Discussion
5.4.1 Phonon DOS . . . . . . . . . . . . . . . . . . . . . . . . . . .
. . . . . . . . . . . . . 5.4.2 Generalized Partial Entropy Modeling
. . . . . . . . . . . . . . . . . . 5.4.3 Local Cluster Approximation
5.4.4 Vibrational Entropy of Ordering of Cu3Au . . . . . . . . . . .
. . . . . . . . . . . . . . . . . . . . . . . . . . . . . . . . 5.5 Conclusions
6 Conclusions
. . . . . . . . . . . . . . . . . . . . . . . . . . . 6.1 Science and Methods
. . . . . . . . . . . . . . . . . . . . . . . . . . . . . 6.1.1 Method 1
. . . . . . . . . . . . . . . . . . . . . . . . . . . . . 6.1.2 Method 2
. . . . . . . . . . . . . . . . . . . . . . . . . . . . . 6.1.3 Method3
. . . . . . . . . . . . . . . . . . . . . . . . . . . . . . . . 6.2 Future Work
6.2.1 Temperature Dependence of the Phonon DOS . . . . . . . . .
6.2.2 Vibrational Entropy of Alloying in the Dilute Limit . . . . . .
6.2.3 Fitting Lattice Dynamics to the Phonon DOS . . . . . . . . .
A Neutron Scattering Analysis from TOF Instruments
. . . . . . . . . . . . . . . . . . . . . . . . . . . . A.l TOF Spectrometer
. . . . . . . . . . . . . . . . . . . . . . . . . . . . . . . A.2 Data Analysis
. . . . . . . . . . . . . . . . . . . . . . . . . . A.3 Background Correction
. . . . . . . . . . . . . . . . . A.4 Thermal and Multiphonon Corrections
. . . . . . . . . . . . . . . . . . . . . . . A.5 Neutron-Weight Corrections
B Local Cluster Approximation
Bibliography 117
List of Figures
. . . . . . . . . . . . . . . . . 1.1 Phase diagram of the Co-V alloy system
. . . . . . . . . 2.1 Measured versus Debye value for selected alloys
2.2 Measured AS2bm versus difference in metallic radii of solute and solvent
atoms . . . . . . . . . . . . . . . . . . . . . . . . . . . . . . . . . . . .
2.3 Measured AS, lp versus atomic mass difference for L12 alloys . . . . .
2.4 Measured AS:? versus prediction from volume and mass effects for
. . . . . . . . . . . . . . . . . . . . . . . . . . . . . . . selected alloys
2.5 Measured AS:;? versos Debye value for selected Llz alloys . . . . . .
2.6 Measured AS~::Y versus volume change upon alloying for L12 alloys . .
3.1 Latent heat of martensite-austenitephase transitionin NiTi . . . . . .
3.2 The low-temperature heat capacity of martensitic NiTi . . . . . . . . .
3.3 Thermal expansion of NiTi plate in three orthogonal directions . . . .
3.4 Neutron scattering data and multiphonon contribution for NiTi . . . .
3.5 Neutron de-weighting function F(E) for NiTi . . . . . . . . . . . . . .
3.6 Phonon DOS of martensitic and austenitic NiTi . . . . . . . . . . . . .
4.1 Phonon DOS of V at 293. 873. 1273 and 1673K . . . . . . . . . . . . .
. . . . . . 4.2 Anharmonic entropy contributions to V at high temperature
4.3 Effect of convolving 293 K V DOS with damped harmonic oscillator of
. . . . . . . . . . . . . . . . . . . . . . . . . . . . . . . . . . variable Q
4.4 Best-fit inverse & versus temperature . . . . . . . . . . . . . . . . . . .
4.5 Phonon DOS of vanadium at 293 K compared with results of Sears, et
a1.[1]. . . . . . . . . . . . . . . . . . . . . . . . . . . . . . . . . . . .
4.6 Anharmonic entropy of elemental chromium, niobium, titanium and
. . . . . . . . . . . . . . . . . . . . . . . . . . . . . . . . . . zirconium
4.7 Phonon DOS of bcc zirconium. niobium and chromium at high tem-
. . . . . . . . . . . . . . . . . . . . . . . . . . . . . . . . . . . perature 59
5.1 X-ray diffraction patterns of disordered C U ~ ~ A ~ ~ ~ . . . . . . . . . . . .
. . . . . . 5.2 X-ray diffraction patterns of ordered and disordered Cu3Au
5.3 Neutron-weighted phonon DOS of disordered CuxAul-, alloys . . . . .
5.4 Neutron-weighted vibrational entropies of disordered Cu-ilu alloys at
300K . . . . . . . . . . . . . . . . . . . . . . . . . . . . . . . . . . . .
5.5 Phonon DOS of elemental Cu and Au at 300 K . . . . . . . . . . . . .
5.6 Neutron-weight corrected vibrational entropies of disordered Cu-Au
. . . . . . . . . . . . . . . . . . . . . . . . . . . . . . . alloys at 300 K
5.7 Partial vibrational entropies of Cu and Au in Cu-Au alloys . . . . . . .
5.8 Phonon DOS of 3 and 10% Cu-Au alloys using Green function analyt-
. . . . . . . . . . . . . . . . . . . . . . . . . . . . . . . . . . ical theory
5.9 Partial phonon DOS of Au in Cug6AuO4 alloy using resonance peak
approximation . . . . . . . . . . . . . . . . . . . . . . . . . . . . . . .
5.10 Phonon DOS of ordered and disordered Cu3Au . . . . . . . . . . . . .
5.11 Vibrational entropy of formation of disordered Cu-Au alloys . . . . . .
5.12 Phonon DOS of disordered CusAu derived from phonon dispersions . .
. . . . . . . A.l Schematic diagram of time-of-flight neutron spectrometer 101
. . . . . . . . . . . . . . . . . . . . . . A.2 k, k; and kf neutron wavectors 102
A.3 Q as a function of angle-bank and energy gain for a TOF spectrometer . 104
A.4 Scattering surface, S(Q,E). for the third angle-bank of an FeAl sample
containing 2% vacancies . . . . . . . . . . . . . . . . . . . . . . . . . . 105
A.5 Neutron data (background corrected) from the twelfth and fourth an-
glebanks of the LRMECS TOF spectrometer . . . . . . . . . . . . . . 106
A.6 Neutron data analysis flowchart . . . . . . . . . . . . . . . . . . . . . . 107
A.7 S(E), 2-5 phonon and 1-5 phonon fits to neutron scattering spectra of
angle bank of an FeAl sample containing 2% vacancies . . . . . . 112
List of Tables
1.1 Thermal neutron scattering cross-section of 3d-transition metals . . . . 7
2.1 Vibrational entropies of alloying and formation for 32 binary alloys and
. . . . . . . . . . . . . . . . . . . . . . . . . . . . . . . . . compounds 17
. . . . . . . . . . . . . . . . . . . 2.2 Correlations with entropy of alloying 28
3.1 Enthalpy and entropy of martensite transformation in NiTi . . . . . . 35
3.2 Best fit Born-von KArmin force constants to NiTi neutron-weighted
. . . . . . . . . . . . . . . . . . . . . . . . . . . . . . . . phononDOS 40
5.1 LCA cluster coeffecients for the vibrational entropy of formation of
. . . . . . . . . . . . . . . . . . . . . . . . . . . . . . . . . . . . Cu-Au 88
. . . . . . . . . . . . . . . . . . . . . . . 5.2 Disordering entropy of Cu3Au 91
Chapter 1 Introduction
1.1 Overview
The measurement and prediction of thermodynamic equilibrium in the solid state is
one of the enduring scientific goals of materials science and condensed matter physics.
Measuring thermodynamic equilibrium is the everyday work done in characterising
new materials: atomic positions and crystal structure are determined by diffraction,
microstructural features through electron miscroscopy. Predicting thermodynamic
equilibrium has historically been the work of theory and theorists; the minimization
of the free energy function with respect to atomic position is the ultimate goal. Much
progress has been made towards this goal in the last few decades; the advent of fast,
cheap computation has been crucial in this regard. The free energy function has two
discrete terms: energy and entropy. The free energy function, F, can be calculated
with
where E is the internal energy, T is the temperature and S is the entropy.
The energy term can now be calculated, in the ground state at zero temperature,
for near arbitrary atomic positions. The entropy terms, however, are less well char-
acterised. There are many different possible sources of entropy in a solid: electronic,
magnetic, configurational and vibrational:
More esoteric sources exist, but the ones listed are typically the important ones in
metals. Of the four, the electronic and configurational entropies are well understood
and accessible through calculation. The magnetic entropy is of importance only in
2
the handful of materials that exhibit magnetic order. The vibrational entropy is
ubiquitous, very difficult to predict computationally and also quite hard to measure
experiment ally. Ironically, the vibrational entropy comprises most of the entropy of
a solid, yet historically is the least well understood.
Some progress has been made in our understanding of the vibrational entropy of
materials. Grimvall and J. Roskn have shown that calorimetric entropy differences
between T i c , ZrC and HfC are explained entirely by the mass differences of the
constituent metals [2]. Langeveld and Niemantsverdriet showed that segregation of
P t to the surface of a bulk Pt-Rh alloy was accounted for by the large vibrational
entropy difference between bulk and surface P t [3]. Clark and Ackland calculated the
effect of vacancies and interstitial atoms on the vibrational entropy of silicon [4].
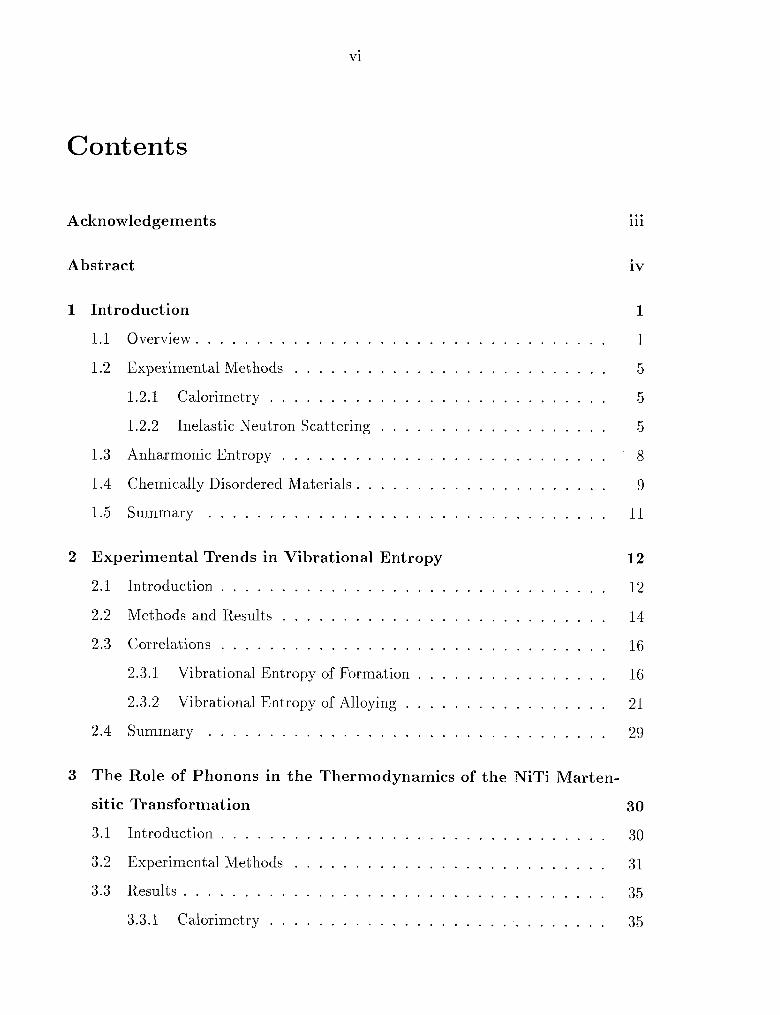
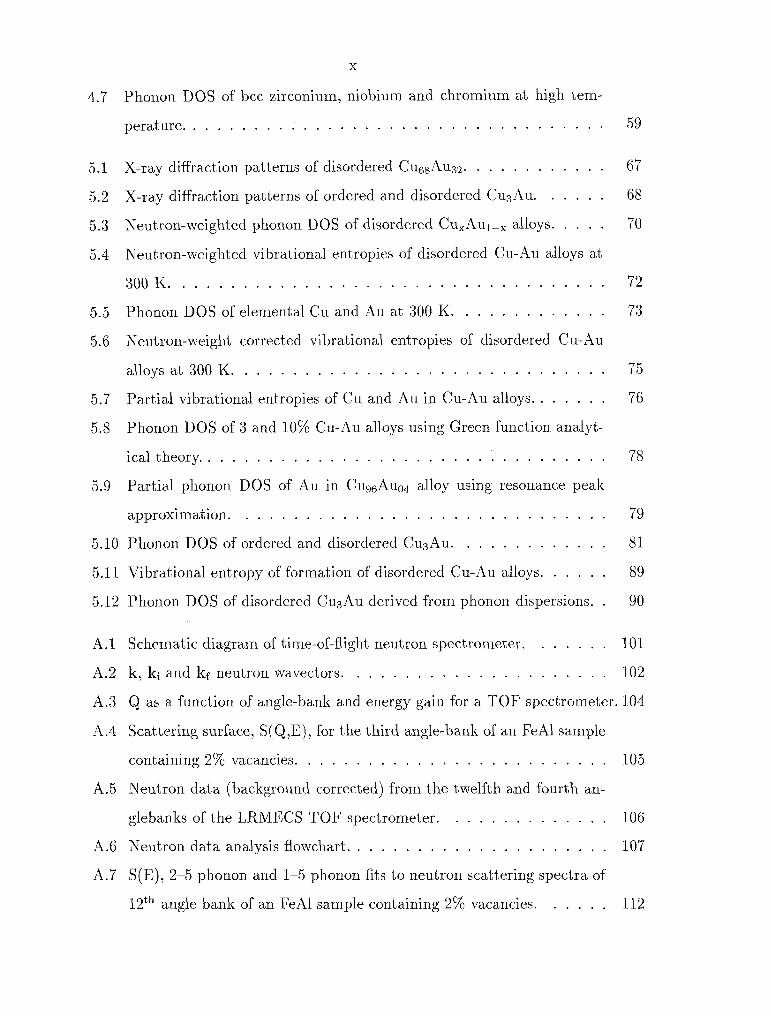
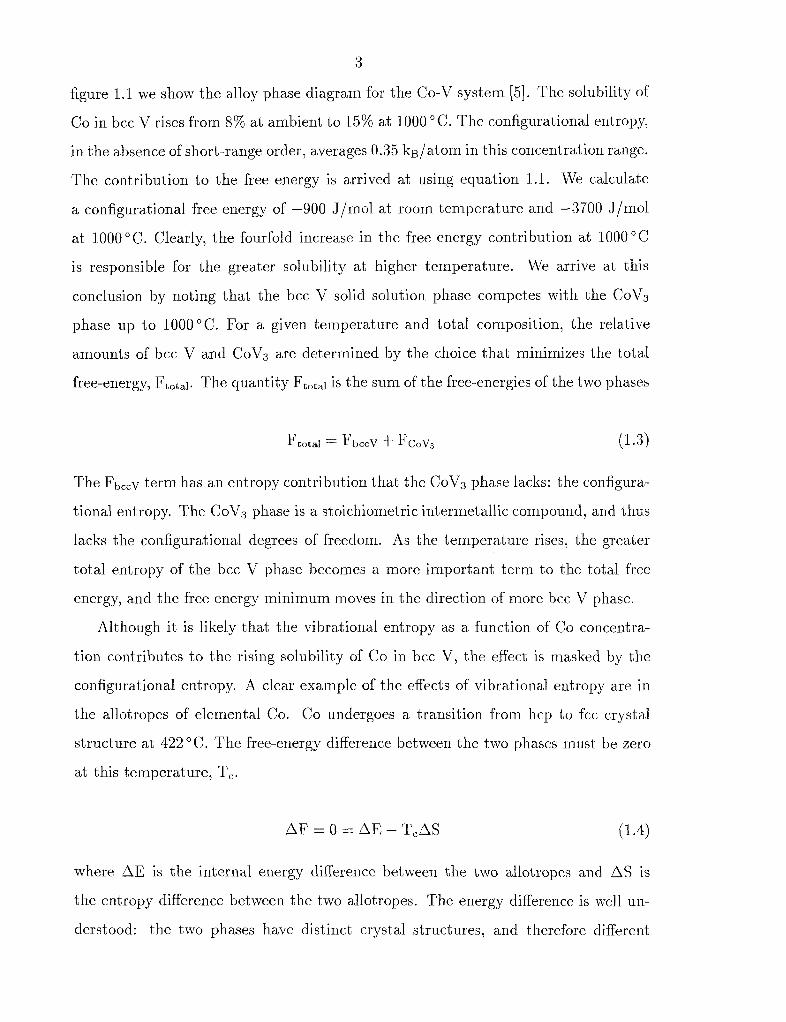
Co Atomic Percent Y
Figure 1.1: Phase diagram of the Co-V alloy system.
The entropy is of special interest in the calculation of alloy phase diagrams. In
3
figure 1.1 we show the alloy phase diagram for the Co-V system [5]. The solubility of
Co in bcc V rises from 8% at ambient to 15% at 1000 " C. The configurational entropy,
in the absence of short-range order, averages 0.35 ks/atom in this concentration range.
The contribution to the free energy is arrived at using equation 1.1. We calculate
a configurational free energy of -900 J/mol at room temperature and -3700 J/mol
at 1000 "C. Clearly, the fourfold increase in the free energy contribution at 1000 "C
is responsible for the greater solubility at higher temperature. We arrive at this
conclusion by noting that the bcc V solid solution phase competes with the CoV3
phase up to 1000°C. For a given temperature and total composition, the relative
amounts of bcc V and CoV3 are determined by the choice that minimizes the total
free-energy, Ftotal. The quantity FtOtal is the sum of the free-energies of the two phases
The FbccV term has an entropy contribution that the CoV3 phase lacks: the configura-
tional entropy. The CoV3 phase is a stoichiometric intermetallic compound, and thus
lacks the configurational degrees of freedom. As the temperature rises, the greater
total entropy of the bcc V phase becomes a more important term to the total free
energy, and the free energy minimum moves in the direction of more bcc V phase.
Although it is likely that the vibrational entropy as a function of Co concentra-
tion contributes to the rising solubility of Co in bcc V, the effect is masked by the
configurational entropy. A clear example of the effects of vibrational entropy are in
the allotropes of elemental Co. Co undergoes a transition from hcp to fcc crystal
structure at 422°C. The free-energy difference between the two phases must be zero
at this temperature, T,.
where AE is the internal energy difference between the two allotropes and AS is
the entropy difference between the two allotropes. The energy difference is well un-
derstood: the two phases have distinct crystal structures, and therefore different
4
electronic band structures and total electronic energies. The source of the entropy
difference can be arrived at by elimination. Elemental crystalline solids have no con-
figurational entropy, and the magnetic entropy difference is zero since both phases
are ferromagnetic. Electronic entropies of transition metals are small at moderate
temperatures, typically 1 to 10% of the size of the vibrational entropies. Thus, we ex-
pect the electronic entropy difference between the two phases to be small and unable
to account for all the entropy of the ~ h a s e transition. The only possible remaining
source of the entropy difference between the phases is vibrational.
The entropy of solid state allotropic phase transitions has attracted much recent
interest. Inelastic neutron scattering and calorimetric measurements on Ce showed
that the allotropic /'3 - y phase transition has a vibrational entropy contribution that
accounts for 65% of the total entropy difference 161. In chapter 3 we show that vibra-
tional entropy accounts for the entire entropy of the ambient martensite transition in
NiTi, to within experimental error. At higher temperatures, the electronic entropy
can equal the vibrational contribution. Electronic band-structure calculations show
that the electronic entropy accounts for 63% and 40% of the hcp-bcc phase transitions
in Ti and Zr, respectively [7] . More recent calculations by Moroni, Grimvall and Jarl-
borg [8] claim the electronic entropy accounts for over 90% of the transition entropy
in both these cases. However, the same work show that the high temperature hcp-bcc
phase transitions in Sc and Y have electronic entropy differences that accounts for
only 32% and 50% of the total entropy, respectively. In the high temperature y - 6
transition in Ce, recent measurements [6] show that the vibrational entropy differ-
ence is almost twice as large as the total transition entropy. The electronic entropy
difference must be half as large and with the opposite sign in order to account for the
measured total entropy.
Allotropic phase changes are an example of first-order phase transitions. First
order phase transitions follow the relationship between energy differences, entropy
differences and transition temperature shown in equation 1.4. Given a fixed energy
difference, the exact value for AS is said to determine the transition temperature, T,.
Including the vibrational entropy in phase diagram calculations should lead to better
5
agreement with experiment and measured transition temperatures. The effect of
lattice vibrations improved the agreement between predicted and experimental values
of the solubility of Sc in A1 [9]. On the other hand, agreement between predicted and
experimental values of the order-disorder transition temperatures in Cu-Au alloys
worsen when vibrational effects are included [lo]. In this case, the lack of agreement
with experiment is indicative of our continuing poor methodology for calculating the
energies and entropies of the chemically disordered solid.
1.2 Experimental Methods
1.2.1 Calorimetry
Calorimetric data are indispensable in any thermodynamic study. Heat capacity
measurements and their corresponding entropies are regarded as the most reliable
direct measurements of thermodynamic quantities. However, there exists no way to
separate the differing contributions to the heat capacity from all the internal degrees
of freedom. Thus, although one can measure the calorimetric entropy of a solid very
accurately, one cannot separate the vibrational entropy from the electronic, magnetic
and ordering contributions. Vibrational entropies derived from calorimetric studies
suffer from both the uncertainty of the measurement and the difficulty in ascertaining
other contributions to the entropy. In many cases, the latter overwhelm the former.
Calorimetric data is a useful piece of the entropic puzzle, but it fails to give the entire
picture.
1.2.2 Inelastic Neutron Scattering
Inelastic neutron scattering provides us with the most direct measurement of the lat-
tice entropy of a solid. Knowledge of the lattice-d~namical excitations of a crystalline
solid together with the use of statical mechanics is sufficient to derive the vibrational
entropy. The use of neutron scattering allows us to isolate the lattice contribution
specifically. However, the accuracy of the derived entropy depends greatly on how
6
accurately one can measure the vibrational excitations of the solid. In turn, these de-
pend on how well the sample scatters neutrons and the type of neutron spectrometer
used. These factors are given further consideration below.
Incoherent and Coherent Scattering
Neutrons can scatter from a solid coherently or incoherently. The former preserves
phase between the initial and scattered neutron waves; the latter does not. An im-
portant consequence of this distinction is that Bragg peaks are observed only from
coherently scattered neutrons. Coherent inelastic scattering occurs when the change
in neutron wavevector equals the wavevector of the dynamic excitation in the Sam-
ple: magnetic, vibrational or otherwise. Incoherent inelastic scattering, on the other
hand, has no such conservation. The vibrational entropy can be calculated from
measurements of either the incoherent or coherently scattered neutron cross-section.
The former is most easily performed using a triple-axis neutron spectrometer and
involves no approximations in the data analysis. This technique is unfeasible when
the sample exhibits significant coherent scattering. The latter demands the use of a
time-of-flight (TOF) neutron spectrometer and involves a number of approximations
in the data analysis. As a side note, these approximations can be eliminated by us-
ing a lattice dynamics model to interpret the raw data. However, current generation
TOF instruments lack the neutron flux and spectrometer resolution to make this a
feasible option. The TOF spectrometer method is also appropriate for samples that
have significant incoherent scattering.
In theory, every element exhibits some coherent and some incoherent scattering.
Practically, most elements, in their naturally found isotopic proportions, exhibit a
signicant amount of coherent scattering (see Table 1.1). Therefore, with the exception
of a handful of elements and almost no alloys, most materials require time on a TOF
neutron spectrometer for measurements of the vibrational entropy. Chapters 3 and 5
both contain measurements done on a TOF neutron spectrometer. Chapter 4 contains
measurements on elemental vanadium done on a triple-axis spectrometer.
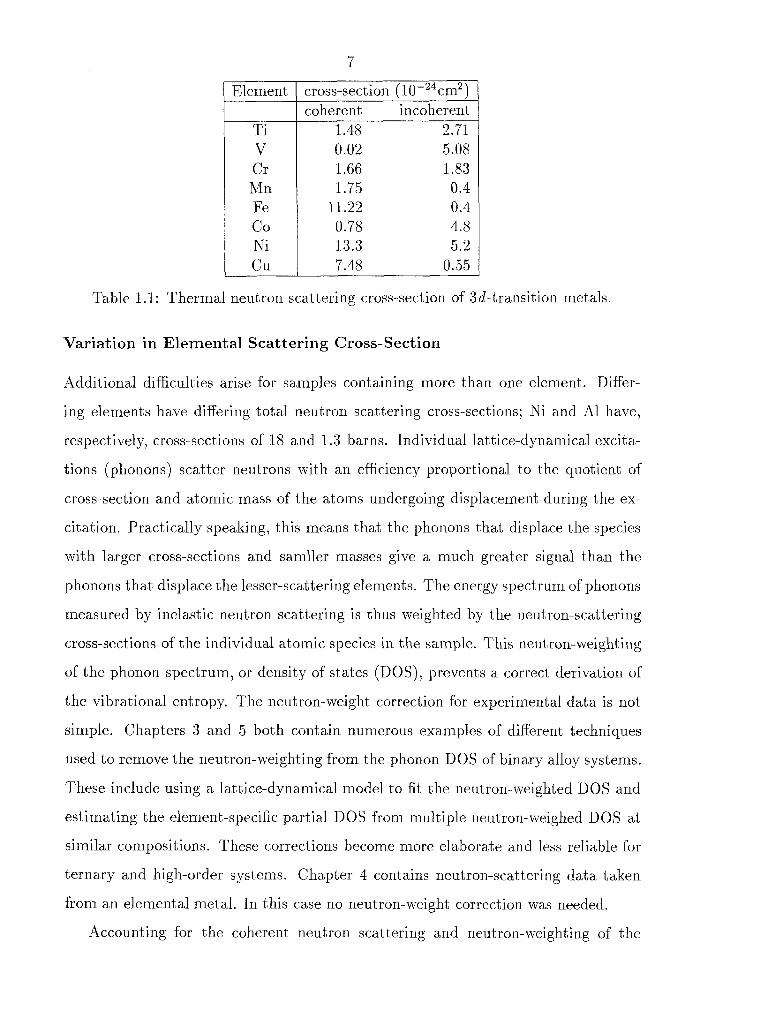
Table 1.1: Thermal neutron scattering cross-section of 3d-transition metals.
Element
Ti V C r Mn Fe Co Ni Cu
Variation in Elemental Scattering Cross-Section
cross-section (10-24~m2) coherent incoherent
1.48 2.71 0.02 5.08 1.66 1.83 1.75 0.4
11.22 0.4 0.78 4.8 13.3 5.2 7.48 0.55
Additional difficulties arise for samples containing more than one element. Differ-
ing elements have differing total neutron scattering cross-sections; Ni and Al have,
respectively, cross-sections of 18 and 1.3 barns. Individual lattice-dynamical excita-
tions (phonons) scatter neutrons with an efficiency proportional to the quotient of
cross-section and atomic mass of the atoms undergoing displacement during the ex-
citation. Practically speaking, this means that the phonons that displace the species
with larger cross-sections and samller masses give a much greater signal than the
phonons that displace the lesser-scattering elements. The energy spectrum of phonons
measured by inelastic neutron scattering is thus weighted by the neutron-scattering
cross-sections of the individual atomic species in the sample. This neutron-weighting
of the phonon spectrum, or density of states (DOS), prevents a correct derivation of
the vibrational entropy. The neutron-weight correction for experiment a1 data is not
simple. Chapters 3 and 5 both contain numerous examples of different techniques
used to remove the neutron-weighting from the phonon DOS of binary alloy systems.
These include using a lattice-dynamical model to fit the neutron-weighted DOS and
estimating the element-specific partial DOS from multiple neutron-weighed DOS at
similar compositions. These corrections become more elaborate and less reliable for
ternary and high-order systems. Chapter 4 contains neutron-scattering data taken
from an elemental metal. In this case no neutron-weight correction was needed.
Accounting for the coherent neutron scattering and neutron-weighting of the

8
phonons is the largest obstacle in any attempt t o measure the phonon DOS directly
with inelastic neutron scattering. Historically, these obstacles were considered so
unmanageable that very few systematic atternpts to measure the phonon DOS in
coherently scattering multi-atomic systems were made. In part, this thesis deals di-
rectly with how to overcome these obstacles, showing in chapters 3 and 5 a consistent
methodology for extracting and correcting the neutron-weighted DOS from coherently
scattering alloys.
1.3 Anharmonic Entropy
Lattice vibrations are primarily quantum mechanical phenomena at low temperature
and classical phenomena at high temperature. The classical nature of phonons at
finite temperature is responsible for the existence of a quantity known as anharmonic
entropy. Simply put, anharmonic entropy is the entropy due to deviations from
harmonicity of the interatomic forces. The cubic and quartic terms in the interatomic
forces are responsible for the existence of thermal expansion; the anharmonic entropy
has often been loosely defined as the excess vibrational entropy associated with the
thermal expansion of the solid. This definition is strictly incorrect because the thermal
expansion of the solid accounts for both a volume and a temperature effect on the
phonon energies. Furthermore, changes in the electronic entropy with specific volume
can also drive thermal expansion. It can be shown that the anharmonic entropy is
identified solely with the temperature effect on the phonon energies, to first order.
The relationship between phonon energies and anharmonic interatomic forces is
straightforward. Theory tells us that the anharmonic nature of the interatomic forces
leads to phonon-phonon scattering [Ill. In turn, phonon-phonon scattering leads to
shifts in the energies of individual phonon modes. Lastly, phonon-phonon scattering
is strongly temperature dependent; at low temperatures few phonons are present so
little phonon-phonon scattering occurs, while at high temperatures phonon-phonon
scattering is commonplace. This quantum-mechanical viewpoint has a direct clas-
sical counterpart; at low temperatures atomic displacements due to vibrations are
9
low and thus the atoms mostly see harmonic interatomic forces. At high tempera-
tures vibrational displacements are large and atoms see large anharmonic interatomic
forces.
By using phonon energies modified by phonon-phonon scattering to calculate the
vibrational entropy we can account for the anharmonic contribution. This method is
exact to first order in the vibrational entropy Ell]. If the anharmonic effects are large
and the phonon energy shifts are large, it is unclear how well this method accounts for
the anharmonic entropy. Thus, at very high temperatures it is unclear whether using
the temperature dependent phonon DOS with the standard formula is sufficient to
capture the entire anharmonic contribution to the vibrational entropy. In chapter 4 it
is shown that for V the temperature dependent phonon DOS captures the anharmonic
contribution to at least 1400 O C.
1.4 Chemically Disordered Materials
The measurement of phonons and phonon entropy in chemically disordered materials
continues to be of interest. This interest results from the theoretical and computa-
tional difficulties in treating chemically and topologicaly disordered materials. In the
absence of adequate theory, experiments assume enormous importance. The difficulty
with chemically disordered materials is twofold: lack of translational periodicity and
local relaxations. The first removes the wave-vector as a good quantum number for
both electronic and vibrational quantum states. Modern ab-initio electronic struc-
ture computations require a cryst a1 with a translationally-periodic unit cell. In its
absence, these computations become unmanageable. Furthermore, the effect of lo-
cal relaxations compounds the computational difficulties. In a chemically-disordered
material, the atomic nuclei deviate from the lattice sites measured by diffraction.
These atomic relaxations away from the average lattice sites are a function of the
local chemical environment, which is heterogeneous in the presence of chemical dis-
order. An accurate treatment of local relaxations requires each atom to be moved
until the net forces on it are zero. Ideally, the entire crystal would have to be relaxed
simultaneously in order to account for the long range of the forces in metals. This
methodology is not possible using the most accurate ab-inito calculation codes, which
requires days or weeks to calculate the energy of one crystal configuration.
Two theoretical approaches have shown some success in dealing with chemical
disorder. The cluster variation method (CVM), refined by Zunger and others [lo] ,
was first formulated to calculate the configurational entropy in the presence of short
range order [12, 131. Using this method, the vibrational entropy of a chemically
disordered material can be calculated by computing the entropy of a large number of
chemically ordered materials. The chemically disordered alloy is then approximated
by a suitable average over the ordered materials, taking into account short-range
chemical correlations t o arbitrary distances. Our measurements of disorderd Cu-Au
alloys in chapter 5 show good agreement with this method. The drawback of this
method is that the phonon DOS of the disordered material is never computed, only
the vibrational entropy and free energy.
The second approach uses special quasi-random structures (SQS) to approximate
the disordered material [14]. Using this method, an artificial unit cell (SQS) is
constructed that has the property that the resultant crystal has some of the same
short-range chemical correlations of the disordered material. The SQS crystal has
long-range translation periodicity and is amenable to ab-initio computation, unlike
the real disordered material. The properties of the SQS crystal are then assumed to
be the same as the disordered material. The drawback of this approach is that the
SQS crystal matches only a handful of the short-range chemical correlations in the
disordered material. It is unclear if the SQS crystal handles local relaxations in the
same way as the real disordered material. In contrast, the CVM method can abri-
trarily extend the range of the chemical correlations that are matched by including
more ordered materials in the computation.
Of the two approaches, we prefer the CVM methodology. In chapter 5 we measure
the neutron-weighted DOS and vibrational entropy of six chemically disordered Cu-
Au alloys and show fair agreement with existing theoretical predictions using CVM.
1.5 Summary
In this chapter we have briefly touched upon the justification, methodology and sci-
entific focus of this thesis. The thermodynamic consequences of the phonon entropy
in metals and alloys are enormous, both in size and scope. We further this assertion
in chapter 2, where we tabulate the vibrational entropy differences of alloying and
formation for 32 alloys and intermetallic compounds. In chapter 3 we demonstrate the
largest measured vibrational entropy difference for a polymorphic solid-state phase
transition. In chapters 4 and 5 we explore the effects of thermal and chemical disorder
in elemental V and Cu-Au alloys.
Chapter 2 Experimental Trends in
Vibrational Entropy
2.1 Introduction
There has been a steady growth in our understanding of alloy phase diagrams from
ab-initio calculations [15] and more phenomenological approaches [16, 17, 18, 191.
From the work of Ising [20] and Bragg and Williams 1121, 221 to the present day, the
free energies of alloy phases have been largely understood as an internal energy plus a
configurational entropy [23, 24, 25, 26, 27, 151. There were indications that vibrational
entropy could also be important to alloy phase stability [28, 29, 30, 31, 32, 331 but
experimental proof of this has been available only recently [34, 35, 36, 37, 38, 391.
In the harmonic approxin~ation, differences in the phonon density of states (DOS)
can be used to identify the reasons for differences in vibrational entropies of alloy
phases. There have been recent attempts to calculate the lattice dynamics of inter-
metallic phases [4, 40, 41, 421 and some alloys were chosen for these calculations in
part to provide comparisons with experimental vibrational entropies of order-disorder
transformations. The difficulty with such comparisons is calculating the phonon DOS
of the disordered alloy. The state of disorder involves chemical and spatial disorder
of atoms on crystal lattice sites, and the details of this disorder may differ between
experiments and calculations. For example, disordered alloys of Ni3Al show a wide
range of lattice parameters [43, 44, 45, 461, suggesting that Ni3A1 is not a reliable
alloy for experimental comparisons.
More reliable comparisons between theory and experiment should be possible with
vibrational entropies of formation, defined here as the entropy per mole of the inter-
metallic compound minus the total vibrational entropy of its two elemental metals.
The advantage of studying vibrational entropies of formation is that the unit cells
13
of both the initial state (two crystalline elemental metals) and the final state (inter-
metallic compound) are translationally ~eriodic, so well-defined phonon modes exist.
An advantage for experimental studies of vibrational entropies of formation is that
the lattice dynamics for the phonon DOS should be obtained reliably from coher-
ent neutron inelastic scattering experiments on single crystals. In contrast, coherent
neutron inelastic scattering experiments on disordered alloys are typically interpreted
with the assumption of a virtual crystal, an assumption that has been shown to be
unreliable 138, 47, 41, 421.
Here we report differences in vibrational entropies of formation, AS$irn , for in-
termetallic compounds and alloys in the harmonic approximation. We performed a
search of the literature for data on phonon densities of states for alloys and com-
pounds, and their elemental constituents [48, 49, 50, 51, 52, 53, 54, 55, 56, 571. The
vibrational entropies of formation can be large and range from 0.64 to $0.55 ks/atom.
It is interesting that this range is larger than is possible for the range of the configu-
rational entropy of mixing for a binary alloy, ASCOnfig(c):
AScOnfig(c) = ks[c In c + (1 - c) ln(1 - c)]
which has a maximum value of 0.693 kB/atom when c = 0.5, and has a minimum
value of 0.
We attempted many correlations of vibrational entropies of formation to ther-
mophysical properties of the compounds and the constituent elements. Many of the
parameters were chosen because of their relationship to the masses of atoms and
forces between them, since these masses and forces are the basis for lattice dynamics.
Structural differences between phases are also expected to be important, so most sys-
tematic comparisons were made within the L12 and A15 families of compounds. We
report a good correlation of the vibrational entropy of formation to the difference in
metallic radii of the two species. For the related problem of alloy formation, consid-
ered here as substituting solute atoms for atoms of the matrix, we report some success
in correlating the vibrational entropy of alloying to the mass ratio of the solute and

matrix atoms.
2.2 Methods and Results
In the high temperature limit, the vibrational entropy of formation can be obtained
from the phonon densities of states as
00
= -3ka 1 Ag(E) ln(E)dE (2.2)
where Ag(E) is defined as the difference in phonon DOS of the intermetallic com-
pound, g(E), and the elemental constituents, g;(E):
where fi is the atom fraction of the elemental constituent, i, in the intermetallic
compound. The fi sum to unity. To calculate the vibrational entropy of alloying,
a s a l l o y ,;,, , we use the following definition of Ag(E):
where gl(E) is the DOS of the majority constituent element - the element with the
largest fi. To compare the success of the many different correlations and models, we
use the parameter, R, the standard error of estimate, as a measure of the quality of
the fit to a straight line through the origin. We define R as
where the index i sums over all the data points, ASexP is the measured value of the
vibrational entropy difference for data point i, Asfit is the best fit or model value of
the vibrational entropy for data point i, and n is the number of data points. The
value R can be used to compare the quality of correlation between different models.
To calculate vibrational entropies, we used the phonon DOS curves for 32 com-

15
pounds and alloys and their 21 elemental constituents compiled in the Landolt-
Bornstein tables [51, 521 and other references [48, 49, 50, 53, 56, 58, 54, 59, 361.
All neutron scattering measurements were performed at room temperature, with the
exceptions of elemental Ge (80 K), Pb (80 K) and Pt (90 K). Most phonon DOS curves
were obtained from coherent inelastic neutron scattering measurements of phonon dis-
persion curves from single crystals. The original authors fit their measured phonon
dispersion curves to predictions from a Born-von KBrmAn model of lattice dynam-
ics. This model was then used to calculate the phonon DOS. Exceptions were the
DOS curves for the A15 intermetallics, bcc alloys and the MgZn2 Laves compound,
which were obtained by neutron scattering from polycrystalline samples. For these
polycrystalline samples, the neutron data were interpreted in the incoherent approxi-
mation [60, 611, but without correcting for the different constituent scattering lengths.
This correction is in principle impossible without prior knowledge of the lattice dy-
namics, but it could be important. Results for the A15 intermetallics, bcc alloys and
the MgZn2 Laves compound should therefore be treated with caution.
For the present study, we used two methods for obtaining phonon DOS curves. In
the first method, the interatomic force constants provided by the original authors were
used to calculate the phonon DOS, as described previously 157, 361. In the second
method, we converted the published graphs of the phonon DOS curves into digital
form using the software package Datathief 2.0b. Although the number of original
points in the data was not preserved, the shape of the DOS curve was reproduced
faithfully after digitization. The digitization process provided essentially the same
phonon DOS curves that we calculated from the force constants, and nearly the
same values of AS$;m that we calculated directly with the Born-von KLrmAn model
for L12 Cu3Au, Fe3Ni, Ni3A1, Ni3Fe, PtsFe, and their elemental constituents. The
discrepancies were used to provide the error bars for our estimates of AS$;m. All
digitized DOS curves were normalized to unity, which typically required corrections
of less than one part per thousand. Results for AS$km and AS:^? for 32 intermetallic
compounds and alloys are presented in Table 2.2. We expect that AS:I;Y is physically
meaningful only when the minority constituent does not change the structure of the
16
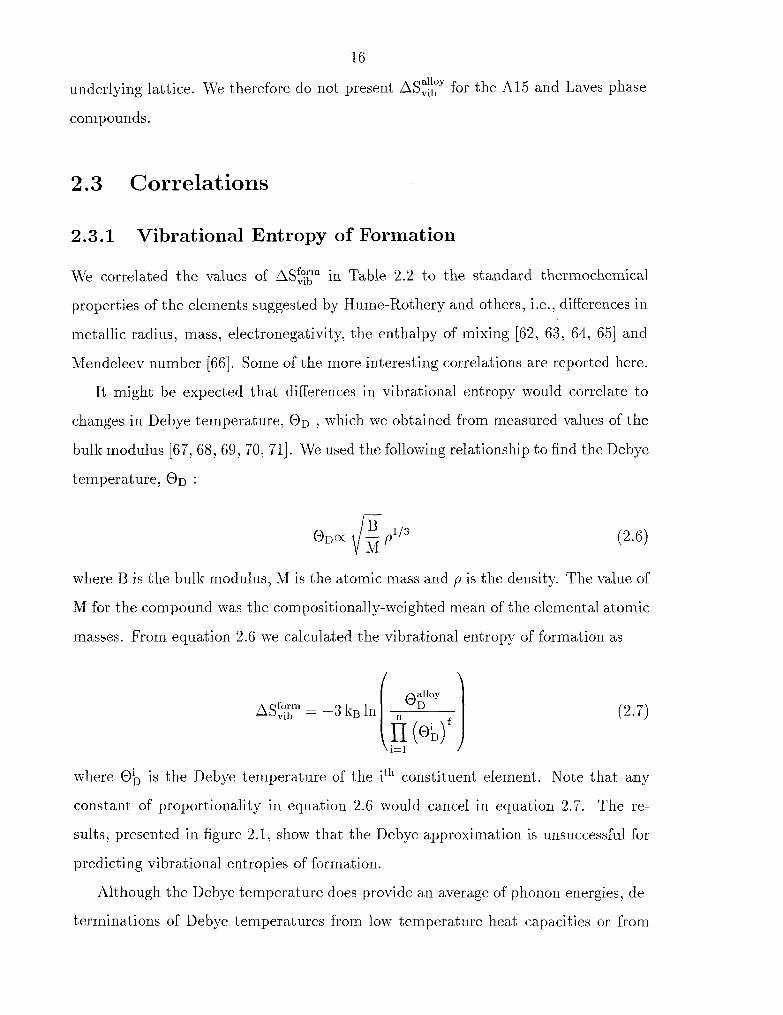
underlying lattice. We therefore do not present boy for the A15 and Laves phase
compounds.
2.3 Correlations
2.3.1 Vibrational Entropy of Formation
We correlated the values of 4 S g m in Table 2.2 to the standard thermochemical
properties of the elements suggested by Hume-Rothery and others, i.e., differences in
metallic radius, mass, electronegativity, the enthalpy of mixing [62, 63, 64, 651 and
Mendeleev number [66]. Some of the more interesting correlations are reported here.
It might be expected that differences in vibrational entropy would correlate to
changes in Debye temperature, OD , which we obtained from measured values of the
bulk modulus 167, 68, 69, 70, 711. We used the following relationship to find the Debye
temperature, OD :
where B is the bulk modulus, M is the atomic mass and p is the density. The value of
M for the compound was the compositionally-weighted mean of the elemental atomic
masses. From equation 2.6 we calculated the vibrational entropy of forination as
where Ob is the Debye temperature of the ith constituent element. Note that any
constant of proportionality in equation 2.6 would cancel in equation 2.7. The re-
sults, presented in figure 2.1, show that the Debye approximation is unsuccessful for
predicting vibrational entropies of formation.
Although the Debye temperature does provide an average of phonon energies, de-
terminations of Debye temperatures from low temperature heat capacities or from
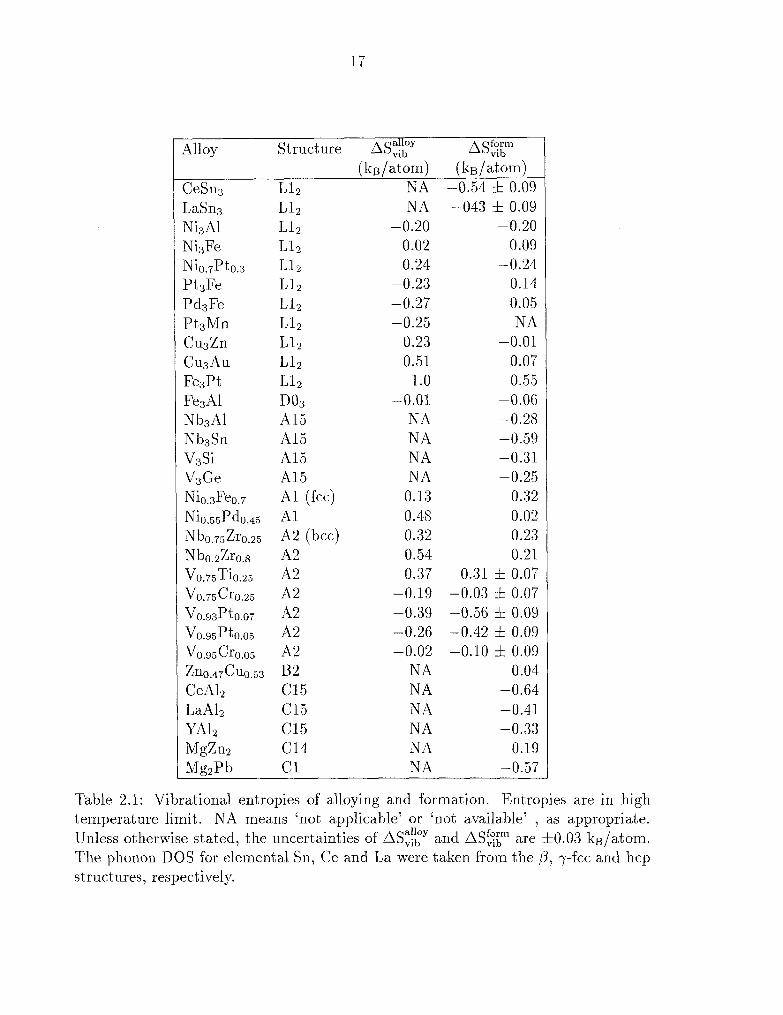
Alloy Structure AS::? a s f o r m vib
(kB/atom) (kB/atom) CeSn3 Ll2 NA -0.54 k 0.09 LaSn3 Ll2 NA -043 f 0.09 Ni3AS Ll2 -0.20 -0.20 Ni3Fe Ll2 0.02 0.09 Nio.7Pto.3 L12 0.24 -0.24 Pt3Fe L12 -0.23 0.14 Pd3Fe L12 -0.27 0.05 Pt3Mn Ll2 -0.25 NA Cu3Zn Ll2 0.23 -0.01 Cu3Au L12 0.51 0.07 Fe3Pt L12 1.0 0.55 Fe3A1 Do3 -0.01 -0.06 Nb3A1 A15 NA -0.28 Nb3Sn A15 NA -0.59 V3Si A15 NA -0.31 V3Ge A15 NA -0.25 Nio.3Feo.7 A1 (fcc) 0.13 0.32 Nio.55Pdo.45 A1 0.48 0.02 Nbo.75Zro.25 A2 (bee) 0.32 0.23 Nbo.zZro.8 A2 0.54 0.21 Vo.75Tio.25 A2 0.37 0.31 f 0.07 Vo.75Cro.25 A2 -0.19 -0.03 6 0.07 V0.93Pto.07 A2 -0.39 -0.56 k 0.09 V0.95Pto.05 A2 -0.26 -0.42 f 0.09 V0.95Cr0.05 A2 -0.02 -0.10 f 0.09 Zno.47C~o.53 B2 NA 0.04 CeAS2 C l 5 NA -0.64 LaA12 C15 NA -0.41 YA12 C15 NA -0.33 MgZn2 C14 NA 0.19 MgaPb C1 NA -0.57
Table 2.1: Vibrational entropies of alloying and formation. Entropies are in high temperature limit. NA means 'not applicable' or 'not available' , as appropriate. Unless otherwise stated, the uncertainties of AS:::' and are 60.03 ks/atom. The phonon DOS for elemental Sn, Ce and La were taken from the P , y-fcc and hcp structures, respectively.

-3k,ln[0 alloy 0 1 - f 1 ~ ~ f 2 ]
Figure 2.1: Comparison of the measured vibrational entropy of formation with that calculated from the bulk modulus in the Debye approximation (equation 2.6) for selected L l a alloys. R = 0.430.
elastic constants emphasize the low energy phonons. At modest temperatures the
higher energy phonons account for most of the heat capacity, however, and the ele-
ments and compounds discussed here showed large differences in the structure of the
higher energy part of their phonon DOS. The structure of the phonon DOS at higher
energies is expected to depend more sensitively on the local structure of the alloy [72]
than the low energy part of the DOS.
Of the correlations performed with other thermochemical parameters, the most
successful involved the difference in metallic radius [73] between the majority and
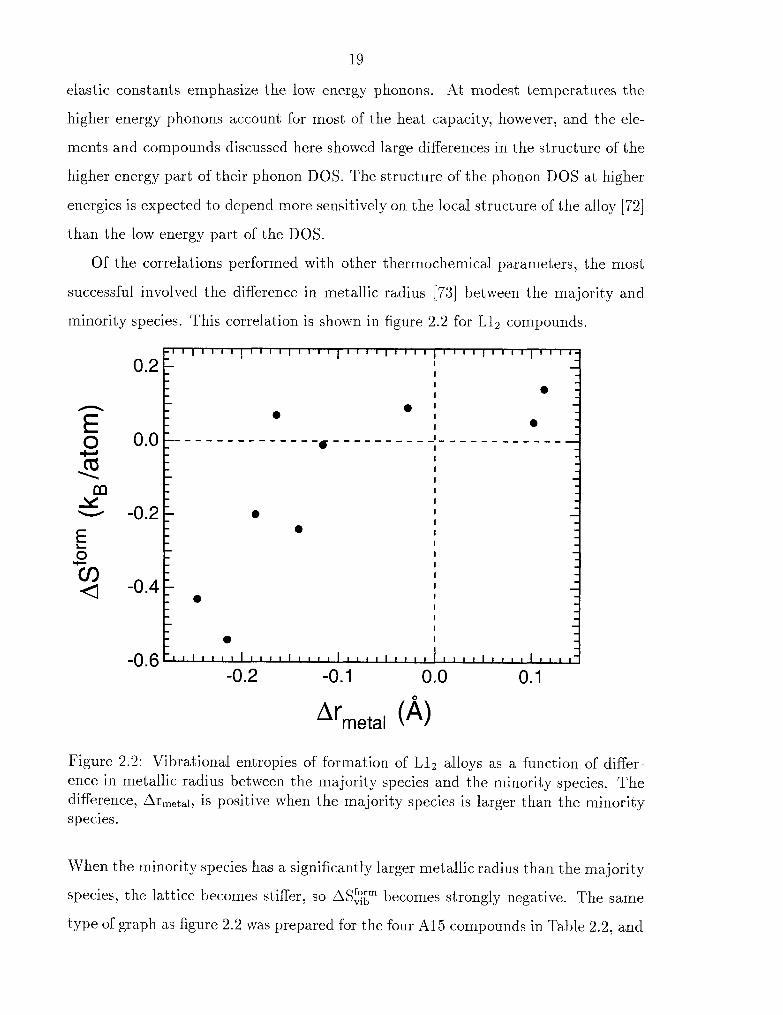
minority species. This correlation is shown in figure 2.2 for L l z compounds.
Ar metal (4 Figure 2.2: Vibrational entropies of formation of L IZ alloys as a function of differ- ence in metallic radius between the majority species and the minority species. The difference, Armetal, is positive when the majority species is larger than the minority species.
When the minority species has a significantly larger metallic radius than the majority
species, the lattice becomes stiffer, so AS:irn becomes strongly negative. The same
type of graph as figure 2.2 was prepared for the four A15 compounds in Table 2.2, and
2 0
a similar trend was found, although the entropy va.lues for the A15 compounds were
all strongly offset negative by about 0.36 kB/atom. This offset may originate with
the difference between bcc and A15 structures, probably because the A15 structure
includes compressed chains of atoms. The L12 data of figure 2.2 lack this offset
because the underlying lattice has not changed (fcc to ordered fcc).
The success of the correlation of with differences in metallic radius seems
consistent with interatomic force constants determined from coherent inelastic neu-
tron scattering. Consider first the case where the B-atom is larger than the A-atom.
The condition for axially-symmetric Inn force constants, C1,, - CI,, = C1,,, is sat-
isfied reasonably well for both A-A pairs and A-B pairs in most L12 alloys of A3B
stoichiometry [51]. Furthermore, the force constants C ~ G ~ are usually small, indi-
cating that the dominant forces between A-B Inn pairs are radial. This suggests
an intuitive picture of the lattice dynamics involving spheres that interact by stiff
first-neighbor central forces. First consider the case of an A3B alloy with the L12
structure, where the larger B atoms fit tightly into a matrix of smaller A atoms. The
general trend of finding large force constants c$gB and C ~ G ~ is consistent with this
stiff sphere picture. When the larger B-atoms are squeezed onto the A-lattice without
causing much change in lattice parameter, the amplitudes of the atomic vibrations
are expected to be constrained, and the vibrational frequencies increased. This effect
is consistent with the large slope of the curve of ASzm versus Ar at increasingly
negative Ar. (The exception to the trend in figure 2.2 was the invar alloy FesPt,
not shown on figure 2.2, which has a positive of $0.5 kB/atom. The force
constants for Fe-Pt neighbors showed by far the largest deviations from central force
character of any L12 alloy. Invar alloys are generally expected to show anomalous
vibrational modes.)
On the other hand, figure 2.2 shows that AS:;;" is small and slightly positive
when the minority atom is smaller than (or only slightly larger than) the majority
atom. When the minority B-atom is smaller than the majority A-atom, we expect
poor contact between the B-atom and its neighbors, and weak A-B force constants.
For stiff spheres, once contact is lost, the A-B force constant is not sensitive to the
21
metallic radius of the B-atom. This is consistent with the flattening of the curve in
figure 2.2 for small and positive values of Ar. As a corollary, we suggest that when
the B-atoms are smaller than the A-atoms, the phonon DOS of the L12 alloy should
be less sensitive to the state of chemical order in the alloy.
2.3.2 Vibrational Entropy of Alloying
It is well-known that mass disorder has no effect on vibrational entropy, assuming the
force constants remain unchanged. It is therefore unreasonable to make a model for
the effect of atomic mass on the vibrational entropies of formation of intermetallic
compounds from their constituent elements. In alloying, however, substituting atoms
of one mass for atoms of a different mass will alter the vibrational entropy even when
the interatomic force constants remain unchanged. At a fixed temperature such a
substitution will have no effect on the mean-squared interatomic displacement (in
the harmonic approximation), which is set by the force constants. The substituted
alloy will explore a different range in its momentum coordinates, p, however. Since
p2/2M oc kBT, the range in momentum coordinates will increase as the square root
of the increased mass of the alloy. The change in vibrational entropy will be (per
substituted atom):
where the masses of the solute and matrix atoms are MsOlute and M,,triX. The corre-
lation between the vibrational entropy of alloying and In(Ms,lute/M,,t,ix) is shown in
figure 2.3. This mass correlation, without adjustable parameters, seems reasonably
successful with R = 0.212.
In alloying there will also be changes in interatomic force constants. A proper
estimation of this contribution requires knowledge of the interatomic potential, but
we attempt a simple correlation here. For L12 compounds the lattice parameters are
known. We obtain the change in phonon frequencies through the Gruneisen relation:
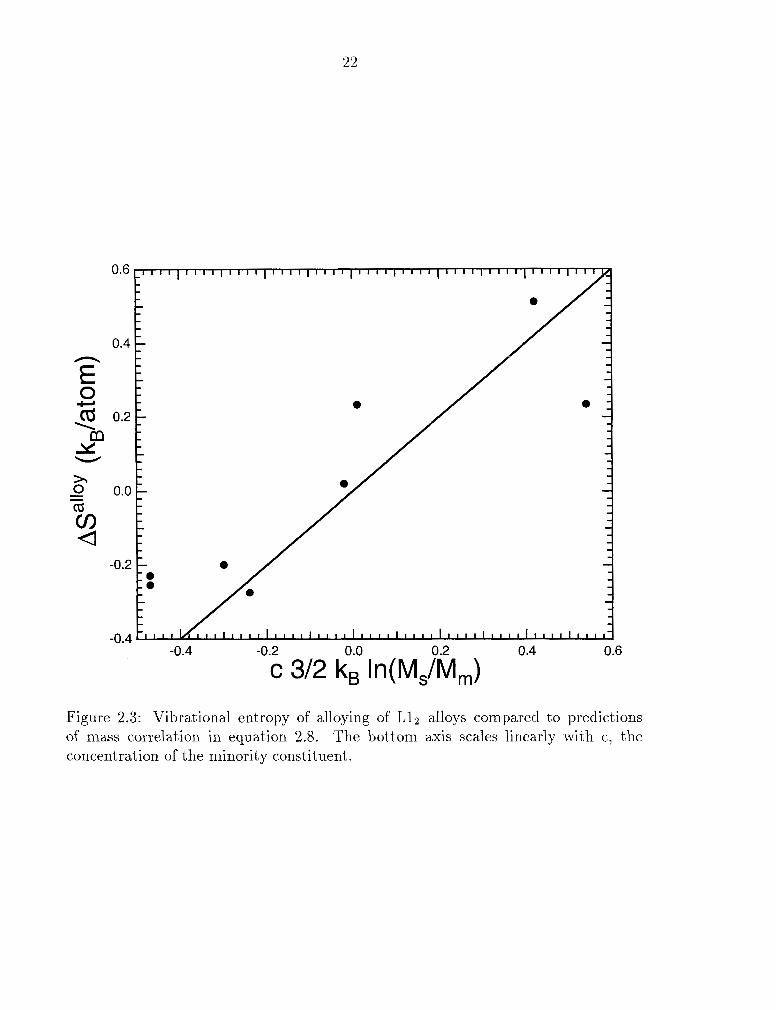
Figure 2.3: Vibrational entropy of alloying of L12 alloys compared to predictions of mass correlation in equation 2.8. The bottom axis scales linearly with c, the concentration of the minority constituent.
where yi is the mode Gruneisen parameter. Using w,,,, as a constant of normal-
ization, the force constant effect on the vibrational entropy, A S Z , can then be
evaluated as
3N asforce
vib = + k B z 7 i A l n V i=l
We assume the Griineisen parameter is the same for all phonon modes. For the
contribution to the vibrational entropy change upon substituting the minority species
for the majority species, we attempt to use x-ray lattice parameter data [69, 741 for
the change in volume upon alloying. The change in entropy of the alloy owing to
changes in force constant is (per atom):
V a ~ l o y OS"'~' vib = 3 y kBln (-) Vmatr ix
where Vall,, is the volume per atom of the alloy, and Vrnatrix is the volume per atom
of the elemental metal of the majority species.
Combining the mass effect of alloying, equation 2.8, with the force constant effects
predicted by equation 2.14, and setting y = 2, we obtain for an alloy with solute
concentration, c:
Msolute V a ~ ~ o y = c 3 k ~ in ( ) + 6 k s in (-) vib 2 Mrnatrix Vrnatrix
24
For L12 alloys, the correlation with equation 2.15 is less successful than the mass
effect alone (equation 2.8 and figure 2.3). The theoretical fit overestimated the mea-
sured entropy change by a factor of 2 to 3 in most cases. The change in unit cell
volume may be unsuccessful as a parameterization of the change in vibrational modes
because some interatomic separations are reduced, and some are expanded beyond
their equilibrium separations when an atom of different size is inserted into the ma-
trix. Upon alloying, some of the interatomic forces are therefore increased, and some
decreased. The expected trend for correlation of vibrational modes to the unit cell
volume is uncertain. We may expect equation 2.15 to be more appropriate for the
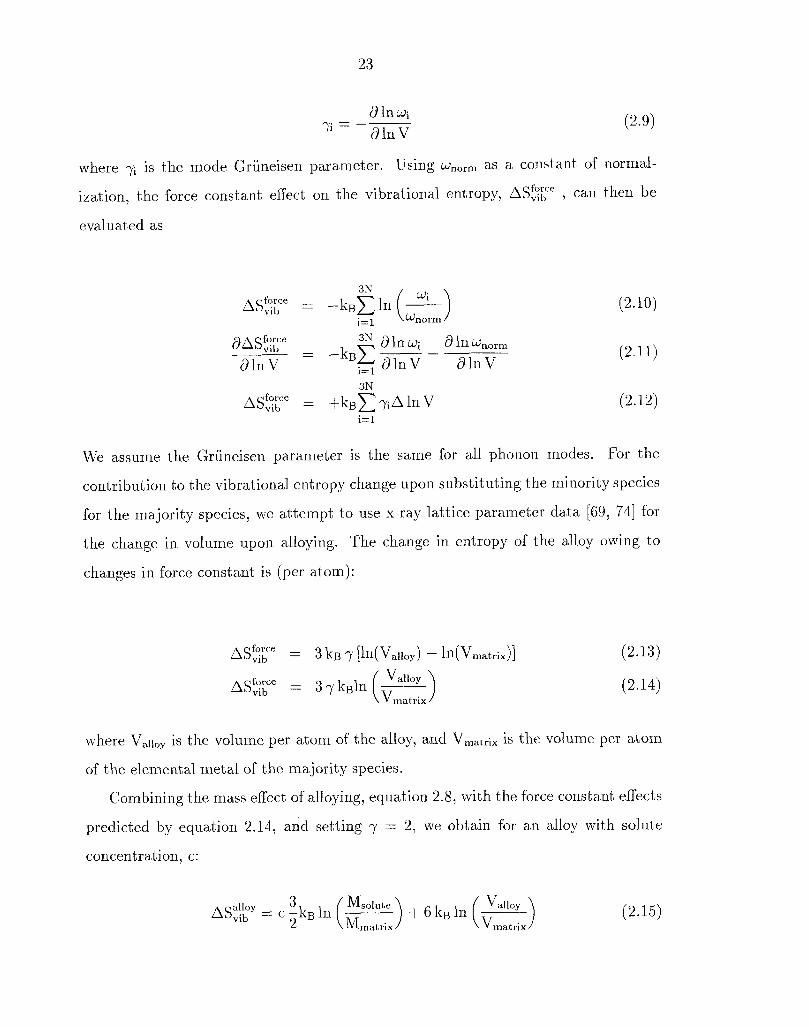
vibrational entropy of substitution between the same cryst a1 structures. Figure 2.4
shows the vibrational entropy difference between similar Laves, L12 and A15 phases
as a function of minority constituent and volume difference [69, 741. The same data
plotted versus equation 2.8 (mass term only) gives a moderately better correlation
(not shown) with an R value of 0.316.
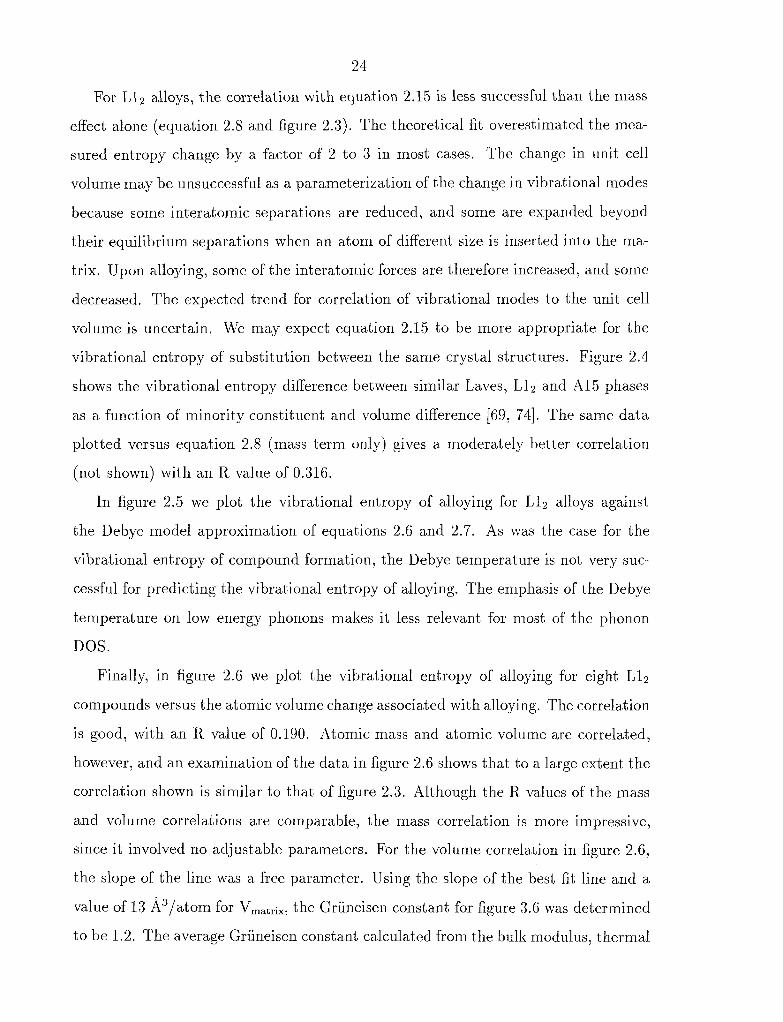
In figure 2.5 we plot the vibrational entropy of alloying for L12 alloys against
the Debye model approximation of equations 2.6 and 2.7. As was the case for the
vibrational entropy of compound formation, the Debye temperature is not very suc-
cessful for predicting the vibrational entropy of alloying. The emphasis of the Debye
temperature on low energy phonons makes it less relevant for most of the phonon
DOS.
Finally, in figure 2.6 we plot the vibrational entropy of alloying for eight L12
compounds versus the atomic volume change associated with alloying. The correlation
is good, with an R value of 0.190. Atomic mass and atomic volume are correlated,
however, and an examination of the data in figure 2.6 shows that to a large extent the
correlation shown is similar to that of figure 2.3. Although the R values of the mass
and volume correlations are comparable, the mass correlation is more impressive,
since it involved no adjustable parameters. For the volume correlation in figure 2.6,
the slope of the line was a free parameter. Using the slope of the best fit line and a
value of 13 A3/atom for V,,tri,, the Griineisen constant for figure 3.6 was determined
to be 1.2. The average Griineisen constant calculated from the bulk modulus, thermal
Figure 2.4: The vibrational entropy difference of substitution for Laves, A15 and L12 alloys versus the prediction from equation 2.15. The specific intermetallics being compared are indicated for each data point. The variables MI, and M2, are the atomic masses of the minority constituents of the final and initial states, respectively. R = 0.541.
-3k,ln(O a110 JO,)
Figure 2.5: The vibrational entropy of alloying for six L12 alloys compared to the entropy predicted from the bulk modulus in the Debye approximation. Or is the Debye temperature of the majority constituent element. R = 0.372.
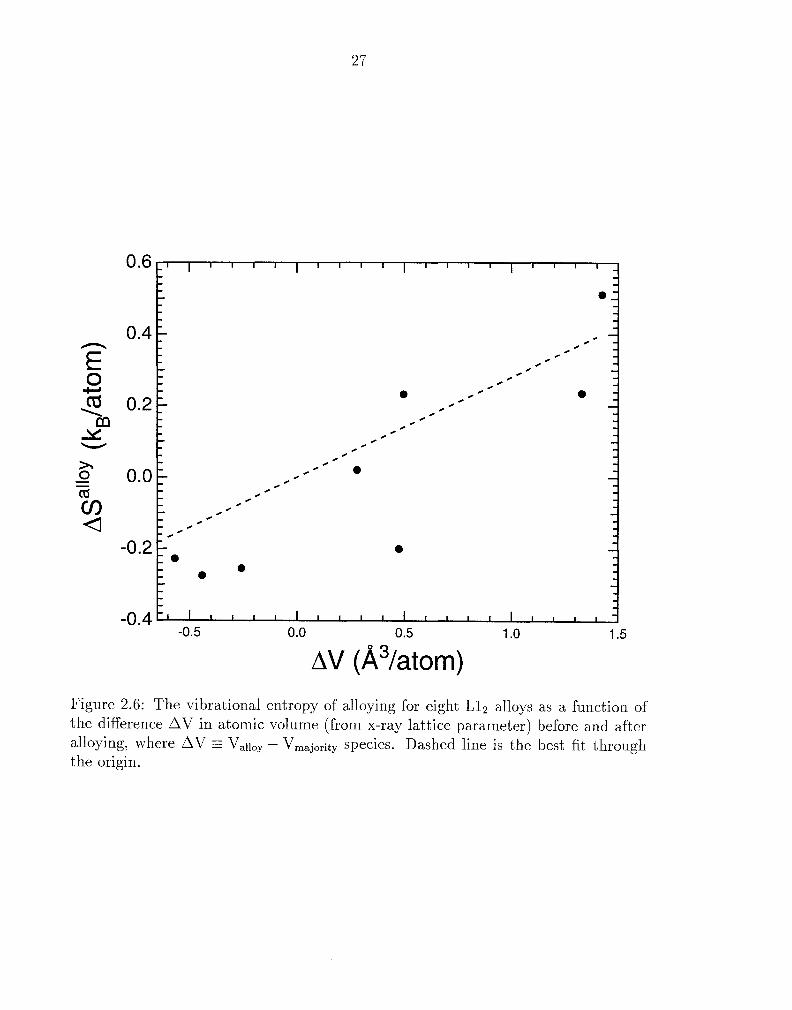
Figure 2.6: The vibrational entropy of alloying for eight L12 alloys as a function of the difference AV in atomic volume (from x-ray lattice parameter) before and after alloying, where AV - Vall,, - V,,,,j,,.ity species. Dashed line is the best fit through the origin.
Notes: For consistency, R values for all correlations were calculated with six LIZ compounds for which all physical parameters were available.
Table 2.2: Correlations with entropy of alloying.
R
0.372
0.208
0.637
0.207 0.280
Correlation
Debye (equation 2.7)
Mass (equation 2.8)
Mass plus Griineisen (equation 2.15) Change in atomic volume (W3/atom) Difference in metallic radius (A)
expansion [75] and classical heat capacity for five Liz compounds was 1.82 f 0.46.
The average Griineisen constant (derived from best fit line to AV, see figure 2.6) for
the same 5 L l z compounds was 1.04. The lack of agreement is a good indication that
equation 2.13 fails to model the observed entropy of alloying, and that the correlation
in figure 2.6 may, as stated above, reflect the correlation between atomic volume and
atomic mass.
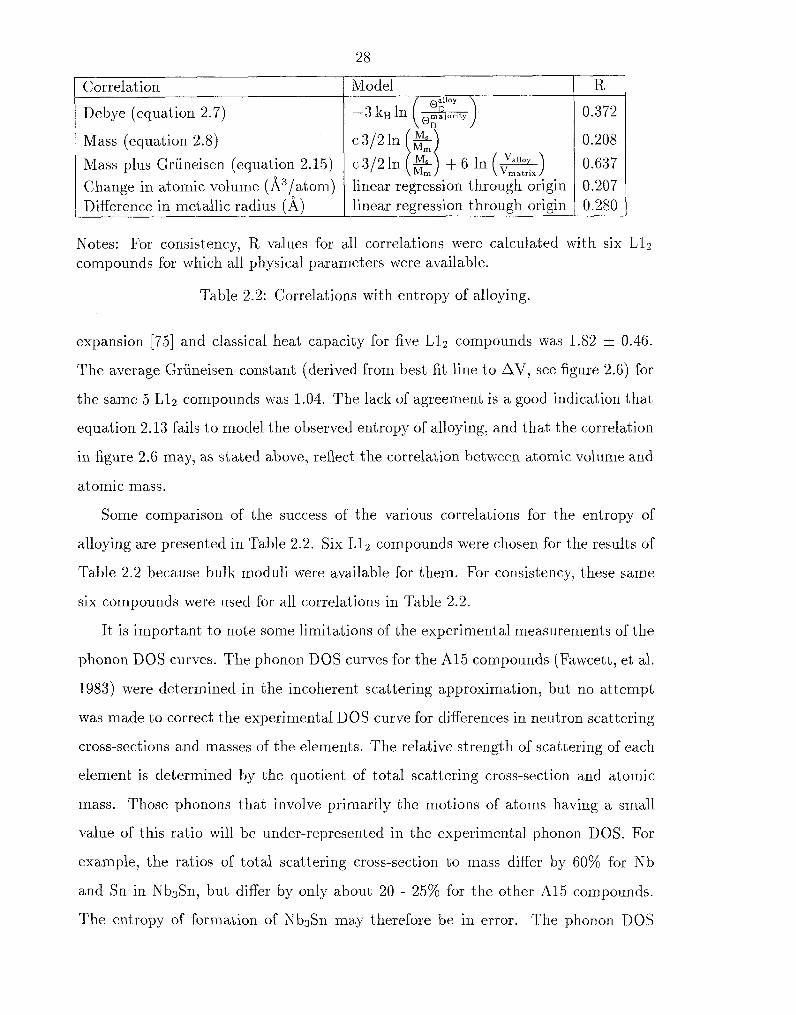
Some comparison of the success of the various correlations for the entropy of
alloying are presented in Table 2.2. Six Liz compounds were chosen for the results of
Table 2.2 because bulk moduli were available for them. For consistency, these same
six compounds were used for all correlations in Table 2.2.
It is important to note some limitations of the experimental measurements of the
phonon DOS curves. The phonon DOS curves for the A15 compounds (Fawcett , et al.
1983) were determined in the incoherent scattering approximation, but no attempt
was made to correct the experimental DOS curve for differences in neutron scattering
cross-sections and masses of the elements. The relative strength of scattering of each
element is determined by the quotient of total scattering cross-section and atomic
mass. Those phonons that involve primarily the motions of atoms having a small
value of this ratio will be under-represented in the experimental phonon DOS. For
example, the ratios of total scattering cross-section to mass differ by 60% for Nb
and Sn in Nb3Sn, but differ by only about 20 - 25% for the other A15 compounds.
The entropy of formation of NbsSn may therefore be in error. The phonon DOS
Model O a l l o ~
-3 kg In rn2jority 0,
c 3/2 \Ll c3/2 In + 6 In ( Vrnatrix ) linear regression through origin linear regression through origin
2 9
curves for the bcc alloys listed in Table 2.2 were also obtained in the incoherent
scattering approximation (Fawcett et al. 1983), suggesting problems with the V-Ni
alloy. Finally, we point out that the phonon DOS curves used for the data of Table 2.2
were obtained at temperatures of 300 K and below. For phase transformations at
elevated temperatures, anharmonic effects could alter considerably the vibrational
entropies.
2.4 Summary
Using all available data on phonon densities of states of intermetallic compounds,
alloys, and their element a1 metals, we calculated and tabulated the vibrational en-
tropies of formation of the alloys and compounds in the harmonic approximation.
The range of these entropies of formation, from -0.64 to $0.55 ks/atom, is larger
than the maximum possible range for the configurational entropy of formation of a
binary alloy. Vibrational entropies of alloying ranged from -0.35 to 1.0 ks/atom.
We correlated the vibrational entropies of formation to several thermophysical
properties of the atoms. The Debye approximation does not account adequately for
the structure of the phonon DOS, and the Debye model made poor predictions of
the vibrational entropy of formation and the vibrational entropy of alloying. For L12
compounds and A15 compounds, we found that the vibrational entropy of formation
correlated best to the difference in metallic radius of the two atomic species. We
also modeled the vibrational entropy of alloying in terms of atomic mass and volume
effects. The correlation between the vibrational entropy of alloying and the mass ratio
of the solute and matrix atoms was most successful, although correlations involving
the volume and metallic radius were also good.
Chapter 3 The Role of Phonons in the
Thermodynamics of the NiTi Martensitic
Transformat ion
3.1 Introduction
The intermetallic compound NiTi exhibits the shape memory effect near room tem-
perature. This phenomenon involves large, reversible strains, and is closely related
t o the martensitic transformation that occurs spontaneously upon heating or cooling.
The high temperature 'austenite' has the cubic B2 structure (CsC1 prototype), and
the low temperature 'martensite' has a monoclinic B19' structure [76]. Since this
martensitic phase transformation is reversible, we expect the austenite to have larger
energy and larger entropy than the martensite. The present investigation addresses
the entropy. Since the atom motions during the transformation occur by a coopera-
tive process, no significant change in configurational entropy can occur. The phase
transformation involves no known chemical, electronic or magnetic ordering; hence
the entropy should be entirely vibrational.
Calorimetric methods were used in several previous investigations of the marten-
sitic transforination in NiTi. McCormick and Liu [77], using the temperature de-
pendence of the transformation stress, measured an entropy gain of 0.41 ks/atom
upon transforming to austenite. Johari and coworkers [78] measured values of 0.44 f
0.09 k ~ / a t o m and 0.37 kB/atom using pressure-dependent resistivity and calorimetry,
respectively. Smaller values were reported by Obrad6, Mafiosa and Planes for Cu-
A1-Mn alloys [79]. Calorimetry can provide useful numbers, but it does not address
the atomistic origin of the transformation entropy. There have been several previous
investigations using coherent inelastic neutron scattering to measure phonon soften-
3 1
ing in the austenite near the martensitic transformation temperature. These studies
on NiTi [80, 81, 82, 831, with a single exception 1841, were single-crystal experiments
measuring a few phonon dispersion curves. Their focus was on the mechanism by
which the phase transformation occurs, not the vibrational entropy. More recently,
there have been several experiment a1 and theoretical investigations on the role of vi-
brational entropy in solid-state phase transformations [34, 35, 38, 101. The emphasis
of this work has been on how differences in vibrational entropy originate from dif-
ferences in the phonon density of states (DOS) of the different phases. The present
investigation has this same emphasis.
We performed measurements of the phonon DOS, heat capacity, transformation
ent halpy, thermal expansion, and performed calculations of Born-von KBrmAn lattice
dynamics to investigate the vibrational entropy of the martensitic transformation.
The neutron scattering and latent heat data gave independent measurements of the
entropy. The heat capacity measurements and lattice dynamics simulations were
used to check the reliability of the phonon DOS measured by neutron scattering.
The phonons implicated in the mechanism of the martensitic transformation, the
k = $ [110] 27r/a transverse acoustic phonons, are not sufficient in number to account
for the entropy of the transformation. On the other hand, the softness of the acoustic
branches in the B2 austenite phase is shown to be responsible for most of the vibra-
tional entropy of the phase transformation. The stability of this bcc-like B2 phase
seems related to the transverse force const ant between first-nearest neighbors.
3.2 Experimental Methods
A NiTi plate of 0.125 cm thickness was obtained from Shape Memory Applications,
Inc., and annealed for 15 min at 700 O C . This annealed plate provided all samples for
the present study. The sample for differential scanning calorimetry was ground into
a 0.2613 g disc of approximately 0.20 cm diameter. Nickel metal of 99.99% purity
was selected as a reference material, and the Ni sample was cold-rolled and ground
to a 0.3293 g disc. The masses were chosen so the two samples had approximately
the same number of atoms.
Low-temperature heat capacity measurements were performed with a Perkin-
Elmer DSC-4 differential scanning calorimeter that had been modified by installing
its sample head in a liquid helium dewar. The latent heat measurements were taken
using liquid nitrogen as the cryogen. Heating scans were performed from -90 "C to
+ 100 " C, at heating rates of 10, 5 and 3 " C per second. Cooling scans were taken from
+I00 "C to -90 "C at cooling rates of 10 and 5 "C per second. All measurements were
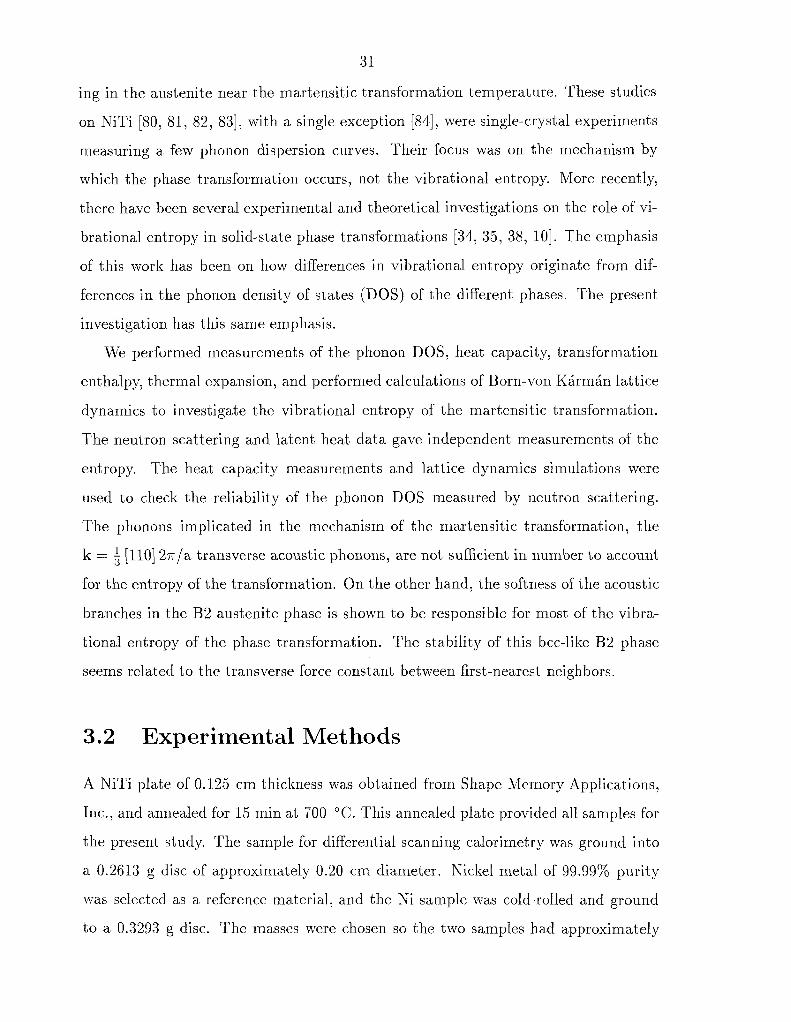
repeated with the two samples interchanged in the sample pans. Representative data
are shown in figure 3.1.
-40 0 40 80
Temperature ("C)
Figure 3.1: Representative data of the latent heat upon cooling and heating of the martensite-austenite phase transformation in NiTi. In both cases a background has been subtracted from the raw data.
Using the same samples and calorimeter, the differential low temperature heat
capacity of martensitic NiTi was measured with respect to Ni. Liquid nitrogen was
used as the cryogen, allowing measurements of the differential heat capacity from
-170 to -50 "C. Data were taken with a heating rate of 20 "C/min in 30 "C intervals
with 10 "C overlaps. Scans were repeated with samples interchanged in the sample
pans. The difference between the pairs of data with samples interchanged is equal to
twice the differential heat flow, from which the differential heat capacity was found.
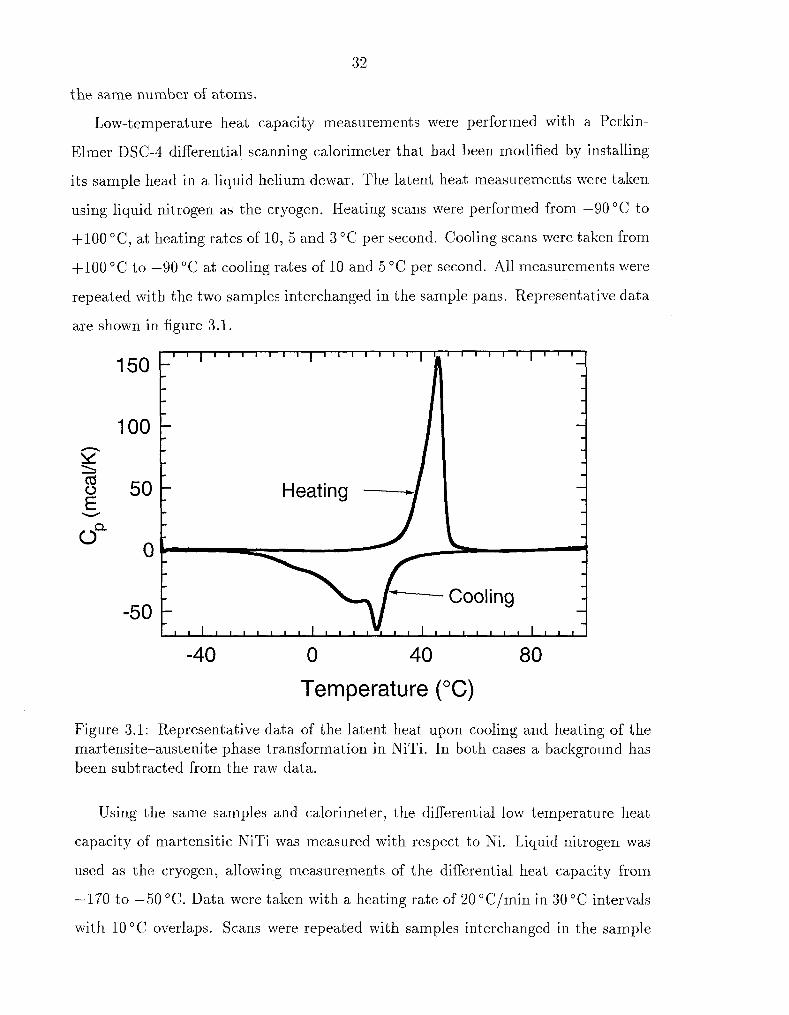
The differential heat capacity was added to the heat capacity of Ni [85] to obtain the
absolute heat capacity for martensitic NiTi. The result is shown in figure 3.2.
Corrected martensite DOS
Temperature (K)
Figure 3.2: The low-temperature heat capacity of martensitic NiTi. The filled dia- monds are our calorimetric results. The thin curve was calculated from the neutron- weight corrected martensite phonon DOS derived from low temperature neutron in- elastic scattering (shown in figure 3.6). Dashed line is heat capacity taken from Herget, et al. [84].
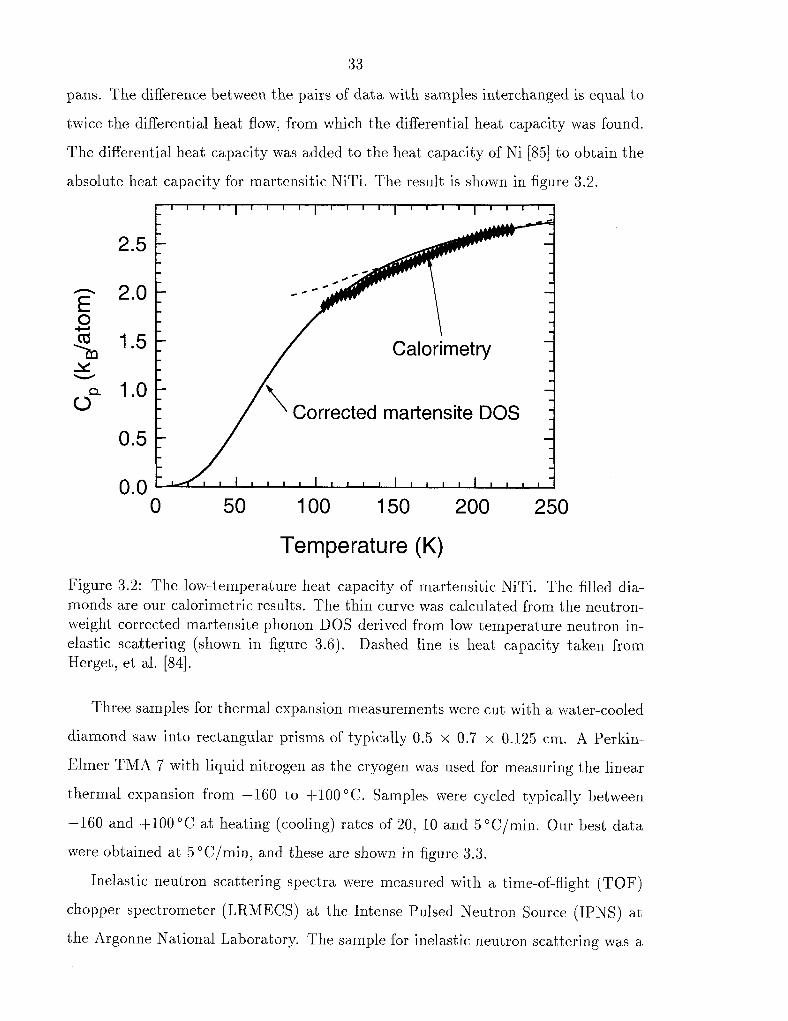
Three samples for thermal expansion measurements were cut with a water-cooled
diamond saw into rectangular prisms of typically 0.5 x 0.7 x 0.125 cm. A Perkin-
Elmer TMA 7 with liquid nitrogen as the cryogen was used for measuring the linear
thermal expansion from - 160 to $100 O C. Samples were cycled typically between
-160 and +lOO°C at heating (cooling) rates of 20, 10 and 5"C/min. Our best data
were obtained at 5 "C/min, and these are shown in figure 3.3.
Inelastic neutron scattering spectra were measured with a time-of-flight (TOF)
chopper spectrometer (LRMECS) at the Intense Pulsed Neutron Source (IPNS) at
the Argonne National Laboratory. The sample for inelastic neutron scattering was a
-150 -100 -50 0 50 100
Temperature ("C)
Figure 3.3: Thermal expansion of NiTi plate in three orthogonal directions. The long dashed line is linear expansion in the direction perpendicular to the plane of the plate. The continuous and short dashed lines are linear expansion in orthogonal direct ions within the plate plane. Data were taken with the sample at low temperature, pro- ceeding to 100°C and then returning to low temperature. Heating and cooling are indicated by arrows.
plate of 7 x 9 x 0.125 cm encased in thin-walled A1 pans and mounted at a 45 O angle
normal to the incident beam to minimize self shielding. Total scattering was 13%.
Spectra with an incident energy of 50 meV were measured at 8, 77, 127, 177, 300 and
573 K. The 300 and 573 K data were taken with the sample in the IPNS "drylid"
furnace, while the 8, 77, 127 and 177 K data were obtained with a displex refrigerator.
Background spectra were measured from the empty can both in the furnace and in the
refrigerator at 300 K. The broad detector coverage of LRMECS, ranging from 3 " to
117 ", allowed measurements over a range of momentum and energy transfer (k, hw),
with I k(u) I varying between 0.5 and 8.3 A-1 when Iiw varied from 0 to f50 meV.

Method AS AH (kslatom) (J /mol>
Calorimetric heating 2 0.41 f 0.04 1070 f. 100 Calorimetric cooling 5 0 . 5 6 f 0 . 1 -1300rt200 Calorimetric (section 3.3.1) 0.47 f 0.09 NAt Neutron scattering 0.57 -1 0.03 NA'C
tnot available.
Table 3.1: Enthalpy and entropy of martensite transformation. Calorimetric error bounds were obtained from the statistical variation of the repeated measurements for both heating and cooling.
3.3 Results
3.3.1 Calorimetry
The enthalpy of the martensitic transformation is obtained from the area under the
heating and cooling curves in figure 3.1. The entropy can then be calculated by
integrating dQ/T, where dQ is the measured heat input, over the temperature range
of the phase transformation. A reversible process should provide the same values of
AH and AS for heating and cooling, but Table 3.1 shows a discrepancy between the
heating and cooling results slightly beyond the error bars.
This hysteresis of the phase transformation implies that the transformation to
martensite is more dissipative. Assuming this is so, the values of AS in Table 3.1 are
upper and lower bounds as indicated. Alternatively, by assuming that the heating and
cooling ent halpies are in substantial agreement (within error bars), we can calculate
AS = AHIT,, where the equilibrium transformation temperature, T,, is assumed to
lie equidistant between the heating and cooling transformation start temperatures.
This provides a value for AS of 0.47 6 0.09 kB/atom.
The calorimetry curves of figure 3.1 did not vary with cooling and heating rate, but
they did change with cycling. This effect has been reported previously [86,87,77], and
has been attributed to increasing defect densities and internal stresses in the marten-
site. Perhaps such microstructural dissipation mechanisms could be responsible for
the small discrepancy between the heating and cooling results of Table 3.1.

3.3.2 Thermal Expansion
Figure 3.3 presents the fractional sample dilatation versus temperature along each
orthogonal sample dimension. The anisotropy of the B19' martensite structure and
the strong crystallographic texture of the samples caused different dilatations in each
direction. The martensitic transformation is evident between -30 and $50 OC, where
the linear thermal expansion is interrupted by a large contraction or expansion, de-
pending on the axis. Summing the linear transformation dilatations gives a volumetric
expansion of -0.2% (i.e., a contraction) upon transformation to martensite.
The transformation start and stop temperatures for heating and cooling agree well
with those observed in the calorimetric measurements of the latent heat (figure 3.1).
The complicated kinetics observed upon cooling, which appear as the three separate
peaks in the cooling curves in figure 3.1, are also observed in the thermal expansion
data. The linear expansions measured within the plane of the rolled plate (short
dashed and solid lines, figure 3.3) show a kink in slope between 0 and 10°C upon
cooling, corresponding to the region between the peaks in latent heat of cooling at
-4 and +12OC (figure 3.1).
The linear thermal expansion was determined by measuring the slopes of the
curves in the straight regions above and below the transformation temperature (fig-
ure 3.3). For martensite this depends on the crystallographic direction. Summing the
linear thermal expansion in all three plate dimensions gives the volumetric thermal
expansion, which is independent of the crystallographic texture in the sample. The
coefficients of volume thermal expansion are 36 f 3 x 10⁻⁶K-1 for the austenite and
30 f. 2 x IO-~K-' for the martensite.
3.3.3 Neutron Scattering
All TOF spectra were first normalized and corrected for detector efficiency and time-
independent background following standard procedures. In this step, the detector
counts were grouped into 10 " ranges of scattering angles having average angles from
5" to 115 O . The scattering contribution of the container and displex (or furnace)
3 7
was removed using the runs on the empty container. The data below 3-4 meV are
dominated by the large elastic peak, which was stripped from the data by assuming
the raw data were linear in energy at small energy transfer.
The first step in obtaining a phonon DOS from the corrected spectra used an iter-
ative procedure to calculate the multiphonon contribution to the measured scattering,
and this multiphonon contribution was subtracted from the data [88]. The 'neutron-
weighted' phonon DOS, gNw (E), is obtained easily from the remaining 1-phonon
cross-section. When using this procedure with data from LRMECS, we accounted
for the fact that the TOF spectra were obtained at constant scattering angle, not
constant scattering vector. The scattering vector and multiphonon correction there-
fore vary with energy transfer, and this dependence is different for the energy spectra
from the different angle banks. The sum of the corrected intensities from the upper
6 angle banks was used to obtain the phonon DOS. Disallowing the data from the
lower 6 angle banks eliminates any possible contribution from magnetic scattering,
which is greatly suppressed at high Q. Summing over the highest angle banks ensures
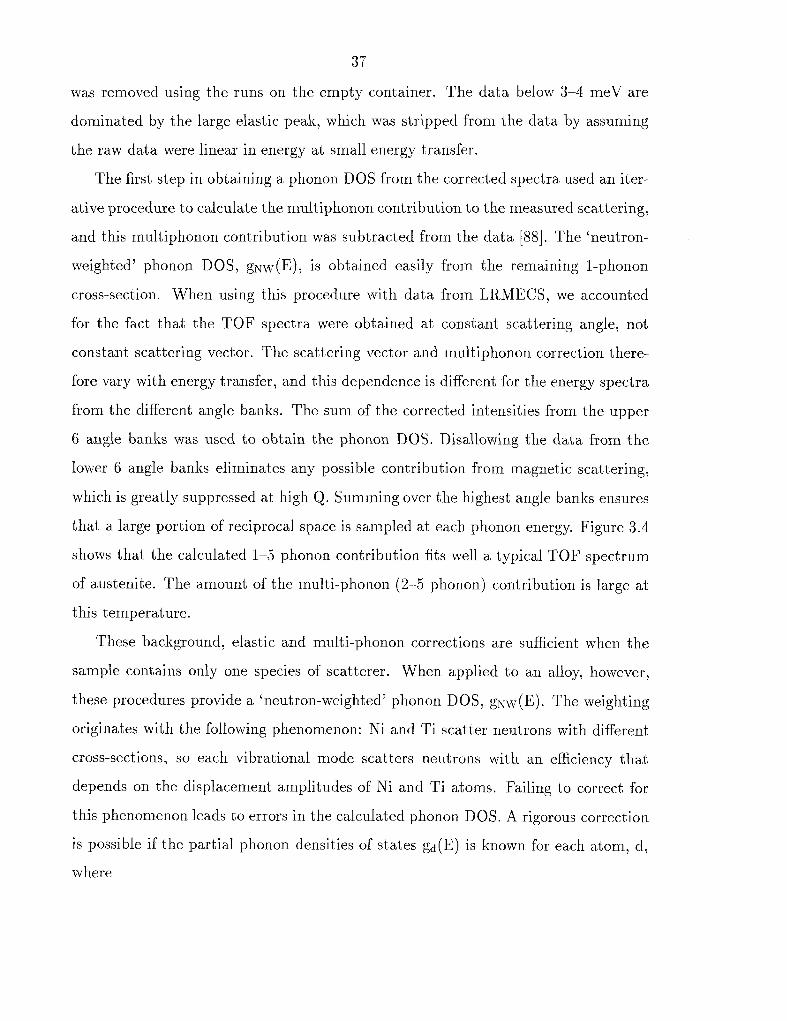
that a large portion of reciprocal space is sampled at each phonon energy. Figure 3.4
shows that the calculated 1-5 phonoli contribution fits well a typical TOF spectrum
of austenite. The amount of the multi-phonon (2-5 phonon) contribution is large at
this temperature.
These background, elastic and multi-phonon corrections are sufficient when the
sample contains only one species of scatterer. When applied to an alloy, however,
these procedures provide a 'neutron-weighted' phonon DOS, gNw(E). The weighting
originates with the following phenomenon: Ni and Ti scatter neutrons with different
cross-sections, so each vibrational mode scatters neutrons with an efficiency that
depends on the displacement amplitudes of Ni and Ti atoms. Failing to correct for
this phenomenon leads to errors in the calculated phonon DOS. A rigorous correction
is possible if the partial phonon densities of states gd(E) is known for each atom, d,
where
Energy Transfer (meV)
Figure 3.4: Raw TOF data compared with the self-convergent multiphonon expansion. The background corrected TOF spectra, at the 1 2 ~ ~ angle bank, of NiTi at 573 K is the bold line. The thin line is the 1-5 phonon contribution as calculated with the procedure of Bogdanoff, Fultz and Rosenkranz [88]. The dashed line is the 2-5 phonon contribution.
and q and j are the phonon wave vectors and polarization branch that specify a
single vibrational mode. Here e$ and wqj are the polarization vector for atom d and
frequency of mode q,j. Note that g(E) = Cdgd(E) but the neutron-weighted phonon
DOS ~ N ~ ( E ) is given by
where exp(-2Wd),gd and md are the Debye-Waller factor, total scattering cross-
section and mass of atom d. The Debye-Waller factor is an explicit function of gd(E).
The term exp(2W) is the average Debye-Waller correction; this is calculated from the
3 9
self-consistent neutron-weighted D 0 s . The factor exp[2(W - Wd)] is approximately
unity. For the case where ad/md is the same for all species d, gNw(E) m g(E). For
the case of NiTi, the quotient of aNi/mNi and aTi/mTi is 3.6, so the correction is
potentially large. We need a correction function F(E), where
The correction function F(E) for the austenite DOS was obtained by a Born-von
KBrmAn lattice dynamics simulation. Such simulations are often used to generate
interatomic force constants by fitting to experimental phonon dispersions. In turn, the
force constants can be used to calculate complete lattice dynamics information for the
crystal, including the partial DOS, the neutron-weighted DOS, and arbitrary phonon
dispersions. The acoustic phonon dispersions in the high symmetry directions are well
documented in the literature [80, 81, 82, 891, and the neutron-weighted phonon DOS
is known from our measurements. These data provide adequate constraints on the
force constants to allow a hybrid least-squares fit procedure. Our model generates the
dispersions of acoustic phonons, which are well-documented, but also generates the
neutron-weighted phonon DOS by sampling the phonon frequencies and polarization
vectors over the irreducible portion of the Brillouin zone of the B2 structure. The best
16 independent force constants out to 4th nearest neighbors are shown in Table 3.2.
These force constants produce a good fit to the neutron-weighted phonon DOS and
a fair fit to the known acoustic dispersions.
Using the force constants of Table 3.2, the correction function F(E) is calculated
from the lattice dynamics simulations by taking the ratio of the real and neutron-
weighted DOS, both of which are generated by the simulation. As with any optimiza-
tion scheme, the uniqueness of the fitted force constants is unclear. Nevertheless, the
shape and magnitude of the calculated F(E) itself proved rather insensitive to the
choice of force constants. This correction function is shown in figure 3.5.
'Previous Born-von KSrmSn simulations [go, 891 have focused exclusively on the acoustic phonon dispersions, and the force constants obtained give very poor results for the optical (high-energy) modes.

Force Const ants (103dyne/cm) Ni-Ni Ti-Ti Ni-Ti
Table 3.2: Best fit Born-von KArmAn force constants to NiTi neutron-weighted phonon DOS.
The correction is physically reasonable. Given the lower mass of Ti compared to
Ni, we expect the higher-energy modes to have more Ti displacements and the lower-
energy modes to have more Ni displacements. Since the scattering is stronger for Ni,
the higher-energy modes are under-emphasized in the neutron-weighted DOS. The
correction, F(E), should enhance the high energy modes at the expense of the low
energy modes. We also expect the correction to become a constant in E at low energies
in the hydrodynamic limit. We use the same F(E) to correct the martensite neutron-
weighted DOS. Although the real correction function for martensite is most likely
different in detail, we note below that the F(E) for austenite is successful in providing
a martensite phonon DOS that is consistent with the heat capacity measurements
on martensite. The corrected and uncorrected (neutron-weighted) martensite DOS
are shown in figure 3.5. The corrected austenite and martensite DOS are shown in
figure 3.6.
As a test for the reliability of applying the austenite correction function to the
g ~ w (E) of the martensite, the heat capacity calculated from the corrected martensite
DOS is shown by the solid curve in figure 3.2. The agreement with the experimental
data is quite good. Herget, et al. [84] measured the neutron-weighted phonon DOS of
Ni50.5Ti49.5 at 200, 296 and 406 K using a TOF spectrometer with an incident neutron
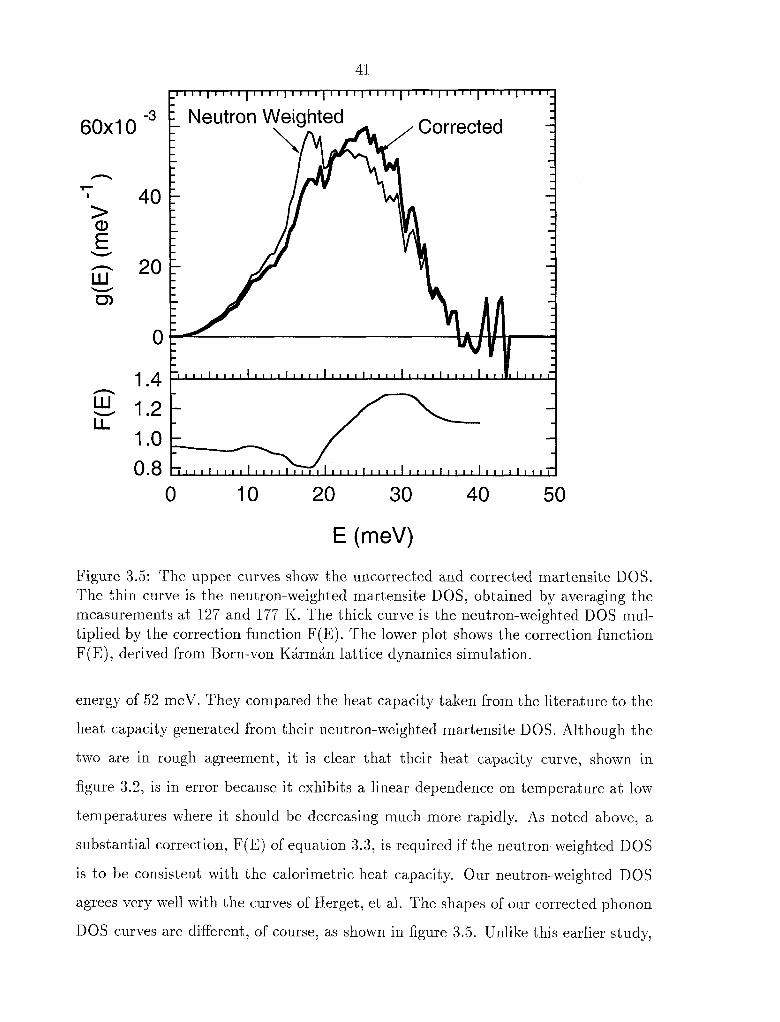
Figure 3.5: The upper curves show the uncorrected and corrected martensite DOS. The thin curve is the neutron-weighted martensite DOS, obtained by averaging the measurements at 127 and 177 K. The thick curve is the neutron-weighted DOS mul- tiplied by the correction function F(E). The lower plot shows the correction function F(E), derived from Born-von KArmAn lattice dynamics simulation.
energy of 52 meV. They compared the heat capacity taken from the literature to the
heat capacity generated from their neutron-weighted martensite DOS. Although the
two are in rough agreement, it is clear that their heat capacity curve, shown in
figure 3.2, is in error because it exhibits a linear dependence on temperature at low
temperatures where it should be decreasing much more rapidly. As noted above, a
substantial correction, F(E) of equation 3.3, is required if the neutron-weighted DOS
is to be consistent with the calorimetric heat capacity. Our neutron-weighted DOS
agrees very well with the curves of Herget, et al. The shapes of our corrected phonon
DOS curves are different, of course, as shown in figure 3.5. Unlike this earlier study,
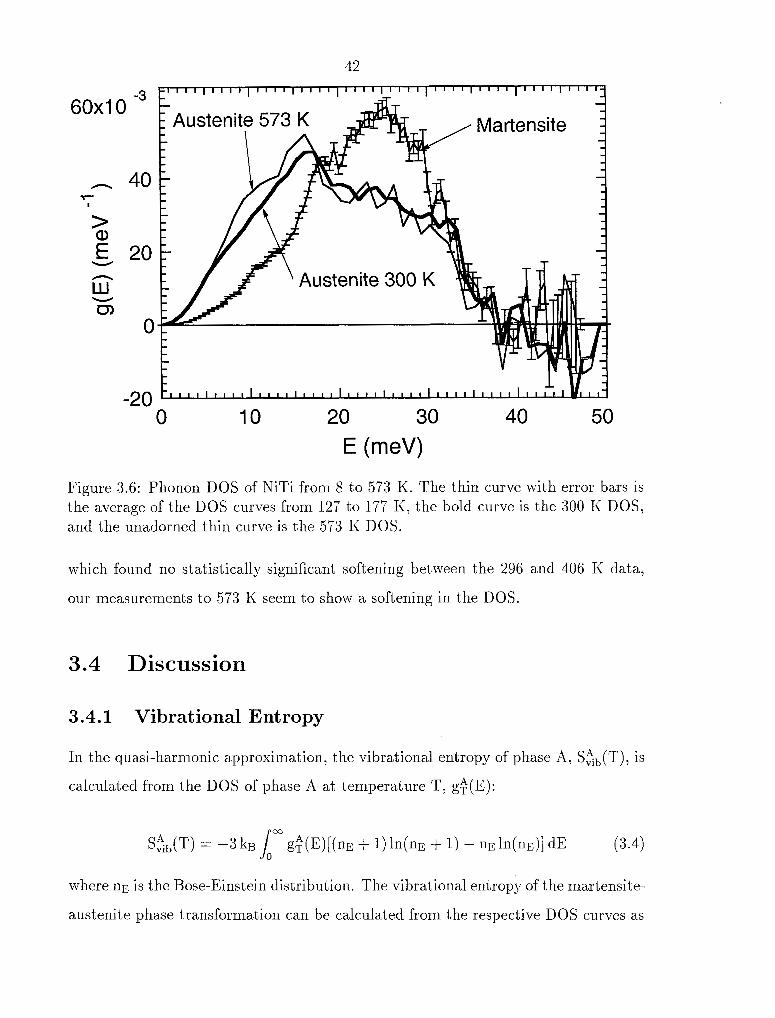
Figure 3.6: Phonon DOS of NiTi from 8 to 573 K. The thin curve with error bars is the average of the DOS curves from 127 to 177 K, the bold curve is the 300 K DOS, and the unadorned thin curve is the 573 K DOS.
which found no statistically significant softening between the 296 and 406 K data,
our measurements to 573 K seem to show a softening in the DOS.
3.4 Discussion
3.4.1 Vibrational Entropy
In the quasi-harmonic approximation, the vibrational entropy of phase A, Sab (T), is
calculated from the DOS of phase A at temperature T, g + ( ~ ) :
where n~ is the Bose-Einstein distribution. The vibrational entropy of the martensite-
austenite phase transformation can be calculated from the respective DOS curves as
austenite martensite as:;a = svib (T,) - svib (T,) (3.5)
where T, is the transformation temperature and S$,(T,) is given by equation 3.4
using g$, (E) of phase A. From the phonon DOS curves of figure 3.6, AS:;" 0.57 k
0.03 kB/atom at 300 K. This value falls within the bounds on ASm-" as measured
by calorimetry (see Table 3.1). Contributions to ASm-" from non-vibrational sources
are either small or mutually-cancelling.
By using phonon DOS curves obtained at different temperatures T, equation 3.4
can account for the anharmonic contributions to the vibrational entropy. For our
two DOS curves of the austenite phase obtained at 300 and 573 K, AS?, can be
calculated as
The anharmonic contribution to the vibrational entropy of an individual phase can
be calculated with the classical formula
where B, u and ,O are the temperature-dependent bulk modulus, specific volume
and coefficient of volume thermal expansion. We evaluated equation 3.7 at 300 K
using our measured coefficients of volume thermal expansion: 36 f 2 x 10⁻⁶K-1 for
austenite and 30 k 2 x 10⁻⁶KE(-1 for martensite. Values for B and v were taken from
the literature [91,92]. Lacking data on the temperature dependence of B, v and P, we
assume them constant. The anharmonic contribution to the total entropy of either
state at 300 K is on the order of 0.02 kB/atom. The anharmonic contribution t o
AS:;" is the difference between two very small numbers, and is negligible. A similar
analysis provides a value of 0.05 ks/atom for the anharmonic vibrational entropy
change in austenite from 300 to 500 K. This anharmonic contribution to the entropy
of the austenite is smaller than that obtained from the phonon DOS. The discrepancy

44
could originate with errors in /3 or in an exaggerated difference between the austenite
phonon DOS at 300 and 570 K.
3.4.2 Premartensitic Phonon Softening
Previous neutron scattering investigations on NiTi have studied the premartensitic
phonon softening of the austenite phase. It was reported that the softest mode in the
[[[O] transverse acoustic (TA2) phonon dispersion branch, the mode at
softens from 4 meV at 623 K to 0 meV as the martensite transformation temperature
is approached upon cooling. Our phonon DOS curves do not show this softening,
but we do not expect to see it. We estimated the number of modes involved in the
softening by assuming they occupied a spherical volume in k-space with a diameter
equal to the width of soft phonons in the [I101 TA2 branch. We find that at most a
half percent of the total number of phonons in NiTi participate in this softening, and
thus the premartensitic phonon softening at ko is imperceptible in the total phonon
DOS. Furthermore, the relevant phonon energies lie entirely beneath the elastic peak
footprint of our TOF data, so the relevant featues would have been eliminated by our
stripping of the elastic peak.
3.4.3 Soft Acoustic Phonons in B2 Austenite
The martensite and austenite have very similar DOS at the highest phonon energies.
The high energy cutoffs are identical, within the limits of experimental resolution.
Our lattice dynamics simulations using the force constants of Table 3.2 show that the
optical phonons do not account for any modes below 20 meV, but account for most
of the modes above this energy. Changes in the optical modes do not have much
thermodynamic significance for the martensitic transformation.
The martensite and austenite DOS differ most significantly in the low-energy
region. The softer acoustic branches in B2 NiTi contribute sufficient entropy to
stabilize the austenite with respect to the martensite at modest temperatures. From
the many studies of soft acoustic modes in the bcc and B2 structures [93, 94, 95,
96, 971, we know that although the TA2 phonon branch at ko undergoes the most
dramatic change near the martensitic transformation, the entire [I101 TA2 phonon
branch undergoes a significant softening with decreasing temperature [80]. According
to Zhao and Harmon [89], the peculiar temperature behavior of this phonon branch
originates with a strong coupling between its phonon modes and nested electronic
states on the Fermi surface. The Fermi surface smearing that occurs with higher
temperatures reduces the strength of the electronic nesting, and thus reduces the
phonon softening. Nevertheless, the difference between the austenite and martensite
DOS shown in figure 3.6 covers the energy range up to 17 meV, which also involves
the longitudinal acoustic (LA) phonon branch.
Our lattice dynamics simulations showed that the [[[O] TA2 dispersion is most
sensitive to the axially-symmetric first nearest-neighbor (Inn) transverse force con-
stant (@?"). In bcc structures, small perturbations in @pn lead to large changes in
the [[to] TA2 dispersions and smaller changes in the other high symmetry acoustic
phonons. In B2 structures the Inn radial force constant, @En, also has a large effect
on the [tt0] LA dispersion, and small effects on the optical modes. Zhao and Har-
mon [89] asserted that only the [[to] TA2 and LA modes couple strongly with the
nested Fermi states in NiTi, which lends credence to the suggestion that the @Yn force
constant displays the strongest temperature dependence in NiTi and related alloys.
This phenomenon can be seen in the data of Heiming and coauthors [98], who mea-
sured phonon dispersions in bcc zirconium at 915, 1210 and 1610 " C, and fitted them
to a 5th nearest-neighbor Born-von KArm&n model. The [[to] TAI dispersion in bcc
Zr shows the same anomalous temperature behavior as in NiTi. Furthermore, exam-
ination of their force constants for Zr, converted from tensorial to axial form, shows
that @?" decreases in the sequence 0.147, 0.543 and 1.215 N/m at 1610, 1210 and
915 " C. In contrast, the first nearest-neighbor radial axial-symmetric force constant
a?" stays unchanged at 24.12, 24.482 and 24.481 N/m over the same temperature
range. The softening of the TA1 and LA branches are visible in the full phonon DOS,
46
with the modes in the lowest energy van-Hove singularity (approximately 10% of the
total) softening 2-3 meV as the temperature decreases, while the rest of the DOS
remains stationary.
Conclusions
Inelastic neutron scattering measurements of the phonon DOS of NiTi were accom-
panied with ancillary measurements of heat capacity and thermal expansion. We
developed a Born-von KArmAn lattice dynamics simulation to calculate a neutron de-
weighting correction for the neutron-weighted austenite DOS. The correction function
proved robust, and reasonably insensitive to the choice of force constants in the lattice
dynamics model. There is a large entropy difference of 0.5 k 0.05 kB/atom between
the austenite and martensite phases at the martensitic transformation temperature of
NiTi. The entropy is nearly all vibrational in origin. More specifically, it originates
with the relative softness of the acoustic modes of austenite compared to those of
martensite. We found that the acoustic phonon branches are most sensitive to the
axially symmetric first nearest-neighbor transverse force constant. Changes in this
@pn could also be responsible for the mode softenings that provide the mechanism
for the martensitic transformation in NiTi and in bcc Zr.
Chapter 4 The Temperature Dependence
of the Phonon Entropy of Vanadium
4.1 Introduction
Although there have been many measurements of macroscopic equations of state of
solids [99], there is, unfortunately, much less experimental data on the temperature
and volume dependence of the phonon density-of-states (DOS). A few studies on the
temperature dependencies of phonon dispersions have been performed [98, 100, 101,
1021, but they were presented in the context of diffusion and kinetic mechanisms
of structural phase transitions, not of phonon thermodynamics. Ultimately there
should be a rationalization of macroscopic equations of state in terms of the specific
changes in phonons and electrons that underlie the relationships between pressure,
temperature, and volume. The present investigation was undertaken to help identify
the individual thermal contributions to the entropy of phonons and electrons.
Calculations of the electron entropy and its effect on heat capacities of transition
metals were reported by Eriksson, Wills and Wallace [7]. By calculating the full
electronic entropy, Sell and using heat capacity data and phonon DOS measurements
in the literature, these authors deduced the phonon anharrnonicity from the simple
relationship for the total entropy, Stat:
where Shar is the harmonic phonon entropy. This Shar originates from the part of
the phonon DOS that is unchanged with temperature. The anharmonic contribution,
Sanh, originates with the temperature-dependence of the phonon DOS, and is typi-
cally represented by cubic and quartic terms in the interatomic potentials that lead to
48
phonon-phonon scattering and shifts in the energies of individual phonon states. The
"quasi-harmonic" approximation used in this paper captures most of the effect of an-
harmonicity on the phonon entropy of a solid. This approximation assumes harmonic
vibrations, but with a phonon DOS characteristic of the elevated temperature.
Vanadium is an ideal element for measuring a phonon DOS because it scatters
neutrons incoherently and has a cubic crystal structure. These properties allow its
phonon density of states (DOS) to be obtained rigorously from inelastic neutron scat-
tering spectra. A recent measurement of the phonon DOS of vanadium at ambient
conditions [I] was undertaken with little complication, and many previous measure-
ments have been performed with generally good success [103, 104, 105, 106, 107, 108,
109, 110, 111, 112, 113, 114, 1151. Using similar techniques, we measured the phonon
DOS of vanadium at 293, 873, 1273 and 1673 K. We assess the thermal broaden-
ing of the phonon DOS, and interpret it as phonon lifetime broadening. We also
assess the temperature dependence of the phonon DOS in terms of the phonon soft-
ening predicted under thermal expansion. This volume dependence of the phonon
DOS overestimates significantly the observed thermal softening of the DOS. A pure
temperature dependence of the phonon DOS, comparable in size to the volume de-
pendence, is deduced. Using phonon data from the literature, we perform similar
assessments of the anharmonic contributions to the entropy of chromium, niobium,
titanium and zirconium.
4.2 Experimental
Vanadium slugs of 99.9% purity were arc melted into 7 button ingots of 10 g mass.
The ingots were stacked vertically within a thin-walled vanadium can to provide a
sample with cylindrical geometry, prior to mounting within an AS Scientific furnace
that was kept under high vacuum for all measurement. Inelastic neutron scattering
spectra were measured on the HB2 and HB1 triple-axis spectrometers at the HF'IR
research reactor at Oak Ridge National Laboratory. The magnitude of the scattering
vector Q and final neutron energy Ef were fixed at 4.6 A-1 and 14.8 meV. The incident
49
neutron energy was varied to provide an energy transfer from 50 to -2 meV. A total of
7 scans on the HB2 spectrometer were taken at temperatures of 293, 873 and 1273 K,
including an empty furnace measurement at 293 K. Two more scans were taken on
the HB1 spectrometer at 293 and 1673K. The spectrometer energy resolution was
estimated as 1 meV.
4.3 Analysis and Results
4.3.1 Phonon Density of States
The individual scans were corrected for the scattering from the furnace using the
empty-can runs. The data below 2meV were dominated by the large elastic peak,
but this peak was easily deleted. The raw data are featureless and linear in energy
transfer at low energies, which allowed for the inelastic portion of the scattering
below 2rneV to be estimated. Data so corrected were analyzed in the incoherent
approximation to obtain the phonon DOS. Our iterative procedure generates a self-
consistent multiphonon scattering contribution, and for an incoherent scatterer with
cubic symmetry it involves no approximations [88]. An advantage of a triple axis
scan is that the scattering vector Q is fixed, so the Q-dependence of the energy
transfer is eliminated. The Q-space is sampled over only a very small range, but for
an incoherently-scattering sample this does not pose a problem, and the phonon DOS
can be extracted reliably. The final phonon DOS curves are shown in figure 4.1.
4.3.2 Vibrational Entropy
In the quasi-harmonic approximation the phonon DOS at temperature T and volume
V, gT,v (E), provides the the phonon entropy at temperature T, SPh(T):
where nE is the Bose-Einstein distribution at temperature T. A generalized version
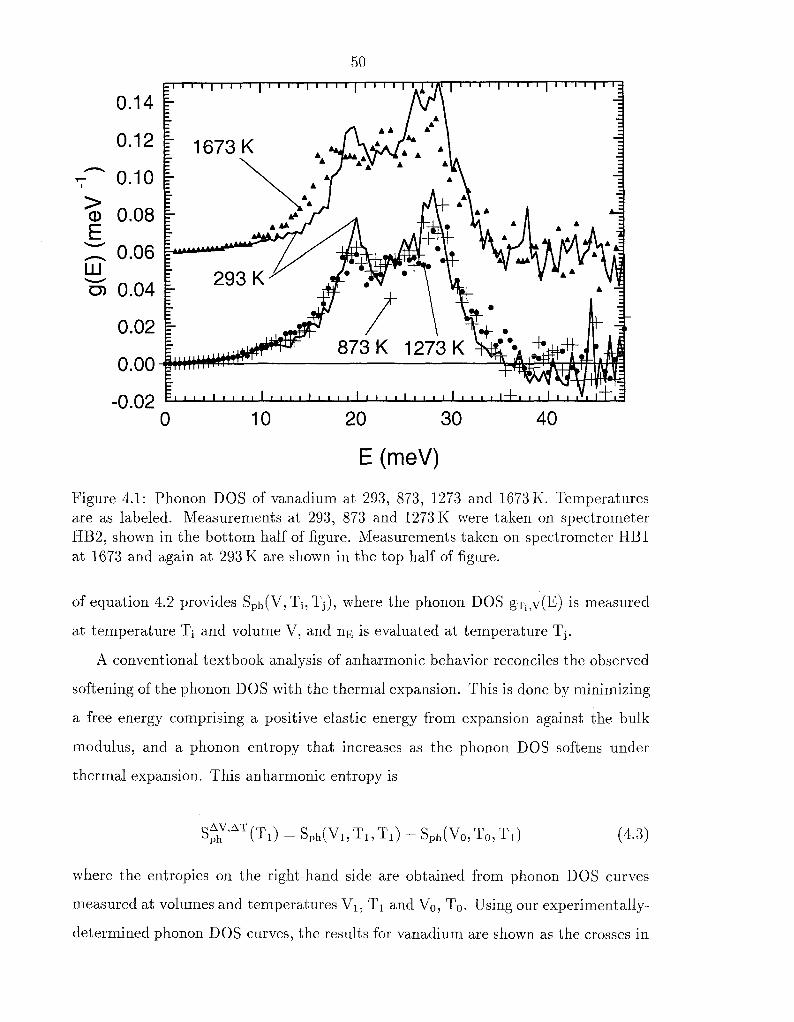
Figure 4.1: Phonon DOS of vanadium at 293, 873, 1273 and 1673 K. Temperatures are as labeled. Measurements at 293, 873 and 1273 K were taken on spectrometer HB2, shown in the bottom half of figure. Measurements taken on spectrometer HB1 at 1673 and again at 293 K are shown in the top half of figure.
of equation 4.2 provides Sph(V, Ti, Tj) , where the phonon DOS gTi,v(E) is measured
at temperature Ti and volume V, and n~ is evaluated at temperature Tj.
A conventional textbook analysis of anharmonic behavior reconciles the observed
softening of the phonon DOS with the thermal expansion. This is done by minimizing
a free energy comprising a positive elastic energy from expansion against the bulk
modulus, and a phonon entropy that increases as the phonon DOS softens under
thermal expansion. This anharmonic entropy is
where the entropies on the right-hand side are obtained from phonon DOS curves
measured at volumes and temperatures V1, TI and Vo, TO. Using our experimentally-
determined phonon DOS curves, the results for vanadium are shown as the crosses in
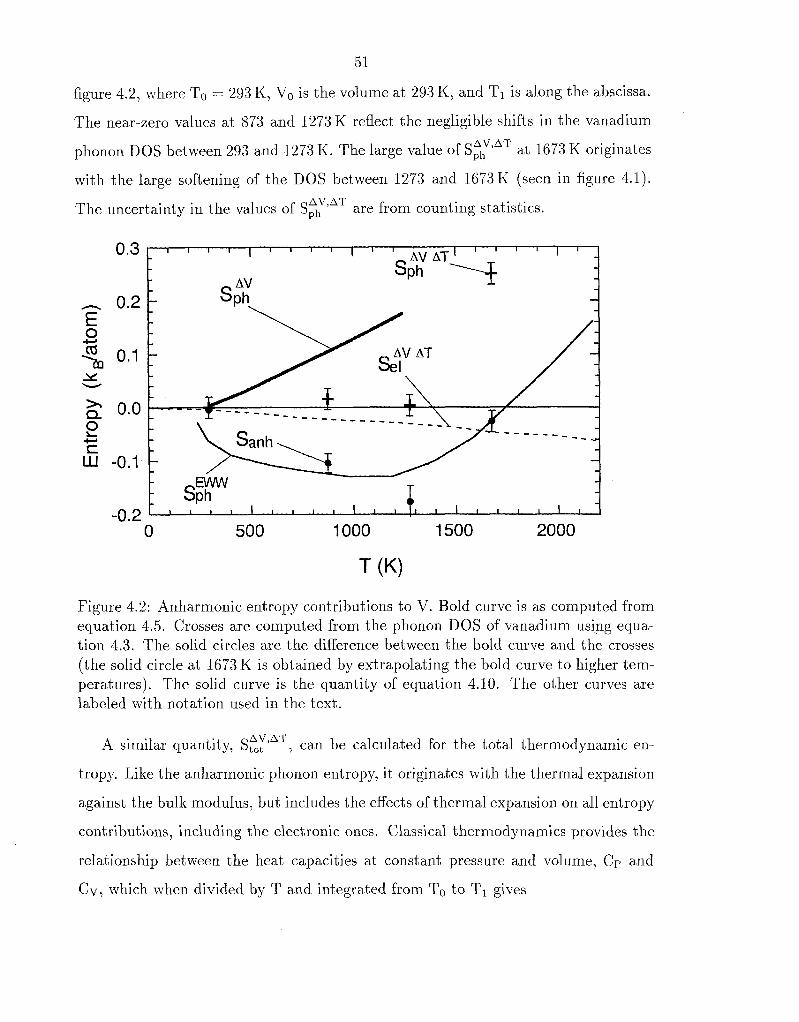
figure 4.2, where To = 293 K, Vo is the volume at 293 K, and T1 is along the abscissa.
The near-zero values at 873 and 1273K reflect the negligible shifts in the vanadium
at 1673 K originates phonon DOS between 293 and 1273 K. The large value of Sph
with the large softening of the DOS between 1273 and 1673K (seen in figure 4.1). AV,AT
The uncertainty in the values of Sph are from counting statistics.
Figure 4.2: Anharmonic entropy contributions to V. Bold curve is as computed from equation 4.5. Crosses are computed from the phonon DOS of vanadium using equa- tion 4.3. The solid circles are the difference between the bold curve and the crosses (the solid circle at 1673 K is obtained by extrapolating the bold curve to higher tem- peratures). The solid curve is the quantity of equation 4.10. The other curves are labeled with notation used in the text.
A similar quantity, s;:'*~, can be calculated for the total thermodynamic en-
tropy. Like the anharmonic phonon entropy, it originates with the thermal expansion
against the bulk modulus, but includes the effects of thermal expansion on all entropy
contributions, including the electronic ones. Classical thermodynamics provides the
relationship between the heat capacities at constant pressure and volume, Cp and
Cv, which when divided by T and integrated from To to T1 gives

where B, v and /3 are, respectively, the bulk modulus, the specific volume and the
coefficient of volume thermal expansion. The quantity St,t(V, T) is the total entropy
at volume V and temperature T, and V(P, TI) is the volume at fixed pressure P and
temperature TI. Thus V1 = V(P, TI) and Vo = V(P, To). Equation 4.4 accounts for
the volume dependence of the total entropy, not just the phonon entropy. Subtracting
we obtain: an electronic contribution, Sel
T1 AV,AT Sph(V1, TI) - Sph(V01 TI) = / B V PZ dT - Sel
To (4.5)
We rewrite equation 4.5 with the generalized notation presented earlier:
is the difference in electronic entropy at constant The electronic term, Sel
pressure versus constant volume over the temperature range AT. It is obtained by
comparing the electronic density of states at Val To with that at V1, T1. This elec-
tronic term is typically small compared to the total anharmonic entropy, and can
have either positive or negative sign. Evaluating S F for elemental vanadium using
variables taken from the literature [75], we obtain the bold curve in figure 4.2. The
electronic term in equation 4.5 was calculated using the electronic Gruneisen param-
eters provided by Eriksson, Wills and Wallace [7], with the experimental thermal
expansion. It is shown as the dashed curve in figure 4.2.
The discrepancy between the bold curve and the crosses on figure 4.2 is quite
large up to 1273 K. A comparison of equations 4.7 and 4.3 shows that the discrepancy
between S~:"~(T~) and Sfc(Tl) likely originates with the difference between the
quantities Sph(Vo, TI, TI ) and Sph(Vo, To, TI) . The significance of this difference is
5 3
discussed in section 4.4.2.
4.3.3 Phonon Broadening
One effect of temperature on phonons is to reduce their lifetimes, and thus broaden
their energies. This is commonly attributed to increased phonon-phonon scatter-
ing due to the increase in phonon occupations at high temperature. This energy
broadening is observed in the DOS as a general smearing of features such as van
Hove singularities and the high energy cutoff 11161. The energy broadening of a sin-
gle phonon mode at energy 6 is expected to have the form of a damped harmonic
oscillator, D,, (c)
The only free parameter in equation 4.8 is Q , the quality factor of the oscillator.
Convolving equation 4.8 with the DOS obtained at the lowest temperature of 293 K,
we adjusted Q to give the best fit to the DOS obtained at 873 and 1273 K. Figure 4.3
shows the excellent agreement between the measured 873 and 1273 K DOS curves and
the best fits generated by broadening the 293 K DOS with equation 4.8. Figure 4.4
shows the optimal (inverse) Q versus temperature. The behavior of inverse Q as
a function of temperature shows a large broadening of phonon energy with rising
temperature, but we cannot state conclusively that the temperature dependence is
linear or quadratic.
4.4 Discussion
4.4.1 Phonon DOS Curves
Figure 4.5 shows that our phonon DOS of vanadium at 293K agrees well with the
earlier result of Sears, Svensson and Powell [I]. We do not find the small peak at
5 meV seen by Sears, et al., but this is a small feature about which these investigators
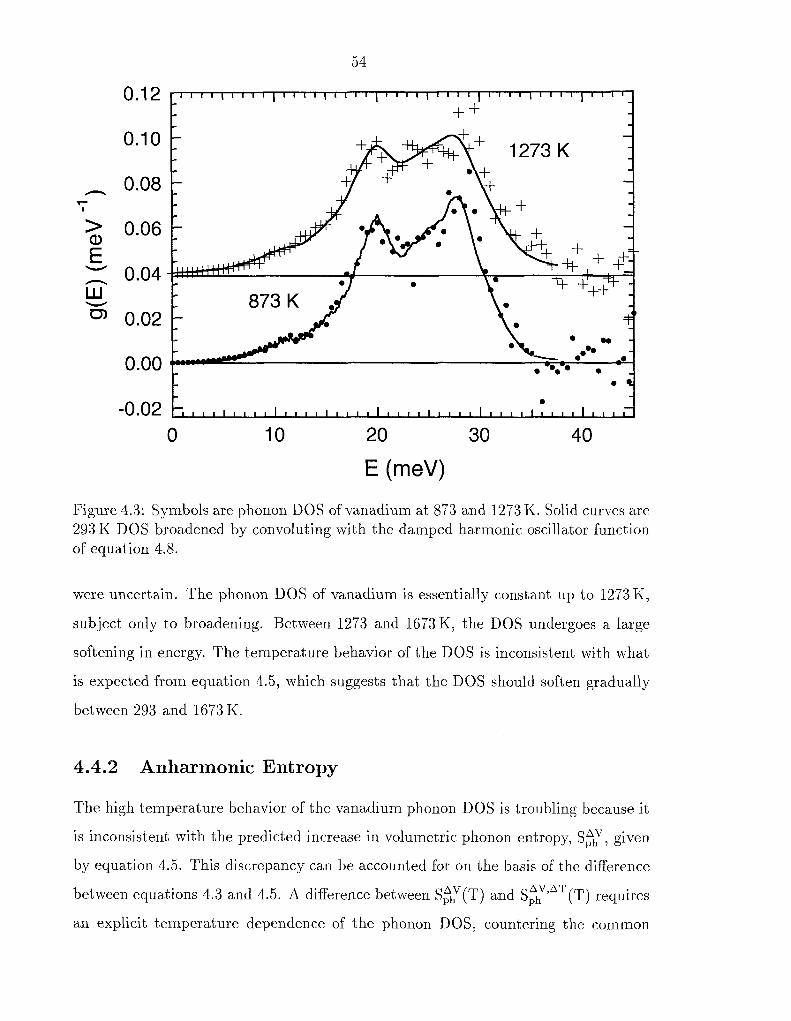
Figure 4.3: Symbols are phonon DOS of vanadium at $73 and 1273 K. Solid curves are 293 K DOS broadened by convoluting with the damped harmonic oscillator function of equation 4.8.
were uncertain. The phonon DOS of vanadium is essentially constant up to 1273 K,
subject only to broadening. Between 1273 and 1673 K, the DOS undergoes a large
softening in energy. The temperature behavior of the DOS is inconsistent with what
is expected from equation 4.5, which suggests that the DOS should soften gradually
between 293 and 1673 K.
4.4.2 Anharmonic Entropy
The high temperature behavior of the vanadium phonon DOS is troubling because it
is inconsistent with the predicted increase in volumetric phonon entropy, St:, given
by equation 4.5. This discrepancy can be accounted for on the basis of the difference
between equations 4.3 and 4.5. A difference between S ~ ( T ) and s ~ : ' ~ ~ ( T ) requires
an explicit temperature dependence of the phonon DOS, countering the common
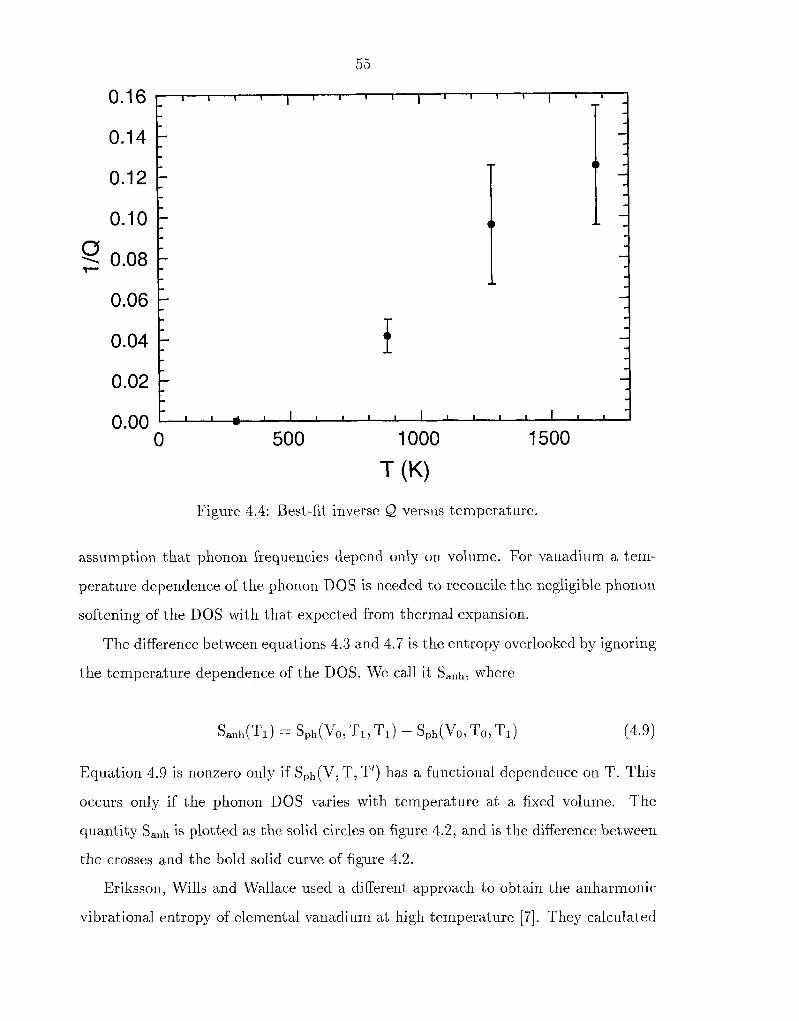
Figure 4.4: Best-fit inverse Q versus temperature.
assumption that phonon frequencies depend only on volume. For vanadium a tem-
perature dependence of the phonon DOS is needed to reconcile the negligible phonon
softening of the DOS with that expected from thermal expansion.
The difference between equations 4.3 and 4.7 is the entropy overlooked by ignoring
the temperature dependence of the DOS. We call it Sanh, where
Equation 4.9 is nonzero only if Sph(V, T, T') has a functional dependence on T. This
occurs only if the phonon DOS varies with temperature at a fixed volume. The
quantity Sanh is plotted as the solid circles on figure 4.2, and is the difference between
the crosses and the bold solid curve of figure 4.2.
Eriksson, Wills and Wallace used a different approach to obtain the anharmonic
vibrational entropy of elemental vanadium at high temperature [7]. They calculated
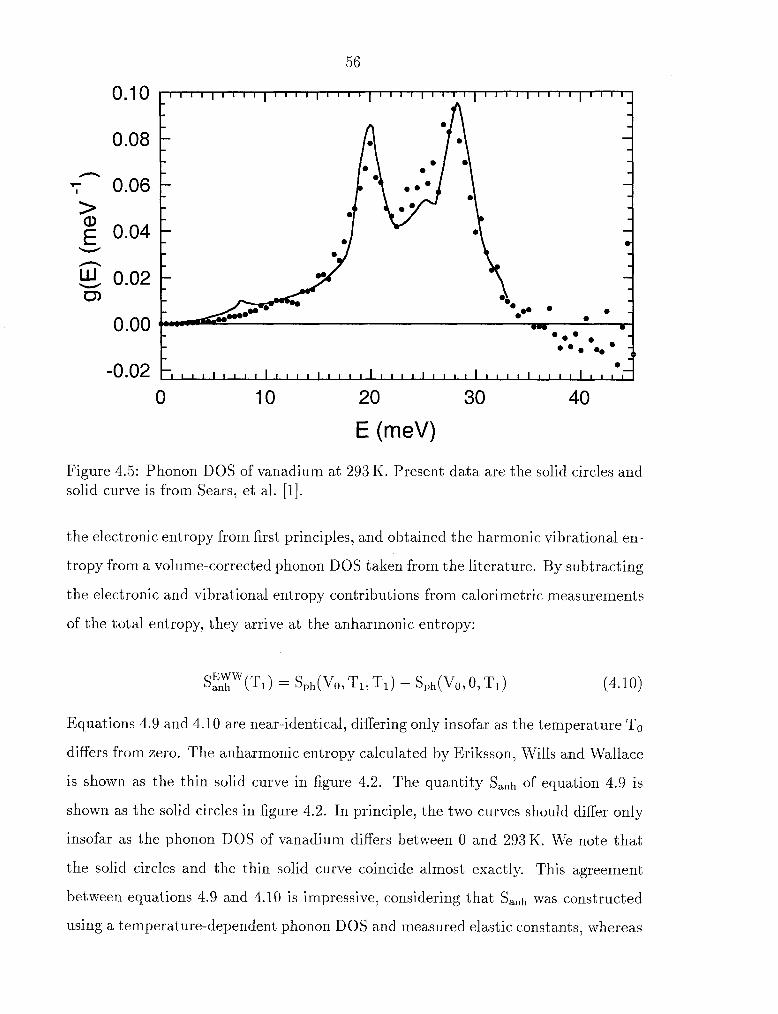
Figure 4.5: Phonon DOS of vanadium at 293 K. Present data are the solid circles and solid curve is from Sears, et al. [I].
the electronic entropy from first principles, and obtained the harmonic vibrational en-
tropy from a volume-corrected phonon DOS taken from the literature. By subtracting
the electronic and vibrational entropy contributions from calorimetric measurements
of the total entropy, they arrive at the anharmonic entropy:
EWW Sanh (TI ) = Sph(Vo, TI, TI) - Sph(Vo,O, T I ) (4.10)
Equations 4.9 and 4.10 are near-identical, differing only insofar as the temperature To
differs from zero. The anharmonic entropy calculated by Eriksson, Wills and Wallace
is shown as the thin solid curve in figure 4.2. The quantity Sanh of equation 4.9 is
shown as the solid circles in figure 4.2. In principle, the two curves should differ only
insofar as the phonon DOS of vanadium differs between 0 and 293K. We note that
the solid circles and the thin solid curve coincide almost exactly. This agreement
between equations 4.9 and 4.10 is impressive, considering that Sanh was constructed
using a temperature-dependent phonon DOS and measured elastic constants, whereas
5 7
S:lW was derived from heat capacity data and electronic structure calculations. The
calculation by Eriksson, Wills and Wallace even captures the large softening of the
phonon DOS near 1673 K - Eriksson's curve goes from negative to positive near this
temperature.
Eriksson, Wills and Wallace's work lends support to our assertion that the sta-
tionary behavior of the phonon DOS of vanadium up to 1273K is caused by a pure
temperature dependence of the phonon energies. The strongly-positive bold curve
in figure 4.2 (from classical thermodynamics with a small correction for electronic
entropy) shows that expanding the crystal volume at constant temperature causes a
softening of the phonon DOS. The phonon DOS of vanadium is nearly unchanged
up to 1273 K, however, even though the cryst a1 expands. We therefore conclude that
the volurne and temperature effects on the phonon energies are nearly equal and op-
posite from 293 to 1273 K. The phonon DOS of vanadium hardens with increasing
temperature at fixed volume. The most likely source of a pure temperature effect on
EWW EWW the phonon energies is phonon-phonon scattering because Sanh N Sanh , and Sanh
is unambiguously identified as originating with phonon anharmonicity.
4.4.3 Chromium, Niobium, Titanium and Zirconium
Results from a number of investigations performed over the past decade suggest sim-
ilar or related behavior in other bcc transition metals at high temperature. The
behavior of the phonon DOS of chromium, titanium, niobium and zirconium at high
temperature are all in disagreement from what is expected from measured thermal
expansions, even when corrected for the electronic entropy. These discrepancies can
be quantified by taking the difference of equations 4.7 and 4.3. This difference is
Sanh, as calculated in equation 4.9. The values of Sanh for these elements, shown on
figure 4.6, are nonzero and increase monotonically with temperature.
A high-temperature DOS consistent with equation 4.5 would yield negligibly small
values of Sanh. Evaluating equation 4.5 required the use of thermal expansion coeffi-
cients taken from the literature [75] and elastic constants extracted from the phonon
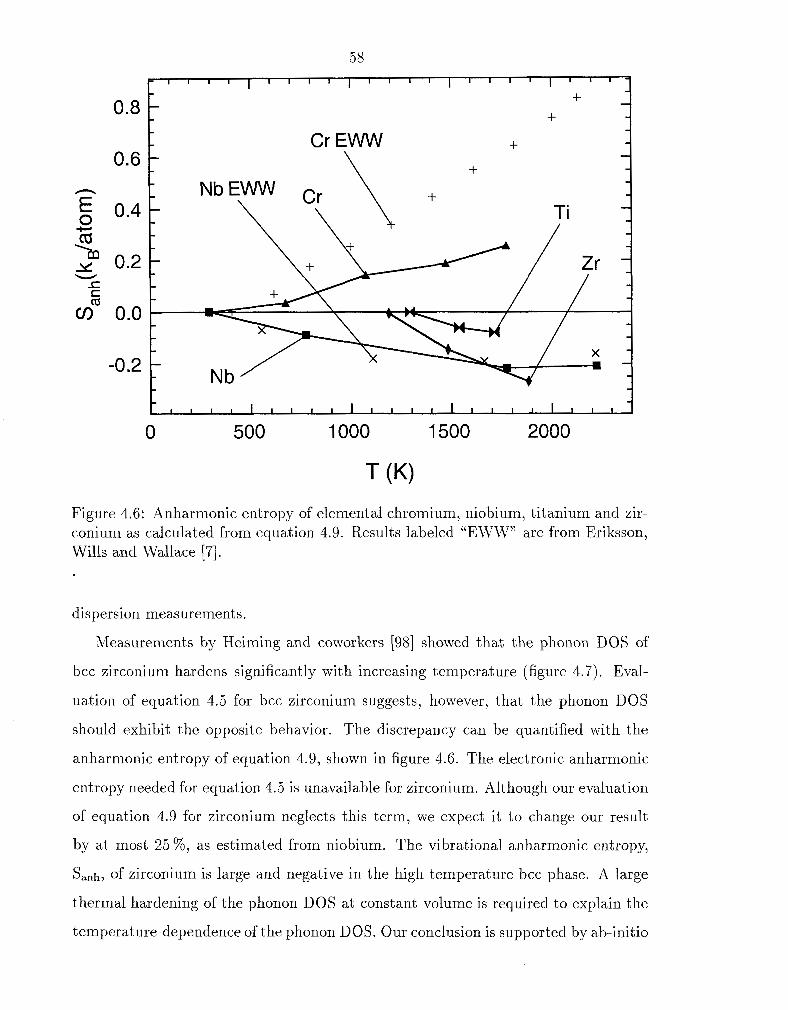
Figure 4.6: Anharmonic entropy of elemental chromium, niobium, titanium and zir- conium as calculated from equation 4.9. Results labeled "EWW" are from Eriksson, Wills and Wallace [7].
dispersion measurements.
Measurements by Heiming and coworkers [98] showed that the phonon DOS of
bcc zirconium hardens significantly with increasing temperature (figure 4.7). Eval-
uation of equation 4.5 for bcc zirconium suggests, however, that the phonon DOS
should exhibit the opposite behavior. The discrepancy can be quantified with the
anharmonic entropy of equation 4.9, shown in figure 4.6. The electronic anharmonic
entropy needed for equation 4.5 is unavailable for zirconium. Although our evaluation
of equation 4.9 for zirconium neglects this term, we expect it to change our result
by at most 25 %, as estimated from niobium. The vibrational anharmonic entropy,
Sanh, of zirconium is large and negative in the high temperature bcc phase. A large
thermal hardening of the phonon DOS at constant volume is required to explain the
temperature-dependence of the phonon DOS. Our conclusion is supported by ab-initio
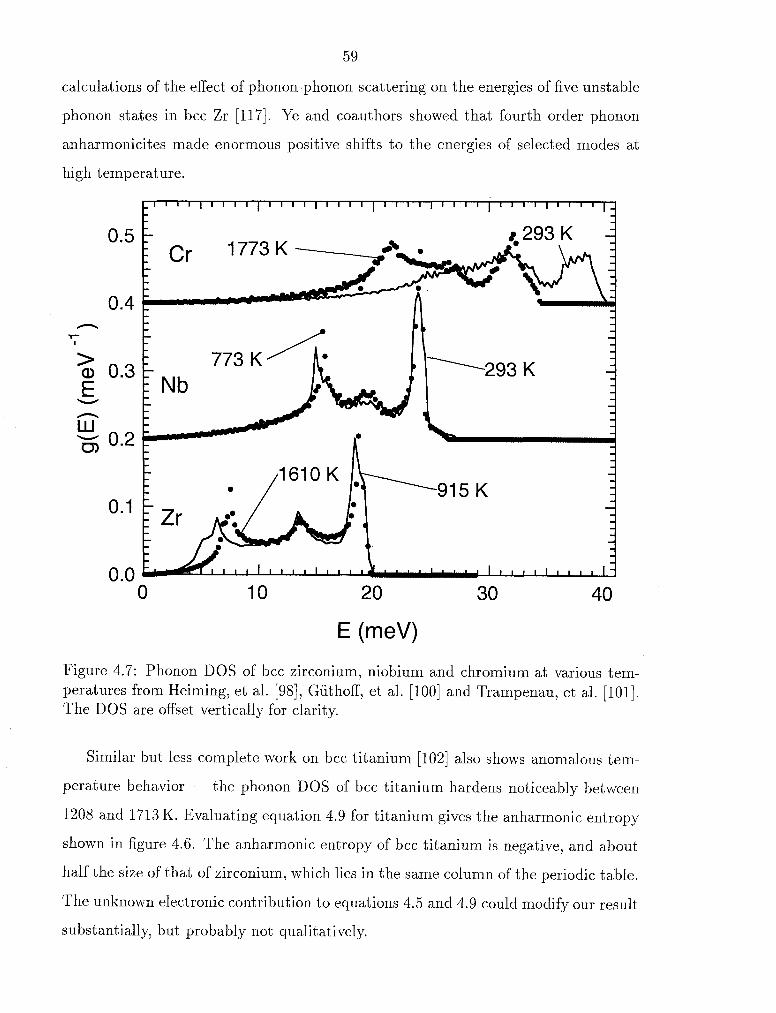
calculations of the effect of phonon-phonon scattering on the energies of five unstable
phonon states in bcc Zr [117]. Ye and coauthors showed that fourth order phonon
anharmonicites made enorlnous positive shifts to the energies of selected modes at
high temperature.
Figure 4.7: Phonon DOS of bcc zirconium, niobium and chromium at various tem- peratures from Heiming, et al. [98], Giithoff, et al. [loo] and Trampenau, et al. [loll. The DOS are offset vertically for clarity.
Similar but less complete work on bcc titanium [I021 also shows anomalous tem-
perature behavior - the phonon DOS of bcc titanium hardens noticeably between
1208 and 1713 K. Evaluating equation 4.9 for titanium gives the anharmonic entropy
shown in figure 4.6. The anharmonic entropy of bcc titanium is negative, and about
half the size of that of zirconium, which lies in the same column of the periodic table.
The unknown electronic contribution to equations 4.5 and 4.9 could modify our result
substantially, but probably not qualitatively.
6 0
The phonon dispersions and DOS of bcc niobium at high temperature are also
available from the literature [loo]. A close examination of the temperature-dependent
DOS in bcc niobium, reproduced in figure 4.7, shows that many acoustic modes
near 15 meV harden significantly between 293 and 773 K. Accordingly, the agreement
between equations 4.5 and 4.3 is poor, and the anharmonic entropy calculated with
equation 4.9 is substantially negative. The electronic contribution to equation 4.5 was
calculated using the DOS and electronic Griineisen parameters ~rovided by Eriksson,
Wills and Wallace (71. Our result is in excellent agreement with the previous estimates
by Eriksson, Wills and Wallace [7], as marked in figure 4.6. The temperature behavior
of the niobium DOS is very similar to that of vanadium, with little change up to
1000 K. (Vanadium and niobium both lie in the same column of the periodic table.)
The case of niobium is important because it points out that the average phonon
energy shifts, as inferred by evaluating equations 4.5 and 4.9, can be quite different
from the energy shifts of individual phonon modes. For the case of bcc niobium, a
large number of transverse phonons harden with temperature, but a similar number of
longitudinal phonons soften with temperature, leading to zero average shift of phonon
energies.
The phonon DOS of bcc chromium has been measured from 293 to 1773 K [loll. In
contrast with zirconium and titanium, the DOS of chromium softens enormously over
this temperature range, as shown in figure 4.7. The anharmonic vibrational entropy as
calculated with equation 4.3 is twice as large as that calculated from equation 4.5. The
discrepancy is accounted for by the explicit temperature dependence of the phonon
energies. For chromium, however, this is a pure thermal softening of the DOS, instead
of the hardening that occurs for vanadium, niobium, zirconium and titanium. The
anharmonic entropy of bcc chromium as given by equation 4.10 was calculated by
Eriksson, Wills and Wallace [7], and is shown in figure 4.6 as solid crosses. The
electronic contribution to equation 4.5 was calculated using the DOS and electronic
Griineisen parameters provided by Eriksson, Wills and Wallace [7]. The anharmonic
entropy calculated using equation 4.9 is shown in figure 4.6. Our result is half that
obtained by Eriksson, et al., but we are encouraged by the agreement in sign and

61
magnitude. Perhaps local magnetic effects play a role in the thermodynamics of
chromium, even at these high temperatures.
4.5 Conclusions
The phonon DOS of bcc vanadium was measured using the time-of-flight triple axis
spectrometers on the HB2 and HBl beam lines on the HFIR reactor at the Oak
Ridge National Laboratory. The DOS showed little change up to 1273 K, and a
large softening at 1673K. The behavior of the phonon DOS leads us to conclude
that volume expansion and rising temperature exert equal and opposite shifts in the
phonon energies up to 1273K. In practice, the phonon DOS depends as strongly on
temperature as it does on volume. The most likely physical explanation for this pure
temperature dependence is phonon-phonon scattering. Similar effects are also found
by analyzing previous high-temperature data on bcc chromium, zirconium, niobium
and titanium.
4.6 Acknowledgements
This work was supported by the U.S. Department of Energy under contract DE-
FG03-96ER45572 and BES-MS, W-31-109-ENG-38.
Chapter 5 The Vibrational Entropy of
Alloying and Ordering in Cu-Au
5.1 Introduction
5.1 .I Alloying in Cu-Au
The Cu-Au binary alloy system has long been of interest in the study of metals.
Cu and Au form a face-centered cubic (fcc) single-phase solid solution at arbitrary
compositions. Near the compositions CusAu, CuAu and CuAus the stable phase
at low-temperature is a chemically ordered one: L l o for CuAu and L12 for the re-
maining two. The chemical ordering can be suppressed by quenching the alloys from
high temperature. The ordering transformations in Cu-Au have made it a model
system for both theoretical and experimental studies of ordering. Early interest in
ordering has also led to the study of many different properties in Cu-Au: elastic
constants [llS], heat capacity [I191 and lattice dynamics [56]. These studies have
focused upon the differences between the ordered and disordered phases at specific
compositions. Among these studies is a recent measurement of the vibrational en-
tropy of ordering in Cu3Au using low-temperature heat capacity [37]. There has been
no study focused exclusively on the vibrational entropy of the chemically disordered
phase. The presence of a common chemically disordered phase throughout the phase
diagram of Cu-Au allows for a model experiment: we can measure the composition
dependence of the vibrational entropy in the absence of changes in crystal structure
and chemical order. Because this phase is chemically-disordered, the study offers
challenges and opportunities.
The presence of chemical disorder presents enormous difficulties to computational
and theoretical studies. Without long-range chemical order, Blochis theorem no
6 3
longer applies and states (electronic and vibrational) can no longer be labeled by
wave-vector. Without the simplifications allowed for by Bloch's theorem, and in the
presence of unknown local relaxations, true ab-initio calculations are prohibitively ex-
pensive and methodologically uncertain. Presently, ab-initio efforts to calculate the
electronic energy (a pre-requisite to calculating the phonon energies) of the disordered
phase use a number of approximations. Approximations such as the special quasi-
random structure (SQS) [14] or the cluster variation model [lo] attempt to match the
short-range chemical correlations present in the disordered phase using calculations
done on chemically ordered phases. These approaches introduce errors of unknown
magnitude because not all chemical correlations are included in the matching process.
Empirical models such as the embedded-atom method (EAM) overcome these obsta-
cles by performing calculations on large chemically disordered supercells, including
local relaxations. However, these calculations are only as good as the potential model
being used. Typically, the EAM method gives good results for some alloy proper-
ties but poor results for others. In the absence of a reliable theory, experiments on
chemically-disordered alloys are especially important.
The measurement of the vibrational entropy in chemically-disordered Cu-Au pre-
sents challenges not encountered in chapters 2, 3 and 4. The presence of chemical
disorder disallows the use of a Born-von K&rm&n model to extract the DOS and
entropy from triple-axis measurements of the phonon dispersions, as was done in
chapter 2. Cu and Au are strong coherent scatterers of neutrons, and this prevents us
from measuring the phonon DOS directly using a triple-axis spectrometer, as we did
in chapter 4. In this alloy system with strong chemical disorder, the instrument of
choice is a time-of-flight (TOF) spectrometer. However, Cu phonons scatter neutrons
more than three times as efficiently as Au phonons, which gives rise to the problematic
neutron-weight correction to the phonon DOS. A very similar difficulty was observed
in chapter 3 with NiTi, which was solved using Born-von KArm&n lattice dynamics to
estimate the neutron-weight correction. The presence of chemical disorder prevents
us from following the same approach with Cu-Au. Much of this chapter is devoted
to developing a reliable methodology for deriving the vibrational entropy from the
64
neutron-weighted phonon DOS. In the process, we learn much about the composition
dependence of the partial vibrational entropies of Cu and Au.
5.1.2 Ordering in Cu3Au
Alloys near the composition Cu3Au undergo an order-disorder transition at high tem-
perature. The low-temperature phase has the ordered L12 structure, while the high
temperature phase is a chemically disordered face-centered cubic (fcc) phase. In both
cases the parent lattice is fcc. The first-order transition from chemical order to dis-
order occurs at 390 "C. This critical temperature (T,) is determined by the energy
and entropy difference between the two phases. The energy difference between the
two phases can be estimated by modern electronic structure calculations (more accu-
rately for the ordered than disordered phase), and the configurational entropy is well
understood through cluster-variation calculations or Monte-Carlo simulations. The
vibrational component of the transit ion entropy, A S O , ~ ~ , is less accessible by theory.
Nagel, Anthony and Fultz obtained a AS:;: value of 0.14 f 0.05 ks/atom at 300K
using low-temperature calorimetry, where
and Sdis, Sord are the entropies of the disordered and ordered phases. Using a Born-
von Kiirmiin model with force constants taken from phonon dispersion measurements
of the ordered and disordered phases [56], the phonon entropy difference AS::: is
estimated as 0.23 ks/atom at 300 K. This measurement by Kat ano is the most direct,
yet suffers seriously from the use of the virtual-crystal approximation to interpret
the disordered phase lattice dynamics within the Born-von Kiirmiin model. The
calorimetric measurement has a large uncertainty that stems from the difficulty of
measuring the difference in heat capacities of the two phases. Ozolipi, Wolverton
and Zunger calculated a AS:!: value of 0.06 ks/atom at 300 K using the cluster-
variation method to model the vibrational entropy of the disordered phase from ab-
inito calculations of the lattice dynamics of ordered Cu-Au phases. Both experiment a1
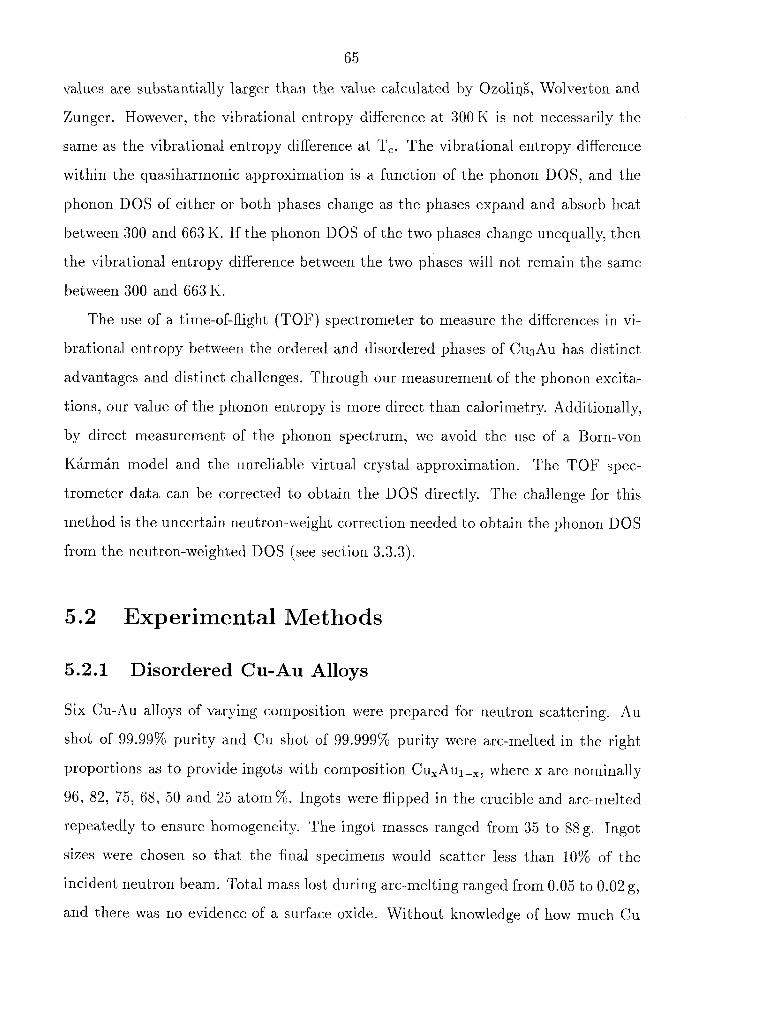
values are substantially larger than the value calculated by Ozoliqg, Wolverton and
Zunger. However, the vibrational entropy difference at 300 K is not necessarily the
same as the vibrational entropy difference at T,. The vibrational entropy difference
within the quasiharmonic approximation is a function of the phonon DOS, and the
phonon DOS of either or both phases change as the phases expand and absorb heat
between 300 and 663 K. If the phonon DOS of the two phases change unequally, then
the vibrational entropy difference between the two phases will not remain the same
between 300 and 663 K.
The use of a time-of-flight (TOF) spectrometer to measure the differences in vi-
brational entropy between the ordered and disordered phases of Cu3Au has distinct
advantages and distinct challenges. Through our measurement of the phonon excita-
tions, our value of the phonon entropy is more direct than calorimetry. Additionally,
by direct measurement of the phonon spectrum, we avoid the use of a Born-von
KArmAn model and the unreliable virtual crystal approximation. The TOF spec-
trometer data can be corrected to obtain the DOS directly. The challenge for this
method is the uncertain neutron-weight correction needed to obtain the phonon DOS
from the neutron-weighted DOS (see section 3.3.3).
5.2 Experimental Methods
5.2.1 Disordered Cu-Au Alloys
Six Cu-Au alloys of varying composition were prepared for neutron scattering. Au
shot of 99.99% purity and Cu shot of 99.999% purity were arc-melted in the right
proportions as to provide ingots with composition Cu,Aul-,, where x are nominally
96, 82, 75, 68, 50 and 25 atom %. Ingots were flipped in the crucible and arc-melted
repeatedly to ensure homogeneity. The ingot masses ranged from 35 to 88g. Ingot
sizes were chosen so that the final specimens would scatter less than 10% of the
incident neutron beam. Total mass lost during arc-melting ranged from 0.05 to 0.02 g,
and there was no evidence of a surface oxide. Without knowledge of how much Cu
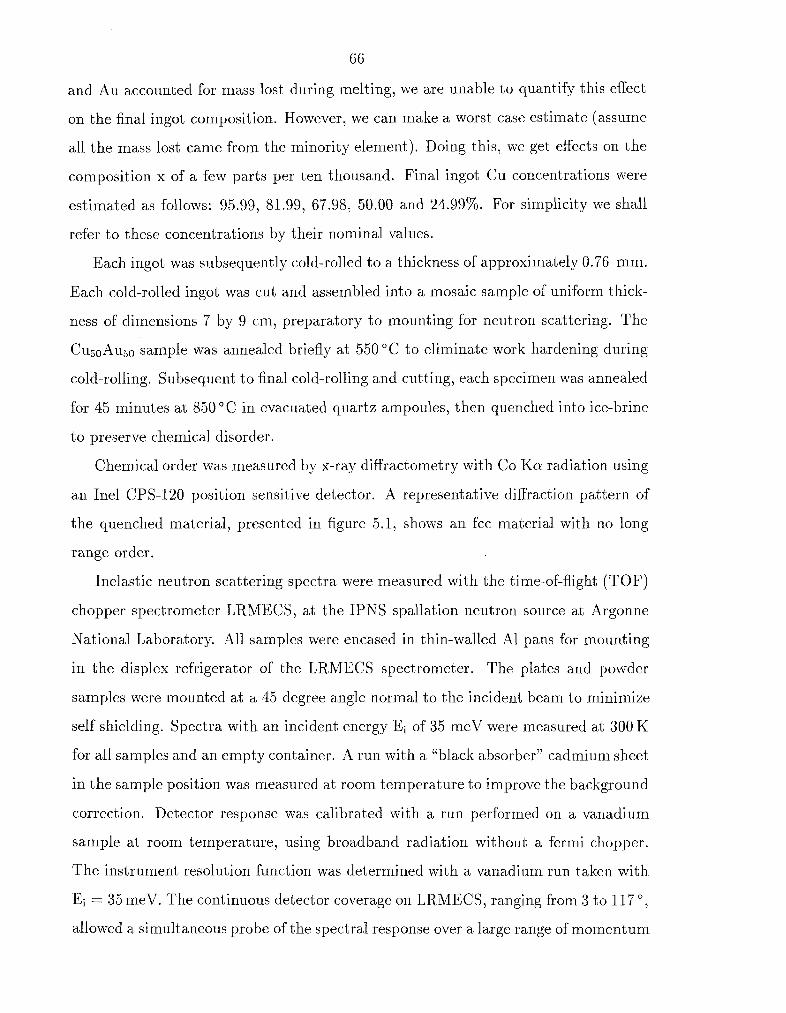
66
and Au accounted for mass lost during melting, we are unable to quantify this effect
on the final ingot composition. However, we can make a worst case estimate (assume
all the mass lost came from the minority element). Doing this, we get effects on the
composition x of a few parts per ten thousand. Final ingot Cu concentrations were
estimated as follows: 95.99, 81.99, 67.98, 50.00 and 24.99%. For simplicity we shall
refer to these concentrations by their nominal values.
Each ingot was subsequently cold-rolled to a thickness of approximately 0.76 mm.
Each cold-rolled ingot was cut and assembled into a mosaic sample of uniform thick-
ness of dimensions 7 by 9 cm, preparatory to mounting for neutron scattering. The
Cu50A~50 sample was annealed briefly at 550 OC to eliminate work hardening during
cold-rolling. Subsequent to final cold-rolling and cutting, each specimen was annealed
for 45 minutes at 850 C in evacuated quartz ampoules, then quenched into ice-brine
to preserve chemical disorder.
Chemical order was measured by x-ray diffractometry with Co K a radiation using
an Inel CPS-120 position sensitive detector. A representative diffraction pattern of
the quenched material, presented in figure 5.1, shows an fcc material with no long
range order.
Inelastic neutron scattering spectra were measured with the time-of-flight (TOF)
chopper spectrometer LRMECS, at the IPNS spallation neutron source at Argonne
National Laboratory. All samples were encased in thin-walled A1 pans for mounting
in the displex refrigerator of the LRMECS spectrometer. The plates and powder
samples were mounted at a 45 degree angle normal to the incident beam to minimize
self shielding. Spectra with an incident energy E; of 35 meV were measured at 300 K
for all samples and an empty container. A run with a "black absorber" cadmium sheet
in the sample position was measured at room temperature to improve the background
correction. Detector response was calibrated with a run performed on a vanadium
sample at room temperature, using broadband radiation without a fermi chopper.
The instrument resolution function was determined with a vanadium run taken with
E; = 35 meV. The continuous detector coverage on LRMECS, ranging from 3 to 117 O ,
allowed a simultaneous probe of the spectral response over a large range of momentum

Channel
Figure 5.1 : X-ray diffraction pat terns of disordered C U ~ ~ A U ~ ~ . Peak diffraction indices are labeled.
and energy transfer ( K , &w), with I K ( w ) 1 varying between 0.2 and 7 A-1 at zero energy
transfer.
5.2.2 Ordered Cu3.Au
Neutron scattering spectra were measured on ordered and disordered CusAu using
the same neutron TOF spectrometer with the same incident neutron energy. Repre-
sentative x-ray diffraction patterns are shown in figure 5.2. The presence of the extra
(100)-family of superlattice diffractions is evident in the ordered family.
Figure 5.2: X-ray diffraction patterns of ordered and disordered Cu3Au.
5.3 Analysis and Results
5.3.1 PhononDensityofStates
All TOF spectra were first normalized and corrected for detector efficiency and time-
independent background following standard procedures. In this step, the detectors
were combined into groups spanning 10 O each with average angles from 5 to 115 O. The
scattering contribution of the container and spectrometer hardware to the observed
spectra was determined using the runs on the empty container and Cd sample, and
taking into account the sample absorption. The data below 3-4 meV are dominated by
the large elastic peak, which was stripped from the data. The raw data are featureless
and linear in energy transfer at small energy transfer in the hydrodynamic limit,
6 9
and thus are estimated easily. The neutron-weighted phonon density of states was
determined from the corrected spectra with the procedure described in Appendix A.
The final neutron-weighted phonon DOS curves are shown in figure 5.3.
The neutron-weighted phonon DOS have in principle a significant neutron-weight
correction. The quotient of ac,/mc, and aA"/mAu is 3.21, which implies that some
parts of the neutron-weighted DOS could be underweighted by a factor of 3.21 com-
pared to the true phonon DOS. The neutron-weight correction, as described in equa-
tion 3.3, is different for each of the six alloys. We are unable to perform a Born-von
KArmAn lattice-dynamics simulation, as we did in chapter 3, because the alloys are
chemically disordered. In the next section we show that the neutron-weight correc-
tion, although quite difficult for the phonon DOS, can be performed reliably and
accurately for the vibrational entropy.
5.3.2 Neutron-Weighted Vibrational Entropy
Using equation 4.2, we can calculate the vibrational entropy from the phonon DOS. If
we evaluate equation 4.2 using the neutron-weighted DOS instead of the true phonon
DOS, we arrive at a quantity we call the neutron-weighted vibrational entropy, Ssy, where
where gNw(E) is the neutron-weighted phonon DOS. Does the quantity S;F have
any physical significance or theoretical usefulness? The answer is yes. Substituting
equation 3.2 into equation 5.2 and allowing exp[-2(W - Wd)] = 1, we arrive at

Figure 5.3: Neutron-weighted phonon DOS of disordered Cu,Aul-, alloys and ele- ments.
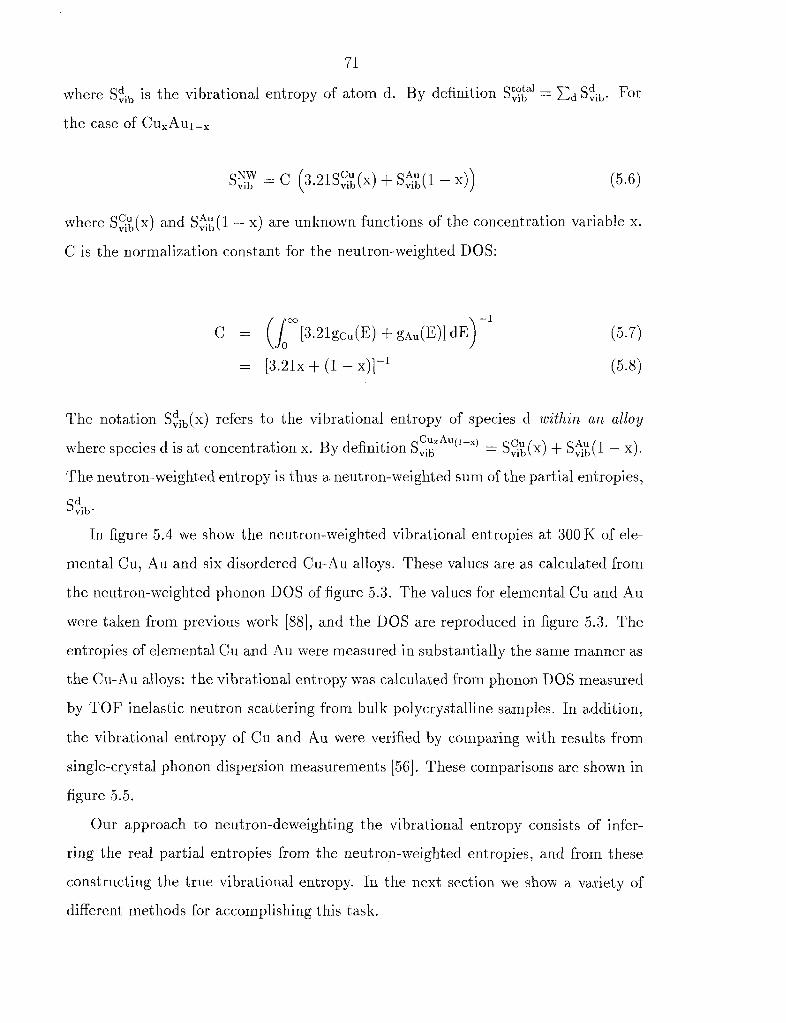
71
where Sd,ib is the vibrational entropy of atom d. By definition s$?' = Ed Sd,ib. For
the case of Cu,Aul-,
s:: = C (3.21s;$(x) + S$(1 - x)) (5.6)
where S:;"b(x) and S$(l - x) are unknown functions of the concentration variable x.
C is the normalization constant for the neutron-weighted DOS:
The notation S $ i b ( ~ ) refers to the vibrational entropy of species d within a n alloy Cux A,(, -,) where species d is at concentration x. By definition Svib = S:$(x) + S$(l - x).
The neutron-weighted entropy is thus a neutron-weighted sum of the partial entropies,
s$ib'
In figure 5.4 we show the neutron-weighted vibrational entropies at 300 K of ele-
mental Cu, Au and six disordered Cu-Au alloys. These values are as calculated from
the neutron-weighted phonon DOS of figure 5.3. The values for elemental Cu and Au
were taken from previous work [88], and the DOS are reproduced in figure 5.3. The
entropies of elemental Cu and Au were measured in substantially the same manner as
the Cu-Au alloys: the vibrational entropy was calculated from phonon DOS measured
by TOF inelastic neutron scattering from bulk polycryst alline samples. In addition,
the vibrational entropy of Cu and Au were verified by comparing with results from
single-crystal phonon dispersion measurements [56]. These comparisons are shown in
figure 5.5.
Our approach to neutron-deweighting the vibrational entropy consists of infer-
ring the real partial entropies from the neutron-weighted entropies, and from these
constructing the true vibrational entropy. In the next section we show a variety of
different met hods for accomplishing this task.
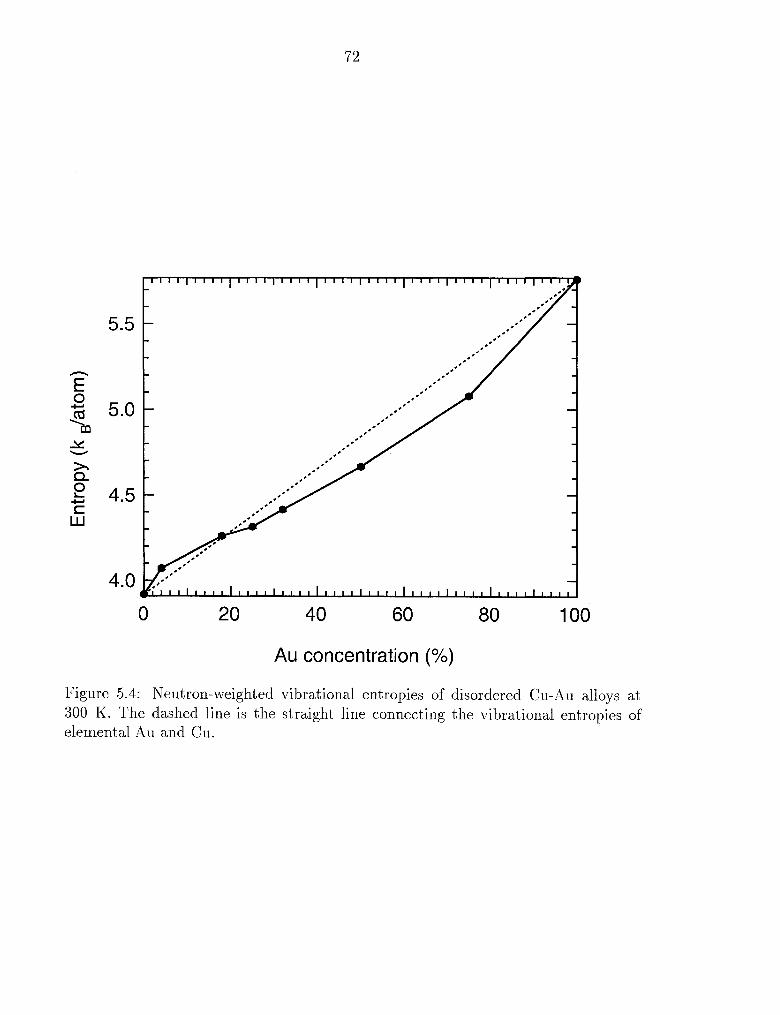
Au concentration (%)
Figure 5.4: Neutron-weighted vibrational entropies of disordered Cu-Au alloys at 300 K. The dashed line is the straight line connecting the vibrational entropies of elemental Au and Cu.
Energy (meV)
Figure 5.5: (a) Phonon DOS of elemental Cu at 300 K. (b) Phonon DOS of elemental Au at 300 K. The bold lines are TOF results, and the thin lines are taken from triple-axis phonon dispersion measurements [120, 1211.
74
5.3.3 Neutron-Weight Corrections for Disordered Alloys
Our goal is to derive the true vibrational entropies from the neutron-weighted vi-
brational entropies. We shall proceed from the simplest corrections to the most
complicated.
Point Approximation
The simplest chemical model of vibrational entropy assumes the point approximation:
where 0 < x 5 1 and neither S:; or S$ are functions of x. Consolidating equa-
tions 5.6 and 5.8 we arrive at
where
and
Thus, s:$, = x$$ and S$ = (1-x)$$. We note that equation 5.10 has the form of
the point approximation, equation 5.9, where x = k. Thus, we assert that Svib(k) =
S:r(x). Using this scheme, the S:? for Cu50Au50 becomes the true value of Svib for
C U ~ ~ A U ~ ~ . The point approximation correction is shown in figure 5.6.
The point approximation is strictly correct only if the partial entropies (and par-
tial DOS) of Au and Cu stay unchanged as the alloy varies in composition between
Cu,Aul-, and CukAuIpk. For x and k far apart, this approximation is likely to have
large errors. We can better make use of the point approximation by choosing alloys
where x and k are close in value, as in the following procedure.
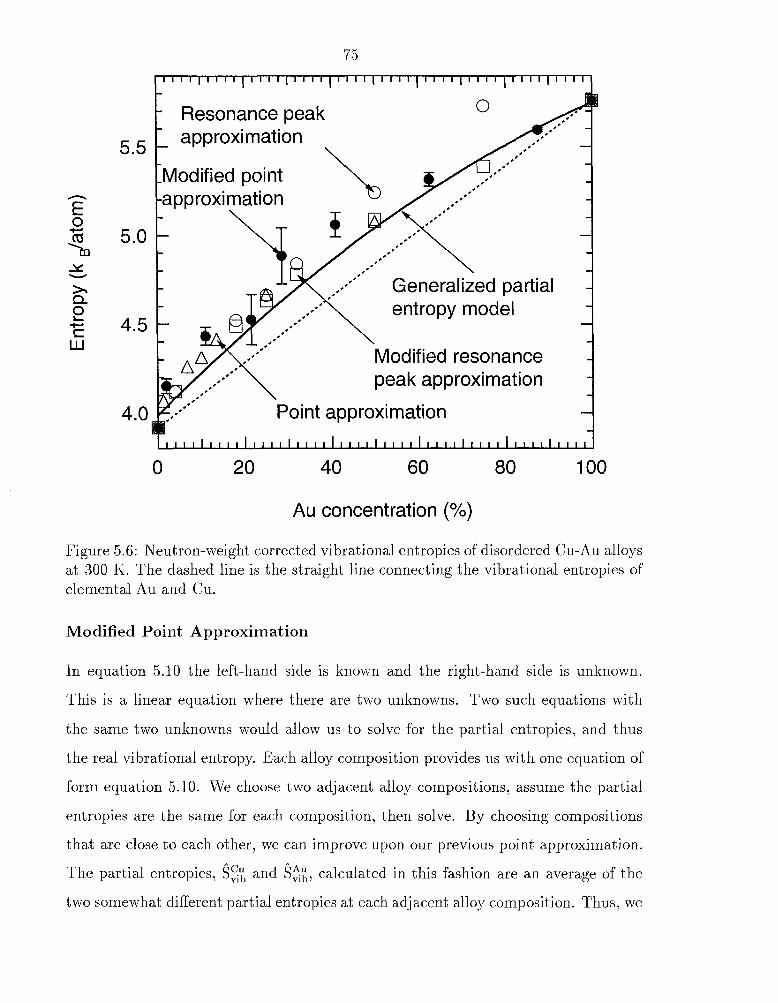
75
- - Resonance peak 0
Modified resonance peak approximation
Point approximation
Au concentration (%)
Figure 5.6: Neutron-weight corrected vibrational entropies of disordered Cu-Au alloys at 300 K. The dashed line is the straight line connecting the vibrational entropies of elemental Au and Cu.
Modified Point Approximation
In equation 5.10 the left-hand side is known and the right-hand side is unknown.
This is a linear equation where there are two unknowns. Two such equations with
the same two unknowns would allow us to solve for the partial entropies, and thus
the real vibrational entropy. Each alloy composition provides us with one equation of
form equation 5.10. We choose two adjacent alloy compositions, assume the partial
entropies are the same for each composition, then solve. By choosing compositions
that are close to each other, we can improve upon our previous point approximation.
The partial entropies, 3:; and !?$, calculated in this fashion are an average of the
two somewhat different partial entropies at each adjacent alloy composition. Thus, we
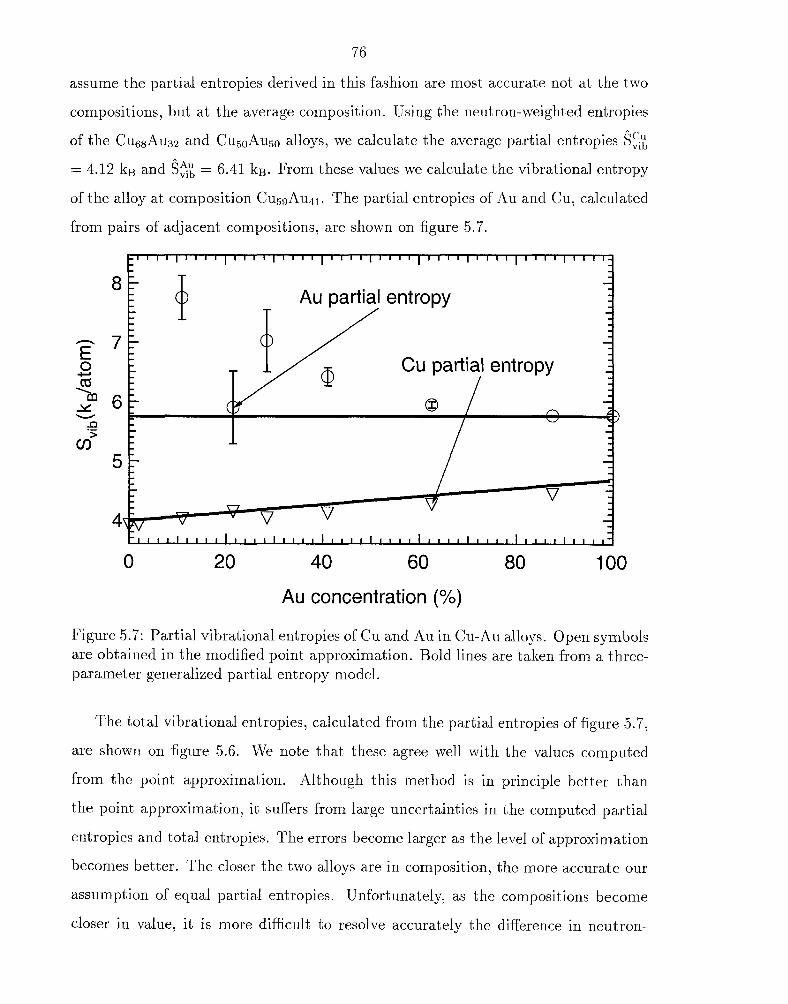
assume the partial entropies derived in this fashion are most accurate not at the two
Au concentration (%)
compositions, but at the average composition. Using the neutron-weighted entropies
of the CussAu32 and CuSoAuso alloys, we calculate the average partial entropies 3;; = 4.12 kB and 3% = 6.41 kB. From these values we calculate the vibrational entropy
of the alloy at composition C U ~ ~ A U ~ ~ . The partial entropies of Au and Cu, calculated
from pairs of adjacent compositions, are shown on figure 5.7.
Figure 5.7: Partial vibrational entropies of Cu and Au in Cu-Au alloys. Open symbols are obtained in the modified point approximation. Bold lines are taken from a three- parameter generalized partial entropy model.
" - 7 : E 0 c.
The total vibrational entropies, calculated from the partial entropies of figure 5.7,
are shown on figure 5.6. We note that these agree well with the values computed
from the point approximation. Although this method is in principle better than
- 1 ~ 1 1 1 1 ~ 1 1 1 1 ~ 1 1 1 1 ~ 1 1 1 1 [ 1 1 1 1 ~ 1 1 1 1 ~ 1 1 1 1 ~ 1 1 1 1 ~ 1 1 1 1 - - - - ' - - - - - Au partial entropy - - - - - - - - - - - - -
the point approximation, it suffers from large uncertainties in the computed partial
entropies and total entropies. The errors become larger as the level of approximation
becomes better. The closer the two alloys are in composition, the more accurate our
assumption of equal partial entropies. Unfortunately, as the compositions become
closer in value, it is more difficult to resolve accurately the difference in neutron-
- ;!. cu partial entropy - - - - - ' x 6; ( A - A - w - V -2
9 - - - - c6 - - - - - - - -
5 ' - - - - - - - I - - v' V - - - - .i-? - - - v v - -
7 7
weighed entropies, given the uncertainties in the values of these entropies. The large
error bars on the total entropy values at Cu concentrations of 78.5% and 71.5%,
shown on figure 5.6, result from the small differences between the neutron-weighted
entropies at alloy compositions Cus2Auls, C U ~ ~ A U ~ ~ and C U ~ ~ A U ~ ~ . Unfortunately,
with this method, any improvement in the approximation is negated by the magnified
uncertainty in our final result. Nevertheless, it appears that the Au partial vibrational
entropy per Au atom is largest at low Au concentrations.
Au Resonance Mode
The modified point approximation method, although lacking good convergence, has
the ability to measure the partial entropies of each independent atomic species. It
motivated the following neutron-weight correction. Each alloy composition gives us
one equation of form equation 5.10. If we knew 5% we could solve for $:$ and then
the vibrational entropy, using the relationship
We need to make a suitable guess for 5%. To this end we shall examine the neutron-
weighted DOS. An examination of figure 5.3 reveals certain regularities in the evolu-
tion of the neutron-weighted DOS as a function of Au concentration. For Au concen-
trations between 0 and 50%, we note that the peak at 9 meV grows proportionally
with increasing Au concentration. Related phenomena have been observed in phonon
dispersion measurements of Cu-Au [I221 and Cr-W [123, 1241 dilute alloys. The pres-
ence of a low-energy peak in Cu-Au alloys is well explained by the mass-defect theory
of lattice dynamics [125], which we summarize here. The addition of a heavy atom
to a matrix of light atoms results in a resonance mode at low energy associated with
damped vibrations of the heavy atom. In the low solubility limit, the partial DOS
of the heavy atom is a modestly sharp peak at the resonance energy. As the con-
centration of the heavy atom increases in the alloy, the partial DOS of the heavy
atom broadens and develops more features. We make the assumption that the partial
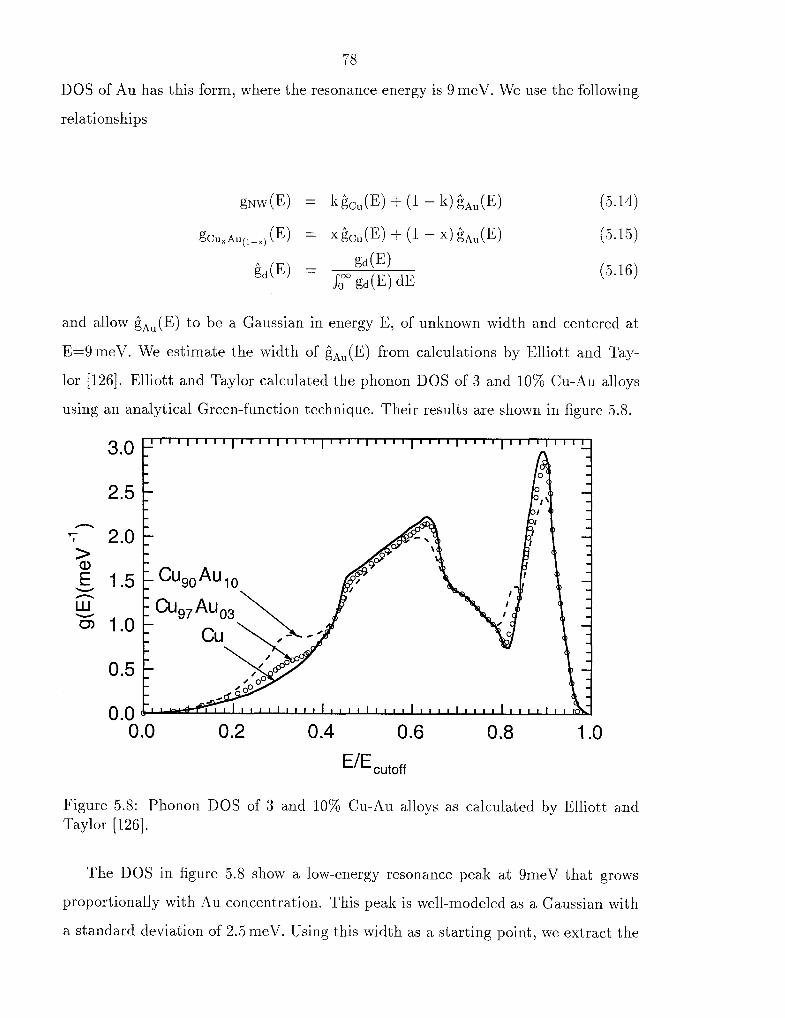
78
DOS of Au has this form, where the resonance energy is 9 meV. We use the following
relationships
and allow gAu(E) to be a Gaussian in energy E, of unknown width and centered at
E=9 meV. We estimate the width of gAu(E) from calculations by Elliott and Tay-
lor 111261. Elliott and Taylor calculated the phonon DOS of 3 and 10% Cu-Au alloys
using an analytical Green-function technique. Their results are shown in figure 5.8.
cut,,
Figure 5.8: Phonon DOS of 3 and 10% Cu-Au alloys as calculated by Elliott and Taylor [126].
The DOS in figure 5.8 show a low-energy resonance peak at 9meV that grows
proportionally with Au concentration. This peak is well-modeled as a Gaussian with
a standard deviation of 2.5 meV. Using this width as a starting point, we extract the

79
Cu partial DOS, gcu(E), and total DOS gcuxnu,,-x, (E) at each alloy composition. Our
results for alloy composition Cug6AuO4 are shown in figure 5.9.
Figure 5.9: The neutron-weighted DOS, Au partial DOS and corrected DOS of Cug6Au04 alloy within the resonance peak approximat ion.
Although not shown in figure 5.9, the Cu partial DOS is nearly identical to the
neutron-weighted DOS, gNw (E). Using the corrected total DOS at each alloy compo-
sition we can calculate the vibrational entropy. These values are shown in figure 5.6,
and are in excellent agreement with the values from the point approximation and
the modified point approximation at low Au concentrations. Our results do not de-
pend sensitively on the width of the Gaussian that approximates the Au partial DOS.
Varying the Gaussian width by a factor of two led to variations in the entropy smaller
than the size of the open circles on figure 5.6.
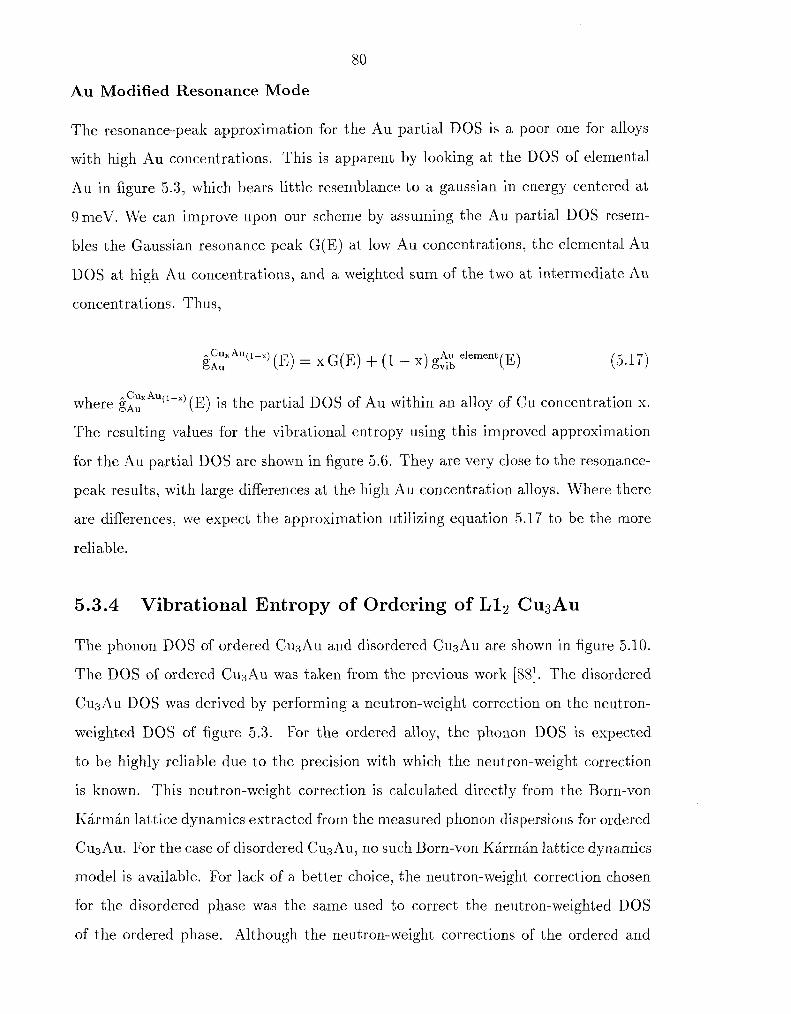
8 0
Au Modified Resonance Mode
The resonance-peak approximation for the Au partial DOS is a poor one for alloys
with high Au concentrations. This is apparent by looking at the DOS of elemental
Au in figure 5.3, which bears little resemblance to a gaussian in energy centered at
9 meV. We can improve upon our scheme by assuming the Au partial DOS resem-
bles the Gaussian resonance peak G(E) at low Au concentrations, the elemental Au
DOS at high Au concentrations, and a weighted sum of the two at intermediate Au
concent rations. Thus,
6 CuxAu(1-x) ~ A U
(E) = x G(E) + (1 - x) g$!, "leme"" (E) (5.17)
A CuxAu(~-x) where gAu (E) is the partial DOS of Au within an alloy of Cu concentration x.
The resulting values for the vibrational entropy using this improved approximation
for the Au partial DOS are shown in figure 5.6. They are very close to the resonance-
peak results, with large differences at the high Au concentration alloys. Where there
are differences, we expect the approximation utilizing equation 5.17 to be the more
reliable.
5.3.4 Vibrational Entropy of Ordering of L12 Cu3Au
The phonon DOS of ordered Cu3Au and disordered Cu3Au are shown in figure 5.10.
The DOS of ordered Cu3Au was taken from the previous work [88]. The disordered
Cu3Au DOS was derived by performing a neutron-weight correction on the neutron-
weighted DOS of figure 5.3. For the ordered alloy, the phonon DOS is expected
to be highly reliable due to the precision with which the neutron-weight correction
is known. This neutron-weight correction is calculated directly from the Born-von
KirmAn lattice dynamics extracted from the measured phonon dispersions for ordered
Cu3Au. For the case of disordered CusAu, no such Born-von Kirmin lattice dynamics
model is available. For lack of a better choice, the neutron-weight correction chosen
for the disordered phase was the same used to correct the neutron-weighted DOS
of the ordered phase. Although the neutron-weight corrections of the ordered and
Figure 5.10: Phonon DOS of ordered and disordered CusAu.
disordered phases are most likely different in detail, the use of the same correction
preserves differences observed in the neutron-weighted DOS. The AS::; value derived
from the phonon DOS shown in figure 5.10 is 0.12 ks/atom. Our confidence in this
value is low, due to the uncertainty associated with the neutron-weight correction of
the DOS of the disordered phase. Better values for the vibrational entropy of ordering
can be attained by calculating the neutron-weight corrected vibrational entropy of the
disordered phase directly, using either the modified point approximation, modified
resonance peak method or the generalized partial entropy method. This approach is
implemented in section 5.4.4.
5.4 Discussion
5.4.1 Phonon DOS
The neutron-weighted phonon DOS of Cu,Au(l-,) changes continuously with de-
creasing Cu concentration. The primary effects are twofold. Firstly, the DOS softens
monotonically with increasing Au concentration. This effect can be seen most clearly
in the high energy cutoff of the DOS: 31 meV for Cu and 20 meV for Au. The effect
is not quite linear in Au concentration, as can be observed in figure 5.3. The DOS
of Cu50A~50 terminates at 27meV, not at 25.5 meV. Secondly, the peak at 9 meV
grows rapidly with increasing Au concentration. This peak is almost certainly a
resonance mode due to Au vibrations. First predicted by Rayleigh 11271 and Lif-
shitz [128, 129, 1301, the resonance mode is the low energy vibration resulting from
a heavy atom substituted into a matrix of much lighter atoms. The phonons con-
tributing to a resonance mode are expected to be composed entirely of heavy atom
motions, with contributions from light atoms near the heavy impurity. Strictly speak-
ing, resonance modes are a phenomenon associated with dilute alloys only. For the
case of CU,AU(~-,~, we see the persistence of a strong resonance mode up to Au con-
centrations of 50%. The resonance mode in Cu-Au is strongly de-emphasized in the
neutron-weighted DOS because of the small scattering cross-section and large mass
of the Au atom.
It is difficult to ascertain the changes of the phonon DOS at Au concentrations
between 50 and 100% due to our single measurement in this region. In principle, there
should be a local mode associated with the vibrations of the minority Cu atoms in a
heavy Au atom matrix. Unlike the case for a Au resonance mode, these Cu vibrations
should occur at high energy, perhaps even well separated from the rest of the phonon
DOS. It is possible the extended tail and shoulder observed in the DOS
between 23 and 25 meV are due to Cu local modes.
8 3
5.4.2 Generalized Partial Entropy Modeling
The modified point approximation was a specific case of a more generalized neutron-
weight correction method. In the modified point approximation, the partial entropies
of Cu and Au were modeled with two parameters. Two linear equations were then
inverted to solve for the unknown parameters. In principle, the partial entropies of
Cu and Au can be modeled with an arbitrary number of parameters, and any number
of equations of the form 5.10 can be inverted to solve for the parameters and partial
entropies. Here we are limited by the total number of different compositions we
measured: eight. For a perfectly-determined system of equations, this allows up to
eight parameters to model the partial entropies of Cu and Au. We choose to use four
parameters: two parameters to parameterize 3:; and two for 9%. The form of the
model is a first-order polynomial in concentration variable x:
where the parameters are the coefficients c$ and cf. For each alloy composition
CU,AU(~-,) we have one equation in four unknowns:
where $:$ and $,qub are parameterized as shown in equation 5.18. We label each alloy
composition x with an integer value i, where i={1,. . . ,8} and
This system of equations is overdetermined, with four unknowns and eight equa-
tions. Generally speaking, we cannot find values for the unknowns which simul-
taneously solve all eight equations. However, we can find values of the unknown
parameters that best solve all equations simultaneously, in a least-squares sense.
In matrix notation, we denote the system of equations as
where
and
where [k@Iij is the element at row i and column j of matrix [ka]. Matrix [ka] is size
8 x 4. The term k(i) is the value of k, computed from equation 5.11, at alloy com-
position i. Our definition of the matrix [k@] shown in equation 5.24 implements the
linear parameterization of the Cu and Au partial entropies, shown in equation 5.18.
Inverting equation 5.21, we solve for the parameter vector 2. The inversion is
done using singular value decomposition, which returns the unique choice of c' if the
number of parameters is equal to the number of unknowns or the least-squares choice
of c' for an overdetermined system of equations. The least squares choice of c' is
the 2 that minimizes the quantity 1 [k@]F - s?! I . For this example, the system is
overdetermined so we expect only a least squares choice of c'. We can solve for the
partial entropies and total vibrational entropy trivially once we know the parameter-
vector c'. In matrix notation, solving for the correct vibrational entropy is done by
evaluating
where
x(i) x(j-l) if j<3 [x@]i,j =
(1 - x(i)) ~ ( j - ~ ) otherwise
and the ith element of gvib corresponds to the neutron-weight corrected vibrational
entropy at the ith alloy composition. The term x(i) corresponds to the concentration of
Cu of the ith alloy. Using the parameterization of 3:: and 3% shown in equation 5.18
and the neutron-weighted entropies from all eight alloy compositions, we solve for
c' = {cOcU, cyu, c t u , c?).
Unfortunately, this procedure is flawed. Allowing both 9;; and 3% to be pa-
rameterized with the same functional form introduces a fatal linear dependence into
matrix [k@]. For arbitrary composition x, a row of [k@] has the following elements:
These four elements are linearly dependent functions; there exists a choice of
such that
Using k defined in equation 5.11, c',,ll = X {-0.215,0.215, .0.69,0.69), where X is an
arbitrary constant. This can be easily verified by substitution. For any choice of A ,
the following holds true:

8 6
The above property leads us to say that Gun belongs to the nullity of matrix [kcD].
Thus, it is impossible to find a unique choice of c' that minimizes the quantity
1 [k@]c'- s$? 1 . An arbitrary vector Gull can be added to c' without affecting our
minimization of the quantity I [kcD]c'- S ~ Y I . It is sadly true that our system of equa-
tions can be both overdetermined and linearly dependent at the same time. Speaking
qualitatively, it is impossible to distinguish the separate contributions to S:r from
3:; and 3% when the partial entropies are linearly dependent as shown in equa-
tion 5.29. We have the case where the behavior of a set of Sx? can be equally well
described with different linear models for 9;; and 3%. The linear dependence can be avoided by modifying our parameterization of $2.
We set ci\" = 0 and solve for the least squares choice of 2 = {c:~, cYU, c*). This
method improves upon the modified point approximation in three ways: first, we allow
for a linear dependence on composition of the partial entropy of Cu, 3:s. Second, we
model the partial entropies of Cu and Au by fitting to all eight alloy compositions
simultaneously. Lastly, the generalized met hod does not suffer the poor convergence
of the modified point approximation: the uncertainties on c' do not increase as the
alloy compositions become more similar. The resulting partial entropies are shown in
figure 5.7. The corrected vibrational entropy is shown in figure 5.6. We note excellent
agreement between these results and the previous neutron-weight corrections to the
entropy.
The success of the generalized partial entropy model depends on the parameter-
ization of the partial entropies $$ib. The parameterization of $$ib is constrained to
be linear with respect to the parameters c:, where j = {I,. . . ,N). This constraint
mandates the general functional form of $tib:
N
$Sib(x) = c c," f: (x) (5.31) j=1
where ff(x) are functions of concentration variable x. We refer to ff as the jth basis
function of the partial vibrational entropy of atomic species d. Additionally, the $d(x)
must be chosen so to avoid linear dependence of [kcD], as was seen in the case of Cu-Au
8 7
above. For the case of a binary a,lloy, where d={1,2), we can state this constraint in
general: The equation
N
c: (k) f:(x) + cl (1 - k) f:(x) = 0 j=1
must have only one solution for arbitrary x: c,d = 0 for all j and d. Typically we want
to parameterize all atomic species with the same model, so fj = f t for all j and i # k.
Using tKis simplification, we restate equation 5.32 in matrix-vector notation:
where fT is the vector transpose of shared basis functions fj(x), 4 is the parameter
vector for atomic species d and AZ= Zl - Z2. We desire equation 5.33 to have the
unique solution Zl = Z2 = 0 for arbitrary X. A set of basis functions fj(x) that both
satisfy this constraint and model $ $ i b ( ~ ) is unknown.
5.4.3 Local Cluster Approximation
The local cluster approximation (LCA) can be used to calculate thermodynamic prop-
erties of chemically disordered materials. This theory is explained in some detail in
Appendix B. The LCA can be used to parametrize the partial entropies of Cu and Au
within the generalized partial entropy model. This parameterization is a poor one,
since the LCA basis functions become linearly dependent beyond the point cluster.
Using the LCA to interpret experimental results is motivated by the use of the LCA
within the theoretical community to describe the properties of disordered crystals.
Recent theoretical work by Ozolipi, Wolverton and Zunger [lo] has provided a
temperature dependent LCA model for the vibrational entropy of formation of disor-
dered Cu-Au alloys. In this work, Ozoliqii and coauthors obtained the phonon DOS
and vibrational entropy for a series of ordered Cu-Au alloys using ab-initio electronic-
structure calculations within the local density approximation (LDA). Using results
from six ordered Cu-Au alloys, Ozoliqi and coauthors found the values of cluster-
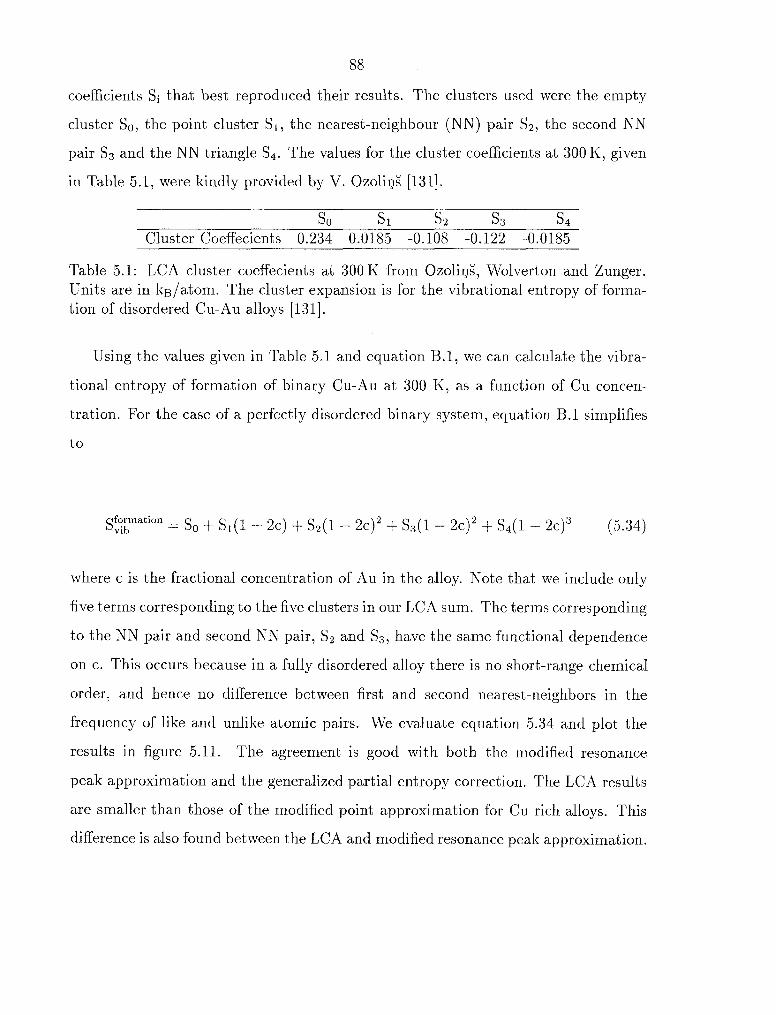
coefficients Si that best reproduced their results. The clusters used were the empty
cluster So, the point cluster S1, the nearest-neighbour (NN) pair S2, the second NN
pair SS and the NN triangle S4. The values for the cluster coefficients at 300 K, given
in Table 5.1, were kindly ~rovided by V. Ozoliq; [131].
s 0 s 1 s 2 s3 s4
Cluster Coeffecients 0.234 0.0185 -0.108 -0.122 -0.0185
Table 5.1: LCA cluster coeffecients at 300 K from Ozoliq;, Wolverton and Zunger. Units are in kB/atom. The cluster expansion is for the vibrational entropy of forma- tion of disordered Cu-Au alloys [131].
Using the values given in Table 5.1 and equation B. 1, we can calculate the vibra-
tional entropy of formation of binary Cu-Au at 300 K, as a function of Cu concen-
tration. For the case of a perfectly disordered binary system, equation B.l simplifies
sformation - vib - SO + sl(l - 2 ~ ) + s2(1 - 2 ~ ) ~ -I- $ 4 1 - 2 ~ ) ~ + s 4 ( i - 2 ~ ) ~ (5.34)
where c is the fractional concentration of Au in the alloy. Note that we include only
five terms corresponding to the five clusters in our LCA sum. The terms corresponding
to the NN pair and second NN pair, S2 and S3, have the same functional dependence
on c. This occurs because in a fully disordered alloy there is no short-range chemical
order, and hence no difference between first and second nearest-neighbors in the
frequency of like and unlike atomic pairs. We evaluate equation 5.34 and plot the
results in figure 5.11. The agreement is good with both the modified resonance
peak approximation and the generalized partial entropy correction. The LCA results
are smaller than those of the modified point approximation for Cu rich alloys. This
difference is also found between the LCA and modified resonance peak approximation.

Au Concentration (%)
Figure 5.11: Vibrational entropy of formation of disordered Cu-Au alloys at 300 K. The circles marked OWZ are the LCA results by Ozoliyg, Wolverton and Zunger.
5.4.4 Vibrational Entropy of Ordering of CusAu
The phonon DOS of ordered and disordered CusAu differ substantially, as shown in
figure 5.10. The DOS of the ordered alloy exhibits large Van-Hove singularities at
9, 13, 20 and 25meV. The DOS of the disordered alloy has one very broad central
feature at 16 meV, and two small peaks at 10 and 24 meV. The high-energy cutoff is
the same for both the ordered and disordered DOS.
The vibrational entropy of disordering calculated from the phonon DOS of fig-
ure 5.10 is half the size of the value derived from the phonon dispersion measurements
of Katano et al.[56] and is in good agreement with the calorimetric estimate. How-

9 0
ever, we have low confidence in the vibrational entropy of disordering calculated from
the lattice dynamics corrected phonon DOS. In figure 5.12 we compare our phonon
DOS of disordered Cu3Au with that of Katano and coauthors.
Figure 5.12: Phonon DOS of disordered CusAu derived from phonon dispersions.
The lack of agreement is notable, and is due largely to the inaccuracies introduced
by the virtual crystal approximation. The virtual crystal approximation assumes a
single atomic species only, where the atomic mass is the average of the real crystal.
This assumption allows a phonon DOS to be modeled using a simple fcc unit cell and
measured phonon dispersions. Our results are a direct measurement of the phonon
DOS, with some small uncertainty introduced by the neutron-weight correction.
The vibrational entropy of disordering depends sensitively on the phonon DOS
of both the ordered and disordered phases of Cu3Au. The DOS of ordered Cu3Au
is known more reliably than the DOS of the disordered phase, due to the more re-
liable neutron-weight correction of the ordered phase. Our value of AS:!: derived
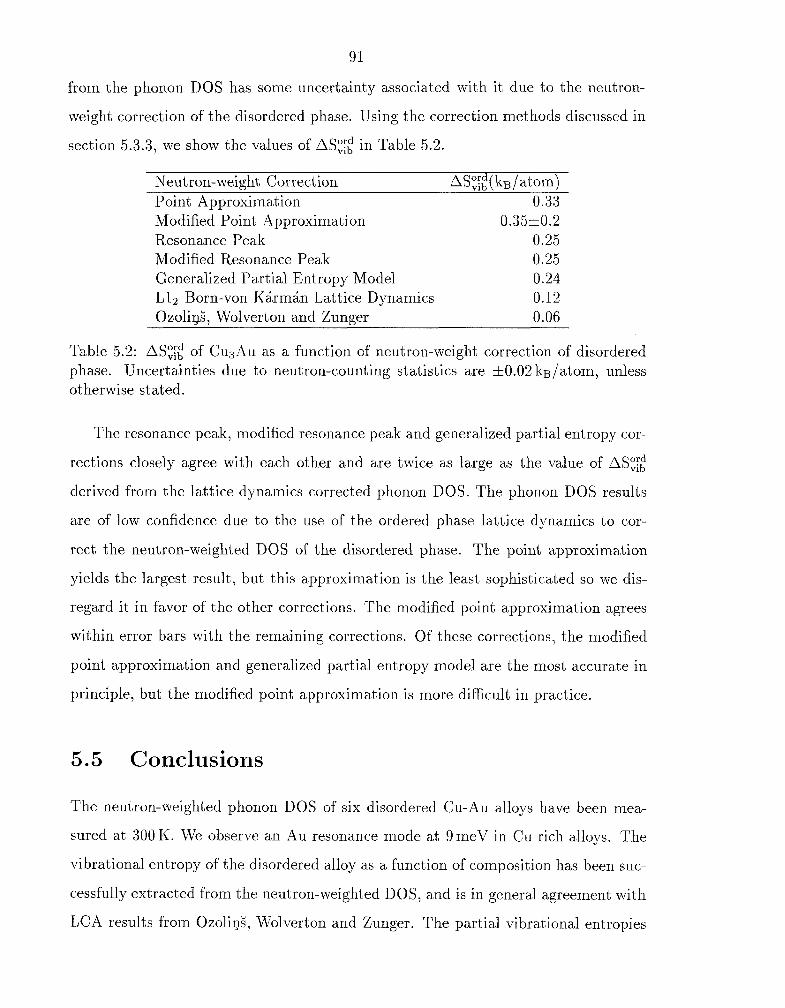
from the phonon DOS has some uncertainty associated with it due to the neutron-
weight correction of the disordered phase. Using the correction methods discussed in
section 5.3.3, we show the values of AS:!: in Table 5.2.
Neutron-weight Correction AS~~:(ks/atom) Point Approximation 0.33 Modified Point Approximation 0.352~ 0.2 Resonance Peak 0.25 Modified Resonance Peak 0.25 Generalized Partial Entropy Model 0.24 L12 Born-von KArmin Lattice Dynamics 0.12 Ozol i~ i , Wolverton and Zunger 0.06
Table 5.2: AS",: of CusAu as a function of neutron-weight correction of disordered phase. Uncertainties due to neutron-counting statistics are f 0.02 kB/atom, unless otherwise stated.
The resonance peak, modified resonance peak and generalized partial entropy cor-
rections closely agree with each other and are twice as large as the value of AS:::
derived from the lattice dynamics corrected phonon DOS. The phonon DOS results
are of low confidence due to the use of the ordered phase lattice dynamics to cor-
rect the neutron-weighted DOS of the disordered phase. The point approximation
yields the largest result, but this approximation is the least sophisticated so we dis-
regard it in favor of the other corrections. The modified point approximation agrees
within error bars with the remaining corrections. Of these corrections, the modified
point approximation and generalized partial entropy model are the most accurate in
principle, but the modified point approximation is more difficult in practice.
Conclusions
The neutron-weighted phonon DOS of six disordered Cu-Au alloys have been mea-
sured at 300 K. We observe an Au resonance mode at 9 meV in Cu rich alloys. The
vibrational entropy of the disordered alloy as a function of composition has been suc-
cessfully extracted from the neutron-weighted DOS, and is in general agreement with
LCA results from Ozolipg, Wolverton and Zunger. The partial vibrational entropies
92
of Cu and Au are smoothly varying as a function of composition. This allows for a
variety of neutron-weight corrections to the vibrational entropy using simple models
for the partial vibrational entropies of Cu and Au. The failure of the generalized
partial entropy model shows us that it is impossible to uniquely extract linear models
of the Au and Cu partial vibrational entropies, as a function of alloy composition,
from any given set of neutron-weighted DOS.
We estimate the vibrational entropy of disordering, ASO,~; in CusAu as 0.24 % 0.02
kB/atom, at 300 K. The vibrational entropy of disordering at T, might be different,
depending on how the phonon DOS of the two phases change between 300 and 663 K.
Our results are four times larger than the calculations of Ozoligg, Wolverton and
Zunger.

Chapter 6 Conclusions
Science and Methods
In this thesis we explored the importance of vibrational entropy on phase stability
in metals and alloys. Each chapter has dealt with a specific alloy or alloy system,
and has focused upon the vibrational entropy contribution to the thermodynamics of
interest. Nevertheless, we find strong scientific connections that were not expected
beforehand. In chapter 3 we found vibrational entropy to be the driving force for the
martensitic transformation in NiTi. Lattice dynamics simulations in NiTi and high
temperature Zr show that the large vibrational entropy of the low-temperature bcc
phase is due to a large number of low energy acoustic phonon. These acoustic phonons
shift to higher energy at higher temperatures, which is the opposite behavior expected
from the volume expansion alone at high temperature. The temperature dependence
of phonon energies in bcc metals is revisited in chapter 4. Measurements of the
phonon DOS of V at high temperature show that phonon-phonon scattering at high
temperature counteracts the phonon softening expected from thermal expansion.
In chapter 5 we develop a novel methodology for the calculation of vibrational
entropy from the neutron-weighted phonon DOS in chemically disordered alloys. The
approach relies upon modelling the vibrational entropy contributions of each atomic
species as a function of alloy composition. The advantage of dealing with the vibra-
tional entropies directly is that the partial vibrational entropy of each species is a
slowly-varying and smooth function of composition. In contrast, the partial phonon
DOS of each species is difficult to parameterize simply as a function of composition.
One can use the local cluster approximation (LCA), or cluster variation method, to
model the partial vibrational entropies. This approach is explored more fully in Ap-
pendix B. We conclude that it is impossible to uniquely extract best-fit linear models
for the partial vibrational entropies from a set of neutron-weighted phonon DOS.
94
This limitation and its qualifications inform our understanding of the usefulness of
the neutron-weighted 110s and entropy.
Other specific conclusions have been sufficiently explained in each individual chap-
ter, and we shall not revisit them here. Chapters 2, 3, 4 and 5 have focused on the
science. Here we wish to examine the experimental methodology.
6.1.1 Method 1
The most straightforward measurement of the phonon DOS is the use of a triple-axis
spectrometer at constant Q on an incoherently scattering polycrystalline element.
Triple-axis spectrometers work in conjuction with reactor sources. This method allows
the direct measurement of the phonon DOS, with no approximations in the data
analysis. One can measure the DOS and hence the vibrational entropy limited only
by the energy resolution of the spectrometer and the time one allows for good counting
statistics. One can extend this method with almost equal accuracy to alloys where
each atomic species has equal neutron-weight, such as Co-V alloys. In this case we
introduce errors when we neglect the individual Debye-Waller corrections in favor
of an average Debye-Waller correction. Our study on V in chapter 4 employed this
method. Limitations of this method are the small number of elements and miniscule
number of alloys that satisfy the requirements of incoherent scattering and equal
neut ron-weighting.
6.1.2 Method 2
The second-easiest neutron scattering experiment is the use of a time-of-flight (TOF)
spectrometer to measure the phonon DOS of a polycrystalline element. TOF neutron
spectrometers need a pulsed source (spallation source) to achieve energy resolution.
The broad sampling of scattering at different Q allows the use of samples that have
coherent or mixed coherent-incoherent scattering. This method allows the direct
measurement of the phonon DOS, with substantial approximations in the data analy-
sis. These approximations are sufficiently accurate to allow differential measurements

95
of the vibrational entropy and phonon DOS. The data analysis and approximations
needed for a TOF measurement are not trivial, and are explained in some detail in
Appendix A. The methodology outlined in this appendix, combined with its exper-
imental verification in chapters 3 and 5, is a large part of the scientific contribution
of this thesis. The measurement of the phonon DOS of elemental Cu in chapter 5 is
a good example of this method. The advantage to this method is that one can use
it on any nearly any metal in the periodic table, although one is better off using a
triple-axis spectrometer for samples that exhibit pure incoherent scattering.
6.1.3 Method 3
The most difficult neutron scattering experiment is the use of a TOF spectrometer to
measure the vibrational entropy of a polycrystalline alloy. This experiment has all the
difficulties of Method 2 and adds to them the difficulty of implementing a neutron-
weight correction to the neutron-weighted DOS. The neutron-weight correction to the
DOS can range from the difficult (the use of Born-von K&rm&n lattice dynamics in
NiTi) to the near-impossible (chemically disordered Cu-Au alloys). Neutron-weight
correcting the vibrational entropy is a more feasible task. Despite the difficulty, this
method is applicable to almost all alloys. In principle, a high resolution TOF spectrum
has sufficient information to extract the lattice dynamics near-uniquely from a poly-
atomic coherently scattering polycrystalline sample. Limitations on the quality of
current spectrometers and the sophistication of our data analysis tools make this goal
a distant one.
The three methods listed above all share some common limitations. Some el-
ements (Cd, Rh, Gd, 235U) are prohibitively strong neutron absorbers, and their
presence, even in small quantities, will eliminate any neutron signal from the sample.
Other elements (Au, Co) have sufficiently unfavorable ratios of neutron scattering to
absorption cross-sections that only small samples combined with prohibitively long
measurement times will yield good data.
An understanding of these practical limitations is useful for designing productive
9 6
experiments. In the next section I propose three broad areas of future scientific study,
specifically optimized for one of the experimental methods outlined above. My work
in chapters 2, 3, 4 and 5 show why these studies will be interesting.
Future Work
6.2.1 Temperature Dependence of the Phonon DOS
Measuring the phonon DOS of elements is much easier than for alloys. However,
the lattice dynamics, phonon DOS and vibrational entropy of almost all elements
has already been measured . . . at room temperature. In chapter 4 we show how the
temperature and volume dependent phonon DOS, combined with measurements of
the temperature dependent thermal expansion and bulk modulus, can be used to
determine the temperature dependent phonon DOS at fixed volume. A calculation
of the temperature and volume dependent electronic DOS or electronic entropy is
a,lso required. The temperature dependence (at constant volume) of the phonon DOS
must be caused by either electron-phonon scattering or phonon-phonon scattering.
If the latter, then the excess phonon entropy associated with the temperature shifts
of the DOS is identical with the anharmonic vibrational entropy. The temperature
dependence of the phonon DOS of the elements has, in general, not been measured.
In addition to our work, Manley and coauthors [I321 have recently measured the tem-
perature dependence of the phonon DOS of U up to 1213 K. They used a calculation
of the total vibrational power spectrum to show that the softening observed in the
DOS of U was harmonic, not anharmonic.
The use of polycrystalline elements greatly reduces the time needed for sample
preparation and characterization. Beam time on a TOF instrument at a neutron
spallation source will be needed for most samples, as described in Method 2. In
addition, a reliable TOF compatible furnace that operates at high temperature will
also be needed. The use of elemental samples eliminates the need for a neutron-weight
correction in the data analysis, thus removing a major obstacle associated with the

9 7
measurement of the phonon DOS using neutron scattering.
6.2.2 Vibrational Entropy of Alloying in the Dilute Limit
The vibrational entropic effect of dilute alloying in metals has long been neglected.
Although this area has attracted lattice dynamical interest from the theoretical com-
munity (see sections 5.3.3 and 5.4.1), the thermodynamic importance has gone un-
explored both theoretically and experimentally. What little experimental evidence
exists shows promise. In Table 2.2 we observe that the dilute alloying of Pt in V
causes an enormous vibrational effect, while Cr in V does very little. Within the
Einstein approximation, one might expect a pure mass effect of placing Pt in V given
by
where c is the concentration of P t and M is the atomic mass. For c = 0.05 we expect
~ s a l l o y ,ib - - 0.1 kg/atom. The value calculated from the phonon DOS is 0.4 kB/atom.
An effect in excess of that predicted by the change in mass between the solute and
solvent atoms must be caused by a change in the force constants of the alloys. In turn,
a change in the force constants is caused by a change in the bonding, or electronic-
structure between the element and the alloy. A reasonable experiment would be to
systematically measure the effect of dilute alloying as a function of solute atom. One
could look for systematic effects as a function of solute atom radius, mass and electron
number.
This experiment is well-suited for inelastic neutron scattering. By working in the
dilute alloy limit we avoid the use of a neutron-weight correction. To a good first
approximation, the neutron-weighed DOS and the real phonon DOS are identical
when the concentration of impurity species is low. What we look for is large changes
in the phonon modes of the majority species caused by a small concentration of solute
atoms. This sort of effect is readily observed using Methods 1 or 2. Measurements
could be confined to room temperature, and the data analysis and sample preparation
9 8
are greatly simplified by using dilute alloy samples. A good choice of solvent atom
would be an element that had good neutron-scattering characteristics (low absorption,
large cross-section) as well as metallurgical ones (readily alloys, high ductility).
6.2.3 Fitting Lattice Dynamics to the Phonon DOS
The vibrational entropy of a solid can be derived solely from knowledge of the phonon
density-of-states. The phonon DOS is not a unique description of the vibrational ex-
citations in a solid. Phonons (in a translationally periodic crystal) have two quantum
labels: energy and wave-vector. Knowledge of the energy as a function of wave-vector
constitutes a complete harmonic description of the phonons in a periodic crystal.
Traditional methods of measuring the phonon dispersions are time-consuming and
not comprehensive: a high quality, large single crystal and considerable time on a
triple-axis neutron spectrometer are both needed. Time constraints mandate that
only phonon dispersions along a few high symmetry directions are measured. The
phonon-dispersions along other directions are inferred by using a Born-von KArmin
model to fit the measured data, then arbitrary lattice dynamics information can be
calculated using the model.
Alternatively, one can fit measurements of the neutron-weighted phonon DOS
(measured using Methods 1, 2 or 3) to a Born-von KArmAn lattice dynamics model.
This procedure is used in chapter 3 to arrive at a neutron-weight correction for NiTi.
Of course, the difficulty with this scheme is that there exists more than one set of
phonon dispersions that give the same phonon DOS. In principle, even a perfect fitting
routine will be unable to distinguish uniquely which set of force constants is the correct
one for the measured data. This same criticism can be leveled at the more traditional
method using measured phonon dispersions. In that case, as in ours, there exists more
than one set of force constants that equally well describe the measured data. Recent
work on the validity of this approach shows that different sets of converged force
constants vary little from each other, and thus one can reasonably hope to extract
meaningful lattice dynamics data from neutron-weighted phonon DOS.
9 9
The simplest implentation of this approach is the following: choose a set of force
constants, calculate the neutron-weighted phonon DOS with the model, then compare
the model DOS with the experimental DOS. Adjust the force constants, then repeat
until the model DOS and experimental DOS are converged. There are numerous prac-
tical considerations that have a large effect on the accuracy of this procedure. First,
the calculated force-constants can only be as good as the quality of the experimen-
tal DOS. A measured DOS with few sharp features (due to poor energy resolution)
and uncertain neutron-weighting can yield only a few trustworthy force-constants.
Second, the mechanical fitting routine is capable of fitting the measured DOS to a
much higher degree of accuracy than is called for, considering the likely error-bars
on the measured DOS. One's fitting program might spend much of its time choosing
the correct set of fifth-nearest force constants that improves the quality of fit by a
few tenths of a percent . . . even though the measured DOS has uncertainties of a few
percent! It seems necessary to use as few force constants as can give an adequate
fit to the data. For typical TOF spectra my experience shows that one should al-
most never go beyond the t hird-nearest-neighbor force const ants. One should also
repeat the fitting procedure many times with different starting guesses.. .the differ-
ent sets of converged force-constants will give some idea of the uncertainties in the
force-constants. Of course, one should always double-check one's results using phys-
ical intuition. The first-nearest neighbour force constants should be larger than the
second, which should be larger than the third. When possible, the force constants
should be compared to a related system where the lattice dynamics are known. Fi-
nally, the tensorial force constants should not stray too far from central-force behavior
for close-packed crystal structures, although invar alloys may be a,n exception.
The mechanical fitting of inelastic scattering data to a model can be greatly im-
proved upon. First, by fitting the model directly to the raw data one can eliminate the
large uncertainties introduced by treating the coherent scattering in the incoherent
approximation. This would require, for the case of the Born-von KArmAn model, cal-
culating correctly the incoherent and coherent single and multiple-phonon scattering
contributions as a function of neutron wave-vector, energy transfer and temperature.
This is no trivial task, and would require large modifications t o an existing lattice-
dynamics code base, which typically calculate phonon dispersions and phonon DOS.
Secondly, one should implement a fitting routine that is sensitive to the estimated
neutron counting statistics. The fitting routine should stop once it has found a set of
force-constants that fit the raw data to within the error bars on the data. Thirdly,
the fitting routine should be robust and fast enough to achieve convergence in a rea-
sonable amount of time. Of the two, writing fast code is more feasible than writing
robust code. N-dimensionsal function optimization (minimization) is a notorious dif-
ficult task, and even the best codes are very sensitive to the starting guess and give
only local minima. With a very fast routine, one could minimize a few hundred times
and find the best set of converged force-constants.
Modeling of inelastic neutron-scattering data is still in its infancy. No equivalent
of the Rietveld-refinement method, applicable in elastic scattering, exists for inelas-
tic scattering. Our ability to measure vibrational properties of materials is rapidly
falling behind our ability to predict vibrational properties using ab-initio theory. The
potential for growth in this research area is enormous and promises a large experimen-
tal reward: the measurement of the phonon DOS, lattice dynamics and vibrational
entropy of arbitrary materials.

Appendix A Neutron Scattering
Analysis from TOF Instruments
A common task is the measurement of the vibrational entropy through time-of-flight
(TOF) inelastic neutron-scattering. In order to calculate the vibrational entropy
we extract the phonon density-of-states (DOS) from the inelastic neutron-scattering
spectra.
A.l TOF Spectrometer
The (neutron-weighted) phonon DOS can be derived from TOF inelastic neutron
scattering. This appendix explains how to derive the phonon DOS from TOF in-
elastic neutron-scattering data. In figure A . l we show a schematic view of a TOF
spectrometer.
Angle Bank 12
/ u Detectors
k Scattering Angle
Figure A. l : Schematic diagram of time-of-flight neutron spectrometer.
The incident neutron beam shown in figure A.1 is pulsed and monochromatic.
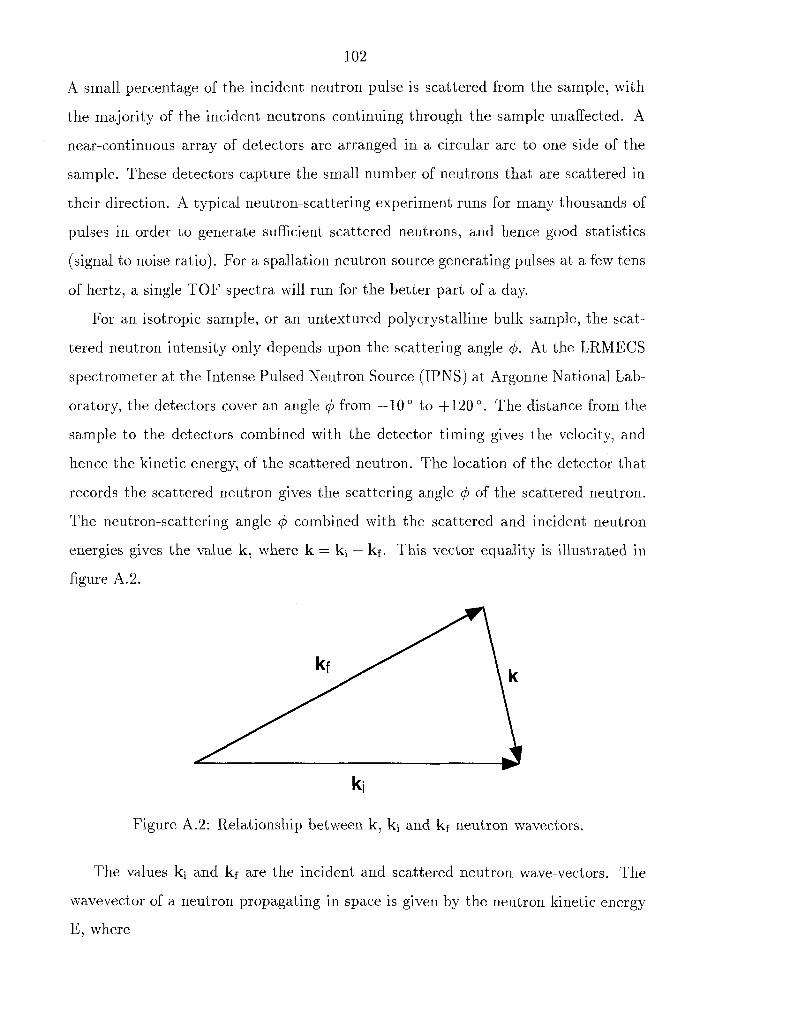
102
A small percentage of the incident neutron pulse is scattered from the sample, with
the majority of the incident neutrons continuing through the sample unaffected. A
near-continuous array of detectors are arranged in a circular arc to one side of the
sample. These detectors capture the small number of neutrons that are scattered in
their direction. A typical neutron-scattering experiment runs for many thousands of
pulses in order to generate sufficient scattered neutrons, and hence good statistics
(signal to noise ratio). For a spallation neutron source generating pulses at a few tens
of hertz, a single TOF spectra will run for the better part of a day.
For an isotropic sample, or an untextured polycrystalline bulk sample, the scat-
tered neutron intensity only depends upon the scattering angle $. At the LRMECS
spectrometer at the Intense Pulsed Neutron Source (IPNS) at Argonne National Lab-
oratory, the detectors cover an angle + from - 10 ' to $120 '. The distance from the
sample to the detectors combined with the detector timing gives the velocity, and
hence the kinetic energy, of the scattered neutron. The location of the detector that
records the scattered neutron gives the scattering angle 4 of the scattered neutron.
The neutron-scattering angle + combined with the scattered and incident neutron
energies gives the value k, where k = k; - kf. This vector equality is illustrated in
figure A.2.
Figure A.2: Relationship between k, k; and kf neutron wavectors.
The values k; and kf are the incident and scattered neutron wave-vectors. The
wavevector of a neutron propagating in space is given by the neutron kinetic energy
E, where
E is the neutron energy in meV and K is the magnitude of k in inverse angstroms. We
use interchangeably Q and K , where K = Q. The vector k points in the same direction
as the velocity vector of the neutron.
Each scattered neutron can be labeled by its energy loss and its detection angle.
Alternatively, each scattered neutron can be labeled by energy loss and k. In practice,
the neutron counts are grouped into bins of finite energy and angle width. This is
done to improve the neutron-counting statistics, and for sufficiently narrow bins does
not introduce errors into the data analysis. Two detector angle banks are shown in
figure A.l, and are labeled banks 1 and 12. At the LRMECS TOF instrument, the
default angle binning is done in increments of ten degrees, for a total of 12 angle
bins (banks). The relationship between angle-bank, energy gain and K is shown in
figure A.3.
The raw data are labeled by angle-bank and energy-transfer. This information,
combined with figure A.3, is sufficient to extract the scattering-vector magnitude K.
The most elegant presentation of the scattering data is of a three-dimensional surface,
where neutron-scattering counts are plotted as a function of the in-plane scattering
angle and energy-transfer. In figure A.4 we show a constant angle "slice" of this
scattering surface for an FeAl sample, taken on the LRMECS spectrometer at IPNS.
The quantity S(Q,E) is proportional to the neutron counts per unit time multiplied
by the factor k;/kf, where k; is the magnitude of the vector k; and kf is the magnitude
of the vector kf .
It is usually more convenient to preserve the data as a group of two-dimensional
data sets, each corresponding to a constant scattering-angle slice of the three-dimensional
scattering surface. The scattering-vector magnitude K can be calculated from the
scattering angle and energy transfer using the following equation:

Energy transfer (meV)
Figure A.3: Q as a function of angle-bank and energy gain for a TOF spectrometer. The curves are labeled by angle-bank. The incident neutron energy is 50 meV.
where Ei is the incident neutron energy in meV, x is the neutron energy-transfer in
meV, (3 is the scattering angle and K is the scattering-vector magnitude in inverse
angstroms.
In figure A.5 we show representative constant scattering-angle slices of the scatter-
ing surface of a chemically ordered FeA1 specimen with a 2% vacancy concentration.
The twelfth and fourth angle-banks correspond to median scattering angles of 115
and 35 O, respectively.
The off-scale peak between -4 and +4meV neutron-energy loss is due to elastic
scattering processes. Although phonon scattering does occur in this energy range,
the elastic scattering is greater by several orders of magnitude and we effectively lose
all information on the phonon scattering in this energy region.
Figure A.4: Scattering surface, S(Q,E), for the third angle-bank of an FeAl sam- ple containing 2% vacancies. Data taken on LRMECS spectrometer at IPNS. The incident energy is 60 meV.
The scattering to the left and right-hand sides of the elastic peak represent neu-
trons that have either gained or lost energy during the scattering process. The signal
is larger from the right-hand side of the elastic peak (positive energy-loss) because
it is easier for monochromatic neutrons to lose energy to a phonon than it is for a
phonon to impart energy to the incident neutrons. Because of the far superior signal
in the positive energy-loss portion of the data, we confine our data aiialysis to this
region only.
Neutron energy loss (meV)
Figure A.5: Neutron data (background corrected) from the twelfth and fourth an- glebanks of the LRMECS TOF spectrometer. The sample is chemically ordered B2 FeA1, with a 2% vacancy concentration. Incident neutron energy is 60 meV.
A.2 Data Analysis
Proceeding from the scattering surface data taken by the TOF spectrometer to the
phonon DOS is a multi-step, iterative procedure. In figure A.6 we illustrate the
process in a flowchart.
One must have at least two and optionally three data sets in order to proceed
reliably with the data analysis. First, the inelastic TOF spectra of the sample must
be measured. Second, some sort of background spectra must be measured, at con-
ditions that are close as possible to the conditions present when the sample data
was taken. At the LRMECS spectrometer, this is usually accomplished by removing
the sample from the A1 sample can and recording the resultant TOF spectra. One
Sample data Background data Cd data
Calculate S(0,E) from raw neutron counts
Angle Angle Bank 12
I I, Elastic Peak, Background, Multiphonon, Thermal, Debye- Waller corrections
Iterate until convergence
sum to arrive at phonon DOS
Figure A.6: Neutron data analysis flowchart. Data analysis proceeds from the raw neutron counts (top of the chart) to the phonon DOS (bottom of the chart).
can improve upon the background correction by taking a TOF spectra of a 100%
absorbing sample. At the LRMECS spectrometer, this is usually accomplished by
replacing the sample with a plate of Cd, which is completely opaque to thermal neu-
trons. The sample, empty-can and Cd data are transformed from the raw counts to
their S(4, E) representation, which also adjusts the raw neutron counts for variations
in detector effeciencies. This step is performed on LRMECS data using the iliad
code, written and maintained by Ray Osbourne. The iliad code also transforms the
3-dimensional surface representation of the scattering spectra into a more practical
group of two-dimensional data sets. Each data set represents a constant-angle "slice"
of the scattering surface, where the slice sums the neutron counts over a ten-degree
scattering angle.
A.3 Background Correction
Once the data has been transformed into the S($, E) representation, the background
corrections can be performed. The simplest background correction simply subtracts
the empty-can data, Sbg, from the sample data, SSamp1,.
This procedure is an over-correction, since the background with the sample in place
is somewhat smaller than the measured background. The background counts are
proportional to the incident neutron flux, but the sample absorbs and scatters a
certain percentage of the incident neutrons. Thus the true background counts can be
approximated by attenuating the measured background by an amount equal to the
scattering strength of the sample
where f is the percentage of the incident neutron flux that the sample scatters and
absorbs. Typical values for f are between 0.05 and 0.1. This procedure is adequate
109
but can be improved upon. We can divide the background counts into two types:
originating from scattering before the sample and after the sample. Background
counts of the former type do not undergo the (1-f) attenuation shown in equation A.4.
Background counts of the latter type do undergo the (1-f) attenuation. The Cd
background measurement allows us to separate the latter from the former. Using the
Cd data, we calculate the background correction as
where SCd is the scattering from the Cd run. In practice, the Cd signal is near zero,
so the corrections A.4 and A.5 are identical. It is more important to calculate f
correctly for each angle-bank, which requires knowing the thickness and geometry of
the specimen.
Before the phonon DOS can be derived from the data, the multi-phonon scat-
tering contribution must be subtracted from the data. The multi-phonon scattering
increases with temperature and 6 . Multi-phonon scattering arises when more than
one-phonon participates in a single neutron-scattering event. The multi-phonon scat-
tering can be calculated from the phonon DOS. We use an iterative procedure to arrive
at both the multi-phonon contribution and the phonon DOS, where the phonon DOS
is used to calculate the multi-phonon scattering and then the new phonon DOS. This
procedure is iterated until convergence. We calculate the multi-phonon scattering
within the incoherent, virtual-crystal approximation. This is the only approach pos-
sible without detailed knowledge of the lattice dynamics of the crystal. We explain
this method below.
Thermal and Multiphonon Corrections
The partial differential cross-section for a harmonic Bravais lattice is given in the
incoherent approximation as [61, 601
where U = - i ~ . ~ ( 0 ) and V = i~ - u( t ) . The variables u( t ) , crinC, kt, k, N, W, and
I3 = hw are, respectively, the atomic displacement from equilibrium at time t , in-
coherent scattering cross-section, final and initial neutron wave-vector magnitudes,
number of atoms in the crystal, Debye-Waller factor and energy transfer. Although
the one-phonon expansion of equation A.6 is a good approximation for small mo-
mentum transfer, the higher order multi-phonon terms cannot be neglected at higher
scattering vectors, where the incoherent approximation is more reliable. The TOF
spectra were measured at constant scattering angle, not constant scattering vector.
The scattering vector therefore varies with energy transfer, and this dependence is
different for each angle bank. Evaluating equation A.6 while retaining the dependence
of rc on w, the following expression is obtained for the incoherent inelastic n-phonon
double-differential scattering cross-section:
inc g inc k' N - 2 . (g) -- [p (w)] n-convolution
47rh k ae , (A.7)
where m denotes the mass of the scat terer,
and
inc
inelastic n=l n-phonon
The index s specifies a single vibrational mode and the notation (. . .), denotes an
average over all vibrational modes with frequency w. The variable es is the phonon
polarization vector of mode s. The function g is, as usual, the normalized phonon
DOS. The not at ion [f]n-cOnvo'ution specifies the sequential convolution of n instances
of the function f. For example,
and
The term ( ( K e,)'), simplifies to ~ K ( w ) ~ for a crystal with cubic symmetry, which
was the case for all our samples.
As is seen from equation A.7, the phonon DOS is obtained easily from the 1-
phonon cross-section. The latter was derived in an iterative process from the mea-
sured spectra by evaluating equation A.7 for the l-5-phonon contributions, fitting
their sum [equation A.91 to the corrected data and subtracting the 2-5 multi-phonon
contributions from the spectrum. In figure A.7 we show the 2-5 and 1-5 phonon fits
to the S(E) spectrum, at the twelfth angle-bank, for an FeAl sample at 300K.
The 2-5 phonon contributions, collectively known as the multiphonon scattering,
are considerable at room temperature. It is sufficient to sum the multiphonon scat-
tering to 5-phonon events since the n-phonon scattering rapidly goes to zero for large
n. The 1-5 phonon contribution as calculated using equation A.7 fitted remarkably
well the TOF spectra shown in figure A.7. This is surprising for a model which as-
sumes a single mass and scattering factor for an average atom, as well as neglecting
the coherent-scattering entirely. Nevertheless, since the multiphonon scattering is es-
sentially featureless, the above procedure yields a sufficiently accurate correction for
multiphonon scattering.
The remaining intensity was then corrected for the elastic-peak, thermal and
Debye-Waller factors. Mean square displacements (for use in the Debye-Waller factor)
are calculated self-consistently. The sum of the corrected intensities from all 12 angle
banks gives the phonon DOS. By summing over the angle banks, we ensure that a
large portion of reciprocal space is sampled at each phonon energy. This is necessary
in order to account for any coherent-scattering present in the sample. For a sample
that exhibits purely incoherent scattering, the entire TOF spectra is redundant. In
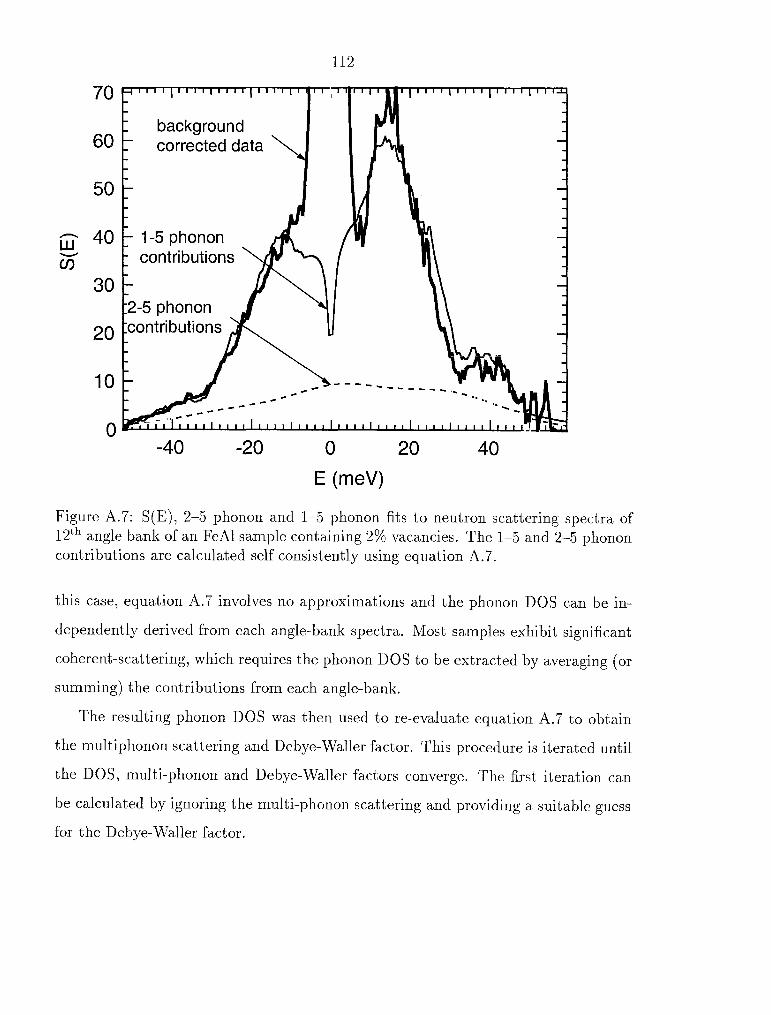
Figure A.7: S(E), 2-5 phonon and 1-5 phonon fits to neutron scattering spectra of 12" angle bank of an FeAl sample containing 2% vacancies. The 1-5 and 2-5 phonon contributions are calculated self consistently using equation A.7.
this case, equation A.7 involves no approximations and the phonon DOS can be in-
dependently derived from each angle-bank spectra. Most samples exhibit significant
coherent-scattering, which requires the phonon DOS to be extracted by averaging (or
summing) the contributions from each angle-bank.
The resulting phonon DOS was then used to re-evaluate equation A.7 to obtain
the multiphonon scattering and Debye-Waller factor. This procedure is iterated until
the DOS, multi-phonon and Debye-Waller factors converge. The first iteration can
be calculated by ignoring the multi-phonon scattering and providing a suitable guess
for the Debye-Waller factor.

Neutron-Weight Corrections
Strictly speaking, the phonon DOS arrived at using the procedure outlined above and
in figure A.6 is not the true phonon DOS, but rather the neutron-weighted DOS. The
neutron-weighted DOS is identical with the phonon DOS for an elemental scatterer.
This is not the case for a sample that contains more than one type of atom, or
scatterer. The neutron-weighted phonon DOS is rigorously defined in equation 3.2,
which is provided again here:
where exp(-2wd),od and md are the Debye-Waller factor, total scattering cross-
section and mass of atom d. The Debye-Waller factor is an explicit function of gd(E).
The term exp(2W) is the average Debye-Waller correction; this is calculated from the
self-consistent neut ron-weighted DOS . The factor exp[2(W - Wd)] is approximately
unity. For the case where ad/md is the same for all species d, gNW(E) % g(E).
The error introduced by calculating the multi-phonon scattering self-consistently
using the neutron-weighted DOS, rather than the true phonon DOS, is small. This
can be qualitatively verified by examining how well the 1-5 phonon scattering, as
calculated using equation A.7, fits the experimental data. In figure A.7 we observe a
good fit between the 1-5 phonon contribution calculated using the neutron-weighted
DOS and the experimental data. This agreement raises our confidence in the accuracy
of the 2-5 phonon contribution.
Arriving at the true phonon DOS from the neutron-weighted phonon DOS is be-
yond the scope of this appendix. Various methods have been discussed in chapters 3
and 5, with varing degrees of universality. As we mentioned in section 6.2.3, the
neutron-weight correction as well as other approximations involved in the data anal-
ysis can be overcome by fitting a dynamics model to the neutron-scattering data di-
rectly. Although this approach is both scientifically and computationally demanding,
we foresee no better method for extracting the vibrational dynamics from inelastic
neutron scattering measurements.
Appendix B Local Cluster
Approximat ion
The local cluster approximation (LCA), and its extension to the cluster variation
method, is a technique for modeling ground-state thermodynamic properties of crys-
t als. Although best known for very successfully calculating the correct configurational
entropy of ordering 1131, the LCA in principle can be used to calculate any lattice
property. A lattice property is a property of a solid which is a unique function of
the location of all the atoms in the solid. Most lattice properties can be shown to
be thermodynamic ground-st ate varia,bles, including the vibrational entropy. Within
the LCA the vibrational entropy Svib can be represented by
where the Si are the cluster coefficients associated with cluster i, ai is the ith cluster
type and 4(ai) is the spin-~roduct over cluster a;. Examples of clusters are single
atoms, all first-neighbor-neighbor pairs, all second-nearest-neighbor pairs or all first-
nearest-neighbor tetrahedrons. The function 45 is a multiplicative spin-product over
a particular cluster of type a;
where there are N atoms in cluster a and Xj is the spin value associated with the
jth atom in cluster (T. For the case of a binary alloy, we let species A have spin +1
and species B have spin -1. The spin product 4 of a first-nearest-neighbour cluster
would have four possible values because there are four ways to occupy a first-nearest
neighbour pair in a binary alloy: (- 1) (-I), (- 1)(+1), ($1) ($1) and (+I ) (-1). These
products are twofold degenerate, and 4 would either be $1 or -1, depending on the
115
occupancy of the pair cluster. In general, for a binary alloy, $ is one of two values,
-1 or $1, for any arbitrary occupancy of any arbitrary cluster.
The summations C,, q5 in equation B.l are over all clusters of type a; in the crystal.
For the case of 'CPoi,, q5(point), where "point" is the single atom cluster, this sum is
identically zero for a binary alloy of composition 50%. This can be shown in the
following fashion: The spin-product 4 takes on the value -1 for atom A and $1 for
atom B. We sum q5 over all point clusters in the crystal. Every point cluster is simply
every atom, and thus the sum ~,,in,$(point) equals (N/2)(-1) + (N/2)(+1) = 0,
where N is the number of atoms in the crystal. For a binary alloy of composition
75%, this same sum would be - f , and for 25% it is +;. The cluster coefficients S; do not depend on the occupancy of the cluster, but
vary as a function of cluster type. For temperature or pressure dependent data, we
allow S; to depend on temperature and pressure. The coefficients S; are the variable
parameters in the LCA, and they are to be solved for or fitted to, depending on the
model.
The equality in equation B. l is exact if we allow the right-hand side to sum over all
possible clusters in the crystal. In practice, we cut off the summation at some finite
cluster size and thus arrive at a "cluster approximation" or "cluster expansion."
When we are solving for the coeffecients S;, we introduce error into the values of
these parameters by truncating the sum at some finite cluster size. The power of
the LCA is in the quick convergence of the right-hand side of equation B.l ; however,
fast convergence requires an intelligent guess of the clusters that contribute most
significantly to the sum. This guess is facilitated by a strong connection between
the individual elements of the LCA sum and our physical intuition about the lattice
property in question. For most lattice properties, short-range physical interactions
predominate, with longer-range interactions contributing less. Within the LCA model
this means that smaller, more localized clusters are more important than larger, more
diffuse clusters. For this reason, the LCA always includes terms for the point and
first-nearest neighbour pair. Typical additional clusters are the first-nearest neighbour
triplet and tetrahedra.

116
For the case of the vibrational entropy, it is unclear how quickly the LCA con-
verges. The vibrational entropy depends on the energies of the phonons in a crystal,
and phonons are notoriously long-ranged excitations. A typical high-quality Born-von
KBrmBn model of an elemental metal will have significant force interactions between
sixth-nearest neighbour (or farther) pairs. There is reason to hope that the vibra-
tional entropy, however, can be expressed accurately with clusters of smaller size than
the range of the force constants needed in a Born-von KArmin model [14].
Bibliography
[I] V. Sears, E. Svensson, and B. Powell, Canadian Journal of Physics 73, 726
(1995).
[2] G. Grimvall and J . Roskn, International Journal of Thermophysics 4, 139
(1983).
[3] A. V. Langeveld and J. Neimantsverdriet, Surface Science 178, 880 (1986).
[4] S. J. Clark and G. J. Ackland, Physical Review B 48, 10899 (1993).
[5] T. B. Massalski, P. R. Hiroaki Okamoto, and L. K. Subramanian, editors, Bi-
nary Alloy Phase Diagrams, Second ed. (ASM Int., Materials Park, OH, 1990).
[6] M. E. Manley, From Elementary Excitations to Microstructures: The thermo-
dynamics of metals and alloys across length scales, PhD dissertation, California
Institute of Technology, Materials Science, 2001.
[7] 0. Eriksson, J . M. Wills, and D. C. Wallace, Physical Review B 46, 5221
(1992).
[8] E. G. Moroni, G. Grimvall, and T. Jarlborg, Physical Review Letters 76, 2758
(1996).
[9] V. Ozolins and M. Asta, Physical Review B 86, 448 (2001).
[lo] V. Ozolins, C. Wolverton, and A. Zunger, Physical Review B 58, 5897 (1998).
[ll] D. C. Wallace, Thermodynamics of Crystals (Dover, Mineola, New York, 1998).
[12] J . M. Sanchez and D. de Fontaine, Physical Review B 17, 2926 (1978).
[I31 R. Kikuchi, Physical Review 81, 988 (1951).
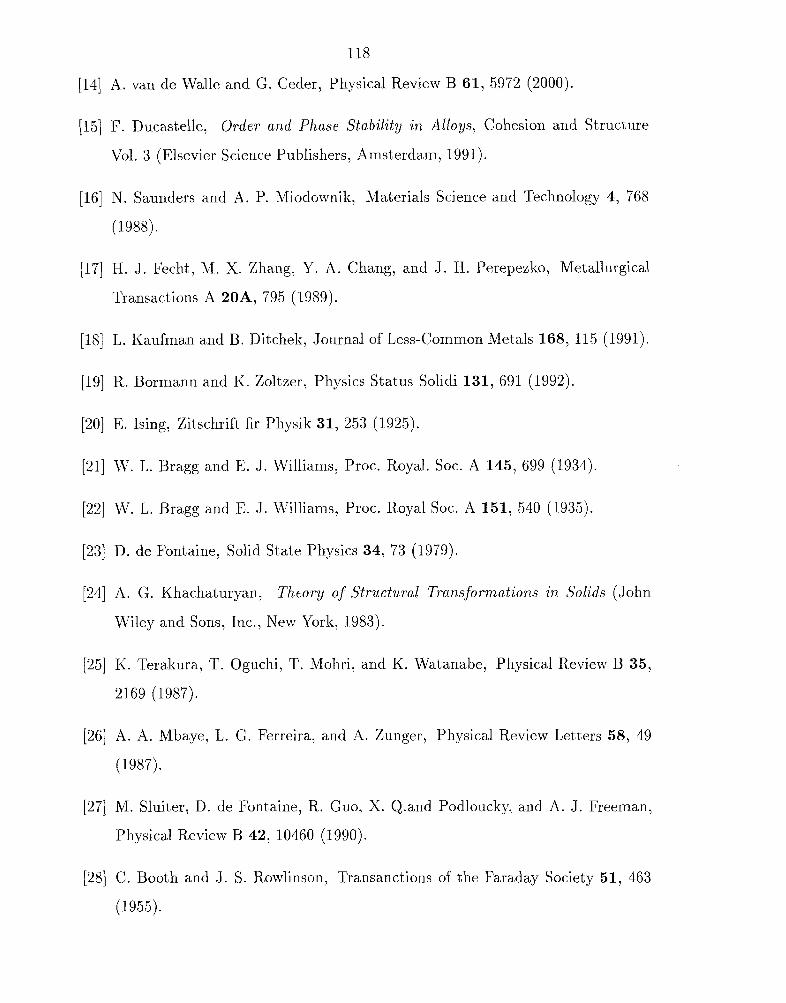
118
(141 A. van de Walle and G. Ceder, Physical Review B 61, 5972 (2000).
[15] F. Ducastelle, Order and Phase Stability in Alloys, Cohesion and Structure
Vol. 3 (Elsevier Science Publishers, Amsterdam, 1991).
[16] N. Saunders and A. P. Miodownik, Materials Science and Technology 4, 768
(1988).
[17] H. J . Fecht, M. X. Zhang, Y. A. Chang, and J . H. Perepezko, Metallurgical
Transactions A 20A, 795 (1989).
[18] L. Kaufman and B. Ditchek, Journal of Less-Common Metals 168, 115 (1991).
[19] R. Bormann and K. Zoltzer, Physics Status Solidi 131, 691 (1992).
[20] E. Ising, Zitschrift fir Physik 31, 253 (1925).
[21] W. L. Bragg and E. J . Williams, Proc. Royal. Soc. A 145, 699 (1934).
[22] FV. L. Bragg and E. J. Williams, Proc. Royal Soc. A 151, 540 (1935).
[23] D. de Fontaine, Solid State Physics 34, 73 (1979).
[24] A. G. Khachaturyan, Theory of Structural Transformations in Solids (John
Wiley and Sons, Inc., New York, 1983).
[25] K. Terakura, T. Oguchi, T. Mohri, and K. Watanabe, Physical Review B 35,
2169 (1987).
[26] A. A. Mbaye, L. G. Ferreira, and A. Zunger, Physical Review Letters 58, 49
(1987).
[27] M. Sluiter, D. de Fontaine, R. Guo, X. Q.and Podloucky, and A. J . Freeman,
Physical Review B 42, 10460 (1990).
[28] C. Booth and J . S. Rowlinson, Transanctions of the Faraday Society 51, 463
(1955).
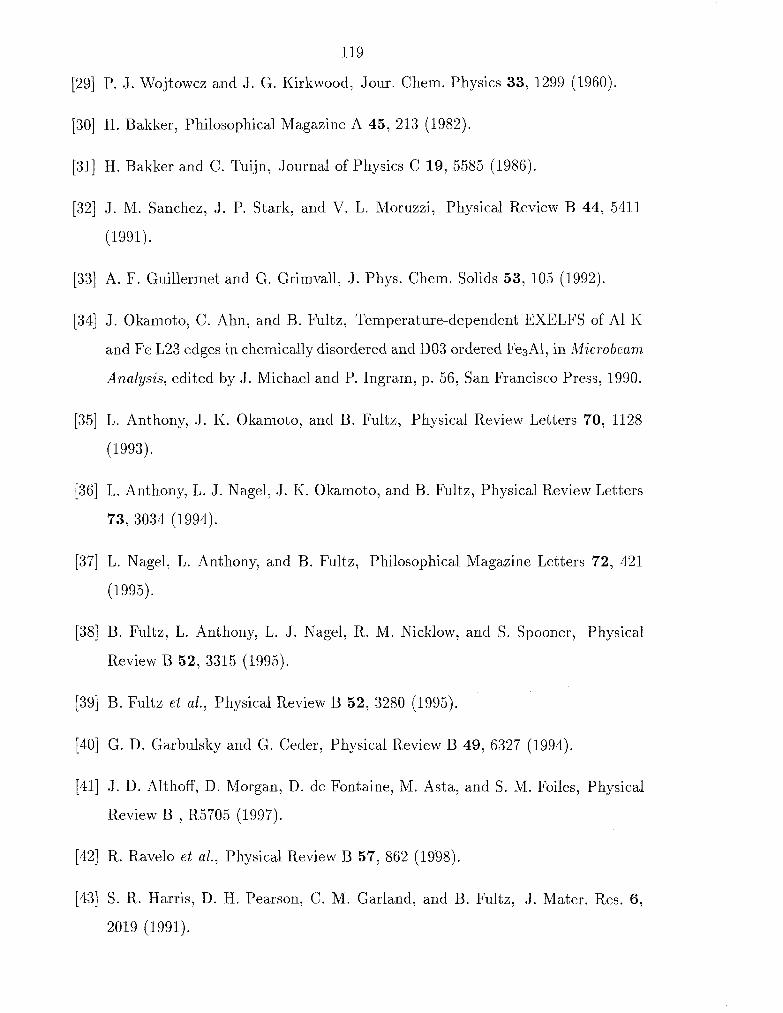
119
[29] P. J . Wojtowcz and J . G. Kirkwood, Jour. Chem. Physics 33, 1299 (1960).
[30] H. Bakker, Philosophical Magazine A 45, 213 (1982).
[31] H. Bakker and C. Tuijn, Journal of Physics C 19, 5585 (1986).
[32] J. M. Sanchez, J. P. Stark, and V. L. Moruzzi, Physical Review B 44, 5411
(1991).
[33] A. F. Guillermet and G. Grimvall, J. Phys. Chem. Solids 53, 105 (1992).
[34] J . Okarnoto, C. Ahn, and B. Fultz, Temperature-dependent EXELFS of A1 K
and Fe L23 edges in chemically disordered and DO3 ordered Fe3A1, in Microbeam
Analysis, edited by J. Michael and P. Ingram, p. 56, San Francisco Press, 1990.
[35] L. Anthony, J. K. Okamoto, and B. Fultz, Physical Review Letters 70, 1128
(1993).
[36] L. Anthony, L. J . Nagel, J. K. Okamoto, and B. Fultz, Physical Review Letters
73, 3034 (1994).
[37] L. Nagel, L. Anthony, and B. Fultz, Philosophical Magazine Letters 72, 421
(1995).
[38] B. Fultz, L. Anthony, L. J. Nagel, R. M. Nicklow, and S. Spooner, Physical
Review B 52, 3315 (1995).
[39] B. Fultz et al., Physical Review B 52, 3280 (1995).
1401 G. D, Garbulsky and G. Ceder, Physical Review B 49, 6327 (1994).
[41] J . D. Althoff, D. Morgan, D. de Fontaine, M. Asta, and S. M. Foiles, Physical
Review B , R5705 (1997).
[42] R. Ravelo et al., Physical Review B 57, 862 (1998).
[43] S. R. Harris, D. H. Pearson, C. M. Garland, and B. Fultz, J. Mater. Res. 6,
2019 (1991).
120
[44] S. Gialanella, S. B. Newcomb, and R. W. Cahn, Ordering and Disordering in
Alloys (Elsevier Applied Science, London, 1992).
(451 F. Cardellini, C. Fabrizio, G. Mazzone, A. Montone, and V. Rosato, J . Mater.
Res. 8, 2504 (1993).
[46] G. F. Zhou, M. J . Zwanenburg, and H. Bakker, J . Appl. Phys. 78, 3438 (1995).
[47] L. Nagel, L. Anthony, J . K. Okamoto, and B. Fultz, Journal of Phase Equilibria
18, 551 (1997).
[48] W. G. Stirling, R. A. Cowley, and M. W. Stringfellow, Journal of Physics F 2,
421 (1972).
[49] D. M. Paul, R. A. Cowley, and B. W. Lucas, Journal of Physics F 9, 39 (1979).
[50] C. Stassis, F. X. Kayser, C.-K. Loong, and D. Arch, Physical Review B 24,
3048 (1981).
[51] P. H. Dederichs, H. Schober, and D. J. Sellmyer, Metals: Phonon States, Elec-
tron States and Fermi Surfaces, Landolt-Bornstein Numerical Data and Func-
tional Relationships in Science and Technology Vol. III/13a (Springer-Verlag
Berlin, New York, 1981).
[52] E. Fawcett, R. Griessen, W. Joss, and W. Kress, Metals: Phonon States, Elec-
tron States and Fermi Surfaces, Landolt-Bornstein Numerical Data and Func-
tional Relationships in Science and Technology Vol. 1111 13b ( Springer-Verlag
Berlin, New York, 1983).
[53] I. M. Robertson, Solid State Communications 53, 901 (1985).
[54] M. Mostoller et al., Physical Review B Condensed Matter 40, 2856 (1989).
[55] Y. Noda, Y. Endoh, S. Katano, and M. Iizumi, Physica B & C 120,317 (1983).
[56] S. Katano, M. Iizumi, and Y. Noda, Journal Of Physics F Metal Physics 18,
2195 (1988).

121
1571 L. Anthony, L. Nagel, and B. Fultz, Vibrational entropy differences in inter-
metallic compounds from phonon densities of states, in Solid-Solid Phase Trans-
formations The Minerals, Metals @ Materials Society, edited b y W . Johnson,
J . Howe, D. Laughlin, and W. Soffa, 1994.
1581 Y. Noda and Y. Endoh, Journal of the Physical Society of Japan 57, 4225
(1988).
[59] I. M. Robertson, Journal of Physics: Condensed Matter 3, 8181 (1991).
[60] W. Marshall and S. W. Lovesey, Theory of Thermal Neutron Scattering (Claren-
don Press, Oxford, 1971).
[61] G. L. Squires, Introduction to the Theory of Thermal Neutron Scattering (Dover
Publications, Inc., New York, 1978).
[62] W. Hume-Rothery and G. V. Raynor, The Structure of Metals and Alloys
(Institute of Metals, London, 1962).
[63] A. Miedema, Philips Technical Review 36 (1976).
[64] A. Miedema, F. de Boer, and R. Boom, CALPHAD 1, 341 (1977).
[65] A. Miedema, P. de Chatel, and F. de Boer, Physica 100B, 1 (1980).
[66] D. Pettifor, Bonding and structure of molecules and solids (Clarendon Press,
Oxford, 1995).
[67] C. Bechman, W. Wallace, and R. Craig, Philosophical Magazine 27, 1249
(1973).
[68] M. Podgorny, Physical Review B 43, 11300 (1991).
1691 P. Villars and L. Calvert, Pearson's Handbook of Crystallographic Data for
Intermetallic Phases, 2 ed. (ASM International, Materials Park, OH, 1991).
1701 A. Kashyap, T. Nautiyal, and S. Auluck, Physica B 193, 248 (1994).
122
[71] K. Tanaka and M. Koiwa, Intermetallics 4, S29 (1996).
[72] B. Fultz, T. A. Stephens, W. Sturhahn, W. Toellner, and E. E. Alp, Physical
Review Letters 80, 3304 (1998).
[73] E. Teatum, J . K.A. Gschneidner, and J . Waber, Los Alamos Scientific Labora-
tory of the University of California Report No. LA-4003, 1968 (unpublished).
1741 C. Kittel, Introduction to Solid State Physics, 7 ed. (John Wiley & Sons, Inc.,
New York, 1996).
[75] Y. Touloukian, R. K. Kirby, R. E. Taylor, and P. D. Desai, editors, Thermal
Expansion: Metallic Elements and Alloys, Thermophysical Properties of Matter
Vol. 12 (IFIJPlenum, New York, 1975).
[76] G. Michal and R. Sinclair, Acta Crysta. B37, 1803 (1981).
1771 P. McCormick and Y. Liu, Acta Metallurgica et Materialia 42, 2407 (1994)
[78] G. Johari, J. McAnanama, and G. Sartor, Philosophical Magazine B 74, 243
(1996).
[79] E. Obrad6, L. Manosa, and A. Planes, Physical Review B 56, 20 (1997).
[80] P. Moine, J . Allain, and B. Renker, Journal Of Physics F: Metal Physics 14 ,
2517 (1984).
[81] S. Satija and S. Shapiro, Physical Review B 29, 6031 (1984).
[82] H. Tietze, M. Mullner, and B. Renker, Journal of Physics C: Solid State Physics
17, L529 (1984).
[83] H. Tietze, M. Mullner, P. Selgert, and W. Assmus, Journal of Physics F: Metal
Physics 15, 263 (1985).
[84] G. Herget, M. Mullner, J. B. Suck, R. Schmidt, and H. Wipf, Europhysics
Letters 10, 49 (1989).

123
[85] Y. Touloukian and E. Buyco, editors, Specific Heat: Metallic Elements and
Alloys, Thermophysical Properties of Matter Vol. 4 (IFI/Plenum, New York,
1970).
[86] G. Airoldi, G. Bellini, and C. Difrancesco, Journal Of Physics F: Metal Physics
14, 1983 (1984).
[87] D. Li, X. Wu, and T. KO, Philosophical Magazine A 63, 603 (1991).
[88] P. Bogdanoff, B. Fultz, and S. Rosenkranz, Physical Review B 60, 1 (1999).
[89] G. L. Zhao and B. N. Ha,rmon, Physical Review B 48, 2031 (1993)
[go] R. Bruinsma, Physical Review B 25, 2951 (1982).
[91] 0. Mercier, K. N. Melton, G. Gremaud, and J . Hagi, Journal of Applied Physics
51, 1833 (1980).
[92] G. Bihlmayer, R. Eibler, and A. Neckel, Physical Review B 50, 13113 (1994).
[93] J. Trampenau, W. Petry, and A. Heiming, Physica B 180 & 181, 363 (1992).
[94] F. Guthoff et al., Physical Review B 47, 2563 (1993)
[95] T. Makita, A. Nagasawa, Y. Morii, N. Minakawa, and H. Ohno, Physica B 213
& 214, 430 (1995).
1961 J. Neuhaus, W. Petry, and A. Krimmel, Physica B 234-236, 897 (1997).
[97] T. Ohba, Phase Transitions 69, 289 (1999).
[98] A. Heiming e t al., Physical Review B 43, 10948 (1991).
[99] 0. L. Anderson, editor, Equations of State of Solids for Geophysicists and
Ceramic Science (Oxford, New York, 1995).
[loo] F. Guthoff, B. Hennion, C. Herzig, W. Petry, and H. Schober, Journal of
Physics: Condensed Matter 6, 6211 (1994).
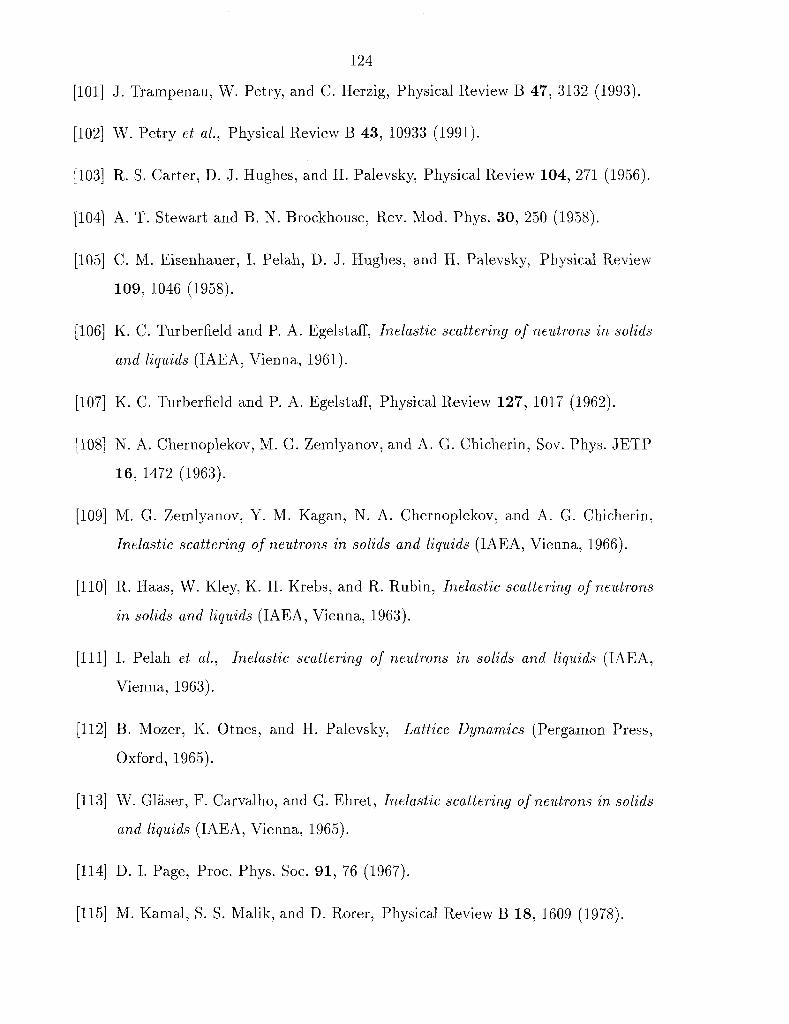
124
[ lo l l J . Trampenau, W. Petry, and C. Herzig, Physical Review B 47, 3132 (1993).
[102] W. Petry et al., Physical Review B 43, 10933 (1991).
[103] R. S. Carter, D. J. Hughes, and H. Palevsky, Physical Review 104, 271 (1956).
[I041 A. T. Stewart and B. N. Brockhouse, Rev. Mod. Phys. 30, 250 (1958).
[105] C. M. Eisenhauer, I. Pelah, D. J . Hughes, and H. Palevsky, Physical Review
109, 1046 (1958).
[106] K. C. Turberfield and P. A. Egelstaff, Inelastic scattering of neutrons in solids
and liquids (IAEA, Vienna, 1961).
[I071 K. C. Turberfield and P. A. Egelstaff, Physical Review 127, 1017 (1962).
[I081 N. A. Chernoplekov, M. G. Zemlyanov, and A. G. Chicherin, Sov. Phys. JETP
16, 1472 (1963).
[I091 M. G. Zemlyanov, Y. M. Kagan, N. A. Chernoplekov, and A. G. Chicherin,
Inelastic scattering of neutrons in solids and liquids (IAEA, Vienna, 1966).
[110] R. Haas, W. Kley, K. H. Krebs, and R. Rubin, Inelastic scattering of neutrons
in solids and liquids (IAEA, Vienna, 1963).
[ I l l ] I. Pelah et al., Inelastic scattering of neutrons in solids and liquids (IAEA,
Vienna, 1963).
[I121 B. Mozer, K. Otnes, and H. Palevsky, Lattice Dynamics (Pergamon Press,
Oxford, 1965).
[113] W. Glaser, F. Carvalho, and G. Ehret, Inelastic scattering of neutrons in solids
and liquids (IAEA, Vienna, 1965).
[I141 D. I. Page, Proc. Phys. Soc. 91, 76 (1967).
[I151 M. Kamal, S. S. Malik, and D. Rorer, Physical Review B 18, 1609 (1978).
125
[I161 H. Frase, B. Fultz, and J . L. Robertson, Physical Review B 57, 898 (1998).
[117] Y.-Y. Ye, Y. Chen, K.-M. Ho, B. N. Harmon, and P.-A. Lindgard, Physical
Review B 58, 1769 (1998).
[118] P. A. Flinn, G. M. McManus, and J . A. Rayne, Jour. of Chem. Solids 15, 189
(1960).
[119] D. T. Hawkins and R. Hultgren, J . Chem. Thermodynamics 3, 175 (1971).
[120] J . W. Lynn, H. G. Smith, and R. M. Nicklow, Physical Review B 8, 3493
(1973).
[121] E. C. Svensson, B. N. Brockhouse, and J . M. Rowe, Physical Review 155, 619
(1967).
[I221 E. C. Svensson and W. A. Kamitakahara, Canadian Journal of Physics 49,
2291 (1971).
[I231 R. M. Cunningham, L. D. Muhlestein, W. M. Shaw, and C. W. Tornpson,
Physical Review B 2, 4864 (1970).
11241 H. Bjerrum M~l l e r and A. R. Mackintosh, Physical Review Letters 15, 623
(1965).
[125] A. A. Maradudin, E. W. Montroll, G. H. Weiss, and I. P. Ipatova, Theory
of Lattice Dynamics in the Harmonic Approximation, Solid State Physics Vol.
Supplement 3, Second ed. (Academic Press, New York, New York, 1971), sec-
tion 7, pp. 353-514.
[126] R. J . Elliott and D. W. Taylor, Proc. Roy. Soc. A 296, 161 (1967).
[127] Rayleigh, Theory of Sound (Dover, New York, 1945).
[I281 I. M. Lifshitz, J. Phys. USSR 7, 215 (1943).
[I291 I. M. Lifshitz, J . Phys. USSR 7, 249 (1943).

126
11301 I. M. Lifshitz, J . Phys. USSR 8, 289 (1944).
[I311 V. Ozolins, Private communication, 2000.
[I321 M. E. Manley et al., Phys. Rev. Lett. 86, 3076 (2001).


![Review Article Prediction of Spectral Phonon Mean Free Path ...obtained the phonon relaxation times by Umklapp ( ) three-phonon scattering [ , ] and defect scattering [ ], Herring](https://img.pdfslide.net/doc/110x75/610ec2441e225c0bdc196ade/review-article-prediction-of-spectral-phonon-mean-free-path-obtained-the-phonon.jpg)