Embed Size (px)
Citation preview
1
The Physics Behind Drag Racing:
A look into Weight, Tire Pressure, Maximum Speed,
and Time Relationships
Dylan Mercer
4/30/2014
Advisor: Professor Leon Cole
2
Abstract
In drag racing, one of the most important factors that affect a vehicle is how much it
weighs. Racers and teams will remove all unnecessary weight to produce a faster vehicle.
Another important factor is the tire pressure in which racers adjust to find optimal surface area
over the racing surface. My experiment examined the exact effects weight and tire pressure have
on a vehicle performing a drag racing run. My primary objective was to confirm that, on a 1/8
mile track, 0.07 seconds would reduce from the elapsed time per 100 pounds removed from the
vehicle. My secondary objective was to conclude that when racing with a slightly lower tire
pressure, the vehicle would perform better than at a moderately higher pressure. To obtain data I
formulated an experiment in which I altered weight and tire pressure while keeping all other
variables independent. My results partially allowed to me examine my initial objectives but
mostly introduced error which accounted for unexpected results.
3
Introduction
The engineering and science that goes into auto racing is becoming more detailed than
ever before. In professional racing series, winning margins are often in the hundredths and
thousandths of a second. Although this science can be complex, there are big-picture factors that
can be examined with a good understanding of math, physics, and general car knowledge. The
two main results in any racing series are the time of a run or lap and the speed at which that time
can be achieved. To achieve great results, experts focus on vehicle handling, aerodynamics, and
power. Closely related to these is the weight of the vehicle. While bound by many rules and
regulations, teams do as much as they can to make their vehicle as light as possible. Basic
physics tells us that the heavier mass an object has, the slower it will go.
In drag racing, the number one rule of thumb is that per 100 pounds taken out of a
vehicle, 0.10 seconds will be reduced from the elapsed run time. This formula ties to the results
on a 1/4 mile course since most National Hot Rod Association (NHRA) races are conducted on a
track of this length. The same rule of thumb applies for 1/8 mile length tracks but instead, 0.07
seconds is said to be reduced per 100 pounds removed. This rule of thumb is very important to
drag racing because all of the other main factors remain constant. While drag due to air
resistance plays a huge factor in the aerodynamics on the car, the shortness of the race only
allows a small amount of time for this to become a big factor. Handling is also important because
the driver needs to comfortably maneuver the vehicle down the track. Though overall, the
handling of the car doesn't greatly factor into the results. This brings us to the power produced by
the vehicle. Not only a perfectly engineered engine will ensure good results, a good drivetrain
can be greatly diminished by extra weight or a lack of traction. This leads gear heads to often
analyzing their power to weight ratio. This means that a car with less horsepower could
4
potentially win a race against a car with more horsepower because the first car is either lighter, or
able to deliver its power to the ground more thoroughly. In order to provide optimal traction,
large tires, known as drag radials or race slicks, are used to increase the surface area of the tire so
that more friction with the surface is capable. In the top divisions of drag racing, these radial tires
are so large that traction is nearly perfect and the full amount of the engine's power is being used
to propel the vehicle forward. The surface area of these tires is greatly affected by the pressure
inside of them. Large drag radials can be inflated to less than ten pounds per square inch (psi) to
maximize this surface area. As a comparison, factory consumer vehicles often have tires rated
between 30 psi and 40 psi and are about 25% of the size. Out of all of these factors that go into
producing a fast race car, weight and tire pressure are the easiest to control. Therefore, I
developed my experiment to examine exactly how the two variables affect the elapsed time and
top speed of a drag racing run.
My primary objective was to confirm that, on a 1/8 mile track, 0.07 seconds would
reduce from the elapsed time per 100 pounds removed from the vehicle. My secondary objective
was to demonstrate that racing with a slightly lower tire pressure would result in a faster time
than using a higher tire pressure. The results I expected were quite simple. As 100 pounds was
added to my vehicle, I expected to see a 0.07 second addition to my elapsed time. I expected this
addition in time to occur each time 100 pounds was added, even when I got into the maximum
weight that the vehicle could handle. In regards to the tire pressure, I expected that a lower tire
pressure would also reduce the elapsed time about 0.07 seconds compared to a run with higher
tire pressure. I estimated that these time changes due to tire pressure would results from at least a
10, but more likely a 15 to 20, psi difference. Hot Rod Magazine performed a similar experiment
5
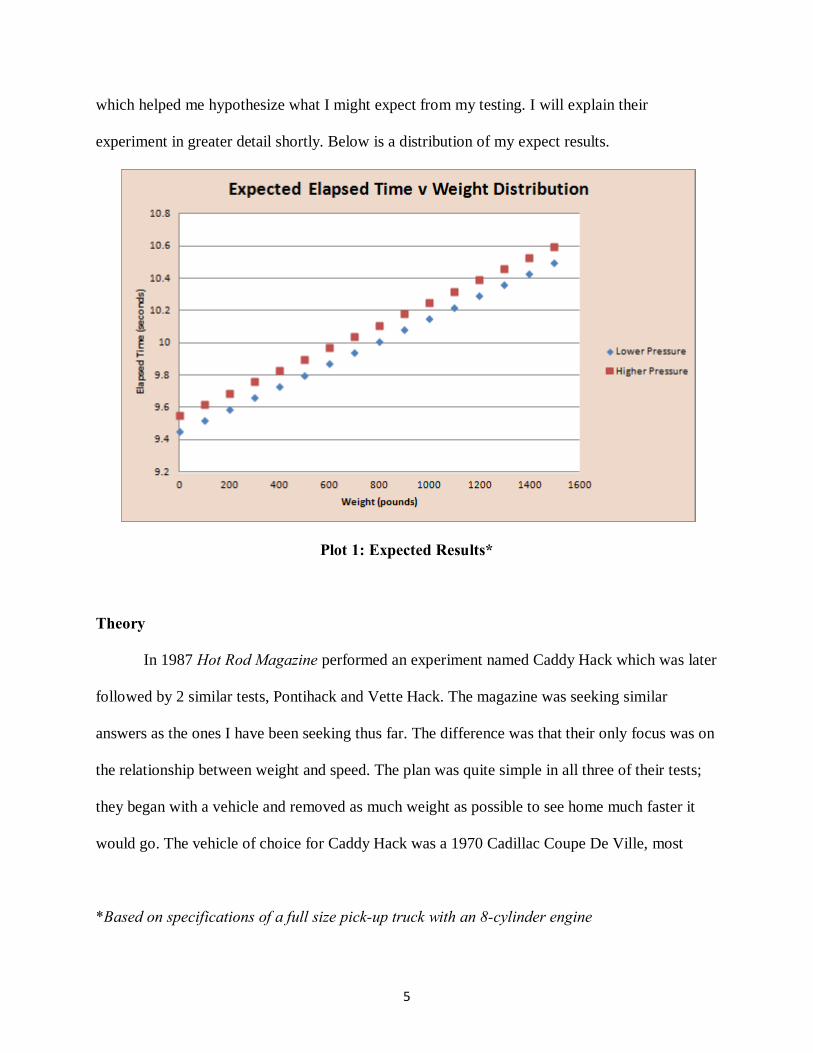
which helped me hypothesize what I might expect from my testing. I will explain their
experiment in greater detail shortly. Below is a distribution of my expect results.
Plot 1: Expected Results*
Theory
In 1987 Hot Rod Magazine performed an experiment named Caddy Hack which was later
followed by 2 similar tests, Pontihack and Vette Hack. The magazine was seeking similar
answers as the ones I have been seeking thus far. The difference was that their only focus was on
the relationship between weight and speed. The plan was quite simple in all three of their tests;
they began with a vehicle and removed as much weight as possible to see home much faster it
would go. The vehicle of choice for Caddy Hack was a 1970 Cadillac Coupe De Ville, most
*Based on specifications of a full size pick-up truck with an 8-cylinder engine
6
likely chosen because they were very heavy cars. As they began their testing, the car was filled
with as much weight as possible and was followed by a ¼ mile run. Weight was removed from
the car for each proceeding run. Once all of the car’s extra weight was removed, the team began
removing doors and body panels. In the end, the car had lost nearly 4,000 pounds and all that
remained was a drivable frame. This experiment gave me an initial idea of how to perform a test
examining the weight of a vehicle. Most importantly, the results from this test almost perfectly
verified the drag racing rule of thumb I was seeking to verify myself. The vehicle began at 6,780
pounds and was reduced to 2,900 pounds, a difference of 3,880 pounds. This weight difference
resulted in an overall time decrease of 3.67 seconds and an overall top speed difference of 20.82
miles per hour (MPH). The most useful calculation to take away from these results is that 0.095
seconds was reduced per 100 pounds removed from the vehicle on average. This is only 0.005
seconds different from the goal of a 0.01 seconds decrease. This result gave me perfect insight
into what I could expect from my experiment. Since Hot Rod Magazine didn't observe any other
variables, my testing was the perfect place to pick up from their findings to examine the
relationships that weight and tire pressure have with final results.
Methods
The knowledge I gained from Hot Rod Magazine's test provided me with a good place to
begin, but I had to make a few modifications. The biggest difference was that I couldn’t afford to
obtain weight loss by destroying a car. The vehicle used would need to be in the same condition
before and after my testing. I began with a rough outline of how I was going to obtain good data.
I was planning to find a 1/4 or 1/8 mile drag strip and a used vehicle. Once there I would perform
7
a run with a different weight, starting with zero extra pounds and ending with 1,500 extra
pounds. Then I would alter tire pressure between a low pressure and a high pressure to accurately
see how weight and tire pressure affect the final results. The big picture was that each weighted
run would be done at two different tire pressures, which would produce my expected results.
My initial focus was on the type of vehicle and a weight source that was contained, easily
moveable, and reliable. I came to the conclusion that bagged sand would provide a rather
consistent weight source which was also cheap. It turned out that sand traditionally comes in 50
pounds bags at hardware stores, so adding 100 pounds at a time would be quite easy. Since I was
planning on using up to 1,500 pounds of sand, I needed a vehicle with a large enough payload to
safely handle the extra weight. Manufacturers rate each vehicle they produce with a payload
rating, this refers to the amount of weight the vehicle can safely hold and still function properly.
Most sedans have a payload rating of 1,000 pounds. This meant that I was going to need an SUV
or a truck, but due to a minimal budget I was not going to be able to purchase a used one. My
only remaining option was to rent one. A rental truck fit into my budget and offered an exact
payload of 1,500 pounds which is exactly what I needed. I looked into a number of facilities in
Virginia and finally got hooked up with Sumerduck Dragway in Sumerduck, Virginia.
Sumerduck is a 1/8 drag strip open from March through November. Once I established where I
was going to conduct my testing I picked the beginning of the racing season as my testing date.
As I got closer to my testing date I started to realize that I wasn't going to have enough
time at the track to complete all of my runs. Two runs at each weight and a few control runs
added up to 33 total runs. The track was only going to be open for four hours each weekend and
with a rental I could only afford to go once. Plus the track was open to the public; this meant that
there could have been many other racers present. To save time and still gather my results, I
8
changed my increment of weight to 200 pounds instead of 100 pounds. I also planned to test up
to 1,200 pounds, instead of 1,500 pounds. These adjustments brought me down to 15 total runs
which equated to one every 16 minutes. From my research and after consulting with the track
owner, this seemed like a realistic goal.
On the weekend of my test, I picked up the rental truck on Saturday to conduct some
preliminary data and get comfortable with it before I went to the track on Sunday. I had access to
a vehicle scale owned by Vulcan Materials which allowed me to get base weight measurements
on the truck. The curb weight was 5,420 pounds and 5,580 pounds with me inside. I was more
concerned with the latter measurement because my control runs would be with zero extra
pounds, but my weight had to be accounted for. The truck was a brand new 2014 Dodge Ram
1500 Crew Cab with about 400 horsepower and 400 ft*pounds of torque. As I mentioned
previously, the payload capacity on this truck was 1,500 pounds. This meant that the maximum
weight of 1,200 pounds plus the weight of myself would be sustainable by the truck. The factory
tires were rated at 40 psi, so I chose a high pressure of 45 psi and a low pressure of 35 psi.
Lastly, the vehicle was brand new so I needed to make sure it was broken in. New vehicles have
a break-in period in which it is ill-advised to accelerate quickly during that period. The factory
break-in period for this truck was only 300 miles. By the time my testing began, the truck had
nearly 900 miles on it so I was indeed out of the break-in period.
On March 2, the day of my testing, I arrived at Sumerduck before they opened to meet
with the owner, Mike Anderson. Mike told me all that I needed to know to successfully stage my
vehicle for each race, and explained his experiences with weight and drag racing. A racer
himself, Mike confirmed both 1/4 mile and 1/8 mile track time reductions when 100 pounds is
removed from a vehicle. With rain in the forecast, I adjusted the order in which I was going to
9
gather my data. Instead of alternating tire pressures each run, I planned to do all of my runs at the
higher tire pressure before I reduced to my lower pressure. This was also done to save time
because I would have wasted a few minutes every other run traveling to the air compressor to fill
my tires.
Once the track was officially open I lined up for my first run with no added weight at
45psi. This run was only a test run to get familiar with the truck and timing of the starting tree. A
tree is the name given to the sequence of lights that begins a drag race. From there I proceeded to
start my actual testing. I performed another run with zero added weight as my first control. Once
complete, I continued to complete each run at the higher tire pressure until I reached my
maximum weight of 1,200 pounds added. Before each run I recorded the tire pressure to see how
much it changed as I raced. Since the truck was brand new, it had tire pressure reading on the
dashboard. These measurements were checked to be accurate before the testing began. I also
recorded oil temperature, transmission temperature, and coolant temperature to see if any trends
occurred with those readings. An infrared thermometer was used to measure the tire temperature
before each run as well as the air temperature and track surface temperature. After each run I
once again measure the tire temperatures and also received a ticket with my reaction time, 0-60
MPH time, elapsed time, and maximum velocity. Periodic rain showers occurred in the first two
hours and while the first few were overcome, the final rain closed the track for the rest of the
day. As a result, I did not get to perform runs at a lower tire pressure but due to strategic
planning, I recorded enough data to analyze my primary objective.
10
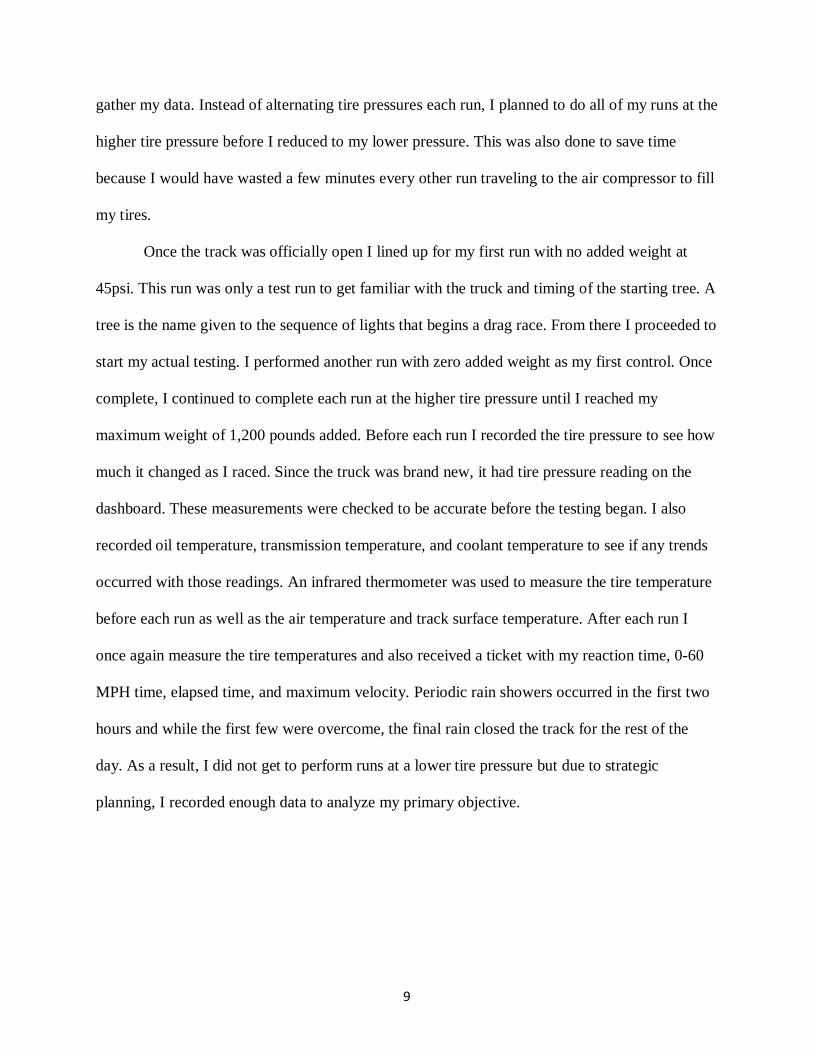
Data
Added Weight Tire Pressure Elapsed Time Maximum Speed
0 45 11.270 71.65
200 45 11.042 71.00
400 45 11.173 69.57
600 45 10.697 70.72
800 45 10.556 70.10
1000 45 10.212 69.29
1200 45 10.218 69.07
Table 1: Results
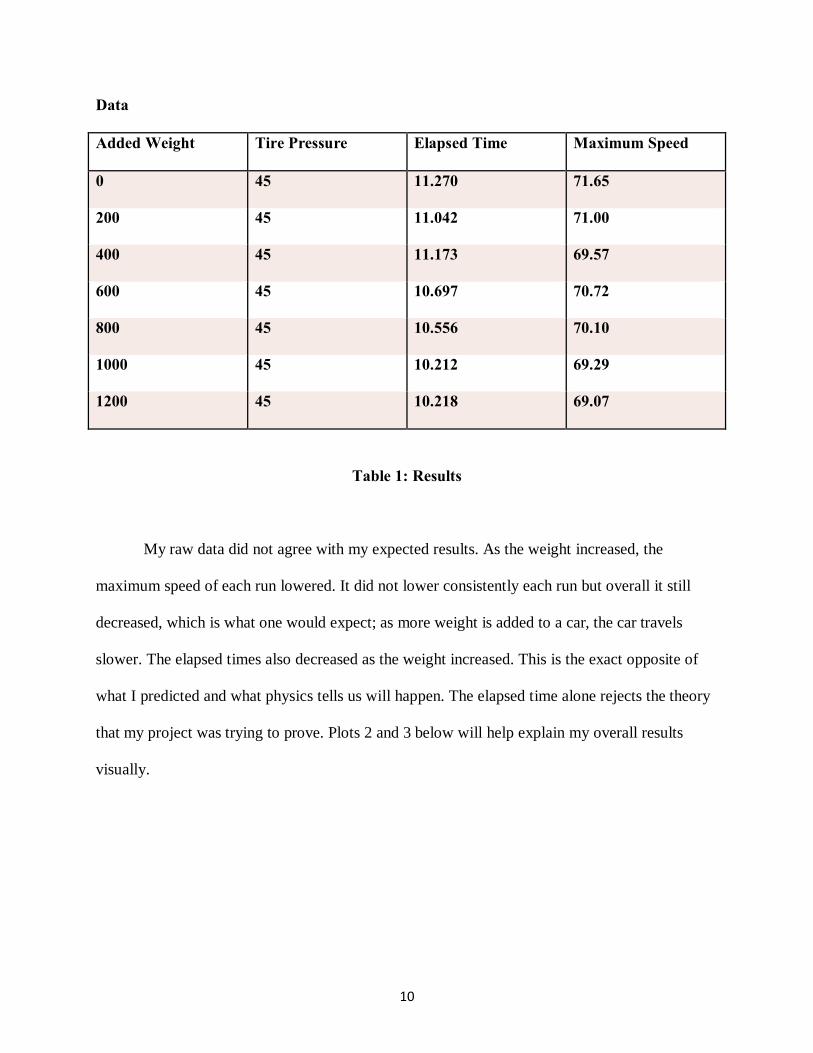
My raw data did not agree with my expected results. As the weight increased, the
maximum speed of each run lowered. It did not lower consistently each run but overall it still
decreased, which is what one would expect; as more weight is added to a car, the car travels
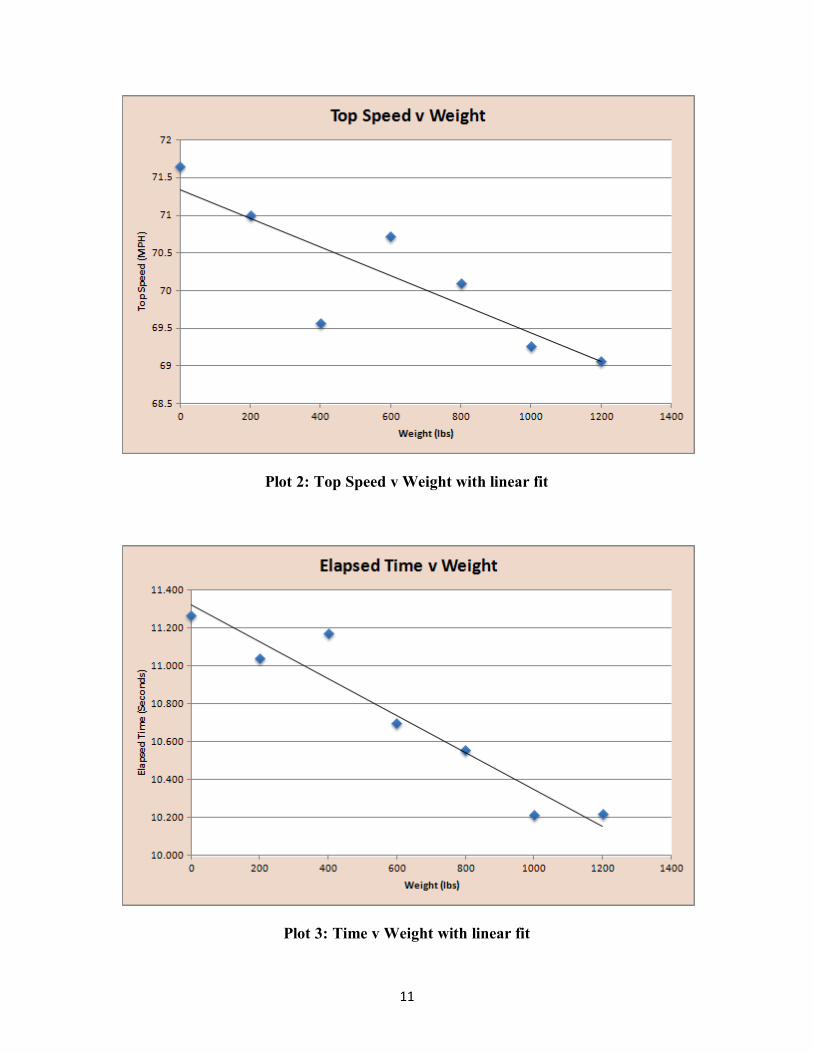
slower. The elapsed times also decreased as the weight increased. This is the exact opposite of
what I predicted and what physics tells us will happen. The elapsed time alone rejects the theory
that my project was trying to prove. Plots 2 and 3 below will help explain my overall results
visually.
11
Plot 2: Top Speed v Weight with linear fit
Plot 3: Time v Weight with linear fit
12
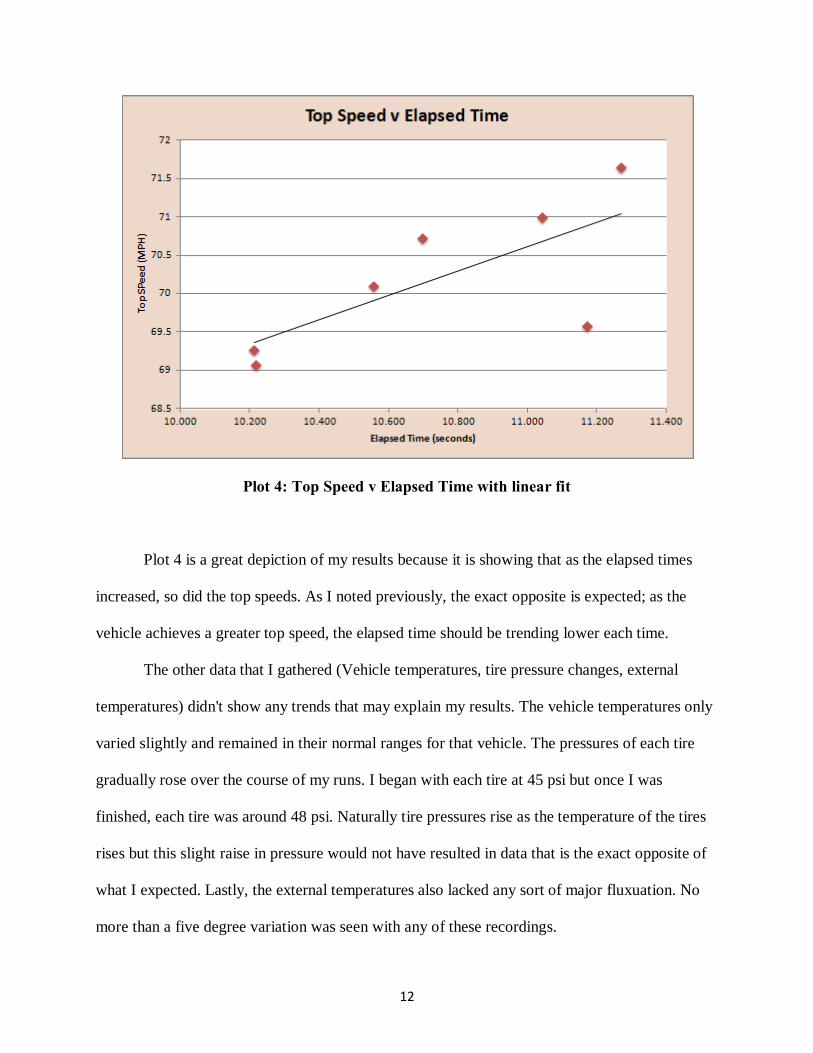
Plot 4: Top Speed v Elapsed Time with linear fit
Plot 4 is a great depiction of my results because it is showing that as the elapsed times
increased, so did the top speeds. As I noted previously, the exact opposite is expected; as the
vehicle achieves a greater top speed, the elapsed time should be trending lower each time.
The other data that I gathered (Vehicle temperatures, tire pressure changes, external
temperatures) didn't show any trends that may explain my results. The vehicle temperatures only
varied slightly and remained in their normal ranges for that vehicle. The pressures of each tire
gradually rose over the course of my runs. I began with each tire at 45 psi but once I was
finished, each tire was around 48 psi. Naturally tire pressures rise as the temperature of the tires
rises but this slight raise in pressure would not have resulted in data that is the exact opposite of
what I expected. Lastly, the external temperatures also lacked any sort of major fluxuation. No
more than a five degree variation was seen with any of these recordings.
13
There is likely no error involved from my controlled variables or measurement tools. The
weight was strictly controlled; any difference in weight of a bag of sand would have been in the
grams. All of my results were measured exactly the same each run using optics. The time was
measured from the second the vehicle crossed the initial timing mark. This means that no matter
what the driver's reaction time is, their individual time is still correct. Reaction times are only
important when racing an opponent. The timer is ended once the vehicle crosses the final timing
mark. At this point, the vehicle maximum speed was measured by radar.
Discussion
Although I did not get the results I was expecting, there is still a good explanation as to
why my prediction was incorrect. The one factor that I did not account for when planning my
experiment was the traction between the truck and the racing surface. I knew that an automatic
transmission would allow for more consistent gear changes and would probably eliminate wheel
spin. Although having an automatic probably did help out the consistency of each run, as well as
the fact that the truck had a traction control setting, the truck was simply too powerful to
consistently obtain perfect traction. As my runs progressed with more weight, the amount of
wheel spin declined until my two final runs with 1,000 and 1,200 extra pounds. From this
observation it became clear that the truck needed the extra weight to improve its traction
My initial analysis was to take my top speed v weight data, since it reflected what I was
expecting, and work backwards to find the average change in time per 100 pounds added. I
gathered the fitted top speeds per 100 pounds added and from there, knowing the distance
traveled, I solved for the acceleration of each run. Then I solved for what the elapsed time would
have needed to be each run to get those top speeds. The fitted result had an expected slope which
14
showed that the average change in elapsed time per 100 pounds removed from around 0.05
seconds. This appeared to be correct because I was expecting the average change in time to be
0.07 seconds, but this analysis was not correct. The mistake I made here was that the acceleration
was not constant during any of my runs. When the truck was at its initial maximum traction
level, maximum acceleration was achieved. So for most of the runs, that wasn't until a few
seconds had elapsed and the tires finally stopped spinning. This means that I could not analyze
my data this way.
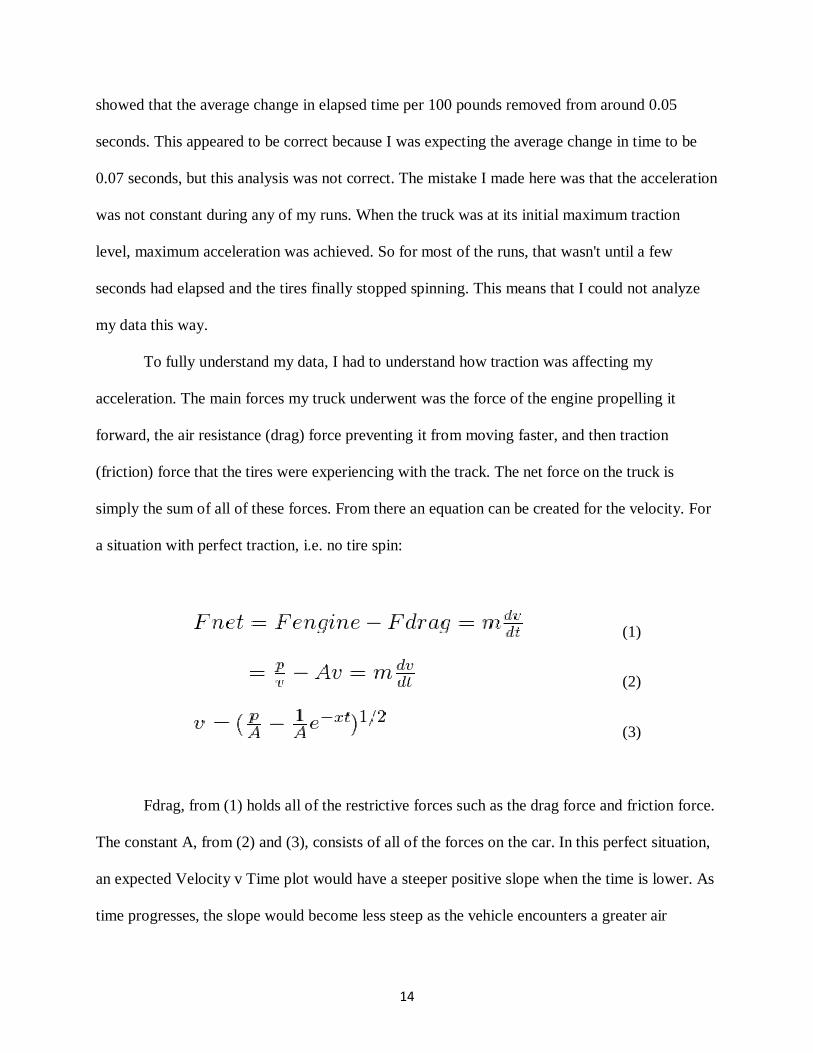
To fully understand my data, I had to understand how traction was affecting my
acceleration. The main forces my truck underwent was the force of the engine propelling it
forward, the air resistance (drag) force preventing it from moving faster, and then traction
(friction) force that the tires were experiencing with the track. The net force on the truck is
simply the sum of all of these forces. From there an equation can be created for the velocity. For
a situation with perfect traction, i.e. no tire spin:
(1)
(2)
(3)
Fdrag, from (1) holds all of the restrictive forces such as the drag force and friction force.
The constant A, from (2) and (3), consists of all of the forces on the car. In this perfect situation,
an expected Velocity v Time plot would have a steeper positive slope when the time is lower. As
time progresses, the slope would become less steep as the vehicle encounters a greater air
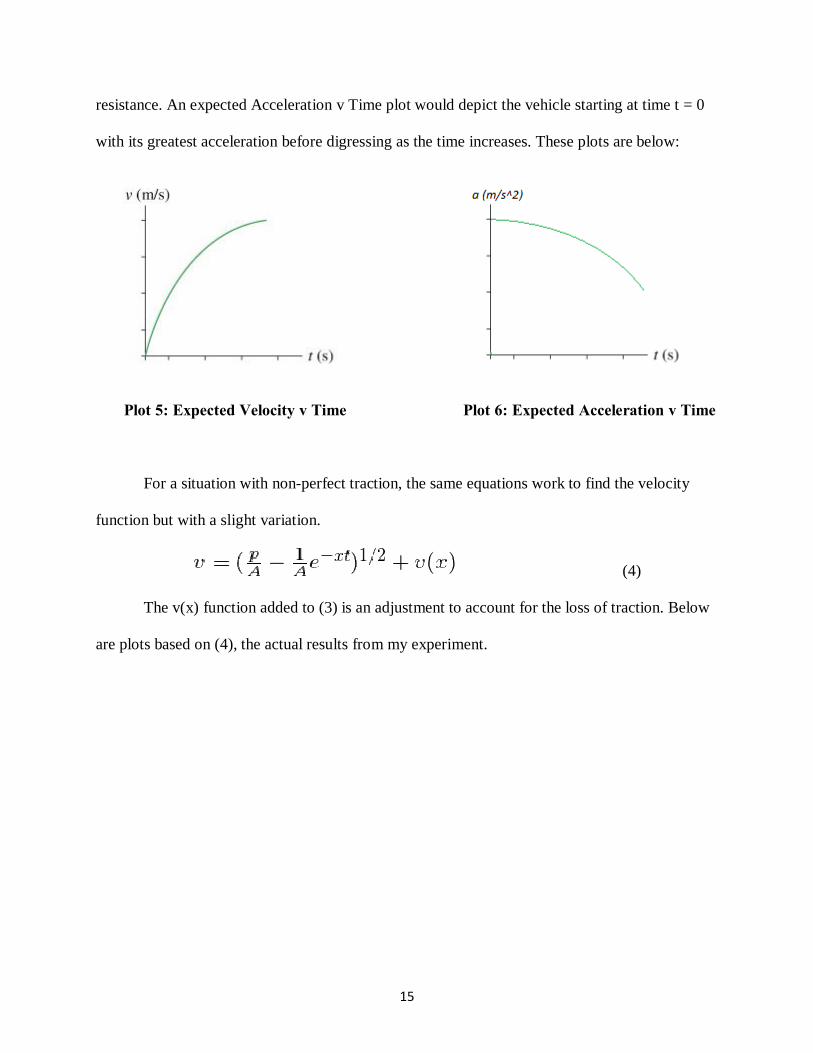
15
resistance. An expected Acceleration v Time plot would depict the vehicle starting at time t = 0
with its greatest acceleration before digressing as the time increases. These plots are below:
Plot 5: Expected Velocity v Time Plot 6: Expected Acceleration v Time
For a situation with non-perfect traction, the same equations work to find the velocity
function but with a slight variation.
(4)
The v(x) function added to (3) is an adjustment to account for the loss of traction. Below
are plots based on (4), the actual results from my experiment.
16
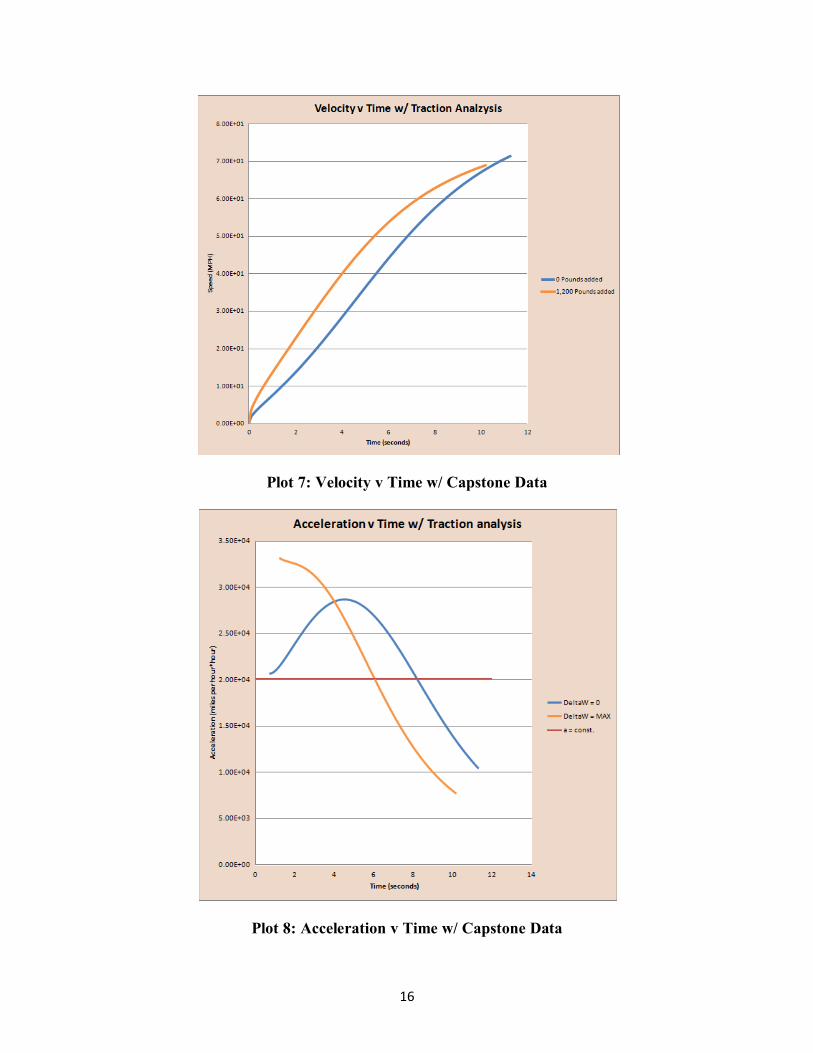
Plot 7: Velocity v Time w/ Capstone Data
Plot 8: Acceleration v Time w/ Capstone Data
17
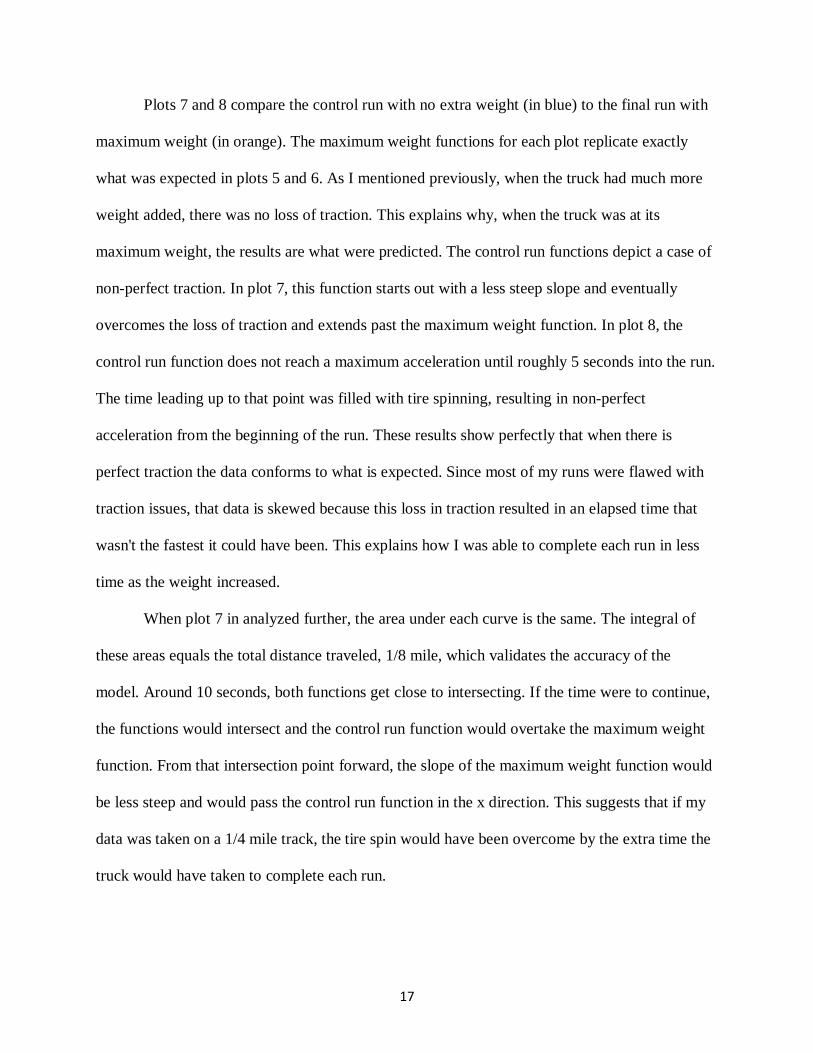
Plots 7 and 8 compare the control run with no extra weight (in blue) to the final run with
maximum weight (in orange). The maximum weight functions for each plot replicate exactly
what was expected in plots 5 and 6. As I mentioned previously, when the truck had much more
weight added, there was no loss of traction. This explains why, when the truck was at its
maximum weight, the results are what were predicted. The control run functions depict a case of
non-perfect traction. In plot 7, this function starts out with a less steep slope and eventually
overcomes the loss of traction and extends past the maximum weight function. In plot 8, the
control run function does not reach a maximum acceleration until roughly 5 seconds into the run.
The time leading up to that point was filled with tire spinning, resulting in non-perfect
acceleration from the beginning of the run. These results show perfectly that when there is
perfect traction the data conforms to what is expected. Since most of my runs were flawed with
traction issues, that data is skewed because this loss in traction resulted in an elapsed time that
wasn't the fastest it could have been. This explains how I was able to complete each run in less
time as the weight increased.
When plot 7 in analyzed further, the area under each curve is the same. The integral of
these areas equals the total distance traveled, 1/8 mile, which validates the accuracy of the
model. Around 10 seconds, both functions get close to intersecting. If the time were to continue,
the functions would intersect and the control run function would overtake the maximum weight
function. From that intersection point forward, the slope of the maximum weight function would
be less steep and would pass the control run function in the x direction. This suggests that if my
data was taken on a 1/4 mile track, the tire spin would have been overcome by the extra time the
truck would have taken to complete each run.
18
Conclusion
My raw data did not allow me to confirm or deny that a vehicle will lose 0.07 seconds on
a 1/8 mile run per 100 pounds removed. Although I could not conclude that goal, I understand
exactly why I did not measure the data I was expecting. I was also unable to definitively
conclude my analysis on tire pressure because I was only able to test my higher pressure. I
believe that if I had been able to test my lower pressure, the results from those runs would have
shown to be closer to what I was expecting. I don't think that perfect traction would have been
possible with the stock tires on the truck, no matter the tire pressure, but a lower tire pressure
would have most likely helped. To achieve perfect traction without extra weight, the surface area
of the tire making contact with the track surface would have needed to be increased by using
drag radials.
To further improve my experiment, a different vehicle could be used to eliminate traction
issues. I used a truck because it allowed me to safely add large amounts of weight. A car would
most likely be a better fit because the weight is more equally distributed. With the truck, much
more weight was in the front due to the large engine, leaving a very light rear end which resulted
in poor traction. I could have also chosen a vehicle with less horsepower. A more powerful
vehicle was more reliable when transporting large amounts of weight, but this power was what
caused the wheel spin. I could have also used a vehicle with front wheel drive or all wheel drive.
Since most American cars have engines in the front, a front wheel drive vehicle has more weight
to keep the drive wheels from losing contact with the surface. The thought is similar with an all
wheel drive vehicle but all four wheels would be used to propel the car forward, meaning the
force due to traction would double and less wheel spin would ensue. Another method I could
have tried was to accelerate from a rolling start. If I had access to a stretch of open road or an
19
oval race track with straightaways, I could have measured similar results except without traction
issues. By starting at a slow speed instead of zero miles per hour and accelerating within a
controlled distance, I would have mostly likely had no wheel spin.. Theoretically the results
would have been very similar to an actual drag racing run from rest. I also could have obtained
better results by using a professional driver in an actual dragster. An experienced racer could
limit wheel spin, and their car would be perfect for these tests because its sole purpose is for drag
racing. Lastly, if I had tested on a 1/4 mile course, I believe my data would have reflected what
was expected even with tire spin. As I mentions previously, if the time in plot 7 would have
roughly doubled, the run with a lower weight would have prevailed and resulted in a shorted
elapsed time.
20
Bibliography
• Air pressure, temperature fluctuations. (2013). Retrieved from
http://www.tirerack.com/tires/tiretech/techpage.jsp?techid=73
• Freiburger, D. (2010, November 01). Hot rod hack ups - where it all began. Hot Rod
Magazine , Retrieved from
http://www.hotrod.com/feature_stories/hrdp_1011_hot_rod_hack_ups/
• Freiburger, D. (2004, January 01). 1970 cadillac coupe de ville drag race weight
palmdale. Hot Rod Magazine, Retrieved from
http://www.hotrod.com/eventcoverage/hrdp_0401_1970_cadillac_coupe_de_ville_drag_
weight/
• An introduction to car physics modeling for games. (2003, November 1). Car Physics for
Games . Retrieved November 1, 2013, from
http://www.asawicki.info/Mirror/Car%20Physics%20for%20Games/Car%20Physics%20
for%20Games.html
• Finnegan, M. (2010, November 1). Corvette Hack Track Test. Hot Rod Magazine .
Retrieved April 1, 2014, from
http://www.hotrod.com/projectbuild/hrdp_1011_corvette_hack_track_test/