Embed Size (px)
Citation preview

ElDeeb et al. Futur Bus J (2021) 7:32 https://doi.org/10.1186/s43093-021-00073-w
RESEARCH
The pillars determining financial inclusion among SMEs in Egypt: service awareness, access and usage metrics and macroeconomic policiesMohamed Samy ElDeeb1* , Yasser Tawfik Halim2 and Esmat Mostafa Kamel3
Abstract
Over the past decade, financial inclusion has been a trending topic and key priority in developing countries seeking to build a resilient financial sector and pursuing economic growth. Most of the recently launched financial inclu-sion initiatives in Egypt, especially those aligned with the 2030 sustainability strategy, have targeted marginalized and excluded individuals. Only a few have addressed the financial inclusion of small- and medium-sized enterprises (SMEs). Accordingly, this paper aims to identify the main pillars of financial inclusion for SMEs. In keeping up with the mainstream literature, it introduces a number of financial inclusion determinants designed to attract SMEs. They include supply-side determinants such as access to financial services and marketing awareness campaigns, which act as tools to segment financial services and market their benefits to SMEs, and demand-side determinants, which involve the use of financial services. Finally, there is an assessment of the macroeconomic risks to investors and SMEs. The researchers’ methodology was based on first deriving a novel dataset from responses to a questionnaire address-ing bankers who manage SME portfolios, second analyzing the dataset through descriptive and inferential statistics and third undertaking a twofold econometric estimation. The econometric estimations started with principal compo-nent analysis (PCA) and proceeded to a logistic regression to determine the significant variables pertinent to increas-ing the financial inclusion of SMEs. The PCA suggested three main pillars determining financial inclusion. They are integrated marketing tools, which increase SMEs’ awareness of and access to the most sophisticated banking services, usage of banking services, and assessment of the macroeconomic risks that would prevent SMEs from gaining access to financial services. As well, the interaction term between the variables derived from the three pillars accounts for a variability of 86.6% in the level of financial inclusion of Egypt’s SMEs.
Keywords: Financial inclusion, SMEs, Usage of banking services, Marketing awareness tools, Macroeconomic risk, Principal component analysis, Egypt
© The Author(s) 2021. This article is licensed under a Creative Commons Attribution 4.0 International License, which permits use, sharing, adaptation, distribution and reproduction in any medium or format, as long as you give appropriate credit to the original author(s) and the source, provide a link to the Creative Commons licence, and indicate if changes were made. The images or other third party material in this article are included in the article’s Creative Commons licence, unless indicated otherwise in a credit line to the material. If material is not included in the article’s Creative Commons licence and your intended use is not permitted by statutory regulation or exceeds the permitted use, you will need to obtain permission directly from the copyright holder. To view a copy of this licence, visit http:// creat iveco mmons. org/ licen ses/ by/4. 0/.
IntroductionFinancial inclusion has achieved great notoriety among recently introduced concepts, especially after the onset of the 2008 global financial crisis. That crisis compelled international financial institutions to devise innovative strategies to achieve financial stability and provide access
to the highest number of banking services possible. Once financial inclusion and stability are achieved, economic growth will be stimulated, and size of the underground economy will diminish. Many countries, especially devel-oping ones, have derived universal policies from the World Bank Global Findex to achieve financial inclu-sion. Such policies have sought to introduce as many
Open Access
Future Business Journal
*Correspondence: [email protected] Faculty of Management Sciences, October University for Modern Sciences and Arts, 4/14 Zahraa Elmaadi, PO Box 11742, Cairo, EgyptFull list of author information is available at the end of the article

Page 2 of 19ElDeeb et al. Futur Bus J (2021) 7:32
individuals/SMEs1 as possible to a scope of financial services and educate them about banking products and the macro-financial environment, with a view towards matching their capacities to the best alternative financial vehicles and preventing their financial marginalization. The policies have had a great impact on the economic and social conditions of individuals and SMEs alike on a national level [12, 25, 54].
When analyzing from the policy implication per-spective, this topic would prompt policymakers to take actions and formulate their monetary policies on the basis of financial inclusion across countries. In turn, affecting the legal framework, the infrastructure of the financial markets, raising financial awareness, education and guaranteeing the protection of lenders’ and borrow-ers’ rights, would realize the positive outcomes of finan-cial inclusion. In essence, financial inclusion strategies have been defined as national or subnational roadmaps devised by stakeholders who contribute to their efforts and resources in achieving the objectives of financial inclusion. A financial inclusion strategy should address, for instance, the various problems related to financial services, the upgrading and development of the financial markets. It should also be sensitive towards the integra-tion of financially excluded groups and informal sectors, entrepreneurs in general and businesswomen in particu-lar [52].
Egypt has adopted steadfast measures to become a leader in the field of digital payments. It has worked toward launching a new phase of financial inclusion to meet its international sustainable development goals (SDGs) and carry out with its 2030 strategy. SDGs have focused on the Egyptian financial system, as one of the dynamos of economic growth. As well, reforms were applied in the financial sector to pave the way toward a smoother transition into the digital economy and to achieve an optimum level of financial inclusion. Above all, the new design of the financial system seeks to weave the transactions of individuals and enterprises into the country’s formal economic fabric and ensure that the development of financial institutions will provide them
with a wider range of tailored services. It should also help to raise Egypt’s standard of living, narrow income dis-parities and reduce poverty rates by reaching out to the less-served segments of the society, such as the poor, the low-income and small- and medium-sized investors and startups [6].
To build a comprehensive financial system, there are multidimensional roles for the regulators of financial markets, including the Central Bank of Egypt, the Min-istry of Finance and regulators of non-banking financial services. The first task for the regulators of financial mar-kets is to create a profitable legal and regulatory frame-work: one that enables financial institutions to facilitate access to financial services for families and small busi-nesses. Their second task is to reduce market imperfec-tions and enhance market infrastructure by offering convenient payment channels and reducing transac-tion costs. Their third task is to recommend govern-ment intervention to help financial institutions build up the capacity of financial intermediaries, which increase awareness and reduce financial illiteracy among indi-viduals and SMEs [28, 39]. Many benefits accrue when all stakeholders take part in building a resilient financial system based on regulations, infrastructural prepared-ness and awareness [25]. Indeed, financial inclusion will benefit both the public and the private sectors on both macro- and microeconomic levels. On the governmen-tal front, financial inclusion has offered various social welfare programs that reached out financially to exclude beneficiaries. It has supported the Ministry of Social Solidarity to build reliable databases for beneficiaries and estimate income disparities [6]. A comprehensive finan-cial system can help attract new businesses to the formal private sector, and especially to secure payment systems for day-to-day operations, improve services for employ-ees and develop a variety of financial instruments to help women become entrepreneurs.
Finally, financial inclusion is already the cornerstone of any resilient financial sector; however, the criteria and measures for its definition remain subject to debate. Usually, policymakers adjust how financial inclusion can be adopted based on their needs and demographics of each economy. The existing literature has considered the experience of countries and agreed that the notion is undergirded by a number of pillars. On the supply side, financial inclusion is a matter of increasing access to financial services through the adoption of full-fledged awareness campaigns tailored to SMEs. On the demand side, it is based on criteria and key performance indica-tors that measure the usage of financial services by SMEs. There is also a macroeconomic dimension to the assess-ment of factors influencing SMEs’ inclusiveness into the financial system [3, 27, 44, 60].
1 Small- and medium-sized enterprises are businesses in which one, two or three individuals make most of the decisions. There is no serious distinction between private and business assets, and it is subjective to personal factors which play a considerable role in the decision-making process. SME entre-preneurs have much larger stakes in their business than corporate executives do in their corporation. Most countries apply three measures to distinguish SMEs from other companies: capital investment in plant and machinery, number of employees and production volume or turnover [5]. Based on OECD definition, a small- and medium-sized enterprise is defined as the enterprise whose number of employees should not exceed 10–49 employ-ees for small-sized enterprises and balance sheets of EUR 10 million. As for medium-sized enterprises the range is from 50 to 29 employees and balance sheets of EUR 50 million [43, p.17].

Page 3 of 19ElDeeb et al. Futur Bus J (2021) 7:32
MethodsAccordingly, the main objective of this research is to use primary research and a novel database aimed at SMEs in Egypt to identify non-traditional channels toward finan-cial inclusion. We have tested the paper’s main objectives and hypotheses using a twofold methodology. First, we derived a novel qualitative dataset from a questionnaire distributed online to Egyptian financial banking execu-tives who manage SMEs portfolios. The questionnaire used more than 42 variables to test for financial inclusion determinants. One of the questionnaire’s advantages is that it can be adapted to a wider regional or international scale. The questionnaire response rate was 82%. Second, we undertook inferential and econometric modeling on the questionnaire, using both principal component anal-ysis (PCA) and logistic regression to identify significant variables and reduce the dimension of unnecessary deter-minants of financial inclusion and test their robustness through the regression.
The PCA and regression results indicated that the interaction between variables such as SME access to the most sophisticated banking services through market-ing, increased usage of tailored and digital banking ser-vices and assessment of macroeconomic risks pertinent to SMEs led to an 86.6% variability in the level of finan-cial inclusion for Egypt’s SMEs. The paper is structured as follows: “Methods” section reviews the literature, “Literature review” section lays out the questionnaire’s data design, “Exploratory research prior to questionnaire design” section frames our hypotheses, “Methodological approach: twofold approach” section describes our meth-odologies, “Results and discussion” section presents and discusses main results and defines the limitations, and finally, “Conclusion” section concludes.
Literature reviewRole of financial inclusion in promoting societal segments and, above all, SMEsThe literature has settled on a broad definition of finan-cial inclusion, but it has also adopted a wide variety of perspectives to explain the term from different angles and to differentiate between individuals, businesses and stakeholders needs for financial inclusion. The World Bank’s Universal Financial Access, the IFC 2020 goals and the Alliance for Financial Inclusion all agree that financial inclusion is in a nutshell, the universal availability and usage of high-quality transactions and payment prod-ucts tailored to different segments of the society and to firms of different sizes. The Financial Inclusion Center in Washington complemented the previous definition by adding that individuals and businesses are not excluded, if they are introduced to the most innovative approaches that will guarantee their access to a full range of suitable
financial services at affordable prices [12, 54, 61]. Hence, the cost of financial services is one of the crucial ele-ments in determining financial inclusion. Accordingly, this cost has fallen dramatically and amplified the access of remotely located or vulnerable individuals and women to financial services. Additional banking policies have worked in a highly effective manner to offer duty-free accounts, facilitate and unify the multiple documenta-tion requirements for applicants and accelerate the use of electronic transactions through bank accounts and bank wallet accounts with some of them tailored to the indi-viduals and others to SMEs needs [28].
Small- and medium-sized enterprises (SMEs) can be defined, as the workhorse of economic growth since they drive employment through job creation. In fact, their contribution has reached up to 50% of GDP in some countries [34, 42]. The greater an SME’s access to finance, the wider the range of financial services available to jump start its business and expand its operations [12, 54, 61]. SMEs account for 45% of total employment globally and for up to 70% of jobs in most OECD countries [7]. More importantly, the investments of SMEs are directly chan-neled to promote innovative services and accommodate to the expansive digital revolution in the financial sec-tor [35]. Finally, to qualify for microfinance services, SMEs should follow a set of financial regulations and requirements set by banks and non-financial institutions. Based on OECD definition and classification for SMEs, a small-sized enterprise is characterized by the number of employees that should not exceed 10–49 employees and their balance sheets of EUR 10 million, whereas for a medium-sized enterprise the range is from 50 to 249 employees and their balance sheets of EUR 50 million [43].
The literature’s determinants of financial inclusion for SMEsOne stream of the literature advocates the removal of price and non-price obstacles to facilitate SMEs’ access and usage of financial services and ease common barri-ers across countries, which will facilitate SMEs growth. There is a consensus in the mainstream literature on three standard factors working on the acceleration finan-cial inclusion. The first is the availability and affordability of formal, electronic and secure financial services tailored to the needs of SMEs. The second is the need to integrate the most vulnerable investors and startups into the for-mal financial fabric, which can be done solely through full-fledged promotional campaigns and the spread of financial literacy [49, 56]. The case of Dahmen and Rod-riguez [18] has shown how in Colombia and many other countries, financial literacy was positively correlated with the promotion of bank account use and the facilitation of financial payments for firms.
Page 4 of 19ElDeeb et al. Futur Bus J (2021) 7:32
The third is the necessity of providing financial ser-vices on the basis of SMEs’ performance ratios. Under some circumstances, small-sized enterprises can be given credit against a guaranteed collateral and the existence of highly valued fixed assets. The lower a firm’s owner-ship shares in tangible and non-tangible assets, the less likely it is to be approved for external credit lines, regard-less of its demographic characteristics. Fourth, a firm’s age2 is linked to its reputation, historical performance, ability to handle financial distress and the ability to build up trustworthy credit records that are essential for the assessment of its credit scores [40, 46]. A firm’s busi-ness activities and performance are used as indicators to determine its access to credit, loans and mobilize finan-cial payments and transfers. Firms in the construction sector, for example, have higher guaranteed collaterals due to the size of their fixed assets. In turn, these assets would generate higher profitability ratios and conse-quently increase their access to more funds.
Fifth, and last, the presence of macroeconomic and financial risks embedded in the economy is critical to SMEs’ financial inclusion. The macroeconomic risk to which SMEs are exposed is highly dependent upon the central bank’s directives and monetary policy that opts to set the appropriate interest rates. Usually, optimal inter-est rates set by central banks seek to generate higher out-put while curbing inflation trends and economic volatility [38]. The literature motivated by Evans and Adeoye [22] has indicated to the causality running between finan-cial inclusion and the effectiveness of monetary policies, especially for firms in developing and African economies. This is one of the limitations in this branch of the litera-ture, as it is not exactly known whether financial inclu-sion will affect and alter monetary policy targets or if the adoption of monetary directives might invigorate finan-cial inclusion efforts.
Obstacles preventing SME access to financial servicesHistorically, many obstacles have hindered SMEs’ access to financial services, particularly in developing countries. They include limited spread of knowledge and illiteracy, which could prevent the use of the most suitable finan-cial and digital services. As well, the lack of knowledge tends to block proper decision making with respect to the business financial affairs and also undermines the importance of the most up-to-date and suitable online banking services. Additional obstacles include higher transaction costs, red tape and the excessive documenta-tion required to open and close accounts. These factors
have already relegated about 35% of SMEs from being financially included [18, 31, 42, 61]. The MSME survey diagnostics elaborated by Clarke et al. [17] has identi-fied the fragility of data protection laws, as yet another problem eroding off SMEs confidence in the financial system. Finally, Karpowicz [31] has illustrated that the depth of financial services that banks provide to SMEs is determined by the collateral, guarantees and credit lines taken in return, which are sometimes too strict and hin-der their growth. At the same time, the interest rate they receive when evaluated is still insufficient compared to the higher transaction costs they incur. SMEs in develop-ing countries are therefore in dire need of bridging the ‘financial gap’ between demand for the amount, variety, quality and means of financial services and the awareness of the payment services offered.
Financial inclusion through digitalized banking services: the case of Egypt’s SMEsFinancial inclusion has been one of Egypt’s national pri-orities since the launch of its Sustainable Development Strategy (SDS) Vision 2030, but by then the country had already been taking steps to transform its economy into a digital one reliant on e-payments and reducing the use of cash. The Central Bank of Egypt (CBE) has participated in several regional and global initiatives to improve finan-cial inclusion. In July 2017, for example, Egypt was cho-sen along with China and Mexico to be a model country in the Financial Inclusion Global Initiative launched by the World Bank Group. The three-year initiative aimed to support access to financial services for the unbanked and underbanked and developed policy recommenda-tions for digital finance. According to the World Bank, Egypt had the potential to bring a large number of enti-ties and individuals estimated at more than 44 million adults into the formal financial sector [53]. The latest banking statistics for 2018 indicated that there are more than 2,800 branches for 39 separate banks distributed across governorates. Almost half of these rely mainly on e-banking and mobile banking services, with 133,651 registered payment agents to provide a variety of elec-tronic financial services to individuals and firms [14]. The Egyptian financial sector has revamped its strategy along two main axes: First, it has updated the regulatory frame-work to suit new financial products introduced onto the market and to safeguard firms against cyber fraud; sec-ond, it has stimulated digital transactions and broadened e-payment channels to include a variety of customized services for SMEs. Among those services, fall the mobile transaction modes such as cardless ATM, cash-in/cash-out for mobile wallets, person-to-person (P2P), person-to-merchant (P2M), merchant-to-merchant (M2M), 2 Age of the firm in this context refers to the number of years of its existence,
operations and establishment. Usually, the more experienced firms operating for longer years will have a more creditworthy reputation and history [40, 46].

Page 5 of 19ElDeeb et al. Futur Bus J (2021) 7:32
international money transfers (IMT), virtual card num-ber (VCN) and bank wallet accounts [30, 48].
The main pillars activating financial inclusion in the case of Egypt’s SMEsFinancial services access and usage metricsBanks are mainly using sales volume as a metric to grant access to specific financial services and to dis-tinguish between services offered to corporates and others to SMEs. Classifying a business as an SME is in fact inconsistent across countries, and there is no one standardized definition for an SME. An SME might be considered of medium size in one country and can again be classified as a large-sized enterprise elsewhere. Countries pursuing financial inclusion must therefore carefully define their business size and characteristics to match the procedures and services offered to differ-ent categories of firms through formal financial institu-tions. The banking sector of many developing countries has started to cater to the needs of SMEs through offer-ing a variety of financial services, such as financing and saving plans. These plans incorporate risk mitiga-tion strategies for SMEs into their design to guarantee an amplitude of services and low-cost transactions [28, 53].
In fact, the spread of technology in the form of digi-tal e-payments and mobile payment services is one of the main facilitators of access to financial services for small investors and businesses and it is effective in low-ering both costs and risks. Account penetration in Egypt increased from 10 to 33% from 2011 to 2017 due to the support of cashless transactions and banks’ own encour-agement of individuals and businesses to open accounts at lower fees and lower restrictions on cash deposit requirements. Moreover, the Central Bank of Egypt (CBE) has been a member of the international alliance for financial inclusion since 2013, which represented a great opportunity for hands on practical and technical know-how to stress on the concept of financial inclusion among businesses and startups [11].
The CBE has encouraged banks to expand their finan-cial services for SMEs and increase the proportion of their total lending that goes to SMEs by at least 20%. They have also encouraged private and public banks to estab-lish special units devoted to providing SMEs with finan-cial services. In light of those directives, some 49 billion Egyptian pounds went toward financing SMEs during 2017. To accelerate SMEs growth and activities, many incentives were set up, such as reductions in documen-tation and procedures for account opening, mobile and online access to banking services and consistent moni-toring of financial services [28]. Easier access to financial services in turn mobilized household savings and freed
up capital to finance SMEs. It offered financial services on an equitable basis to citizens and SMEs that had oth-erwise been excluded for decades.
Raising financial literacy and awareness: marketing campaigns as an outreach to SMEsThe modern banking system is under continuous pres-sure from the shocks and influences of exogenous and economic risks. The explosive growth of new trends in digital technologies has exacerbated for banks the chal-lenge of coping with the ever-increasing expectations of their customers. They had to innovate to meet the ‘new’ needs and wants of SMEs as a target group [23, 58]. According to Fortea and Ioan [24], only a few of the branded big banks have used direct marketing to increase SMEs’ awareness of their services. Some have prior-itized promotional activities, such as sweepstakes for credit cards. Most have engaged in public relations (PR) to strengthen their credibility and alter the perception of their corporate image. At any rate, it has represented a small portion of their marketing budget.
Direct marketing campaigns held by banks are mainly focused on telemarketing and the Internet, which con-sume only a small portion of the total marketing budgets allocated to SMEs. To evaluate the effectiveness of each marketing medium used, we must screen and select the best mix of cost-effective marketing tools. Those tools should reduce financial illiteracy and, at the same time, deliver a clear, consistent message through all possible communication channels [33, 47, 51]. Marketing commu-nications tools should be focused on the following four components: first, establishing a comprehensive advertis-ing campaign to promote a bank’s credibility, reputation and corporate image to SMEs; second, promoting new and modified products to be aligned with external condi-tions and internal business strategies; third, engaging in permanent public relations, regular interviews and media events, so as to inform SMEs of a bank’s regular activi-ties; and finally, upscaling employees’ skills and executive knowledge, as they leave the greatest impression on the SME perception of a bank’s financial products, services and their quality.
Claessens and Laeven [16] pinpointed that many new trends over the past few years have changed the dynamics of the banking industry, especially in Egypt. The trends include globalization, regulations and deregulations, the opening up of domestic markets, improvements in retail banking, the building of corporate image, the launch of new brands, the opening of new delivery channels and, finally, the pursuit of smaller connections to SME cus-tomers. International trends in the banking sector have moved beyond the traditional means of conducting trans-actions. Most national and international banking sectors
Page 6 of 19ElDeeb et al. Futur Bus J (2021) 7:32
have started to rely on and promote digital banking tools. In fact, the emergence of Internet banking in Egypt has sustained an effective two-way interactive communica-tion between banks and SMEs through an advertising budget tailored to customers. It has also increased the number of non-financial institutions that act as mediators to grant access to financial services, especially during the latest COVID-19 pandemic. Banque Misr, the National Bank of Egypt, as well as Monzo Bank Ltd. in the UK and Enpara.com digital Bank in Turkey, have moved to fully digitalize their services on the domestic level during the pandemic. It is important to train the bank’s staff to deal with and communicate easily to customers. Also, banks should be capable of tailoring and marketing financial services to be compatible to the demographic structure of SMEs [20, 26, 37, 55].
Macroeconomic and financial risks to SMEsThe theoretical and empirical literature has covered all aspects of financial inclusion, which is believed to accel-erate economic growth. This strand of the literature sug-gested links between macroeconomic indicators and financial risk; in addition, it has gauged the impact of these links on SMEs’ financial inclusion and vice versa. Previous studies used GDP per capita, per capita income, consumption per capita and the informal sector as a percentage of total GDP to estimate the financial power and resilience of individuals and businesses. There are, besides, other key indicators such as inflation volatil-ity, output growth and income disparities used to con-struct the Gini index, which acts as a proxy for measuring income equalities [32, 41, 44, 60]. The higher percent-age of credit allocated to a startup would lead to higher generated income, which would in turn accelerate eco-nomic growth and reduce income inequality. One of the obstacles impeding the financial inclusion of firms was attributed to the higher transaction costs recorded in less developed neighborhoods. Consequently, the overstated transaction costs were not suitable for Egypt, which is characterized by higher-income inequalities across gov-ernorates [3, 27, 44, 60]. Other empirical models have predicted that causality runs in the opposite direction between income inequality and financial inclusion. Per-otti et al. [45] found that countries with less inequality were well prepared for greater access to financial services.
The implications of financial inclusion on the economy and how it promotes economic growth are multidimen-sional, especially when it comes to minimizing the size of the shadow economy and mitigating tax evasion [62]. They are best identified by examining the relationship between financial inclusion and its broader dynamics on an array of macroeconomic indicators. For example, a consistent inflation rate could be achieved through an
optimal monetary policy, with an interest rate set to with-draw excess liquidity from an expanding market or inject it into a contracting one. This optimal policy mitigates severe liquidity shocks by introducing a variety of finan-cial products segmented to SMEs. Directing services at SMEs should in turn moderate per capita consumption and induce additional investments into SMEs through access to loans and financial products. This should lead to output stability, higher disposable income per capita, higher per capita GDP and less tax evasion among SMEs and other firms [32, 41, 44, 60].
Exploratory research prior to questionnaire designResearchers began with an exploratory study of what bankers at their various managerial levels recommend for the design of variables to determine the financial inclusion of SMEs. The exploratory study was conducted through personal interviews with managers and decision makers concerned with the research area in the private and public banking sector under study. A random sam-pling technique was used by researchers, and it included bankers at managerial and non-managerial positions in seven banks in Greater Cairo. The results were fed into the second part of the data collection, which was reflected in the design of a questionnaire covering all aspects of financial inclusion for SMEs. The determinants of financial inclusion were derived from the primary data obtained through the online questionnaire.
Questionnaire design and data samplingThe questionnaire consisted of five sets of questions. The first covered the multiple saving services guaranteed to SMEs. The second measured the effectiveness of the mar-keting tools used to increase SMEs awareness about the services. The third evaluated the usage and metrics of financial services provided to SMEs. The fourth assessed the macroeconomic risks SMEs are exposed to and how it might impact their inclusion into the financial ser-vices. Finally, the fifth covered demographic factors, such as the degree of their access and integration to financial inclusion. The questionnaire consisted of 42 close-ended questions. Thirty-eight questions were designed on the basis of a categorical Likert scale and the rest following a nominal scale. Additional data were collected on the respondents themselves, such as gender, years of work experience, type of bank and educational level to shed light on the role of bankers on influencing SMEs deci-sions. The response rate was 82% to represent 355 sub-mitted questionnaires out of 432 questionnaires.
The researchers used a practical, non-probability sam-pling technique, called accidental sampling, to maxi-mize accessibility, time saving and keep up with coding the collected data. They submitted the questionnaires

Page 7 of 19ElDeeb et al. Futur Bus J (2021) 7:32
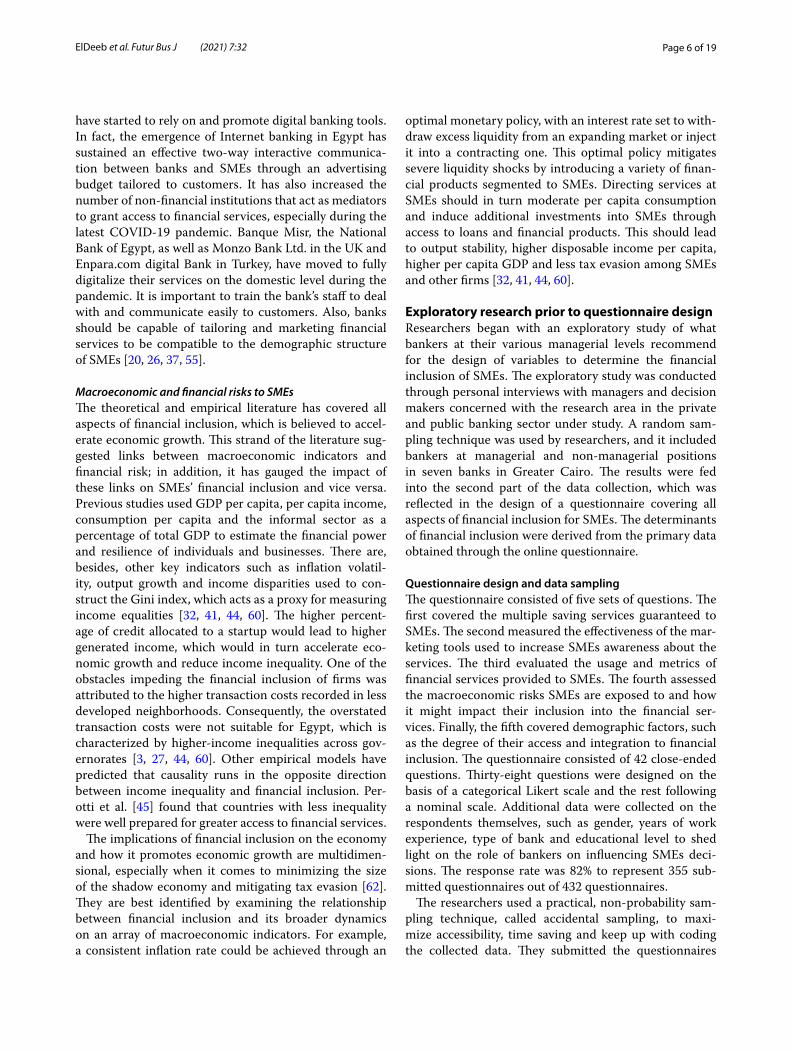
online, through professional social media platforms such as LinkedIn to reach to as many of the bankers working in the Egyptian private and public banks. As shown in Table 1 and Fig. 1, the sample was almost evenly distrib-uted between female (48.2%) and male (51.8%) respond-ents. Almost (55%) of respondents had less than five years of experience, (34%) had more than five and less than ten years of experience, and a minority of 9.6% worked for more than ten years. A majority (58%) of respond-ents worked for private banks and most of them had
completed more than 5 years of experience and (42%) in public banks. All of the banks served Egyptian SMEs.
The cross-tabulation in Fig. 2 for the variables of e-payment services and type of bank shows that around 78% of public and private banking respondents agreed that access to e-payments facilitated SMEs’ transac-tions, increased their interaction with formal financial agencies and enabled the inclusion of many more small-sized enterprises and startups in the financial system. The coded data derived from the questionnaire enclosed
Table 1 Summary of frequency statistics for the variables Data source: questionnaire enclosed in “Appendix”
Indictors Frequency Percent Valid percent Cumulative percent
Respondents gender
Female 171 48.2 48.2 48.2
Male 184 51.8 51.8 100.0
Years of experience at work
10 to less than 20 years 34 9.6 9.6 9.6
5 to less than 10 years 120 33.8 33.8 43.4
Less than 5 years 196 55.2 55.2 98.6
More than 20 years 5 1.4 1.4 100
Type of bank
Employees in private banks 205 57.8 57.8 57.8
Employees in public banks 150 42.2 42.2 100
020406080
100120140
More than 20 years 10 to less than 20years
5 to less than 10years
less than 5 years
225
53
124
3 9
6772
Number of Banker repsondents with different experiencesdistributed across private and public banks
Private Banks Public BanksFig. 1 Cross-tabulation between bankers’ respondents’ years of experience and type of bank. Data Source: questionnaire enclosed in “Appendix”

Page 8 of 19ElDeeb et al. Futur Bus J (2021) 7:32
in “Appendix” has indicated that 75% of respondents believed that offering multiple saving services to SMEs would encourage them to join formal financial banks. In addition, a vast majority of 80% strongly agreed that loan procedures, their paperwork, collaterals and restrictions should be designed to facilitate SMEs operations and their access to funds. As for integrated marketing cam-paigns, 33% of respondents were neutral and they did not agree to the efficacy of promoting financial services to SMEs through enhanced direct sales and promotional tools; meanwhile, a majority of almost 87% of bank-ers serving to SMEs believed that both advertising and PR campaigns provided more know-how on all types of financial services. In addition, 72% agreed that Internet and social media campaigns directed at SMEs were one of the most highly effective marketing and communica-tion tools.
The coded data derived from the questionnaire in “Appendix” illustrated that there was a conflict between respondents on the idea of having SMEs pay higher fees and transaction costs. Some 32.7% were neutral or did not confirm whether banks charged SMEs a high per-centage of fees per transaction, which would act as a
barrier against financial inclusion, whereas 40% of pri-vate banks agreed that SMEs were charged a high fee per transaction. As well, more than half of the respond-ents believed that the growing volume of transactions for SMEs was highly related to their higher net income. Moreover, respondents had a strong sense that the central banks’ macroeconomic policy played a critical role in stabilizing the financial sector, as 63% strongly agreed that its monetary policies restored SMEs confi-dence in the effectiveness and credibility of the banking system and prompted them to open more accounts and join formal financial institutions and agencies.
More importantly, around 86% indicated that SMEs evaded their taxes due to the high and uneven tax lev-els, when they reported their net income and this in turn diminished their operations. As previously men-tioned in the literature, although SMEs with outstand-ing loans are seen as the engine of financial inclusion and for Middle East, North Africa, Afghanistan, and Pakistan(MENAP) countries, only the average share of SMEs in total bank lending stood recently at a modest 7% [12]. In consistency with the literature data, more than 50% of respondents believed that the number of
Fig. 2 Breakdown of access to e-payment services provided to SMEs by type of bank. Data Source: questionnaire enclosed in “Appendix”

Page 9 of 19ElDeeb et al. Futur Bus J (2021) 7:32
SMEs with outstanding loans from regulated or for-mal financial institutions should increase to open the door to SMEs to access more funds and start operating under sustainable conditions.
Research framework and hypotheses developmentMain hypothesis to be tested and applied to questionnaire designOn the basis of the above illustrated literature, four hypotheses were developed. Figure 2 in “Appendix” illus-trates the framework analysis:
H1 The following are the most significant determinants of financial inclusion: -
H1a The higher levels at which SMEs may access mul-tiple segmented savings and deposit services, the higher will their level of financial inclusion be.
H1b The more instructive the integrated marketing tools used to raise awareness about the services provided to SMEs, the higher will their access to financial services and the level of financial inclusion be.
H1c The more practical will the financial services offered by banks to SMEs’, the higher will their access to financial services and the level of financial inclusion be.
H1d The higher the interest rate set through the opti-mum monetary policy, the lower will SMEs be able to access loans and the lower their level of financial inclusion.
Methodological approach: twofold approachMethodological designThe paper’s methodology followed a twofold approach. First step, novel primary data were obtained from the online questionnaires to be consistent to other authors using primary data in determining factors influencing financial inclusion (see [12, 19, 50]). As previously men-tioned, the questionnaire addressed private and pub-lic-sector bankers in managerial and non-managerial positions serving to SMEs. Second, the collected data from the questionnaires were subject to descriptive and inferential tests (summarized in “Methods” section). The inferential estimations undertaken focused on the princi-pal component analysis (PCA). As previously mentioned, the dependent variable to be estimated was the level of financial inclusion based on a number of indicators3
included in the questionnaire. This variable is a categori-cal variable estimated as the percentage of SMEs with accounts, outstanding loans, payroll accounts and access to e-banking services. After the analysis of the coded answers, a set of 42 independent variables were derived from the questionnaires to determine the level of finan-cial inclusion (see “Appendix” questionnaire close- ended question).
It was theoretically and empirically impractical to introduce the 42 independent variables into a classical regression. Therefore, it was inevitable for the research-ers to reduce the number of variables through the princi-pal component analysis (PCA). The PCA is an inferential analysis method used to summarize the number of vari-ables determining in this case SMEs’ level of financial inclusion, and its use is aligned with the previous litera-ture using the same approach, as in the case of Tomaselli et al. [59], ElSherif [21], Bensaada and Taghezout [10] and Cámara and Tuesta [13] to estimate the level of financial inclusion. After the PCA, a logistic regression with cat-egorical variables was conducted to provide the best fit to a linear regression model on the factors causing the highest possible variability on the level of financial inclu-sion (as proposed by Archer et al. [4]). The advantage of a logistic regression is that it accounts for more than one category of both the dependent and independent vari-ables through the maximum likelihood estimation and works well with interval and categorical data [2].
Principal component analysis (PCA) to determine SMEs’ level of financial inclusionThe rest of this section will be devoted to an inferential estimation technique known as PCA, which served as a preparatory step to the regression analysis. Shlens [57] defined PCA as a statistical approach that examines interrelations between a set of variables and identifies the underlying structure of those variables. It generates one or more artificial series, summarizing the behavior of a group of variables. It is computed in such a way that the first three or more components under which variables will be loaded should explain as much as possible of the variability in the results. It treats at the same time for
3 The indicators testing for the level of financial inclusion were derived from the literature and all included on the G section of the questionnaire in Appen-dix, specifying measurement of financial inclusion level for SMEs, and they
are estimated in categories: (1) percentage of financial services, products and infrastructural capital (provided through banks ATM cash-in/cash-out for mobile wallets, person-to-person (P2P), person-to-merchant (P2M), mer-chant-to-merchant (M2M), international money transfers (IMT), virtual card number); (2) % use of e-payment services; (3) percentage of coverage they receive from being financially included in the banking system; (4) their will-ingness to switch a percentage of their transactions to cashless payments; (5) awareness and promotion they receive on the financial services; and (6) opti-mal setting of the monetary policy reflected through the percentage of out-standing loans and payrolls of employees [20, 26, 30, 32, 37, 41, 44, 48, 55, 60].
Footnote 3 (continued)

Page 10 of 19ElDeeb et al. Futur Bus J (2021) 7:32
multicollinearity and possible autocorrelation between underlying variables by grouping the variables into a smaller number of original components based on their original scores and mathematical properties, and these components are not linearly dependent [9]. An additional benefit to PCA, as noted by Cámara and Tuesta [13], lies in the new set of classified variables, which it generates to explain the changes in the dependent variable. These are not necessarily correlated but certainly hold and describe a big portion of the underlying latent structure of the var-iables introduced before the PCA.
Logistic regression model analysis with ordinal variablesAfter extracting the principal components meant to determine variability in the level of financial inclusion, the main components PCA 1, 2, 3, 4, … driven from the inferential analysis will be fed as variables into a logistic regression estimation. This type of regression provides for more than one category of both the dependent and independent variables and is benchmarked in the techni-cal literature, as a multinomial logistic regression (refer to Barbić et al. [8]). An interval logistic regression another similar estimation was used as a robustness check to suit the nature of the Likert-scale questions introduced ear-lier in the questionnaire design. Both types of regressions treat for multicollinearity, as a nonlinear relation exists between the variable and the intercept term. It is well known that multicollinearity might lead to errors in the estimation, resulting in linear dependency and less-con-sistent results. Hence, one of the virtues of multinomial logistic regression is its potency to resolve for the omis-sion of variables and at the same time preserve the pre-dictive power of the model.
The generalized equation for the multinomial logistic model for θj , which denotes the level of financial inclu-sion measured through categories of the previously men-tioned indicators and which varies by a single or more than one independent variable, is written as follows:-Ln(θj) =∝j −βX … and j denotes number of categories
to1, whereas ∝j is the intercept term. β is the independ-ent variable and it is expanded in its simplest form with more than one independent variable [36].
The ordinal and categorical logistic regression at its expanded version is as follows:
Results and discussionMain results for PCAThe PCA summarizes and reduces the size of the 42 inde-pendent variables into a number of underlying factors and structure, which determine the variability of financial
(1)Logit
(
P(
Y <= j))
= <<j0 +j1x1 + · · · +jp Xp.
inclusion for SMEs in Egypt. In keeping up with the lit-erature (notably [1, 8, 10, 13]), the ‘eigenvalue-based cri-teria,’4 provided the cut-off threshold for the number of components or groups explaining the variability of the dependent variable. There is a standardized cut-off point agreed upon by the literature, which should exceed 50% or equivalent to a number of PC groups that retain a coef-ficient of variability that almost reaches one [29]. There is in addition an acceptable reference value produced by Cerny and Kaiser [15], which adopts Kaiser–Meyer–Olkin sampling adequacy criteria to check the adequacy of the sample and its underlying structure, the design of variables used and introduced into the PCA. The coeffi-cient reference value needs to exceed a value of 0.5, so the coefficient obtained from sampling adequacy test stood at 0.8 with high levels of significance. This result derived was plausible, when compared to the reference value.
Later, to estimate the PCA, we used the ‘varimax method’ to rotate factors and reduce the number of vari-ables that load on the principal component vectors or what will be called as the sub-factors loading on the main components and explaining the variability in financial inclusion. Tables 2, 3 and Fig. 3 in “Appendix” all refer to the PCA that resulted in three components with their uploaded variables. These explain 86.65% of the total cumulative variance and original data that determine the level of financial inclusion of Egypt’s SMEs. The peculiar-ity of the results is derived from the interaction between categories of several variables that account for the effec-tive variability in SMEs’ level of financial inclusion.
The total variance is decomposed as follows. In Table 2, the first component, PCA 1, generated a 50.84% vari-ability in financial inclusion and it reflects the macroeco-nomic and financial risk variables and their sub-factors such as optimal interest rate and inflation rate. PCA 2 generated a 25.74% variability and pertains to variables related to financial services usage among SMEs. These sub-factors include percentage of accounts used, loans from various sources, payroll accounts and e-payment services. PCA 3, representing greater access to financial services through integrated marketing campaigns, gen-erated a 14.87% variability in the level of financial inclu-sion for SMEs. As for the sub-factors loading on the three PCA exhibited in Table 3 in the following manner. PC 1 of highest variability which is macroeconomic volatility and risk is determined by the setting of optimal interest
4 Eigenvalue-based criteria: They explain the variance of data derived from the questionnaire and how the magnitude of these data changes when the prin-cipal component analysis is applied, which is basically rotating the data on the plain until the most variability and change is driven from the new rotated eigenvectors and it provides a new intuitive way to justify and explain data variability [8].

Page 11 of 19ElDeeb et al. Futur Bus J (2021) 7:32
rate and the inflation rate and interaction between them. PC2 pertinent to the usage of financial services includes the percentage of outstanding loans for SMEs and payroll accounts and their interaction, and finally PC3 causing the least variability of all components is comprised of PR and social media campaigns to market and raise aware-ness among SMEs and their combined effect led to the variability on the level of financial inclusion.
It is worth mentioning that all eigenvalues exceeded 1 and that a validity check of the results was performed through a reliability analysis called “Cronbach’s alpha.” This gave us an estimate of 0.896, as indicated in Table 4. Here, Cronbach’s alpha tests for high consistency in the original and latent variables are used to explain for finan-cial inclusion. The results were aligned to similar values derived from the literature [8].
Main results for logistic regression estimationsOnce the principal components were extracted through factor analysis, the second step was to introduce a logis-tic regression with categorical variables to estimate the impact of PC1, which is the macroeconomic and finan-cial risk. PC2 reflects the increased usage of banking ser-vices, and PC3 focuses on the access to services through full-fledged integrated marketing campaigns directed to raise the awareness of SMEs. Table 5 shows that the model’s three PCs used to predict the level of financial inclusion are highly significant, with a confidence inter-val of 95%. The ‘goodness-of-fit’ model failed to reject the null hypothesis that the three PCA factors explain correctly the variability in financial inclusion of SMEs. Finally, Table 6 shows that the model’s coefficients reach
Table 2 Total variance explained
The bold value indicates to the cumulative percentage pf 86.65% covering most of the variability of financial inclusion through the "three PC 1,2,3 and which represent:- PC1: Macreconomic risj pertinent to SMEs PC2: Usage of financial services by SMEs PC3: Marketing promotion tools to SMEs
Factor Initial eigenvalues Rotation sums of squared loadings
Total % of variance Cumulative % Total % of Variance Cumulative %
1. Macroeconomic risk pertinent to SMEs) 4.559 56.982 56.982 2.607 50.847 50.847
2. Usage of financial services by SME’s 1.299 16.238 73.220 2.459 25.745 76.7
3. Marketing promotion tools to SMEs 1.074 13.427 86.647 1.866 14.877 86.6474. Type of SMEs sector [E1] .324 4.051 90.698
5. Account transaction costs for SMEs [C2] .298 3.728 94.426
6.Sales promotion SMEs [B1] .164 2.052 96.478
7. Tax evasion SMEs [D4] .155 1.933 98.411
8. Number of employees SMEs [D4] .127 1.589 100.000
Table 3 Total sub-factors loaded under each PC group
Extraction method: principal component analysis. Rotation method: varimax with Kaiser normalization. A. Rotation converged in five iterations
PCA 1 (macroeconomic risk pertinent to SMEs)
Explained variance
PCA 2 (usage of financial services by SMEs)
Explained variance
PCA 3 (marketing promotion tools to SMEs)
Explained variance
D1: monetary policy (Interest rate) .884 F2: SMEs with outstanding loans .860 B3: PR campaign .864
D2: Inflation rate .909 F3: SMEs with payroll accounts .882 B4:Social media campaign .889
Interaction between D1* D2 .914 Interaction F2* F3 .893 interaction between B3*B4 .891
Table 4 Reliability statistics
Cronbach’s alpha Cronbach’s alpha based on standardized items
No. of items
.896 .767 10
Table 5 Model fitting information
Model Model fitting criteria Likelihood ratio tests
-2 Log likelihood Chi-square df Sig.
Intercept only 869.939
Final 608.997 260.943 12 .000

Page 12 of 19ElDeeb et al. Futur Bus J (2021) 7:32
their highest significant values for the use of financial services variables and macroeconomic risk at coefficients of 0.527 and 0.444, respectively. Finally, integrated mar-keting campaigns increased the visibility of and access to financial services for SMEs at a lower coefficient of 0.187 at high levels of significance.
Some limitations in the methodological approachIt is essential at this point to explain some of the limi-tations of this paper. One of the first limitations that should be considered will be the absence of a standard-ized definition for an SME and more precisely to the banking community and the criteria upon which bank-ers would provide access to financial services targeted at SMEs. Based on OECD, a small- and medium-sized enterprise is defined as the enterprise; whose number of employees should not exceed 10–49 employees for small-sized enterprises and balance sheets of EUR 10 million. As for medium-sized enterprises, the range is from 50 to 29 employees and balance sheets of EUR 50 million [43]. The second limitation was particu-lar to the causality running between macroeconomic stability and level of financial inclusion, which would have been totally resolved through using the propen-sity score matching (PSM) approach or through 2SLS to address this bias; however, it would have extended the work’s scope to treat for this problematic bias elaborately.
ConclusionThis paper contributes to the literature on financial inclusion in many ways. First, the researchers have provided a new perspective on the financial inclu-sion of SMEs and the expansion of the financial ser-vices provided to them in Egypt. The paper singles out financial literacy in particular and how it could be fos-tered through integrated marketing campaigns special tools such as social media and public relations aimed
at SMEs. Second, it considers the macroeconomic risks and the role of optimal monetary policy in main-taining a consistent level of financial inclusion and mitigating inflationary trends that would harm SMEs. Third, driven from the literature, an online question-naire was submitted to bankers who served SMEs and it was used to obtain a new dataset, which suggested actions that banks can take to increase the inclusion of SMEs into the official banking system. The results became robust after they were tested through inferen-tial modeling applying the PCA and the econometric modeling using logistic regression.
The main three factors derived from PCA led to 86.65% of the variability in the level of SMEs’ financial inclusion, and they were organized chronologically to include: PC1 which reflects on the understanding of the sensitivity of macroeconomic policies and how they support financial inclusion of SMEs; PC2 which refers to the usage of SMEs to loans and employees’ payrolls; and finally, PC3 which targets the provision of higher access of SMEs to financial services through finan-cial literacy promoted via integrated marketing cam-paigns and tools. In a nutshell, the questionnaires and the paper’s main results suggest to a promising line of research, which will investigate and test new metrics and factors to be accounted for and included on finan-cial inclusion indices not only for the case of Egypt but on a regional and international scale. They also under-score the importance of e-payments and other online services, which can be prompted through innovative marketing tools and scaled to the needs of SMEs and their respective business operations. As well, this paper emphasized on the policy implications addressing bank-ers and drawing out on the most untraditional chan-nels through which bankers could approach SMEs. It is known that in many developing and emerging coun-tries, SMEs represent one of least financial included groups in their economies and at the same time they are considered the locomotive of economic growth. Thus, more services and follow-up should be dedicated to SMEs through financial and non-financial institutions and agencies to reinforce SMEs role as the workhorse of economic growth, generation of employment and crea-tion of jobs.
AppendixSee Fig. 3 and Tables 7, 8.
Table 6 Coefficients
Standardized coefficients df F Sig.
Beta Bootstrap (1000) estimate of std. error
Macro-financial risk .444 .056 4 62.729 .000
Usage of financial services
.527 .054 3 95.469 .000
Access through IMC .187 .036 3 26.444 .000

Page 13 of 19ElDeeb et al. Futur Bus J (2021) 7:32
Financial Inclusion for SMEs' in Egypt
Questionnaire variables
Principal Components Analysis PCA (86.65%)
Demand Side Usage of Financial Services PC2
(25.74%)
E Payments Services Usage
Payroll Services Usage
Outstanding Loans Usage
Supply Side Access to Financial Services through
Integrated Marke�ng ToolsPC 3 (14.87%)
Public Rela�ons Campaigns
Social and Digital Marke�ng
Macroeconomic Risk Relevant to SMEs'
PC1 (50.84%)
Monetary Policy and Interest Rates
Infla�on Rate
Fig. 3 The pillars of financial inclusion based on hypotheses testing, questionnaire and PCA results. Source: Figure pillars collected through the questionnaire descriptive data

Page 14 of 19ElDeeb et al. Futur Bus J (2021) 7:32
Tabl
e 7
Des
crip
tive
stat
istic
s fo
r som
e ca
tego
ries
of q
uest
ionn
aire
’s va
riabl
es S
ourc
e: Q
uest
ionn
aire
dat
a
NM
inim
umM
axim
umM
ean
Std.
dev
iatio
n
Acc
ess:
mul
tiple
sav
ing
serv
ices
355
15
3.94
.654
Acc
ess:
inte
grat
ed m
arke
ting
cam
paig
n35
51
54.
03.6
82
Size
of fi
nanc
ial t
rans
actio
ns b
y SM
Es35
51
53.
92.7
21
Mac
roec
onom
ic ri
sk fa
ctor
s35
51
54.
22.7
86
SMEs
’ dem
ogra
phic
s35
51
53.
96.6
73
Usa
ge o
f fina
ncia
l ser
vice
s35
51
53.
90.6
59
Valid
N (l
istw
ise)
355

Page 15 of 19ElDeeb et al. Futur Bus J (2021) 7:32
Table 8 Questionnaire
Please indicate your level of agreement towards the following statements.
Statements Stronglyagree
(5)
Agree
(4)
Neutral
(3)
Disagree
(2)
StronglyDisagree
(1)
A. The following statements measure the presence of the multiple savings services targeted to SMEs
1. E-Payments services affect the financial inclusion level
(5) (4) (3) (2) (1)
2. Joint use of financial services affects the financial inclusion level
(5) (4) (3) (2) (1)
3. Types of saving accounts and CDs' affect the financial inclusion level
(5) (4) (3) (2) (1)
4. Loans with simple procedures affect the financial inclusion level
(5) (4) (3) (2) (1)
5. The presence of the multiple savings services enhances the level of the financial inclusion
(5) (4) (3) (2) (1)
Statements Stronglyagree
(5)
Agree
(4)
Neutral
(3)
Disagree
(2)
StronglyDisagree(1)
B. The following statements measure the effectiveness of applying an integrated marketing communications campaign
1. Sales promotion affects the financial inclusion level.
(5) (4) (3) (2) (1)
2. Advertising campaigns affect the financial inclusion level.
(5) (4) (3) (2) (1)
3. PR campaigns affect the financial inclusion level.
(5) (4) (3) (2) (1)
4. Internet and social media campaigns affect the financial inclusion level.
(5) (4) (3) (2) (1)
5. The overall integrated marketing communications campaigns affect the financial inclusion level.
(5) (4) (3) (2) (1)
Statements Stronglyagree
(5)
Agree(4)
Neutral(3)
Disagree(2)
StronglyDisagree
(1)C. The following statements measure the SMEs financial performance
1. Percentage of taxes increases SMEs’ transactions with formal financial agencies through financial inclusion
(5) (4) (3) (2) (1)
2. Reducing SMEs transactions cost increasesSMEs’ transactions with formal financial agencies through financial inclusion
(5) (4) (3) (2) (1)
3. Growing SMEs volume of transactions increasesSMEs’ transactions with formal financial agencies through financial inclusion
(5) (4) (3) (2) (1)
4. Growing SMEs net income increases SMEs’transactions with formal financial agencies through financial inclusion.
(5) (4) (3) (2) (1)
5. The overall SMEs financial performanceincreases SMEs’ transactions with formal financial agencies through financial inclusion
(5) (4) (3) (2) (1)

Page 16 of 19ElDeeb et al. Futur Bus J (2021) 7:32
Table 8 (continued)
Statements Stronglyagree
(5)
Agree(4)
Neutral(3)
Disagree(2)
StronglyDisagree
(1)D. The following statements measure the macroeconomic risk
1. Monetary Policies set by the Central Bank of Egyptaffect SMEs’ transactions with formal financial agencies through financial inclusion
(5) (4) (3) (2) (1)
2. Inflation rate affects SMEs' transactions with formal financial agencies through financial inclusion
(5) (4) (3) (2) (1)
3. GDP per Capita affects SMEs’ transactions with formal financial agencies through financial inclusion
(5) (4) (3) (2) (1)
4. Tax evasion affects SMEs’ transactions with formal financial agencies through financial inclusion
(5) (4) (3) (2) (1)
5. The overall SMEs macroeconomic risk affects SMEs’transactions with formal financial agencies through financial inclusion
(5) (4) (3) (2) (1)
Statements Stronglyagree
(5)
Agree(4)
Neutral(3)
Disagree(2)
StronglyDisagree
(1)E. The following statements measure the demographics indicators
1. Type of industry sector the SMEs work in affect SMEs’transactions with formal financial through financial inclusion agencies.
(5) (4) (3) (2) (1)
2. Age of the SMEs affect SMEs’ transactions with formal financial through financial inclusion
(5) (4) (3) (2) (1)
3. Number of employees affect SMEs’ transactions with formal financial agencies through financial inclusion.
(5) (4) (3) (2) (1)
4. The volume of international transaction and exportsaffect SMEs’ transactions with formal financial agencies through financial inclusion
(5) (4) (3) (2) (1)
5. The overall SMEs demographics indicators affect SMEs’ transactions with formal financial agencies through financial inclusion
(5) (4) (3) (2) (1)
Statements Stronglyagree
(5)
Agree
(4)
Neutral
(3)
Disagree
(2)
StronglyDisagree
(1)F. The following statements measure the usage of financial inclusion level
1. Percentage of SMEs with accounts measures the level of financial inclusion
(5) (4) (3) (2) (1)
2. Percentage of SMEs with outstanding loans measuresthe level of financial inclusion
(5) (4) (3) (2) (1)
3. Percentage of SMEs with outstanding payroll accounts measures the level of financial inclusion
(5) (4) (3) (2) (1)
4. Percentage of SMEs with E-banking services measuresthe level of financial inclusion
(5) (4) (3) (2) (1)

Page 17 of 19ElDeeb et al. Futur Bus J (2021) 7:32
AbbreviationsSMEs: Small- and medium-sized enterprises; PCA: Principal component analy-sis; SDGs: Sustainable development goals; IFC: International financial access; OECD: Organization for Economic Co-operation and Development; MSME: Ministry of Micro-, Small- and Medium-sized Enterprises; CBE: Central Bank of Egypt; IMT: International money transfers; M2M: Merchant-to-merchant; P2P: Person-to-person; P2M: Person-to-merchant; VCN: Virtual card number; GDP: Growth domestic product; MENAP: Middle East North Africa, Afghanistan and Pakistan.
AcknowledgementsWe have to express our appreciation to people who sacrificed their pearls of wisdom with us during the course of this research paper. We are also immensely grateful to banks employees for their comments on an earlier ver-sion of the survey, although any errors are our own and should not tarnish the reputations of these esteemed professionals.
Authors’ contributionsMS has scrutinized the literature and formulated the research gap. In addition, he wrote down the literature review. MS formulated the methodical frame-work of this study to achieve the desired objectives. He selected the sample size from the available population and has designed, together with YT the data collection instrument and suggested the method of data analysis. YT has presented the discussion of results. The discussion of different collected data presented in the results. EK contributed to this research by collaborating with YT in the design of the data collection instruments. All authors have read and approved the final manuscript.
FundingThe authors declare that funding of preparing this study or further processing of its publication in case of approval is totally borne by themselves.
Availability of data and materialThe authors declare they have full access to all study data, take full responsibil-ity for the accuracy of the data analysis and have authority over manuscript preparation and decisions to submit the manuscript for publication.
Declarations
Competing interestsThe authors declare that they have no competing interests. None declared under financial, general and institutional competing interests. The authors
declare they have full access to all study data, take full responsibility for the accuracy of the data analysis and have authority over manuscript preparation and decisions to submit the manuscript for publication.
Author details1 Faculty of Management Sciences, October University for Modern Sciences and Arts, 4/14 Zahraa Elmaadi, PO Box 11742, Cairo, Egypt. 2 Faculty of Man-agement Sciences, October University for Modern Sciences and Arts, 99 A Road 9 Maadi, PO Box 11728, Cairo, Cairo, Egypt. 3 Faculty of Management Sciences, 6th of October, October University for Modern Sciences and Arts, Cairo, Egypt.
Received: 29 May 2020 Accepted: 11 June 2021
References 1. Ahamed MM, Mallick SK (2019) Is financial inclusion good for bank stabil-
ity? International evidence. J Econ Behav Organ 157:403–427 2. Annin K, Omane-Adjepong M, Senya SS (2014) Applying logistic regres-
sion to e-banking usage in Kumasi Metropolis, Ghana. Int J Mark Stud 6(2):153
3. Aslan G, Deléchat C, Newiak MM, Yang MF (2017) Inequality in financial inclusion and income inequality. International Monetary Fund
4. Archer KJ, Lemeshow S, Hosmer DW (2007) Goodness-of-fit tests for logistic regression models when data are collected using a complex sampling design. Comput Stat Data Anal 51(9):4450–4464
5. Aremu MA, Adeyemi SL (2011) Small and medium scale enterprises as a survival strategy for employment generation in Nigeria. J Sustain Dev 4(1):200–206
6. Awad MM, Eid NH (2019) Financial inclusion in the MENA region: a case study on Egypt. IOSR J Econ Finance 9(1):11–25
7. Ayadi R, de Groen WP, Hassouba T, Zaki C, Alshyab N, Sandri S, Hmaied DM (2018) Financial development and inclusion in Egypt, Jordan, Morocco and Tunisia. EMNES Studies
8. Barbić D, Palić I, Bahovec V (2016) Logistic regression analysis of financial literacy implications for retirement planning in Croatia. Croat Oper Res Rev 7(2):319–331
9. Basto M, Pereira JM (2012) An SPSS R-menu for ordinal factor analysis. J Stat Softw 46(4):1–29
Table 8 (continued)Personal information:
1) Gender
1- Male2- Female
2) Experience
1. less than 5 years2. 5 to less than 10 years 3. 10 to less than 20 years 4. More than 20 years
3) Occupation
1. Employee in private bank2. Employee in public bank
4) Education
1. Bachelor degree2. Master degree3. PhD degree4. Professional degree

Page 18 of 19ElDeeb et al. Futur Bus J (2021) 7:32
10. Bensaada I, Taghezout N (2019) An enterprise risk management system for SMEs: innovative design paradigm and risk representation model. Small Enterp Res 26(2):179–206
11. Betz F, Weiss CT, Ravasan FR (2020) EIB Working Papers 2019/10-Structural and cyclical determinants of access to finance: Evidence from Egypt. European Investment Bank
12. Blancher MNR, Appendino M, Bibolov A, Fouejieu MA, Li MJ, Ndoye A, Sydorenko T (2019) Financial inclusion of small and medium-sized enterprises in the Middle East and Central Asia. International Monetary Fund
13. Cámara N, Tuesta D (2014) Measuring financial inclusion: A muldimen-sional index. BBVA Research Paper, (14/26)
14. Central Bank of Egypt (2018) Financial stability report 15. Cerny BA, Kaiser HF (1977) A study of a measure of sampling adequacy
for factor-analytic correlation matrices. Multivar Behav Res 12(1):43–47 16. Claessens S, Laeven L (2003) Financial development, property rights, and
growth. J Financ 58(6):2401–2436 17. Clarke GR, Shah MK, Sheppard M, Munro J, Pearson R (2010) The profile
and productivity of Zambian businesses. World Bank: Lusaka, Zambia 18. Dahmen P, Rodríguez E (2014) Financial literacy and the success of small
businesses: an observation from a small business development center. Numer Adv Educ Quant Liter 7(1):1–14
19. Demirgüç-Kunt A, Klapper L (2013) Measuring financial inclusion: explain-ing variation in use of financial services across and within countries. Brook Pap Econ Act 44(1):279–340
20. Domazet IS, Neogradi S (2019) Digital Marketing and Service Industry: Digital Marketing in the Banking Industry. In Managing Diversity, Innova-tion, and Infrastructure in Digital Business IGI Global, 20-40
21. Elsherif M (2019) The relationship between financial inclusion and monetary policy transmission: the case of Egypt. In Proceedings of Inter-national Academic Conferences (No. 9010737). International Institute of Social and Economic Sciences
22. Evans O, Adeoye B (2016) Determinants of financial inclusion in Africa: a dynamic panel data approach. Univ Maurit Res J 22(1):1–23
23. Flögel F (2018) Distance and modern banks’ lending to SMEs: ethno-graphic insights from a comparison of regional and large banks in Germany. J Econ Geogr 18(1):35–57
24. Fortea C, Ioan V (2019) Promotion of banking products and services. Ann Univ Dunarea de Jos of Galati Fascicle: I Econ Appl Inform 25(2):107
25. Ghebrial F (2019) Financial Inclusion in Egypt: Opportunities and Chal-lenges. A Thesis Submitted to the Department of Public Policy and Administration in Partial Fulfilment of the Requirements for the Master in Public Administration, The American University in Cairo
26. Hackley C (2003) From consumer insight to advertising strategy: the account planner’s integrative role in creative advertising development. Mark Intell Plan 21(7):446–452
27. Hassan AA (2019) The role of the most important financial institutions in the development of small and micro agricultural projects in Egypt. Egypt J Agron 41(3):255–260
28. Helmy A, Wagdi O (2019) Three-dimensional analysis of bank profit with the development of regulatory restrictions: evidence from Egypt. Int J Econ Finance 11(3):12
29. Jolliffe IT (1987) Rotation of principal components: some comments. J Climatol 7(5):507–510
30. Karim NA, Alhabshi SMSJ, Kassim S, Haron R, Alam KP (2019) A critical review of bank stability measures in selected countries with dual banking system. Revista Publicando 6(19):118–131
31. Karpowicz I (2016) Financial inclusion, growth and inequality: a model application to Colombia. J Bank Financ Econ 6(2):68–89
32. Kim DW, Yu JS, Hassan MK (2018) Financial inclusion and economic growth in OIC countries. Res Int Bus Financ 43:1–14
33. Krizanova A, Lăzăroiu G, Gajanova L, Kliestikova J, Nadanyiova M, Moravcikova D (2019) The effectiveness of marketing communication and importance of its evaluation in an online environment. Sustain-ability 11(24):7016
34. Kumar R, Singh RK (2017) Coordination and responsiveness issues in SME supply chains: a review. Benchmark Int J 24(3):635–650
35. Levine R, Lin C, Xie W (2017) The origins of financial development: how the African slave trade continues to influence modern finance (No. w23800). National Bureau of Economic Research, NBER WORKING PAPER SERIES,1–50
36. Liu X, Koirala H (2012) Ordinal regression analysis: Using generalized ordinal logistic regression models to estimate educational data. J Mod Appl Stat Methods 11(1):1–14
37. Malik A, Khalid GK (2008) Work/life conflicts and desired work hour adjustments: Banking perspective in Pakistan. Int Rev Bus Res Pap 4(5):267–276
38. Mehrotra A, Yetman J (2014) Financial inclusion and optimal monetary policy BIS Working Papers No 476. Monetary and Economic Depart-ment, 1–30
39. Mundial B (2014) Global financial development report 2014. Financial Inclusion. International Bank for Reconstruction and Development/The World Bank
40. Musamali MM, Tarus DK (2013) Does firm profile influence financial access among small and medium enterprises in Kenya? Asian Econ Financ Rev 3(6):714
41. Neaime S, Gaysset I (2017) Sustainability of macroeconomic policies in selected MENA countries: post financial and debt crises. Res Int Bus Finance 40:129–140
42. Nuryakin C, Sastiono P, Maizar FA, Amin P, Yunita L, Puspita N, Afrizal M, Tjen C (2017) Financial inclusion through digital financial services and branchless banking: inclusiveness, challenges and opportunities. In: Lembaga Penyelidikan Ekonomi dan Masyarakat-Fakultas Ekonomi dan Bisnis, 1–10
43. OECD S, Outlook E (2005) Organization for Economic Co-operation and Development Publishing
44. Park CY, Mercado RV (2014) Equity home bias, financial integration, and regulatory reforms: implications for emerging Asia. In: Global shock, risks, and Asian financial reform. Edward Elgar Publishing
45. Perotti E, Volpin P (2007) Investor protection and entry, Tinbergen Insti-tute Discussion Paper, No. 07-006/2, Tinbergen Institute, Amsterdam and Rotterdam, 1–40
46. Petersen MA, Rajan RG (1994) The benefits of lending relationships: evidence from small business data. J Finance 49(1):3–37
47. Prawitasari L, Hudrasyah H (2012) Integrated marketing communica-tion to enhance active user of internet banking service: case study bank XYZ. Indones J Bus Admin 1(3):66931
48. Rashdan A, Eissa N (2020) The determinants of financial inclusion in Egypt. Int J Financ Res 11(1):1–14
49. Rasyid R, Masdupi E, Yasri, Roza-Linda M (2018) Analysis of financial literacy and financial inclusion as a strategy to improve the competi-tiveness of small-medium enterprises (SMEs) of handicrafts business in West Sumatera. In: Proceedings of 95th IRES international conference, Kuala Lumpur, Malaysia, 39–42
50. Riwayati HE (2017) Financial inclusion of business players in mediating the success of small and medium enterprises in Indonesia. Int J Econ Financ Issues 7(4):623–627
51. Rubtcova M, Pavenkov O (2019). Features of integrated marketing communications of the Russian Bank Sphere. In: RF-360th international conference on management, economics and social science-ICMESS
52. Sakariya S (2013) Evaluation of financial inclusion strategy compo-nents: Reflections from India. J Int Manag Stud 13(1):83–92
53. Samer M, Abdelaziz S, Refai M, Abdelsalam E (2020) Techno-economic assessment of dry fermentation in household biogas units through co-digestion of manure and agricultural crop residues in Egypt. Renew Energy 149:226–234
54. Sarma M (2012) Index of financial inclusion—A measure of financial sector inclusiveness. Centre for International Trade and Development, School of International Studies, Working Paper Jawaharlal Nehru Uni-versity. Delhi, India, paper no.07/2012, 1–37
55. Šerić M, Gil-Saura I, Ruiz-Molina ME (2014) How can integrated market-ing communications and advanced technology influence the creation of customer-based brand equity? Evidence from the hospitality indus-try. Int J Hosp Manag 39:144–156
56. Shanker S (2013) Financial inclusion in India: do microfinance institu-tions address access barriers? ACRN J Entrep Perspect 2(1):60–74
57. Shlens J (2014) A tutorial on principal component analysis. arXiv pre-print arXiv:1404.1100

Page 19 of 19ElDeeb et al. Futur Bus J (2021) 7:32
58. Shofawati A (2019) The role of digital finance to strengthen financial inclusion and the growth of SME in Indonesia. KnE Soc Sci 3:389–407
59. Tomaselli MF, Timko J, Kozak R (2013) Assessing small and medium for-est enterprises’ access to microfinance: case studies from The Gambia. J Dev Stud 49(3):334–347
60. Turegano DM, Herrero AG (2018) Financial inclusion, rather than size, is the key to tackling income inequality. Singap Econ Rev 63(01):167–184
61. World Bank (2012) Development Research Group. Finance and Private Sector Development Team, 2012. The Little Data Book on Financial Inclusion. World Bank Publications
62. Zachosova N, Herasymenko O, Shevchenko A (2018) Risks and possibili-ties of the effect of financial inclusion on managing the financial security at the macro level. Invest Manag Financ Innov 15(4):304