Embed Size (px)
Citation preview
The Pipeline to New Hampshire’s Future
2 I University System of New Hampshire
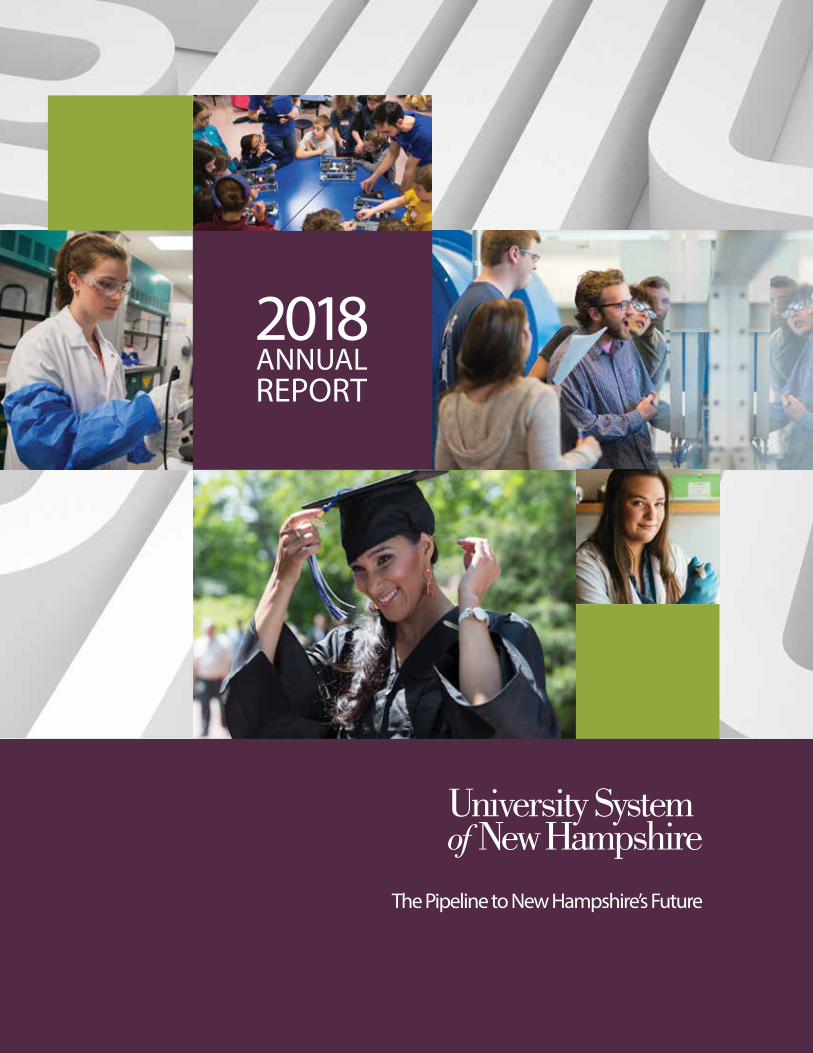
The University System of New Hampshire (USNH) includes the University of New Hampshire (UNH), with campuses in Durham,
Manchester and Concord, Plymouth State University (PSU), Keene State College (KSC) and Granite State College (GSC). KSC, PSU and
UNH Durham are the three residential campuses of USNH. The system enrolls 32,000 students and is committed to providing access to
affordable, high-quality education and to creating a talented workforce to serve the state’s businesses and communities. A 29-member
board of trustees is responsible for overseeing the system. The chancellor is the chief executive and academic officer of USNH, and is
responsible for developing, recommending and implementing the board’s policies and decisions.
34
25
23
21
20
18
16
12
10
7
5
University System of New Hampshire I 3
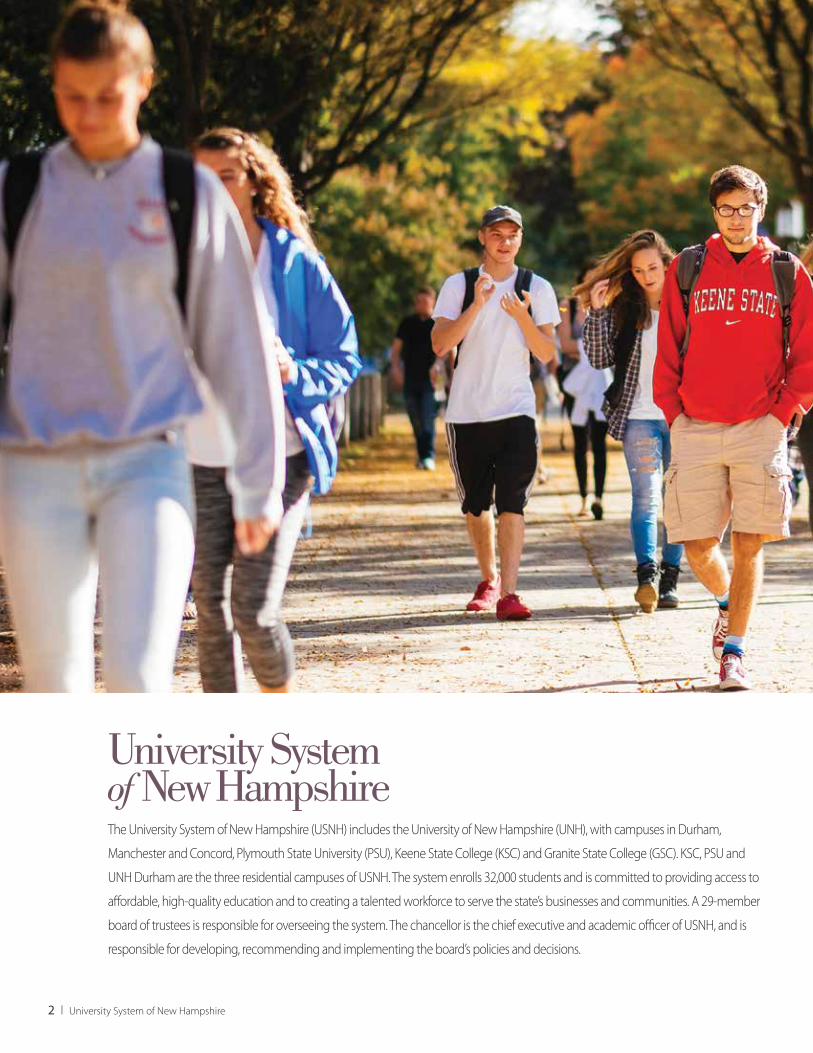
ContentsChancellor’s Letter
Report from USNH
Efficiencies
STEM and Research
Workforce Development
Health and Education
Serving State Needs
Open Education Initiative
Business
Report of Independent Auditors
Management’s Discussion and Analysis
Financial Statements
Notes to the Financial Statements
1. University of New Hampshire, Durham2. University of New Hampshire, Manchester3. University of New Hampshire School of Law, Concord4. Plymouth State University5. Keene State College
6. Granite State College, Concord7. Granite State College, Conway8. Granite State College, Manchester9. Granite State College, Nashua (Colocation)10. Granite State College, Portsmouth 11. Granite State College, Rochester
University System of New Hampshire
1
2
3
4
5
6
7
8
9
10
11
The 2018 Annual Report is a publication of the University System of New Hampshire. Prior year University System annual reports are available online at https://www.usnh.edu/about/publications. University System of New Hampshire, 5 Chenell Drive, Suite 301, Concord, NH 03301 603-862-1800.
4
37
4 I University System of New Hampshire
At this year’s Business and Industry Association’s Strategic Retreat, workforce needs were identified as one of New Hampshire’s most pressing business imperatives, and that sentiment seems to be shared by every industry leader I meet with. Unemployment data suggests that the State’s biggest workforce bottleneck is among those that are bachelor’s educated and above. Unfortunately, demographic data suggests the imperative is only going to be stronger over the next several years to come.
Compounding New Hampshire’s workforce challenge is the fact that every other state in New England is facing the same demographic landscape and thus the same workforce challenge. What that means is that our workforce pipeline is going to be increasingly dependent upon a strong pipeline of talent and keeping more New Hampshire students in New Hampshire will be key to achieving the necessary talent pipeline.
The University System of New Hampshire is the State’s largest provider of a bachelor’s educated workforce. Our institutions are particularly focused on State needs for educators, health care professionals, and STEM (science, technology, engineering and math) educated workers. The University System invested over $5 million into biological science labs in UNH’s Manchester facility this year in support of New Hampshire’s regenerative medicine industry, and our institutions are dedicated to working closely with industry partners in support of their needs.
Key to preparing New Hampshire’s workforce is ensuring affordable access. Holding down costs by leveraging economies of scale across the System has long been a focus of the System and those efforts have been stepped up through strategic procurement and aggressive management of health care costs, among other cost containment efforts. The System also leverages State dollars to lower tuition for all New Hampshire residents. In addition, USNH institutions have raised millions for additional scholarships and all residential institutions are offering the Granite Guarantee that allows Pell eligible New Hampshire students to attend tuition free.
New Hampshire’s public four-year institutions are critical to the State’s talent pipeline and serve as one of New Hampshire’s most critical economic engines. The University System works hard to maximize the return on investment for both the State and our students.
Todd LeachChancellor
Chancellor’s Letter
University System of New Hampshire I 5
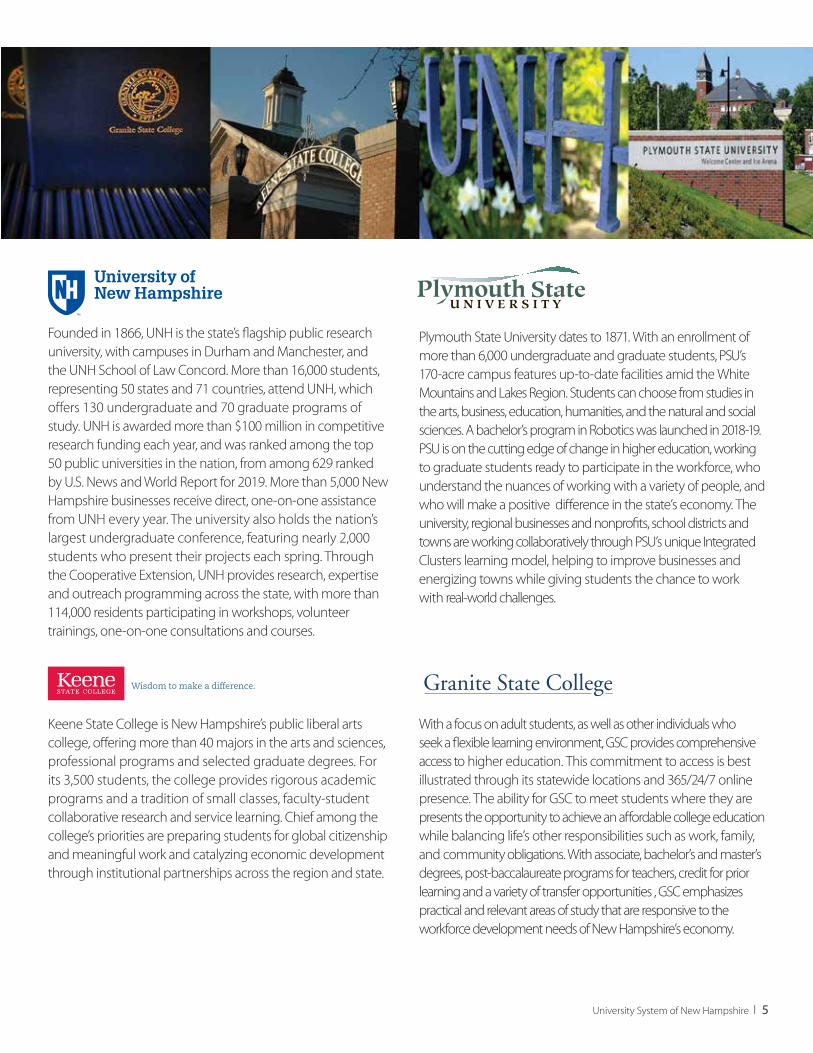
Founded in 1866, UNH is the state’s flagship public research university, with campuses in Durham and Manchester, and the UNH School of Law Concord. More than 16,000 students, representing 50 states and 71 countries, attend UNH, which offers 130 undergraduate and 70 graduate programs of study. UNH is awarded more than $100 million in competitive research funding each year, and was ranked among the top 50 public universities in the nation, from among 629 ranked by U.S. News and World Report for 2019. More than 5,000 New Hampshire businesses receive direct, one-on-one assistance from UNH every year. The university also holds the nation’s largest undergraduate conference, featuring nearly 2,000 students who present their projects each spring. Through the Cooperative Extension, UNH provides research, expertise and outreach programming across the state, with more than 114,000 residents participating in workshops, volunteer trainings, one-on-one consultations and courses.
Keene State College is New Hampshire’s public liberal arts college, offering more than 40 majors in the arts and sciences, professional programs and selected graduate degrees. For its 3,500 students, the college provides rigorous academic programs and a tradition of small classes, faculty-student collaborative research and service learning. Chief among the college’s priorities are preparing students for global citizenship and meaningful work and catalyzing economic development through institutional partnerships across the region and state.
Plymouth State University dates to 1871. With an enrollment of more than 6,000 undergraduate and graduate students, PSU’s 170-acre campus features up-to-date facilities amid the White Mountains and Lakes Region. Students can choose from studies in the arts, business, education, humanities, and the natural and social sciences. A bachelor’s program in Robotics was launched in 2018-19. PSU is on the cutting edge of change in higher education, working to graduate students ready to participate in the workforce, who understand the nuances of working with a variety of people, and who will make a positive difference in the state’s economy. The university, regional businesses and nonprofits, school districts and towns are working collaboratively through PSU’s unique Integrated Clusters learning model, helping to improve businesses and energizing towns while giving students the chance to work with real-world challenges.
With a focus on adult students, as well as other individuals who seek a flexible learning environment, GSC provides comprehensive access to higher education. This commitment to access is best illustrated through its statewide locations and 365/24/7 online presence. The ability for GSC to meet students where they are presents the opportunity to achieve an affordable college education while balancing life’s other responsibilities such as work, family, and community obligations. With associate, bachelor’s and master’s degrees, post-baccalaureate programs for teachers, credit for prior learning and a variety of transfer opportunities , GSC emphasizes practical and relevant areas of study that are responsive to the workforce development needs of New Hampshire’s economy.

6 I University System of New Hampshire
Alumni Legislator Breakfast Always terrific to connect with our alumni lawmakers at our annual USNH alumni breakfast. This is a wonderful event where our alumni lawmakers hear first-hand from the presidents and recent graduates of our institutions and are recognized for their commitment to public service.
University System of New Hampshire I 7
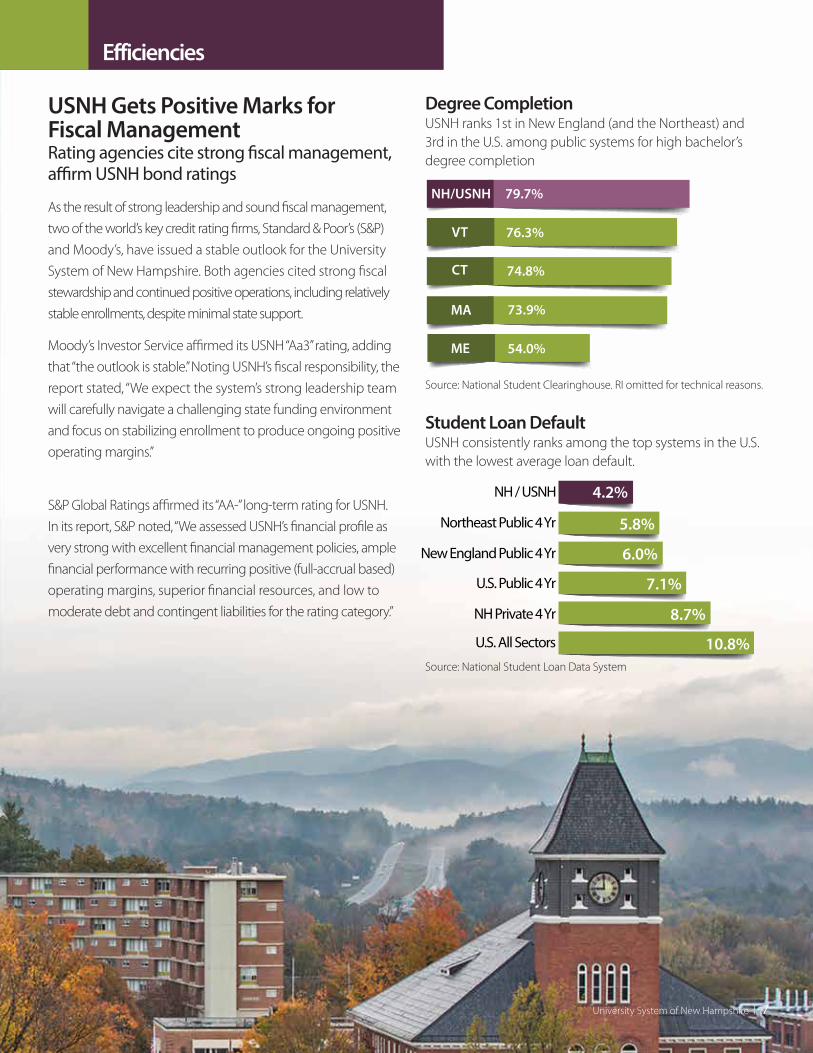
USNH Gets Positive Marks for Fiscal ManagementRating agencies cite strong fiscal management, affirm USNH bond ratings
As the result of strong leadership and sound fiscal management, two of the world’s key credit rating firms, Standard & Poor’s (S&P) and Moody’s, have issued a stable outlook for the University System of New Hampshire. Both agencies cited strong fiscal stewardship and continued positive operations, including relatively stable enrollments, despite minimal state support.
Moody’s Investor Service affirmed its USNH “Aa3” rating, adding that “the outlook is stable.” Noting USNH’s fiscal responsibility, the report stated, “We expect the system’s strong leadership team will carefully navigate a challenging state funding environment and focus on stabilizing enrollment to produce ongoing positive operating margins.”
S&P Global Ratings affirmed its “AA-” long-term rating for USNH. In its report, S&P noted, “We assessed USNH’s financial profile as very strong with excellent financial management policies, ample financial performance with recurring positive (full-accrual based) operating margins, superior financial resources, and low to moderate debt and contingent liabilities for the rating category.”
Degree Completion USNH ranks 1st in New England (and the Northeast) and 3rd in the U.S. among public systems for high bachelor’s degree completion
Source: National Student Clearinghouse. RI omitted for technical reasons.
Student Loan Default USNH consistently ranks among the top systems in the U.S. with the lowest average loan default.
Source: National Student Loan Data System
4.2%
U.S. All Sectors
U.S. Public 4 Yr
Northeast Public 4 Yr
NH / USNH
10.8%
7.1%
New England Public 4 Yr 6.0%
5.8%
NH Private 4 Yr 8.7%
Efficiencies
8 I University System of New Hampshire
Efficiencies
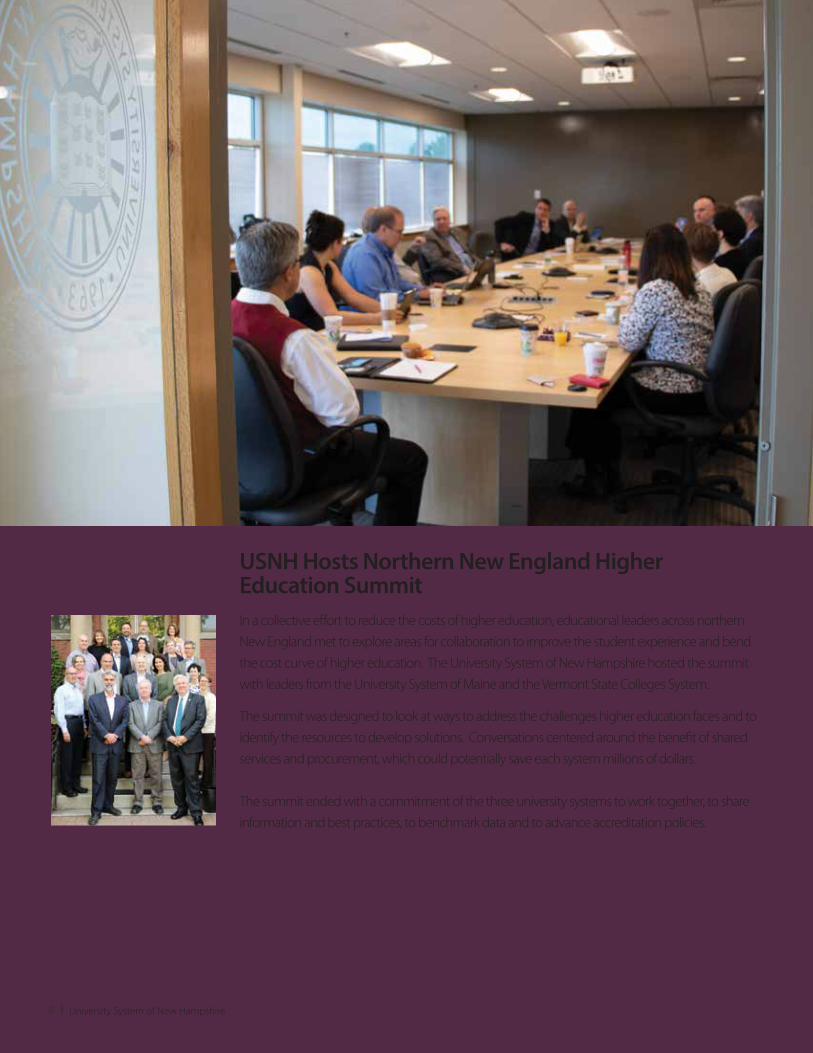
USNH Hosts Northern New England Higher Education Summit In a collective effort to reduce the costs of higher education, educational leaders across northern New England met to explore areas for collaboration to improve the student experience and bend the cost curve of higher education. The University System of New Hampshire hosted the summit with leaders from the University System of Maine and the Vermont State Colleges System.
The summit was designed to look at ways to address the challenges higher education faces and to identify the resources to develop solutions. Conversations centered around the benefit of shared services and procurement, which could potentially save each system millions of dollars. The summit ended with a commitment of the three university systems to work together, to share information and best practices, to benchmark data and to advance accreditation policies.
University System of New Hampshire I 9
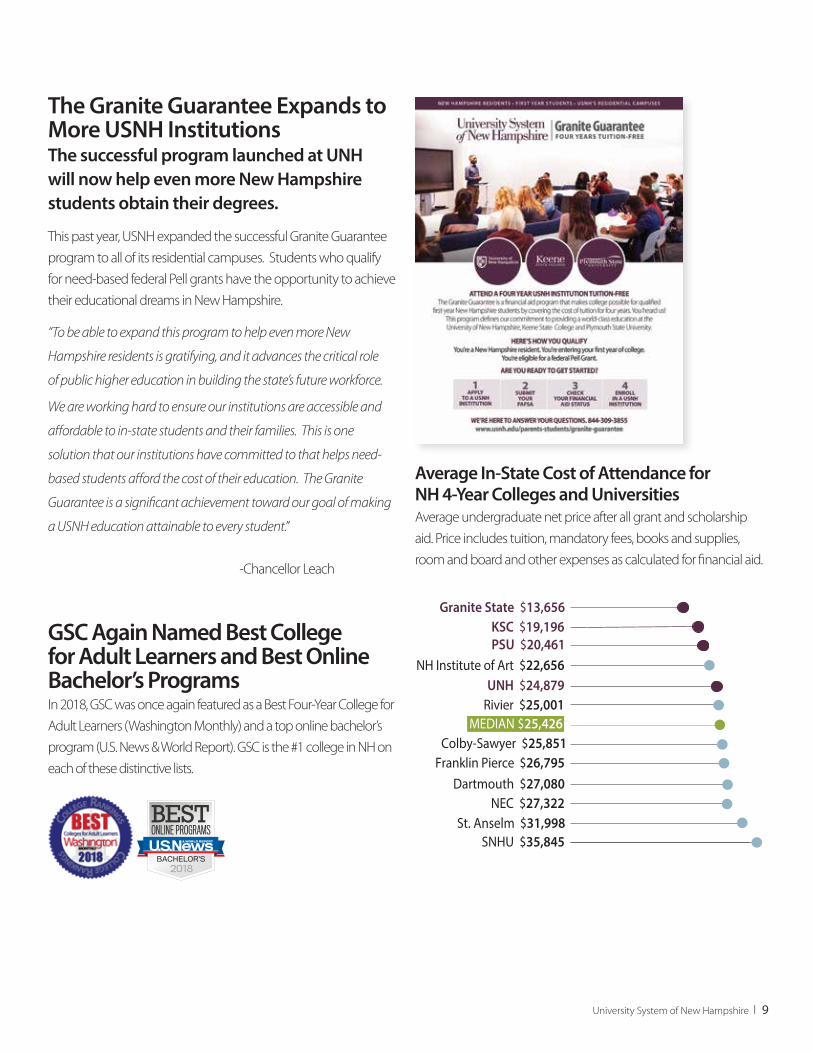
The Granite Guarantee Expands to More USNH InstitutionsThe successful program launched at UNH will now help even more New Hampshire students obtain their degrees. This past year, USNH expanded the successful Granite Guarantee program to all of its residential campuses. Students who qualify for need-based federal Pell grants have the opportunity to achieve their educational dreams in New Hampshire.
“To be able to expand this program to help even more New
Hampshire residents is gratifying, and it advances the critical role
of public higher education in building the state’s future workforce.
We are working hard to ensure our institutions are accessible and
affordable to in-state students and their families. This is one
solution that our institutions have committed to that helps need-
based students afford the cost of their education. The Granite
Guarantee is a significant achievement toward our goal of making
a USNH education attainable to every student.” -Chancellor Leach
GSC Again Named Best College for Adult Learners and Best Online Bachelor’s ProgramsIn 2018, GSC was once again featured as a Best Four-Year College for Adult Learners (Washington Monthly) and a top online bachelor’s program (U.S. News & World Report). GSC is the #1 college in NH on each of these distinctive lists.
Average In-State Cost of Attendance forNH 4-Year Colleges and Universities Average undergraduate net price after all grant and scholarship aid. Price includes tuition, mandatory fees, books and supplies, room and board and other expenses as calculated for financial aid.
Rivier $25,001
Colby-Sawyer $25,851MEDIAN $25,426
NH Institute of Art $22,656
Dartmouth $27,080
UNH $24,879
KSC $19,196PSU $20,461
NEC $27,322St. Anselm $31,998
Granite State $13,656
SNHU $35,845
Franklin Pierce $26,795
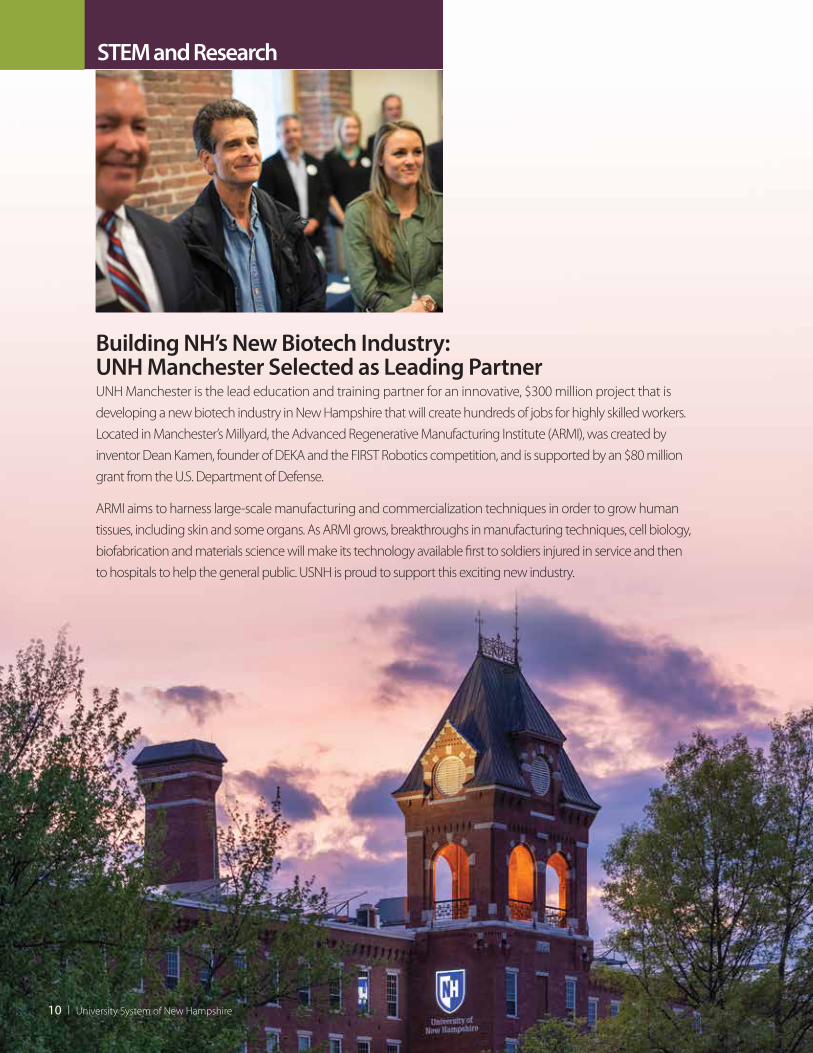
Building NH’s New Biotech Industry:UNH Manchester Selected as Leading PartnerUNH Manchester is the lead education and training partner for an innovative, $300 million project that is developing a new biotech industry in New Hampshire that will create hundreds of jobs for highly skilled workers. Located in Manchester’s Millyard, the Advanced Regenerative Manufacturing Institute (ARMI), was created by inventor Dean Kamen, founder of DEKA and the FIRST Robotics competition, and is supported by an $80 million grant from the U.S. Department of Defense.
ARMI aims to harness large-scale manufacturing and commercialization techniques in order to grow human tissues, including skin and some organs. As ARMI grows, breakthroughs in manufacturing techniques, cell biology, biofabrication and materials science will make its technology available first to soldiers injured in service and then to hospitals to help the general public. USNH is proud to support this exciting new industry.
10 I University System of New Hampshire
STEM and Research
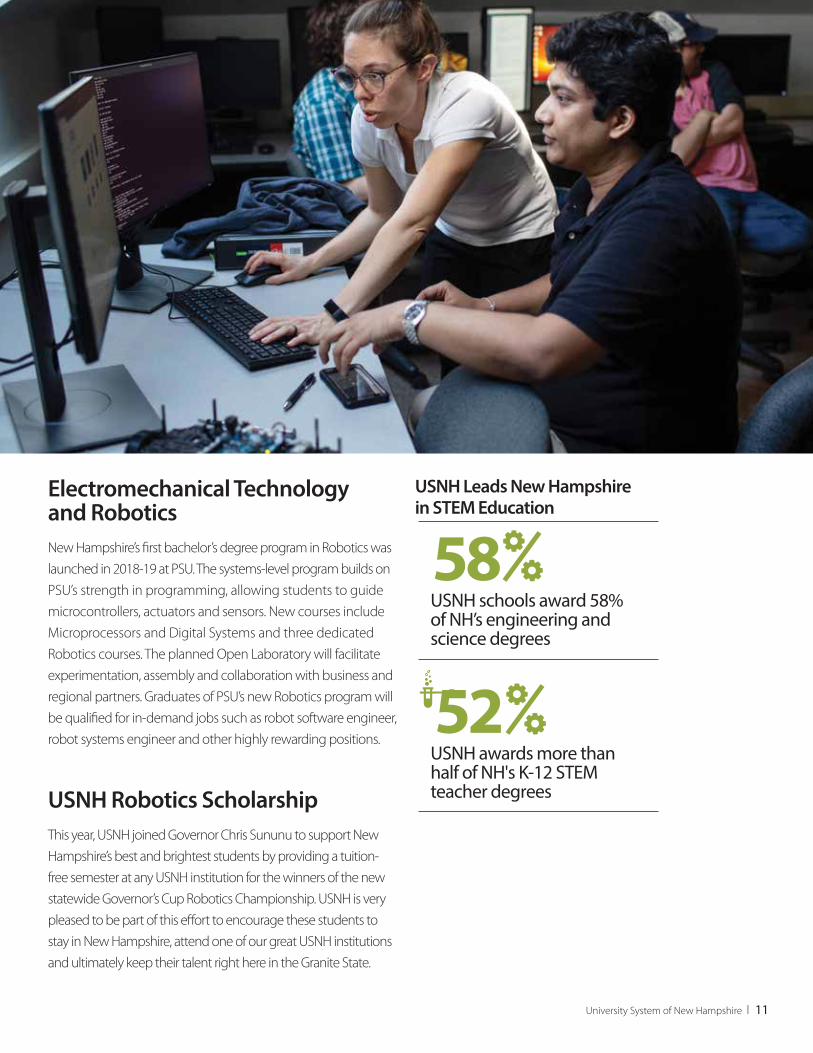
Electromechanical Technology and Robotics New Hampshire’s first bachelor’s degree program in Robotics was launched in 2018-19 at PSU. The systems-level program builds on PSU’s strength in programming, allowing students to guide microcontrollers, actuators and sensors. New courses include Microprocessors and Digital Systems and three dedicated Robotics courses. The planned Open Laboratory will facilitate experimentation, assembly and collaboration with business and regional partners. Graduates of PSU’s new Robotics program will be qualified for in-demand jobs such as robot software engineer, robot systems engineer and other highly rewarding positions.
USNH Robotics Scholarship This year, USNH joined Governor Chris Sununu to support New Hampshire’s best and brightest students by providing a tuition-free semester at any USNH institution for the winners of the new statewide Governor’s Cup Robotics Championship. USNH is very pleased to be part of this effort to encourage these students to stay in New Hampshire, attend one of our great USNH institutions and ultimately keep their talent right here in the Granite State.
USNH Leads New Hampshire in STEM Education
University System of New Hampshire I 11
58
52
USNH schools award 58% of NH’s engineering andscience degrees
USNH awards more than half of NH's K-12 STEM teacher degrees
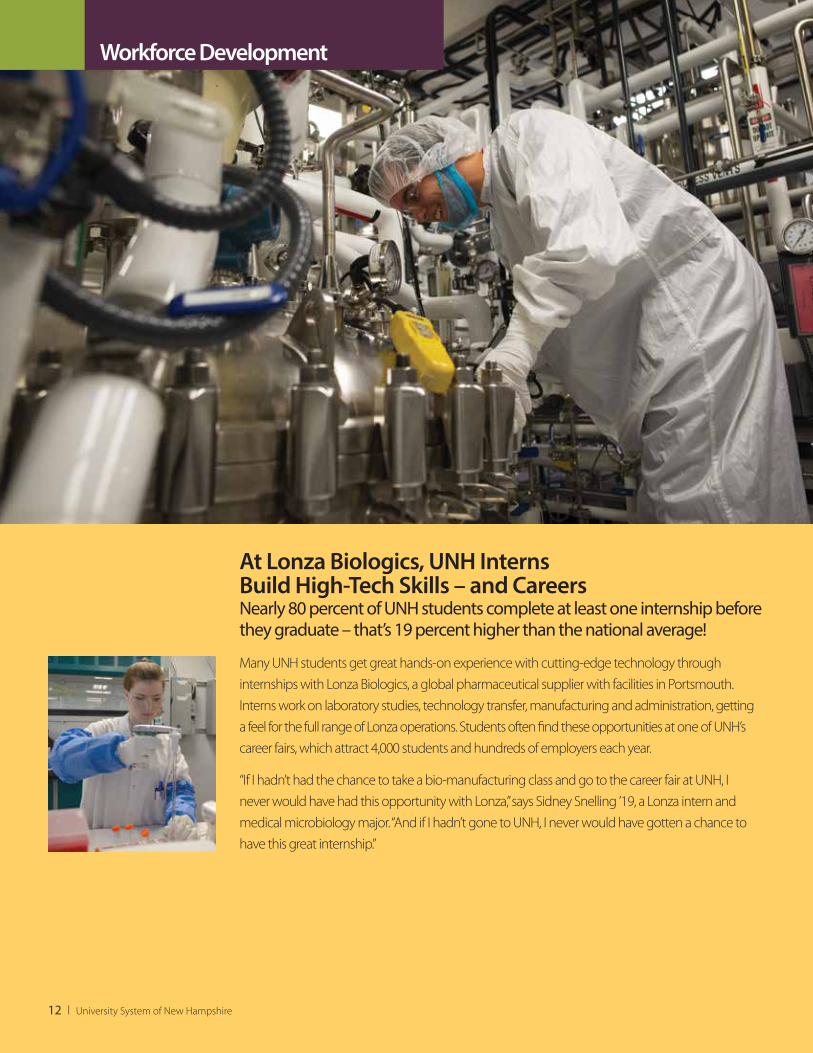
At Lonza Biologics, UNH InternsBuild High-Tech Skills – and CareersNearly 80 percent of UNH students complete at least one internship before they graduate – that’s 19 percent higher than the national average!
Many UNH students get great hands-on experience with cutting-edge technology through internships with Lonza Biologics, a global pharmaceutical supplier with facilities in Portsmouth. Interns work on laboratory studies, technology transfer, manufacturing and administration, getting a feel for the full range of Lonza operations. Students often find these opportunities at one of UNH’s career fairs, which attract 4,000 students and hundreds of employers each year.
“If I hadn’t had the chance to take a bio-manufacturing class and go to the career fair at UNH, I never would have had this opportunity with Lonza,” says Sidney Snelling ’19, a Lonza intern and medical microbiology major. “And if I hadn’t gone to UNH, I never would have gotten a chance to have this great internship.”
12 I University System of New Hampshire
Workforce Development
University System of New Hampshire I 13
First-in-the-Nation Construction Safety Sciences ProgramKeene State’s new Construction Safety Sciences Program is the first in the nation. The program prepares students for a variety of occupational safety and health program management positions in the private and public sectors. Emphasis is placed on critical thinking, hazard identification and prioritization, problem solving, cost effectiveness, professional skills in programmatic management and safety and environmental regulatory compliance.
Applied Optics Program Keene State invited representatives from local industries to campus on August 17 to explore the creation of an ‘Optics’ or ‘Applied Optics’ program at the college. The group included BAE Systems, Corning, Omega Optical, Chroma, and Stingray Optics. Keene State shared details of current courses that could be built into an optics program, brainstormed skills and outcomes of an optics curriculum, and discussed creation of a program that meets the hiring needs of those companies. Moving forward, KSC is forming a faculty advisory committee to outline courses for a four-year major in optics, as well as certificate and minor options. BAE has volunteered to identify instrumentation and machinery that may be donated or loaned to Keene State, and representatives of the company have discussed the potential of sponsoring a course or program. In addition, BAE is one of eight represented companies that will participate in the college’s Career Speaker Series. BAE Systems made its first hires from Keene State in May – Brittany Jennings ’18 was hired as a process engineer and Julia Przekaza ’19 was an intern.
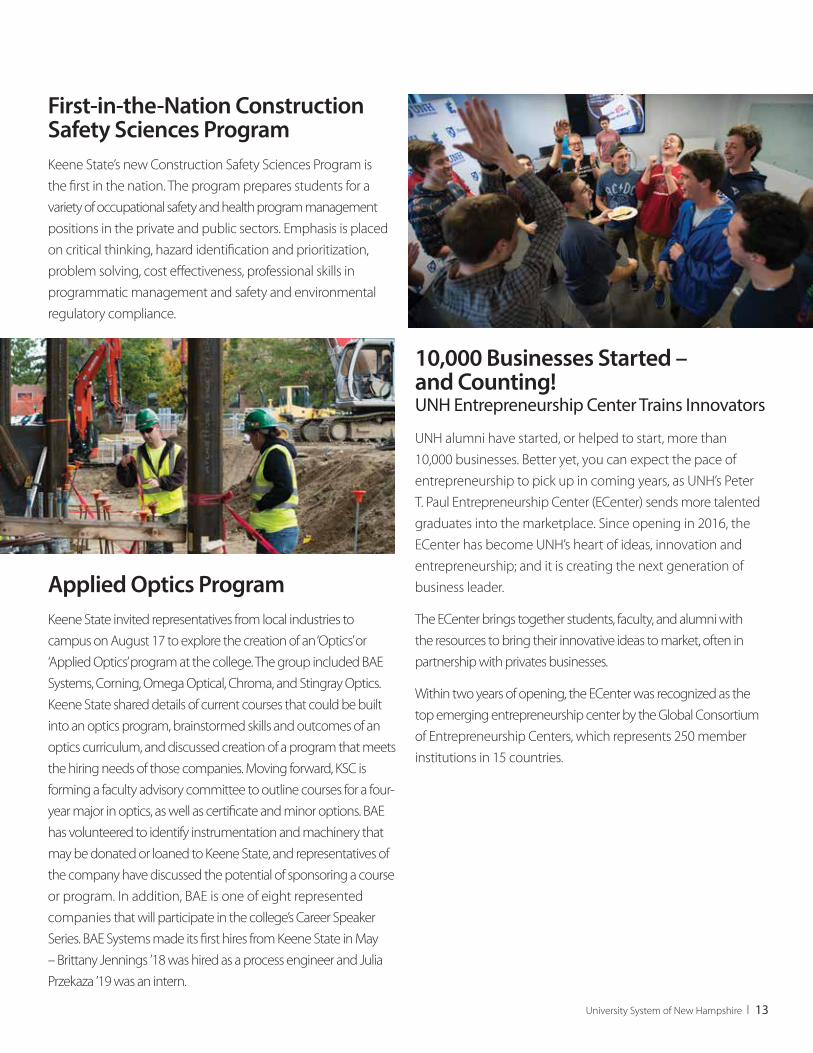
10,000 Businesses Started – and Counting!UNH Entrepreneurship Center Trains Innovators UNH alumni have started, or helped to start, more than 10,000 businesses. Better yet, you can expect the pace of entrepreneurship to pick up in coming years, as UNH’s Peter T. Paul Entrepreneurship Center (ECenter) sends more talented graduates into the marketplace. Since opening in 2016, the ECenter has become UNH’s heart of ideas, innovation and entrepreneurship; and it is creating the next generation of business leader.
The ECenter brings together students, faculty, and alumni with the resources to bring their innovative ideas to market, often in partnership with privates businesses.
Within two years of opening, the ECenter was recognized as the top emerging entrepreneurship center by the Global Consortium of Entrepreneurship Centers, which represents 250 member institutions in 15 countries.
14 I University System of New Hampshire
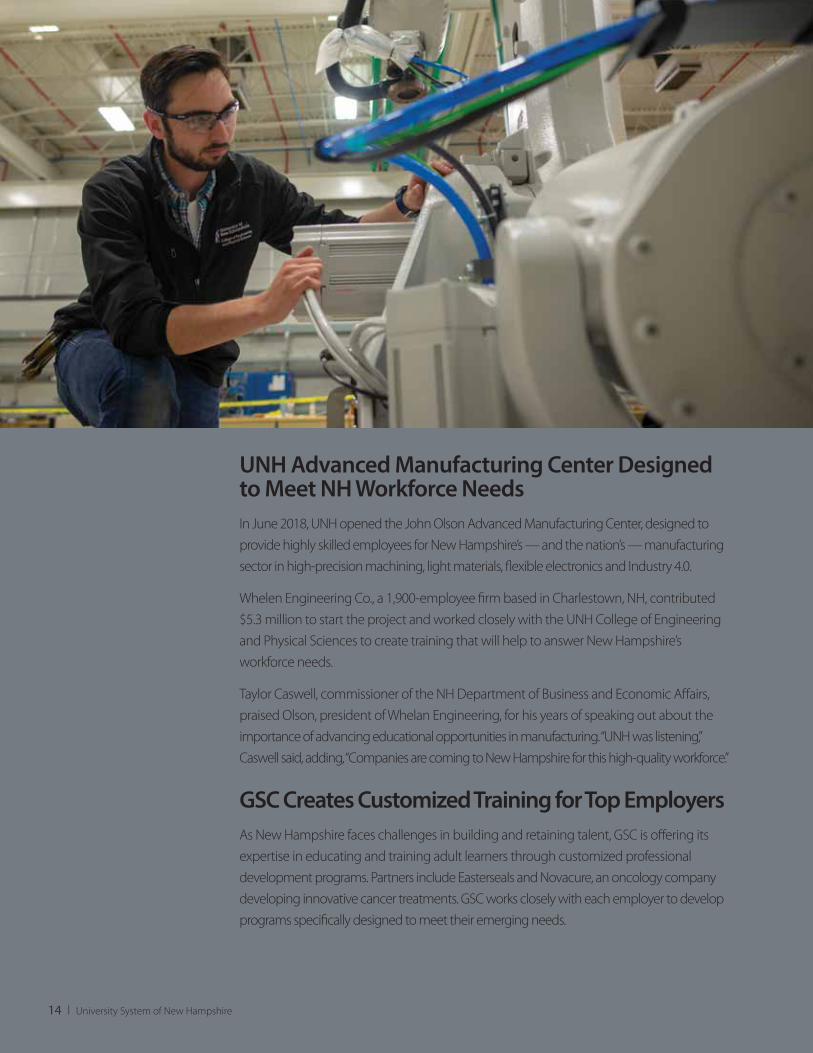
UNH Advanced Manufacturing Center Designed to Meet NH Workforce NeedsIn June 2018, UNH opened the John Olson Advanced Manufacturing Center, designed to provide highly skilled employees for New Hampshire’s — and the nation’s — manufacturing sector in high-precision machining, light materials, flexible electronics and Industry 4.0.
Whelen Engineering Co., a 1,900-employee firm based in Charlestown, NH, contributed $5.3 million to start the project and worked closely with the UNH College of Engineering and Physical Sciences to create training that will help to answer New Hampshire’s workforce needs.
Taylor Caswell, commissioner of the NH Department of Business and Economic Affairs, praised Olson, president of Whelan Engineering, for his years of speaking out about the importance of advancing educational opportunities in manufacturing. “UNH was listening,” Caswell said, adding, “Companies are coming to New Hampshire for this high-quality workforce.”
GSC Creates Customized Training for Top Employers As New Hampshire faces challenges in building and retaining talent, GSC is offering its expertise in educating and training adult learners through customized professional development programs. Partners include Easterseals and Novacure, an oncology company developing innovative cancer treatments. GSC works closely with each employer to develop programs specifically designed to meet their emerging needs.
University System of New Hampshire I 15
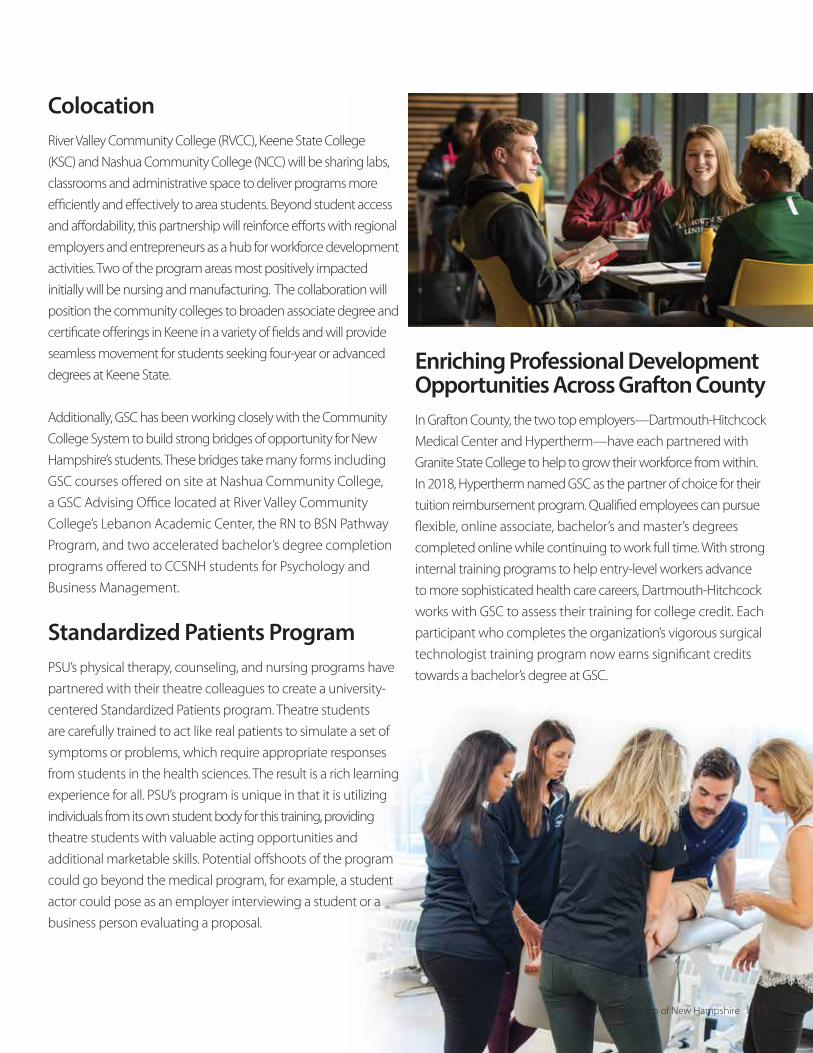
Colocation River Valley Community College (RVCC), Keene State College (KSC) and Nashua Community College (NCC) will be sharing labs, classrooms and administrative space to deliver programs more efficiently and effectively to area students. Beyond student access and affordability, this partnership will reinforce efforts with regional employers and entrepreneurs as a hub for workforce development activities. Two of the program areas most positively impacted initially will be nursing and manufacturing. The collaboration will position the community colleges to broaden associate degree and certificate offerings in Keene in a variety of fields and will provide seamless movement for students seeking four-year or advanced degrees at Keene State. Additionally, GSC has been working closely with the Community College System to build strong bridges of opportunity for New Hampshire’s students. These bridges take many forms including GSC courses offered on site at Nashua Community College, a GSC Advising Office located at River Valley Community College’s Lebanon Academic Center, the RN to BSN Pathway Program, and two accelerated bachelor’s degree completion programs offered to CCSNH students for Psychology and Business Management.
Standardized Patients Program PSU’s physical therapy, counseling, and nursing programs have partnered with their theatre colleagues to create a university-centered Standardized Patients program. Theatre students are carefully trained to act like real patients to simulate a set of symptoms or problems, which require appropriate responses from students in the health sciences. The result is a rich learning experience for all. PSU’s program is unique in that it is utilizing individuals from its own student body for this training, providing theatre students with valuable acting opportunities and additional marketable skills. Potential offshoots of the program could go beyond the medical program, for example, a student actor could pose as an employer interviewing a student or a business person evaluating a proposal.
Enriching Professional Development Opportunities Across Grafton County In Grafton County, the two top employers—Dartmouth-Hitchcock Medical Center and Hypertherm—have each partnered with Granite State College to help to grow their workforce from within. In 2018, Hypertherm named GSC as the partner of choice for their tuition reimbursement program. Qualified employees can pursue flexible, online associate, bachelor’s and master’s degrees completed online while continuing to work full time. With strong internal training programs to help entry-level workers advance to more sophisticated health care careers, Dartmouth-Hitchcock works with GSC to assess their training for college credit. Each participant who completes the organization’s vigorous surgical technologist training program now earns significant credits towards a bachelor’s degree at GSC.

16 I University System of New Hampshire
Efficiencies
Growing the Nursing Workforce through Smart Partnerships According to a report from Medicare Health Plans, New Hampshire’s nurses rank #10 among the most overworked nationwide. To support growth among the nursing workforce, Granite State College has developed key partnerships across the state. Now in its fifth year, the Community College System of New Hampshire (CCSNH) and GSC offer an RN to BSN pathway that guides NH students from the associate-level to a bachelor’s degree with a competitive, low tuition rate. This flexible option allows students to work in a health care facility and gain experience, while finishing their degree.
Health and Education
University System of New Hampshire I 17
Strength and Conditioning Open Laboratory Plymouth State University’s comprehensive renovation of the Physical Education Center includes a new Strength and Conditioning Open Laboratory, which will support the Health and Human Enrichment Cluster of disciplines. Students enrolled in athletic training, physical education, adventure education, physical therapy, exercise and sports physiology and other allied health fields will use top-notch equipment and work in state-of-the-art facilities. This academic hub will integrate knowledge gained in the classroom with hands-on expertise refined in the Open Laboratory, which will serve as a nexus for shared projects with industry. The renovation is taking place courtesy of $3 million in initial Capital Improvement Project (CIP) funding approved by Governor Sununu and the New Hampshire Legislature.
Two New Master’s Programs: Addressing NH’s Health Care Needs With roughly half of its employees nearing retirement age, the health care industry in New Hampshire is positioned for a generational turnover of workers, which will create a significant shortage of talent across the field. Two new graduate programs at GSC, the Master of Science in Nursing and the M.S. in Health Care Management, will help to address this gap by preparing emerging leaders in the health care workforce for top positions in nursing and management. These programs are designed for professionals who are already serving the workforce and can be completed 100% online, allowing students to balance their graduate program with their career and home life.
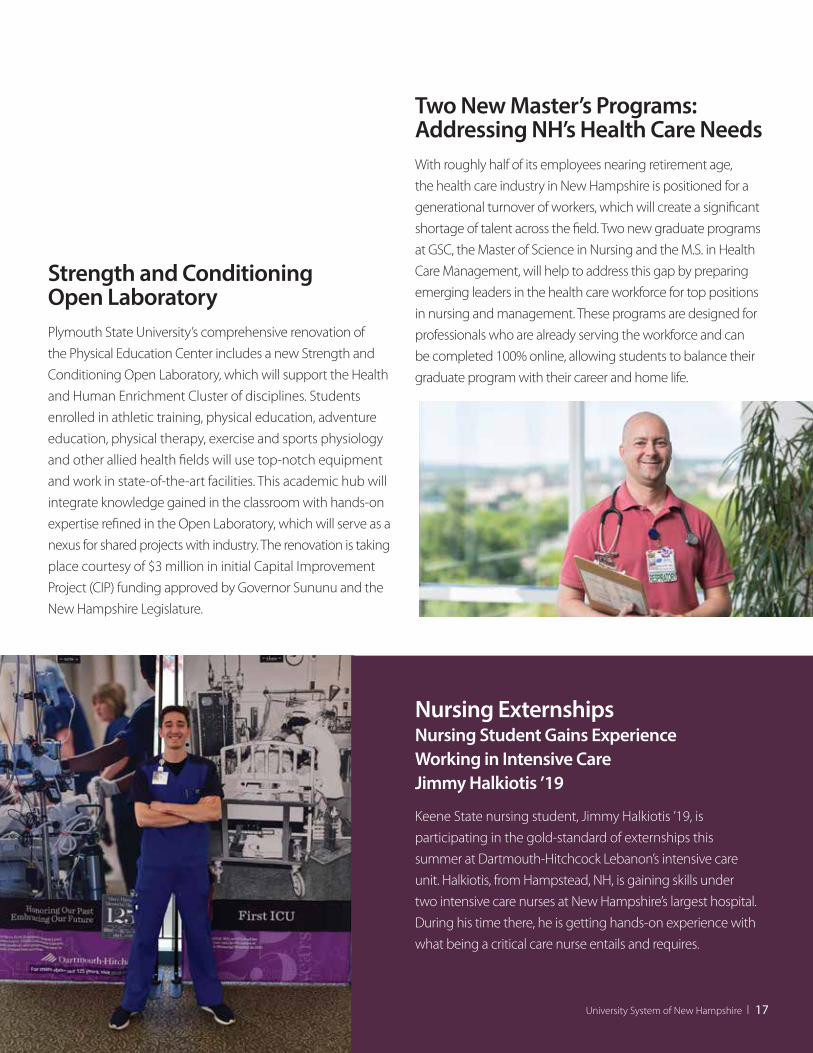
Nursing Externships Nursing Student Gains Experience Working in Intensive CareJimmy Halkiotis ’19 Keene State nursing student, Jimmy Halkiotis ’19, is participating in the gold-standard of externships this summer at Dartmouth-Hitchcock Lebanon’s intensive care unit. Halkiotis, from Hampstead, NH, is gaining skills under two intensive care nurses at New Hampshire’s largest hospital. During his time there, he is getting hands-on experience with what being a critical care nurse entails and requires.

18 I University System of New Hampshire
Serving State Needs
University System of New Hampshire I 19
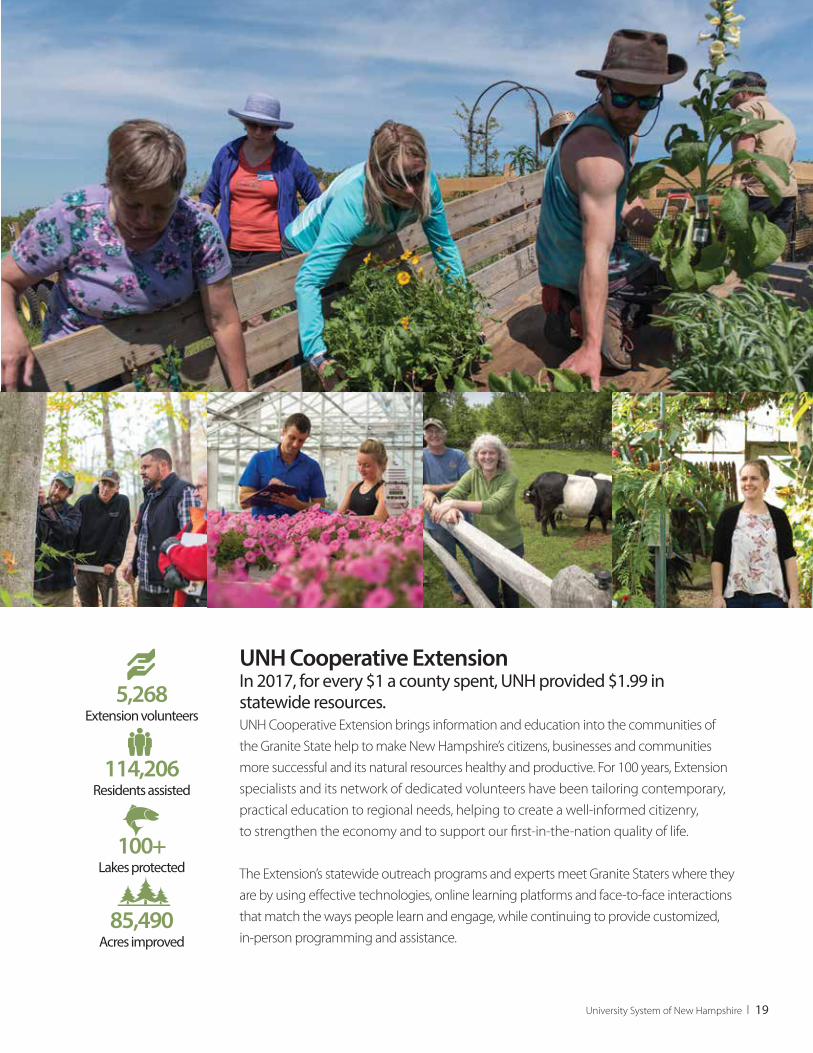
5,268 Extension volunteers
114,206Residents assisted
100+Lakes protected
85,490 Acres improved
UNH Cooperative Extension In 2017, for every $1 a county spent, UNH provided $1.99 in statewide resources. UNH Cooperative Extension brings information and education into the communities ofthe Granite State help to make New Hampshire’s citizens, businesses and communitiesmore successful and its natural resources healthy and productive. For 100 years, Extensionspecialists and its network of dedicated volunteers have been tailoring contemporary,practical education to regional needs, helping to create a well-informed citizenry,to strengthen the economy and to support our first-in-the-nation quality of life.
The Extension’s statewide outreach programs and experts meet Granite Staters where they are by using effective technologies, online learning platforms and face-to-face interactionsthat match the ways people learn and engage, while continuing to provide customized,in-person programming and assistance.
20 I University System of New Hampshire
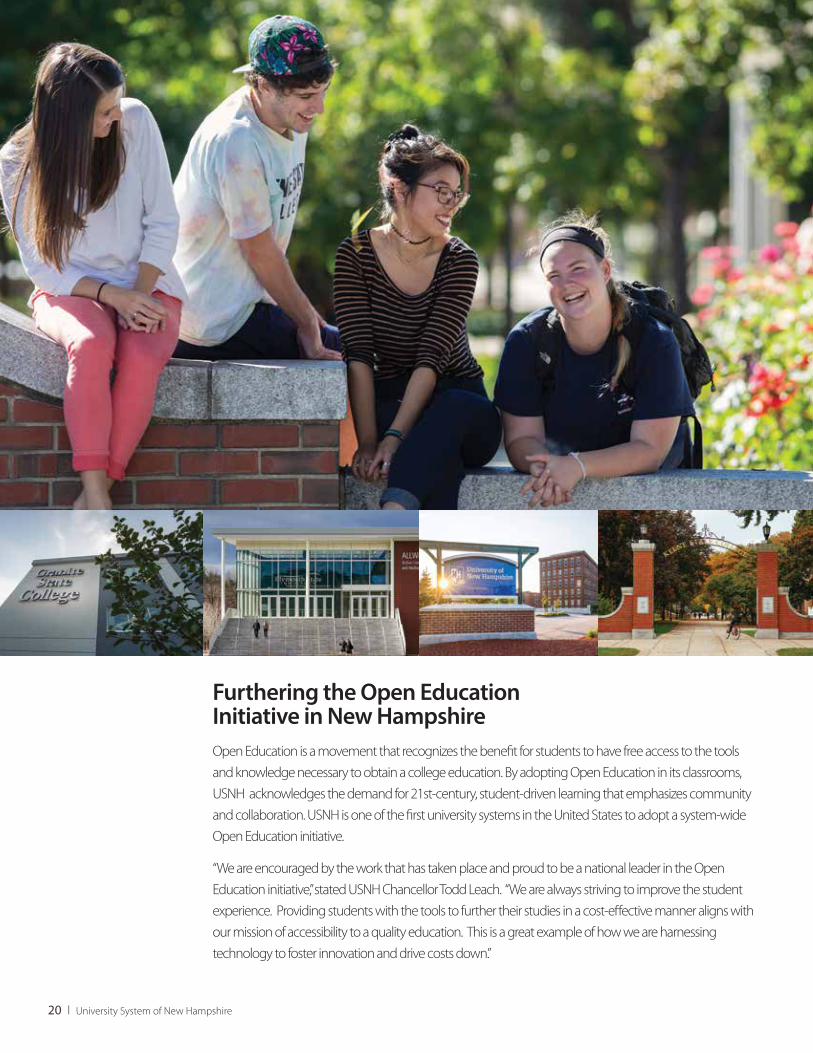
Furthering the Open Education Initiative in New HampshireOpen Education is a movement that recognizes the benefit for students to have free access to the tools and knowledge necessary to obtain a college education. By adopting Open Education in its classrooms, USNH acknowledges the demand for 21st-century, student-driven learning that emphasizes community and collaboration. USNH is one of the first university systems in the United States to adopt a system-wide Open Education initiative. “We are encouraged by the work that has taken place and proud to be a national leader in the Open Education initiative,” stated USNH Chancellor Todd Leach. “We are always striving to improve the student experience. Providing students with the tools to further their studies in a cost-effective manner aligns with our mission of accessibility to a quality education. This is a great example of how we are harnessing technology to foster innovation and drive costs down.”
Within the next academic year, academic leaders will initiate Open Education projects within their class-

Portsmouth, UNH Team Up with Local EmployersSeacoast area businesses learned how they can hire a UNH student or graduate in early summer 2018 when the City of Portsmouth’s economic development office hosted a “How to Hire a Wildcat” workshop with the UNH Cooperative Extension and UNH Career and Professional Success (CaPS).
The event was developed in response to an Extension survey of 71 Portsmouth businesses, which outlined the challenges local employers face in finding qualified, well-trained employees.
UNH School of Law 5th in U.S. for Jobs on the Open MarketThe UNH School of Law ranked No. 1 among the 14 law schools in New England for employment on the open market (excluding law school funded jobs) – and No. 5 in the U.S. –with 95 percent of the 2017 JD class employed within 10 months of graduation. UNH Law was also No. 2 in New England in graduates employed in bar-passage-required jobs at 85.2 percent, while 91.8 percent obtained jobs that required bar passage or a law degree. UNH Law’s strong employment outcomes were bolstered by an impressive bar passage rate in 2017, as graduates achieved a first-time bar-passage rate of 93.3 percent, 15th among law schools nationwide.
First-Year Seminar, “Wicked Problems” The current generation is facing some large, seemingly intractable problems: world hunger, gender inequity, technology’s increasing influence, inequities in education and more. Daunting issues, but also precisely the kind that lend themselves to Plymouth State University’s cross-disciplinary Integrated Clusters approach, which is why PSU students are tackling these “Wicked Problems” —and many more—in their First-Year Seminars. Each of this year’s approximately 1,200 first-year students chose one of 35 Wicked Problems to work on. They then partnered with peers from other majors, and with faculty, regional partners, businesses and nonprofit organizations, gaining real-world, résumé-boosting experience.
University System of New Hampshire I 21
Business
22 I University System of New Hampshire
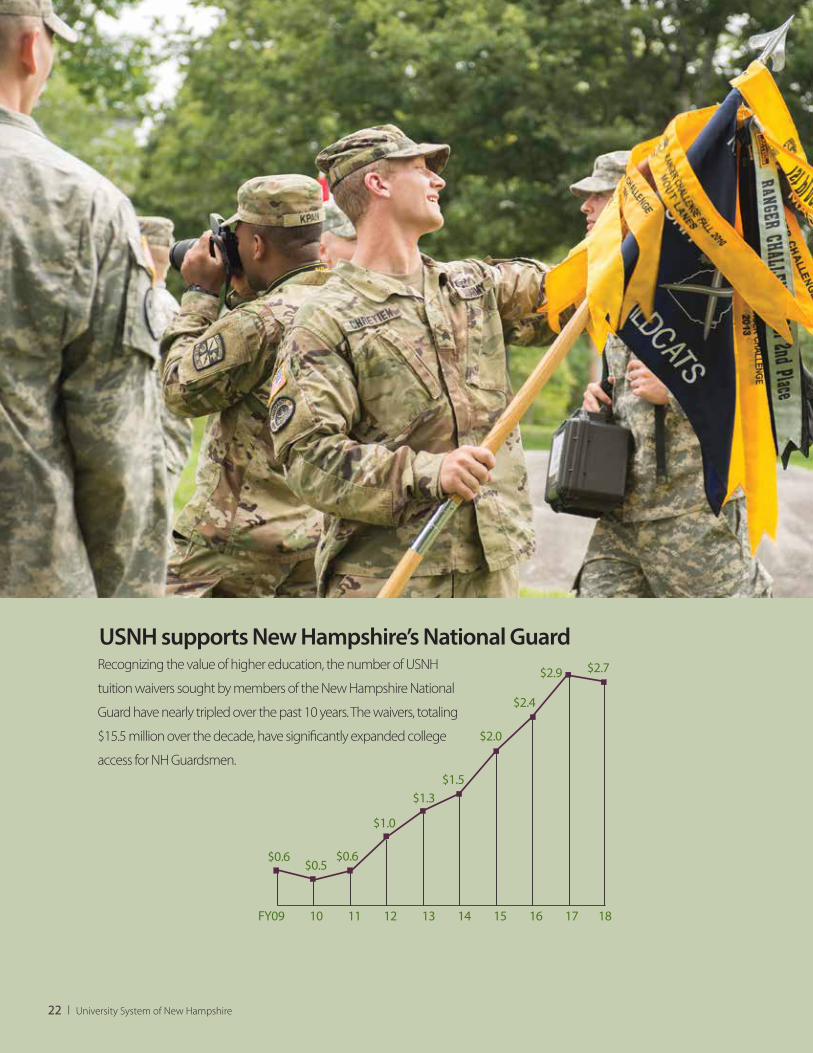
Recognizing the value of higher education, the number of USNH
tuition waivers sought by members of the New Hampshire National
Guard have nearly tripled over the past 10 years. The waivers, totaling
$15.5 million over the decade, have significantly expanded college
access for NH Guardsmen.
USNH supports New Hampshire’s National Guard
FY09 10 11 12 13 14 15 16 17 18
$0.6$0.5
$0.6
$1.0
$1.3$1.5
$2.0
$2.4
$2.9 $2.7
University System of New Hampshire I 23
Independent Auditors’ Report
The Governor andLegislative Fiscal CommitteeState of New Hampshire; and
The Board of Trustees University System of New Hampshire:
Report on the Financial Statements We have audited the accompanying statements of net position of the University System of New Hampshire (the System), a component unit of the State of New Hampshire, as of and for the years ended June 30, 2018 and 2017, the related statements of revenues, expenses and changes in net position and cash flows for the years then ended, and the related notes to the financial statements, which collectively comprise the System’s basic financial statements for the years then ended.
Management’s Responsibility for the Financial StatementsManagement is responsible for the preparation and fair presentation of these financial statements in accordance with U.S. generally accepted accounting principles; this includes the design, implementation, and maintenance of internal control relevant to the preparation and fair presentation of financial statements that are free from material misstatement, whether due to fraud or error.
Auditors’ ResponsibilityOur responsibility is to express an opinion on these financial statements based on our audits. We conducted our audits in accordance with auditing standards generally accepted in the United States of America. Those standards require that we plan and perform the audit to obtain reasonable assurance about whether the financial statements are free from material misstatement.
An audit involves performing procedures to obtain audit evidence about the amounts and disclosures in the financial statements. The procedures selected depend on the auditors’ judgment, including the assessment of the risks of material misstatement of the financial statements, whether due to fraud or error. In making those risk assessments, the auditor considers internal control relevant to the entity’s preparation and fair presentation of the financial statements in order to design audit procedures that are appropriate in the circumstances, but not for the purpose of expressing an opinion on the effectiveness of the entity’s internal control. Accordingly, we express no such opinion. An audit also includes evaluating the appropriateness of accounting policies used and the reasonableness of significant accounting estimates made by management, as well as evaluating the overall presentation of the financial statements.
We believe that the audit evidence we have obtained is sufficient and appropriate to provide a basis for our audit opinion.
Opinion In our opinion, the financial statements referred to above present fairly, in all material respects, the net position of the University System of New Hampshire as of June 30, 2018 and 2017, and the changes in its net position and its cash flows for the years then ended in accordance with U.S. generally accepted accounting principles.
KPMG LLP is a Delaware limited liability partnership and the U.S. member firm of the KPMG network of independent member firms affiliated with KPMG International Cooperative (“KPMG International”), a Swiss entity.
KPMG LLPTwo Financial Center60 South StreetBoston, MA 02111
USNH supports New Hampshire’s National Guard
24 I University System of New Hampshire
2
Emphasis of Matter
As discussed in Note 1 to the financial statements, in 2018 the System adopted Governmental Accounting Standards Board Statement No. 75, Accounting and Financial Reporting for Postemployment Benefits Other Than Pensions. Our opinion is not modified with respect to this matter.
Other Matter - Required Supplementary Information
U.S. generally accepted accounting principles require that the management’s discussion and analysis onpages 25 - 33 and the required supplemental information on page 50 be presented to supplement the basic financial statements. Such information, although not a part of the basic financial statements, is required by the Governmental Accounting Standards Board who considers it to be an essential part of financial reporting for placing the basic financial statements in an appropriate operational, economic, or historical context. We have applied certain limited procedures to the required supplementary information in accordance with auditing standards generally accepted in the United States of America, which consisted of inquiries of management about the methods of preparing the information and comparing the information for consistency with management’s responses to our inquiries, the basic financial statements, and other knowledge we obtained during our audits of the basic financial statements. We do not express an opinion or provide any assurance on the information because the limited procedures do not provide us with sufficient evidence to express an opinion or provide any assurance.
October 26, 2018
Management’s Discussion and AnalysisJune 30, 2018 and 2017 (Unaudited)
I. IntroductionThe following Management’s Discussion and Analysis summarizes the financial condition and results of activities of the University System of New Hampshire (USNH) for the fiscal years ended June 30, 2018 and 2017. This analysis provides a comparison of significant amounts and measures to prior periods and, where appropriate, presents management’s outlook for the future.
USNH is a Section 501(c)(3) corporation organized under the laws of the State of New Hampshire to serve the people of the state as the key provider of public higher education for Bachelor’s and advanced degree students. USNH accomplishes its mission by operating four educational institutions that collectively offer a broad array of education, research and public service options for the state. These institutions include the University of New Hampshire (UNH), Plymouth State University (PSU), Keene State College (KSC) and Granite State College (GSC). While select programs are active in other regions as well as abroad, most of USNH’s activities take place at the three residential campuses (UNHD, PSU and KSC), UNH’s urban campuses (UNHM and UNHL), the six regional sites of GSC, and the UNH Cooperative Extension and Small Business Development Centers located throughout the state. The accompanying financial statements also include the activities and balances of the University of New Hampshire Foundation, Inc. (UNHF) and the Keene Endowment Association (KEA), two legally separate but affiliated entities. (See Note 1 to the Financial Statements for additional information on affiliated entities.)
II. Economic OutlookThe US Census Bureau projects that through 2030 the number of New Hampshire residents between ages 15 and 19 will drop 6.6% (approximately 5,600 students) from the current level of 85,385. The dip will then be partially recovered over the following ten years to approximately 83,300 in 2040. This is one near-term trend impacting USNH campuses. However, it is mitigated by other trends including increased demand for fifth year programs culminating in graduate degrees, as well as local industry needs for higher education levels of new hires. At 2.7% as of July 2018, New Hampshire has the fourth lowest unemployment rate in the country behind only Hawaii, Iowa and North Dakota. This compares to the national average of 4.0%, and will ease the pathway for our graduates as they transition into the state’s workforce. Over the past year USNH institutions have increased partnerships with the State and businesses to offer and expand programs in areas of expected economic growth including nursing and associated medical needs, as well as robotics and other new technologies. In short, our campuses continue to evolve to meet local and national demands for quality education. The remainder of this report describes the results of financial operations for the year ended June 30, 2018 with comparisons to prior years.
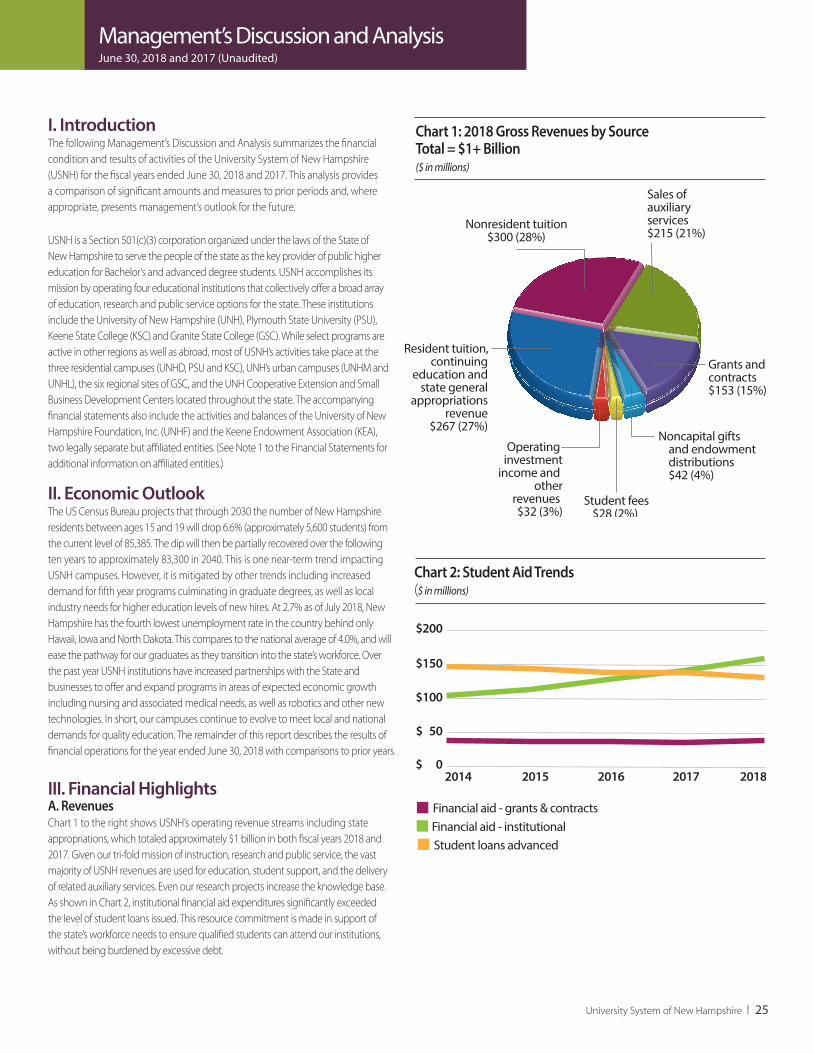
III. Financial HighlightsA. RevenuesChart 1 to the right shows USNH’s operating revenue streams including state appropriations, which totaled approximately $1 billion in both fiscal years 2018 and 2017. Given our tri-fold mission of instruction, research and public service, the vast majority of USNH revenues are used for education, student support, and the delivery of related auxiliary services. Even our research projects increase the knowledge base. As shown in Chart 2, institutional financial aid expenditures significantly exceeded the level of student loans issued. This resource commitment is made in support of the state’s workforce needs to ensure qualified students can attend our institutions, without being burdened by excessive debt.
Sales of auxiliaryservices $215 (21%)
Grants andcontracts $153 (15%)
Resident tuition, continuing
education and state general
appropriations revenue
$267 (27%)
Nonresident tuition$300 (28%)
Noncapital gifts and endowment distributions $42 (4%)
Student fees$28 (2%)
Operating investment
income and other
revenues $32 (3%)
Chart 1: 2018 Gross Revenues by SourceTotal = $1+ Billion($ in millions)
$ 0
$ 50
$100
$150
$200
2014 2015 2016 2017 2018
Financial aid - grants & contractsFinancial aid - institutionalStudent loans advanced
Chart 2: Student Aid Trends ($ in millions)
University System of New Hampshire I 25
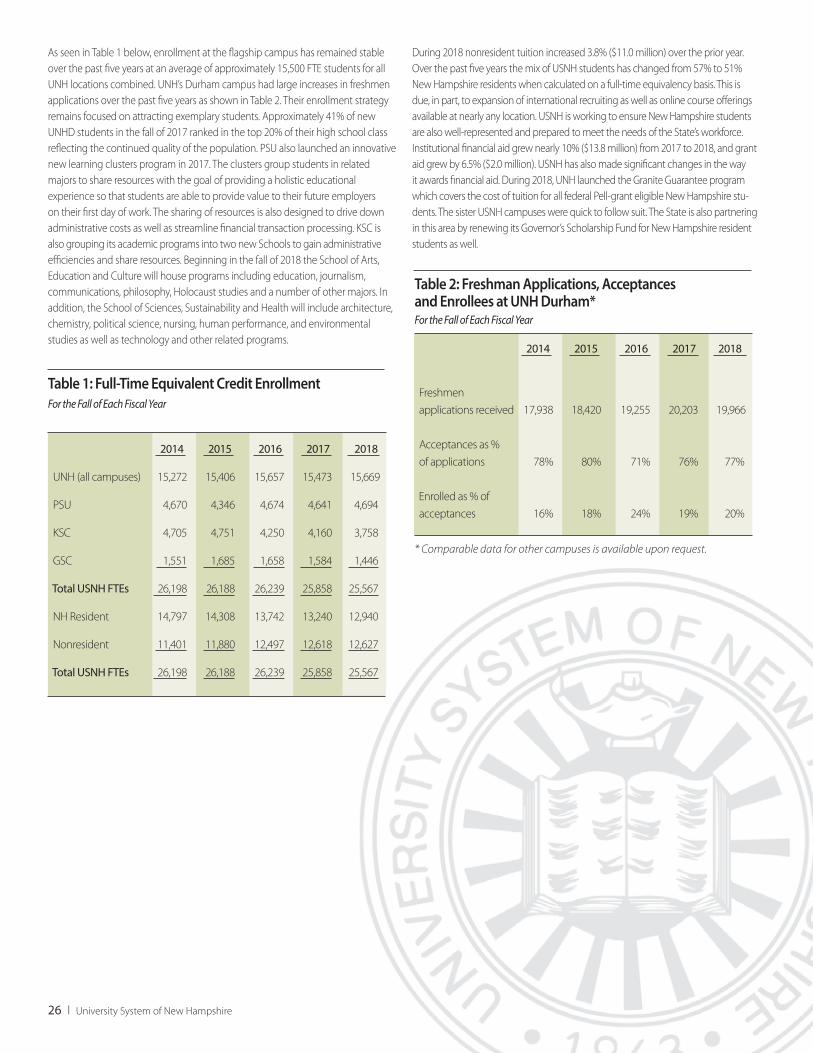
As seen in Table 1 below, enrollment at the flagship campus has remained stable over the past five years at an average of approximately 15,500 FTE students for all UNH locations combined. UNH’s Durham campus had large increases in freshmen applications over the past five years as shown in Table 2. Their enrollment strategy remains focused on attracting exemplary students. Approximately 41% of new UNHD students in the fall of 2017 ranked in the top 20% of their high school class reflecting the continued quality of the population. PSU also launched an innovative new learning clusters program in 2017. The clusters group students in related majors to share resources with the goal of providing a holistic educational experience so that students are able to provide value to their future employers on their first day of work. The sharing of resources is also designed to drive down administrative costs as well as streamline financial transaction processing. KSC is also grouping its academic programs into two new Schools to gain administrative efficiencies and share resources. Beginning in the fall of 2018 the School of Arts, Education and Culture will house programs including education, journalism, communications, philosophy, Holocaust studies and a number of other majors. In addition, the School of Sciences, Sustainability and Health will include architecture, chemistry, political science, nursing, human performance, and environmental studies as well as technology and other related programs.
During 2018 nonresident tuition increased 3.8% ($11.0 million) over the prior year. Over the past five years the mix of USNH students has changed from 57% to 51% New Hampshire residents when calculated on a full-time equivalency basis. This is due, in part, to expansion of international recruiting as well as online course offerings available at nearly any location. USNH is working to ensure New Hampshire students are also well-represented and prepared to meet the needs of the State’s workforce. Institutional financial aid grew nearly 10% ($13.8 million) from 2017 to 2018, and grant aid grew by 6.5% ($2.0 million). USNH has also made significant changes in the way it awards financial aid. During 2018, UNH launched the Granite Guarantee program which covers the cost of tuition for all federal Pell-grant eligible New Hampshire stu-dents. The sister USNH campuses were quick to follow suit. The State is also partnering in this area by renewing its Governor’s Scholarship Fund for New Hampshire resident students as well.
2014 2015 2016 2017 2018
UNH (all campuses) 15,272 15,406 15,657 15,473 15,669
PSU 4,670 4,346 4,674 4,641 4,694
KSC 4,705 4,751 4,250 4,160 3,758
GSC 1,551 1,685 1,658 1,584 1,446
Total USNH FTEs 26,198 26,188 26,239 25,858 25,567
NH Resident 14,797 14,308 13,742 13,240 12,940
Nonresident 11,401 11,880 12,497 12,618 12,627
Total USNH FTEs 26,198 26,188 26,239 25,858 25,567
2014 2015 2016 2017 2018
Freshmen applications received 17,938 18,420 19,255 20,203 19,966
Acceptances as % of applications 78% 80% 71% 76% 77%
Enrolled as % of acceptances 16% 18% 24% 19% 20%
* Comparable data for other campuses is available upon request.
Table 2: Freshman Applications, Acceptances and Enrollees at UNH Durham* For the Fall of Each Fiscal Year
Table 1: Full-Time Equivalent Credit Enrollment
For the Fall of Each Fiscal Year
26 I University System of New Hampshire
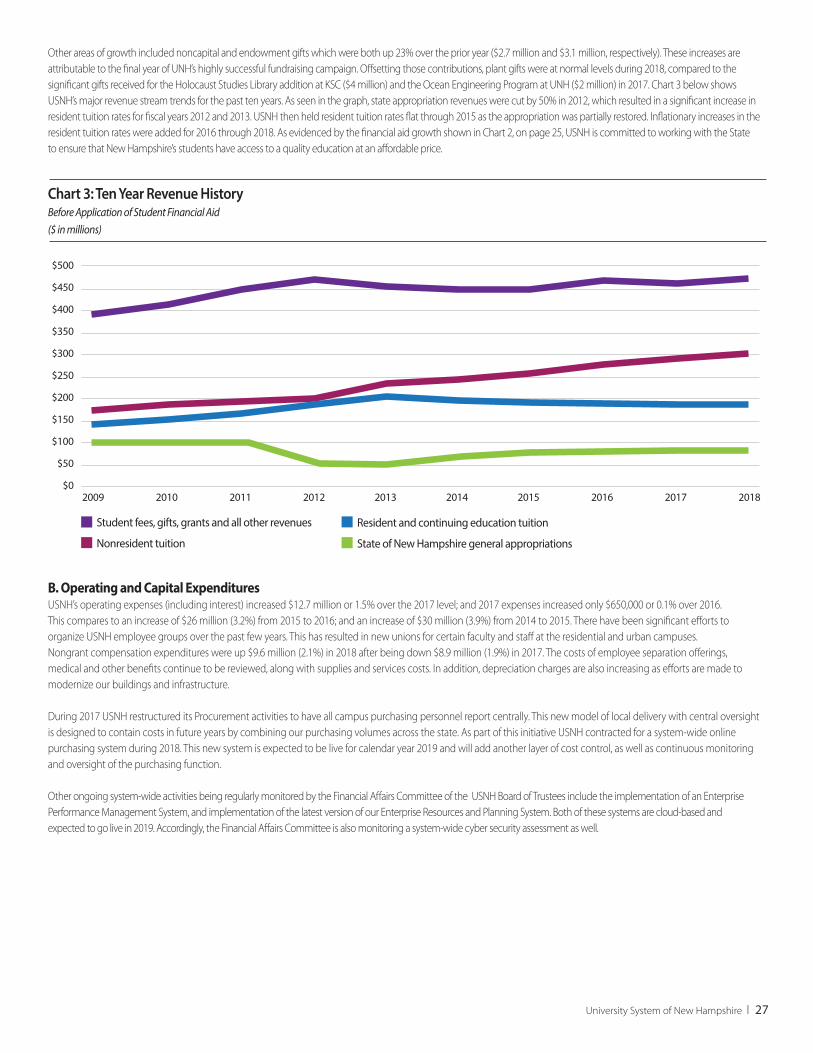
Other areas of growth included noncapital and endowment gifts which were both up 23% over the prior year ($2.7 million and $3.1 million, respectively). These increases are attributable to the final year of UNH’s highly successful fundraising campaign. Offsetting those contributions, plant gifts were at normal levels during 2018, compared to the significant gifts received for the Holocaust Studies Library addition at KSC ($4 million) and the Ocean Engineering Program at UNH ($2 million) in 2017. Chart 3 below shows USNH’s major revenue stream trends for the past ten years. As seen in the graph, state appropriation revenues were cut by 50% in 2012, which resulted in a significant increase in resident tuition rates for fiscal years 2012 and 2013. USNH then held resident tuition rates flat through 2015 as the appropriation was partially restored. Inflationary increases in the resident tuition rates were added for 2016 through 2018. As evidenced by the financial aid growth shown in Chart 2, on page 25, USNH is committed to working with the State to ensure that New Hampshire’s students have access to a quality education at an affordable price.
Chart 3: Ten Year Revenue History Before Application of Student Financial Aid ($ in millions)
B. Operating and Capital Expenditures USNH’s operating expenses (including interest) increased $12.7 million or 1.5% over the 2017 level; and 2017 expenses increased only $650,000 or 0.1% over 2016. This compares to an increase of $26 million (3.2%) from 2015 to 2016; and an increase of $30 million (3.9%) from 2014 to 2015. There have been significant efforts to organize USNH employee groups over the past few years. This has resulted in new unions for certain faculty and staff at the residential and urban campuses. Nongrant compensation expenditures were up $9.6 million (2.1%) in 2018 after being down $8.9 million (1.9%) in 2017. The costs of employee separation offerings, medical and other benefits continue to be reviewed, along with supplies and services costs. In addition, depreciation charges are also increasing as efforts are made to modernize our buildings and infrastructure.
During 2017 USNH restructured its Procurement activities to have all campus purchasing personnel report centrally. This new model of local delivery with central oversight is designed to contain costs in future years by combining our purchasing volumes across the state. As part of this initiative USNH contracted for a system-wide online purchasing system during 2018. This new system is expected to be live for calendar year 2019 and will add another layer of cost control, as well as continuous monitoring and oversight of the purchasing function.
Other ongoing system-wide activities being regularly monitored by the Financial Affairs Committee of the USNH Board of Trustees include the implementation of an Enterprise Performance Management System, and implementation of the latest version of our Enterprise Resources and Planning System. Both of these systems are cloud-based and expected to go live in 2019. Accordingly, the Financial Affairs Committee is also monitoring a system-wide cyber security assessment as well.
2009 2010 2011 2012 2013 2014 2015 2016 2017 2018
$500
$450
$400
$350
$300
$250
$200
$150
$100
$50
$0
Student fees, gifts, grants and all other revenues
Nonresident tuition
Resident and continuing education tuition
State of New Hampshire general appropriations
University System of New Hampshire I 27
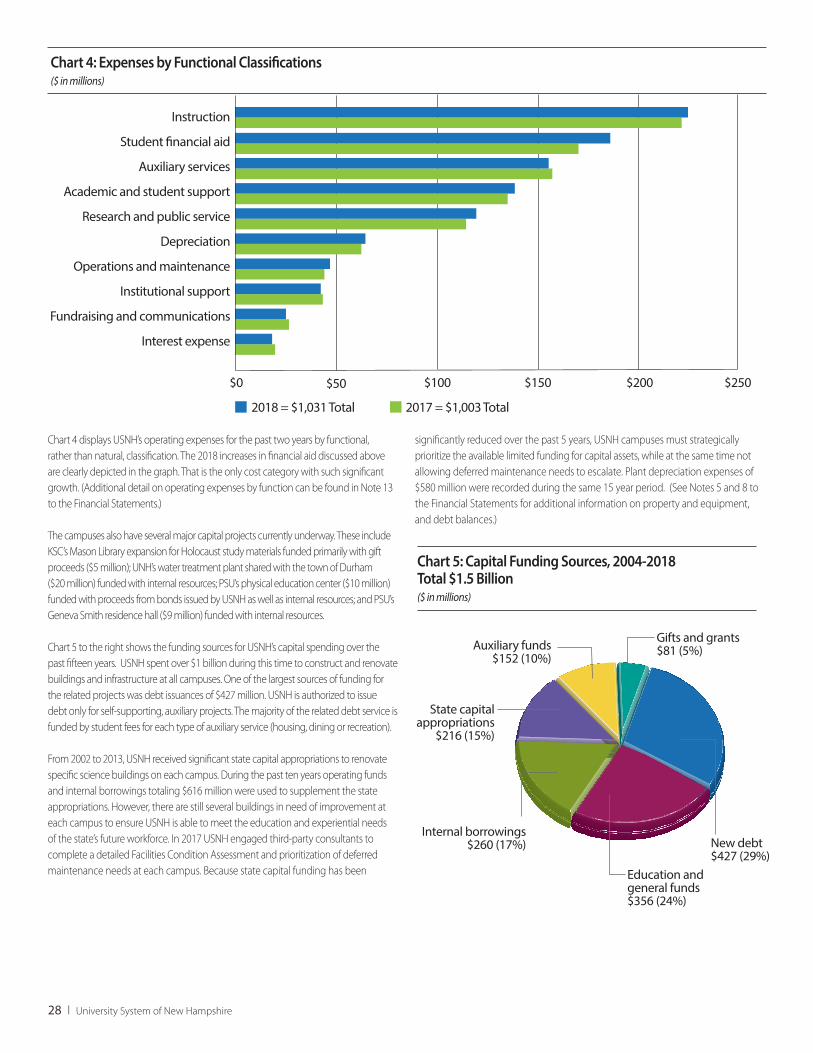
Chart 4 displays USNH’s operating expenses for the past two years by functional, rather than natural, classification. The 2018 increases in financial aid discussed above are clearly depicted in the graph. That is the only cost category with such significant growth. (Additional detail on operating expenses by function can be found in Note 13 to the Financial Statements.)
The campuses also have several major capital projects currently underway. These include KSC’s Mason Library expansion for Holocaust study materials funded primarily with gift proceeds ($5 million); UNH’s water treatment plant shared with the town of Durham ($20 million) funded with internal resources; PSU’s physical education center ($10 million) funded with proceeds from bonds issued by USNH as well as internal resources; and PSU’s Geneva Smith residence hall ($9 million) funded with internal resources.
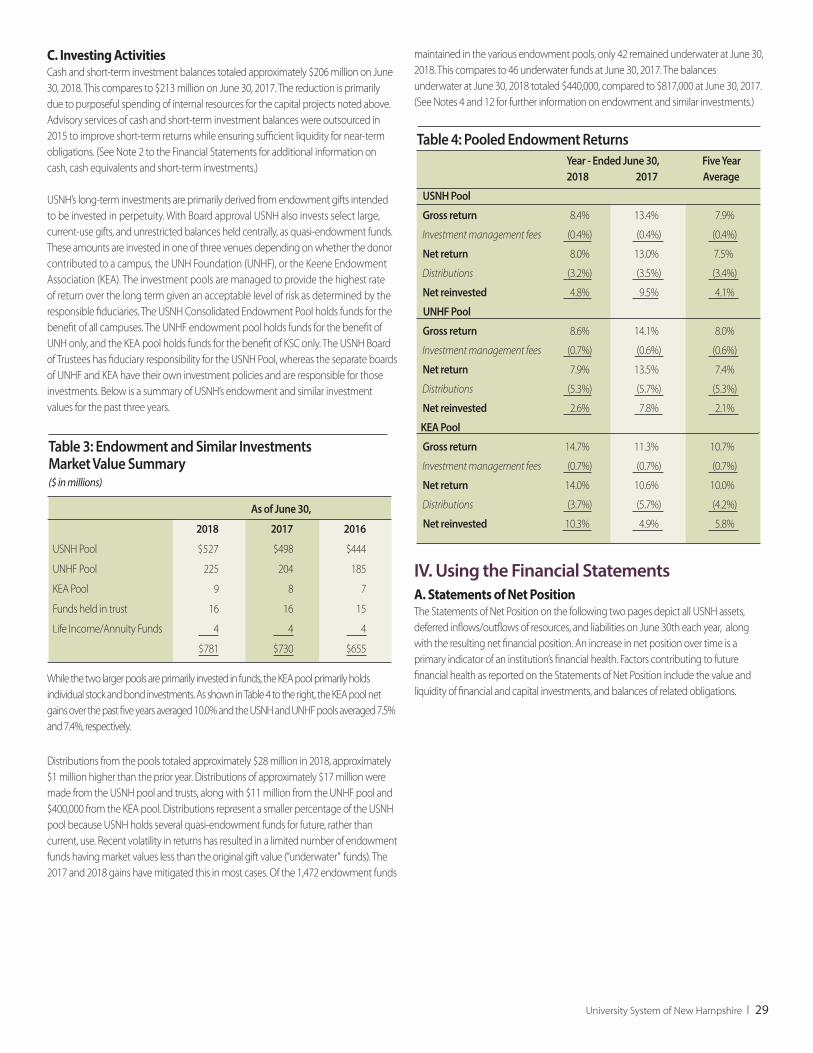
Chart 5 to the right shows the funding sources for USNH’s capital spending over the past fifteen years. USNH spent over $1 billion during this time to construct and renovate buildings and infrastructure at all campuses. One of the largest sources of funding for the related projects was debt issuances of $427 million. USNH is authorized to issue debt only for self-supporting, auxiliary projects. The majority of the related debt service is funded by student fees for each type of auxiliary service (housing, dining or recreation).
From 2002 to 2013, USNH received significant state capital appropriations to renovate specific science buildings on each campus. During the past ten years operating funds and internal borrowings totaling $616 million were used to supplement the state appropriations. However, there are still several buildings in need of improvement at each campus to ensure USNH is able to meet the education and experiential needs of the state’s future workforce. In 2017 USNH engaged third-party consultants to complete a detailed Facilities Condition Assessment and prioritization of deferred maintenance needs at each campus. Because state capital funding has been
significantly reduced over the past 5 years, USNH campuses must strategically prioritize the available limited funding for capital assets, while at the same time not allowing deferred maintenance needs to escalate. Plant depreciation expenses of $580 million were recorded during the same 15 year period. (See Notes 5 and 8 to the Financial Statements for additional information on property and equipment, and debt balances.)
Chart 4: Expenses by Functional Classication($ in millions)
$0 $50 $100 $150 $200 $250
Instruction
Student �nancial aid
Auxiliary services
Academic and student support
Research and public service
Depreciation
Operations and maintenance
Institutional support
Fundraising and communications
Interest expense
2018 = $1,031 Total 2017 = $1,003 Total
Chart 4: Expenses by Functional Classifications ($ in millions)
Chart 5: Capital Funding Sources, 2004-2018Total $1.5 Billion ($ in millions)
Auxiliary funds$152 (10%)
New debt $427 (29%)
Internal borrowings$260 (17%)
State capitalappropriations
$216 (15%)
Education andgeneral funds$356 (24%)
Gifts and grants$81 (5%)
28 I University System of New Hampshire
C. Investing Activities Cash and short-term investment balances totaled approximately $206 million on June 30, 2018. This compares to $213 million on June 30, 2017. The reduction is primarily due to purposeful spending of internal resources for the capital projects noted above. Advisory services of cash and short-term investment balances were outsourced in 2015 to improve short-term returns while ensuring sufficient liquidity for near-term obligations. (See Note 2 to the Financial Statements for additional information on cash, cash equivalents and short-term investments.)
USNH’s long-term investments are primarily derived from endowment gifts intended to be invested in perpetuity. With Board approval USNH also invests select large, current-use gifts, and unrestricted balances held centrally, as quasi-endowment funds. These amounts are invested in one of three venues depending on whether the donor contributed to a campus, the UNH Foundation (UNHF), or the Keene Endowment Association (KEA). The investment pools are managed to provide the highest rate of return over the long term given an acceptable level of risk as determined by the responsible fiduciaries. The USNH Consolidated Endowment Pool holds funds for the benefit of all campuses. The UNHF endowment pool holds funds for the benefit of UNH only, and the KEA pool holds funds for the benefit of KSC only. The USNH Board of Trustees has fiduciary responsibility for the USNH Pool, whereas the separate boards of UNHF and KEA have their own investment policies and are responsible for those investments. Below is a summary of USNH’s endowment and similar investment values for the past three years.
While the two larger pools are primarily invested in funds, the KEA pool primarily holds individual stock and bond investments. As shown in Table 4 to the right, the KEA pool net gains over the past five years averaged 10.0% and the USNH and UNHF pools averaged 7.5% and 7.4%, respectively.
Distributions from the pools totaled approximately $28 million in 2018, approximately $1 million higher than the prior year. Distributions of approximately $17 million were made from the USNH pool and trusts, along with $11 million from the UNHF pool and $400,000 from the KEA pool. Distributions represent a smaller percentage of the USNH pool because USNH holds several quasi-endowment funds for future, rather than current, use. Recent volatility in returns has resulted in a limited number of endowment funds having market values less than the original gift value (“underwater” funds). The 2017 and 2018 gains have mitigated this in most cases. Of the 1,472 endowment funds
maintained in the various endowment pools, only 42 remained underwater at June 30, 2018. This compares to 46 underwater funds at June 30, 2017. The balances underwater at June 30, 2018 totaled $440,000, compared to $817,000 at June 30, 2017. (See Notes 4 and 12 for further information on endowment and similar investments.)
IV. Using the Financial Statements A. Statements of Net PositionThe Statements of Net Position on the following two pages depict all USNH assets, deferred inflows/outflows of resources, and liabilities on June 30th each year, along with the resulting net financial position. An increase in net position over time is a primary indicator of an institution’s financial health. Factors contributing to future financial health as reported on the Statements of Net Position include the value and liquidity of financial and capital investments, and balances of related obligations.
Chart 5: Capital Funding Sources, 2004-2018Total $1.5 Billion ($ in millions)
Table 3: Endowment and Similar InvestmentsMarket Value Summary ($ in millions)
As of June 30,
2018 2017 2016
USNH Pool $527 $498 $444
UNHF Pool 225 204 185
KEA Pool 9 8 7
Funds held in trust 16 16 15
Life Income/Annuity Funds 4 4 4
$781 $730 $655
Table 4: Pooled Endowment Returns Year - Ended June 30, Five Year 2018 2017 Average
USNH Pool
Gross return 8.4% 13.4% 7.9%
Investment management fees (0.4%) (0.4%) (0.4%)
Net return 8.0% 13.0% 7.5%
Distributions (3.2%) (3.5%) (3.4%)
Net reinvested 4.8% 9.5% 4.1%
UNHF Pool
Gross return 8.6% 14.1% 8.0%
Investment management fees (0.7%) (0.6%) (0.6%)
Net return 7.9% 13.5% 7.4%
Distributions (5.3%) (5.7%) (5.3%)
Net reinvested 2.6% 7.8% 2.1%
KEA Pool
Gross return 14.7% 11.3% 10.7%
Investment management fees (0.7%) (0.7%) (0.7%)
Net return 14.0% 10.6% 10.0%
Distributions (3.7%) (5.7%) (4.2%)
Net reinvested 10.3% 4.9% 5.8%
University System of New Hampshire I 29
Table 5: Condensed Information from the Statements of Net Position as of June 30, ($ in millions)
2014 2015 2016 2017 2018*
Cash and short-term investments $ 235 $ 237 $ 228 $ 213 $ 206 Endowment and similar investments 667 679 655 730 781Property and equipment, net 982 1,010 1,077 1,120 1,122Other assets and deferred outflows of resources 96 168 162 106 95 Total Assets and Deferred Outflows of Resources 1,980 2,094 2,122 2,169 2,204
Derivative instruments - interest rate swaps 30 30 37 26 18Postretirement medical benefits 51 54 56 56 90Long-term debt 431 500 519 501 488Other liabilities and deferred inflows of resources 150 160 169 152 160 Total Liabilities and Deferred Inflows of Resources 662 744 781 735 756
Net investment in capital assets 574 598 630 651 665Restricted financial resources 397 413 405 454 481Unrestricted financial resources 347 339 306 329 302 Total Net Position $1,318 $1,350 $1,341 $1,434 $1,448
*Beginning net position restated to reflect the adoption of GASB 75 related to postretirement medical obligations.
As shown above, cash and short-term investment balances have decreased over the past four years. The spending also increased the value of the related property assets. In 2017 endowment returns rebounded after net losses in the prior two years. The 2018 endowment gains were more moderate. This increased the restricted net position, as well as the investment asset balances. The other assets balances above include investments of $69 million, $57 million, $11 million and $4 million, held by our bond trustee related to our Series 2015 and 2016 bond issuances for 2015 through 2018, respectively. In 2017 USNH also transferred assets related to our Operating Staff Retirement Program into a trust, and applied the provisions of GASB Statement No. 68, Accounting and Financial Reporting for Pensions. The actuarial reviews completed for the plan in 2017 and 2018 resulted in the recording of a net pension asset of approximately $1 million, which is also included in other assets. Accordingly, no related pension liabilities are recorded for the plan beginning in 2017.
Deferred inflows and outflows of resources include changes in the fair value of USNH’s interest rate swap derivatives, as well as accounting gains and losses incurred when refinancing certain bonds outstanding. Because the interest-rate swaps are deemed to be effective hedge instruments, the fair value of the derivatives is recorded to offset the fair value of the interest rate swap liability in its entirety. The accounting gains and losses on debt refinancing are amortized and charged to interest expense annually over the term of the new obligations. The impacts of changes in actuarial assumptions, differences between projected and actual earnings, and benefit payments made after the measurement dates of USNH benefit plans are also included in deferred inflows and outflows beginning in 2017 and 2018 depending on the type of plan.
The reduction in other assets and deferred outflows of resources in 2018 is due to a $7 million reduction in the fair value of interest rate swap obligations, offset by an increase of $2 million in accounting losses on debt refinancing, and postretirement
medical plan benefit payments of $3 million which were made after the actuarial review measurement date in 2018. Approximately $11 million of bond proceeds was also unspent at June 30, 2017, then used in 2018 for the fall 2017 occupancy. (See Notes 8 and 9 to the Financial Statements for further discussion of outstanding debt and related interest rate swaps in place.)
In 2017 USNH adopted the provisions of GASB Statement No. 73, Accounting and Financial Reporting for Pensions and Related Assets That Are Not within the Scope of GASB Statement No. 68, with respect to the accounting for our Additional Retirement Contributions (ARC) plan. In 2018 USNH adopted the provisions of GASB Statement No. 75, Accounting and Financial Reporting for Postemployment Benefits Other than Pensions, for our postretirement medical obligations. The actuarial review complet-ed for the ARC plan in June 2017 resulted in the recording of deferred inflows for the related obligations of approximately $693,000 in 2017 and $629,000 in 2018. The actuarial review completed for the Postretirement Medical Plan in 2018 resulted in recording deferred outflows of approximately $3 million, as well as deferred inflows of approximately $6 million. The UNH Foundation also adopted the provisions of GASB Statement No.81, Irrevocable Split-Interest Agreements, which resulted in recording deferred inflows of approximately $1 million and $2 million in 2017 and 2018, respectively. USNH has large liabilities related to long-term debt and postretirement medical benefits. Bond and capital lease principal payments of approximately $16 million and $19 million reduced the related liabilities in 2017 and 2018, respectively. The postretirement obligations represent the actuarially-determined value of medical benefits provided to certain current and former employees for various periods, including the remaining life of the participants in some cases. (See Notes 7 and 8 to the Financial Statements for additional information in this regard.)
Table 5 below shows condensed information from the Statements of Net Position at June 30 for the past five years. Note that we have also included certain condensed information as of June 30, 2018 by campus herein as required by recent regional accreditation standard changes.
30 I University System of New Hampshire
B. Statements of Revenues, Expenses and Changes in Net Position Operating revenues are generally earned in exchange for providing goods and services. However, GASB reporting standards require that some of USNH’s recurring revenues be shown as nonoperating. This includes state general appropriations, federal Pell grants, noncapital gifts, operating investment income, and the portion of endowment returns used to fund the related programs. These revenue streams are important sources of funds used to supplement tuition and fees revenue. Accordingly, we have grouped the operating and nonoperating revenues together in the condensed statement below to allow readers to better understand which revenues support operating expense streams.
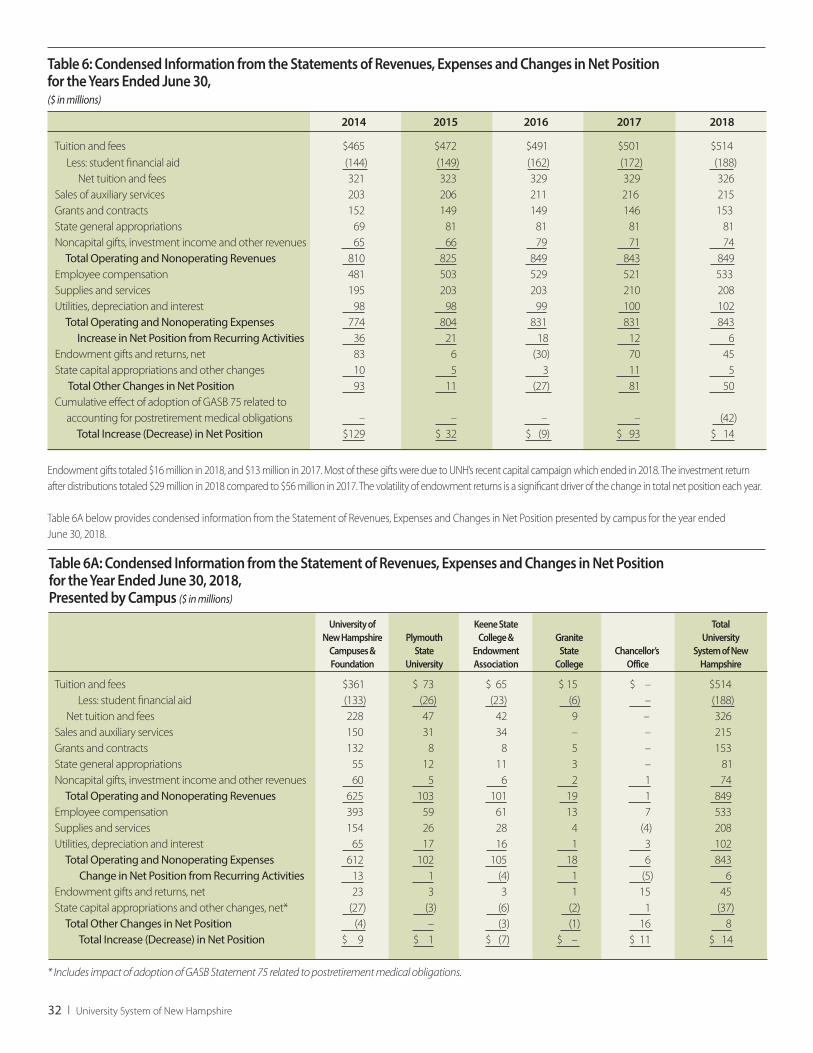
Table 6 shows condensed information from the Statements of Revenues, Expenses and Changes in Net Position for the five years ended June 30, 2018.
The net tuition and other revenue values on these statements reflect the size and type of student enrollments, financial need, and growth of supporting revenue streams. Total operating and nonoperating revenues were up $6 million in 2018, primarily due to increases in grant and noncapital gifts revenues. Expenses were up approximately $12 million in 2018, after being held flat in 2017. Compensation, utilities and depreciation cost increases were offset by a decrease in supplies and services costs.
The increase in net position from recurring activities reflects USNH’s operating margin each year. USNH’s margin for 2018 was half the level of 2017. This reflects the increased investment in institutional financial aid provided as discussed previously. USNH is implementing a cloud-based ERP upgrade and a new EPM system to help improve forecasting and control costs. The USNH Board of Trustees is monitoring these initiatives, particularly our move to more electronic procurement, as work continues to lower administrative cost structures.
Cash and short-term investments $ 251 $ 44 $ 58 $ 20 $(167) $ 206Endowment and similar investments 391 27 37 7 319 781Property and equipment, net 747 189 177 8 1 1,122Other assets and deferred outflows of resources (32) (8) (2) (1) 138 95 Total Assets and Deferred Outflows of Resources 1,357 252 270 34 291 2,204 Derivative instruments - interest rate swaps 18 18Postretirement medical benefits 70 12 12 2 (6) 90Long-term debt 197 104 103 – 84 488Other liabilities and deferred inflows of resources 84 14 7 2 53 160 Total Liabilities and Deferred Inflows of Resources 351 130 122 4 149 756
Net investment in capital assets 474 72 71 5 43 665Restricted financial resources 404 25 43 9 – 481Unrestricted financial resources 128 25 34 16 99 302 Total Net Position $1,006 $122 $148 $30 $142 $1,448
University ofNew Hampshire
Campuses &Foundation
Plymouth State
University
Keene StateCollege &
EndowmentAssociation
GraniteState
CollegeChancellor’s
Office
Total University
System of New Hampshire
Table 5A: Condensed Information from the Statement of Net Position as of June 30, 2018Presented by Campus($ in millions)
Beginning net position restated to reflect the impact of adoption of GASB 75 related to postretirement medical obligations.
Net position is reported in three categories. The net invested in capital assets amount represents the historical cost of property and equipment reduced by total accumulated depreciation and the balance of related debt outstanding for certain auxiliary buildings. Restricted financial resources include balances of current and prior year gifts for specified purposes such as scholarships or academic programs, as well as the majority of campus endowment balances which were requested to be invested in perpetuity by the original donors ($264 million and $270 million at June 30, 2017 and 2018, respectively). Unrestricted financial resources represent net assets that are available for any future use without restriction. (See Note 14 to the Financial Statements for further details on the components of net position.) A breakdown of asset, liability and net position balances by campus as of June 30, 2018 is shown below.
University System of New Hampshire I 31
2014 2015 2016 2017 2018
Tuition and fees $465 $472 $491 $501 $514 Less: student financial aid (144) (149) (162) (172) (188) Net tuition and fees 321 323 329 329 326Sales of auxiliary services 203 206 211 216 215Grants and contracts 152 149 149 146 153State general appropriations 69 81 81 81 81Noncapital gifts, investment income and other revenues 65 66 79 71 74 Total Operating and Nonoperating Revenues 810 825 849 843 849Employee compensation 481 503 529 521 533Supplies and services 195 203 203 210 208 Utilities, depreciation and interest 98 98 99 100 102 Total Operating and Nonoperating Expenses 774 804 831 831 843 Increase in Net Position from Recurring Activities 36 21 18 12 6Endowment gifts and returns, net 83 6 (30) 70 45State capital appropriations and other changes 10 5 3 11 5 Total Other Changes in Net Position 93 11 (27) 81 50Cumulative effect of adoption of GASB 75 related to accounting for postretirement medical obligations – – – – (42) Total Increase (Decrease) in Net Position $129 $ 32 $ (9) $ 93 $ 14
Table 6: Condensed Information from the Statements of Revenues, Expenses and Changes in Net Positionfor the Years Ended June 30,($ in millions)
Endowment gifts totaled $16 million in 2018, and $13 million in 2017. Most of these gifts were due to UNH’s recent capital campaign which ended in 2018. The investment return after distributions totaled $29 million in 2018 compared to $56 million in 2017. The volatility of endowment returns is a significant driver of the change in total net position each year.
Table 6A below provides condensed information from the Statement of Revenues, Expenses and Changes in Net Position presented by campus for the year ended June 30, 2018.
Tuition and fees $361 $ 73 $ 65 $ 15 $ – $514 Less: student financial aid (133) (26) (23) (6) – (188) Net tuition and fees 228 47 42 9 – 326Sales and auxiliary services 150 31 34 – – 215 Grants and contracts 132 8 8 5 – 153State general appropriations 55 12 11 3 – 81Noncapital gifts, investment income and other revenues 60 5 6 2 1 74 Total Operating and Nonoperating Revenues 625 103 101 19 1 849Employee compensation 393 59 61 13 7 533Supplies and services 154 26 28 4 (4) 208Utilities, depreciation and interest 65 17 16 1 3 102 Total Operating and Nonoperating Expenses 612 102 105 18 6 843 Change in Net Position from Recurring Activities 13 1 (4) 1 (5) 6Endowment gifts and returns, net 23 3 3 1 15 45State capital appropriations and other changes, net* (27) (3) (6) (2) 1 (37) Total Other Changes in Net Position (4) – (3) (1) 16 8 Total Increase (Decrease) in Net Position $ 9 $ 1 $ (7) $ – $ 11 $ 14
University ofNew Hampshire
Campuses &Foundation
PlymouthState
University
Keene StateCollege &
EndowmentAssociation
GraniteState
CollegeChancellor’s
Office
Total University
System of New Hampshire
Table 6A: Condensed Information from the Statement of Revenues, Expenses and Changes in Net Position for the Year Ended June 30, 2018, Presented by Campus ($ in millions)
* Includes impact of adoption of GASB Statement 75 related to postretirement medical obligations.
32 I University System of New Hampshire
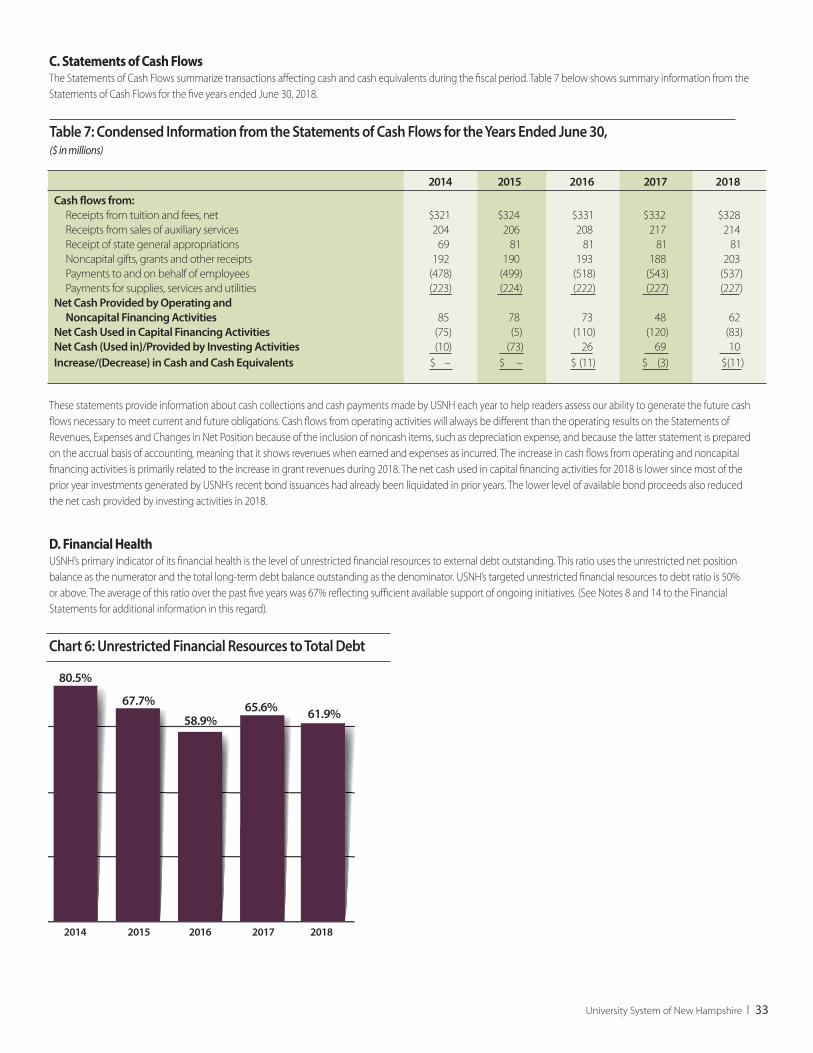
C. Statements of Cash Flows The Statements of Cash Flows summarize transactions affecting cash and cash equivalents during the fiscal period. Table 7 below shows summary information from the Statements of Cash Flows for the five years ended June 30, 2018.
These statements provide information about cash collections and cash payments made by USNH each year to help readers assess our ability to generate the future cash flows necessary to meet current and future obligations. Cash flows from operating activities will always be different than the operating results on the Statements of Revenues, Expenses and Changes in Net Position because of the inclusion of noncash items, such as depreciation expense, and because the latter statement is prepared on the accrual basis of accounting, meaning that it shows revenues when earned and expenses as incurred. The increase in cash flows from operating and noncapital financing activities is primarily related to the increase in grant revenues during 2018. The net cash used in capital financing activities for 2018 is lower since most of the prior year investments generated by USNH’s recent bond issuances had already been liquidated in prior years. The lower level of available bond proceeds also reduced the net cash provided by investing activities in 2018.
D. Financial Health USNH’s primary indicator of its financial health is the level of unrestricted financial resources to external debt outstanding. This ratio uses the unrestricted net position balance as the numerator and the total long-term debt balance outstanding as the denominator. USNH’s targeted unrestricted financial resources to debt ratio is 50% or above. The average of this ratio over the past five years was 67% reflecting sufficient available support of ongoing initiatives. (See Notes 8 and 14 to the Financial Statements for additional information in this regard).
Chart 6: Unrestricted Financial Resources to Total Debt
20182014 2015 2016 2017
61.9%
80.5%
67.7%
58.9%65.6%
2014 2015 2016 2017 2018
Cash flows from: Receipts from tuition and fees, net $321 $324 $331 $332 $328 Receipts from sales of auxiliary services 204 206 208 217 214 Receipt of state general appropriations 69 81 81 81 81 Noncapital gifts, grants and other receipts 192 190 193 188 203 Payments to and on behalf of employees (478) (499) (518) (543) (537) Payments for supplies, services and utilities (223) (224) (222) (227) (227)Net Cash Provided by Operating and Noncapital Financing Activities 85 78 73 48 62Net Cash Used in Capital Financing Activities (75) (5) (110) (120) (83)Net Cash (Used in)/Provided by Investing Activities (10) (73) 26 69 10Increase/(Decrease) in Cash and Cash Equivalents $ – $ – $ (11) $ (3) $(11)
Table 7: Condensed Information from the Statements of Cash Flows for the Years Ended June 30,($ in millions)
University System of New Hampshire I 33
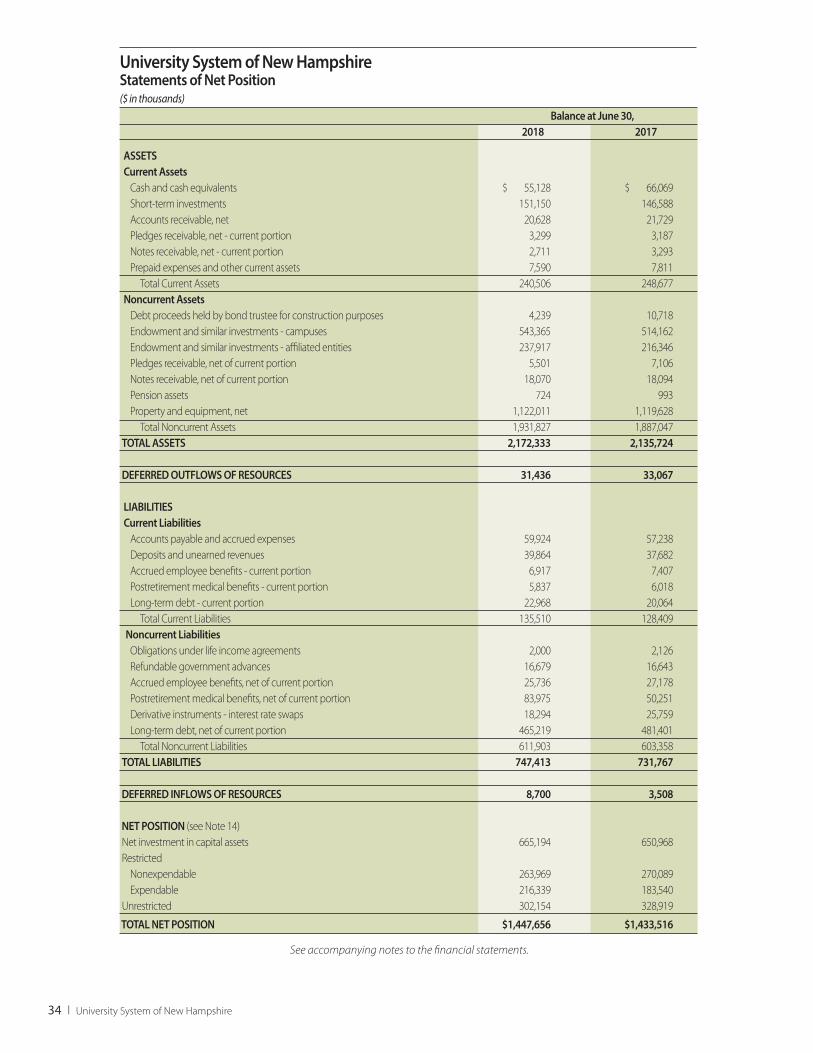
University System of New HampshireStatements of Net Position($ in thousands) Balance at June 30, 2018 2017
ASSETS Current Assets Cash and cash equivalents $ 55,128 $ 66,069 Short-term investments 151,150 146,588 Accounts receivable, net 20,628 21,729 Pledges receivable, net - current portion 3,299 3,187 Notes receivable, net - current portion 2,711 3,293 Prepaid expenses and other current assets 7,590 7,811 Total Current Assets 240,506 248,677 Noncurrent Assets Debt proceeds held by bond trustee for construction purposes 4,239 10,718 Endowment and similar investments - campuses 543,365 514,162 Endowment and similar investments - affiliated entities 237,917 216,346 Pledges receivable, net of current portion 5,501 7,106 Notes receivable, net of current portion 18,070 18,094 Pension assets 724 993 Property and equipment, net 1,122,011 1,119,628 Total Noncurrent Assets 1,931,827 1,887,047 TOTAL ASSETS 2,172,333 2,135,724
DEFERRED OUTFLOWS OF RESOURCES 31,436 33,067
LIABILITIES Current Liabilities Accounts payable and accrued expenses 59,924 57,238 Deposits and unearned revenues 39,864 37,682 Accrued employee benefits - current portion 6,917 7,407 Postretirement medical benefits - current portion 5,837 6,018 Long-term debt - current portion 22,968 20,064 Total Current Liabilities 135,510 128,409 Noncurrent Liabilities Obligations under life income agreements 2,000 2,126 Refundable government advances 16,679 16,643 Accrued employee benefits, net of current portion 25,736 27,178 Postretirement medical benefits, net of current portion 83,975 50,251 Derivative instruments - interest rate swaps 18,294 25,759 Long-term debt, net of current portion 465,219 481,401 Total Noncurrent Liabilities 611,903 603,358 TOTAL LIABILITIES 747,413 731,767
DEFERRED INFLOWS OF RESOURCES 8,700 3,508
NET POSITION (see Note 14) Net investment in capital assets 665,194 650,968 Restricted Nonexpendable 263,969 270,089 Expendable 216,339 183,540 Unrestricted 302,154 328,919
TOTAL NET POSITION $1,447,656 $1,433,516
See accompanying notes to the financial statements.
34 I University System of New Hampshire
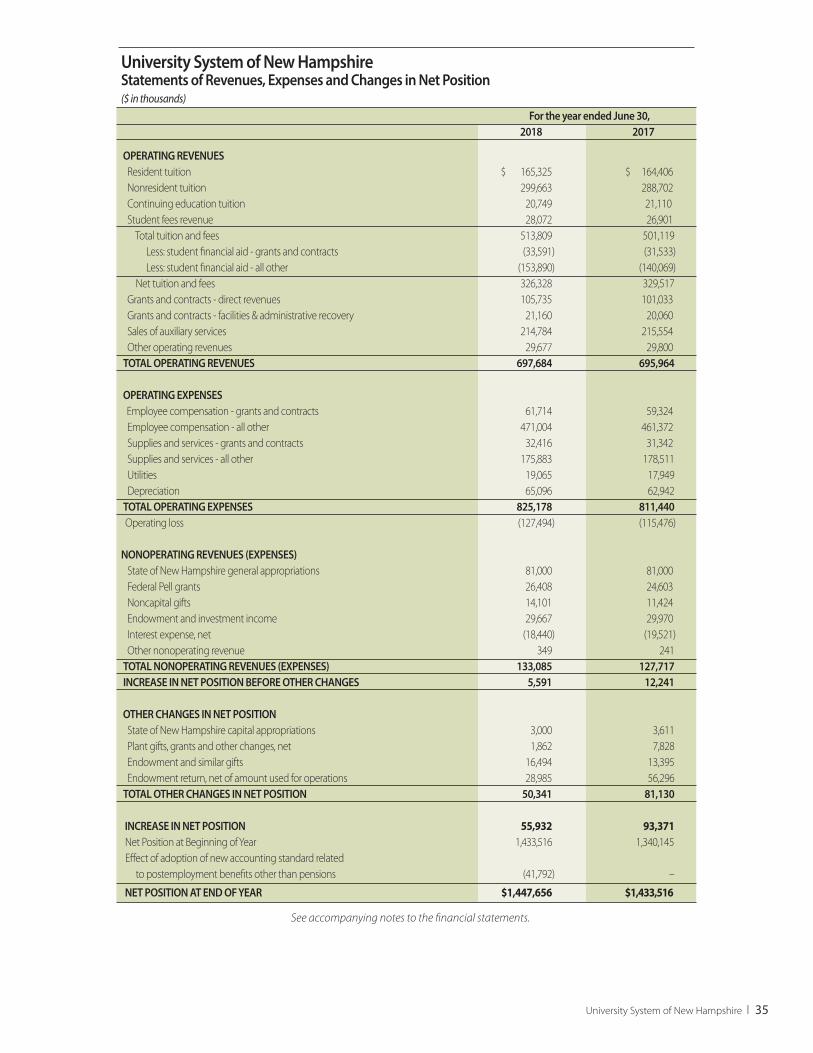
University System of New HampshireStatements of Revenues, Expenses and Changes in Net Position($ in thousands) For the year ended June 30, 2018 2017
OPERATING REVENUES Resident tuition $ 165,325 $ 164,406 Nonresident tuition 299,663 288,702 Continuing education tuition 20,749 21,110 Student fees revenue 28,072 26,901 Total tuition and fees 513,809 501,119 Less: student financial aid - grants and contracts (33,591) (31,533) Less: student financial aid - all other (153,890) (140,069) Net tuition and fees 326,328 329,517 Grants and contracts - direct revenues 105,735 101,033 Grants and contracts - facilities & administrative recovery 21,160 20,060 Sales of auxiliary services 214,784 215,554 Other operating revenues 29,677 29,800 TOTAL OPERATING REVENUES 697,684 695,964 OPERATING EXPENSES Employee compensation - grants and contracts 61,714 59,324 Employee compensation - all other 471,004 461,372 Supplies and services - grants and contracts 32,416 31,342 Supplies and services - all other 175,883 178,511 Utilities 19,065 17,949 Depreciation 65,096 62,942 TOTAL OPERATING EXPENSES 825,178 811,440 Operating loss (127,494) (115,476) NONOPERATING REVENUES (EXPENSES) State of New Hampshire general appropriations 81,000 81,000 Federal Pell grants 26,408 24,603 Noncapital gifts 14,101 11,424 Endowment and investment income 29,667 29,970 Interest expense, net (18,440) (19,521) Other nonoperating revenue 349 241 TOTAL NONOPERATING REVENUES (EXPENSES) 133,085 127,717 INCREASE IN NET POSITION BEFORE OTHER CHANGES 5,591 12,241
OTHER CHANGES IN NET POSITION State of New Hampshire capital appropriations 3,000 3,611 Plant gifts, grants and other changes, net 1,862 7,828 Endowment and similar gifts 16,494 13,395 Endowment return, net of amount used for operations 28,985 56,296 TOTAL OTHER CHANGES IN NET POSITION 50,341 81,130
INCREASE IN NET POSITION 55,932 93,371 Net Position at Beginning of Year 1,433,516 1,340,145 Effect of adoption of new accounting standard related to postemployment benefits other than pensions (41,792) –
NET POSITION AT END OF YEAR $1,447,656 $1,433,516
See accompanying notes to the financial statements.
University System of New Hampshire I 35
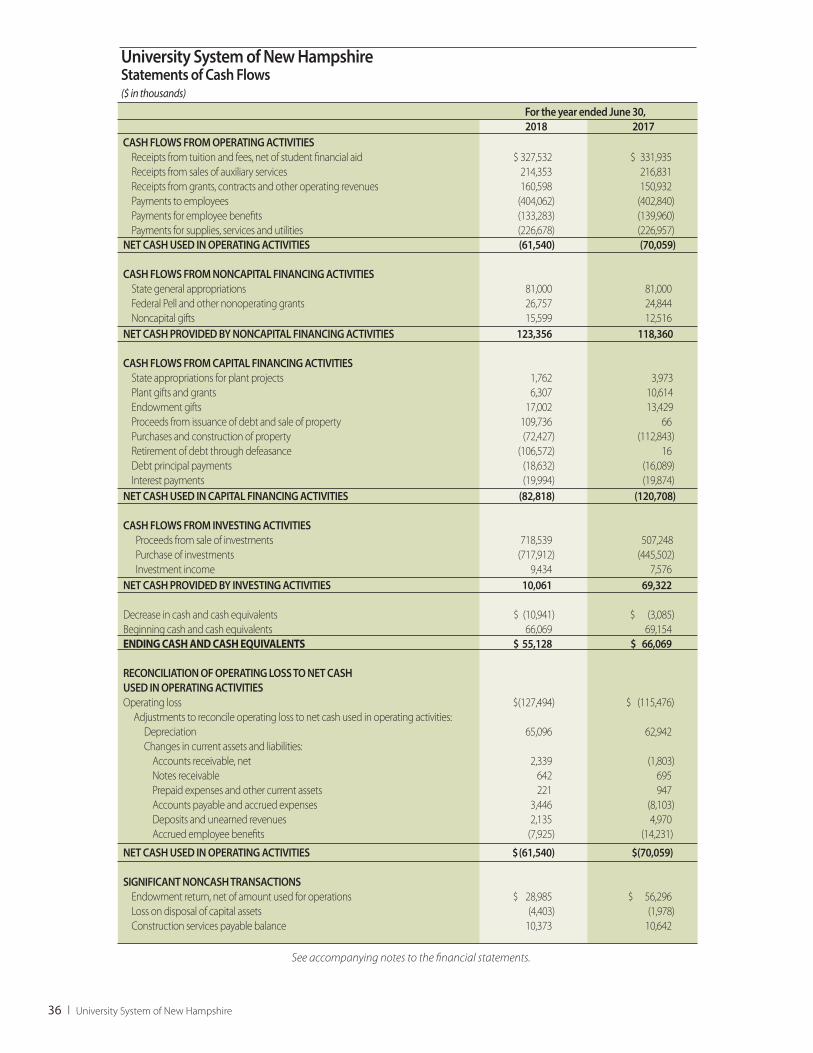
University System of New Hampshire Statements of Cash Flows($ in thousands)
For the year ended June 30, 2018 2017 CASH FLOWS FROM OPERATING ACTIVITIES Receipts from tuition and fees, net of student financial aid $ 327,532 $ 331,935 Receipts from sales of auxiliary services 214,353 216,831 Receipts from grants, contracts and other operating revenues 160,598 150,932 Payments to employees (404,062) (402,840) Payments for employee benefits (133,283) (139,960) Payments for supplies, services and utilities (226,678) (226,957) NET CASH USED IN OPERATING ACTIVITIES (61,540) (70,059) CASH FLOWS FROM NONCAPITAL FINANCING ACTIVITIES State general appropriations 81,000 81,000 Federal Pell and other nonoperating grants 26,757 24,844 Noncapital gifts 15,599 12,516 NET CASH PROVIDED BY NONCAPITAL FINANCING ACTIVITIES 123,356 118,360
CASH FLOWS FROM CAPITAL FINANCING ACTIVITIES State appropriations for plant projects 1,762 3,973 Plant gifts and grants 6,307 10,614 Endowment gifts 17,002 13,429 Proceeds from issuance of debt and sale of property 109,736 66 Purchases and construction of property (72,427) (112,843) Retirement of debt through defeasance (106,572) 16 Debt principal payments (18,632) (16,089) Interest payments (19,994) (19,874) NET CASH USED IN CAPITAL FINANCING ACTIVITIES (82,818) (120,708)
CASH FLOWS FROM INVESTING ACTIVITIES Proceeds from sale of investments 718,539 507,248 Purchase of investments (717,912) (445,502) Investment income 9,434 7,576 NET CASH PROVIDED BY INVESTING ACTIVITIES 10,061 69,322 Decrease in cash and cash equivalents $ (10,941) $ (3,085) Beginning cash and cash equivalents 66,069 69,154 ENDING CASH AND CASH EQUIVALENTS $ 55,128 $ 66,069
RECONCILIATION OF OPERATING LOSS TO NET CASH USED IN OPERATING ACTIVITIES Operating loss $(127,494) $ (115,476) Adjustments to reconcile operating loss to net cash used in operating activities: Depreciation 65,096 62,942 Changes in current assets and liabilities: Accounts receivable, net 2,339 (1,803) Notes receivable 642 695 Prepaid expenses and other current assets 221 947 Accounts payable and accrued expenses 3,446 (8,103) Deposits and unearned revenues 2,135 4,970 Accrued employee benefits (7,925) (14,231)
NET CASH USED IN OPERATING ACTIVITIES $ (61,540) $(70,059)
SIGNIFICANT NONCASH TRANSACTIONS Endowment return, net of amount used for operations $ 28,985 $ 56,296 Loss on disposal of capital assets (4,403) (1,978) Construction services payable balance 10,373 10,642
See accompanying notes to the financial statements.
36 I University System of New Hampshire
Notes to the Financial Statements
June 30, 2018 and 2017
1. Summary of significant accounting policies and presentation The University System of New Hampshire (USNH) is a not-for-profit institution of higher education created in 1963 as a body politic and corporate under the laws of the State of New Hampshire (the State) and is generally exempt from income taxes under Section 501(c)(3) of the Internal Revenue Code. USNH is considered a component unit of the State for financial reporting purposes. The accompanying financial statements include the accounts of the University of New Hampshire (UNH), Plymouth State University (PSU), Keene State College (KSC), and Granite State College (GSC) as well as certain affiliated entities discussed below. UNH, PSU, KSC and GSC are collectively referred to in the accompanying financial statements as “campuses.”
Affiliated entities and related parties Governmental accounting standards require that all potential component units be evaluated for inclusion in the financial statements of the primary government of the reporting entity. USNH’s policy on ‘Foundations Established for the Benefit of USNH or its Component Institutions’ states that the USNH Board of Trustees retains control over the activities of any affiliated foundation. The USNH policy further states that USNH has the legal authority to terminate the existence of any affiliated foundation, at which time ownership of the related assets would revert to USNH. Two legally separate affiliated foundations are impacted by this policy and, accordingly, are considered blended component units of USNH. The University of New Hampshire Foundation, Inc. (UNHF) and the Keene Endowment Association (KEA) are collectively referred to in the accompanying financial statements as “affiliated entities.” The associated revenues, expenses, assets, liabilities, deferred inflows, deferred outflows and net position of UNHF and KEA are fully consolidated with those of the campuses in the accompanying financial statements, and all associated inter-entity activity has been eliminated.
UNHF, Inc. was incorporated in 1989 as a not-for-profit, tax-exempt organization. Its purpose is to solicit, collect, invest and disburse funds for the sole benefit of the University of New Hampshire. The University of New Hampshire funds a portion of the operating expenses of UNHF. UNHF is governed by its own Board of Directors, the membership of which includes the President of the University of New Hampshire and up to three other members of the USNH Board of Trustees. UNHF has a separate financial statement audit each year. Condensed financial information for UNHF is included in Note 16. The KEA was organized in 1957 as a separate charitable entity to provide financial assistance to deserving students at Keene State College. Income is distributed at the discretion of the Trustees of KEA.
Basis of accounting The accompanying financial statements have been prepared in accordance with US generally accepted accounting principles (GAAP) prescribed by the Governmental Accounting Standards Board (GASB) using the economic resources measurement focus and the accrual basis of accounting.
USNH follows the requirements of the “business-type activities” (BTA) model as defined by GASB Statement No. 35, Basic Financial Statements – and Management’s Discussion and Analysis for Public Colleges and Universities. BTAs are defined as those that are financed in whole or in part by fees charged to external parties for goods or services. The Statement requires that resources be classified into the following net position categories, as more fully detailed in Note 14:
Net investment in capital assets: Property and equipment at historical cost or fair value on date of acquisition, net of accumulated depreciation and outstanding principal balances of debt attributable to the acquisition or construction of those assets.
Restricted Nonexpendable: Resources subject to externally imposed stipulations that they be maintained permanently by USNH. These funds include the historical gift value of restricted true endowment funds.
Restricted Expendable: Resources whose use by USNH is subject to externally imposed stipulations. Such funds include the accumulated net gains on donor-restricted “true” endowment funds; the fair value of restricted funds functioning as endowment; restricted funds loaned to students; restricted gifts and endowment income; and other similarly restricted funds.
Unrestricted: Resources that are not subject to externally imposed stipulations. Substantially all unrestricted net position funds are designated to support academic, research, or auxiliary enterprises; invested to function as endowment; or committed to capital construction projects.
The preparation of financial statements in conformity with GAAP requires management to make estimates and assumptions that affect the reported amounts of assets and liabilities, the disclosure of contingent assets and liabilities at the dates of the financial statements, and the reported amounts of revenues and expenses during the reporting periods. Actual results could differ from these estimates. The most significant areas that require management estimates relate to valuation of certain investments and derivative instruments, useful life and related depreciation of capital assets, and accruals for postretirement medical and other employee-related benefits.
Investments are maintained with established financial institutions whose credit is evaluated by management and the respective governing boards of USNH and its affiliated entities. Investments of operating cash in money market and other mutual funds are generally recorded as cash equivalents. These amounts are invested for purposes of satisfying current operating liabilities and generating investment income to support ongoing operations. Short-term investments represent highly liquid amounts held for other current liabilities.
Property and equipment are recorded at original cost for purchased assets or at fair value on the date of donation in the case of gifts. Equipment with a unit cost of $5,000 or more is capitalized. Building improvements with a cost of $50,000 or greater are also capitalized. Net interest costs incurred during the construction period for major, debt-funded capital projects are added to the cost of the underlying asset. The value of equipment acquired under capital leases is recorded at the present value of the minimum lease payments at the inception of the lease. Depreciation of property and equipment is calculated on a straight-line basis over the estimated useful lives of the respective assets. The cost of certain research buildings is componentized for the purpose of calculating depreciation. Buildings and improvements are depreciated over useful lives ranging from 10 to 50 years. Depreciable lives for equipment range from 3 to 30 years. (See Note 5 for additional information on depreciation.) USNH does not record donated works of art and historical treasures that are held for exhibition, education, research and public service. Library collections are recorded as an expense in the period purchased, with the exception of UNH School of Law library collections which are capitalized annually and depreciated over a ten year period on a straight-line basis.
Deposits and unearned revenue consist of amounts billed or received in advance of USNH providing goods or services. Advances from the US Government for FederalPerkins loans to students are reported as government advances refundable.Federal Direct Loan proceeds are posted to student accounts as approved and drawn weekly.
University System of New Hampshire I 37
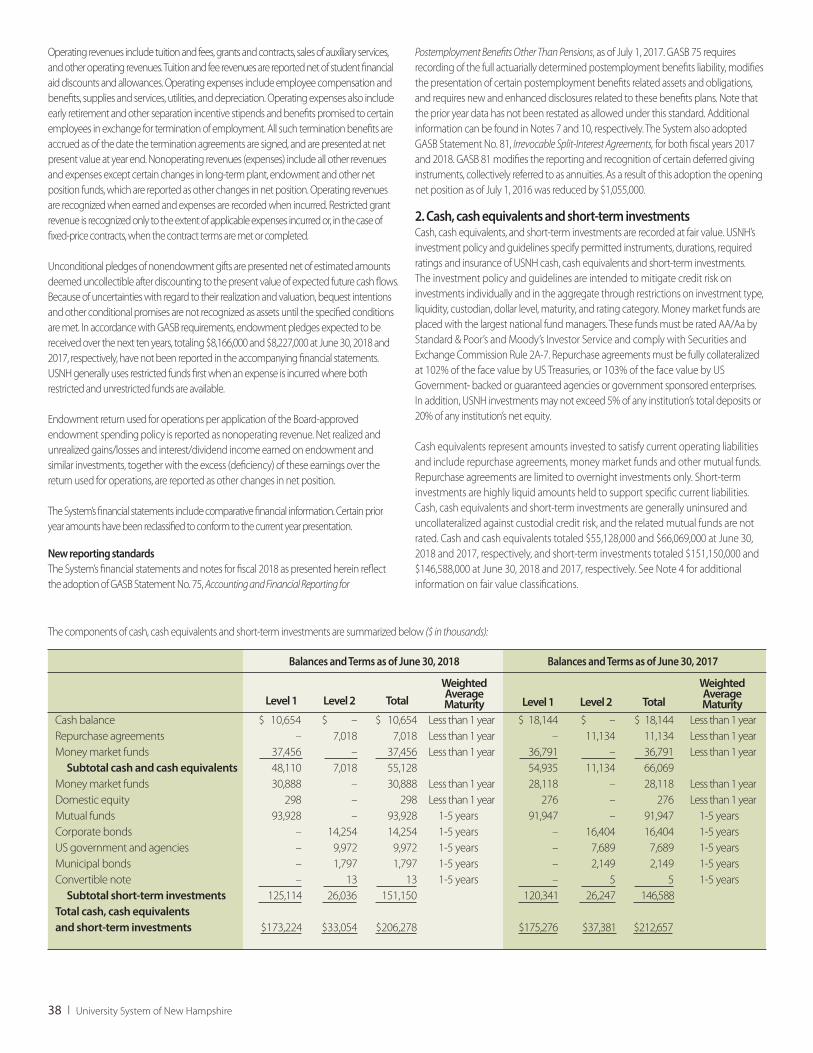
Operating revenues include tuition and fees, grants and contracts, sales of auxiliary services, and other operating revenues. Tuition and fee revenues are reported net of student financial aid discounts and allowances. Operating expenses include employee compensation and benefits, supplies and services, utilities, and depreciation. Operating expenses also include early retirement and other separation incentive stipends and benefits promised to certain employees in exchange for termination of employment. All such termination benefits are accrued as of the date the termination agreements are signed, and are presented at net present value at year end. Nonoperating revenues (expenses) include all other revenues and expenses except certain changes in long-term plant, endowment and other net position funds, which are reported as other changes in net position. Operating revenues are recognized when earned and expenses are recorded when incurred. Restricted grant revenue is recognized only to the extent of applicable expenses incurred or, in the case of fixed-price contracts, when the contract terms are met or completed.
Unconditional pledges of nonendowment gifts are presented net of estimated amounts deemed uncollectible after discounting to the present value of expected future cash flows. Because of uncertainties with regard to their realization and valuation, bequest intentions and other conditional promises are not recognized as assets until the specified conditions are met. In accordance with GASB requirements, endowment pledges expected to be received over the next ten years, totaling $8,166,000 and $8,227,000 at June 30, 2018 and 2017, respectively, have not been reported in the accompanying financial statements. USNH generally uses restricted funds first when an expense is incurred where both restricted and unrestricted funds are available.
Endowment return used for operations per application of the Board-approved endowment spending policy is reported as nonoperating revenue. Net realized and unrealized gains/losses and interest/dividend income earned on endowment and similar investments, together with the excess (deficiency) of these earnings over the return used for operations, are reported as other changes in net position.
The System’s financial statements include comparative financial information. Certain prior year amounts have been reclassified to conform to the current year presentation.
New reporting standardsThe System’s financial statements and notes for fiscal 2018 as presented herein reflect the adoption of GASB Statement No. 75, Accounting and Financial Reporting for
Postemployment Benefits Other Than Pensions, as of July 1, 2017. GASB 75 requires recording of the full actuarially determined postemployment benefits liability, modifies the presentation of certain postemployment benefits related assets and obligations, and requires new and enhanced disclosures related to these benefits plans. Note that the prior year data has not been restated as allowed under this standard. Additional information can be found in Notes 7 and 10, respectively. The System also adopted GASB Statement No. 81, Irrevocable Split-Interest Agreements, for both fiscal years 2017 and 2018. GASB 81 modifies the reporting and recognition of certain deferred giving instruments, collectively referred to as annuities. As a result of this adoption the opening net position as of July 1, 2016 was reduced by $1,055,000.
2. Cash, cash equivalents and short-term investments Cash, cash equivalents, and short-term investments are recorded at fair value. USNH’s investment policy and guidelines specify permitted instruments, durations, required ratings and insurance of USNH cash, cash equivalents and short-term investments. The investment policy and guidelines are intended to mitigate credit risk on investments individually and in the aggregate through restrictions on investment type, liquidity, custodian, dollar level, maturity, and rating category. Money market funds are placed with the largest national fund managers. These funds must be rated AA/Aa by Standard & Poor’s and Moody’s Investor Service and comply with Securities and Exchange Commission Rule 2A-7. Repurchase agreements must be fully collateralized at 102% of the face value by US Treasuries, or 103% of the face value by US Government- backed or guaranteed agencies or government sponsored enterprises. In addition, USNH investments may not exceed 5% of any institution’s total deposits or 20% of any institution’s net equity.
Cash equivalents represent amounts invested to satisfy current operating liabilities and include repurchase agreements, money market funds and other mutual funds. Repurchase agreements are limited to overnight investments only. Short-term investments are highly liquid amounts held to support specific current liabilities. Cash, cash equivalents and short-term investments are generally uninsured and uncollateralized against custodial credit risk, and the related mutual funds are not rated. Cash and cash equivalents totaled $55,128,000 and $66,069,000 at June 30,2018 and 2017, respectively, and short-term investments totaled $151,150,000 and $146,588,000 at June 30, 2018 and 2017, respectively. See Note 4 for additional information on fair value classifications.
Balances and Terms as of June 30, 2018 Balances and Terms as of June 30, 2017
Cash balance $ 10,654 $ – $ 10,654 Less than 1 year $ 18,144 $ – $ 18,144 Less than 1 year Repurchase agreements – 7,018 7,018 Less than 1 year – 11,134 11,134 Less than 1 year Money market funds 37,456 – 37,456 Less than 1 year 36,791 – 36,791 Less than 1 year Subtotal cash and cash equivalents 48,110 7,018 55,128 54,935 11,134 66,069 Money market funds 30,888 – 30,888 Less than 1 year 28,118 – 28,118 Less than 1 yearDomestic equity 298 – 298 Less than 1 year 276 – 276 Less than 1 yearMutual funds 93,928 – 93,928 1-5 years 91,947 – 91,947 1-5 yearsCorporate bonds – 14,254 14,254 1-5 years – 16,404 16,404 1-5 yearsUS government and agencies – 9,972 9,972 1-5 years – 7,689 7,689 1-5 yearsMunicipal bonds – 1,797 1,797 1-5 years – 2,149 2,149 1-5 years Convertible note – 13 13 1-5 years – 5 5 1-5 years Subtotal short-term investments 125,114 26,036 151,150 120,341 26,247 146,588 Total cash, cash equivalents and short-term investments $173,224 $33,054 $206,278 $175,276 $37,381 $212,657
The components of cash, cash equivalents and short-term investments are summarized below ($ in thousands):
Level 1 Level 2 Total Level 1 Level 2 Total
WeightedAverageMaturity
WeightedAverageMaturity
38 I University System of New Hampshire
3. Accounts, pledges and notes receivable Accounts receivable at June 30 consisted of the following ($ in thousands):
2018 2017
Grants and contracts $16,296 $18,847 Student and general 6,589 6,095 State of NH capital projects 1,238 – Allowance for doubtful accounts (3,495) (3,213) Total accounts receivable, net $20,628 $21,729
Pledges receivable at June 30 consisted entirely of unconditional nonendowment promises to pay as follows ($ in thousands):
2018 2017
Pledges receivable $12,119 $13,884 Discounts and allowance for doubtful pledges (3,319) (3,591) Total pledges receivable, net 8,800 10,293 Less: noncurrent portion (5,501) (7,106) Current portion $ 3,299 $ 3,187
Notes receivable at June 30 consisted primarily of student loan funds as follows ($ in thousands):
2018 2017
Perkins loans $22,134 $22,481 Other loans, restricted and unrestricted 748 874 Allowance for doubtful loans (2,101) (1,968) Total notes receivable, net 20,781 21,387 Less: noncurrent portion (18,070) (18,094) Current portion $ 2,711 $ 3,293
4. Investments USNH’s investment policy and guidelines specify permitted instruments, duration and required ratings for pooled endowment funds. The policy and guidelines are intended to mitigate risk on investments individually and in the aggregate while maximizing total returns and supporting intergenerational equity of spending levels. Illiquid investments are limited to 20% of the USNH consolidated endowment pool. Credit risk is mitigated by due diligence in the selection and continuing review of investment managers as well as diversification of both investment managers and underlying investments. No more than 15% of total portfolio assets may beinvested in any single fund and no more than 20% of the pool may be invested with any single bank, fund manager, or investment group unless approved by the USNH Board of Trustees’ Finance Committee for Investments. Foreign currency risk is mitigated by limiting global equity investments in publicly traded international and emerging market funds to 25% of the endowment pool. Private global equity investments are limited to 15% of the endowment pool. No USNH endowment investments were denominated in foreign currencies as of June 30, 2018 or June 30, 2017.
GASB Statement No. 72, Fair Value Measurement and Application, requires that USNH categorize assets measured at fair value using a three-tiered hierarchy based on the valuation methodologies employed.
The hierarchy includes the following: Level 1 — Value based on quoted prices (unadjusted) in active markets for identical assets that are accessible at the measurement date
Level 2 — Value based on inputs other than quoted prices that are observable for an asset either directly or indirectly; and
Level 3 — Value based on unobservable inputs for an asset
In determining fair value of investment assets, USNH utilizes valuation techniques that maximize the use of observable inputs and minimize the use of unobservable inputs to the extent possible. As a practical expedient to estimate the fair value of USNH’s interests, certain investments in commingled funds and limited partnerships are reported at the net asset value (NAV) determined by the respective fund managers, without adjustment when assessed as reasonable by USNH, unless it is probable that all or a portion of the investment will be sold for an amount different from NAV. Because these investments are not readily marketable, their estimated fair values may differ from the values that would have been assigned had a ready market for such investments existed, and such differences could be material. As of June 30, 2018, and 2017, USNH had no plans or intentions to sell such investments at amounts different from NAV. Investments reported at NAV as a practical expedient are not categorized in the fair value hierarchy.
The endowment and similar investment holdings of the campuses and affiliated entities as of June 30, 2018 and 2017, respectively, are summarized below ($ in thousands):
Campuses Affiliated Entities
2018 2017 2018 2017
Pooled endowments: Campuses $527,063 $ 497,885 $ – $ – UNH Foundation – – 224,648 204,468 Keene Endowment Association – – 8,869 7,820 Life income and annuity funds 87 85 4,400 4,058 Funds held in trust 16,215 16,192 – – Total $543,365 $514,162 $237,917 $216,346
The majority of USNH’s investments are units of institutional commingled funds and limited partnerships invested in equity, fixed income, hedge, natural resources, private equity, or real estate strategies. Hedge strategies involve funds whose managers have the authority to invest in various asset classes at their discretion, including the ability to invest long and short. Funds with hedge strategies generally hold securities or other financial instruments for which a ready market exists and may include stocks, bonds, put or call options, swaps, currency hedges and other instruments which are valued by the investment manager. To the extent quoted prices exist the manager would usethose; when these are not available, other methodologies maximizing observable inputs would be used for the valuation, such as discounted cash flow analysis, capitalization of current or stabilized net operating income, replacement costs, or sales contracts and recent sales comparable in the market. Private equity funds employ buyout, growth and venture capital, and distressed security strategies. Real asset funds generally hold interests in private real estate. As of June 30, 2018 and 2017, fixed income securities had maturities up to 29 years and carried ratings ranging from AAA to A3. The mutual fund investments held in the endowment pools are not rated.
University System of New Hampshire I 39
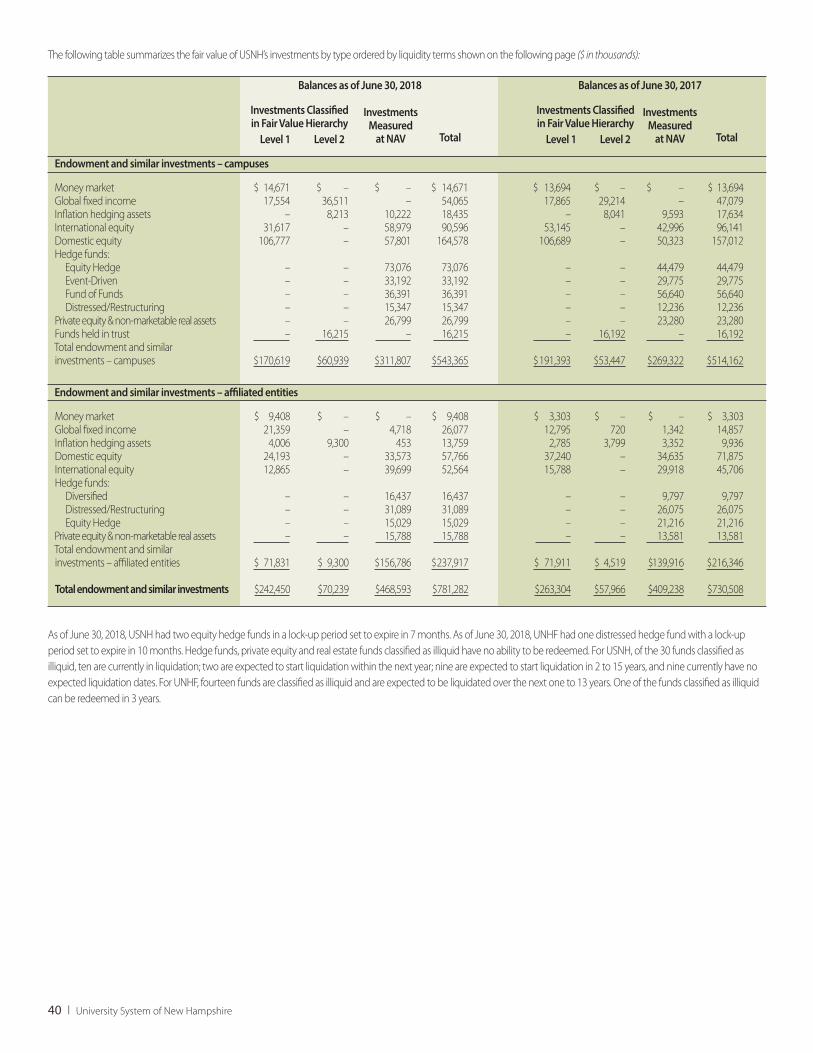
40 I University System of New Hampshire
The following table summarizes the fair value of USNH’s investments by type ordered by liquidity terms shown on the following page ($ in thousands):
As of June 30, 2018, USNH had two equity hedge funds in a lock-up period set to expire in 7 months. As of June 30, 2018, UNHF had one distressed hedge fund with a lock-up period set to expire in 10 months. Hedge funds, private equity and real estate funds classified as illiquid have no ability to be redeemed. For USNH, of the 30 funds classified as illiquid, ten are currently in liquidation; two are expected to start liquidation within the next year; nine are expected to start liquidation in 2 to 15 years, and nine currently have no expected liquidation dates. For UNHF, fourteen funds are classified as illiquid and are expected to be liquidated over the next one to 13 years. One of the funds classified as illiquid can be redeemed in 3 years.
Balances as of June 30, 2018 Balances as of June 30, 2017
Endowment and similar investments – campuses
Money market $ 14,671 $ – $ – $ 14,671 $ 13,694 $ – $ – $ 13,694 Global fixed income 17,554 36,511 – 54,065 17,865 29,214 – 47,079 Inflation hedging assets – 8,213 10,222 18,435 – 8,041 9,593 17,634 International equity 31,617 – 58,979 90,596 53,145 – 42,996 96,141 Domestic equity 106,777 – 57,801 164,578 106,689 – 50,323 157,012 Hedge funds: Equity Hedge – – 73,076 73,076 – – 44,479 44,479 Event-Driven – – 33,192 33,192 – – 29,775 29,775 Fund of Funds – – 36,391 36,391 – – 56,640 56,640 Distressed/Restructuring – – 15,347 15,347 – – 12,236 12,236 Private equity & non-marketable real assets – – 26,799 26,799 – – 23,280 23,280 Funds held in trust – 16,215 – 16,215 – 16,192 – 16,192 Total endowment and similar investments – campuses $170,619 $60,939 $311,807 $543,365 $ 191,393 $53,447 $269,322 $514,162
Endowment and similar investments – affiliated entities
Money market $ 9,408 $ – $ – $ 9,408 $ 3,303 $ – $ – $ 3,303 Global fixed income 21,359 – 4,718 26,077 12,795 720 1,342 14,857 Inflation hedging assets 4,006 9,300 453 13,759 2,785 3,799 3,352 9,936 Domestic equity 24,193 – 33,573 57,766 37,240 – 34,635 71,875 International equity 12,865 – 39,699 52,564 15,788 – 29,918 45,706 Hedge funds: Diversified – – 16,437 16,437 – – 9,797 9,797 Distressed/Restructuring – – 31,089 31,089 – – 26,075 26,075 Equity Hedge – – 15,029 15,029 – – 21,216 21,216 Private equity & non-marketable real assets – – 15,788 15,788 – – 13,581 13,581 Total endowment and similar investments – affiliated entities $ 71,831 $ 9,300 $156,786 $237,917 $ 71,911 $ 4,519 $ 139,916 $216,346
Total endowment and similar investments $242,450 $70,239 $468,593 $781,282 $263,304 $57,966 $409,238 $730,508
Investments Classifiedin Fair Value Hierarchy
Level 1 Level 2
Investments Measured
at NAV Total
Investments Classifiedin Fair Value Hierarchy
Level 1 Level 2
Investments Measured
at NAV Total
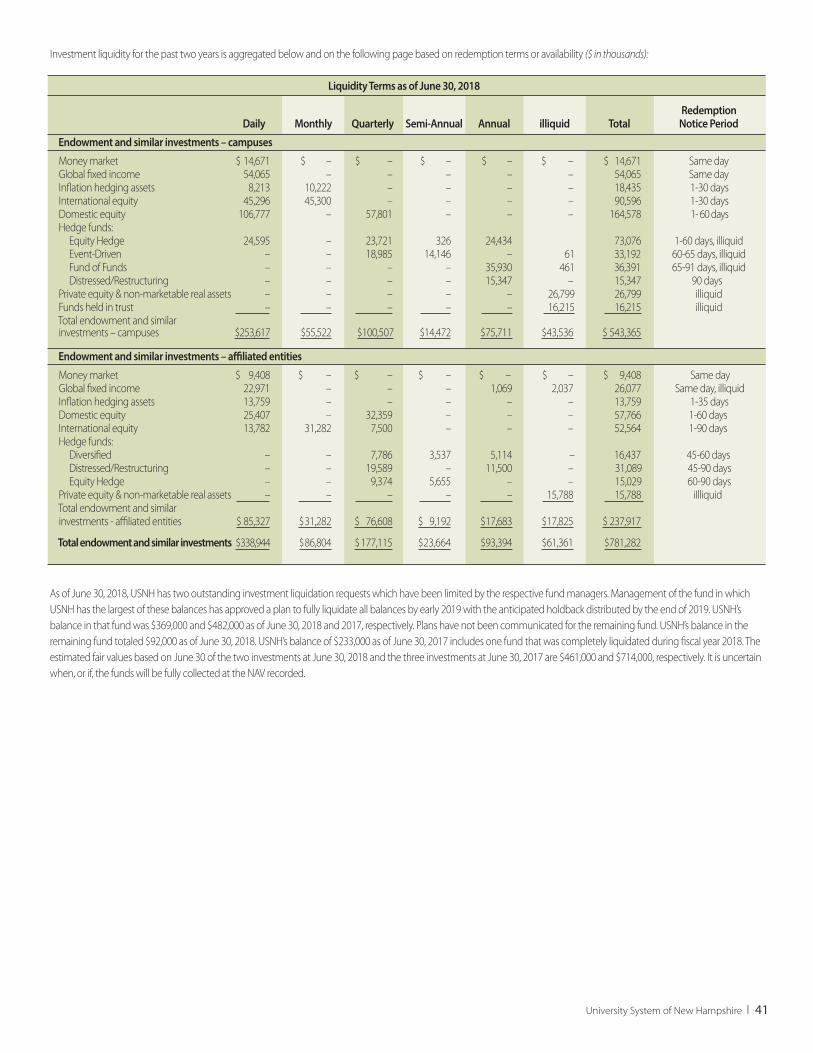
Liquidity Terms as of June 30, 2018
Redemption Daily Monthly Quarterly Semi-Annual Annual illiquid Total Notice Period
Endowment and similar investments – campuses
Money market $ 14,671 $ – $ – $ – $ – $ – $ 14,671 Same day Global fixed income 54,065 – – – – – 54,065 Same day Inflation hedging assets 8,213 10,222 – – – – 18,435 1-30 days International equity 45,296 45,300 – – – – 90,596 1-30 days Domestic equity 106,777 – 57,801 – – – 164,578 1- 60 days Hedge funds: Equity Hedge 24,595 – 23,721 326 24,434 73,076 1-60 days, illiquid Event-Driven – – 18,985 14,146 – 61 33,192 60-65 days, illiquid Fund of Funds – – – – 35,930 461 36,391 65-91 days, illiquid Distressed/Restructuring – – – – 15,347 – 15,347 90 days Private equity & non-marketable real assets – – – – – 26,799 26,799 illiquid Funds held in trust – – – – – 16,215 16,215 illiquid Total endowment and similar investments – campuses $253,617 $55,522 $100,507 $14,472 $75,711 $43,536 $ 543,365
Endowment and similar investments – affiliated entities
Money market $ 9,408 $ – $ – $ – $ – $ – $ 9,408 Same day Global fixed income 22,971 – – – 1,069 2,037 26,077 Same day, illiquid Inflation hedging assets 13,759 – – – – – 13,759 1-35 days Domestic equity 25,407 – 32,359 – – – 57,766 1-60 days International equity 13,782 31,282 7,500 – – – 52,564 1-90 days Hedge funds: Diversified – – 7,786 3,537 5,114 – 16,437 45-60 days Distressed/Restructuring – – 19,589 – 11,500 – 31,089 45-90 days Equity Hedge – – 9,374 5,655 – – 15,029 60-90 days Private equity & non-marketable real assets – – – – – 15,788 15,788 iIlliquid Total endowment and similar investments - affiliated entities $ 85,327 $31,282 $ 76,608 $ 9,192 $17,683 $17,825 $ 237,917
Total endowment and similar investments $338,944 $86,804 $ 177,115 $23,664 $93,394 $61,361 $781,282
As of June 30, 2018, USNH has two outstanding investment liquidation requests which have been limited by the respective fund managers. Management of the fund in which USNH has the largest of these balances has approved a plan to fully liquidate all balances by early 2019 with the anticipated holdback distributed by the end of 2019. USNH’s balance in that fund was $369,000 and $482,000 as of June 30, 2018 and 2017, respectively. Plans have not been communicated for the remaining fund. USNH’s balance in the remaining fund totaled $92,000 as of June 30, 2018. USNH’s balance of $233,000 as of June 30, 2017 includes one fund that was completely liquidated during fiscal year 2018. The estimated fair values based on June 30 of the two investments at June 30, 2018 and the three investments at June 30, 2017 are $461,000 and $714,000, respectively. It is uncertain when, or if, the funds will be fully collected at the NAV recorded.
Investment liquidity for the past two years is aggregated below and on the following page based on redemption terms or availability ($ in thousands):
University System of New Hampshire I 41
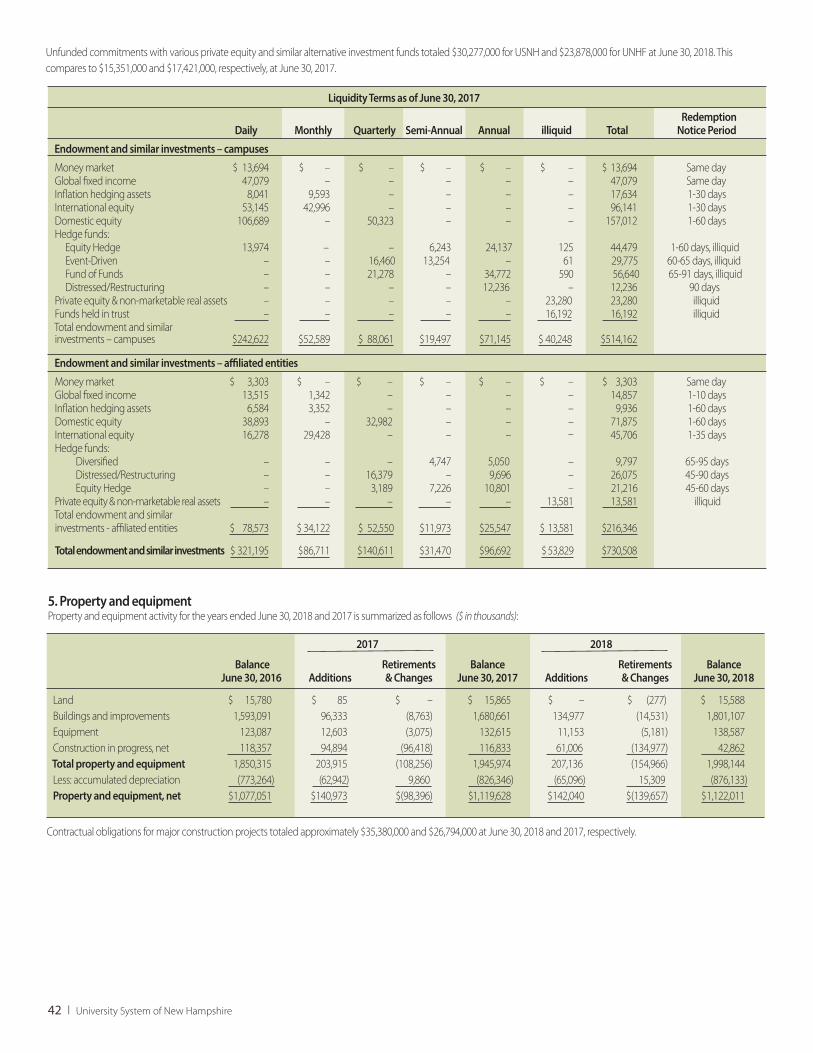
5. Property and equipment Property and equipment activity for the years ended June 30, 2018 and 2017 is summarized as follows ($ in thousands):
Land $ 15,780 $ 85 $ – $ 15,865 $ – $ (277) $ 15,588 Buildings and improvements 1,593,091 96,333 (8,763) 1,680,661 134,977 (14,531) 1,801,107 Equipment 123,087 12,603 (3,075) 132,615 11,153 (5,181) 138,587 Construction in progress, net 118,357 94,894 (96,418) 116,833 61,006 (134,977) 42,862 Total property and equipment 1,850,315 203,915 (108,256) 1,945,974 207,136 (154,966) 1,998,144 Less: accumulated depreciation (773,264) (62,942) 9,860 (826,346) (65,096) 15,309 (876,133) Property and equipment, net $1,077,051 $140,973 $(98,396) $1,119,628 $142,040 $(139,657) $1,122,011 Contractual obligations for major construction projects totaled approximately $35,380,000 and $26,794,000 at June 30, 2018 and 2017, respectively.
BalanceJune 30, 2016 Additions
Retirements& Changes
BalanceJune 30, 2017 Additions
Retirements& Changes
BalanceJune 30, 2018
2017 2018
Liquidity Terms as of June 30, 2017
Redemption Daily Monthly Quarterly Semi-Annual Annual illiquid Total Notice Period
Endowment and similar investments – campuses
Money market $ 13,694 $ – $ – $ – $ – $ – $ 13,694 Same day Global fixed income 47,079 – – – – – 47,079 Same day Inflation hedging assets 8,041 9,593 – – – – 17,634 1-30 days International equity 53,145 42,996 – – – – 96,141 1-30 days Domestic equity 106,689 – 50,323 – – – 157,012 1-60 days Hedge funds: Equity Hedge 13,974 – – 6,243 24,137 125 44,479 1-60 days, illiquid Event-Driven – – 16,460 13,254 – 61 29,775 60-65 days, illiquid Fund of Funds – – 21,278 – 34,772 590 56,640 65-91 days, illiquid Distressed/Restructuring – – – – 12,236 – 12,236 90 days Private equity & non-marketable real assets – – – – – 23,280 23,280 illiquid Funds held in trust – – – – – 16,192 16,192 illiquid Total endowment and similar investments – campuses $242,622 $52,589 $ 88,061 $19,497 $71,145 $ 40,248 $514,162
Endowment and similar investments – affiliated entities
Money market $ 3,303 $ – $ – $ – $ – $ – $ 3,303 Same day Global fixed income 13,515 1,342 – – – – 14,857 1-10 days Inflation hedging assets 6,584 3,352 – – – – 9,936 1-60 days Domestic equity 38,893 – 32,982 – – – 71,875 1-60 days International equity 16,278 29,428 – – – – 45,706 1-35 days Hedge funds: Diversified – – – 4,747 5,050 – 9,797 65-95 days Distressed/Restructuring – – 16,379 – 9,696 – 26,075 45-90 days Equity Hedge – – 3,189 7,226 10,801 – 21,216 45-60 days Private equity & non-marketable real assets – – – – – 13,581 13,581 illiquid Total endowment and similar investments - affiliated entities $ 78,573 $ 34,122 $ 52,550 $11,973 $25,547 $ 13,581 $216,346 Total endowment and similar investments $ 321,195 $86,711 $140,611 $31,470 $96,692 $ 53,829 $730,508
42 I University System of New Hampshire
Unfunded commitments with various private equity and similar alternative investment funds totaled $30,277,000 for USNH and $23,878,000 for UNHF at June 30, 2018. This compares to $15,351,000 and $17,421,000, respectively, at June 30, 2017.
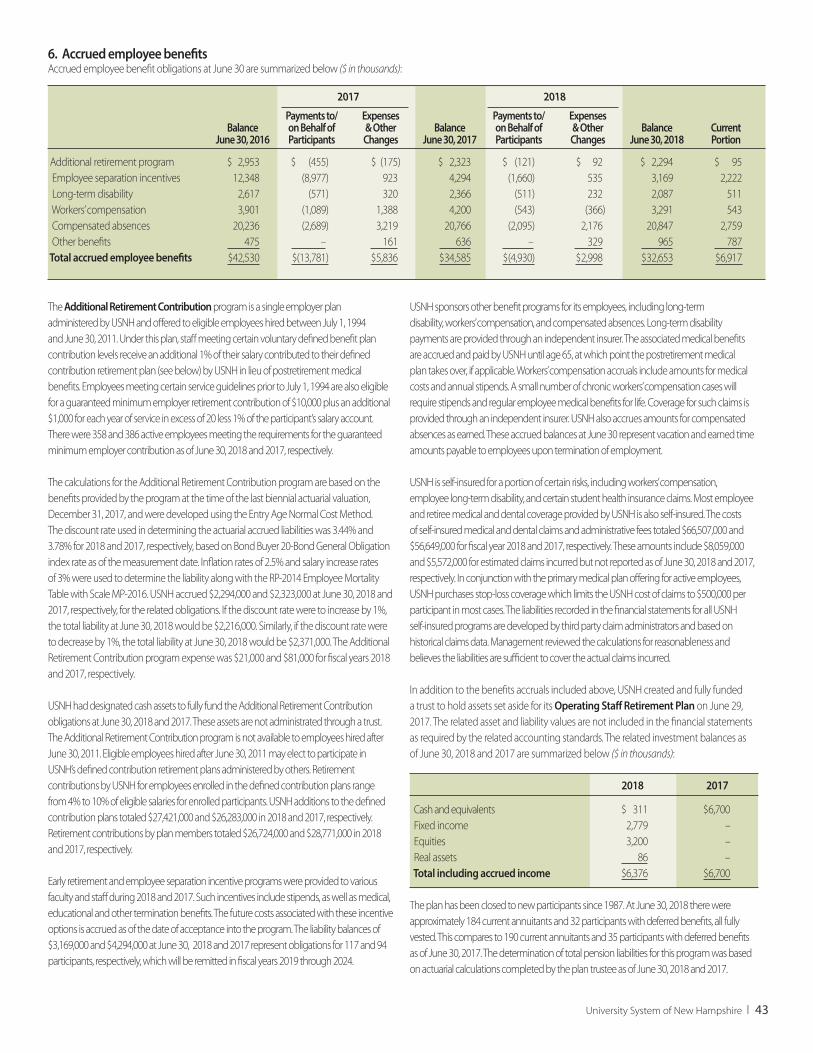
Additional retirement program $ 2,953 $ (455) $ (175) $ 2,323 $ (121) $ 92 $ 2,294 $ 95 Employee separation incentives 12,348 (8,977) 923 4,294 (1,660) 535 3,169 2,222 Long-term disability 2,617 (571) 320 2,366 (511) 232 2,087 511 Workers’ compensation 3,901 (1,089) 1,388 4,200 (543) (366) 3,291 543 Compensated absences 20,236 (2,689) 3,219 20,766 (2,095) 2,176 20,847 2,759 Other benefits 475 – 161 636 – 329 965 787 Total accrued employee benefits $42,530 $(13,781) $5,836 $34,585 $(4,930) $2,998 $32,653 $6,917
Balance
June 30, 2016
Payments to/on Behalf ofParticipants
Expenses& OtherChanges
BalanceJune 30, 2017
Payments to/on Behalf ofParticipants
Expenses& OtherChanges
BalanceJune 30, 2018
CurrentPortion
2017 2018
6. Accrued employee benefits Accrued employee benefit obligations at June 30 are summarized below ($ in thousands):
University System of New Hampshire I 43
The Additional Retirement Contribution program is a single employer plan administered by USNH and offered to eligible employees hired between July 1, 1994 and June 30, 2011. Under this plan, staff meeting certain voluntary defined benefit plan contribution levels receive an additional 1% of their salary contributed to their defined contribution retirement plan (see below) by USNH in lieu of postretirement medical benefits. Employees meeting certain service guidelines prior to July 1, 1994 are also eligible for a guaranteed minimum employer retirement contribution of $10,000 plus an additional $1,000 for each year of service in excess of 20 less 1% of the participant’s salary account. There were 358 and 386 active employees meeting the requirements for the guaranteed minimum employer contribution as of June 30, 2018 and 2017, respectively.
The calculations for the Additional Retirement Contribution program are based on the benefits provided by the program at the time of the last biennial actuarial valuation, December 31, 2017, and were developed using the Entry Age Normal Cost Method. The discount rate used in determining the actuarial accrued liabilities was 3.44% and 3.78% for 2018 and 2017, respectively, based on Bond Buyer 20-Bond General Obligation index rate as of the measurement date. Inflation rates of 2.5% and salary increase rates of 3% were used to determine the liability along with the RP-2014 Employee Mortality Table with Scale MP-2016. USNH accrued $2,294,000 and $2,323,000 at June 30, 2018 and 2017, respectively, for the related obligations. If the discount rate were to increase by 1%, the total liability at June 30, 2018 would be $2,216,000. Similarly, if the discount rate were to decrease by 1%, the total liability at June 30, 2018 would be $2,371,000. The Additional Retirement Contribution program expense was $21,000 and $81,000 for fiscal years 2018 and 2017, respectively.
USNH had designated cash assets to fully fund the Additional Retirement Contribution obligations at June 30, 2018 and 2017. These assets are not administrated through a trust. The Additional Retirement Contribution program is not available to employees hired after June 30, 2011. Eligible employees hired after June 30, 2011 may elect to participate in USNH’s defined contribution retirement plans administered by others. Retirement contributions by USNH for employees enrolled in the defined contribution plans range from 4% to 10% of eligible salaries for enrolled participants. USNH additions to the defined contribution plans totaled $27,421,000 and $26,283,000 in 2018 and 2017, respectively. Retirement contributions by plan members totaled $26,724,000 and $28,771,000 in 2018 and 2017, respectively. Early retirement and employee separation incentive programs were provided to various faculty and staff during 2018 and 2017. Such incentives include stipends, as well as medical, educational and other termination benefits. The future costs associated with these incentive options is accrued as of the date of acceptance into the program. The liability balances of $3,169,000 and $4,294,000 at June 30, 2018 and 2017 represent obligations for 117 and 94 participants, respectively, which will be remitted in fiscal years 2019 through 2024.
USNH sponsors other benefit programs for its employees, including long-term disability, workers’ compensation, and compensated absences. Long-term disability payments are provided through an independent insurer. The associated medical benefits are accrued and paid by USNH until age 65, at which point the postretirement medical plan takes over, if applicable. Workers’ compensation accruals include amounts for medical costs and annual stipends. A small number of chronic workers’ compensation cases will require stipends and regular employee medical benefits for life. Coverage for such claims is provided through an independent insurer. USNH also accrues amounts for compensated absences as earned. These accrued balances at June 30 represent vacation and earned time amounts payable to employees upon termination of employment.
USNH is self-insured for a portion of certain risks, including workers’ compensation, employee long-term disability, and certain student health insurance claims. Most employee and retiree medical and dental coverage provided by USNH is also self-insured. The costs of self-insured medical and dental claims and administrative fees totaled $66,507,000 and $56,649,000 for fiscal year 2018 and 2017, respectively. These amounts include $8,059,000 and $5,572,000 for estimated claims incurred but not reported as of June 30, 2018 and 2017, respectively. In conjunction with the primary medical plan offering for active employees, USNH purchases stop-loss coverage which limits the USNH cost of claims to $500,000 per participant in most cases. The liabilities recorded in the financial statements for all USNH self-insured programs are developed by third party claim administrators and based on historical claims data. Management reviewed the calculations for reasonableness and believes the liabilities are sufficient to cover the actual claims incurred.
In addition to the benefits accruals included above, USNH created and fully funded a trust to hold assets set aside for its Operating Staff Retirement Plan on June 29, 2017. The related asset and liability values are not included in the financial statements as required by the related accounting standards. The related investment balances as of June 30, 2018 and 2017 are summarized below ($ in thousands):
2018 2017
Cash and equivalents $ 311 $6,700 Fixed income 2,779 – Equities 3,200 – Real assets 86 – Total including accrued income $6,376 $6,700
The plan has been closed to new participants since 1987. At June 30, 2018 there were approximately 184 current annuitants and 32 participants with deferred benefits, all fully vested. This compares to 190 current annuitants and 35 participants with deferred benefits as of June 30, 2017. The determination of total pension liabilities for this program was based on actuarial calculations completed by the plan trustee as of June 30, 2018 and 2017.
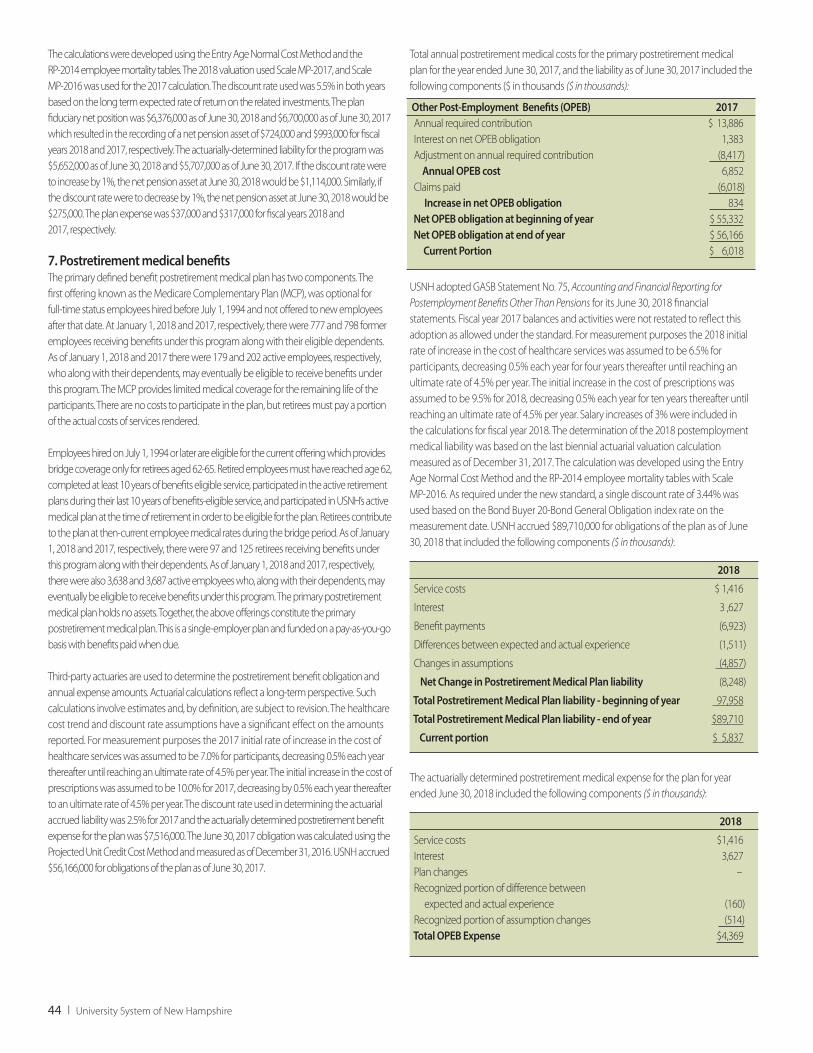
The calculations were developed using the Entry Age Normal Cost Method and the RP-2014 employee mortality tables. The 2018 valuation used Scale MP-2017, and Scale MP-2016 was used for the 2017 calculation. The discount rate used was 5.5% in both years based on the long term expected rate of return on the related investments. The plan fiduciary net position was $6,376,000 as of June 30, 2018 and $6,700,000 as of June 30, 2017 which resulted in the recording of a net pension asset of $724,000 and $993,000 for fiscal years 2018 and 2017, respectively. The actuarially-determined liability for the program was $5,652,000 as of June 30, 2018 and $5,707,000 as of June 30, 2017. If the discount rate were to increase by 1%, the net pension asset at June 30, 2018 would be $1,114,000. Similarly, if the discount rate were to decrease by 1%, the net pension asset at June 30, 2018 would be $275,000. The plan expense was $37,000 and $317,000 for fiscal years 2018 and 2017, respectively.
7. Postretirement medical benefits The primary defined benefit postretirement medical plan has two components. The first offering known as the Medicare Complementary Plan (MCP), was optional for full-time status employees hired before July 1, 1994 and not offered to new employees after that date. At January 1, 2018 and 2017, respectively, there were 777 and 798 former employees receiving benefits under this program along with their eligible dependents. As of January 1, 2018 and 2017 there were 179 and 202 active employees, respectively, who along with their dependents, may eventually be eligible to receive benefits under this program. The MCP provides limited medical coverage for the remaining life of the participants. There are no costs to participate in the plan, but retirees must pay a portion of the actual costs of services rendered.
Employees hired on July 1, 1994 or later are eligible for the current offering which provides bridge coverage only for retirees aged 62-65. Retired employees must have reached age 62, completed at least 10 years of benefits eligible service, participated in the active retirement plans during their last 10 years of benefits-eligible service, and participated in USNH’s active medical plan at the time of retirement in order to be eligible for the plan. Retirees contribute to the plan at then-current employee medical rates during the bridge period. As of January 1, 2018 and 2017, respectively, there were 97 and 125 retirees receiving benefits under this program along with their dependents. As of January 1, 2018 and 2017, respectively, there were also 3,638 and 3,687 active employees who, along with their dependents, may eventually be eligible to receive benefits under this program. The primary postretirement medical plan holds no assets. Together, the above offerings constitute the primary postretirement medical plan. This is a single-employer plan and funded on a pay-as-you-go basis with benefits paid when due.
Third-party actuaries are used to determine the postretirement benefit obligation and annual expense amounts. Actuarial calculations reflect a long-term perspective. Such calculations involve estimates and, by definition, are subject to revision. The healthcare cost trend and discount rate assumptions have a significant effect on the amounts reported. For measurement purposes the 2017 initial rate of increase in the cost of healthcare services was assumed to be 7.0% for participants, decreasing 0.5% each year thereafter until reaching an ultimate rate of 4.5% per year. The initial increase in the cost of prescriptions was assumed to be 10.0% for 2017, decreasing by 0.5% each year thereafter to an ultimate rate of 4.5% per year. The discount rate used in determining the actuarial accrued liability was 2.5% for 2017 and the actuarially determined postretirement benefit expense for the plan was $7,516,000. The June 30, 2017 obligation was calculated using the Projected Unit Credit Cost Method and measured as of December 31, 2016. USNH accrued $56,166,000 for obligations of the plan as of June 30, 2017.
Total annual postretirement medical costs for the primary postretirement medical plan for the year ended June 30, 2017, and the liability as of June 30, 2017 included the following components ($ in thousands ($ in thousands):
Other Post-Employment Benefits (OPEB) 2017 Annual required contribution $ 13,886 Interest on net OPEB obligation 1,383 Adjustment on annual required contribution (8,417) Annual OPEB cost 6,852 Claims paid (6,018) Increase in net OPEB obligation 834 Net OPEB obligation at beginning of year $ 55,332 Net OPEB obligation at end of year $ 56,166 Current Portion $ 6,018
USNH adopted GASB Statement No. 75, Accounting and Financial Reporting for Postemployment Benefits Other Than Pensions for its June 30, 2018 financial statements. Fiscal year 2017 balances and activities were not restated to reflect this adoption as allowed under the standard. For measurement purposes the 2018 initial rate of increase in the cost of healthcare services was assumed to be 6.5% for participants, decreasing 0.5% each year for four years thereafter until reaching an ultimate rate of 4.5% per year. The initial increase in the cost of prescriptions was assumed to be 9.5% for 2018, decreasing 0.5% each year for ten years thereafter until reaching an ultimate rate of 4.5% per year. Salary increases of 3% were included in the calculations for fiscal year 2018. The determination of the 2018 postemployment medical liability was based on the last biennial actuarial valuation calculation measured as of December 31, 2017. The calculation was developed using the Entry Age Normal Cost Method and the RP-2014 employee mortality tables with Scale MP-2016. As required under the new standard, a single discount rate of 3.44% was used based on the Bond Buyer 20-Bond General Obligation index rate on the measurement date. USNH accrued $89,710,000 for obligations of the plan as of June 30, 2018 that included the following components ($ in thousands): 2018
Service costs $ 1,416
Interest 3 ,627
Benefit payments (6,923)
Differences between expected and actual experience (1,511)
Changes in assumptions (4,857)
Net Change in Postretirement Medical Plan liability (8,248)
Total Postretirement Medical Plan liability - beginning of year 97,958
Total Postretirement Medical Plan liability - end of year $89,710
Current portion $ 5,837
The actuarially determined postretirement medical expense for the plan for year ended June 30, 2018 included the following components ($ in thousands):
2018
Service costs $1,416 Interest 3,627 Plan changes – Recognized portion of difference between expected and actual experience (160) Recognized portion of assumption changes (514) Total OPEB Expense $4,369
44 I University System of New Hampshire
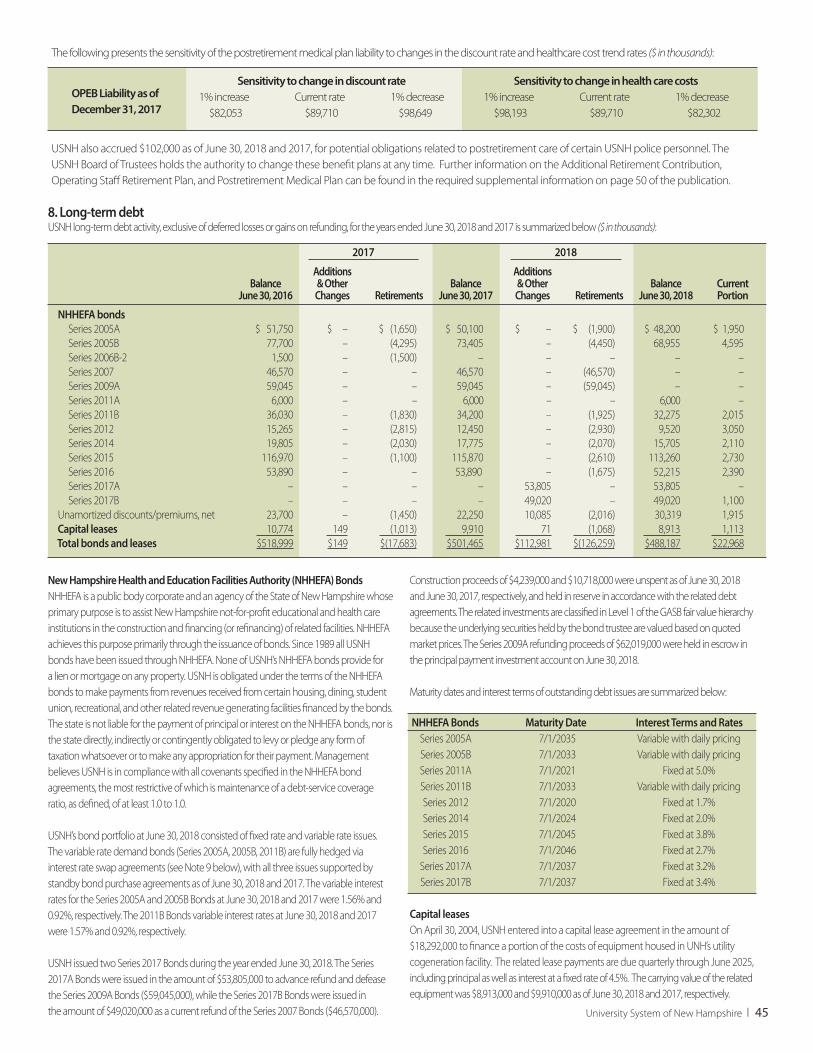
New Hampshire Health and Education Facilities Authority (NHHEFA) Bonds NHHEFA is a public body corporate and an agency of the State of New Hampshire whose primary purpose is to assist New Hampshire not-for-profit educational and health care institutions in the construction and financing (or refinancing) of related facilities. NHHEFA achieves this purpose primarily through the issuance of bonds. Since 1989 all USNH bonds have been issued through NHHEFA. None of USNH’s NHHEFA bonds provide for a lien or mortgage on any property. USNH is obligated under the terms of the NHHEFA bonds to make payments from revenues received from certain housing, dining, student union, recreational, and other related revenue generating facilities financed by the bonds. The state is not liable for the payment of principal or interest on the NHHEFA bonds, nor is the state directly, indirectly or contingently obligated to levy or pledge any form of taxation whatsoever or to make any appropriation for their payment. Management believes USNH is in compliance with all covenants specified in the NHHEFA bond agreements, the most restrictive of which is maintenance of a debt-service coverage ratio, as defined, of at least 1.0 to 1.0.
USNH’s bond portfolio at June 30, 2018 consisted of fixed rate and variable rate issues. The variable rate demand bonds (Series 2005A, 2005B, 2011B) are fully hedged via interest rate swap agreements (see Note 9 below), with all three issues supported by standby bond purchase agreements as of June 30, 2018 and 2017. The variable interest rates for the Series 2005A and 2005B Bonds at June 30, 2018 and 2017 were 1.56% and 0.92%, respectively. The 2011B Bonds variable interest rates at June 30, 2018 and 2017 were 1.57% and 0.92%, respectively.
USNH issued two Series 2017 Bonds during the year ended June 30, 2018. The Series 2017A Bonds were issued in the amount of $53,805,000 to advance refund and defease the Series 2009A Bonds ($59,045,000), while the Series 2017B Bonds were issued in the amount of $49,020,000 as a current refund of the Series 2007 Bonds ($46,570,000).
Construction proceeds of $4,239,000 and $10,718,000 were unspent as of June 30, 2018 and June 30, 2017, respectively, and held in reserve in accordance with the related debt agreements. The related investments are classified in Level 1 of the GASB fair value hierarchy because the underlying securities held by the bond trustee are valued based on quoted market prices. The Series 2009A refunding proceeds of $62,019,000 were held in escrow in the principal payment investment account on June 30, 2018. Maturity dates and interest terms of outstanding debt issues are summarized below: NHHEFA Bonds Maturity Date Interest Terms and Rates Series 2005A 7/1/2035 Variable with daily pricing Series 2005B 7/1/2033 Variable with daily pricing Series 2011A 7/1/2021 Fixed at 5.0% Series 2011B 7/1/2033 Variable with daily pricing Series 2012 7/1/2020 Fixed at 1.7% Series 2014 7/1/2024 Fixed at 2.0% Series 2015 7/1/2045 Fixed at 3.8% Series 2016 7/1/2046 Fixed at 2.7% Series 2017A 7/1/2037 Fixed at 3.2% Series 2017B 7/1/2037 Fixed at 3.4%
Capital leasesOn April 30, 2004, USNH entered into a capital lease agreement in the amount of $18,292,000 to finance a portion of the costs of equipment housed in UNH’s utility cogeneration facility. The related lease payments are due quarterly through June 2025, including principal as well as interest at a fixed rate of 4.5%. The carrying value of the related equipment was $8,913,000 and $9,910,000 as of June 30, 2018 and 2017, respectively.
NHHEFA bonds Series 2005A $ 51,750 $ – $ (1,650) $ 50,100 $ – $ (1,900) $ 48,200 $ 1,950 Series 2005B 77,700 – (4,295) 73,405 – (4,450) 68,955 4,595 Series 2006B-2 1,500 – (1,500) – – – – – Series 2007 46,570 – – 46,570 – (46,570) – – Series 2009A 59,045 – – 59,045 – (59,045) – – Series 2011A 6,000 – – 6,000 – – 6,000 – Series 2011B 36,030 – (1,830) 34,200 – (1,925) 32,275 2,015 Series 2012 15,265 – (2,815) 12,450 – (2,930) 9,520 3,050 Series 2014 19,805 – (2,030) 17,775 – (2,070) 15,705 2,110 Series 2015 116,970 – (1,100) 115,870 – (2,610) 113,260 2,730 Series 2016 53,890 – – 53,890 – (1,675) 52,215 2,390 Series 2017A – – – – 53,805 – 53,805 – Series 2017B – – – – 49,020 – 49,020 1,100 Unamortized discounts/premiums, net 23,700 – (1,450) 22,250 10,085 (2,016) 30,319 1,915 Capital leases 10,774 149 (1,013) 9,910 71 (1,068) 8,913 1,113 Total bonds and leases $518,999 $149 $(17,683) $501,465 $112,981 $(126,259) $488,187 $22,968
Balance
June 30, 2016
Additions& OtherChanges Retirements
BalanceJune 30, 2017
Additions& OtherChanges Retirements
BalanceJune 30, 2018
CurrentPortion
2017 2018
8. Long-term debt USNH long-term debt activity, exclusive of deferred losses or gains on refunding, for the years ended June 30, 2018 and 2017 is summarized below ($ in thousands):
University System of New Hampshire I 45
The following presents the sensitivity of the postretirement medical plan liability to changes in the discount rate and healthcare cost trend rates ($ in thousands):
USNH also accrued $102,000 as of June 30, 2018 and 2017, for potential obligations related to postretirement care of certain USNH police personnel. The USNH Board of Trustees holds the authority to change these benefit plans at any time. Further information on the Additional Retirement Contribution, Operating Staff Retirement Plan, and Postretirement Medical Plan can be found in the required supplemental information on page 50 of the publication.
OPEB Liability as of December 31, 2017
Sensitivity to change in discount rate 1% increase Current rate 1% decrease $82,053 $89,710 $98,649
Sensitivity to change in health care costs 1% increase Current rate 1% decrease $98,193 $89,710 $82,302
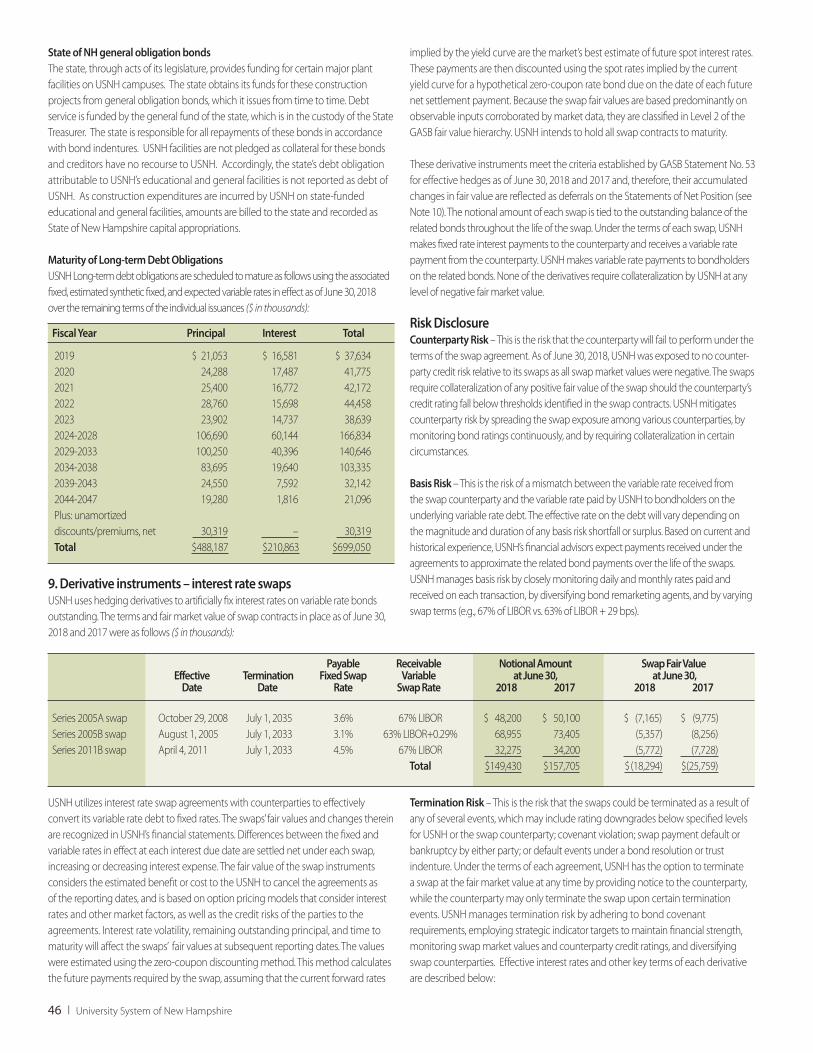
State of NH general obligation bondsThe state, through acts of its legislature, provides funding for certain major plant facilities on USNH campuses. The state obtains its funds for these construction projects from general obligation bonds, which it issues from time to time. Debt service is funded by the general fund of the state, which is in the custody of the State Treasurer. The state is responsible for all repayments of these bonds in accordance with bond indentures. USNH facilities are not pledged as collateral for these bonds and creditors have no recourse to USNH. Accordingly, the state’s debt obligation attributable to USNH’s educational and general facilities is not reported as debt of USNH. As construction expenditures are incurred by USNH on state-funded educational and general facilities, amounts are billed to the state and recorded as State of New Hampshire capital appropriations. Maturity of Long-term Debt ObligationsUSNH Long-term debt obligations are scheduled to mature as follows using the associated fixed, estimated synthetic fixed, and expected variable rates in effect as of June 30, 2018 over the remaining terms of the individual issuances ($ in thousands):
Fiscal Year Principal Interest Total
2019 $ 21,053 $ 16,581 $ 37,634 2020 24,288 17,487 41,775 2021 25,400 16,772 42,172 2022 28,760 15,698 44,458 2023 23,902 14,737 38,639 2024-2028 106,690 60,144 166,834 2029-2033 100,250 40,396 140,646 2034-2038 83,695 19,640 103,335 2039-2043 24,550 7,592 32,142 2044-2047 19,280 1,816 21,096 Plus: unamortized discounts/premiums, net 30,319 – 30,319 Total $488,187 $210,863 $699,050
9. Derivative instruments – interest rate swaps USNH uses hedging derivatives to artificially fix interest rates on variable rate bonds outstanding. The terms and fair market value of swap contracts in place as of June 30, 2018 and 2017 were as follows ($ in thousands):
USNH utilizes interest rate swap agreements with counterparties to effectively convert its variable rate debt to fixed rates. The swaps’ fair values and changes therein are recognized in USNH’s financial statements. Differences between the fixed and variable rates in effect at each interest due date are settled net under each swap, increasing or decreasing interest expense. The fair value of the swap instruments considers the estimated benefit or cost to the USNH to cancel the agreements as of the reporting dates, and is based on option pricing models that consider interest rates and other market factors, as well as the credit risks of the parties to the agreements. Interest rate volatility, remaining outstanding principal, and time to maturity will affect the swaps’ fair values at subsequent reporting dates. The values were estimated using the zero-coupon discounting method. This method calculates the future payments required by the swap, assuming that the current forward rates
implied by the yield curve are the market’s best estimate of future spot interest rates. These payments are then discounted using the spot rates implied by the current yield curve for a hypothetical zero-coupon rate bond due on the date of each future net settlement payment. Because the swap fair values are based predominantly on observable inputs corroborated by market data, they are classified in Level 2 of the GASB fair value hierarchy. USNH intends to hold all swap contracts to maturity.
These derivative instruments meet the criteria established by GASB Statement No. 53 for effective hedges as of June 30, 2018 and 2017 and, therefore, their accumulated changes in fair value are reflected as deferrals on the Statements of Net Position (see Note 10). The notional amount of each swap is tied to the outstanding balance of the related bonds throughout the life of the swap. Under the terms of each swap, USNH makes fixed rate interest payments to the counterparty and receives a variable rate payment from the counterparty. USNH makes variable rate payments to bondholders on the related bonds. None of the derivatives require collateralization by USNH at any level of negative fair market value.
Risk DisclosureCounterparty Risk – This is the risk that the counterparty will fail to perform under the terms of the swap agreement. As of June 30, 2018, USNH was exposed to no counter-party credit risk relative to its swaps as all swap market values were negative. The swaps require collateralization of any positive fair value of the swap should the counterparty’s credit rating fall below thresholds identified in the swap contracts. USNH mitigates counterparty risk by spreading the swap exposure among various counterparties, by monitoring bond ratings continuously, and by requiring collateralization in certain circumstances.
Basis Risk – This is the risk of a mismatch between the variable rate received from the swap counterparty and the variable rate paid by USNH to bondholders on the underlying variable rate debt. The effective rate on the debt will vary depending on the magnitude and duration of any basis risk shortfall or surplus. Based on current and historical experience, USNH’s financial advisors expect payments received under the agreements to approximate the related bond payments over the life of the swaps. USNH manages basis risk by closely monitoring daily and monthly rates paid and received on each transaction, by diversifying bond remarketing agents, and by varying swap terms (e.g., 67% of LIBOR vs. 63% of LIBOR + 29 bps).
Termination Risk – This is the risk that the swaps could be terminated as a result of any of several events, which may include rating downgrades below specified levels for USNH or the swap counterparty; covenant violation; swap payment default or bankruptcy by either party; or default events under a bond resolution or trust indenture. Under the terms of each agreement, USNH has the option to terminate a swap at the fair market value at any time by providing notice to the counterparty, while the counterparty may only terminate the swap upon certain termination events. USNH manages termination risk by adhering to bond covenant requirements, employing strategic indicator targets to maintain financial strength, monitoring swap market values and counterparty credit ratings, and diversifying swap counterparties. Effective interest rates and other key terms of each derivative are described below:
Series 2005A swap October 29, 2008 July 1, 2035 3.6% 67% LIBOR $ 48,200 $ 50,100 $ (7,165) $ (9,775) Series 2005B swap August 1, 2005 July 1, 2033 3.1% 63% LIBOR+0.29% 68,955 73,405 (5,357) (8,256) Series 2011B swap April 4, 2011 July 1, 2033 4.5% 67% LIBOR 32,275 34,200 (5,772) (7,728) Total $149,430 $157,705 $ (18,294) $(25,759)
Effective
Date Termination
Date
PayableFixed Swap
Rate
ReceivableVariable
Swap Rate
Notional Amountat June 30,
2018 2017
Swap Fair Value at June 30,
2018 2017
46 I University System of New Hampshire
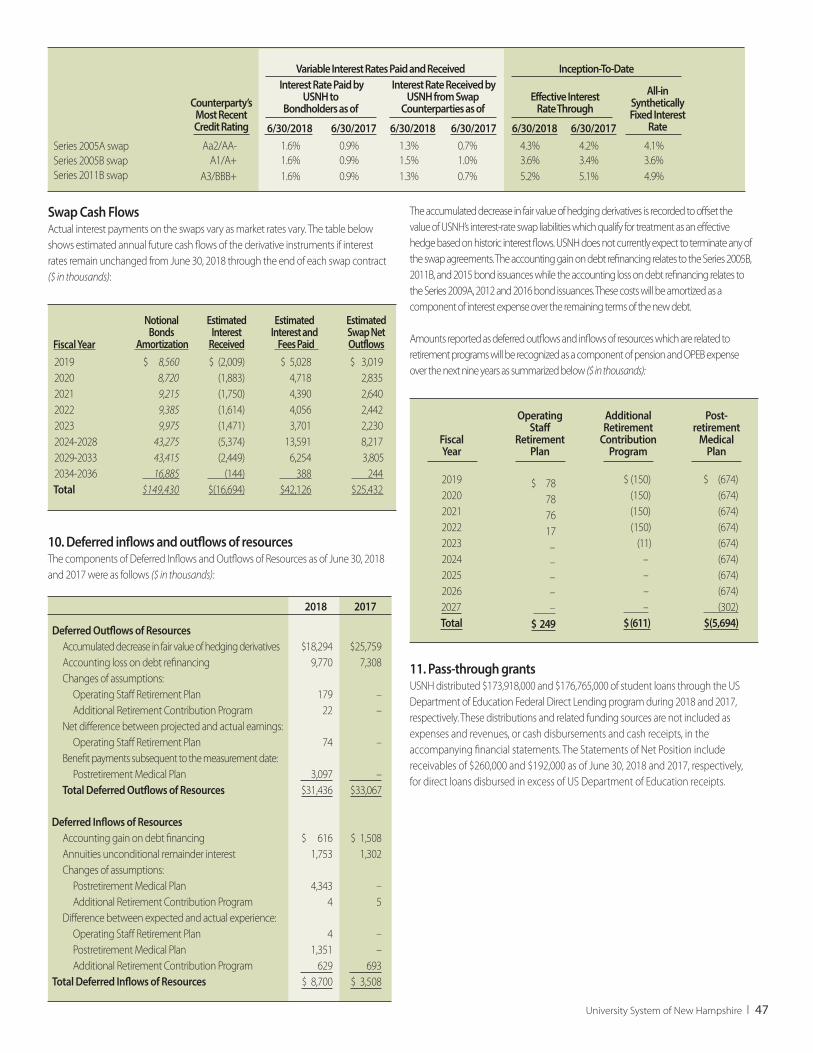
Swap Cash FlowsActual interest payments on the swaps vary as market rates vary. The table below shows estimated annual future cash flows of the derivative instruments if interest rates remain unchanged from June 30, 2018 through the end of each swap contract ($ in thousands):
2019 $ 8,560 $ (2,009) $ 5,028 $ 3,019 2020 8,720 (1,883) 4,718 2,835 2021 9,215 (1,750) 4,390 2,640 2022 9,385 (1,614) 4,056 2,442 2023 9,975 (1,471) 3,701 2,230 2024-2028 43,275 (5,374) 13,591 8,217 2029-2033 43,415 (2,449) 6,254 3,805 2034-2036 16,885 (144) 388 244 Total $149,430 $(16,694) $42,126 $25,432
10. Deferred inflows and outflows of resourcesThe components of Deferred Inflows and Outflows of Resources as of June 30, 2018 and 2017 were as follows ($ in thousands):
2018 2017
Deferred Outflows of Resources Accumulated decrease in fair value of hedging derivatives $18,294 $25,759 Accounting loss on debt refinancing 9,770 7,308 Changes of assumptions: Operating Staff Retirement Plan 179 – Additional Retirement Contribution Program 22 – Net difference between projected and actual earnings: Operating Staff Retirement Plan 74 – Benefit payments subsequent to the measurement date: Postretirement Medical Plan 3,097 – Total Deferred Outflows of Resources $31,436 $33,067 Deferred Inflows of Resources Accounting gain on debt financing $ 616 $ 1,508 Annuities unconditional remainder interest 1,753 1,302 Changes of assumptions: Postretirement Medical Plan 4,343 – Additional Retirement Contribution Program 4 5 Difference between expected and actual experience: Operating Staff Retirement Plan 4 – Postretirement Medical Plan 1,351 – Additional Retirement Contribution Program 629 693 Total Deferred Inflows of Resources $ 8,700 $ 3,508
The accumulated decrease in fair value of hedging derivatives is recorded to offset the value of USNH’s interest-rate swap liabilities which qualify for treatment as an effective hedge based on historic interest flows. USNH does not currently expect to terminate any of the swap agreements. The accounting gain on debt refinancing relates to the Series 2005B, 2011B, and 2015 bond issuances while the accounting loss on debt refinancing relates to the Series 2009A, 2012 and 2016 bond issuances. These costs will be amortized as a component of interest expense over the remaining terms of the new debt. Amounts reported as deferred outflows and inflows of resources which are related to retirement programs will be recognized as a component of pension and OPEB expense over the next nine years as summarized below ($ in thousands):
11. Pass-through grantsUSNH distributed $173,918,000 and $176,765,000 of student loans through the US Department of Education Federal Direct Lending program during 2018 and 2017, respectively. These distributions and related funding sources are not included as expenses and revenues, or cash disbursements and cash receipts, in the accompanying financial statements. The Statements of Net Position include receivables of $260,000 and $192,000 as of June 30, 2018 and 2017, respectively, for direct loans disbursed in excess of US Department of Education receipts.
Fiscal Year
NotionalBonds
Amortization
EstimatedInterest
Received
Estimated Interest and Fees Paid
Estimated Swap NetOutflows
6/30/2018 6/30/2017 6/30/2018 6/30/2017 6/30/2018 6/30/2017 Aa2/AA- 1.6% 0.9% 1.3% 0.7% 4.3% 4.2% 4.1% A1/A+ 1.6% 0.9% 1.5% 1.0% 3.6% 3.4% 3.6% A3/BBB+ 1.6% 0.9% 1.3% 0.7% 5.2% 5.1% 4.9%
Interest Rate Paid byUSNH to
Bondholders as of
Interest Rate Received byUSNH from Swap
Counterparties as ofEffective Interest
Rate ThroughAll-in
SyntheticallyFixed Interest
Rate
Counterparty’sMost RecentCredit Rating
Variable Interest Rates Paid and Received Inception-To-Date
Series 2005A swapSeries 2005B swapSeries 2011B swap
University System of New Hampshire I 47
FiscalYear
20192020202120222023202420252026
2027 Total
Operating Staff
Retirement Plan
$ 78 78 76 17 – – – – – $ 249
Additional Retirement
Contribution Program
$ (150) (150) (150) (150) (11) – – – – $ (611)
Post-retirement
Medical Plan
$ (674) (674) (674) (674) (674) (674) (674) (674) (302) $(5,694)
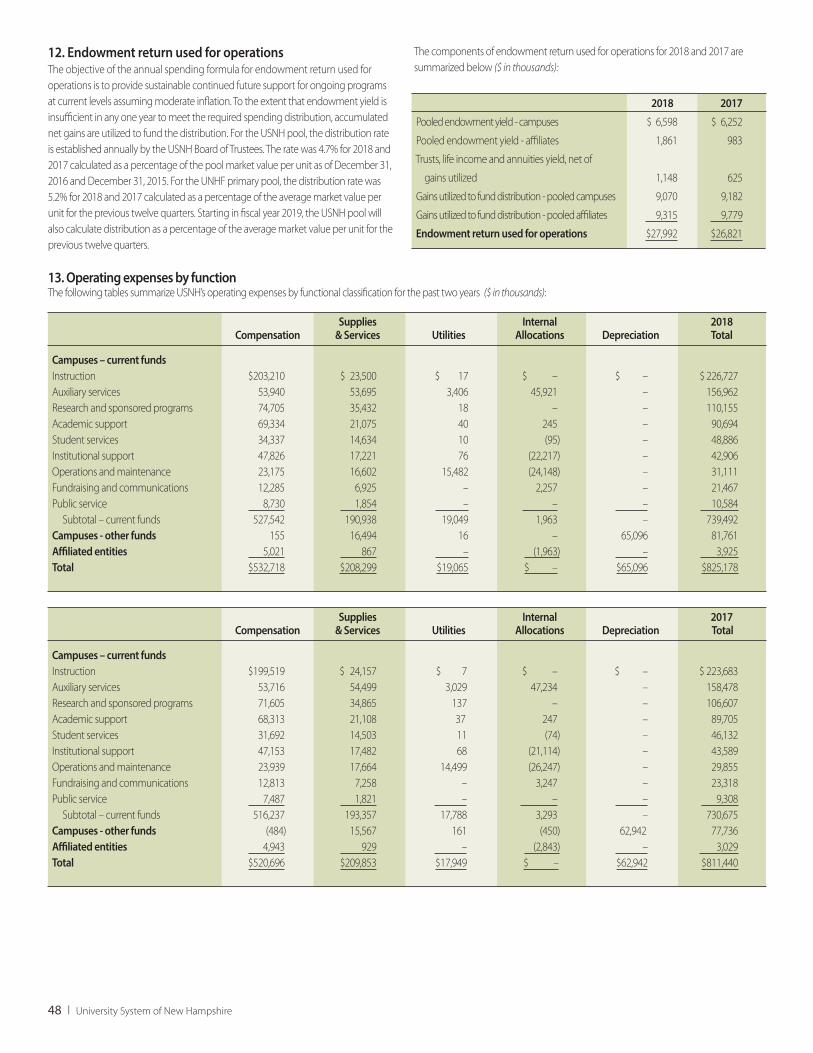
13. Operating expenses by function The following tables summarize USNH’s operating expenses by functional classification for the past two years ($ in thousands):
Campuses – current funds Instruction $199,519 $ 24,157 $ 7 $ – $ – $ 223,683 Auxiliary services 53,716 54,499 3,029 47,234 – 158,478 Research and sponsored programs 71,605 34,865 137 – – 106,607 Academic support 68,313 21,108 37 247 – 89,705 Student services 31,692 14,503 11 (74) – 46,132 Institutional support 47,153 17,482 68 (21,114) – 43,589 Operations and maintenance 23,939 17,664 14,499 (26,247) – 29,855 Fundraising and communications 12,813 7,258 – 3,247 – 23,318 Public service 7,487 1,821 – – – 9,308 Subtotal – current funds 516,237 193,357 17,788 3,293 – 730,675 Campuses - other funds (484) 15,567 161 (450) 62,942 77,736 Affiliated entities 4,943 929 – (2,843) – 3,029 Total $520,696 $209,853 $17,949 $ – $62,942 $811,440
CompensationSupplies
& Services UtilitiesInternal
Allocations Depreciation2017 Total
48 I University System of New Hampshire
Campuses – current funds Instruction $203,210 $ 23,500 $ 17 $ – $ – $ 226,727 Auxiliary services 53,940 53,695 3,406 45,921 – 156,962 Research and sponsored programs 74,705 35,432 18 – – 110,155 Academic support 69,334 21,075 40 245 – 90,694 Student services 34,337 14,634 10 (95) – 48,886 Institutional support 47,826 17,221 76 (22,217) – 42,906 Operations and maintenance 23,175 16,602 15,482 (24,148) – 31,111 Fundraising and communications 12,285 6,925 – 2,257 – 21,467 Public service 8,730 1,854 – – – 10,584 Subtotal – current funds 527,542 190,938 19,049 1,963 – 739,492 Campuses - other funds 155 16,494 16 – 65,096 81,761 Affiliated entities 5,021 867 – (1,963) – 3,925 Total $532,718 $208,299 $19,065 $ – $65,096 $825,178
CompensationSupplies
& Services UtilitiesInternal
Allocations Depreciation2018 Total
12. Endowment return used for operationsThe objective of the annual spending formula for endowment return used for operations is to provide sustainable continued future support for ongoing programs at current levels assuming moderate inflation. To the extent that endowment yield is insufficient in any one year to meet the required spending distribution, accumulated net gains are utilized to fund the distribution. For the USNH pool, the distribution rate is established annually by the USNH Board of Trustees. The rate was 4.7% for 2018 and 2017 calculated as a percentage of the pool market value per unit as of December 31, 2016 and December 31, 2015. For the UNHF primary pool, the distribution rate was 5.2% for 2018 and 2017 calculated as a percentage of the average market value per unit for the previous twelve quarters. Starting in fiscal year 2019, the USNH pool will also calculate distribution as a percentage of the average market value per unit for the previous twelve quarters.
The components of endowment return used for operations for 2018 and 2017 are summarized below ($ in thousands):
2018 2017
Pooled endowment yield - campuses $ 6,598 $ 6,252
Pooled endowment yield - affiliates 1,861 983
Trusts, life income and annuities yield, net of
gains utilized 1,148 625
Gains utilized to fund distribution - pooled campuses 9,070 9,182
Gains utilized to fund distribution - pooled affiliates 9,315 9,779
Endowment return used for operations $27,992 $26,821
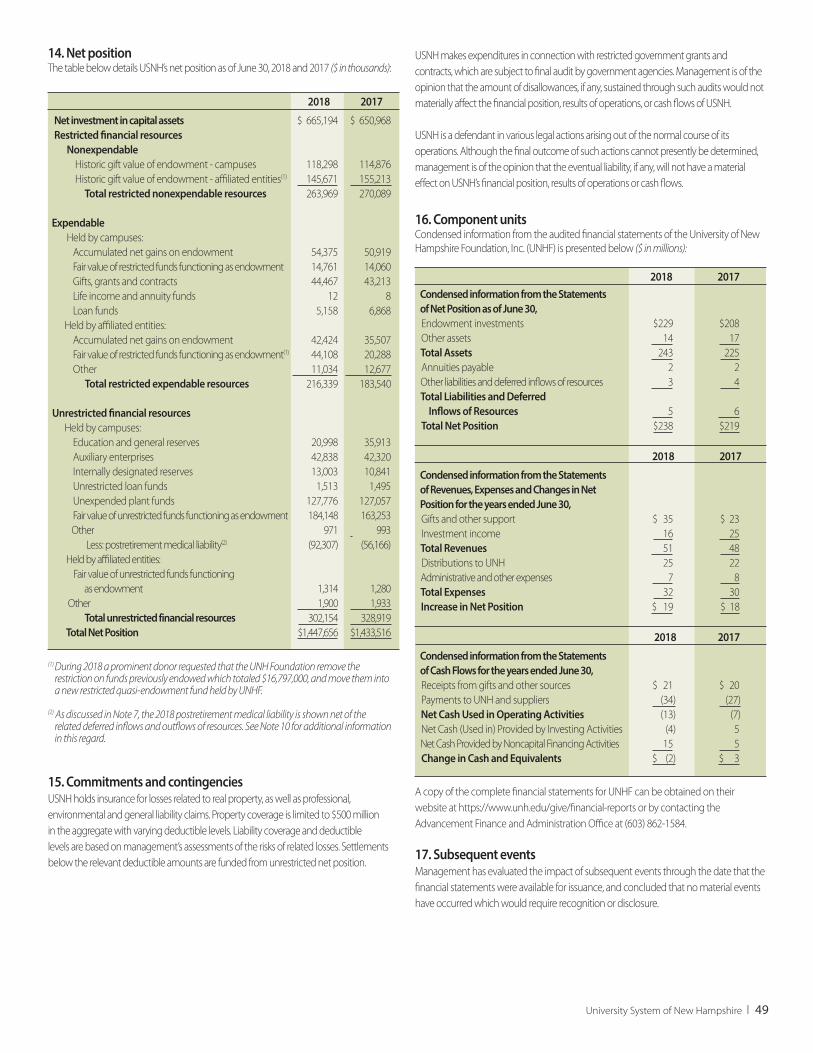
14. Net position The table below details USNH’s net position as of June 30, 2018 and 2017 ($ in thousands):
2018 2017
Net investment in capital assets $ 665,194 $ 650,968 Restricted financial resources Nonexpendable Historic gift value of endowment - campuses 118,298 114,876 Historic gift value of endowment - affiliated entities(1) 145,671 155,213 Total restricted nonexpendable resources 263,969 270,089
Expendable Held by campuses: Accumulated net gains on endowment 54,375 50,919 Fair value of restricted funds functioning as endowment 14,761 14,060 Gifts, grants and contracts 44,467 43,213 Life income and annuity funds 12 8 Loan funds 5,158 6,868 Held by affiliated entities: Accumulated net gains on endowment 42,424 35,507 Fair value of restricted funds functioning as endowment(1) 44,108 20,288
Other 11,034 12,677 Total restricted expendable resources 216,339 183,540
Unrestricted financial resources Held by campuses: Education and general reserves 20,998 35,913 Auxiliary enterprises 42,838 42,320 Internally designated reserves 13,003 10,841 Unrestricted loan funds 1,513 1,495 Unexpended plant funds 127,776 127,057 Fair value of unrestricted funds functioning as endowment 184,148 163,253 Other 971 993 Less: postretirement medical liability(2) (92,307) (56,166) Held by affiliated entities: Fair value of unrestricted funds functioning as endowment 1,314 1,280 Other 1,900 1,933 Total unrestricted financial resources 302,154 328,919 Total Net Position $1,447,656 $1,433,516
(1) During 2018 a prominent donor requested that the UNH Foundation remove the restriction on funds previously endowed which totaled $16,797,000, and move them into a new restricted quasi-endowment fund held by UNHF.
(2) As discussed in Note 7, the 2018 postretirement medical liability is shown net of the related deferred inflows and outflows of resources. See Note 10 for additional information in this regard.
15. Commitments and contingencies USNH holds insurance for losses related to real property, as well as professional, environmental and general liability claims. Property coverage is limited to $500 million in the aggregate with varying deductible levels. Liability coverage and deductible levels are based on management’s assessments of the risks of related losses. Settlements below the relevant deductible amounts are funded from unrestricted net position.
USNH makes expenditures in connection with restricted government grants and contracts, which are subject to final audit by government agencies. Management is of the opinion that the amount of disallowances, if any, sustained through such audits would not materially affect the financial position, results of operations, or cash flows of USNH.
USNH is a defendant in various legal actions arising out of the normal course of its operations. Although the final outcome of such actions cannot presently be determined, management is of the opinion that the eventual liability, if any, will not have a material effect on USNH’s financial position, results of operations or cash flows.
16. Component units Condensed information from the audited financial statements of the University of New Hampshire Foundation, Inc. (UNHF) is presented below ($ in millions):
2018 2017 Condensed information from the Statements of Net Position as of June 30, Endowment investments $229 $208 Other assets 14 17 Total Assets 243 225 Annuities payable 2 2 Other liabilities and deferred inflows of resources 3 4 Total Liabilities and Deferred Inflows of Resources 5 6 Total Net Position $238 $219
2018 2017
Condensed information from the Statements of Revenues, Expenses and Changes in Net Position for the years ended June 30, Gifts and other support $ 35 $ 23 Investment income 16 25 Total Revenues 51 48 Distributions to UNH 25 22 Administrative and other expenses 7 8 Total Expenses 32 30 Increase in Net Position $ 19 $ 18
2018 2017
Condensed information from the Statements of Cash Flows for the years ended June 30, Receipts from gifts and other sources $ 21 $ 20 Payments to UNH and suppliers (34) (27) Net Cash Used in Operating Activities (13) (7) Net Cash (Used in) Provided by Investing Activities (4) 5 Net Cash Provided by Noncapital Financing Activities 15 5 Change in Cash and Equivalents $ (2) $ 3
A copy of the complete financial statements for UNHF can be obtained on their website at https://www.unh.edu/give/financial-reports or by contacting the Advancement Finance and Administration Office at (603) 862-1584.
17. Subsequent events Management has evaluated the impact of subsequent events through the date that the financial statements were available for issuance, and concluded that no material events have occurred which would require recognition or disclosure.
University System of New Hampshire I 49
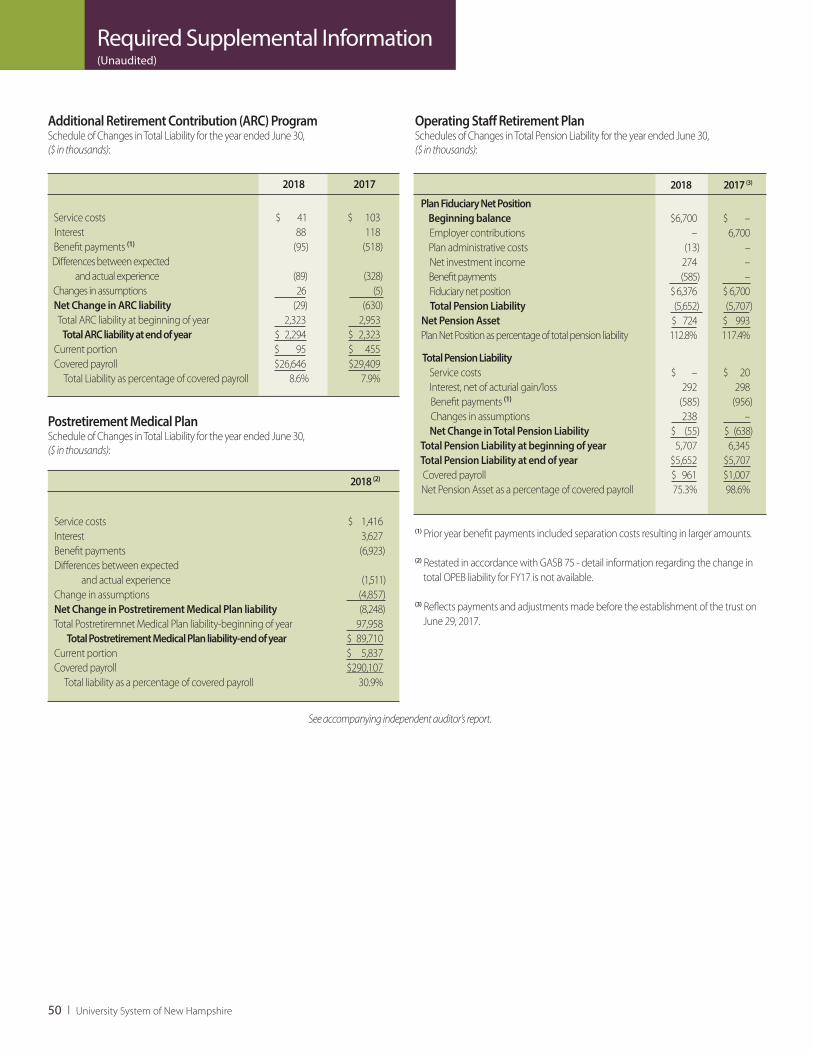
Additional Retirement Contribution (ARC) Program Schedule of Changes in Total Liability for the year ended June 30, ($ in thousands):
2018 2017
Service costs $ 41 $ 103 Interest 88 118 Benefit payments (1) (95) (518) Differences between expected and actual experience (89) (328) Changes in assumptions 26 (5) Net Change in ARC liability (29) (630) Total ARC liability at beginning of year 2,323 2,953 Total ARC liability at end of year $ 2,294 $ 2,323 Current portion $ 95 $ 455 Covered payroll $26,646 $29,409 Total Liability as percentage of covered payroll 8.6% 7.9% Postretirement Medical Plan Schedule of Changes in Total Liability for the year ended June 30, ($ in thousands):
2018 (2)
Service costs $ 1,416 Interest 3,627 Benefit payments (6,923) Differences between expected and actual experience (1,511) Change in assumptions (4,857) Net Change in Postretirement Medical Plan liability (8,248) Total Postretiremnet Medical Plan liability-beginning of year 97,958 Total Postretirement Medical Plan liability-end of year $ 89,710 Current portion $ 5,837 Covered payroll $290,107 Total liability as a percentage of covered payroll 30.9%
Operating Staff Retirement Plan Schedules of Changes in Total Pension Liability for the year ended June 30,($ in thousands):
2018 2017 (3)
Plan Fiduciary Net Position Beginning balance $6,700 $ – Employer contributions – 6,700 Plan administrative costs (13) – Net investment income 274 – Benefit payments (585) – Fiduciary net position $ 6,376 $ 6,700 Total Pension Liability (5,652) (5,707) Net Pension Asset $ 724 $ 993 Plan Net Position as percentage of total pension liability 112.8% 117.4%
Total Pension Liability Service costs $ – $ 20 Interest, net of acturial gain/loss 292 298 Benefit payments (1) (585) (956) Changes in assumptions 238 – Net Change in Total Pension Liability $ (55) $ (638) Total Pension Liability at beginning of year 5,707 6,345 Total Pension Liability at end of year $5,652 $5,707 Covered payroll $ 961 $1,007 Net Pension Asset as a percentage of covered payroll 75.3% 98.6%
(1) Prior year benefit payments included separation costs resulting in larger amounts.
(2) Restated in accordance with GASB 75 - detail information regarding the change in total OPEB liability for FY17 is not available. (3) Reflects payments and adjustments made before the establishment of the trust on June 29, 2017.
Required Supplemental Information (Unaudited)
See accompanying independent auditor’s report.
50 I University System of New Hampshire
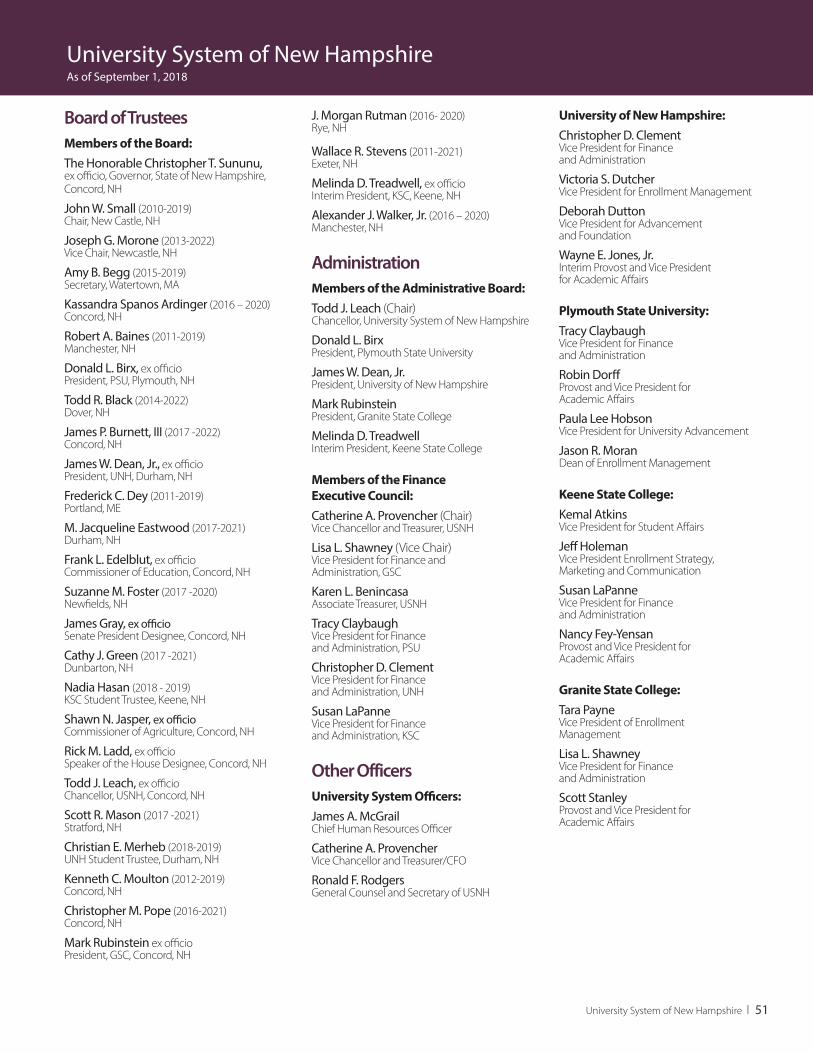
Board of Trustees Members of the Board:The Honorable Christopher T. Sununu, ex officio, Governor, State of New Hampshire, Concord, NH
John W. Small (2010-2019)Chair, New Castle, NH
Joseph G. Morone (2013-2022) Vice Chair, Newcastle, NH
Amy B. Begg (2015-2019)Secretary, Watertown, MA
Kassandra Spanos Ardinger (2016 – 2020)Concord, NH
Robert A. Baines (2011-2019)Manchester, NH
Donald L. Birx, ex officioPresident, PSU, Plymouth, NH
Todd R. Black (2014-2022)Dover, NH
James P. Burnett, III (2017 -2022)Concord, NH
James W. Dean, Jr., ex officioPresident, UNH, Durham, NH
Frederick C. Dey (2011-2019)Portland, ME
M. Jacqueline Eastwood (2017-2021) Durham, NH
Frank L. Edelblut, ex officioCommissioner of Education, Concord, NH
Suzanne M. Foster (2017 -2020)Newfields, NH
James Gray, ex officioSenate President Designee, Concord, NH
Cathy J. Green (2017 -2021)Dunbarton, NH
Nadia Hasan (2018 - 2019)KSC Student Trustee, Keene, NH
Shawn N. Jasper, ex officioCommissioner of Agriculture, Concord, NH
Rick M. Ladd, ex officioSpeaker of the House Designee, Concord, NH
Todd J. Leach, ex officioChancellor, USNH, Concord, NH
Scott R. Mason (2017 -2021)Stratford, NH
Christian E. Merheb (2018-2019)UNH Student Trustee, Durham, NH
Kenneth C. Moulton (2012-2019)Concord, NH
Christopher M. Pope (2016-2021)Concord, NH
Mark Rubinstein ex officioPresident, GSC, Concord, NH
J. Morgan Rutman (2016- 2020)Rye, NH
Wallace R. Stevens (2011-2021)Exeter, NH
Melinda D. Treadwell, ex officioInterim President, KSC, Keene, NH
Alexander J. Walker, Jr. (2016 – 2020)Manchester, NH
Administration Members of the Administrative Board:Todd J. Leach (Chair)Chancellor, University System of New Hampshire
Donald L. BirxPresident, Plymouth State University
James W. Dean, Jr.President, University of New Hampshire
Mark RubinsteinPresident, Granite State College Melinda D. TreadwellInterim President, Keene State College
Members of the Finance Executive Council:Catherine A. Provencher (Chair)Vice Chancellor and Treasurer, USNH Lisa L. Shawney (Vice Chair)Vice President for Finance and Administration, GSC Karen L. BenincasaAssociate Treasurer, USNH Tracy ClaybaughVice President for Finance and Administration, PSU Christopher D. ClementVice President for Finance and Administration, UNH
Susan LaPanneVice President for Finance and Administration, KSC
Other Officers University System Officers:James A. McGrailChief Human Resources Officer
Catherine A. ProvencherVice Chancellor and Treasurer/CFO
Ronald F. RodgersGeneral Counsel and Secretary of USNH
University of New Hampshire:Christopher D. ClementVice President for Finance and Administration
Victoria S. DutcherVice President for Enrollment Management
Deborah DuttonVice President for Advancement and Foundation
Wayne E. Jones, Jr. Interim Provost and Vice President for Academic Affairs
Plymouth State University:Tracy ClaybaughVice President for Finance and Administration
Robin DorffProvost and Vice President for Academic Affairs
Paula Lee HobsonVice President for University Advancement
Jason R. Moran Dean of Enrollment Management
Keene State College:Kemal AtkinsVice President for Student Affairs
Jeff HolemanVice President Enrollment Strategy, Marketing and Communication
Susan LaPanneVice President for Finance and Administration
Nancy Fey-YensanProvost and Vice President for Academic Affairs
Granite State College:Tara PayneVice President of Enrollment Management
Lisa L. ShawneyVice President for Finance and Administration
Scott StanleyProvost and Vice President for Academic Affairs
University System of New Hampshire As of September 1, 2018
University System of New Hampshire I 51

5 Chenell Drive, Suite 301, Concord, NH 03301 603-862-1800 www.usnh.edu