Embed Size (px)
Citation preview
THE PLANT STRESS HYPOTHESIS AND VARIABLE
RESPONSES BY BLUE GRAMA GRASS
(Bouteloua gracilis) TO WATER,
MINERAL NITROGEN, AND
INSECT HERBIVORY
ANTHONY JOERN1,* and SIMON MOLE2,3
1Division of Biology, Kansas State University, Manhattan, KS 66506, USA2School of Biological Sciences, University of Nebraska-Lincoln, Lincoln,
NE 68588-0118, USA
(Received January 3, 2005; revised May 9, 2005; accepted May 17, 2005)
Abstract—Acting simultaneously or sequentially, plants encounter multiple
stresses from combined abiotic and biotic factors that result in decreased
growth and internal reallocation of resources. The plant stress hypothesis
predicts that environmental stresses on plants decrease plant resistance to
insect herbivory by altering biochemical sourceYsink relationships and foliar
chemistry, leading to more palatable food. Such changes in the nutritional
landscape for insects may facilitate insect population outbreaks during periods
of moderate stress on host plants. We examined the plant stress hypothesis
with field experiments in continental grassland (USA) using the C4 grass
Bouteloua gracilis. Water, nitrogen fertilizer, and herbivory from the grass-
feeding grasshopper Ageneotettix deorum were manipulated. Combined
stresses from water and mineral-N in the soil decreased plant growth and
altered foliar percent total N (TN) and percent total nonstructural carbohy-
drate (TNC) concentrations in an additive fashion. Grasshopper herbivory
affected final biomass only in dry years; plants compensated for tissue loss
when rainfall was abundant. Foliar TN and TNC concentrations were dynamic
with respect to variable climatic conditions and treatment combinations,
showing significant interactions. Grasshopper herbivory had its greatest
impact on TN or TNC in dry years, interacting with other forms of stress.
Herbivory as a single factor had strong effects on TNC in years with normal
precipitation, but not in a dry year. Performance (developmental rate and
0098-0331/05/0900-2069/0 # 2005 Springer Science + Business Media, Inc.
2069
Journal of Chemical Ecology, Vol. 31, No. 9, September 2005 (#2005)
DOI: 10.1007/s10886-005-6078-3
* To whom correspondence should be addressed. E-mail: [email protected] Current address: Boulder, CO, USA.
survival) by the grasshoppers Phoetaliotes nebrascensis and A. deorum were
not greatly affected by plant stress in a manner consistent with the plant stress
hypothesis.
Key WordsVChewing insects, environmental stress hypothesis, functional-
convergence-to-plant-stress hypothesis, grasshopper, insect herbivory, total
foliar nitrogen, total nonstructural carbohydrates.
INTRODUCTION
Dynamic biochemical, physiological, and morphological responses by plants to
environmental conditions are integrated at organ and whole-plant levels through
a variety of sourceYsink relationships (Mooney and Chiariello, 1984; Bazzaz
and Grace, 1997). The plant stress hypothesis states that environmental stresses
on plants decrease plant resistance to insect herbivory by altering whole-plant
sourceYsink resource allocation schedules and foliar chemistry, thus changing
food palatability (Rhoades, 1983; Mattson and Haack, 1987; Louda and
Collinge, 1992; White, 1993; Redak and Capinera, 1994; Koricheva et al.,
1998; Huberty and Denno, 2004). Plant resource acquisition (light, water,
carbon, elemental nutrients), internal resource allocation among tissues
(sourceYsink relationships, translocation products), and partitioning of resources
to different plant functions (growth, maintenance, reproduction, repair, defense,
senescence) ultimately prescribe the nature and distribution of nutritional
constituents within plants to herbivores (Mooney and Gilman, 1982; Bazzaz
et al., 1987; Chapin et al., 1987; Mooney et al., 1991; Aerts and Chapin,
2000)Voften considered growth optimization processes (Mooney and Winner,
1991). Variation in water and soil nutrient availability coupled to herbivory may
cause unpredictable levels of stress that alters plant metabolism in response to
the action of one or all factors with consequences for plant growth (Trlica and
Cook, 1971; Bokhari, 1978; Mooney et al., 1991; Louda and Collinge, 1992).
The plant stress hypothesis was proposed as an environmentally deter-
mined explanation for outbreaks of insect herbivores operating through plant
condition (Rhoades, 1983; Waring and Cobb, 1992; Watt, 1992; Koricheva
et al., 1998), in which improved nutritional quality of host plants experiencing
intermediate levels of stress resulted in increased demographic performance by
herbivores. Rhoades (1983) extended the hypothesis to also include reduced
production of chemical defenses under stress conditions in addition to elevated
nutritional quality. Experimental tests of the plant stress hypothesis for forest
insects provide little general support of the hypothesis (Rhoades, 1983; Waring
and Cobb, 1992; Watt, 1992; Koricheva et al., 1998). Although some insect
feeding guilds (e.g., boring and sucking feeders) responded as predicted in
experimental tests in woody plants, other groups including chewing insects did
2070 JOERN AND MOLE
not generally respond to plant stress as predicted (Waring and Cobb, 1992;
Watt, 1992; Koricheva et al., 1998; Huberty and Denno, 2004). However, about
67% of the examples are consistent with predictions (Waring and Cobb, 1992)
in observational studies of trees along environmental stress gradients, although
alternate explanations exist (Watt, 1992). Although this system may be
prototypical for the action of the plant stress hypothesis, few tests with grasses
exist (Waring and Cobb, 1992; Redak and Capinera, 1994).
We seek to clarify the nature of interactions among multiple stresses as
they impact growth and variable leaf chemistry in blue grama grass, Bouteloua
gracilis (H.B.K.) Lag. ex Griffiths, according to predictions of the plant stress
hypothesis. B. gracilis is a dominant C4 grass species in western North
American (USA) grasslands. Two primary predictions of the plant stress
hypothesis were examined in the short grass B. gracilis experiencing naturally
occurring and variable abiotic conditions: (1) reduced water or soil nitrogen
levels coupled to insect herbivory will negatively affect plant growth and
increase the palatability of tissues to insect herbivores, (2) chewing insect
herbivores will perform better on stressed host plants with higher concentrations
of primary nutrients (protein and carbohydrate). In addition, we examined the
relative contribution to responses of stresses when combined under field
conditions. We examined direct effects and interactions among three common
forms of stress to B. gracilis: water availability, plant nutrient availability, and
grasshopper herbivory within natural levels in the field. Experiments repeated
over 3 years included a wide range of weather conditions against which to
gauge plant responses. We expected that the imposition of moderate water or
nutrient stress should modify plant physiology in such a way that resistance to
herbivores decreases, with a concomitant increase in availability of primary
nutrients in leaves to herbivores. As food plant palatability increases following
moderate stress to B. gracilis, performance by the grass-feeding grasshoppers
Ageneotettix deorum (Scudder) and Phoetaliotes nebrascensis Thomas should
be enhanced as levels of primary nutrients in leaf tissues, especially protein and
carbohydrates, increase. B. gracilis does not produce allelochemicals that are
expected to influence responses to primary nutrients by herbivores in this
experiment (Mole and Joern, 1994), allowing us to restrict our attention to the
nutritional component of the problem.
METHODS AND MATERIALS
Study System. We conducted field experiments at Arapaho Prairie (Arthur
County, NE, USA), a protected research site in Nebraska sandhills grassland.
The site is characterized by upland sandhills grassland composed of large
stabilized sand dunes with steep upper ridges that gradually slope into broad flat
2071PLANT STRESS HYPOTHESIS
valleys. Most plants at Arapaho Prairie experience at least some water and
nutrient stress in most years (Barnes, 1985; Mole et al., 1994).
Vegetation at Arapaho Prairie is an open-canopy mixed-prairie, modified by
sandy substrate (Barnes, 1985). Grasses contribute 80% to total plant biomass,
with long-term NAPP ranging between 75 and 250 g mj2 (unpublished data). C3
and C4 grass species typical of eastern tallgrass prairie and western shortgrass
steppe grasslands intermingle at the site. Dominant plants in this sand dune land-
scape form loose but recognizable vegetation associations along the existing
topographic gradient (Barnes, 1985). The grass canopy is intermingled with ex-
tensive bare ground, largely because of extensive disturbance from pocket gophers.
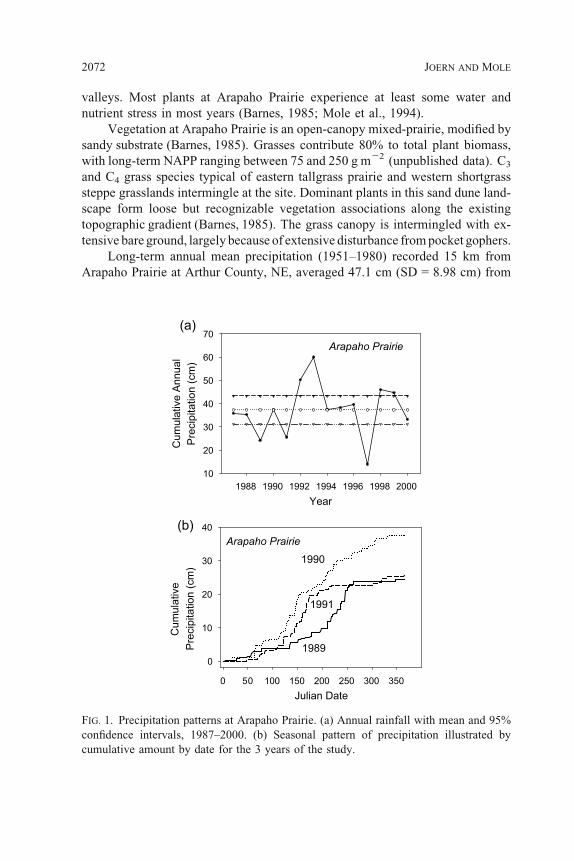
Long-term annual mean precipitation (1951Y1980) recorded 15 km from
Arapaho Prairie at Arthur County, NE, averaged 47.1 cm (SD = 8.98 cm) from
FIG. 1. Precipitation patterns at Arapaho Prairie. (a) Annual rainfall with mean and 95%
confidence intervals, 1987Y2000. (b) Seasonal pattern of precipitation illustrated by
cumulative amount by date for the 3 years of the study.
2072 JOERN AND MOLE
US Weather Bureau records; the recent 14-year record from Arapaho Prairie
(1987Y2000) averaged 37.3 cm (SD = 11.4 cm). The amount and timing of
precipitation at Arapaho Prairie varies greatly among years (Figure 1). Below-
average precipitation was observed in two of the three years of this study
(Figure 1a), with rainfall in 1990 equaling the average amount for the site.
Perhaps more importantly, the seasonal timing of rainfall over the growing
season differs in important ways among years (Figure 1b). Both 1989 and 1991
received approximately the same amount of precipitation, but rain fell early in
the season in 1991 compared with late-season rainfall in 1989. In 1990, rainfall
occurred throughout the growing season, compared with 1989 and 1991, each of
which experienced large periods without significant amounts of rain.
Arapaho Prairie soils contain 80Y85% sand with low nutrient concen-
trations (Barnes et al., 1984). Total nitrogen in soil in the top 10 cm ranges from
0.02 to 0.07% of total soil weight according to landscape position. Valleys
exhibit the highest soil total N levels, but all landscape positions are generally
low (Alward and Joern, 1993). Nitrate concentrations range from 0.04 to 15
ppm, and ammonium concentrations varied from 0.17 to 3.3 ppm. Light is
seldom a major limitation to plant growth because of the open canopy and large
proportion of sunny days at this site.
B. gracilis is an often dominant C4 short-grass species throughout the
shortgrass steppe of the Rocky Mountain foothills to the mixed-grass prairies of
the central Great Plains of North America. In Nebraska sandhills grasslands, it
is commonly found in fine-textured soils typical of dry valleys. At Arapaho
Prairie, B. gracilis comprises up to 20Y30% of the relative cover of valleys and
midslope dunes but is nearly absent from dune ridges (Barnes et al., 1984). B.
gracilis productivity is correlated with soil moisture, and biomass peaks in early
August although yearly variability exists. B. gracilis is an important dietary
component of graminivorous grasshopper species at this site, including A.
deorum and P. nebrascensis (Joern, 1985).
Experimental Design and Statistical Analyses. Overall, two related experi-
ments were run concurrently, one addressing effects of water, N fertilizer, and
grasshopper herbivory on plant response, and the other investigating grasshop-
per performance in response to water and N-fertilizer treatments on plants.
Rectangular cages (basal area 0.5 m2, 80 cm high) were constructed of 0.64-cm
mesh and buried 10 cm after severing possible root connections to neighboring
ramets. Cages were placed over natural stands of B. gracilis Bturf^ in early
June, corresponding to the initiation of growth. Cages housing treatment com-
binations of both experiments were intermingled randomly within each block,
but experiments were analyzed separately.
Plant Responses. We manipulated levels of water, nitrogen fertilizer, and
grasshopper herbivory within natural levels to understand variation in plant re-
sponses to stress. Biomass accumulation and foliar chemical responses (% total
2073PLANT STRESS HYPOTHESIS
nitrogen, TN; and % total nonstructural carbohydrates, TNC) by B. gracilis to
multiple stresses was studied using a 3 � 2 � 2 full-factorial treatment
combination (N fertilizer, water availability, and grasshopper herbivory,
respectively) experiment in a randomized complete block design, nested within
each of 3 years. Six sites (blocks) were arbitrarily selected in a range of natural
habitats for B. gracilis along a gradient stretching from slope vegetation to
valley vegetation. Sites were selected based on the criterion that a sufficient
density of B. gracilis was available to set up a full set of treatment combi-
nations. Treatment combinations were randomly assigned to predetermined
patches of B. gracilis within each block.
Grasshopper Performance. Grasshopper performance was evaluated in a
field experiment executed in parallel with the plant stress experiment by using a
similar experimental design and identical water and mineral-N fertilizer
additions using cages as described above. Cages were intermingled randomly
with those of the plant stress experiment. The experimental design was a 3 � 2
full-factorial treatment combination experiment (N fertilizer and water
availability, respectively) arrayed in a randomized complete block design,
nested within each of 3 years. Six blocks were used. A repeated-measures
analysis of variance (ANOVA) was used to examine grasshopper survival.
Responses of two grasshopper species to plant stress were evaluated in different
years (1989, P. nebrascensis; 1990, A. deorum), but specific responses between
species cannot be compared directly because of overall differences in naturally
occurring stress between years. Ten fourth instar nymphs were added to each
cage in late June or early July to match natural phenological development of
each species in the field. The number of survivors and the developmental stage
of individuals were determined every 2Y3 d from censuses of individuals
remaining in each cage.
Statistical Analyses. Statistical analyses were performed using ANOVA,
with treatments evaluated as fixed effects in the ANOVA. To normalize data,
dependent variables expressed as percent of the total sample weight were
transformed by applying arcsine(square root) to original data before statistical
analyses. We present and discuss values in the nontransformed state. Treatment
variables were treated categorically in analyses.
Manipulations of Plant Stress from Water, Mineral Nitrogen, and Grasshopper
Herbivory
(1) Water. Two water levels were used: W+, in which water was added weekly
for the 10-wk duration of the experiment, and W0, where no additional water
beyond ambient rainfall was added. We considered W0 to be more stressful
than W+ as water stress is common in grasses (Heinisch, 1981; Barnes, 1985).
2074 JOERN AND MOLE
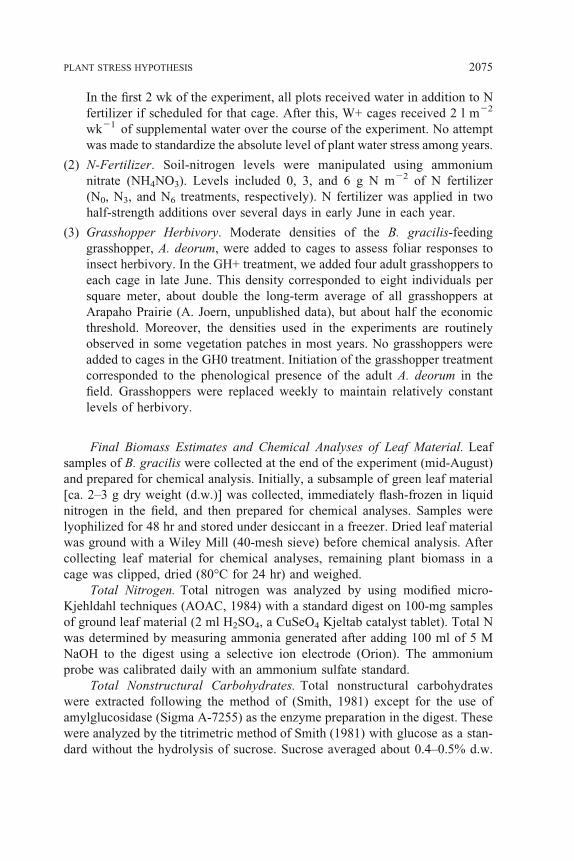
In the first 2 wk of the experiment, all plots received water in addition to N
fertilizer if scheduled for that cage. After this, W+ cages received 2 l mj2
wkj1 of supplemental water over the course of the experiment. No attempt
was made to standardize the absolute level of plant water stress among years.
(2) N-Fertilizer. Soil-nitrogen levels were manipulated using ammonium
nitrate (NH4NO3). Levels included 0, 3, and 6 g N mj2 of N fertilizer
(N0, N3, and N6 treatments, respectively). N fertilizer was applied in two
half-strength additions over several days in early June in each year.
(3) Grasshopper Herbivory. Moderate densities of the B. gracilis-feeding
grasshopper, A. deorum, were added to cages to assess foliar responses to
insect herbivory. In the GH+ treatment, we added four adult grasshoppers to
each cage in late June. This density corresponded to eight individuals per
square meter, about double the long-term average of all grasshoppers at
Arapaho Prairie (A. Joern, unpublished data), but about half the economic
threshold. Moreover, the densities used in the experiments are routinely
observed in some vegetation patches in most years. No grasshoppers were
added to cages in the GH0 treatment. Initiation of the grasshopper treatment
corresponded to the phenological presence of the adult A. deorum in the
field. Grasshoppers were replaced weekly to maintain relatively constant
levels of herbivory.
Final Biomass Estimates and Chemical Analyses of Leaf Material. Leaf
samples of B. gracilis were collected at the end of the experiment (mid-August)
and prepared for chemical analysis. Initially, a subsample of green leaf material
[ca. 2Y3 g dry weight (d.w.)] was collected, immediately flash-frozen in liquid
nitrogen in the field, and then prepared for chemical analyses. Samples were
lyophilized for 48 hr and stored under desiccant in a freezer. Dried leaf material
was ground with a Wiley Mill (40-mesh sieve) before chemical analysis. After
collecting leaf material for chemical analyses, remaining plant biomass in a
cage was clipped, dried (80-C for 24 hr) and weighed.
Total Nitrogen. Total nitrogen was analyzed by using modified micro-
Kjehldahl techniques (AOAC, 1984) with a standard digest on 100-mg samples
of ground leaf material (2 ml H2SO4, a CuSeO4 Kjeltab catalyst tablet). Total N
was determined by measuring ammonia generated after adding 100 ml of 5 M
NaOH to the digest using a selective ion electrode (Orion). The ammonium
probe was calibrated daily with an ammonium sulfate standard.
Total Nonstructural Carbohydrates. Total nonstructural carbohydrates
were extracted following the method of (Smith, 1981) except for the use of
amylglucosidase (Sigma A-7255) as the enzyme preparation in the digest. These
were analyzed by the titrimetric method of Smith (1981) with glucose as a stan-
dard without the hydrolysis of sucrose. Sucrose averaged about 0.4Y0.5% d.w.
2075PLANT STRESS HYPOTHESIS
of plant material compared with 17Y22% d.w. plant material for TNC as
measured and did not vary with TNC concentration (S. Mole, unpublished data).
RESULTS
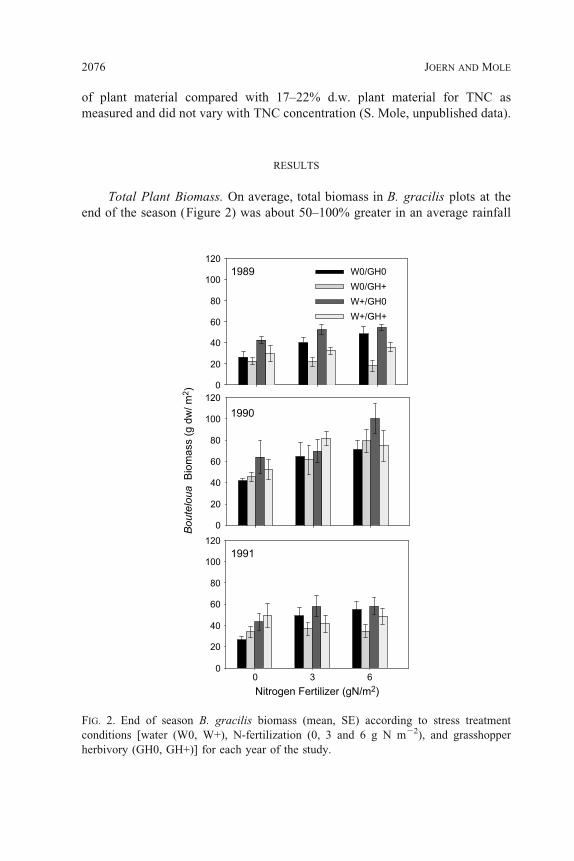
Total Plant Biomass. On average, total biomass in B. gracilis plots at the
end of the season (Figure 2) was about 50Y100% greater in an average rainfall
FIG. 2. End of season B. gracilis biomass (mean, SE) according to stress treatment
conditions [water (W0, W+), N-fertilization (0, 3 and 6 g N mj2), and grasshopper
herbivory (GH0, GH+)] for each year of the study.
2076 JOERN AND MOLE
year (1990) as in dry years (1989, 1991), which were similar. B. gracilis
biomass was significantly different among experimental treatments depending
on the number of stresses applied, indicating that the plants in this study expe-
rienced varying degrees of overall stress. Both water (1989: F1,56 = 17.4,
P < 0.001; 1990: F1,56 = 6.6, P = 0.013; 1991: F1,56 = 11.3, P < 0.001) and N
fertilizer additions (1989: F2,56 = 4.2, P < 0.021; 1990: F2,56 = 11.2, P < 0.001;
1991: F2,56 = 7.1, P < 0.001) resulted in increased biomass in all years as
additive, direct effects; no statistical interactions were detected for water and N
fertilizer in any year (Figure 2).
Feeding by grasshoppers reduced the final B. gracilis biomass in the dry
years of 1989 and 1991 (67% in 1989, F1,56 = 34.8, P < 0.001; 32% in 1991,
F1,56 = 6.5, P = 0.012), but no effect from grasshopper feeding was detected in
1990, a year of normal rainfall. This indicates that complete compensation for
foliage loss was observed in this year with normal rainfall. No statistical
interactions among grasshopper herbivory, water availability, and N fertilizer
treatments were observed in their combined effect on final B. gracilis biomass,
but were additive instead. Although biomass estimates do not include the
amounts consumed by grasshoppers, these should be similar between years as
the grasshopper encounter rate was controlled.
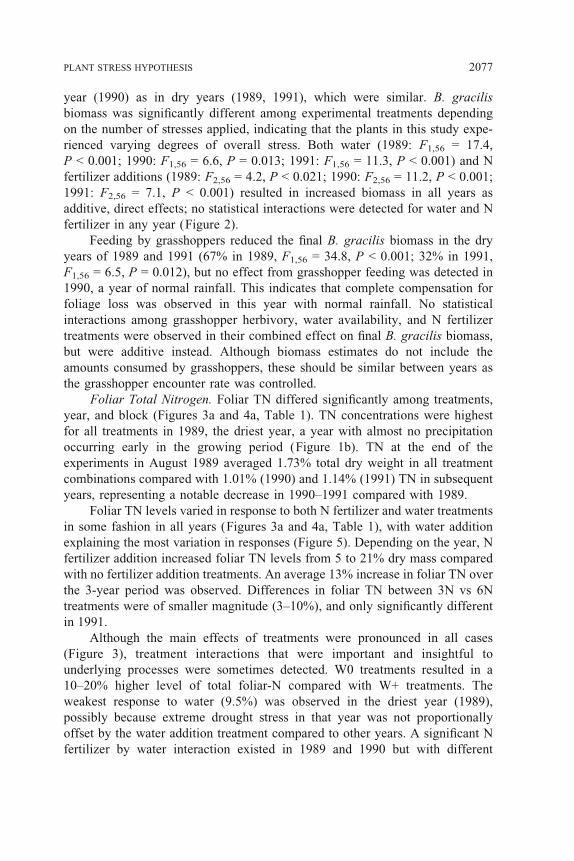
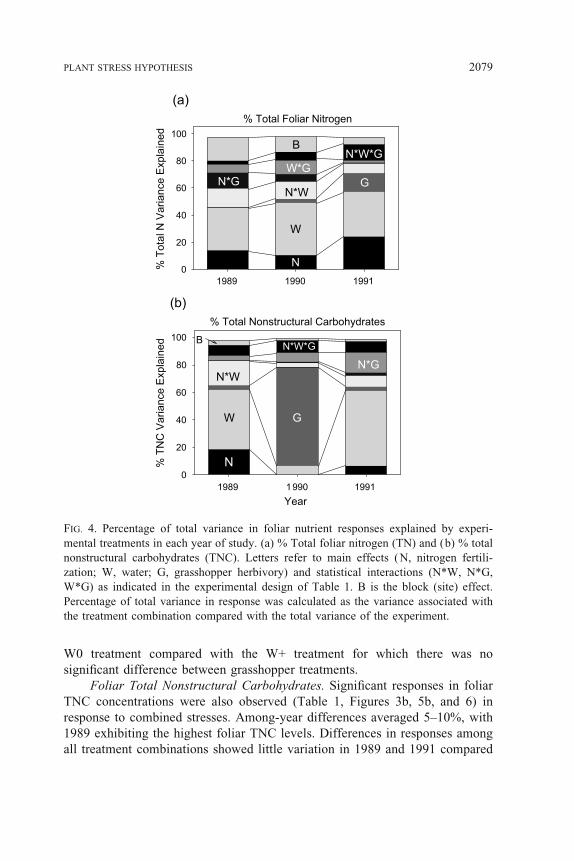
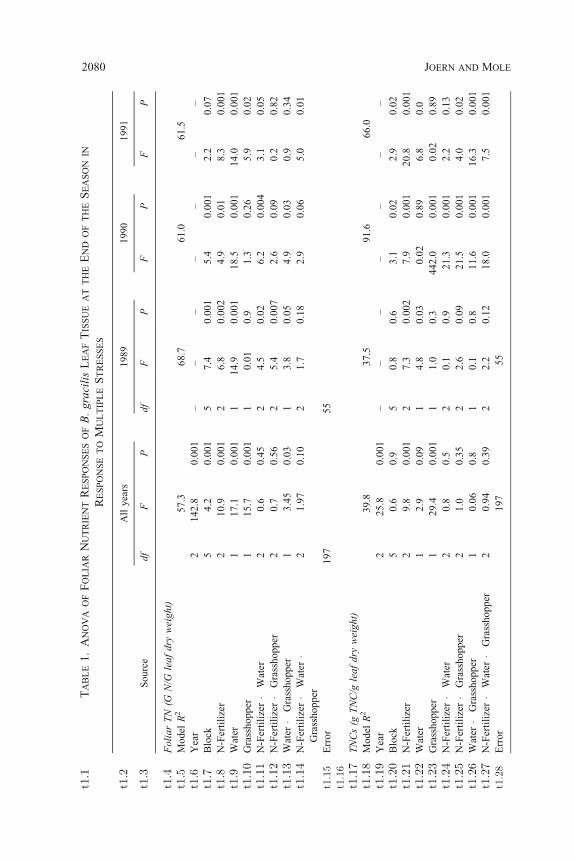
Foliar Total Nitrogen. Foliar TN differed significantly among treatments,
year, and block (Figures 3a and 4a, Table 1). TN concentrations were highest
for all treatments in 1989, the driest year, a year with almost no precipitation
occurring early in the growing period (Figure 1b). TN at the end of the
experiments in August 1989 averaged 1.73% total dry weight in all treatment
combinations compared with 1.01% (1990) and 1.14% (1991) TN in subsequent
years, representing a notable decrease in 1990Y1991 compared with 1989.
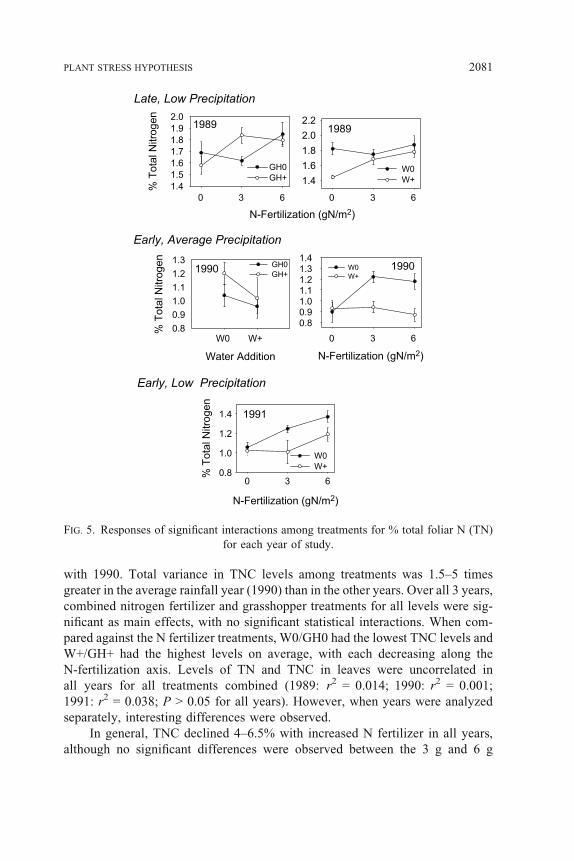
Foliar TN levels varied in response to both N fertilizer and water treatments
in some fashion in all years (Figures 3a and 4a, Table 1), with water addition
explaining the most variation in responses (Figure 5). Depending on the year, N
fertilizer addition increased foliar TN levels from 5 to 21% dry mass compared
with no fertilizer addition treatments. An average 13% increase in foliar TN over
the 3-year period was observed. Differences in foliar TN between 3N vs 6N
treatments were of smaller magnitude (3Y10%), and only significantly different
in 1991.
Although the main effects of treatments were pronounced in all cases
(Figure 3), treatment interactions that were important and insightful to
underlying processes were sometimes detected. W0 treatments resulted in a
10Y20% higher level of total foliar-N compared with W+ treatments. The
weakest response to water (9.5%) was observed in the driest year (1989),
possibly because extreme drought stress in that year was not proportionally
offset by the water addition treatment compared to other years. A significant N
fertilizer by water interaction existed in 1989 and 1990 but with different
2077PLANT STRESS HYPOTHESIS
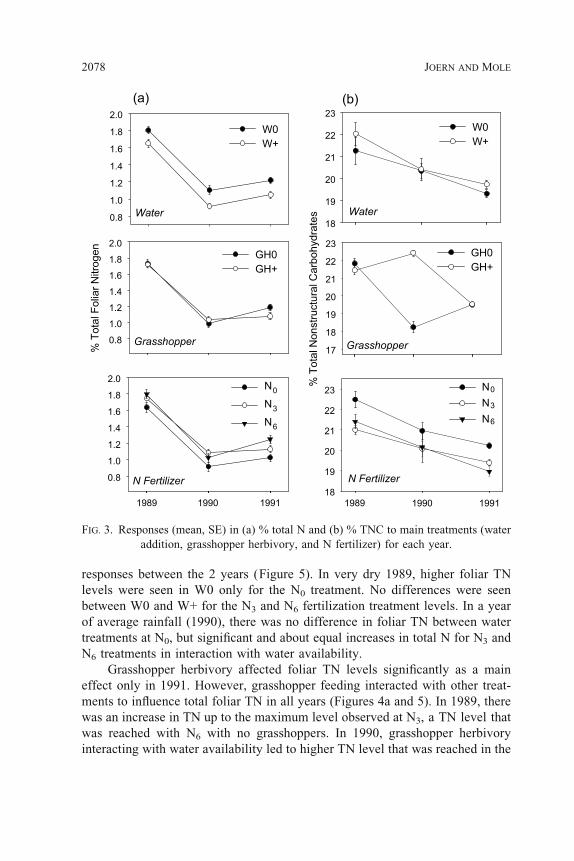
responses between the 2 years (Figure 5). In very dry 1989, higher foliar TN
levels were seen in W0 only for the N0 treatment. No differences were seen
between W0 and W+ for the N3 and N6 fertilization treatment levels. In a year
of average rainfall (1990), there was no difference in foliar TN between water
treatments at N0, but significant and about equal increases in total N for N3 and
N6 treatments in interaction with water availability.
Grasshopper herbivory affected foliar TN levels significantly as a main
effect only in 1991. However, grasshopper feeding interacted with other treat-
ments to influence total foliar TN in all years (Figures 4a and 5). In 1989, there
was an increase in TN up to the maximum level observed at N3, a TN level that
was reached with N6 with no grasshoppers. In 1990, grasshopper herbivory
interacting with water availability led to higher TN level that was reached in the
FIG. 3. Responses (mean, SE) in (a) % total N and (b) % TNC to main treatments (water
addition, grasshopper herbivory, and N fertilizer) for each year.
2078 JOERN AND MOLE
W0 treatment compared with the W+ treatment for which there was no
significant difference between grasshopper treatments.
Foliar Total Nonstructural Carbohydrates. Significant responses in foliar
TNC concentrations were also observed (Table 1, Figures 3b, 5b, and 6) in
response to combined stresses. Among-year differences averaged 5Y10%, with
1989 exhibiting the highest foliar TNC levels. Differences in responses among
all treatment combinations showed little variation in 1989 and 1991 compared
FIG. 4. Percentage of total variance in foliar nutrient responses explained by experi-
mental treatments in each year of study. (a) % Total foliar nitrogen (TN) and (b) % total
nonstructural carbohydrates (TNC). Letters refer to main effects (N, nitrogen fertili-
zation; W, water; G, grasshopper herbivory) and statistical interactions (N*W, N*G,
W*G) as indicated in the experimental design of Table 1. B is the block (site) effect.
Percentage of total variance in response was calculated as the variance associated with
the treatment combination compared with the total variance of the experiment.
2079PLANT STRESS HYPOTHESIS
t1.1
TA
BL
E1
.A
NO
VA
OF
FO
LIA
RN
UT
RIE
NT
RE
SP
ON
SE
SO
FB
.g
raci
lis
LE
AF
TIS
SU
EA
TT
HE
EN
DO
FT
HE
SE
AS
ON
IN
RE
SP
ON
SE
TO
MU
LT
IPL
ES
TR
ES
SE
S
So
urc
e
All
yea
rs1
98
91
99
01
99
1t1
.2
df
FP
df
FP
FP
FP
t1.3
Fo
lia
rT
N(G
N/G
lea
fd
ryw
eig
ht)
t1.4
Mo
del
R2
57
.36
8.7
61
.06
1.5
t1.5
Yea
r2
14
2.8
0.0
01
YY
YY
YY
Yt1
.6B
lock
54
.20
.001
57
.40
.001
5.4
0.0
01
2.2
0.0
7t1
.7N
-Fer
tili
zer
21
0.9
0.0
01
26
.80
.002
4.9
0.0
18
.30
.001
t1.8
Wat
er1
17
.10
.001
11
4.9
0.0
01
18
.50
.00
11
4.0
0.0
01
t1.9
Gra
ssh
opp
er1
15
.70
.001
10
.01
0.9
1.3
0.2
65
.90
.02
t1.1
0N
-Fer
tili
zer�
Wat
er2
0.6
0.4
52
4.5
0.0
26
.20
.00
43
.10
.05
t1.1
1N
-Fer
tili
zer�
Gra
ssh
opp
er2
0.7
0.5
62
5.4
0.0
07
2.6
0.0
90
.20
.82
t1.1
2W
ater�
Gra
ssh
opp
er1
3.4
50
.03
13
.80
.05
4.9
0.0
30
.90
.34
t1.1
3N
-Fer
tili
zer�
Wat
er�
Gra
ssh
op
per
21
.97
0.1
02
1.7
0.1
82
.90
.06
5.0
0.0
1t1
.14
Err
or
19
75
5t1
.15
t1.1
6
TN
Cs
(gT
NC
/gle
af
dry
wei
gh
t)t1
.17
Mo
del
R2
39
.83
7.5
91
.66
6.0
t1.1
8Y
ear
22
5.8
0.0
01
YY
YY
YY
Yt1
.19
Blo
ck5
0.6
0.9
50
.80
.63
.10
.02
2.9
0.0
2t1
.20
N-F
erti
lize
r2
9.8
0.0
01
27
.30
.002
7.9
0.0
01
20
.80
.001
t1.2
1W
ater
12
.90
.09
14
.80
.03
0.0
20
.89
6.8
0.0
t1.2
2G
rass
ho
pp
er1
29
.40
.001
11
.00
.34
42
.00
.00
10
.02
0.8
9t1
.23
N-F
erti
lize
r�
Wat
er2
0.8
0.5
20
.10
.92
1.3
0.0
01
2.2
0.1
3t1
.24
N-F
erti
lize
r�
Gra
ssh
opp
er2
1.0
0.3
52
2.6
0.0
92
1.5
0.0
01
4.0
0.0
2t1
.25
Wat
er�
Gra
ssh
opp
er1
0.0
60
.81
0.1
0.8
11
.60
.00
11
6.3
0.0
01
t1.2
6N
-Fer
tili
zer�
Wat
er�
Gra
ssh
op
per
20
.94
0.3
92
2.2
0.1
21
8.0
0.0
01
7.5
0.0
01
t1.2
7E
rro
r1
97
55
t1.2
8
2080 JOERN AND MOLE
with 1990. Total variance in TNC levels among treatments was 1.5Y5 times
greater in the average rainfall year (1990) than in the other years. Over all 3 years,
combined nitrogen fertilizer and grasshopper treatments for all levels were sig-
nificant as main effects, with no significant statistical interactions. When com-
pared against the N fertilizer treatments, W0/GH0 had the lowest TNC levels and
W+/GH+ had the highest levels on average, with each decreasing along the
N-fertilization axis. Levels of TN and TNC in leaves were uncorrelated in
all years for all treatments combined (1989: r2 = 0.014; 1990: r2 = 0.001;
1991: r2 = 0.038; P > 0.05 for all years). However, when years were analyzed
separately, interesting differences were observed.
In general, TNC declined 4Y6.5% with increased N fertilizer in all years,
although no significant differences were observed between the 3 g and 6 g
FIG. 5. Responses of significant interactions among treatments for % total foliar N (TN)
for each year of study.
2081PLANT STRESS HYPOTHESIS
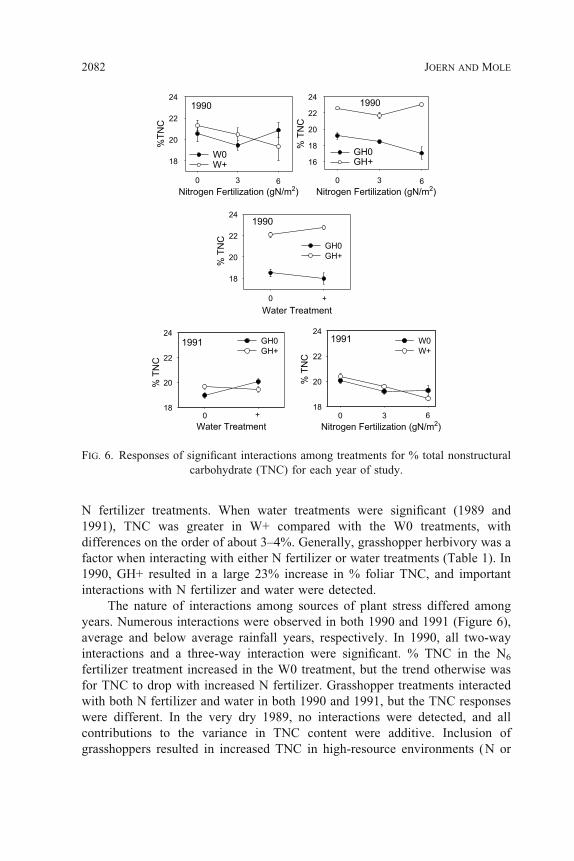
N fertilizer treatments. When water treatments were significant (1989 and
1991), TNC was greater in W+ compared with the W0 treatments, with
differences on the order of about 3Y4%. Generally, grasshopper herbivory was a
factor when interacting with either N fertilizer or water treatments (Table 1). In
1990, GH+ resulted in a large 23% increase in % foliar TNC, and important
interactions with N fertilizer and water were detected.
The nature of interactions among sources of plant stress differed among
years. Numerous interactions were observed in both 1990 and 1991 (Figure 6),
average and below average rainfall years, respectively. In 1990, all two-way
interactions and a three-way interaction were significant. % TNC in the N6
fertilizer treatment increased in the W0 treatment, but the trend otherwise was
for TNC to drop with increased N fertilizer. Grasshopper treatments interacted
with both N fertilizer and water in both 1990 and 1991, but the TNC responses
were different. In the very dry 1989, no interactions were detected, and all
contributions to the variance in TNC content were additive. Inclusion of
grasshoppers resulted in increased TNC in high-resource environments (N or
FIG. 6. Responses of significant interactions among treatments for % total nonstructural
carbohydrate (TNC) for each year of study.
2082 JOERN AND MOLE
water) compared with the GH0 treatments. In 1991, the opposite response was
observed where TNC levels under high-resource conditions were lower if
grasshoppers were present.
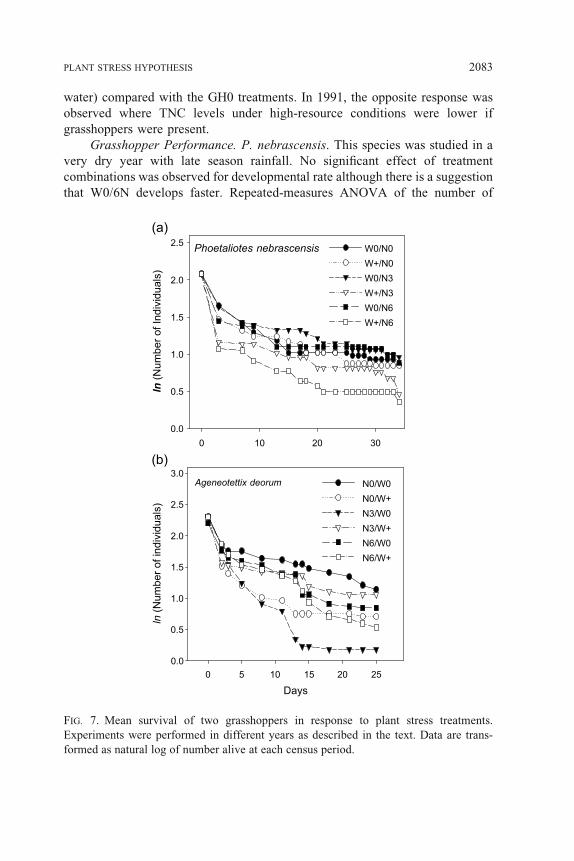
Grasshopper Performance. P. nebrascensis. This species was studied in a
very dry year with late season rainfall. No significant effect of treatment
combinations was observed for developmental rate although there is a suggestion
that W0/6N develops faster. Repeated-measures ANOVA of the number of
FIG. 7. Mean survival of two grasshoppers in response to plant stress treatments.
Experiments were performed in different years as described in the text. Data are trans-
formed as natural log of number alive at each census period.
2083PLANT STRESS HYPOTHESIS
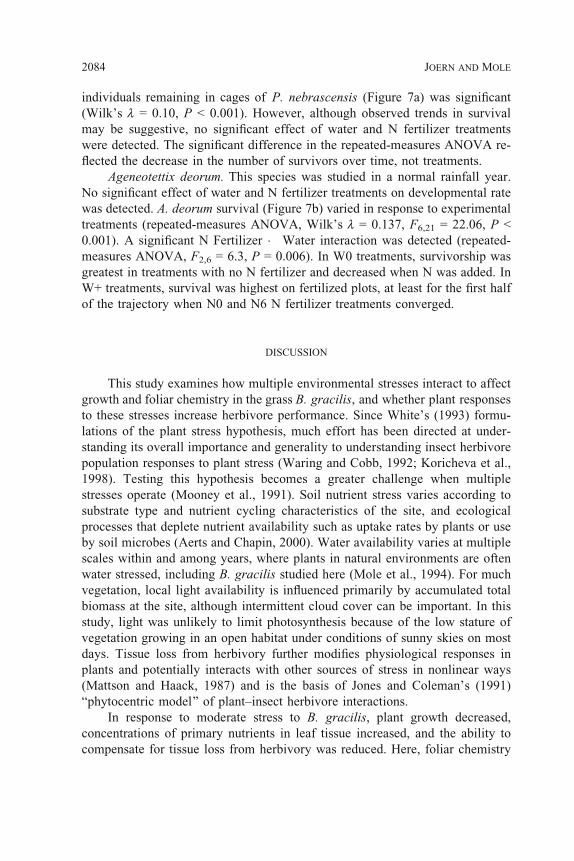
individuals remaining in cages of P. nebrascensis (Figure 7a) was significant
(Wilk’s l = 0.10, P < 0.001). However, although observed trends in survival
may be suggestive, no significant effect of water and N fertilizer treatments
were detected. The significant difference in the repeated-measures ANOVA re-
flected the decrease in the number of survivors over time, not treatments.
Ageneotettix deorum. This species was studied in a normal rainfall year.
No significant effect of water and N fertilizer treatments on developmental rate
was detected. A. deorum survival (Figure 7b) varied in response to experimental
treatments (repeated-measures ANOVA, Wilk’s l = 0.137, F6,21 = 22.06, P <
0.001). A significant N Fertilizer � Water interaction was detected (repeated-
measures ANOVA, F2,6 = 6.3, P = 0.006). In W0 treatments, survivorship was
greatest in treatments with no N fertilizer and decreased when N was added. In
W+ treatments, survival was highest on fertilized plots, at least for the first half
of the trajectory when N0 and N6 N fertilizer treatments converged.
DISCUSSION
This study examines how multiple environmental stresses interact to affect
growth and foliar chemistry in the grass B. gracilis, and whether plant responses
to these stresses increase herbivore performance. Since White’s (1993) formu-
lations of the plant stress hypothesis, much effort has been directed at under-
standing its overall importance and generality to understanding insect herbivore
population responses to plant stress (Waring and Cobb, 1992; Koricheva et al.,
1998). Testing this hypothesis becomes a greater challenge when multiple
stresses operate (Mooney et al., 1991). Soil nutrient stress varies according to
substrate type and nutrient cycling characteristics of the site, and ecological
processes that deplete nutrient availability such as uptake rates by plants or use
by soil microbes (Aerts and Chapin, 2000). Water availability varies at multiple
scales within and among years, where plants in natural environments are often
water stressed, including B. gracilis studied here (Mole et al., 1994). For much
vegetation, local light availability is influenced primarily by accumulated total
biomass at the site, although intermittent cloud cover can be important. In this
study, light was unlikely to limit photosynthesis because of the low stature of
vegetation growing in an open habitat under conditions of sunny skies on most
days. Tissue loss from herbivory further modifies physiological responses in
plants and potentially interacts with other sources of stress in nonlinear ways
(Mattson and Haack, 1987) and is the basis of Jones and Coleman’s (1991)
Bphytocentric model^ of plantYinsect herbivore interactions.
In response to moderate stress to B. gracilis, plant growth decreased,
concentrations of primary nutrients in leaf tissue increased, and the ability to
compensate for tissue loss from herbivory was reduced. Here, foliar chemistry
2084 JOERN AND MOLE
in response to stress conditions is highly dynamic and effects of combined
abiotic stresses are additive, but sometimes appear idiosyncratic when combined
with herbivory from grasshoppers. Results observed for B. gracilis are
consistent with those of other studies. Multiple environmental stresses to plants
regularly reduce plant growth compared to the maximum performance possible
(Mooney et al., 1991; Louda and Collinge, 1992), and nutrient and water stress
or tissue loss often alter tissue palatability to herbivores (Mattson and Haack,
1987; Louda and Collinge, 1992; White, 1993; Redak and Capinera, 1994).
Understanding the integrated responses by plants to combined stresses from
abiotic conditions and herbivory is limited by our ability to incorporate the
consequences of multiple stresses into a predictive framework (Jones and
Coleman, 1991; Mooney et al., 1991; Bazzaz and Grace, 1997). Because plants
function as integrated units, whole-plant growth responses reflect the underlying
coordination and allocation among competing resource sinks (Mooney et al.,
1991; Bazzaz and Grace, 1997).
Consequences of Environmental Stresses to B. gracilis. B. gracilis biomass
varied significantly with manipulation of water availability, nitrogen fertilizer,
and grasshopper herbivory treatments in the field, showing that these factors
contribute importantly to plant stress. Responses differed among years as
weather conditions varied (hot, dry vs normal precipitation), and both water and
nitrogen fertilizer manipulations affected plant growth in each year in an addi-
tive fashion. Moreover, plant biomass decreased relative to controls in response
to grasshopper herbivory in the driest years (1989, 1991), but herbivory did not
affect final biomass accumulation in a year with normal rainfall (1990). These
results indicate that B. gracilis compensates for tissue losses from herbivory
when provided sufficient water and nutrients to support photosynthesis and
growth.
Foliar chemistry of B. gracilis is highly variable among years; variability in
foliar chemical concentrations should increase in response to stress according to
variability in plant stress. This is to be expected, as critical soil nutrients, light,
and water required for plant growth routinely shift in time and space (Bazzaz
and Grace, 1997) under natural conditions. Water stress regularly resulted in
increased concentrations of foliar TN in all years and was the most important
stress to B. gracilis. However, N fertilizer, grasshopper, and year effects con-
tributed greatly to the expression of TN, showing a variety of outcomes among
years.
Insect herbivory should affect plants in a manner similar to other
environmental stresses in that it alters the capacity for photosynthesis by
removing leaf material and changes sourceYsink relationships to favor re-
growth of leaves. Photosynthesis, growth, and foliar nutrients routinely vary
in response to the timing and degree of herbivory (Redak and Capinera,
1994). Of greatest interest is the highly variable nature of responses of foliar
2085PLANT STRESS HYPOTHESIS
chemistry to grasshopper herbivory, especially among years and the large number
of interactions that were observed between other plant stresses and grasshopper
herbivory.
The Plant Stress Hypothesis. By influencing metabolic activity in general,
environmental stresses often alter plant resistance to herbivory, especially
because of changes in foliage quality to herbivores (Rhoades, 1983; Bazzaz
et al., 1987; Mattson and Haack, 1987; Louda and Collinge, 1992). For
example, reduced soil water availability often reduces resistance to herbivory
because of increased nutrient concentrations in leaf tissue available to
herbivores (McNeil and Southwood, 1978; White, 1993; Redak and Capinera,
1994), decreased or elevated concentrations of defensive compounds (Rhoades,
1983; Gershenzon, 1984; Redak and Capinera, 1994), or some trade-off
between nutritional and defensive qualities in leaf tissues that make them more
or less palatable to herbivores (Bazzaz et al., 1987). Consequently, increased
nutritional quality combined with decreased defensive capability results in
improved herbivore performance. Mature grasses contain few chemical defenses
compared to other plant taxa (Mole and Joern, 1994), thus simplifying the
problem. Primary nutrients are also typically found at much lower concen-
trations in grasses than are typically observed in forbs and wood plants,
decreasing the plant’s value as food to herbivores (Bernays and Barbehenn,
1987). Given the expected low concentrations of limiting nutrients relative to
consumer needs, small shifts in their availability may provide large fitness
consequences to individuals feeding on them (Joern and Behmer, 1997).
B. gracilis responded to multiple stresses more or less as expected, but
grasshopper performance was not consistent with predictions of the plant stress
hypothesis. No changes in developmental rate were observed in either species,
and survival in P. nebrascensis showed no significant differences. Survival in
A. deorum differed among stress treatments, but higher survival was observed in
treatments with lower levels of foliar TN, contrary to survivorship patterns
expected based on feeding studies with controlled diets (Joern and Behmer,
1997).
Reviews of the plant stress hypothesis on woody plants (Waring and Cobb,
1992; Koricheva et al., 1998; Huberty and Denno, 2004) indicate weak support
for the notion at best. No significant concordance with expectations was
observed in a meta-analysis of experimental studies (Koricheva et al., 1998;
Huberty and Denno, 2004), although comparative studies in the field were
reasonably consistent with expectations (Waring and Cobb, 1992; Watt, 1992).
Fewer studies are available for nonwoody plants, especially for grasses, and
results generally conflict with predictions of the plant stress hypothesis. Redak
and Capinera (1994) showed that heavy defoliation of western wheat grass
(Pascopyrum smithii) either by mechanical means in the laboratory or from
herbivory by P. nebrascensis in the field altered foliar nutrients and palatability,
2086 JOERN AND MOLE
but in the opposite direction required for support. Similarly, polyphagous leaf
miners on grasses respond positively as expected to foliar nutritional quality,
but fertilizer stress has a negative impact on population responses (Scheirs and
De Bruyn, 2004).
Without doubt, insect herbivores typically encounter heterogeneous nutri-
tional landscapes while foraging, one largely resulting from the integrated
responses of plants to variable environmental conditions (Jones and Coleman,
1991; Louda and Collinge, 1992). In turn, variable nutritional quality is expected
to directly influence herbivore fitness and subsequent population fluctuations
(Rhoades, 1983; Jones and Coleman, 1991; White, 1993). However, responses
by chewing insect herbivores to plant quality are highly variable, with some species
responding positively and others negatively or not at all to specific responses (Joern
and Behmer, 1997; Fischer and Fielder, 2000). This is especially evident for
understanding the dynamic changes in foliar TN and TNC in response to
combined stress, which in turn affect subsequent levels of insect herbivory.
Results from our study with grasshoppers are consistent with others that
examine free-living, chewing insects. Reviews of the plant stress hypothesis
indicate that under continuous stress, most insect herbivore guilds either are
negatively impacted or do not respond to plant stress (Watt, 1992; Koricheva et al.,
1998). The best current model (Huberty and Denno, 2004) may be the Bpulsed
plant stress hypothesis^ in which foliar nutrients accumulating from stress
conditions only become available to herbivores, especially sap feeders, as plants
recover from stress. Still, many other insect herbivore guilds are not explained.
Nutritional quality of host plants generally affects performance by grass-
hoppers, as documented by laboratory and field studies (Joern and Behmer, 1997;
Simpson and Raubenheimer, 2001). Why does the plant-stress hypothesis not
explain responses by free-living chewing insects, such as grasshoppers, despite
the appealing logic inherent in the formulation of plant stress hypothesis? A
combination of multiple factors might explain. It may not be possible to directly
relate performance to stress treatments because of intervening pathways that
interact in unknown ways. (1) Grasshoppers perform best on a diet that is
balanced between protein and carbohydrates; as nutritional ratios deviate from
the target, performance drops as well. Stressed plants may have elevated foliar
protein that is not always in balance with carbohydrates. (2) Grasshoppers can
compensate for poor-quality food by altering diets (Simpson and Abisgold,
1985) or by modifying retention time in the gut (Yang and Joern, 1994), a
response that could affect nutrient acquisition and insect performance in a non-
linear fashion. Lack of response to stress may actually be Bhidden^ because of
such physiological adjustments. (3) As observed in this study, chemical
responses in B. gracilis leaves to stress treatment combinations are highly
variable, making it particularly difficult to predict performance. Response by
grasshoppers may best fit predictions of Price’s (1991) Bplant vigor hypothesis^,
2087PLANT STRESS HYPOTHESIS
which argues for elevated insect herbivore performance on tissues in actively
photosynthesizing tissue; this may allow for a wider range of combinations of
protein and carbohydrate. It is noteworthy that TNC and TN concentrations
among leaf samples were uncorrelated (unpublished data), making it particu-
larly difficult for grasshoppers to use simple phagostimulatory cues to select
balanced diets. (4) Effects of stresses themselves to plants are multifactorial
(water, temperature, trampling, N addition, herbivory) such that the expected
effects on grasshoppers are not predicted by simple plant stress models; Jones
and Coleman (1991) provide a basis for a more comprehensive model.
Ultimately, some combination of each of the above and other factors influencing
foraging by free-living grasshoppers will determine the relative contribution of
plant stress to performance in combination with other factors.
It is important to resolve the ability to relate insect herbivore response to
plant stress. Historically, forecasts of insect pest outbreaks including grass-
hoppers often assume that insect populations do better under hot/dry weather
conditions because of better food quality (Rhoades, 1983; Mattson and Haack,
1987). This weather-induced link between plant stress and insect performance is
often circumstantial at best (Huberty and Denno, 2004) and remains to be vetted
carefully before it is recognized as a key mechanism underlying insect
outbreaks. However, it is also true that many experimental studies, including
those with grasshoppers, implicate elevated host plant quality as an important
determinant of insect performance and population responses in the field.
Alternate explanations that include multiple factors (Belovsky and Joern, 1995)
or incorporate more sophisticated views of nutritional contributions and
environmental influences on observed population variability (Simpson and
Raubenheimer, 2001) must be developed to fill the void left by the inability of
the plant stress hypothesis to explain natural patterns.
AcknowledgmentsVLogistical support from Cedar Point Biological Station is gratefully
acknowledged. M. Thomas, M. Zeisset, C. Holtmeier, S. Behmer, Y. Yang, and L. Kang provided
help in the field. Y. Chen, T. Minnick, M. Thomas, L. Snyder, and M. Zeisset helped analyze plant
samples. B. Danner and K. Stoner provided comments on the manuscript. Research was supported
by USDA/NRI and the National Science Foundation.
REFERENCES
AERTS, R. and CHAPIN, F. S. I. 2000. The mineral nutrition of wild plants revisited: a reevaluation of
processes and patterns. Adv. Ecol. Res. 30:2Y67.
ALWARD, R. D. and JOERN, A. 1993. Plasticity in grass responses to herbivory. Oecologia
95:358Y364.
AOAC. 1984. Official Methods of Analysis. Association of Official Agricultural Chemists,
Washington, DC.
2088 JOERN AND MOLE
BARNES, P. W. 1985. Adaptation to water stress in the big bluestemYsand bluestem complex.
Ecology 66:1908Y1920.
BARNES, P. W., HARRISON, A. T., and HEINISCH, S. P. 1984. Vegetation patterns in relation to
topography and edaphic variation in Nebraska Sandhills Prairie. Prairie Nat. 16:145Y158.
BAZZAZ, F. A. and GRACE, J. (eds.). 1999. Plant Resource Allocation. Academic Press, San Diego,
CA.
BAZZAZ, F. A., CHIARIELLO, N. R., COLEY, P. D., and PITELKA, L. F. 1987. Allocating resources to
reproduction and defense. Bioscience 37:58Y67.
BELOVSKY, G. E. and JOERN, A. 1995. Regulation of grassland grasshoppers: differing dominant
mechanisms in time and space, pp. 359Y386, in N. Cappucino and P. W. Price (eds.). Novel
Approaches for the Study of Population Dynamics: Examples from Insect Herbivores.
Academic Press, New York.
BERNAYS, E. A. and BARBEHENN, R. 1987. Nutritional ecology of grass foliage-chewing insects,
pp. 147Y175, in F. Slansky Jr. and J. G. Rodriguez (eds.). Nutritional Ecology of Insects. Wiley
Interscience, New York.
BOKHARI, U. G. 1978. Nutrient characteristics of blue grama herbage under the influence of added
water and nitrogen. J. Range Manag. 31:18Y22.
CHAPIN, F. S. I., BLOOM, A. J., FIELD, C. B., and WARING, R. H. 1987. Plant responses to variable
environments. Annu. Rev. Ecolog. Syst. 16:363Y392.
FISCHER, K. and FIELDER, K. 2000. Response of the copper butterfly Lycaena titrys to increased leaf
nitrogen in natural food plants: Evidence against the nitrogen limitation hypothesis. Oecologia
124:235Y241.
GERSHENZON, J. 1984. Changes in the levels of plant secondary metabolites under water and nutrient
stress. Recent Adv. Phytochem. 18:273Y320.
HEINISCH, S. P. 1981. Water allocation and rooting morphology of two Bouteloua species in relation
to their distributions in the Nebraska sandhills. M.S. thesis, University of Nebraska.
HUBERTY, A. and DENNO, R. F. 2004. Plant water stress and its consequences for herbivorous
insects: a new synthesis. Ecology 85:1385Y1398.
JOERN, A. 1985. Grasshopper dietary (Orthoptera: Acrididae) from a Nebraska sandhills prairie.
Trans. Nebr. Acad. Sci. 8:21Y32.
JOERN, A. and BEHMER, S. T. 1997. Importance of dietary nitrogen and carbohydrates to survival,
growth and reproduction in adult Ageneotettix deorum (Orthoptera: Acrididae). Oecologia
112:201Y208.
JONES, C. G. and COLEMAN, J. S. 1991. Plant stress and insect herbivory: toward an integrated
perspective, pp. 249Y280, in H. A. Mooney, W. E. Winner, and E. J. Pell (eds.). Response of
Plants to Multiple Stresses. Academic Press, San Diego.
KORICHEVA, J., LARSSON, S., and HAUKIOJA, E. 1998. Insect performance on experimentally
stressed wood plants: a meta-analysis. Annu. Rev. Entomol. 43:195Y216.
LOUDA, S. M. and COLLINGE, S. K. 1992. Plant resistance to insect herbivores: a field test of the
environmental stress hypothesis. Ecology 73:153Y169.
MATTSON, W. J. and HAACK, R. A. 1987. The role of drought in outbreaks of plant-eating insects.
Bioscience 37:110Y118.
MCNEIL, S. and SOUTHWOOD, T. R. E. 1978. The role of nitrogen in the development of insectYplant
relationships, pp. 77Y98, in J. B. Harborne (ed.). Biochemical Aspects of Plant and Animal
Coevolution. Academic Press, London.
MOLE, S. and JOERN, A. 1994. The feeding behavior of graminivorous grasshoppers in response to
hostYplant extracts, alkaloids and tannins. J. Chem. Ecol. 20:3097Y3109.
MOLE, S., JOERN, A., O’LEARY, M. H., and MADHAVAN, S. 1994. Spatial and temporal variation in
carbon isotope discrimination in prairie graminoids. Oecologia 97:316Y321.
MOONEY, H. A. and CHIARIELLO, N. R. 1984. The study of plant function: the plant as a balanced
2089PLANT STRESS HYPOTHESIS
system, pp. 305Y323, in R. Dirzo and J. Sarukhan (eds.). Perspectives on Plant Population
Ecology. Sinauer Associates, Sunderland, MA.
MOONEY, H. A. and GILMAN, S. L. 1982. Constraints on leaf structure and function in reference to
herbivory. Bioscience 32:198Y206.
MOONEY, H. A. and WINNER, D. A. 1991. Partitioning response of plants to stress, pp. 499Y518,
in H. A. Mooney, D. A. Winner, and E. J. Pell (eds.). Response of Plants to Multiple Stresses.
Academic Press, San Diego, CA.
MOONEY, H. A., WINNER, W. E., and PELL, E. J. (eds.). 1991. Response of Plants to Multiple
Stresses. Academic Press, San Diego.
PRICE, P. W. 1991. The plant vigor hypothesis and herbivore attack. Oikos 62:244Y251.
REDAK, R. A. and CAPINERA, J. L. 1994. Changes in western wheatgrass foliage following
defoliation: consequences for a graminivorous grasshopper. Oecologia 100:80Y88.
RHOADES, D. F. 1983. Herbivore population dynamics and plant chemistry, pp. 3Y53, in R. F. Denno
and M. S. McClure (eds.). Variable Plants and Herbivores in Natural and Managed Systems.
Academic, New York.
SCHEIRS, J. and DE BRUYN, L. 2004. Excess nutrients results in plant stress and decreased grass
miner performance. Entomol. Exp. Appl. 113:109Y116.
SIMPSON, S. J. and ABISGOLD, J. D. 1985. Compensation by locusts for changes in dietary nutrients:
Behavioural mechanisms. Physiol. Entomol. 10:443Y452.
SIMPSON, S. J. and RAUBENHEIMER, D. 2001. The geometric analysis of nutrientYalleleochemical
interactions: a case study using locusts. Ecology 82:422Y439.
SMITH, D. 1981. Removing and analyzing total nonstructural carbohydrates from plant tissue.
Wisconsin Agricultural and Experimental Station. Report R2107. University of Wisconsin,
Madison, WI.
TRLICA, M. J. and COOK, C. W. 1971. Defoliation effects on carbohydrate reserves of desert species.
J. Range Manage. 24:418Y425.
WARING, G. L. and COBB, N. S. 1992. The impact of plant stress on herbivore dynamics,
pp. 167Y226, in E. A. Bernays (ed.). InsectYPlant Interactions. CRC Press, Boca Raton, FL.
WATT, A. D. 1992. The relevance of the stress hypothesis to insects feeding on tree foliage,
pp. 73Y85, in S. R. Leather, A. D. Watt, N. J. Mills, and K. F. A. Walters (eds.). Individuals,
Populations and Patterns in Ecology. Intercept Ltd., Andover, Hampshire, UK.
WHITE, T. C. R. 1993. The Inadequate Environment: Nitrogen and the Abundance of Animals.
Springer-Verlag, Berlin.
YANG, Y. and JOERN, A. 1994. Influence of diet, developmental stage and temperature on food
residence time. Physiol. Zool. 67:598Y616.
2090 JOERN AND MOLE