Embed Size (px)
Citation preview
The Political Cost of War Mobilization
in Democracies and Dictatorships∗
Jeff CarterDepartment of Political ScienceThe University of Mississippi
March 12, 2014
Word Count: 10,866
Abstract
I argue that mobilization for interstate war should be politically costlier for democratic leadersthan dictators. Waging interstate war is associated with higher military spending and, often, areduction in social spending. Variation across regime type in the representation of the generalpublic, civilian elite, and military in leaders’ winning coalitions should make democrats morelikely than dictators to lose power given war-time patterns of government spending. This argu-ment finds support during the period from 1950 to 2001. My findings provide microfoundationsfor a number of existing empirical results and suggest that differences in the conflict behav-ior of democracies and dictatorships should be largest when waging war requires a significantmobilization effort.
∗Previously presented at the 2013 meeting of the Peace Science Society (International). Susan Allen, Scott Bennett,David Carter, Matt DiGiuseppe, Ben Jones, Jake Kathman, Doug Lemke, Tim Nordstrom, Glenn Palmer, JamesShortle, Yael Zeira, and Heather Ondercin are thanked for comments on earlier versions of this manuscript.
On July 17th, 1945, the leaders of the Allied Powers gathered in Potsdam, Germany to
discuss a series of issues related to the termination of World War II. As had been the case at
Yalta, Winston Churchill sought to check the ambitions of Joseph Stalin. The opening days
of the Potsdam Conference saw Churchill stand firm against Stalin, particularly with respect
to the Provisional Government of National Unity in Poland (Feis 1960). Stalin sought Allied-
recognition of the “Lublin Poles,” which would offer legitimacy and help consolidate the rule of
the Soviet-sponsored regime. In contrast, Churchill advocated for democratic elections in Poland
in the hope that the “London Poles” would unseat the incumbents (Feis 1960). Churchill’s influ-
ence at Potsdam, though, was cut short by the results of the British General Election. Churchill
returned to London on July 25th for the election returns and on the following day learned that
his Conservative Party had been soundly defeated by Clement Attlee’s Labour Party. Prime
Minister Attlee arrived as Britain’s official representative at the Potsdam Conference on July
27th (Harris 1982). Thus, Churchill was removed from office before the completion of World
War II by the same people whom credited him with saving Britain while Stalin would continue
to lead the Soviet Union until his death from natural causes in 1953.1
Research on interstate conflict largely agrees that domestic politics, and democratic po-
litical institutions in particular, significantly affect interstate conflict processes. Institutional
explanations for differences in conflict behaviors across regime type often assume that the po-
litical costs of interstate war are higher in democracies than in autocracies (e.g., Bennett and
Stam 1998, Russett and Oneal 2001, Reiter and Stam 2002, Bueno de Mesquita et al. 2003).2
Recent scholarship, though, concludes that the prospect of a leader being removed from power
for participating in a war does not vary across regime type and the outcome of an interstate war
affects the political survival of autocratic leaders but not democratic incumbents (Chiozza and
Goemans 2004, Debs and Goemans 2010). This research implies interstate war is not costlier
for democratic leaders than it is for dictators and, more importantly, that our explanations for
variation in conflict behavior across regime type follow from questionable microfoundations. If
at least some aspect of interstate war is not more costly for democrats than dictators, then our
understanding of why democracies and non-democracies differ in when they initiate, reciprocate,
and terminate interstate conflicts and wars is flawed.
1Notably, the Allies agreed to recognize the Provisional Government of National Unity at Potsdam upon thecondition the new Polish regime would hold “free and unfettered elections as soon as possible” (Feis 1960). Poland’sfirst democratic elections were held in 1991.
2The terms non-democracy, autocracy, dictatorship, authoritarian, and their various derivatives are generally usedinterchangeably throughout this paper to refer to those governments that are not democracies.
1
I argue that a fundamental but often overlooked aspect of interstate war is costlier for
democrats than it is for dictators, provides an explanation for why conflict behavior varies across
regime type, and accounts for why Churchill and other democratic leaders might be removed from
office despite overseeing successful interstate war efforts while dictators like Stalin are able to re-
main in power. Fighting in an interstate war generally requires a government to increase military
spending and, often, is accompanied with a decrease in the proportion of national resources ded-
icated to non-military purposes (Sandler and Hartley 1995). The difference between the peace-
time and war-time distribution of a government’s economic resources represents its economic
mobilization for interstate war (e.g., Bueno de Mesquita et al. 2003, Goldsmith 2007). Existing
research on mobilization generally focuses on how it influences the escalation of an interstate
dispute to war or a war’s outcome (among others, Organski and Kugler 1980, Slantchev 2005)
and largely ignores its domestic political consequences. I argue mobilization for interstate war
should have a differential effect on the probability democratic and non-democratic incumbents
remain in power. This claim follows from the observation that the winning coalitions of demo-
cratic leaders largely consist of people who prefer relatively lower military spending and higher
social spending than the members of society that largely make-up the winning coalitions of non-
democratic leaders (the general public versus members of the military and civilian elite). This
implies that the higher military spending inherent in a mobilization effort and the lower social
spending that often accompanies war mobilization should be politically costlier for a democratic
leader than a dictator. I find empirical support for this argument: between 1950 and 2001,
higher military spending during an interstate war increased the probability a democratic leader
would be removed from office significantly more than the probability a non-democratic leader
would lose power. The magnitude of this effect is greater when a mobilization effort is accom-
panied by a reduction in social spending. These results imply that prosecuting an interstate
war is politically costlier for democrats than it is for dictators when fighting the war requires a
leader to alter the peace-time distribution of government spending. This suggests the political
cost of mobilization influences multiple aspects of the conflict process and that variation in the
conflict behavior of democracies and non-democracies should be more pronounced when fighting
requires a significant mobilization of resources.
The remainder of this article proceeds in seven sections. The first describes research on the
empirical relationship between leader survival, interstate war, and regime type. The second
section discusses economic mobilization for interstate war. The third presents my argument for
2
why democratic leaders should be more likely to lose office than non-democratic leaders given
war-time patterns of government spending. The fourth section describes my empirical tests
while the fifth reports the results of my analyses. The cases of Winston Churchill and Joseph
Stalin are then used to illustrate how war mobilization and regime type interact to influence
leader survival. The article concludes with a discussion of the implications of my findings for
the relationship between interstate conflict and regime type.
1 Leader Survival, Interstate War, and Regime Type
Institutional explanations for variation in conflict behavior across regime type often argue
that the cost of war is greater in democracies than it is in non-democracies (e.g., Schultz 2001a,
Reiter and Stam 2002, Bueno de Mesquita et al. 2003). While these accounts often differ in their
specifics, the general logic is that variation in political accountability across regime type makes
it more likely that a democratic leader who retains office through elections will be punished by
the public for leading her country into an interstate war or overseeing a losing war effort than a
dictator who only needs the support of the political elite to stay in power. Scholars often cite the
results of Bueno de Mesquita and Siverson (1995) as empirical justification for the assumption
that interstate war is costlier for democrats than it is for dictators. However, this inference
does not follow from their analysis. Bueno de Mesquita and Siverson (1995) show that the
unconditional probability of being removed from power is greater for a democratic leader than
it is for a non-democratic incumbent; that is, in general democratic leaders are more likely to lose
office than non-democratic leaders. Bueno de Mesquita and Siverson are silent, though, on the
crucial question of how political survival differs across regime type conditional on participation
in or the outcome of an interstate war.3
Recent research concludes the relationship between leader survival, interstate war, and
regime type is very different than assumed by most explanations of autocratic and democratic
conflict behavior. Focusing first on participation in an interstate war, Chiozza and Goemans
(2004) find that the probability of an incumbent retaining office is statistically unrelated to her
country’s involvement in a war. Distinguishing between how a leader is removed from power,
Chiozza and Goemans (2011) find that participating in an international conflict does not alter
the probability that a democratic leader will experience either a regular or forcible removal from
3Interested readers are directed to Debs and Goemans (2010) for a more detailed discussion of this issue.
3
office. In contrast, autocratic leaders who initiate conflicts decrease their likelihood of both
regular and irregular removal from office, as long as they do not subsequently lose an ensuing
war. Turning to war outcomes, Chiozza and Goemans (2004) and Debs and Goemans (2010)
find that the tenure of autocratic leaders is more sensitive to interstate war outcomes than is the
political survival of democratic leaders. Their analyses indicate the probability a democratic
incumbent will be removed from office is not significantly affected by her country’s performance
in an interstate war. Non-democratic incumbents, however, are rewarded with a lower proba-
bility of losing office upon winning an interstate war and are punished with a higher probability
of removal from power after losing a war. A slightly more nuanced relationship between war
outcomes and political survival emerges if we consider the manner of removal. Chiozza and
Goemans (2011) find that losing an interstate war increases the likelihood an autocrat suf-
fers a regular and a forcible removal from office. They fail to find a significant relationship
between interstate war outcomes and the likelihood a democratic leader is removed through
peaceful means, but do find that leaders of parliamentary democracies face a higher probability
of forcible removal upon losing a war. However, one of the hallmarks of democratic governance
is the peaceful transition of political power. Only 5.5% of democratic leaders between 1919 and
2003 lost office in an irregular manner (figure based on data from Debs and Goemans 2010).
Forcible removals therefore are empirically rare in democracies. When considered together, the
recent empirical scholarship on the relationship between leader survival, interstate war, and
regime type uncovers no systematic evidence that participating in or losing an interstate war is
politically costlier for democrats than it is for dictators.
It is possible that strategic behavior obscures the actual relationship among leader survival,
interstate war, and regime type. Schultz (2001b) argues that political incumbents have an
incentive to avoid participating in the interstate wars in which a losing effort would see them
removed from power. Subsequently, the wars we observe are disproportionately drawn from
the non-random sample of wars in which leaders are likely to retain office even if their states
are defeated. If a leader’s ability to identify which wars fall into this non-random sample is a
function of regime type, then statistical analyses would not capture the data generating process
among leader survival and interstate war in democracies and dictatorships. Debs and Goemans
(2010) raise two critiques to Schultz’s (2001b) argument. First, why is it the case that democratic
leaders are able to avoid wars in which losing decreases the probability they will be removed
from office but not select wars in which winning increases their expected tenure? Second, it
4
is not obvious why democratic leaders should be able to strategically choose wars that will
not endanger their political survival but autocratic incumbents cannot; particularly in light of
Bas’s (2012) finding that democracies are more likely to choose suboptimal foreign policies than
are non-democracies. Without sufficient answers to these questions, it is unclear the extent to
which strategic censoring can explain why democratic leaders are not regularly punished for
participating in and/or losing interstate wars.
Institutional explanations for variation in conflict behavior across regime type rely on the
questionable assumptions that democratic leaders are more likely to be removed from power
than autocratic leaders for participating in or losing an interstate war. If interstate war is not
more costly for democratic leaders than it is for dictators, then much of what we think we know
about the relationship between regime type and interstate conflict is wrong. In the next section
I argue a common feature of interstate war is politically costlier for democratic leaders than
dictators but largely has been overlooked by scholars: economic mobilization for war.
2 War Mobilization and Its Political Cost
Interstate wars are costly (most notably, Fearon 1995). In addition to the inherent fatalities,
prosecuting an interstate war leads governments to increase the economic resources dedicated
to the military (e.g., Sandler and Hartley 1995). The increase in a government’s allocation
of resources to the military associated with prosecuting an interstate war represents a state’s
economic mobilization for war (Bueno de Mesquita et al. 2003, Goldsmith 2007). It is instructive
to consider the degree to which states have mobilized for contemporary interstate wars. Between
1950 and 2001, countries fighting in an interstate war allocated, on average, 6.8% of their annual
gross domestic product to military spending while countries at peace spent only 2.5% of their
annual GDP on the military. This 170% average increase in national defense burdens associated
with war mobilization is statistically significant at greater than the 0.01 level.4
Economic mobilization for war, or higher military spending in general, does not neces-
sarily imply a complementary decrease in the proportion of a state’s economic resources al-
located to non-military spending. For example, governments can increase military spending
without cutting non-military expenditures by raising taxes (e.g., Tilly 1975, Bank, Stark and
4Military spending, GDP, and war participation data are drawn from the National Material Capabilities data set(version 3.1) (Singer, Bremer and Stuckey 1972), Gleditsch’s (2002) Expanded GDP and Trade data set, and the ICBproject (Brecher and Wilkenfeld 1997), respectively.
5
Thorndike 2008), borrowing money on the international credit market (Schultz and Weingast
2003, Shea Forthcoming), and/or inflation (Capella 2013). However, at least during the last
sixty years fighting an interstate war has been associated with governments allocating fewer
of their economic resources to non-military purposes. On average, governments distributed ap-
proximately 75.4% of total spending to non-military programs during peace-time but only 50.1%
to non-military expenditures when they were fighting an interstate war during the period from
1950 to 2001 (this difference is also statistically significant at greater than the 0.01 level).5 Im-
portantly for the argument developed below, this reduction in non-military expenditures often
includes cuts to social spending. From 1960 to 1999, governments allocated, on average, 1.9%
of their annual GDP to health care spending during peace-time but only 1.6% while partici-
pating in an interstate war (data drawn from Kugler 2002). This 16.2% decline in health care
spending is statistically significant at the 0.01 level. Thus, the increase in military spending
associated with war mobilization often is accompanied with a decrease in the proportion of
economic resources dedicated to non-military spending.
The political cost of mobilization refers to how the patterns of government spending associ-
ated with an interstate war effort affect the political survival of an incumbent leader. Explicit
consideration of the domestic consequences of mobilization is almost non-existent in the schol-
arly literature. There are two notable exceptions. First, selectorate theory argues economic
mobilization for war should be relatively more costly for autocratic leaders than for democratic
leaders (Bueno de Mesquita et al. 1999, 2003, 2004). This claim follows from the assumptions
that winning an interstate war is a public good and the economic resources not allocated to a
war effort are then distributed to a leader’s winning coalition in the form of private benefits
(2003, pgs. 233, 266). These assumptions imply two things in the selectorate model of politics.
One, mobilization for interstate war increases the probability an autocratic leader will lose office
because it decreases the resources available to be spent on private benefits. Two, mobiliza-
tion indirectly decreases the probability a democratic incumbent will be removed from power
because it increases the probability a state will win a war. As such, selectorate theory con-
cludes the political cost of mobilization should be higher for autocratic leaders than democratic
leaders. Second, Goldsmith (2007) argues the existence of opposition parties in democracies
provides democratic incumbents with an incentive to mobilize resources for war absent for non-
5These figures are based on the National Material Capabilities data set (version 3.1) (Singer, Bremer and Stuckey1972) and Penn World Table (version 7.1) (Heston, Summers and Aten 2012).
6
democratic leaders. This is because citizens have the option of punishing an incumbent that
fails to allocate the resources necessary to win a war by voting for a leader’s political opposition
in a democracy. It then follows that not mobilizing economic resources for an interstate war
effort should be more costly for a democrat than a dictator.
The arguments of Bueno de Mesquita et al. (1999) and Goldsmith (2007) share three char-
acteristics. First, both argue that losing a war should be politically costlier for a democratic
leader than a dictator. However, empirical research that analyzes the relationship between war
outcomes and the conditional probability of leader survival finds that autocrats are more likely
to be removed from power for losing an interstate war than are democratic incumbents (Chiozza
and Goemans 2004, Debs and Goemans 2010). Second, both imply that the political cost of
mobilizing resources for interstate war should be lower for a democratic leader than a dictator.
Third, neither Bueno de Mesquita et al. nor Goldsmith test their predictions about the relative
political cost of mobilization across regime type. In contrast to existing research on the topic,
I argue the political cost of war mobilization should be higher for democratic incumbents than
for autocrats. The next section presents the logic behind this claim.
3 Theoretical Argument
I argue that patterns of war-time spending should be politically costlier for democratic
leaders than dictators. This claim follows from a set of straightforward assumptions about how
incumbent leaders allocate the economic resources available to them, variation in the composition
of winning coalitions across regime type, the relative spending preferences of the general public,
civilian elite, and members of the military, and the effect economic mobilization for interstate
war has on patterns of government spending.
My argument begins with the common assumption that all incumbents rely on the support of
a winning coalition to remain in power (e.g., Bueno de Mesquita et al. 2003). Following Bueno de
Mesquita et al., I define an incumbent’s winning coalition as the subset of the population who
have a say in choosing a government’s leadership whose support is necessary for her to retain
office. I further assume that one of the principle ways an incumbent maintains the political
support of her winning coalition is by allocating scarce economic resources to their preferred
policies (Smith and Bueno de Mesquita 2011, Arena and Nicoletti Forthcoming). It therefore
follows that an incumbent is more likely to be removed from power if she fails to spend her
7
nation’s economic resources in the manner preferred by her winning coalition.
The above assumptions imply that an incumbent’s prospects of retaining office are linked
to her winning coalition’s assessment of how a leader spends the resources available to her.
Understanding how war mobilization influences a leader’s probability of survival requires that
we identify the preferences of her winning coalition over how a government should distribute
its economic resources. At this point it is useful to divide a nation’s citizens between the
elite, who consist of wealthy civilians and members of the military, and the more numerous and
relatively poorer general public. The general public and elite systematically vary in their relative
membership in autocratic and democratic winning coalitions and in their relative preferences
for social and military spending. I focus first on their political influence across regime type.
The winning coalitions of democratic and non-democratic incumbents differ in two funda-
mental ways. The first is that the winning coalitions of democratic leaders are larger than the
winning coalitions of dictators (Bueno de Mesquita et al. 1999, 2003, 2004). I focus on the second
difference. The membership of autocratic and democratic winning coalitions largely are drawn
from different segments of a state’s population. Put simply, different types of people get into
the winning coalitions of democrats and dictators. The winning coalitions of democratic leaders
consist of proportionately more members of the general public and fewer civilian elites and mem-
bers of the military than do the winning coalitions of autocratic incumbents. The comparatively
small winning coalitions of autocratic leaders are made-up almost exclusively by members of the
civilian elite and/or military (Bueno de Mesquita et al. 2003), with the relative influence of the
civilian elite and military varying among non-democratic regime types (e.g., civilian dictatorship
vs. military junta).6 The political institutions of contemporary democracies make it impossible
for a democratic incumbent to retain office with only the support of her country’s civilian elite
and/or military. The relatively high levels of political participation and contestation associ-
ated with democracy result in democratic leaders requiring the support of a large portion of
the general public to remain in power (among many others, Dahl 1971, Boix 2003, Acemoglu
and Robinson 2006). It therefore follows that democratic winning coalitions are composed of
proportionately more members of the general public and fewer members of a society’s civilian
and military elite than are autocratic winning coalitions.
Variation in who gets into a leader’s winning coalition across regime type implies that a
6Space constraints prevent me from analyzing how variation among non-democracies influences the political costof mobilization in this manuscript.
8
democratic incumbent must be relatively more responsive to the preferences of the general public
in order to retain office while a dictator must be relatively more responsive to the preferences of
the elite. This insight is important for variation in the political cost of mobilization across regime
type because members of the public and elite should prefer different distributions of government
spending. Specifically, compared to members of the elite, members of the public generally prefer
their government allocate relatively more of its resources to social spending and fewer resources
to military spending.7 This claim follows from four observations. The first two concern the
preferences of the public and military over military spending. First, military training socializes
members of a state’s armed forces to value a stronger military and favor higher military spending
than the civilian population (Huntington 1957, Nordlinger 1977, Geddes 2003). As Szayna et al.
put it, members of the military “have a professional interest in higher defense spending, since
they have an occupational and institutional interest in increasing the level of resources devoted to
defense. In addition, because military officers have a more detailed and comprehensive knowledge
both of what resources the military needs and what acquiring those resources is likely to cost,
they are likely to have a clearer idea of what additional resources mean in terms of added
capabilities” (2007, pg. 123). Second, while all citizens benefit from the military expenditures
required to provide the public good of national security (Samuelson 1954, Olson 1965), the
public and members of the military have personal reasons to assess military spending beyond
what is required for national security differently. Military spending over and above the level
necessary to provide national security crowds out consumption spending popular among the
public (Sprout and Sprout 1968, Fordham and Walker 2005) but finances private benefits and
club goods for members of the military (on club goods, see Buchanan 1965). These private and
club benefits include, but are not limited to, the salaries of members of the military, access to
goods and services at reduced price at base or post exchanges, and free or subsidized housing.
Research on civilian-military preferences supports the claim that the public and members
of the military have different preferences over military spending. Bachman, Blair and Segal
(1977) find that, in general, members of the military prefer higher military spending than do
members of the public. Addressing a potential guns-versus-butter trade-off, Holsti (1998, 2001)
and Szayna et al. (2007) find that members of the public are more likely than members of the
7To be clear, I do not claim that all members of the public prefer higher military spending and lower social spendingthan all members of the elite. Rather, I argue that, on average, members of the public prefer their government allocatemore resources to social spending and fewer resources to military spending than do members of the wealthy civilianelite and military.
9
military to think that military spending should be decreased in order to increase education
spending. This preference for higher military spending by members of the military is consistent
with the greater weight they place on military superiority (Szayna et al. 2007) and is driven by
a combination of self-selection and socialization (Bachman et al. 2000).
The third and fourth observations concern the preferences of the public and civilian elite over
social spending. The third is that the public derives more direct benefits from social spending
than do the wealthy civilian elite, whom can provide themselves with the services that the
public receives via the welfare state (e.g., health care and education).8 Notably, this is the
case with all means-tested social welfare programs by definition. Second, spending on social
programs typically is financed through taxes on the wealth of the civilian elite (Przeworski
et al. 2000, Boix 2003). Thus, the civilian elite bear the brunt of the costs of the social welfare
state while deriving relatively fewer benefits than members of the public. It therefore follows
that the general public would prefer a government allocate proportionately more of its resources
to social spending than the civilian elite. This claim is consistent with the negative relationship
between income and support for the welfare state in the United States and Europe (Cook and
Barrett 1992, Jæger 2006). Beyond a general correlation, Gilens (2009, 2012) finds that the U.S.
public is more supportive of social welfare programs than the relatively affluent, defined as the
top 20% in terms of income. Focusing on the preferences of the very wealthy, Page, Bartels and
Seawright (2013) find that the public prefers increases in spending on health care, food stamps,
and social security while the top 1% of income earners prefer reductions in social spending.
Variation in who gets into autocratic and democratic winning coalitions and their spending
preferences imply that the political cost of mobilization for interstate war should be higher for
a democratic incumbent than a dictator. This claim follows from how mobilization for war
influences spending patterns and the distributions of spending that best secure the survival of
democratic and non-democratic incumbents. Economic mobilization for interstate war increases
the resources allocated to the military and often, but not always, is accompanied with a decrease
in the proportion of resources dedicated to social spending. Leaders are less likely to be removed
from power when they allocate resources in a manner consistent with the preferences of their
winning coalition. The spending preferences of the public, civilian elite, and military and their
8Members of the elite do derive some benefits from social spending. In particular, the elite would benefit fromsome of the long-term consequences of increased social spending, such as an educated and healthier workforce. Thatsaid, it is members of the public, and not the elite, that would be better educated, healthier and have a longerlife-expectancy due to government spending on social programs.
10
representation in leaders’ winning coalitions across regime type imply that democratic leaders
are more likely to lose office given relatively high levels of military spending and low levels of
social spending than are dictators. The patterns of government spending typically associated
with economic mobilization for interstate war therefore should be more likely to result in a
democratic incumbent losing power than an autocratic leader.
I argue that war-time patterns of government spending should be costlier for a democratic
leader than a dictator. Two possibilities could cut against my hypothesis. First, a survival-
motivated democratic leader has an incentive to finance a war effort in a manner that lowers
the probability her winning coalition removes her from office. To see how this might work,
it is useful to separate the increase in military spending inherent in a war effort from the
decrease in social spending that can accompany mobilization. Leaders that are able to finance
an interstate war exclusively through some combination of borrowing money (Slantchev 2012),
raising taxes (Bank, Stark and Thorndike 2008), and inflation (Capella 2013) can avoid reducing
the proportion of their national resources dedicated to social spending (e.g., the United States
in the Second Gulf War). While the members of the public might prefer the resources used
to increase military spending be allocated to social spending (as suggested by the findings of
Holsti (2001) and Szayna et al. (2007)), fighting a war without reducing social spending could
minimize the political cost of mobilization for a democratic incumbent.9 A second possible
issue with my argument is that members of the public might accept higher levels of military
spending when their country is fighting a war than would otherwise be the case. This might
occur because of a “rally around the flag” effect (Mueller 1973) or a recognition that providing
the public good of national security requires greater economic resources during an interstate war
(Sandler and Hartley 1995). Regardless of the reason, the increase in military spending inherent
in a mobilization effort should not lower the probability a democratic leader remains in office
if publics systematically support higher levels of military spending during a war. Ultimately,
whether democratic leaders pay a higher political cost than dictators for war-time spending
patterns is an empirical question. The next section describes the data and methods used to
assess the effect of war mobilization on leader survival across regime type.
9One way to think about this is that democratic winning coalitions might be less likely to punish their leaders forthe opportunity costs of higher military spending during a war than the realized cost of reduced social spending.
11
4 Research Design
The relationship between leader survival, regime type, and war mobilization is estimated
using data on the universe of political executives from 1950 to 2001.10 With the exception of
variables measuring government spending, all data were taken from the replication materials
associated with Debs and Goemans (2010).11 The dependent variable is the number of days
a leader has been in power and is drawn from the Archigos project (Goemans, Gleditsch and
Chiozza 2009).12
There are three theoretical concepts that need to be operationalized in order to assess how
war mobilization influences the survival of democratic and non-democratic leaders: regime type,
interstate war, and military spending. Democracy is coded 1 in year t if a leader’s government
has a value of +7 or greater on the 21-point Polity2 index (Marshall and Jaggers 2005) and 0
otherwise.13 The dichotomous variable Interstate War is coded 1 in year t if a leader’s country is
involved in an interstate war and 0 otherwise and is based on data from the International Crisis
Behavior (ICB) project (Brecher and Wilkenfeld 1997). Military Spending is operationalized in
two ways in order to model two different conceptions of war mobilization. The first measure
reflects a state’s defense burden, or the percent of a country’s gross domestic product (GDP)
allocated to the military in year t. A state’s defense burden is the traditional indicator of national
military spending in the defense economics literature (e.g., Sandler and Hartley 1995).14 Military
spending is relatively higher during an interstate war than when a country is at peace. Thus,
we can think of mobilization as influencing the level of military spending. The second measure
10All statistical analyses were conducted in R (R Core Team 2013). Upon publication, I will make available alldata and code needed to replicate all of the analyses associated with this manuscript.
11Available at http://www.rochester.edu/college/faculty/hgoemans/research.htm.12Leader failure is coded as occurring when an incumbent is removed by a domestic audience. Leader replacement
by a foreign power or due to a natural death represent fundamentally different data generating processes.13I considered using Bueno de Mesquita et al.’s (2003) variables W and/or WoverS to proxy regime type, but
decided to use a dichotomous version of the Polity2 index for three reasons. First, my argument is concerned withvariation across regime type in the preferences of the members of a leader’s winning coalition, not with variationin the size of a leader’s winning coalition. Neither of Bueno de Mesquita et al.’s measures taps into preferencevariation. Second, their measures are primarily derived from variables from the Polity project and it is not clearwhat they are capturing independent of the Polity2 index (Clarke and Stone 2008, Kennedy 2009). Third, and mostimportantly, W takes on values larger than S in almost 16% of the observations in which data are available for both(see the variable WoverS in the file bdm2s2−nation−year−data.dta at http://www.nyu.edu/gsas/dept/politics/data/bdm2s2/Logic.htm). This is problematic as W should be smaller than S by definition. Given these reasons, Ioperationalize democracy using the more common Polity data.
14The theoretically interesting concept is how much of the resources potentially available to a leader are spenton the military. Measuring spending as a percentage of GDP does a better job at capturing this than a measureof raw expenditures. By explicitly accounting for variation in gross levels of economic resources across countries,standardizing spending over GDP reflects the idea that government spending mirrors the relative preferences andpriorities of a state’s leadership (Sandler and Hartley 1995).
12
of military spending identifies the deviation from a state’s mean defense burden in year t. If
leaders respond to the preferences of their winning coalition through government spending, then
long-term, mean levels of military spending should approach the optimal distribution for an
office-valuing incumbent. War mobilization results in a positive deviation from mean patterns
of military spending. The second measure of military spending allows me to capture this view of
mobilization. Both measures of Military Spending draw on the National Material Capabilities
data set (Singer, Bremer and Stuckey 1972) for expenditure data and GDP data from Gleditsch
(2002).
Retrieving unbiased estimates of how regime type, interstate war, and military spending
interact to influence leader survival requires that a statistical model include all possible interac-
tions among Democracy, Interstate War, and Military Spending (e.g., Braumoeller 2004, Bram-
bor, Clark and Golder 2006). Omitting lower-order and/or “tacit” interaction terms assumes
these effects are zero and, therefore, can lead to biased inferences.15 The effect of war mobi-
lization on leader survival across regime type therefore is modeled with Democracy, Interstate
War, Military Spending, and the full set of interaction terms among these three measures.
Instead of using interaction terms, an alternative way to estimate conditional relationships
is to split the sample by a relevant variable. Splitting the sample by regime type might seem
like an attractive option as it would allow for a more parsimonious specification. However,
it is an inappropriate modeling strategy in this case. My theoretical expectation is that war
mobilization is relatively costlier for democratic leaders than it is for dictators. Directly assessing
this prediction requires that I test whether the effect of mobilization on the probability a leader
remains in power is different across regime type. This is possible when the relationship between
war mobilization, interstate war, and regime type are modeled using interaction terms, but not
with a split-sample approach.16 This is because one can directly test whether multiple predicted
probabilities generated from the same model are statistically different from one another, but can
only make claims that predicted probabilities appear to be different when they are generated
from different statistical models (in particular, see Kam and Franzese 2007).
While not inherently part of a mobilization effort, participation in an interstate war often is
accompanied by a reduction in the proportion of resources allocated to non-military purposes.
15For further discussion of the consequences of omitting relevant terms when modeling multiplicative interactionterms, see Braumoeller (2004), Brambor, Clark and Golder (2006), or Kam and Franzese (2007).
16Further, modeling conditional relationships using a split-sample appoach is relatively inefficient compared todoing so with multiplicative interaction terms (Kam and Franzese 2007).
13
The theoretical argument developed above indicates that altering patterns of social spending, in
particular, could influence the probability of leader survival. Further, the effect of war-time social
spending on leader survival is likely to vary across regime type. I model the relationship between
leader survival and social spending in two ways. First, the primary models include a measure
of social spending as a control variable. This allows the models to isolate the effect of war
mobilization (i.e., higher military spending) on leader survival while accounting for the average
influence of an occasional consequence of mobilization (i.e., lower social spending). Second,
a set of additional analyses treat social spending as part of the mobilization process. This is
accomplished by incorporating a measure of social spending into the set of interaction terms
among Democracy, Interstate War, and Military Spending. Doing so allows for an unbiased
estimate of how patterns of social spending associated with a mobilization effort influence the
survival prospects of democratic and non-democratic leaders. My primary measure of social
spending is the percentage of a state’s GDP allocated to health care in year t. Health Care
Spending is drawn from Kugler (2002). I use health care spending to capture a state’s social
spending because it is available for a greater number of countries for a longer period of time than
other common indicators of social spending (e.g., education spending, unemployment insurance,
welfare effort). As with Military Spending, I also estimate models using the annual deviation
from a state’s mean Health Care Spending.
The statistical models control for a number of factors thought to influence leader sur-
vival. I account for whether the leader’s country was victorious (War Win), vanquished (War
Loss), or obtained a draw (War Draw) in an interstate war during her time in power. Each
variable is modeled as a decay function of War Outcome = 11+t , where War Outcome ∈
{War Win,War Draw,War Loss} and t stands for the number of years since the given out-
come was achieved. The war outcome variables are based on data from Brecher and Wilkenfeld
(1997). At the state-level, I control for a country’s involvement in a Civil War in a given year
with a dichotomous indicator based on the UCDP/PRIO Armed Conflict Database (Gleditsch
et al. 2002). The models also account for four aspects of a state’s economy: its (logged) GDP per
capita (Maddison 2008), GDP growth (Maddison 2008), Trade Openness (International Mone-
tary Fund 2008), and Change in Trade Openness (International Monetary Fund 2008). A state’s
(logged) Population (Singer, Bremer and Stuckey 1972) also is included as a control variable.
The models account for three leader-level characteristics thought to influence an incumbent’s
tenure: a leader’s Age when he or she entered office, the number of Previous Times in Office
14
he or she served, and whether he or she came to power via an Irregular Entry. These three
variables are drawn from the Archigos project (Goemans, Gleditsch and Chiozza 2009). Finally,
all of the models contain a set of variables that identify whether a state is located in Africa,
the Americas, Asia, or the Middle East (Europe serves as the baseline category). These vari-
ables allow the statistical models to capture any region-specific variation in leader survival not
explicitly accounted for by the other independent variables.
I estimate leader survival using semi-parametric Cox models. Cox models are preferable
to parametric event history models (e.g., exponential, Weibull, or Gompertz) when the phe-
nomenon of theoretical interest is the relationship between a set of covariates and the likelihood
of a subject failing and not the distributional form of subject failure (Box-Steffensmeier and
Jones 2004). The models estimated here account for non-proportional hazards between covari-
ates and leader survival. Analysis of the Schoenfeld residuals was used to determine whether
the influence of an explanatory variable on the hazard of a subject failing was constant over
time (Box-Steffensmeier and Jones 2004). Following Box-Steffensmeier and Zorn (2001), any
offending variable was interacted with the natural log of a leader’s tenure in office up to time
t. I also extend the standard Cox model to capture shared frailty among leaders of the same
state. Shared frailty event history models account for unobserved heterogeneity across sub-
groups that makes subjects within group j more or less likely to fail than subjects in group j
(Box-Steffensmeier and Jones 2004). Formally, the frailty term ν is a random variable with a
mean of 1 and variance of Θ and is drawn from the Gamma distribution. It is conceptually
analogous to a random effect clustered on countries in the regression framework. Previously,
Chiozza and Goemans (2004), Goemans (2008), and Debs and Goemans (2010) have used Cox
models with shared frailty to model leadership survival.
Amelia II was used to address concerns about missing data (Honaker, King and Blackwell
2007).17 Multiple imputation of missing observations helps avoid the inefficiency and selection
bias associated with listwise deletion and is more accurate than single imputation (King et al.
2001, Honaker, King and Blackwell 2007). For the data analyzed here, Amelia II is preferable
to other imputation programs as it explicitly takes into account the time-series, cross-sectional
nature of the data (Honaker, King and Blackwell 2007, Honaker and King 2010). The multiple
imputation model was specified with one-year lags, one-year leads, and logical or empirical
17I imputed missing values for the constituent terms of the interaction terms and then created the interactionterms based on variables without missing observations. This ensures that the values the interaction terms take onaccurately reflect the values of the constituent terms.
15
upper and lower bounds of variables with missing observations.18 Including the lags, leads,
and bounds improves the predictive performance of the imputation model (Honaker, King and
Blackwell 2007, Honaker and King 2010). Further details about the imputation process are
available in the Supplementary Appendix. The multiple imputation model produced five data
sets of 7,935 leader-year observations (1,431 leaders from 162 countries). The next section
presents my analyses of the political cost of mobilization in democracies and dictatorships.
5 Empirical Results
Table 1 reports my regression results. Model 1 operationalizes Military Spending as a state’s
defense burden in year t, or the percent of a state’s GDP allocated to military expenditures,
while Model 2 measures Military Spending as a state’s deviation in year t from its average
defense burden. The estimates presented in Table 1 reflect the mean coefficients and corrected
standard errors, as computed by Rubin’s (1987) method, yielded by the estimation of identically
specified Cox models on each of the five Amelia II -generated data sets.19 Positive (negative)
coefficients indicate higher values of an explanatory variable are associated with a leader facing a
greater (lower) hazard of losing office. An interaction with ln(t) signed in the opposite direction
of the constituent term indicates a decay in the original effect over a leader’s tenure.
Two things about Table 1 are worth noting before discussing the theoretically interesting
results. First, the statistically significant Θ indicates non-trivial variation exists in the likelihood
of a leader being removed from power across states and that accounting for shared frailty among
leaders of the same country is methodologically appropriate. Second, the regional indicators are
statistically significant in both models, indicating regional variation in patterns of leader tenure.
The use of multiplicative interaction terms limits the inferences one can draw from Table
1 for two reasons. First, the coefficient associated with any variable tells us the impact of an
increase in that variable when all of the other constituent terms are equal to zero (Braumoeller
2004).20 Second, the standard error associated with a coefficient reflects the uncertainty around
18That is, variables that have a lower and upper bound by definition were assumed to fall in the range defined bythose bounds (e.g., Health Care Spending was forced to take on a value between 0 and 100) while variables withouta logical range were bounded by the minimum and maximum values observed in the data set (e.g., Change in TradeOpenness was forced to fall into the range of -5.82 and 5.72).
19The standard errors are computed by taking the square root of T = U + (1 + 1m)B, where T is the total
variance associate with the mean coefficient estimate, U is the within-imputation variance of the estimated coefficient[U = 1
m
∑mi=1 Ui], B is the between-imputation variance [B = 1
m−1
∑mi=1(Q− Q)2], and 1 + 1
mis a correction factor
to account for simulation error in Q (Schafer and Olsen 1998). Calculations based on code from Goemans (2008).20For example, Interstate War ’s coefficient represents the influence of war on the hazard of leader removal when
16
a variable’s estimated effect when the other constituent terms and interaction terms are equal to
zero and does not account for the covariance among that variable, the other constituent terms,
and the interaction terms (Brambor, Clark and Golder 2006). These points limit what Table 1
can tell us about how mobilization influences leader survival in democracies and dictatorships.
I therefore used a set of simulations based on the models’ parameter estimates to calculate
how mobilization for interstate war influences the survival prospects of a democratic leader and
a non-democratic leader. I took 1,000 draws from a multivariate normal distribution based on
the coefficient and variance-covariance matrices of each model estimated on each of the five
imputed data sets using the MSBVAR package in R (Brandt 2012). I then used the simulated
coefficients to calculate the probability of a democratic leader and a dictator surviving up to
time t over a five-year period given three mobilization scenarios. Each scenario assumes that a
leader mobilized her country’s resources and fought an interstate war in her first two years in
office (mean war duration in the data), and then was able to return military spending back to its
mean peace-time levels during the following three years. The values of Military Spending used
in the simulations represent the average values for a given scenario across the five imputed data
sets. Focusing on the simulations based on Model 1, the first scenario assumes that a leader was
able to fight a war without increasing military spending from its peace-time level (i.e., Military
Spending took on values of 2.63%). This serves as a baseline from which we can estimate how
politically costly mobilizations are for a leader. The second scenario assumes that a leader
engaged in an average mobilization, which was accomplished by setting Military Spending to its
mean war-time values while the war was being waged (6.61%). The third scenario models a large
mobilization effort by setting Military Spending to 10.14% during the war, which represents the
80th percentile war-time value of military spending. As this value for Military Spending might
seem high, it is worth noting that average annual U.S. defense burdens were approximately 32%
in World War II, 10% in the Korean War, and 7% in the Vietnam War. Thus, military spending
in the “large” mobilization scenario is closer to the U.S. experience in the Korean War than
it is to the mobilization of the “Arsenal of Democracy” in World War II. The values of the
constituent variables and interaction terms were manipulated as necessary to accurately reflect
the different scenarios. All of the simulations assume that the incumbent controlled a European
country, won the war, and had either the mean (continuous variables) or median (nominal or
ordinal variables) characteristics with respect to the other control variables.
Democracy, Military Spending, and their various interactions are all equal to zero.
17
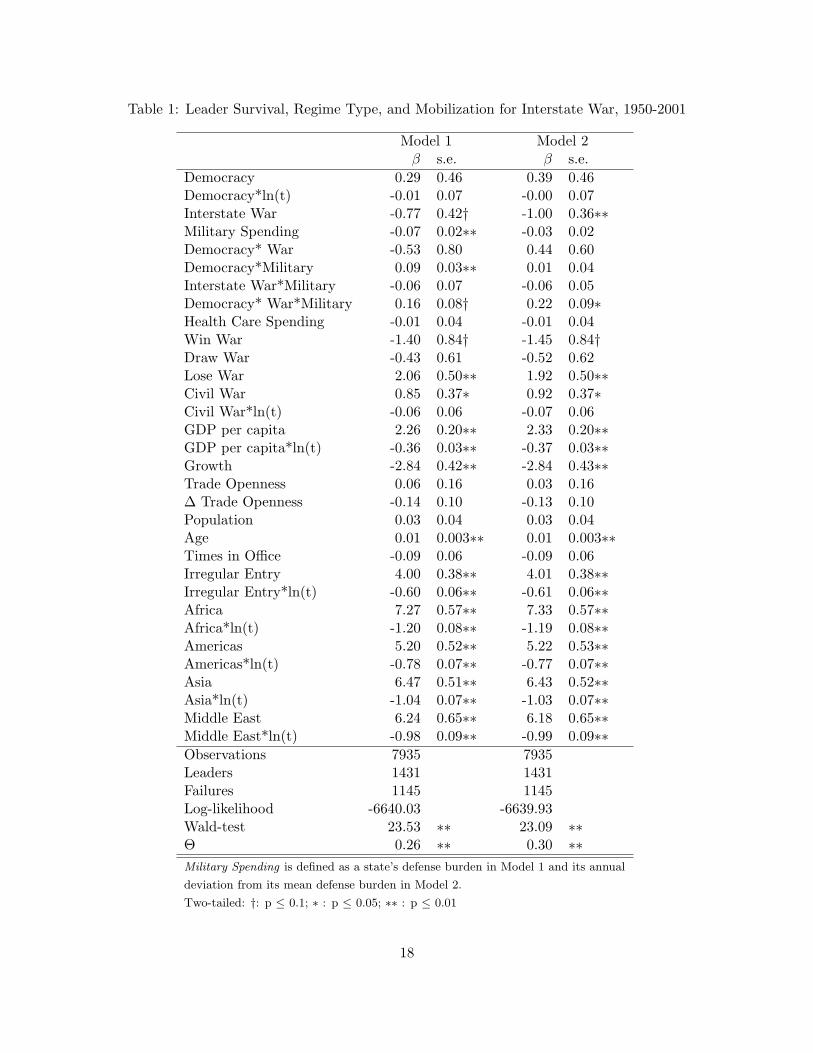
Table 1: Leader Survival, Regime Type, and Mobilization for Interstate War, 1950-2001
Model 1 Model 2β s.e. β s.e.
Democracy 0.29 0.46 0.39 0.46Democracy*ln(t) -0.01 0.07 -0.00 0.07Interstate War -0.77 0.42† -1.00 0.36∗∗Military Spending -0.07 0.02∗∗ -0.03 0.02Democracy* War -0.53 0.80 0.44 0.60Democracy*Military 0.09 0.03∗∗ 0.01 0.04Interstate War*Military -0.06 0.07 -0.06 0.05Democracy* War*Military 0.16 0.08† 0.22 0.09∗Health Care Spending -0.01 0.04 -0.01 0.04Win War -1.40 0.84† -1.45 0.84†Draw War -0.43 0.61 -0.52 0.62Lose War 2.06 0.50∗∗ 1.92 0.50∗∗Civil War 0.85 0.37∗ 0.92 0.37∗Civil War*ln(t) -0.06 0.06 -0.07 0.06GDP per capita 2.26 0.20∗∗ 2.33 0.20∗∗GDP per capita*ln(t) -0.36 0.03∗∗ -0.37 0.03∗∗Growth -2.84 0.42∗∗ -2.84 0.43∗∗Trade Openness 0.06 0.16 0.03 0.16∆ Trade Openness -0.14 0.10 -0.13 0.10Population 0.03 0.04 0.03 0.04Age 0.01 0.003∗∗ 0.01 0.003∗∗Times in Office -0.09 0.06 -0.09 0.06Irregular Entry 4.00 0.38∗∗ 4.01 0.38∗∗Irregular Entry*ln(t) -0.60 0.06∗∗ -0.61 0.06∗∗Africa 7.27 0.57∗∗ 7.33 0.57∗∗Africa*ln(t) -1.20 0.08∗∗ -1.19 0.08∗∗Americas 5.20 0.52∗∗ 5.22 0.53∗∗Americas*ln(t) -0.78 0.07∗∗ -0.77 0.07∗∗Asia 6.47 0.51∗∗ 6.43 0.52∗∗Asia*ln(t) -1.04 0.07∗∗ -1.03 0.07∗∗Middle East 6.24 0.65∗∗ 6.18 0.65∗∗Middle East*ln(t) -0.98 0.09∗∗ -0.99 0.09∗∗Observations 7935 7935Leaders 1431 1431Failures 1145 1145Log-likelihood -6640.03 -6639.93Wald-test 23.53 ∗∗ 23.09 ∗∗Θ 0.26 ∗∗ 0.30 ∗∗Military Spending is defined as a state’s defense burden in Model 1 and its annual
deviation from its mean defense burden in Model 2.
Two-tailed: †: p ≤ 0.1; ∗ : p ≤ 0.05; ∗∗ : p ≤ 0.01
18
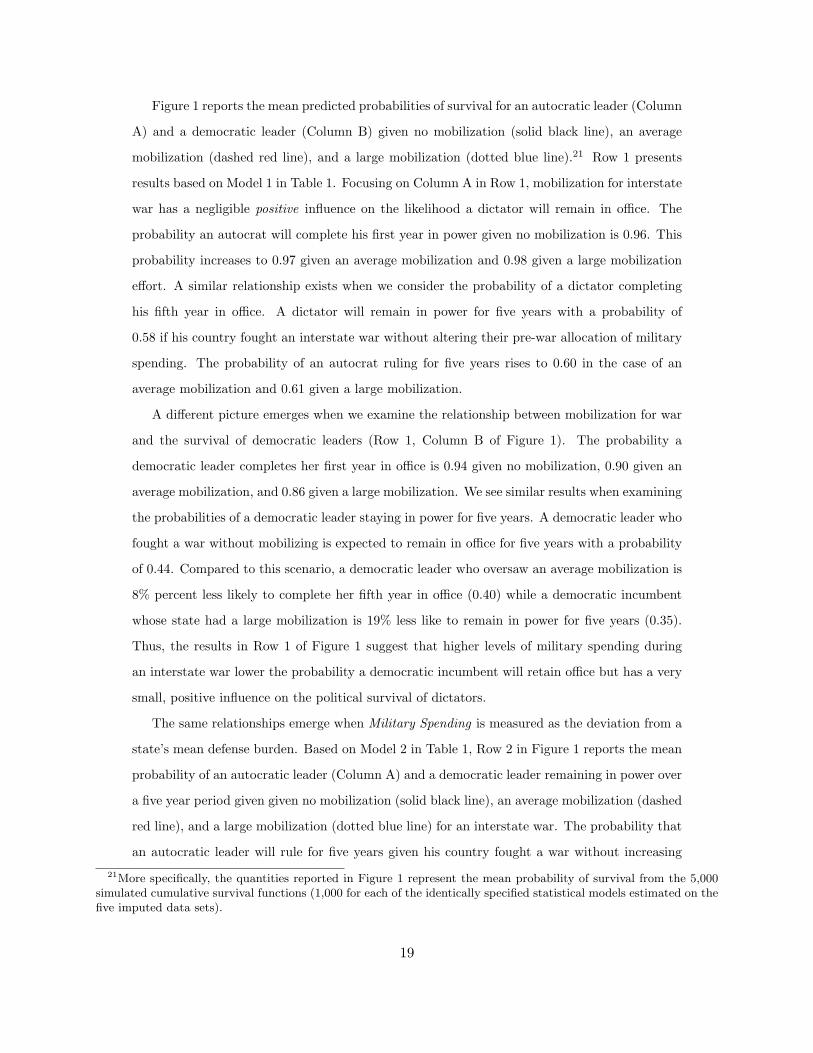
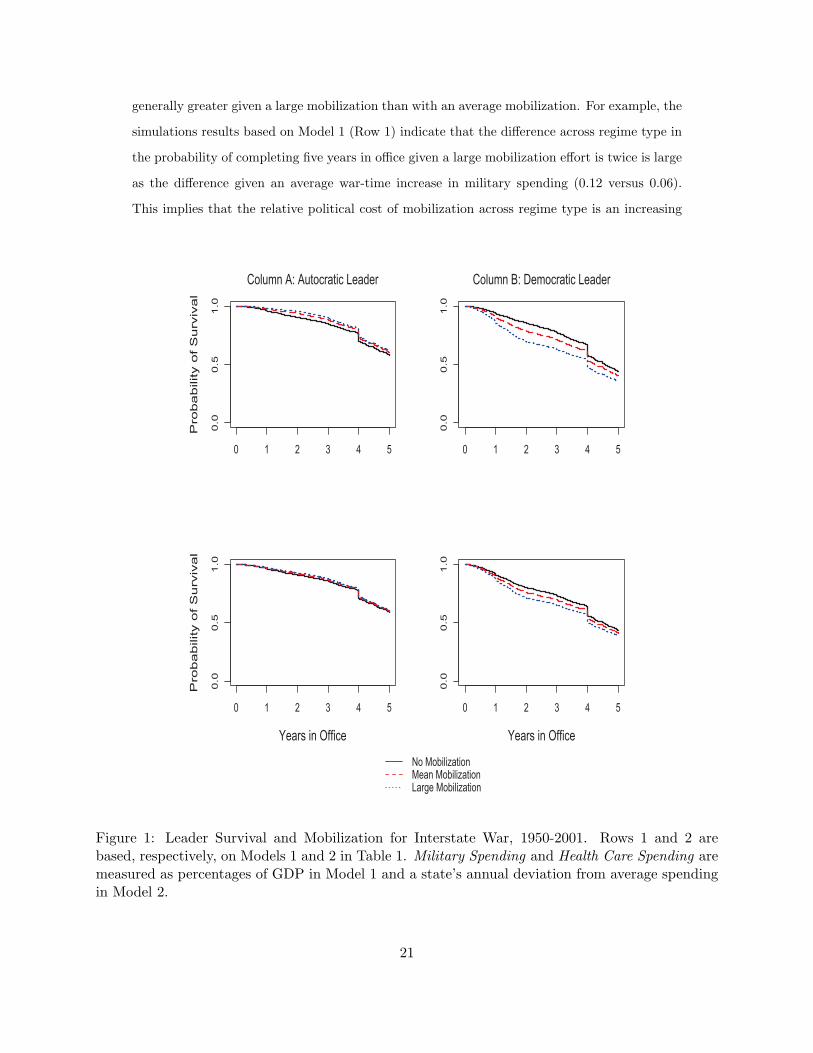
Figure 1 reports the mean predicted probabilities of survival for an autocratic leader (Column
A) and a democratic leader (Column B) given no mobilization (solid black line), an average
mobilization (dashed red line), and a large mobilization (dotted blue line).21 Row 1 presents
results based on Model 1 in Table 1. Focusing on Column A in Row 1, mobilization for interstate
war has a negligible positive influence on the likelihood a dictator will remain in office. The
probability an autocrat will complete his first year in power given no mobilization is 0.96. This
probability increases to 0.97 given an average mobilization and 0.98 given a large mobilization
effort. A similar relationship exists when we consider the probability of a dictator completing
his fifth year in office. A dictator will remain in power for five years with a probability of
0.58 if his country fought an interstate war without altering their pre-war allocation of military
spending. The probability of an autocrat ruling for five years rises to 0.60 in the case of an
average mobilization and 0.61 given a large mobilization.
A different picture emerges when we examine the relationship between mobilization for war
and the survival of democratic leaders (Row 1, Column B of Figure 1). The probability a
democratic leader completes her first year in office is 0.94 given no mobilization, 0.90 given an
average mobilization, and 0.86 given a large mobilization. We see similar results when examining
the probabilities of a democratic leader staying in power for five years. A democratic leader who
fought a war without mobilizing is expected to remain in office for five years with a probability
of 0.44. Compared to this scenario, a democratic leader who oversaw an average mobilization is
8% percent less likely to complete her fifth year in office (0.40) while a democratic incumbent
whose state had a large mobilization is 19% less like to remain in power for five years (0.35).
Thus, the results in Row 1 of Figure 1 suggest that higher levels of military spending during
an interstate war lower the probability a democratic incumbent will retain office but has a very
small, positive influence on the political survival of dictators.
The same relationships emerge when Military Spending is measured as the deviation from a
state’s mean defense burden. Based on Model 2 in Table 1, Row 2 in Figure 1 reports the mean
probability of an autocratic leader (Column A) and a democratic leader remaining in power over
a five year period given given no mobilization (solid black line), an average mobilization (dashed
red line), and a large mobilization (dotted blue line) for an interstate war. The probability that
an autocratic leader will rule for five years given his country fought a war without increasing
21More specifically, the quantities reported in Figure 1 represent the mean probability of survival from the 5,000simulated cumulative survival functions (1,000 for each of the identically specified statistical models estimated on thefive imputed data sets).
19
military spending is 0.59. This probability marginally increases to 0.60 given either an average
or large mobilization effort. In contrast, larger positive deviations in a state’s military spending
during war-time are associated with a lower probability of survival for democratic leaders. The
likelihood a democratic incumbent completes her fifth year in office given no mobilization is
0.44, decreases to 0.41 with a mean mobilization effort, and 0.38 given a large positive deviation
in military spending during an interstate war.
Figure 1 indicates that larger mobilization efforts decrease the probability a democratic leader
retains office and has a negligible positive effect on autocratic survival. Ultimately, though, these
results only offer suggestive support for the claim that the political cost of war mobilization is
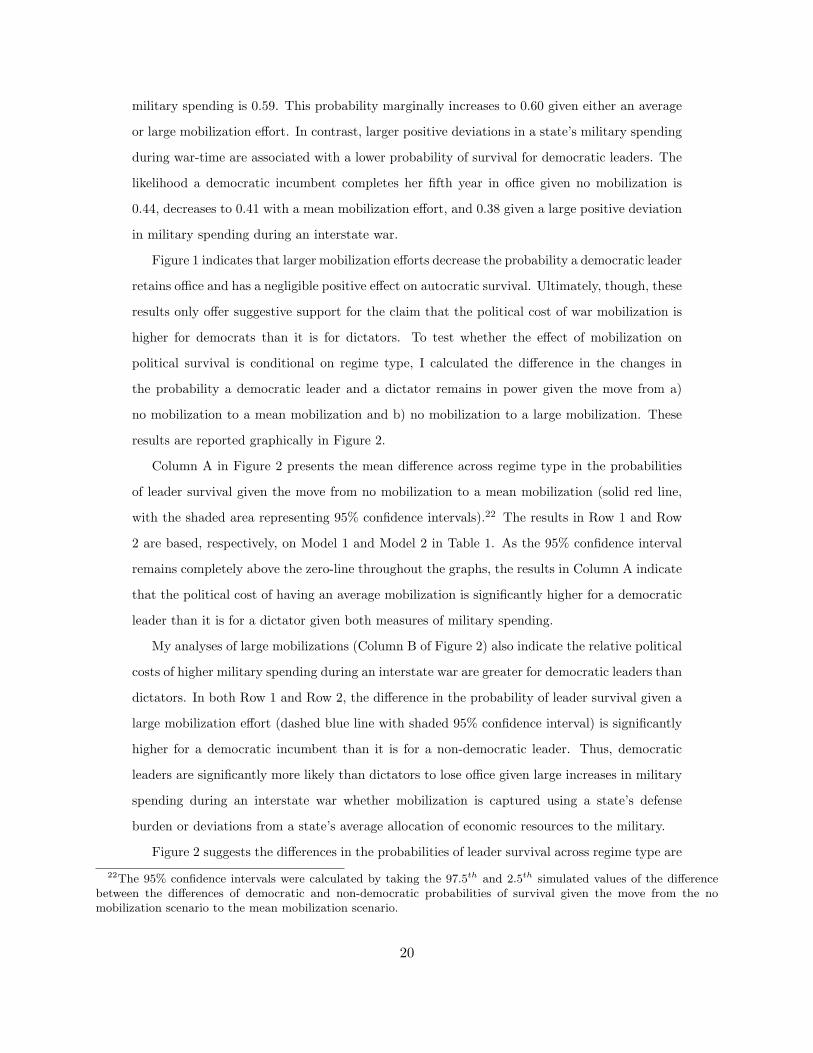
higher for democrats than it is for dictators. To test whether the effect of mobilization on
political survival is conditional on regime type, I calculated the difference in the changes in
the probability a democratic leader and a dictator remains in power given the move from a)
no mobilization to a mean mobilization and b) no mobilization to a large mobilization. These
results are reported graphically in Figure 2.
Column A in Figure 2 presents the mean difference across regime type in the probabilities
of leader survival given the move from no mobilization to a mean mobilization (solid red line,
with the shaded area representing 95% confidence intervals).22 The results in Row 1 and Row
2 are based, respectively, on Model 1 and Model 2 in Table 1. As the 95% confidence interval
remains completely above the zero-line throughout the graphs, the results in Column A indicate
that the political cost of having an average mobilization is significantly higher for a democratic
leader than it is for a dictator given both measures of military spending.
My analyses of large mobilizations (Column B of Figure 2) also indicate the relative political
costs of higher military spending during an interstate war are greater for democratic leaders than
dictators. In both Row 1 and Row 2, the difference in the probability of leader survival given a
large mobilization effort (dashed blue line with shaded 95% confidence interval) is significantly
higher for a democratic incumbent than it is for a non-democratic leader. Thus, democratic
leaders are significantly more likely than dictators to lose office given large increases in military
spending during an interstate war whether mobilization is captured using a state’s defense
burden or deviations from a state’s average allocation of economic resources to the military.
Figure 2 suggests the differences in the probabilities of leader survival across regime type are
22The 95% confidence intervals were calculated by taking the 97.5th and 2.5th simulated values of the differencebetween the differences of democratic and non-democratic probabilities of survival given the move from the nomobilization scenario to the mean mobilization scenario.
20
generally greater given a large mobilization than with an average mobilization. For example, the
simulations results based on Model 1 (Row 1) indicate that the difference across regime type in
the probability of completing five years in office given a large mobilization effort is twice is large
as the difference given an average war-time increase in military spending (0.12 versus 0.06).
This implies that the relative political cost of mobilization across regime type is an increasing0.0
0.5
1.0
0 1 2 3 4 5
Pro
ba
bility o
f S
urv
iva
l
Column A: Autocratic Leader
0.0
0.5
1.0
0 1 2 3 4 5
Column B: Democratic Leader
0.0
0.5
1.0
0 1 2 3 4 5
Pro
ba
bility o
f S
urv
iva
l
Years in Office
0.0
0.5
1.0
0 1 2 3 4 5
Years in Office
No Mobilization
Mean Mobilization
Large Mobilization
Figure 1: Leader Survival and Mobilization for Interstate War, 1950-2001. Rows 1 and 2 arebased, respectively, on Models 1 and 2 in Table 1. Military Spending and Health Care Spending aremeasured as percentages of GDP in Model 1 and a state’s annual deviation from average spendingin Model 2.
21
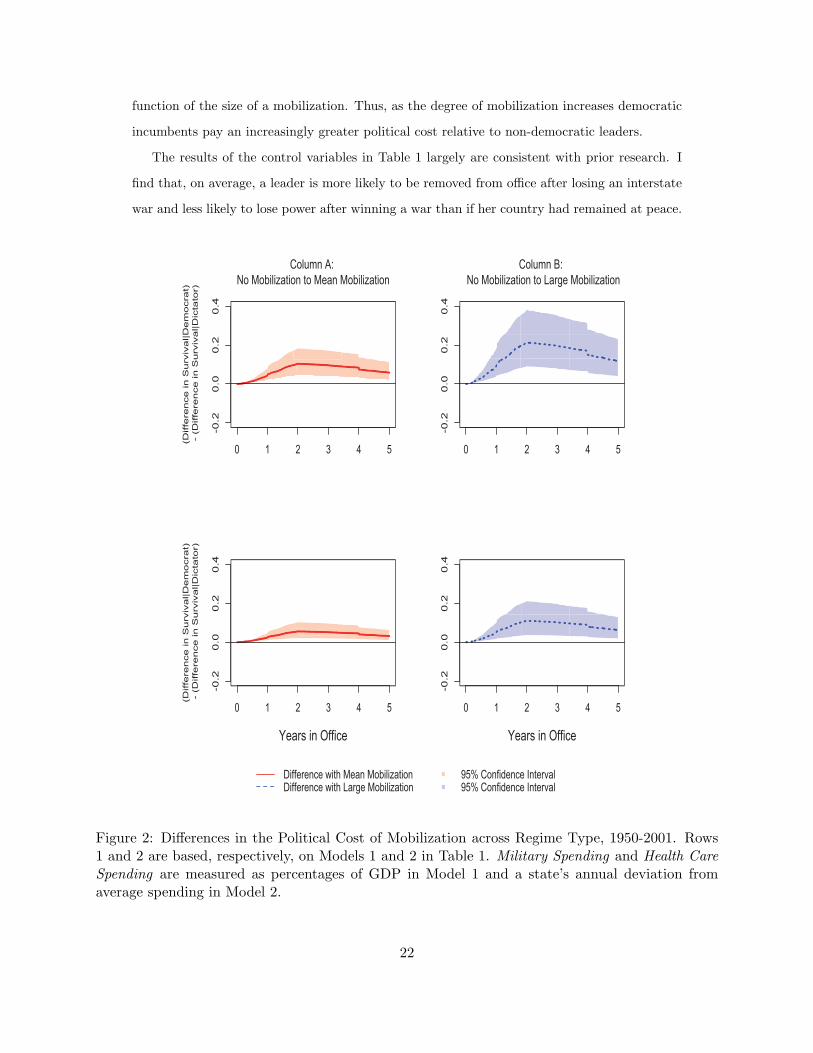
function of the size of a mobilization. Thus, as the degree of mobilization increases democratic
incumbents pay an increasingly greater political cost relative to non-democratic leaders.
The results of the control variables in Table 1 largely are consistent with prior research. I
find that, on average, a leader is more likely to be removed from office after losing an interstate
war and less likely to lose power after winning a war than if her country had remained at peace.
0 1 2 3 4 5
-0.2
0.0
0.2
0.4
(Diffe
rence in S
urv
ival|D
em
ocra
t)
- (
Diffe
rence in S
urv
ival|D
icta
tor)
Column A:
No Mobilization to Mean Mobilization
0 1 2 3 4 5-0.2
0.0
0.2
0.4
Column B:
No Mobilization to Large Mobilization
0 1 2 3 4 5
-0.2
0.0
0.2
0.4
(Diffe
rence in S
urv
ival|D
em
ocra
t)
- (
Diffe
rence in S
urv
ival|D
icta
tor)
Years in Office
0 1 2 3 4 5
-0.2
0.0
0.2
0.4
Years in Office
Difference with Mean Mobilization
Difference with Large Mobilization95% Confidence Interval
95% Confidence Interval
Figure 2: Differences in the Political Cost of Mobilization across Regime Type, 1950-2001. Rows1 and 2 are based, respectively, on Models 1 and 2 in Table 1. Military Spending and Health CareSpending are measured as percentages of GDP in Model 1 and a state’s annual deviation fromaverage spending in Model 2.
22
Obtaining a draw does not have a significant influence on a leader’s expected tenure.23 My results
suggest that civil war and an irregular entry increase a leader’s hazard of losing office, but that
these relationships weaken throughout an incumbent’s tenure (e.g., Debs and Goemans 2010).
I also find that the leaders of wealthier countries face a higher probability of losing office early
in their tenures, but that this effect decreases over time. Positive economic growth significantly
lowers the probability an incumbent is removed from power (Chiozza and Goemans 2004, Debs
and Goemans 2010). I find no significant relationship between an incumbent’s probability of
survival and the number of previous times she has been in office or her state’s trade openness,
change in trade openness, or (logged) population.
5.1 Additional Analyses
The findings presented above indicate that mobilization for interstate war is politically
costlier for democratic leaders than it is for dictators. I conducted a set of additional anal-
yses to see if this substantive inference holds given different model specifications. For space
considerations, I present graphs of the differences across regime type in the probability of leader
survival given different mobilization efforts here and report the statistical models in the Sup-
plementary Appendix.
My primary analyses use health care spending to proxy social spending because cross-national
data on health care spending are available for a longer period of time for more countries than
other indicators of social spending. It is possible, though, that an alternative measure of social
spending would not yield the same results. I therefore re-estimated the models reported in Table
1 using a state’s education spending to capture social spending (measure taken from World Bank
(2001)). Figure 3 reports the difference in the changes in the probability a democratic leader and
a dictator retain office given the move from fighting a war with no mobilization to an average
mobilization and a large mobilization.
Column A in Figure 3 presents the mean difference across regime type in the probabilities of
leader survival given the move from no mobilization to an average mobilization (solid red line,
23It should be noted that these findings do not challenge the conclusions of Chiozza and Goemans (2004), Goemans(2008), Debs and Goemans (2010), or Chiozza and Goemans (2011) that the tenure of autocrats is more sensitiveto war outcomes than the tenure of democrat incumbents. My findings indicate that, on average, a leader is likelyto have a shorter tenure if she oversees a losing war effort than if her state had avoided fighting an interstate warand makes no claims about variation across regime type in the effect of war outcomes on leader survival. Explicitlymodeling this variation would have required me to include all of the interactions among Democracy, Interstate War,Military Spending, War Win, War Draw, and War Loss in the same model.
23
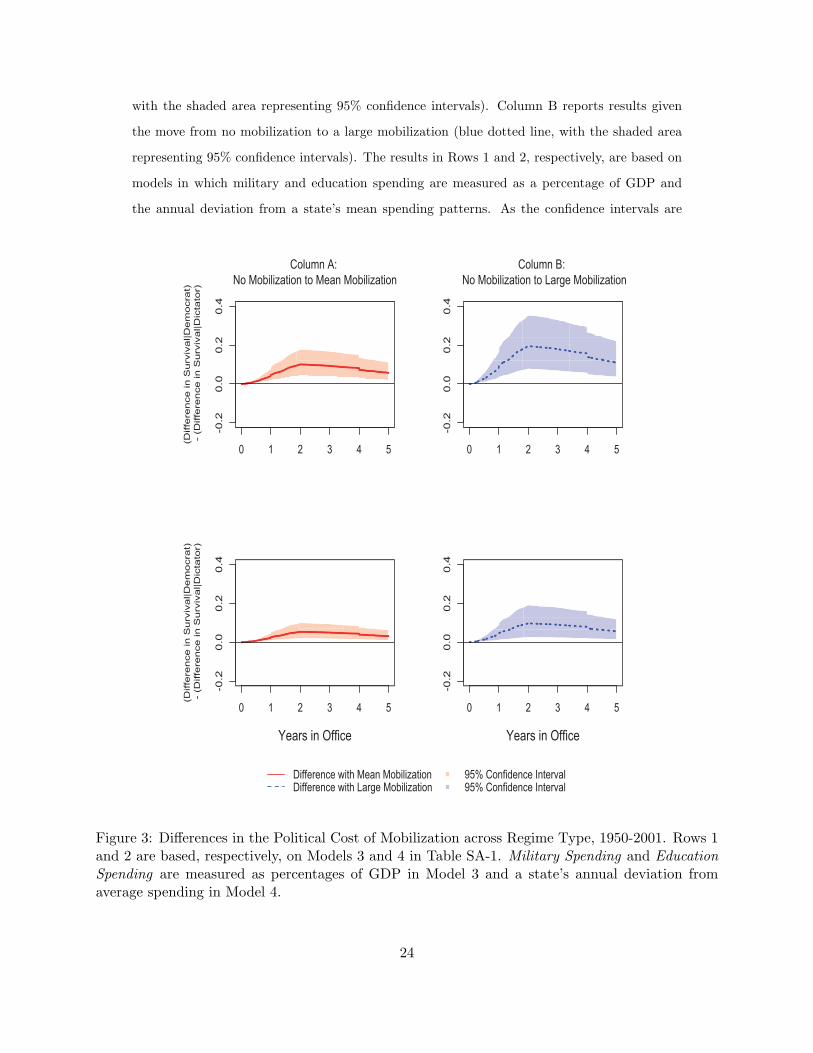
with the shaded area representing 95% confidence intervals). Column B reports results given
the move from no mobilization to a large mobilization (blue dotted line, with the shaded area
representing 95% confidence intervals). The results in Rows 1 and 2, respectively, are based on
models in which military and education spending are measured as a percentage of GDP and
the annual deviation from a state’s mean spending patterns. As the confidence intervals are
0 1 2 3 4 5
-0.2
0.0
0.2
0.4
(Diffe
rence in S
urv
ival|D
em
ocra
t)
- (
Diffe
rence in S
urv
ival|D
icta
tor)
Column A:
No Mobilization to Mean Mobilization
0 1 2 3 4 5-0.2
0.0
0.2
0.4
Column B:
No Mobilization to Large Mobilization
0 1 2 3 4 5
-0.2
0.0
0.2
0.4
(Diffe
rence in S
urv
ival|D
em
ocra
t)
- (
Diffe
rence in S
urv
ival|D
icta
tor)
Years in Office
0 1 2 3 4 5
-0.2
0.0
0.2
0.4
Years in Office
Difference with Mean Mobilization
Difference with Large Mobilization95% Confidence Interval
95% Confidence Interval
Figure 3: Differences in the Political Cost of Mobilization across Regime Type, 1950-2001. Rows 1and 2 are based, respectively, on Models 3 and 4 in Table SA-1. Military Spending and EducationSpending are measured as percentages of GDP in Model 3 and a state’s annual deviation fromaverage spending in Model 4.
24
completely above the zero line in all of the graphs, Figure 3 indicates that the political cost of
war mobilization is significantly higher in democracies than in dictatorships when social spending
is modeled as education spending given both an average mobilization and a large mobilization.
The results presented thus far treat social spending as a control variable. As discussed above,
though, the increased military spending during an interstate war often is accompanied by a de-
crease in the proportion of economic resources dedicated to social spending. We can model
how this change in spending patterns influences the effect of war mobilization on the survival of
democrats and dictators by incorporating social spending into the set of interaction terms among
measures of regime type, interstate war, and military spending. However, doing so in a method-
ologically appropriate manner results in a very complicated specification. Obtaining unbiased
estimates of how regime type, interstate war, military spending, and social spending jointly in-
fluence leader survival requires that a statistical model include all possible interactions among
measures of these concepts (among others, Braumoeller 2004, Brambor, Clark and Golder 2006).
The most precise treatment of this issue is given by Braumoeller (2004), who writes that “In
any interaction of k independent variables, a full set of∑n
k=1
(nk
)coefficients must be estimated
to avoid forcing the estimated hyperplane to assume a shape that may not conform to the
general tendency of the pointcloud that it is intended to describe” (pg. 811). Given the four
theoretically interesting constituent terms, lower-order interactions, “tacit” interactions, and
corrections to address the non-proportional hazards assumption, explicitly including a measure
of social spending into the mobilization process requires sixteen explanatory variables. Mod-
eling the effect of mobilization on leader survival across regime type in this manner induces a
substantial amount of multicollinearity among the constituent variables and various interaction
terms, but is necessary to produce unbiased estimates.
Figure 4 reports the mean difference across regime type in the probabilities of leader survival
given the move from no mobilization to a mean mobilization (Column A) and a large mobiliza-
tion (Column B) derived from models that explicitly incorporate health care spending into the
mobilization process. The graphs in Rows 1 and 2 are based, respectively, on models that mea-
sure spending as a percentage of GDP and annual deviations from a state’s mean spending. The
results in Column A indicate that the political cost of an average mobilization is significantly
higher for a democratic leader than it is for a dictator regardless of how the spending variables
are measured. The results are not as strong for large mobilization efforts (Column B in Figure
4). When Military Spending and Health Care Spending are modeled as a percentage of GDP
25
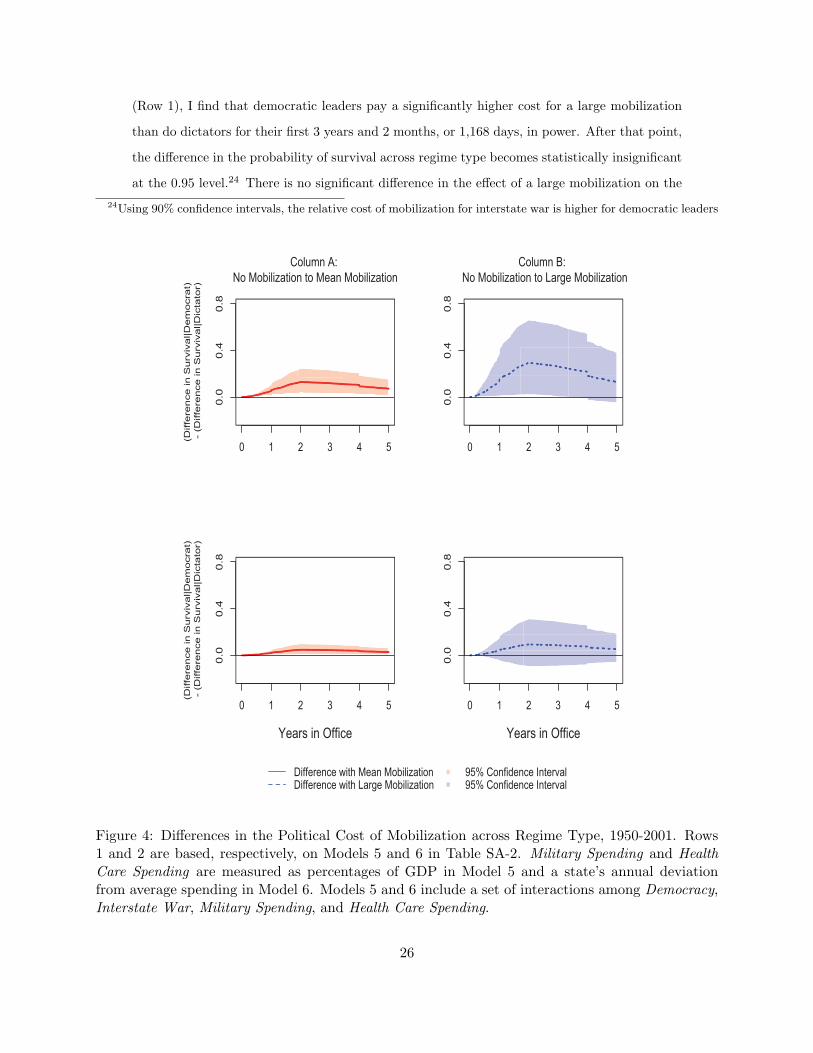
(Row 1), I find that democratic leaders pay a significantly higher cost for a large mobilization
than do dictators for their first 3 years and 2 months, or 1,168 days, in power. After that point,
the difference in the probability of survival across regime type becomes statistically insignificant
at the 0.95 level.24 There is no significant difference in the effect of a large mobilization on the
24Using 90% confidence intervals, the relative cost of mobilization for interstate war is higher for democratic leaders
0 1 2 3 4 5
0.0
0.4
0.8
(Diffe
rence in S
urv
ival|D
em
ocra
t)
- (
Diffe
rence in S
urv
ival|D
icta
tor)
Column A:
No Mobilization to Mean Mobilization
0 1 2 3 4 50.0
0.4
0.8
Column B:
No Mobilization to Large Mobilization
0 1 2 3 4 5
0.0
0.4
0.8
(Diffe
rence in S
urv
ival|D
em
ocra
t)
- (
Diffe
rence in S
urv
ival|D
icta
tor)
Years in Office
0 1 2 3 4 5
0.0
0.4
0.8
Years in Office
Difference with Mean Mobilization
Difference with Large Mobilization95% Confidence Interval
95% Confidence Interval
Figure 4: Differences in the Political Cost of Mobilization across Regime Type, 1950-2001. Rows1 and 2 are based, respectively, on Models 5 and 6 in Table SA-2. Military Spending and HealthCare Spending are measured as percentages of GDP in Model 5 and a state’s annual deviationfrom average spending in Model 6. Models 5 and 6 include a set of interactions among Democracy,Interstate War, Military Spending, and Health Care Spending.
26
probability of a democratic leader and a dictator losing office when the spending variables are
measured as deviations from their panel-means (Row 2, Column B).
Two points should be noted before moving forward. First, the results presented in Figures 2
and 4 suggest that, at least at the margins, democratic leaders can mitigate the relative political
cost of mobilization by funding higher war-time military spending with a strategy that does not
reduce social spending. This follows from the observation that the magnitudes of the difference
in the probabilities of leader survival across regime type reported in Figure 4 are generally larger
than those reported in Figure 2, which are based on models that do not incorporate Health Care
Spending into the set of interaction terms used to model war mobilization. For example, when
spending is measured as a percentage of GDP, the mean difference across regime type in the
probability a leader will complete her fourth year in office is 0.22 when health care spending
is explicitly modeled as part of the mobilization process and 0.17 when it is not. Second, the
weaker results for a large mobilization in Figure 4 are likely due to the relatively high levels of
multicollinearity associated with including the full set of interaction terms among Democracy,
Interstate War, Military Spending, and Health Care Spending. This inference follows from two
observations. First, and as just noted, treating social spending as part of the mobilization process
does not weaken the relative effect of war mobilization on the political survival of democrats
and dictators. Instead, explicitly incorporating Health Care Spending into the set of interaction
terms increases the relative effect of mobilization on leader survival across regime type. However,
the second observation is that the confidence intervals are substantially larger with the models
that analyze social spending as an inherent part of war mobilization. Returning to the example
used above, the confidence interval around the predicted difference of a leader remaining in power
for four years ranges from -0.01 to 0.54 when Health Care Spending is incorporated into the set
of interaction terms and 0.06 to 0.32 when it is not. Framed differently, the confidence interval
is 112% larger when health care is explicitly modeled as part of the mobilization process. These
two observations suggest that multicollinearity from the large number of required interaction
terms reduces the statistical significance of the relationships reported in Column B of Figure 4.
My results indicate that, in general, democratic leaders are significantly more likely to lose
office than dictators given the increased military spending associated with fighting an interstate
war. The next section uses the experiences of Winston Churchill and Joseph Stalin at the end
of World War II to illustrate how regime type and war mobilization influenced leader survival
than it is for dictators throughout a leader’s tenure.
27

in two notable instances.
6 The Cases of Winston Churchill and Joseph Stalin
The cases of Winston Churchill and Joseph Stalin are useful for highlighting what my theo-
retical argument and empirical results can tell us about the relationship between leader survival,
regime type, and interstate conflict for four reasons. First, Churchill lost re-election as World
War II winded down while Stalin remained in power until his death. Second, both oversaw
winning war efforts. Third, Churchill was the leader of a democratic Great Britain while Stalin
ruled over the non-democratic Soviet Union. Fourth, Great Britain and the Soviet Union both
engaged in significant mobilization efforts during World War II.25 The British allocated 6.2% of
their GDP to military spending in 1938. Annual British military expenditures rose to 38.7% of
GDP, on average, during World War II. Further, the British mobilization effort was accompa-
nied by a decrease in the proportion of resources dedicated to health care from 1.74% of GDP
to an average of 1.28 throughout the war. While not as extensive as the British efforts, at least
relative to total resources, the Soviet Union saw military expenditures increase from 13.4% of
GDP in 1938 to an average of 23.3% of GDP during the war.
With these observations in mind, it is unsurprising that Stalin remained in power after World
War II. Winning an interstate war reduces the likelihood a dictator will be removed from office
(e.g., Chiozza and Goemans 2004) and the results presented above indicate mobilization efforts
do not threaten a dictator’s political survival. The existing scholarship, though, has trouble
explaining why Churchill was removed from office despite successfully leading Great Britain
through World War II. While scholars differ on whether democratic incumbents are rewarded
with longer tenures for winning wars (see Bueno de Mesquita et al. 2003, Debs and Goemans
2010), no existing research implies that leaders are likely to lose office after winning an interstate
war. In contrast, my argument and results indicate that democratic leaders whose states undergo
large mobilization efforts, like Churchill, are more likely to be removed from power. To get a
sense of how war-time patterns of spending and regime type influenced Churchill’s survival
25The following military spending statistics are based on expenditure data from Singer, Bremer and Stuckey (1972)and GDP data from (Maddison 2008). Unfortunately, the Gleditsch (2002) data used in the main analyses do notcover the World War II-era. British health care spending data are from Mitchell (2011) and were accessed viahttp://www.ukpublicspending.co.uk/. I was unable to find reliable data on health care spending in the SovietUnion before or during World War II. I use 1938 as the baseline for comparison as it represents the year beforeGermany invaded Poland.
28

prospects, I used a set of post-estimation simulations based on Model 1 in Table 1 to calculate
the probability of Churchill remaining in office throughout World War II given three scenarios:
1) the observed patterns of British military and health care spending; 2) the British successfully
fought World War II without altering their pre-war levels of spending; and 3) the observed
patterns of British military and health care spending in a counterfactual, non-democratic Great
Britain.26
Figure 5 reports the differences in the probability of Churchill maintaining office throughout
World War II between Britain’s actual mobilization and 1) no economic mobilization for war (red
solid line with shaded 95% confidence interval in Panel A) and 2) a non-democratic Great Britain
(blue dashed line with shaded 95% confidence interval in Panel B).27 Recall that the probabilities
of survival in two scenarios are significantly different from one another if the confidence interval
does not contain the zero-line. Accordingly, Panel A indicates that Churchill’s probability of
survival was significantly lower given Britain’s mobilization than would have been the case if
Britain managed to fight the Axis without altering its pre-war spending patterns. Panel B tells
us that, holding the observed mobilization effort constant, Churchill was significantly less likely
to remain in power than would have been the case if Britain was a non-democracy. Taken
together, these results highlight how regime type and Britain’s mobilization effort interacted to
reduce Churchill’s probability of survival upon the conclusion of World War II.
Figure 5 offers statistical support for the claim that Britain’s substantial mobilization ef-
fort harmed Churchill’s prospects for re-election. Qualitative evidence is consistent with this
argument as well. Churchill was consumed by defeating the Axis Powers. In his first speech
to the House of Commons as Prime Minister, Churchill proclaimed that it would be British
policy “to wage war with all our might, with all the strength that God can give us, to wage
war against a monstrous tyranny never surpassed in the dark, lamentable catalogue of human
crime” with the singular aim of “Victory. Victory at all costs. Victory in spite of all terror.
Victory however long and hard the road may be” (Churchill 1940). This single-minded focus
motivated the extensive mobilization of the British economy described above, but came at the
expense of domestic political considerations. This view is reflected in Conservative MP Cuthbert
Headlam’s remark in 1944 that, “Never was a party so leaderless as is the Conservative Party
26The explanatory variables are set to Britain’s observed values during this time period and largely are based onthe sources cited in the Research Design section. The exceptions are GDP data for the measure Military Spendingand Health Care Spending, which are drawn from Maddison (2008) and Mitchell (2011), respectively.
27The mean predicted probabilities of survival in each of the three scenarios are reported in Figure SA-1 in theSupplementary Appendix.
29

today” (quoted on page 472 of Ball 2013). While the Conservative Party floundered, Clement
Attlee’s Labour Party advocated for an expansive social welfare state. Labour proposed that
the British government guarantee social insurance, social security, health care, primary and
secondary education, housing, and full employment to its citizens and, upon the termination of
hostilities, a prompt demobilization of the military (Harris 1982). Churchill agreed in principle
that some social reforms should be undertaken, but viewed these proposals as a distraction to
the war effort. He felt a hasty demobilization was irresponsible and that the massive expansion
1940 1941 1942 1943 1944 1945
-1.0
-0.5
0.0
Diffe
re
nce
in
Pr(S
urviv
al)
Panel A:
No Mobilization to Actual Mobilization
1940 1941 1942 1943 1944 1945
-1.0
-0.5
0.0
Panel B:
Mobilization in Non-Democracy to Mobilization in Democracy
Difference from No Mobilization
Difference from Non-Democracy95% Confidence Interval
95% Confidence Interval
Figure 5: War Mobilization and Differences in the Probability of Winston Churchill Remaining inOffice during World War II. Calculations based on Model 1 in Table 1.
30
of the social welfare state advocated by Labour was too expensive to be implemented, especially
as long as Britain was involved in the war (Harris 1982, Ball 2013). Churchill was immensely
popular throughout the war, with approval ratings never falling below 78% (Addison 2013).
However, the war-weary British public embraced Labour’s proposed policies and preferred them
over the Conservative Party’s platform: a May 1945 Gallup poll found that Labour had a 16
percentage point lead over the Conservatives in terms of intended vote in the July 5th General
Election (Courier-Mail 1945). In the end, the man credited with saving his country lost re-
election as the British public choose Labour’s expansive social welfare state and demobilization
over Churchill’s personal popularity but unpopular policies.
7 Conclusion
The idea that interstate war is politically costlier for democratic leaders than it is for dictators
underlies most of the institutional explanations for variation in conflict behavior across regime
type. Therefore, recent research that demonstrates this assumption is not empirically supported
(e.g., Chiozza and Goemans 2004) calls into question why scholars have found that democracies
are less likely to fight other democracies (Russett and Oneal 2001), more selective in the conflicts
they initiate (Clark and Reed 2003), less likely to reciprocate military challenges (Schultz 2001a),
more likely to fight shorter wars (Bennett and Stam 1998), and more likely to win the wars they
fight (Reiter and Stam 2002). My results offer insight in to why conflict processes vary across
regime type.
I find that democratic leaders pay a higher political cost for interstate war than do dicta-
tors when a war effort is associated with increases in military spending. Filson and Werner
(2007) formally demonstrate that a greater sensitivity to the cost of war participation should
be associated with lower probabilities of conflict initiation and reciprocation, shorter conflicts,
and higher probabilities of victory. My empirical findings provide an explanation for Filson
and Werner’s theoretical results, with a slight twist. Specifically, my results suggest that dif-
ferences in conflict behavior across regime type are likely conditional on the size of an expected
or observed mobilization effort. If the cost of war participation in and of itself does not vary
across regime type (as demonstrated by Chiozza and Goemans 2004), then it is not clear how
much variation across regime type we should observe in situations where a war is, or could be,
fought without a significant mobilization of economic resources. In contrast, if fighting a war
31
requires a significant mobilization effort, my results imply that incumbency-valuing democrats
and dictators have incentives to behave differently. Thus, the findings presented here suggest
variation in the conflict behavior of democracies and non-democracies should be greatest when
fighting requires a large mobilization of resources.
My empirical results have at least three other implications. First, and most straightfor-
wardly, they suggest that democratic leaders have an incentive absent among autocrats to try
to limit the scope of mobilization. Combined with the observation that dictators are more
likely to be punished for losing an interstate war than democratic incumbents (see Debs and
Goemans 2010, Chiozza and Goemans 2011), my results imply that war should be associated
with larger increases in military spending and cuts in social spending in autocracies than in
democracies, at least during the period from 1950 to 2001. This is consistent with the find-
ings of Carter and Palmer (Forthcoming), but not with selectorate theory (Bueno de Mesquita
et al. 2004). However, selectorate theory’s argument relies on the assumptions that losing an
interstate war is costlier for democratic leaders and mobilization is costlier for autocratic lead-
ers. The empirical results of Chiozza and Goemans (2004), Debs and Goemans (2010), and this
manuscript demonstrate that these assumptions do not hold. Accordingly, it is unclear why
democrats have an incentive to mobilize more resources for war than dictators.
Second, my findings suggest that democratic leaders have a greater incentive than dictators
to finance an interstate war effort through some channel other than cutting social spending.
As noted earlier, these strategies include but are not limited to borrowing money on the inter-
national credit market (Slantchev 2012), raising taxes (Bank, Stark and Thorndike 2008), and
inflationary monetary policy (Capella 2013). Given the political and economic unpleasantness
associated with raising taxes and inflation and the ability of democracies to access international
credit at a cheaper rate than non-democracies (Schultz and Weingast 2003), democratic leaders
should be more likely to rely on borrowing to finance a war effort (e.g., Shea Forthcoming).
Third, my results have implications for why democracies are more likely to win the wars
they fight than non-democracies (most notably Reiter and Stam 2002). Most explanations for
this empirical finding argue that, relative to dictatorships, democracies are more selective about
the conflicts they initiate (Clark and Reed 2003), mobilize more of their economic resources
during a war (Lake 1992), or are both more selective and try harder to win the wars they
fight (Bueno de Mesquita et al. 1999, 2003, 2004). My results suggest that, compared to a non-
democratic leader, a democratic incumbent has less of an incentive to try to win a war through a
32
large mobilization effort and, thus, a greater incentive to avoid interstate wars against relatively
strong opponents. Therefore, it is likely the case that democratic success in interstate wars is
due to selectivity and not a mobilization advantage.
My results suggest that the political cost of interstate war mobilization is greater for demo-
cratic leaders than it is for dictators. This finding offers a theoretical explanation for a number
of prominent findings in the interstate conflict literature that, importantly, does not rely on
the empirically untenable assumptions that a democratic incumbent is more likely to lose office
than an autocratic leader for participating in or losing an interstate war. My findings also imply
that whether democracies and dictatorships pursue different strategies with respect to crisis
bargaining and interstate war is likely conditional on the need to mobilize if ex ante bargaining
fails and fighting requires a significant mobilization of resources. The results presented here
therefore suggest that explicitly considering the political cost of mobilization holds promise for
improving our understanding of interstate conflict processes.
References
Acemoglu, Daron and James A. Robinson. 2006. Economic Origins of Dictatorship and Democ-
racy. Cambridge University Press.
Addison, Paul. 2013. Churchill on the Home Front, 1900-1955. Faber & Faber.
Arena, Philip and Nicholas Nicoletti. Forthcoming. “Selectorate Theory, the Democratic Peace,
and Public Goods Provision.” International Theory .
Bachman, Jerald G, John David Blair and David R Segal. 1977. The All-Volunteer Force: A
Study of Ideology in the Military. University of Michigan Press.
Bachman, Jerald G, Peter Freedman-Doan, David R Segal and Patrick M O’Malley. 2000. “Dis-
tinctive Military Attitudes among US Enlistees, 1976-1997: Self-Selection versus Socializa-
tion.” Armed Forces & Society 26(4):561–585.
Ball, Stuart. 2013. Portrait of a Party: The Conservative Party in Britain 1918-1945. Oxford
University Press.
Bank, Steven A., Kirk J. Stark and Joseph J. Thorndike. 2008. War and Taxes. Washington
D.C.: The Urban Institute Press.
33
Bas, Muhammet A. 2012. “Democratic Inefficiency? Regime Type and Suboptimal Choices in
International Politics.” Journal of Conflict Resolution 56(5):799–824.
Bennett, D. Scott and Allan C. Stam. 1998. “The Declining Advantages of Democracy: A Com-
bined Model of War Outcomes and Duration.” Journal of Conflict Resolution 42(3):344–
366.
Boix, Carles. 2003. Democracy and Redistribution. New York: Cambridge University Press.
Box-Steffensmeier, Janet M and Bradford S. Jones. 2004. Event History Modeling. A Guide for
Social Scientists. Cambridge: Cambridge University Press.
Box-Steffensmeier, Janet M. and Christopher J.W. Zorn. 2001. “Duration Models and Propor-
tional Hazards in Political Science.” American Journal of Political Science 45(4):972–988.
Brambor, Thomas, William Clark and Matt Golder. 2006. “Understanding Interaction Models:
Improving Empirical Analyses.” Political Analysis 14(1):63–82.
Brandt, Patrick. 2012. MSBVAR: Markov-Switching, Bayesian, Vector Autoregression Models.
R package version 0.7-2.
Braumoeller, Bear F. 2004. “Hypothesis Testing and Multiplicative Interaction Terms.” Inter-
national Organization 58(4):807–820.
Brecher, Michael and Jonathan Wilkenfeld. 1997. A Study of Crisis. Ann Arbor, MI: University
of Michigan Press.
Buchanan, James M. 1965. “An Economic Theory of Clubs.” Economica 32(125):1–14.
Bueno de Mesquita, Bruce, Alastair Smith, Randolph M. Siverson and James Morrow. 2003.
The Logic of Political Survival. Cambridge: MIT Press.
Bueno de Mesquita, Bruce and Randolph Siverson. 1995. “War and the Survival of Political
Leaders: A Comparative Study of Regime Types and Political Accountability.” American
Political Science Review 89(4):841–855.
Bueno de Mesquita, Bruce, James Morrow, Randolph M. Siverson and Alastair Smith. 1999. “An
Institutional Explanation of the Democratic Peace.” American Political Science Review
93(4):791–808.
Bueno de Mesquita, Bruce, James Morrow, Randolph M. Siverson and Alastair Smith. 2004.
“Testing Novel Implications of the Selectorate Theory of War.” World Politics 56(3):363–
388.
34
Capella, Rosella. 2013. “The Political and Economic Determinants of War Finance.” Unpub-
lished Manuscript. Boston University, Boston, MA.
Carter, Jeff and Glenn Palmer. Forthcoming. “Keeping the Schools Open While the Troops are
Away: Regime Type, Interstate War and Government Spending.” International Studies
Quarterly .
Chiozza, Giacomo and H.E. Goemans. 2004. “International Conflict and the Tenure of Leaders:
Is War Still Ex Post Inefficient?” American Journal of Political Science 48(3):604–619.
Chiozza, Giacomo and H.E. Goemans. 2011. Leaders and International Conflict. Cambridge
University Press.
Churchill, Winston. 1940. “Speech to the House of Commons on May 13, 1940.”. http:
//www.winstonchurchill.org/learn/speeches/speeches-of-winston-churchill/
92-blood-toil-tears-and-sweat.
Clark, David H. and William Reed. 2003. “A Unified Model of War Onset and Outcome.”
Journal of Politics 65(1):69–91.
Clarke, Kevin A. and Randall Stone. 2008. “Democracy and the Logic of Political Survival.”
American Political Science Review 102(3):387–392.
Cook, Fay Lomax and Edith J. Barrett. 1992. Support for the American Welfare State. New
York: Columbia University Press.
Courier-Mail. 1945. “U.K. GALLUP POLL FAVOURS LABOUR.”. Published May 29, 1945.
Accessed at http://nla.gov.au/nla.news-article48961460.
Dahl, Robert A. 1971. Polyarchy: Participation and Opposition. New Haven: Yale University
Press.
Debs, Alexandre and H.E. Goemans. 2010. “Regime Type, the Fate of Leaders and War.”
American Political Science Review 104(3):430–445.
Fearon, James D. 1995. “Rationalist Explanations for War.” International Organization
49(3):379–414.
Feis, Herbert. 1960. Between War and Peace: The Potsdam Conference. Princeton University
Press Princeton, NJ.
Filson, Darren and Suzanne Werner. 2007. “Sensitivity to Costs of Fighting versus Sensitivity
to Losing the Conflict.” Journal of Conflict Resolution 51(5):691–714.
35

Fordham, Benjamin O. and Thomas C. Walker. 2005. “Kantian Liberalism, Regime Type
and Military Resource Allocation: Do Democracies Spend Less?” International Studies
Quarterly 49(1):141–157.
Geddes, Barbara. 2003. Paradigms and Sand Castles: Theory Building and Research Design in
Comparative Politics. University of Michigan Press.
Gilens, Martin. 2009. “Preference Gaps and Inequality in Representation.” PS: Political Science
& Politics 42(02):335–341.
Gilens, Martin. 2012. Affluence and Influence: Economic Inequality and Political Power in
America. Princeton University Press.
Gleditsch, Kristian S. 2002. “Expanded Trade and GDP Data.” Journal of Conflict Resolution
46(5):712–724.
Gleditsch, Nils Petter, Peter Wallensteen, Mikael Erikson, Margareta Sollenberg and Haavard
Strand. 2002. “Armed Conflict, 1945-99: A New Dataset.” Journal of Peace Research
39(5):615–637.
Goemans, H.E. 2008. “Which Way Out? The Manner and Consequences of Losing Office.”
Journal of Conflict Resolution 53(6):771–794.
Goemans, H.E., Kristian Skrede Gleditsch and Giacomo Chiozza. 2009. “Introducing Archigos:
A Data Set of Political Leaders, 1875-2003.” Journal of Peace Research 46(2):269–283.
Goldsmith, Benjamin E. 2007. “Defense Effort and Institutional Theories of Democratic Peace
and Victory: Why Try Harder?” Security Studies 16(2):189–222.
Harris, Kenneth. 1982. Attlee. New York: W.W. Norton & Company.
Heston, Alan, Robert Summers and Bettina Aten. 2012. Penn World Table Version 7.1. Cen-
ter for International Comparisons of Production, Income and Prices at the University of
Pennsylvania.
Holsti, Ole R. 1998. “A Widening Gap between the US Military and Civilian Society?: Some
Evidence, 1976-96.” International Security 23(3):5–42.
Holsti, Ole R. 2001. Of Chasms and Convergences: Attitudes and Beliefs of Civilians and
Military Elites at the Start of a New Millennium. In Soldiers and Civilians: The Civil-
Military Gap and American National Security, ed. Peter D. Feaver and Richard H Kohn.
Cambridge, MA: MIT Press pp. 15–100.
36
Honaker, James and Gary King. 2010. “What To Do About Missing Values in Time-Series
Cross-Section Data.” American Journal of Political Science 54(2):561–581.
Honaker, James, Gary King and Matthew Blackwell. 2007. “Amelia II: A Program for Missing
Data.” http://gking.harvard.edu/amelia/.
Huntington, Samuel P. 1957. The Soldier and the State: The Theory and Politics of Civil-
Military Relations. Belknap Press.
International Monetary Fund. 2008. “International Financial Statistics.”.
Jæger, Mads Meier. 2006. “What Makes People Support Public Responsibility for Welfare
Provision: Self-Interest or Political Ideology? A Longitudinal Approach.” Acta Sociologica
49(3):321–338.
Kam, Cindy D. and Robert J. Franzese. 2007. Modeling and Interpreting Interactive Hypotheses
in Regression Analysis. Ann Arbor: University of Michigan Press.
Kennedy, Ryan. 2009. “Survival and Accountability: An Analysis of the Empirical Support for
Selectorate Theory.” International Studies Quarterly 53(3):695–714.
King, Gary, James Honaker, Anne Joseph and Kenneth Scheve. 2001. “Analyzing Incomplete
Political Science Data: An Alternative Algorithm for Multiple Imputation.” American
Political Science Review 95(1):49–69.
Kugler, Jacek. 2002. Relative Political Capacity data set. Unpublished Manuscript. Claremont
Graduate University: Claremont, CA.
Lake, David A. 1992. “Powerful Pacifists: Democratic States and War.” American Political
Science Review 86(1):24–37.
Maddison, Angus. 2008. “Statistics on World Population, GDP and Per Capita GDP, 1-2008
AD.”. http://www.ggdc.net/maddison/oriindex.htm.
Marshall, Monty and Keith Jaggers. 2005. “Polity IV Dataset Users’ Manual.”
www.cidcm.umd.edu//polity.
Mitchell, BR. 2011. British Historical Statistics. Cambridge, UK: Cambridge University Press.
Mueller, John E. 1973. War, Presidents, and Public Opinion. New York: Wiley Publishing.
Nordlinger, Eric A. 1977. Soldiers in Politics: Military Coups and Governments. Englewood
Cliffs, NJ: Prentice Hall.
37
Olson, Mancur. 1965. The Logic of Collective Action: Public Goods and The Theory of Groups.
Cambridge, MA: Harvard University Press.
Organski, A.F.K. and Jacek Kugler. 1980. The War Ledger. The University of Chicago Press.
Page, Benjamin I, Larry M Bartels and Jason Seawright. 2013. “Democracy and the Policy
Preferences of Wealthy Americans.” Perspectives on Politics 11(1):51–73.
Przeworski, Adam, Michael E. Alvarez, Jose Antonio Cheibub and Fernando Limongi. 2000.
Democracy and Development: Political Institutions and Well-being in the World, 1950-
1990. New York: Cambridge University Press.
R Core Team. 2013. “R: A Language and Environment for Statistical Computing.”.
Reiter, Dan and Allan C. Stam. 2002. Democracies at War. Princeton, NJ: Princeton University
Press.
Rubin, Donald B. 1987. Multiple Imputation for Nonresponse in Surveys. New York: Wiley.
Russett, Bruce and John R. Oneal. 2001. Triangulating Peace: Democracy, Interdependence,
and International Organizations. New York: Norton.
Samuelson, Paul A. 1954. “The Pure Theory of Public Expenditure.” Review of Economics and
Statistics 36(4):387–389.
Sandler, Todd and Keith Hartley. 1995. The Economics of Defense. New York: Cambridge
University Press.
Schafer, Joseph L. and Maren K. Olsen. 1998. “Multiple Imputation for Multivariate
Missing-Data Problems: A Data Analysts Perspective.” Multivariate Behavioral Research
33(4):545–571.
Schultz, Kenneth A. 2001a. Democracy and Coercive Diplomacy. Cambridge, UK: Cambridge
University Press.
Schultz, Kenneth A. 2001b. “Looking for Audience Costs.” Journal of Conflict Resolution
45(1):32–60.
Schultz, Kenneth A. and Barry Weingast. 2003. “The Democratic Advantage: Institutional
Foundations of Financial Power in International Competition.” International Organization
57(1):3–42.
Shea, Patrick E. Forthcoming. “Financing Victory: Sovereign Credit, Democracy, and War.”
Journal of Conflict Resolution .
38
Singer, J. David, Stuart A. Bremer and John Stuckey. 1972. “Capability Distribution, Uncer-
tainty, and Major Power War, 1820-1965”. In Peace, War, and Numbers, ed. Bruce Russett.
Beverly Hills, CA: Sage pp. 19–48.
Slantchev, Branislav L. 2005. “Military Coercion in Interstate Crises.” American Political Sci-
ence Review 99(4):533–547.
Slantchev, Branislav L. 2012. “Borrowed Power: Debt Finance and the Resort to Arms.”
American Political Science Review 106(4):787–809.
Smith, Alastair and Bruce Bueno de Mesquita. 2011. “Contingent Prize Allocation and Pivotal
Voting.” British Journal of Political Science 42(2):371–392.
Sprout, Harold and Margaret Sprout. 1968. “The Dilemma of Rising Demands and Insufficient
Resources.” World Politics 20(4):660–693.
Szayna, Thomas S., Kevin F. McCarthy, Jerry M. Sollinger, Linda J. Demaine, Jefferson P.
Marquis and Brett Steele. 2007. The Civil-Military Gap in the United States: Does it
Exist, Why, and Does it Matter? Vol. 379 Rand Corporation.
Tilly, Charles. 1975. The Formation of National States in Western Europe. Princeton, NJ:
Princeton University Press.
World Bank. 2001. World Development Indicators.
39