Embed Size (px)
Citation preview
The Political Economy of Late Development:
Industrial Policy in the Information Technology and Banking Sectors in India
Paolo Singer
Presented to the Department of Economics in partial fulfillment of the requirements
for a Bachelor of Arts degree with Honors
Harvard College Cambridge, Massachusetts
December 18, 2013

2
The Political Economy of Late Development:
Industrial Policy in the Information Technology and Banking Sectors in India
Abstract
To inform the policy debate in developing countries over strategies for economic development, this paper uses the tertiary sector in India—in particular, the information technology (I.T.) services and banking sectors—as a case study of economic governance. This paper uses a new dataset on the I.T. sector collected from the paper archives of the Software Technology Parks of India (STPI) in New Delhi during July 2013, and a dataset of the 72 largest banks in India collected from public documents at the Reserve Bank of India in Mumbai. Socioeconomic indicators, specifically wage level, higher education and urban agglomeration, only partially account for the growth of these sectors. In both the banking and I.T. sectors, government ownership promoted stability and geographical agglomeration but reduced performance. Government investment in a shared infrastructure commons through STPI was critical for the growth of the I.T. sector after 1991. Gradual deregulation following state ownership resulted in significant gains for both sectors. The paper concludes with a theory for the growth of technologically advanced sectors in India, which promotes gradual liberalization in sequence with government promotion of infrastructure and domestic competition.

3
Acknowledgements This research would not have been possible without certain advisors and mentors. I am very grateful for the guidance of my thesis advisor, Professor Dale Jorgenson, for his generous support and meetings throughout the semester. I am also grateful to Professor Richard Cooper for his encouragement to pursue a political economy thesis despite data constraints; to Professor Jeffrey Miron for his feedback on early drafts and for coordinating Economics 990; to Professor Marty Chen (HKS) for connecting me with community organizations in Bangalore’s informal sector; to Anu Madgavkar and Shishir Gupta of the McKinsey Global Institute for their guidance and providing state-level data on sectoral growth in India; to Anne Le Brun, Jane Herr and Kiran Gajwani for their feedback; and to the Harvard South Asia Institute and the Weatherhead Center for International Affairs for funding my field research in New Delhi, Mumbai and Bangalore. This thesis will be presented at the Weatherhead Center for International Affairs Undergraduate Thesis Conference in February 2014.
4
Table of Contents
Table of Contents ................................................................................................................ 4
0 Author’s Note ............................................................................................................... 5
1 Introduction .................................................................................................................. 6
2 Literature Review ......................................................................................................... 9
2.1 Liberal economics school ................................................................................... 10
2.2 State-facilitated development school ................................................................. 11
2.3 Agglomeration economies ................................................................................. 15
3 Banking and I.T. in Transition: An Overview, 1800 – 1990 ..................................... 18
3.1 History of information technology in India ........................................................ 18
3.2 History of banking in India ................................................................................. 23
4 Political Economies of Growth: Education and Urbanization ................................... 27
4.1 Data Description ................................................................................................. 27
4.2 Analysis ............................................................................................................... 28
5 Political Economies of Growth: Industrial Policy and Regulation ............................ 33
5.1 Industrial policy and deregulation in the information technology sector ........... 33 5.1.1 The Software Technology Parks of India program ........................................................ 33 5.1.2 Labor deregulation in the 1990s ............................................................................................ 41
5.2 Industrial policy and deregulation in the banking sector .................................... 42 5.2.1 Methodology ................................................................................................................................... 43 5.2.2 Data Description ............................................................................................................................ 44 5.2.3 Analysis ............................................................................................................................................. 45
6 Conclusion and Policy Implications .......................................................................... 50
6.1 Primary findings .................................................................................................. 50
6.2 Policy Implications ............................................................................................. 51
Appendix ........................................................................................................................... 55
References ......................................................................................................................... 62
5
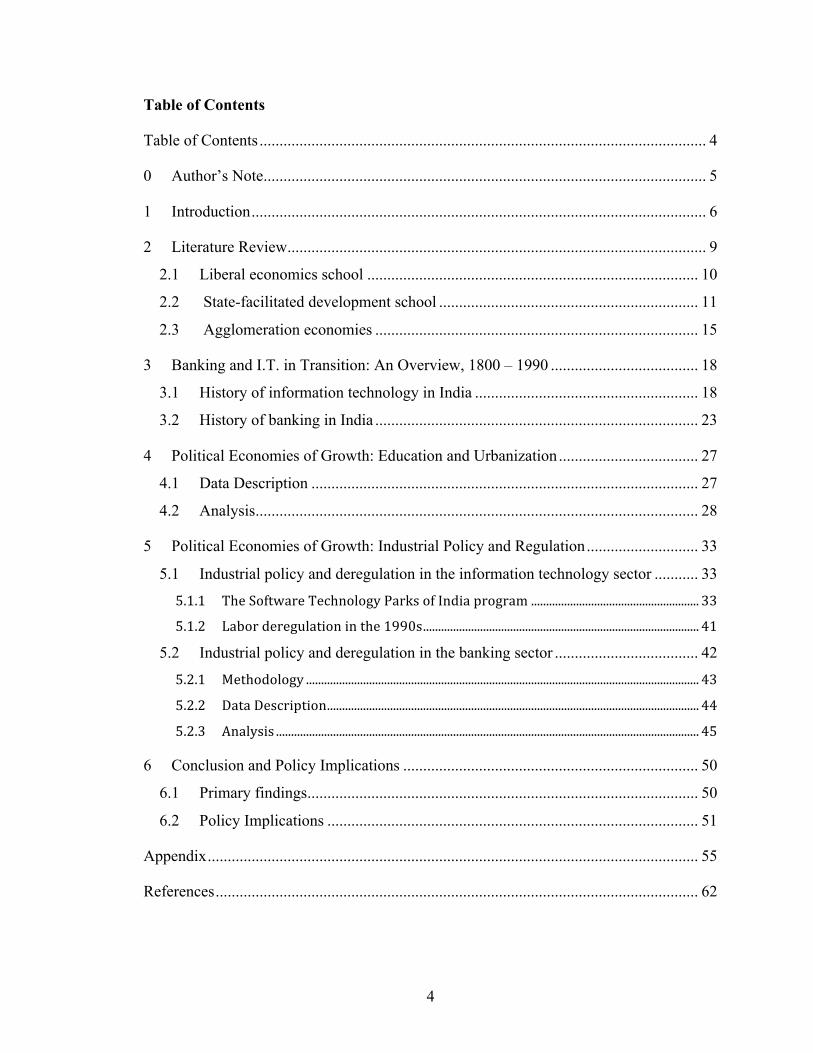
0 Author’s Note
If the ultimate goal of economic growth is human freedom, then we should
measure economic development on the basis of this standard. My initial interest in the
role of the government’s interventions in the information technology and banking sectors
was to understand how these sectors could promote welfare and freedom for the poorest
Indians. Access to computers and finance can improve the choices available to low-
income Indians and improve the capabilities of governments and businesses. Yet the
polarization of the labor market that results from these sector – between a well-paid elite
class of educated engineers, and everyone else – can contribute to a dual economy with
limited linkages to slum dwellers who lack basic housing, education and sanitation
infrastructure in cities across the subcontinent. As I embarked on this research, I was
motivated by the question: how has the government’s promotion of the information
technology and banking sectors contributed, if at all, to the human, economic and
political development of Indian citizens?
It eventually became clear that firm or district-level statistics of the I.T. and
banking sectors were not available. An alternative was to find aggregated production at
the state-level: time-series of socioeconomic indicators relevant to these sectors are only
available at intervals through the Census, and a collage of other sources that do not
correspond consistently over time. Therefore, this paper limits its scope more narrowly to
the following: how has government policy affected the contemporary growth of the
banking and information technology services industry in India? I leave it to future
research to determine how the success of these sectors can translate into better standards
of living for people in India living in poverty today.

6
1 Introduction
In 2012, India’s GDP grew at 9%, with an average per capita income of Rs. 3000,
or approximately US $600. Many have argued that this is the outcome of the country’s
gradual deregulation of the private sector in the 1980s, culminating in 1991 with forced
liberalization after a balance of payments crisis (for example, Bhagwati and Panagariya
2013). However, evidence from the information technology (I.T.) services and banking
sectors suggests that liberalization was necessary but not sufficient for the growth of the
tertiary sector.
The banking and information technology sectors provide a useful case study for
understanding the impact of government policy on the tertiary sector. Banking facilitates
the flow of savings and investments in the country, and was at one time considered a
public utility tasked with providing credit in rural and underinvested areas between 1969
and 1991; today it has expanded that role to allow private and foreign banks to compete
and facilitate the flow of capital in a rapidly growing economy.
India’s information technology services sector is one of the most successful in the
world. Though at one time I.T. was exclusively the domain of ‘public sector champions,’
mandated to create the Indian computer as a source of national autonomy and pride,
today India dominates the share of computer services in the international economy. And
while the compound annual growth rate of the tertiary sector has grown steadily since
1950 – from 1.7% in 1900 to 1950; 4.5% in 1960 to 1980; 6.6% in 1980; and 8.9% in the
past decade (see Table 1, page 12) – I.T. service exports have grown up to 52% per year
in the 2000s.

7
This paper finds that an entrepreneurial government and gradual liberalization
were essential for the I.T. and banking sectors’ contemporary growth. In the early stage
of India’s information technology sector (1950-1980), the government abolished most
practical imports and local tech enterprises and established major state-run industries
with a focus on defense technologies. In the late stage (1980 – 2000), the government
invested heavily in technology infrastructure for public use and reduced labor regulations.
Today, India has the highest share of computer-related service exports in the world.
Figure 1. Computer-related service exports, by top exporters, 2000-2010
Source: U.N. COMTRADE
To evaluate the effect of industrial policy on the productivity of the banking and
information technology sectors in India, I combine econometric data with personal
interviews and historical research. Section 2 reviews the literature on the political
economy of industrial policy. Section 3 provides an overview of the history of each
sector in India. Section 4 analyzes whether we can predict the state-level growth of each
0
10
20
30
40
50
60
2000 2001 2002 2003 2004 2005 2006 2007 2008 2009 2010
$US Billions
India Ireland Germany United Kingdom China United States of America Finland Sweden Netherlands

8
sector on the basis of socioeconomic and urban agglomeration indicators. Section 5
analyzes the role of industrial policy and regulation in promoting each sector. Lastly,
Section 6 offers policy suggestions for each sector.
9
2 Literature Review
The rapid industrialization of East Asian economies challenged economists who
advocated for rapid liberalization in late developing countries. While the World Bank and
IMF’s free market policies and structural adjustment programs promoted throughout the
1980s had the potential to promote growth under certain circumstances, their reforms had
unintended and often negative consequences. While 40% of developing countries that
liberalized in the past five decades have had a rapid expansion of exports, half of them
de-industrialized (Shafaeddin 2005). Industries that were near maturity before
liberalization, such as the aerospace sector in Brazil, accelerated in growth once they
were able to compete with the rest of the world economy (Shafaeddin 2005). Instead,
industries that were less technologically advanced and faced a surge in import
competition, such as labor-intensive industries, declined. The evidence on liberalization
from the past four decades, and the argument this paper will make, suggests that effective
sequencing of active state support and liberalization is key for successful industrial
development.
East Asian economies managed the most successful development programs in
history. South Korea, for example, created some of the most “efficient steel plants in the
world,” resulting from a government-mediated and export-based industrialization strategy
with incentives for competition, supported by a well-regulated financial sector (Stiglitz
2005). As a foundation to study the growth of banking and information in technology, I
use insights from the liberal economics school (Bhagwati and Panagariya 2013,
Panagariya 2008) and the state-facilitated development school (Sen 2013, Rodrik 2005,

10
Evans 1995, Wade 1990). Below I synthesize two primary schools of thought that seek to
explain the shift in economic growth.
2.1 Liberal economics school
Bhagwati and Panagariya offer the dominant liberal economic view of India’s
development, summarized in their recent book, Why Growth Matters (2013). These
economists argue that just after independence, there were too many controls over private
production, the public sector had too much monopoly power, and goals for self-
sufficiency—and an aversion to foreign companies—defined trade policy. The socialist,
central planning model of development that India tried to emulate was consistent with the
anti-foreign sentiment that swept the country following independence from British
colonialism.
Bhagwati and Panagariya point to the fact that growth did not keep up with
increasing rates of investment between 1950 and 1990. The four primary reasons for this,
they argue, were, first, an extensive system of control over private investment and
production; second, monopoly power of the private sector in areas beyond utilities; third,
protection of domestic manufacture; and fourth, restriction on foreign investment.
This school of thought opposes economists from the state-led development school
on the grounds that “there is no compelling case where such policies led to significant
growth over a sustained period” (Bhagwati et al. 2013). To explain rapid development in
East Asia, the authors point to technology transfers and high literacy rates. Still, they do
not endorse the East Asian approach to development: “the mix of political and economic
features that characterizes China is hardly a role model for other nations to adopt for their
development,” because the political regime is not sustainable in the long term (Bhagwati
11
et al. 2013). To explain increasing growth rates in the 1980s, liberal economists argue
that policies after 1975 retreated gradually from the “license raj” before full economic
liberalization. Panagariya also cites evidence that import licenses were gradually phased
out between 1975 and 1985.
2.2 State-facilitated development school
As economic models that prove trade increases welfare are well established under
conditions of perfect competition and constant returns to scale, the burden of proof in the
debate often falls on the state-facilitated development school. These economists attribute
growth in India to the active support of the state, rather than to the deregulation of the
state. These authors argue that it is misleading to attribute the country’s growth rates only
to deregulation and liberalization. Rodrik (2004) and others suggest that growth began
taking place a decade before the 1991 reforms (Table 1). Bosworth et. al. (2007)
document an acceleration in GDP per capita and TFP in the 1970s and 1980s (Table 1).
Structural breaks in economic growth around 1980 give evidence that suggests
India’s upward growth trajectory began before liberalization. Rodrik and Subramanian
(2004) find a structural break in 1979 using data on per-capita GDP (constant dollars and
PPP), GDP per worker, and TFP. Sen (2007) and Basu (2008) show that without the
1979-1980 observation, when GDP fell 5.2% due to an oil price shock and drought, the
trend breaks in 1976; in fact, average annual growth rate is 5.8% in 1975-1978, which
corresponds with India’s growth in the 1980s (see Kotwal 2010 for a complete
discussion).

12
Table 1. Aggregate Growth Accounting in India
1960-70 1970-80 1980-90 1990-99 Bosworth-Collins Output 3.84 2.98 5.85 5.59 Output per worker (Q/L) 1.87 0.69 3.90 3.27 Capital per worker 0.83 0.61 1.06 1.32 Education 0.29 0.58 0.32 0.34 Total factor productivity 0.74 -0.50 2.49 1.57 IMF (in Rodrik 2004) Output 3.75 3.16 5.64 5.61 Output per worker 1.77 0.86 3.69 3.30 Total factor productivity1 1.17 0.47 2.89 2.44 Total factor productivity2 -0.94 -2.07 1.28 0.94 Source: Rodrik (2004); Bosworth and Collins (2003) 1 – Based on labor force 2 – Based on average years of schooling in population above age 15
These findings suggest events or policy before the 1991 liberalization of the
economy influenced the economy’s growth trajectory. Of course, the attribution of these
breaks to any particular policy is ambiguous at best. For example, the 1976 break could
be the result of Indira Gandhi’s declaration of a constitutional Emergency, which gave
her dictatorial power and coincided with GDP growth of 9%. Or, greater output could
have been a result of an increase in India’s savings rate from 12.2% in 1968 to 21.5% in
1978 (Basu 2008). Sen and Athukorala (2007) attribute the increases in savings to bank
nationalizations in 1969 that, among other things, mandated branches in rural areas for
the first time (see Section 3). Sen (in Kotwal 2010) shows that a 1% increase in bank
density is associated with a 0.03% increase in the private savings rate; and during the
1970s, the number of bank branches increased three times. It is not plausible that a
similar increase would have occurred without a nationalized banking sector, as expansion
was heavily subsidized by the central government.

13
If a country liberalizes and specializes, as a result of comparative advantage, in
sectors that do not have dynamic scale or other benefits, it might find itself at a lower
growth rate for an indefinite period of time. If the government is capable of promoting
sectors that have multiple dimensions for growth, such as positive complementarities
with the rest of the economy and higher total factor productivity, trade can lead to higher
growth trajectories. TFP explains most of the difference in output between countries
(Hall and Jones 1999). For example, the average output for the top five countries in 1988
was 31.7 times higher than average output of the bottom five countries as a result of
difference in productivity, instead of traditional factor inputs of labor, capital and
education.
Total factor productivity can come from improvements in technology,
organization of production, reduction of distortions and also government policies.
Quality-adjusted TFP growth calculations show that TFP accounts for 20% to 50% of
growth in developed countries (Jorgenson et. al 2001). Klenow et al. finds that
productivity differences account for approximately 67% in differences in income per
worker, or as high as 90% for information-based sectors (1997). The growth is therefore
contingent on how capital in a given industry is organized. While technology transfers are
key to productivity – as Panagariya (2008) and others note in the case of China’s growth
in manufacturing, for example – so is the role of government in promoting how capital is
used.
The literature on political economy provides insights into how state intervention
can facilitate rapid development. Evans (1995), building on previous work by
Gershenkron (1962), argues the role of the state in late development is not simply to
14
provide a stable environment for markets. In an account of late development in South
Korea and Brazil, Evans shows how entrepreneurs require capital in excess of what they
are able to obtain on their own. The state, he argues, “plays role of an investment banker
by bringing together necessary funds and encouraging their application in transformative
activities,” a risk that capitalists and private institutions do not take (Evans 1995). We see
the state following a similar logic in the U.S., too: during the recovery from the 2008
recession, the U.S. government instituted loan guarantee programs for small businesses to
promote the entry of new entrepreneurs into the market, taking on the role of India’s
nationalized banking sector without the burden of running a monopoly.
South Korea’s growth also followed heavy state intervention. By imposing
performance standards on private companies receiving public support, the South Korean
government became part of a “joint project of industrial transformation” rather than a
neutral arbiter of macroeconomic stability (Evans 1995). Using a similar approach, the
Taiwanese government “governed market processes of resource allocation to produce
different production and investment outcomes than would have occurred with either free
market or simulated free market policies” (Wade 1990). State leadership and
entrepreneurship can help bring about new social and capital organization that is useful
for industrial development.
Evans calls the political capacity of a state to lead late industrialization
“embedded autonomy.” This term refers to a bureaucratic arm that has autonomy from
private political interests, while maintaining ties to firms that can implement a
development project through various subsidies and incentives. For industrial policy to be
effective, Evans argues state agencies must be embedded with the private sector and
15
autonomous from it. One of the primary reasons why the Indian government was
historically ineffective at industrial policy relative to other rapidly developing countries is
that it opted for explicit ownership of monopoly firms without strict oversight of
production or growth targets.
2.3 Agglomeration economies
In the case of information technology services and production, agglomeration
economies are commonly cited as an important explanatory factor for the sector’s growth.
Once industrial policy, or historical accident, encourages the development of an industry
in a geographic region, agglomeration economies may continue to sustain its growth
(Hall and Jones 1999, Krugman 2012). This concept extends and complements the
primary arguments of the liberal economics and state-facilitated growth schools. The
growth of the Indian I.T. sector was not simply a matter of infrastructure, human capital
and trade, but also the physical structure of “highly decentralized and localized
production networks… with close ties to users, to foster innovation” that permitted
increasing economies of scale (Parthasarathy 2000). These concentrations of production
emerge from market-driven development or state-sponsored projects, such as industrial
parks, which can attract well-paid technicians and semi-skilled jobs (Heitzman 2004). In
fact, labor and capital are less important when predicting where tradable industries will
locate, because these resources are mobile within countries (Krugman 2012). Instead,
firms may decide to locate in a given place because similar firms are already located
there. Centralized government planning can play an important role in determining where
a particular industry will locate.
16
To find the effect of agglomeration in the growth of developing countries,
Combes et al. (2007) and Rosenthal and Strange (2004) regress sectoral productivity on
city measures of economic activity within the sector. There is evidence of localization
economies – agglomeration within sectors, fostering specialized cities – in Brazil,
traditional Korean industries and in India (Henderson 1988, Henderson 2001, Lall 2004
in Duranton 2008); and of urbanization economies – agglomeration effects between
sectors, fostering diversified cities – in India, Indonesia, and China (Lall 2001,
Deichmann 2005, Au 2006 in Duranton 2008).
The factors that lead to clustering are difficult to identify because agglomeration
and convergence pressures occur simultaneously. With convergence, the coefficient on
the initial level of economic activity as a predictor of growth is negative: there are
diminishing returns, a mean to reversion, or both (Porter 2011). For example, numerous
firms in one region can create more local demands for inputs, reducing profit margins and
incentives to expand. If the price of specialized inputs – such as technical skills for
specific software – increases with the number of local firms, there could be diminishing
returns, too (Porter 2011). Glaesar et al. (2009), Henderson (2003) and Delgado et al.
(2011) argue that when agglomeration economies are larger than convergence factors,
there is more rapid learning, innovation and entrepreneurship. In Silicon Valley, for
example, early start-ups and venture capital firms were able to engage with the electrical
engineering resources at Stanford University in Palo Alto; government contracts during
the Cold War were critical for financing many of these firms. The service industries
encouraged ‘social capital networks’ that built trust and rewarded innovation, with a
horizontal coordination across firms (Cohen and Fields 2000). The idea of a research park

17
was also successful in the Soviet Union, Japan and Taiwan, where the central government
intervened in local real estate markets to allocate investments.
Sophia Antipolis, in southern France, is another recent example of state-facilitated
development with strong agglomeration economies. The French government invested in
superior communication and transportation networks and an attractive living environment
for professionals and technicians. It aimed to encourage inter-firm cooperation,
circulation of information and links with venture capital (Fouich 1997 in Heitzman 2004).
The center took off in the 1990s with a rapid growth of enterprises, and by 2000 it had
the largest concentration of I.T. and communications industries in Europe, with optical
fiber connections, a concentration of French communication facilities, and government-
funded R&D (Heitzman 2004). The evidence on agglomeration economies suggests that
government activism combined with openness to trade can result in increasing returns to
scale and sustained growth.
18
3 Banking and I.T. in Transition: An Overview, 1800 – 1990
3.1 History of information technology in India
Prior to the growth of the information technology sector in India after 1991, the
public and private sectors had invested in necessary physical and social infrastructure for
over a century. The history of Bangalore, Karnataka is closely related to that of the I.T.
sector in India: the city has produced over 40% of the country’s computer service exports
in the past twenty years. From the 1800s (if not earlier) through the 1990s, Bangalore was
the recipient of national public works. While subsidies, followed by liberalization, appear
to be important explanatory factors for the industry’s success today, an account of the
city’s history provides more nuanced insight into how the city developed prior to its
growth in I.T.1
In the early 1800s, Bangalore was a center for state government offices and an
economic zone for silk weaving, bankers, and cloth merchants. By the 1850s, non-
mechanized production in Bangalore faced competition from Britain. The Indian
government, controlled by the colonial British government, mandated that India import
silk and machine-made goods, resulting in the decline of local production (Heitzman
2004). Subsequently, entrepreneurs from England set up steam-powered factories to
produce textiles starting in 1877. This approach—of outside entrepreneurs setting up
export factories taking advantage of local labor—is similar to China’s industrialization
through special economic zones in the 1980s (Naughton 2006). These plants required
heavy loads of electricity, and by 1890 Bangalore became the first electrified city in India
(Heitzman 2004).
1 For a more detailed account of Bangalore’s complex history in relation to the I.T. industry, see Heitzman 2004 and Evans 1995.
19
In 1909, under the leadership of Indian planner Visvesvaraya, the Government of
Mysore pursued a vision of state-led industrial development through “a technically
educated workforce” (Heitzman 2004). Borrowing technology from Japan, Europe, and
the United States, the government established the Mysore Iron and Steel Works, the
Krishnarajasagara dam near Mysore, and the first Engineering College in Bangalore.
Visvesvaraya’s work coincided with that of Jamsetji Tata, who founded the Indian
Institute of Science in Bangalore to promote new industry in India (Heitzman 2004).
The high-technology sector in Bangalore was also transformed by British
investments in the aeronautics industry during World War II. In particular, the geopolitics
of the region was a factor that contributed to Bangalore’s transition from a manufacturing
center to a high-technology, research and telecommunications center (Parthasarathy
2013). It seems Bangalore was chosen in part because it was beyond the range of
potential air raids from Pakistan (Parthasarathy 2013, Heitzman 2004). The largest
companies during this era that supported the defense industry were government-run. The
Hindustan Aircraft Pvt. Ltd. (HAL), one of the largest public enterprises, was founded in
1940 as a public enterprise. The local government transferred 200 acres of public land in
Bangalore and purchased 800 acres from private owners to establish the new company.
The enterprise created 21 villages to house workers, and arranged a fleet of buses to bring
them to work. HAL manufactured vehicles, jet aircrafts and helicopters; new technical
and service industries formed near the city to supply radio parts, motors and telecom
switches (Heitzman 2004).
Meanwhile in the United States, researchers at the Electrical Numerical Integrator
and Calculator at the University of Pennsylvania built the world’s first computer in 1946

20
with 70,000 vacuum tubes (Parthasarathy 2000). The transistor replaced the vacuum tube
in 1954, which enabled the computer to become smaller, less expensive, and more
powerful. In the 1960s, computers were still only affordable to large organizations, and
IBM controlled two thirds of the world market (Parthasarathy 2000). IBM’s strategy to
maintain a monopoly position in the market was to undercut the development of third-
party software developers: the company developed FORTRAN, the first programming
language, and gave away its software and tools freely with its hardware. Since software
was incompatible between manufacturers, switching away from IBM was expensive. In
1968, after an anti-trust lawsuit by the U.S. Justice Department, IBM began selling
software separately. This decision set the stage for the development of a software market
and independent software industry (Parthasarathy 2000).
In India, the government continued to create public enterprises in Bangalore with
the goal of creating an indigenous computer industry: the Indian Telephone Industries
(ITI) was founded in 1948 had a monopoly over telephone equipment and services;
Bharat Electronics Ltd (BEL) was founded in 1954 within the Department of Defense’s
mandate to produce transistors, receivers, and communications equipment. It became the
largest producer of electronic goods in India and served as a training ground for engineers
(Evans 1995). BEL’s presence of 20,000 employees in the outskirts of Bangalore created
a strong network of engineers and social infrastructure for the city’s future technology
district. By 1960, BEL and ITI were the largest electronics manufacturers in India. To
supplement local capacity for computer production, the government also founded the
Electronics Corporation of India Limited (ECIL) in 1967 under the Atomic Energy
Commission in Bangalore (Evans 1995). ECIL was given the mandate to build a

21
computer as a public sector champion. “Let us work up the embers of national pride
latent in all of us and build up our morale so that we can confidently aim high and
achieve greater goals,” said A.S. Rao, a founding managing director of ECIL (ECIL
2013). Just as the other public sector champions, ECIL was a matter of national pride; in
the two decades after Independence the government sought to encourage autonomy from
foreign powers, which until recently had kept India under painful and extractive colonial
rule.
In 1977, IBM, which had early on established operations in Bangalore, decided to
leave following the Foreign Exchange Regulation Act of 1974, which mandated that
foreign firms could not hold more than 40% equity in Indian companies (Evans 1995).
The next year the Indian government set up the Hindustan Computers Limited to
manufacture its own mainframes. The government also formed the Computer
Maintenance Corporation (CMC) in 1975 to service computers not manufactured in India.
By the end of the 1980s, CMC serviced hardware made by 40 different firms; its
achievements included computerizing the Mediterranean Games of 1987 and coding the
railway reservation system in India (Evans 1995).
Despite a few accomplishments, such as the production of digital switches for
Indian telephones, the domestic industry lagged with cumbersome regulation and the lack
of incentives for competition. The license requirements meant that the “purpose of
installing a computer had to be established before permission would be given for
installation” (Purkayastha 1985 in Parthasarathy 2000). These blockages to the
development of the industry were not lifted until November 1984, when Prime Minister
Rajiv Gandhi took steps to liberalize the electronics sector with the New Computer
22
Policy of 1984 and the Computer Software Export Policy of 1986 (Heitzman 2004).
These policies simplified import procedures to a single window clearance, lowered
import duties and allowed duty-free imports for the government and research facilities.
These policy changes were closely associated with rapid growth in the sector: across the
country, production rose from 800 computers in 1981 to 160,000 in a decade later;
exports of computer equipment grew from $200,000 to $4.8 million in the same time
period (Heitzman 2004).
Demand for packaged software in Europe and the United States grew
tremendously with the standardization of the computer in the late 1980s. The number of
software manufacturers worldwide increased from 2992 to 6001 between 1987 and 1992,
while the average employees per firm changed minimally, from 16.4 to 18.4
(Parthasarathy 2000). Older systems that had accumulated information could not be
easily replaced, and maintenance remained labor intensive. Mayall (1991) writes
“such companies operate what can only be regarded as software museums:
collection of systems that incorporate or exemplify all the significant
developments in computing… including some of the blind alleys. The
result is the systems equivalent to a medieval city, a hotchpotch of
dissimilar buildings and winding lanes where only the locals can find their
way around” (in Parthasarathy 2004).
In the United States, hiring computer scientists to write code for legacy systems
was expensive. Firms started to look elsewhere, especially to India. That year, 80% of
bandwidth in Bangalore was used for projects in the United States, and the rest for
projects in Europe (STPI Annual Report, 1993). The growth of the banking sector after

23
1990 is documented in Figure 2 in the Appendix, and is more closely analyzed in
Sections 4 and 5.
3.2 History of banking in India
A brief history of the Indian banking system provides context for its rapid
internationalization and development in the past two decades. The first joint stock banks
in India were started in the 1860s, the most notable of which were Allahabad Bank
founded in 1865 and the Punjab National Bank founded in 1895. In the early 1900s, the
number of banks swelled as Indian entrepreneurs participated in and were inspired by the
Swadeshi Movement, whose aim was to bring economic development to India (Basu
1965). Industrial houses made their way into the banking business, as did some foreign
banks. A few powerful families owned joint stock banks and made preferential loans to
themselves and their favored organizations (RBI 2011). Rapid growth of new banks led
to a banking crisis: 108 banks failed between 1913 and 1917. More than 1000 failed
between 1922 and 1938! According to Basu (1965), an economic historian of India’s
banking system, these rate of failures were exacerbated by favoritism and vested
industrial interests in lending, insufficient reserves and liquidity, ignorance about banking,
mismanagement, speculation and lack of centralized banking regulation.
In, 1921, the creation of the Imperial Bank of India established the country’s
modern national banking system. The Imperial Bank was a consolidation of the three
largest banks in India, known as the Presidency banks, which were founded between
1806 and 1843 (Basu 1965). In the wake of independence from the British, the
government-owned Imperial Bank was renamed the State Bank of India (SBI). In 1935,

24
the Reserve Bank of India (RBI), India’s central bank, was given the authority to regulate
commercial banks (Banerjee 2004). The Indian government would leverage the banking
system achieve social and economic objectives by expanding credit to underserved
districts, curb abuse of credit by industrial entrepreneurs, and prevent systemic bank
failures from re-occurring.
Between 1960 and 1990, the Indian government nationalized almost all private
banks in the country. First, in 1969, the government nationalized each of the 14 major
commercial banks with deposits greater than Rs. 500 million. Then, in 1980, more banks
were nationalized until 90% of bank branches were under government ownership
(Banerjee 2004). The RBI’s actions may be understood under a context of great public
apprehension over private bank ownership. In a recent report, the RBI writes
Even though industrial and businesses houses are already permitted in
other [non-deposit-taking] areas of financial services, banks are special as
they are highly leveraged fiduciary entities central to the monetary and
payment system. There are several deep-rooted fears in allowing industrial
and business houses to own banks. Mainly these relate to the fact that such
an affiliation tends to undermine the independence and neutrality of banks
as arbiters of the allocation of credit to the real sectors of the economy…
The Japanese experience with Keiretsu, the Korean experience with
Chaebols and the Indian experience prior to nationalization are strong
reminders of the pitfalls of commercial interests promoting and/or
controlling banks (RBI 2011)
India’s nationalized banks have had success at expanding financial access: since
1969, nearly 60,000 new bank branches have opened in India, garnering most deposits
held by Indian banks (Banerjee 2004). However, because nationalized banks were large
25
and deprived of competition over the course of 20 years, their performance deteriorated,
which jeopardized sustainable economic development of the country.
The major causes of deteriorating bank performance can be summarized as (a) a
lack of incentives to allocate credit based on the profitability or creditworthiness of the
borrower, (b) regulatory burdens, and (c) political abuse. In the early years of
nationalization, “ministers organized loan fairs in which money was distributed without
the … expectations of repayment… not surprisingly, the banking system was soon
reeling under bad loans” (Wharton 2009). For example, banks were required to hold
government securities, to follow set interest rates, and, after 1985, to allocate 40% of
loans to the priority sector. The priority sector, which still exists today, includes small-
scale industry and agricultural projects. It has been adapted in recent years to serve
microfinance organizations as well.
The concentration of wealth and power in a few public banks in 1990, coupled
with the country’s current account crisis, threatened the sustainability of the banking
system. Starting in 1991, India allowed foreign banks and new private banks to enter
commercial banking. These private and foreign banks faced large competitive
disadvantages due to their small market share, but still initially outperformed state-owned
banks. New banks had to be well capitalized, technologically advanced, and not be
owned by or associated with industrial houses (Shirai 2001). The RBI also decided to
reduce the reserve requirements and institute more prudential norms. At this time, there
were 140 foreign bank branches in India and 60,000 domestic banking branches (Shirai
2001). In 1994, the government recapitalized public sector banks and allowed them to
raise up to 49% of their capital from the private sector. In 2004, new regulations allowed

26
foreign investors to own up to 74% of private banks (Shirai 2001). The growth of the
banking sector following liberalization is more closely analyzed in Sections 4 and 5.

27
4 Political Economies of Growth: Education and Urbanization
This section tests education, wage, and external economies of scale as drivers of
growth for in information technology and banking sectors using cross-sectional growth
regressions in two time periods. As the regressions are across states, the indicators in the
sample are more comparable than cross-country regressions. States in India are also
bound to the same federal laws for I.T. and banking, providing a basis for comparing
other indicators across states. This enables us to find more reliable coefficients for
differences in education or literacy, despite the limited sample size. The regressions
presented in this section aim to suggest whether robust correlations exist between
dependent and independent variables. Section 5 builds on this section by building a
theory of sequential industrial policy for the information technology and banking sectors.
4.1 Data Description
• Dependent Variables
o Information Technology Services Exports. Data on information
technology used in this section was obtained from field research I
conducted in July 2013 in the archives of the Software Technology Parks
of India (STPI) offices in New Delhi. The data has aggregate state-level
exports from 1991 to 2012 for I.T. service firms that were participating in
the STPI incentive scheme. As the STPI incentive scheme imposed no
taxes on firm profits during from 1993 to 2010, most exporting firms are
covered by these statistics (Rai 2013 and Omkar 2013). This is the first
paper that, to my knowledge, contains annual data on I.T. exports from
28
India segmented by state since 1993. Data on the information technology
sector in India are not otherwise made public.
o Banking Sector Value Added. Data on the banking sector for this section
was obtained from a value added time-series of the sector provided by the
McKinsey Global Institute. I use the same covariates as in the I.T. sector
as a point of comparison. This banking data is supplemented by indicators
of financial stability and profitability in Section 5 obtained by the Reserve
Bank of India.
• Independent variables. Data on education, urbanization, and literacy indicators
was obtained from the Census, Indiastat (an aggregator of statistics) and the
websites of Indian Ministries. Data on higher education enrollment is not
regularly published on a state-level. As this is the key socioeconomic driver of I.T.
growth, and I obtained two observations—in 2000 and 2007—cross-sectional
regressions were only conducted in these two years. As a result of their sample
size and specification, these regressions are necessarily descriptive; they provide
useful context for the otherwise mainly qualitative literature on drivers of
information technology growth in India.
4.2 Analysis
The correlation matrix (Table 2, appendix) summarizes the cross-correlation of
key socioeconomic drivers for the growth of the I.T. sector. A higher urban ratio is
associated with higher literacy, education, and wages. States with more students in higher
education have stronger levels in I.T. exports. The ordinary-least-squares specification I
use to estimate the level of I.T. exports is

29
𝐸𝑥! = 𝐵! + 𝛽!ℎ! + 𝛽!𝑝! + 𝛽!𝑤! + 𝛽!𝑟! + 𝛽!𝑙! + 𝑢! (Eq. 1)
where 𝐸𝑥 is the level of exports in Rs. crores from 2005 CPI levels2; h is the number of
students enrolled in institutions of higher education in thousands; p is the population in
millions; w is the average hourly wage for firms with 50+ employees or 100+ employees
without electricity supply; r is the percentage of people living in urban areas (0 to 100),
and l is the urban literacy rates (0 to 100) for state i with an error term u.
Tables 3 and 4 (appendix) suggest higher education in significant for explaining
the growth of the I.T. sector. In particular, when higher education is removed from
Regression 3 to Regression 4, the R-squared value drops from 61% to 16%. This
indicates that without information on college enrollment, we can explain almost none of
the variance in information technology services growth between states. Higher education
is also the only statistically significant value, with p<0.01, even after controlling for
levels of urbanization and population. Investments by the government in tertiary
education decades earlier created a flow of engineers who could be employed or start
their own companies if given the capital and infrastructure to do so.
The most compelling part of these results emerges when we plot the predicted
value of exports against the actual values (Figures 3 and 4). In both figures, Karnataka
(KNT), where Bangalore is located, has approximately double the actual exports than
predicted. In 2007, other states are consistent with predicted values. First, these figures
suggest the conditional distribution of ui is not zero, and therefore the coefficients are
biased in indeterminate direction as a result of missing variables. Second, and critically,
2 1 crore is equivalent to ten million. The exchange rate in January 2010 and January 2005 was Rs. 45 / $. Beginning in August 2011, the rupee depreciated and in December 2013 trades at Rs. 61 / $.

30
that actual exports are far higher than predicted in only Karnataka suggests there are other
major drivers of growth that are not included in the cross-sectional regression in Table 2.
These drivers are not possible to test at this level of aggregate data, but field interviews
with experts can give insight into what the possibilities are:
The STPI General Director, Dr. Rai, the STPI-Bangalore Director, Mr. Das, and
Professor at the Institute of Information Technology in Bangalore, Dr. Parthasarathy,
suggest two hypotheses for why Karnataka is an outlier in this growth regression: (1), it
was the recipient direct industrial policy compared to other states, and (2), the types of
I.T. services in Bangalore are higher in the value chain compared to other cities, and
therefore less elastic to local wages and educational institutions. Parthasarathy noted in
an interview that “companies in Bangalore are not as wage sensitive because they are
developing new products, not running call centers… they want the best engineers at any
cost” (2013). Both hypotheses are supported by Figures 3 and 4, and will be explored in
more detail in Section 5.
Figure 3. Predicted vs. Actual Values, 2007 Exports (Table 3, Regression 6)
AP
AS
DEL
GUJ
HR
KNT
KRL
MHR
MP
ORS
PNJRJS
TN
UP
WB
-200
000
2000
040
000
6000
0Pr
edict
ed E
xpor
ts
0 20000 40000 60000Actual Exports
Fitted values 45-degree line
31
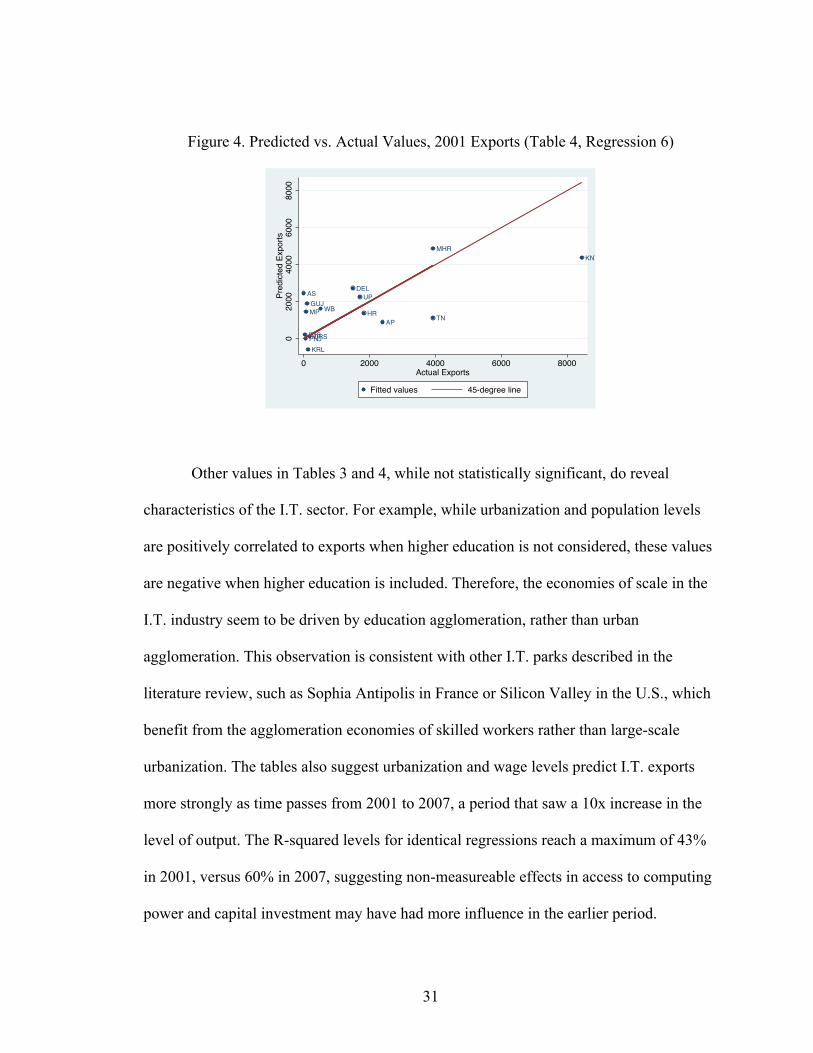
Figure 4. Predicted vs. Actual Values, 2001 Exports (Table 4, Regression 6)
Other values in Tables 3 and 4, while not statistically significant, do reveal
characteristics of the I.T. sector. For example, while urbanization and population levels
are positively correlated to exports when higher education is not considered, these values
are negative when higher education is included. Therefore, the economies of scale in the
I.T. industry seem to be driven by education agglomeration, rather than urban
agglomeration. This observation is consistent with other I.T. parks described in the
literature review, such as Sophia Antipolis in France or Silicon Valley in the U.S., which
benefit from the agglomeration economies of skilled workers rather than large-scale
urbanization. The tables also suggest urbanization and wage levels predict I.T. exports
more strongly as time passes from 2001 to 2007, a period that saw a 10x increase in the
level of output. The R-squared levels for identical regressions reach a maximum of 43%
in 2001, versus 60% in 2007, suggesting non-measureable effects in access to computing
power and capital investment may have had more influence in the earlier period.
AP
ASDEL
GUJHR
KNT
KRL
MHR
MP
ORSPNJRJS
TN
UPWB
020
0040
0060
0080
00Pr
edict
ed E
xpor
ts
0 2000 4000 6000 8000Actual Exports
Fitted values 45-degree line
32
I conduct a similar regression analysis on the banking industry:
𝑉𝐴! = 𝐵! + 𝛽!ℎ! + 𝛽!𝑝! + 𝛽!𝑤! + 𝛽!𝑟! + 𝛽!𝑙! + 𝑢! (Eq. 2)
where V is the level of value added per year in state i, and the covariates are equivalent to
those in the I.T. sector. The value added of the banking system in India includes domestic
growth, which is linked to business development and access to foreign capital. From
Table 5 (see appendix) we should note that the key drivers of banking value are a
combination of urbanization, urban literacy and wage levels. In Regression 5, a 1
percentage point increase in urban literacy levels is associated with Rs. 29 thousand
crores more value added by banks. In Regression 4, a 1 percentage point increase in
urbanization is associated with 15 thousand crores of additional value added.
Urbanization and urban literacy, proxies for business growth and better general education
levels, predict the growth of the banking sector more strongly than specialized education.
Figures 5 and 6 suggest that on the basis of socioeconomic indicators,
Maharashtra is a strong outlier, as Karnataka is in the information technology sector. Just
as Karnataka was the beneficiary of heavy government investment in information
technology, Maharashtra is also the location of the State Bank of India (SBI), the largest
financial institution in the country with 20% of all of India’s deposits and outstanding
loans. That the only major outliers for the I.T. sectors and banking sectors were the
recipients of extraordinary government intervention suggests industrial policy has been a
significant factor in supporting the growth of these industries.

33
5 Political Economies of Growth: Industrial Policy and Regulation
Higher education and urbanization are only two factors that drive the
development of the tertiary sector. This section analyzes the role of government policy
and deregulation in the period of growth following 1991 for the information technology
and banking sectors.
5.1 Industrial policy and deregulation in the information technology sector
5.1.1 The Software Technology Parks of India program
Though India tops the charts of I.T. exports, this is not necessarily only the result
of low wages, strong higher education and English language proficiency. Table 7 shows
Andhra Pradesh and Tamil Nadu (#3 and 4 producers in 2010) growing at approximately
Rs. 4400 crores per year between 2001 and 2007, and Haryana and Uttar Pradesh (#5 and
6) growing at approximately Rs. 1800 crores per year in that same time period. The
growth trajectories of Maharashtra (Rs. 5800 crores per year) and Karnataka (Rs. 9370
crores per year) are unrivaled.
Table 7. Average annual growth in I.T. service exports, selected states, 2001 - 2007
State Average annual growth Karnataka Rs. 9370 crores
Maharashtra 5820 Andhra Pradesh 4360
Tamil Nadu 4475 Haryana 1820
Uttar Pradesh 1700
The early differences in growth trajectories between Uttar Pradesh and Karnataka
suggest that heavy state intervention set the two states on different growth trajectories. In
1992, these were the only two states in India with I.T. service exports that had reached Rs.
34
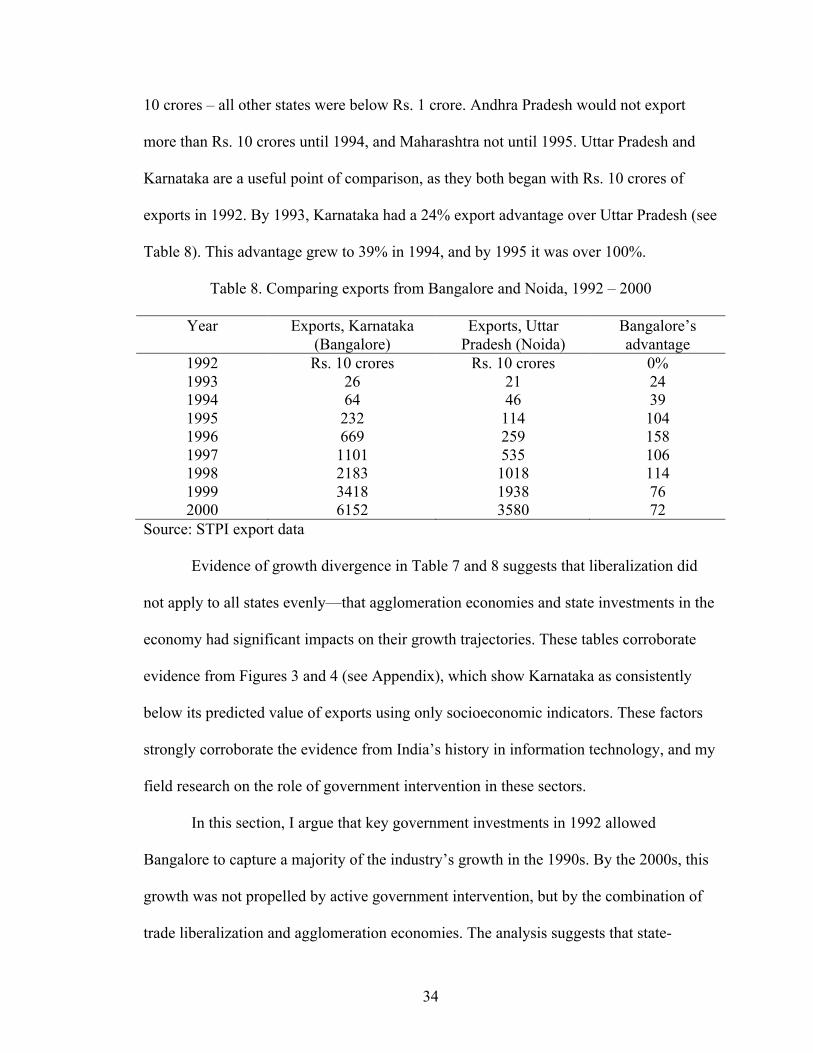
10 crores – all other states were below Rs. 1 crore. Andhra Pradesh would not export
more than Rs. 10 crores until 1994, and Maharashtra not until 1995. Uttar Pradesh and
Karnataka are a useful point of comparison, as they both began with Rs. 10 crores of
exports in 1992. By 1993, Karnataka had a 24% export advantage over Uttar Pradesh (see
Table 8). This advantage grew to 39% in 1994, and by 1995 it was over 100%.
Table 8. Comparing exports from Bangalore and Noida, 1992 – 2000
Year Exports, Karnataka (Bangalore)
Exports, Uttar Pradesh (Noida)
Bangalore’s advantage
1992 Rs. 10 crores Rs. 10 crores 0% 1993 26 21 24 1994 64 46 39 1995 232 114 104 1996 669 259 158 1997 1101 535 106 1998 2183 1018 114 1999 3418 1938 76 2000 6152 3580 72
Source: STPI export data
Evidence of growth divergence in Table 7 and 8 suggests that liberalization did
not apply to all states evenly—that agglomeration economies and state investments in the
economy had significant impacts on their growth trajectories. These tables corroborate
evidence from Figures 3 and 4 (see Appendix), which show Karnataka as consistently
below its predicted value of exports using only socioeconomic indicators. These factors
strongly corroborate the evidence from India’s history in information technology, and my
field research on the role of government intervention in these sectors.
In this section, I argue that key government investments in 1992 allowed
Bangalore to capture a majority of the industry’s growth in the 1990s. By the 2000s, this
growth was not propelled by active government intervention, but by the combination of
trade liberalization and agglomeration economies. The analysis suggests that state-
35
facilitated development and liberalization are both necessary in the tertiary sector, but
must be sequenced properly.
Consistent with the state-facilitated development school, early government
investments in the defense sector during World War II contributed to the necessary
research institutions and development of engineers that initially encouraged IBM and
public enterprises to locate in Bangalore. The defense sector had located in Bangalore
because it was distant from Pakistan and China and had an established electric grid as a
result of the city’s 19th-century mercantile past (Section 3). A combination of private
sector growth combined with heavy government mobilization of resources set Bangalore
up for its growth in information technology services after 1980. Government investments
in Bangalore’s communications capability were crucial for early entrepreneurs in the
sector.
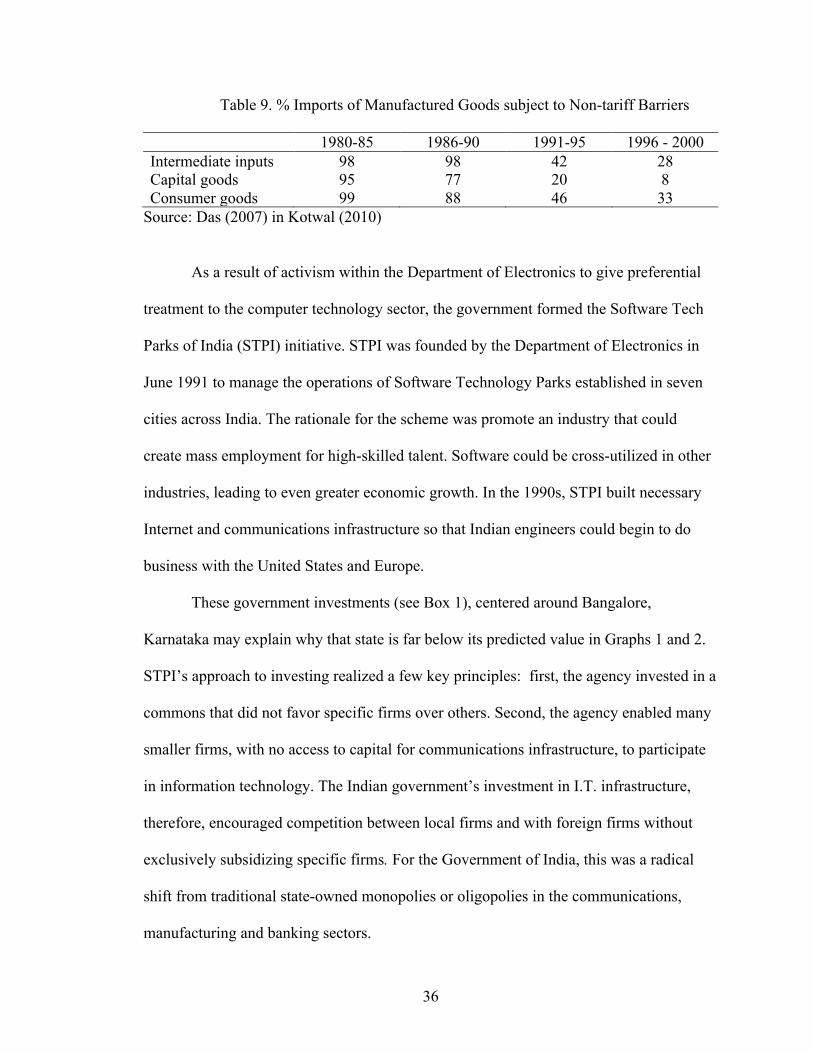
The government’s relaxation of import license requirements was critical for the
growth of the I.T. sector. In the early 1980s, 95% of capital goods and 98% of
intermediate inputs across the economy were subject to non-tariff barriers such as
licenses across the economy (Table 9). In 1984, the government abolished import licenses
and requirements for computers. Exports of computers increased from $200,000 in 1981
to $4.8 million by the end of the decade. India did not complement import licensing
requirements with efforts to increase inter-firm competition, as the Japanese or Korean
government had done while protecting heavy manufacturing (Evans 1995).
36
Table 9. % Imports of Manufactured Goods subject to Non-tariff Barriers
1980-85 1986-90 1991-95 1996 - 2000 Intermediate inputs 98 98 42 28 Capital goods 95 77 20 8 Consumer goods 99 88 46 33
Source: Das (2007) in Kotwal (2010)
As a result of activism within the Department of Electronics to give preferential
treatment to the computer technology sector, the government formed the Software Tech
Parks of India (STPI) initiative. STPI was founded by the Department of Electronics in
June 1991 to manage the operations of Software Technology Parks established in seven
cities across India. The rationale for the scheme was promote an industry that could
create mass employment for high-skilled talent. Software could be cross-utilized in other
industries, leading to even greater economic growth. In the 1990s, STPI built necessary
Internet and communications infrastructure so that Indian engineers could begin to do
business with the United States and Europe.
These government investments (see Box 1), centered around Bangalore,
Karnataka may explain why that state is far below its predicted value in Graphs 1 and 2.
STPI’s approach to investing realized a few key principles: first, the agency invested in a
commons that did not favor specific firms over others. Second, the agency enabled many
smaller firms, with no access to capital for communications infrastructure, to participate
in information technology. The Indian government’s investment in I.T. infrastructure,
therefore, encouraged competition between local firms and with foreign firms without
exclusively subsidizing specific firms. For the Government of India, this was a radical
shift from traditional state-owned monopolies or oligopolies in the communications,
manufacturing and banking sectors.

37
Source: STPI Annual Report, 1993, 1994
Box 1. Early investments by the Software Technology Parks of India In its first annual report, published in 1994 and covering September 1991 to March 1993, STPI documents its earliest investments in I.T. In addition to permitting telecommunication infrastructure imports without custom duty and without export obligation, STPI made infrastructure investments in the following cities:
• Pune: o Acquired space of 320 square meters to rent out 30 units. o Software exports increased from Rs. 4.5 million in FY93 to 16.2 million
in FY94. • Bangalore: “All the physical and technical infrastructure required for software
exporters have been created and is made available for their operations.” o SoftNET installed to communicate with New York, London,
Netherlands and Germany at 64 to 512 Kbps. o Created 25 member units using value added services, 94 units approved
in total o Exports increased from Rs. 229 million in FY93 to Rs. 566 million in
FY94. • Hyderabad. “All physical and technical infrastructure required for software
exporters made available.” o 510 square meters of land made available. o LAN services were installed on a “shared basis” for firms operating in
the jurisdiction. o Exports increased from Rs. 45.5 million in FY93 to Rs. 98.4 million in
FY94. • Noida.
o 1800 square meters allotted for 50 units. o Exports increased from Rs. 236 million in FY93 to Rs. 457 million in
FY94 In its second annual report (1993-1994), STPI documents expanded infrastructural investments
• Built-space and common amenities totaling 17,500 square meters for 87 firms. • IBM AS-400 systems in Pune and Hyderabad. • Completion of “international gateway facilities” as rated by INTELSAT in four
cities: Bangalore, Hyderabad, Thiruvananthapuram, and Gandhinagar. Work underway to establish an Earth Station in Bubaneswar and Noida.
38
In its first annual report, STPI outlines five ways to encourage the development of
the I.T. export industry: (1) tax incentives (2) infrastructure, (3) certifications (4)
marketing support and (5) training. The first two incentives were perhaps the most
important. Tax incentives waived all income tax requirements for I.T. exports and
dramatically streamlined the import process. Infrastructure investments included “utility
power, ready-to-use built-up space, centralized computing facilities, and data
communication facilities” – key common amenities that the government treated as shared
public goods for the I.T. sector.
The nexus of tax incentives and infrastructure platforms provided a foundation for
increasing economies of scale in early investments, like Bangalore. These investments
have since expanded to the rest of the country (see Box 3). Since infrastructure is
accessible to over 100 firms, it encouraged the growth of a competitive private sector and
ensured companies would compete on an even footing with engineers from developed
countries. These investments gave firms in these locations competitive advantages and
helped sustain early agglomeration economies. The government took on a risk that the
private sector or banks could not afford; the agency acted as an investment banker for the
industry (see Box 2). This strategy is similar to that used in Taiwan and South Korea (see
Section 2).
39
Source: STPI Annual Report, 2001
Source: STPI Annual Report, 2008, 2010
One major shortcoming of the government agency, in its role as an investment
banker for the industry, is its failure to fund improvements to basic electric infrastructure.
These investments are critical for the long-term growth of I.T. According to interviews
with the Chief Risk Officer of Infosys and the Director General of the Software
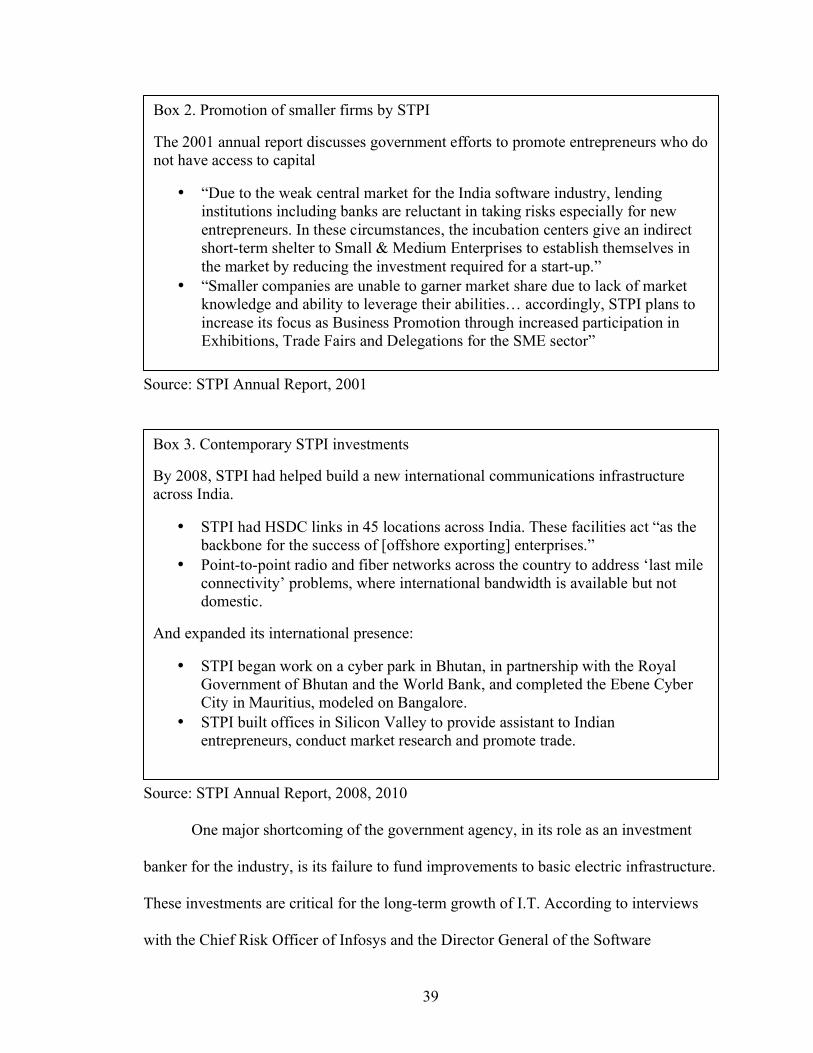
Box 2. Promotion of smaller firms by STPI
The 2001 annual report discusses government efforts to promote entrepreneurs who do not have access to capital
• “Due to the weak central market for the India software industry, lending institutions including banks are reluctant in taking risks especially for new entrepreneurs. In these circumstances, the incubation centers give an indirect short-term shelter to Small & Medium Enterprises to establish themselves in the market by reducing the investment required for a start-up.”
• “Smaller companies are unable to garner market share due to lack of market knowledge and ability to leverage their abilities… accordingly, STPI plans to increase its focus as Business Promotion through increased participation in Exhibitions, Trade Fairs and Delegations for the SME sector”
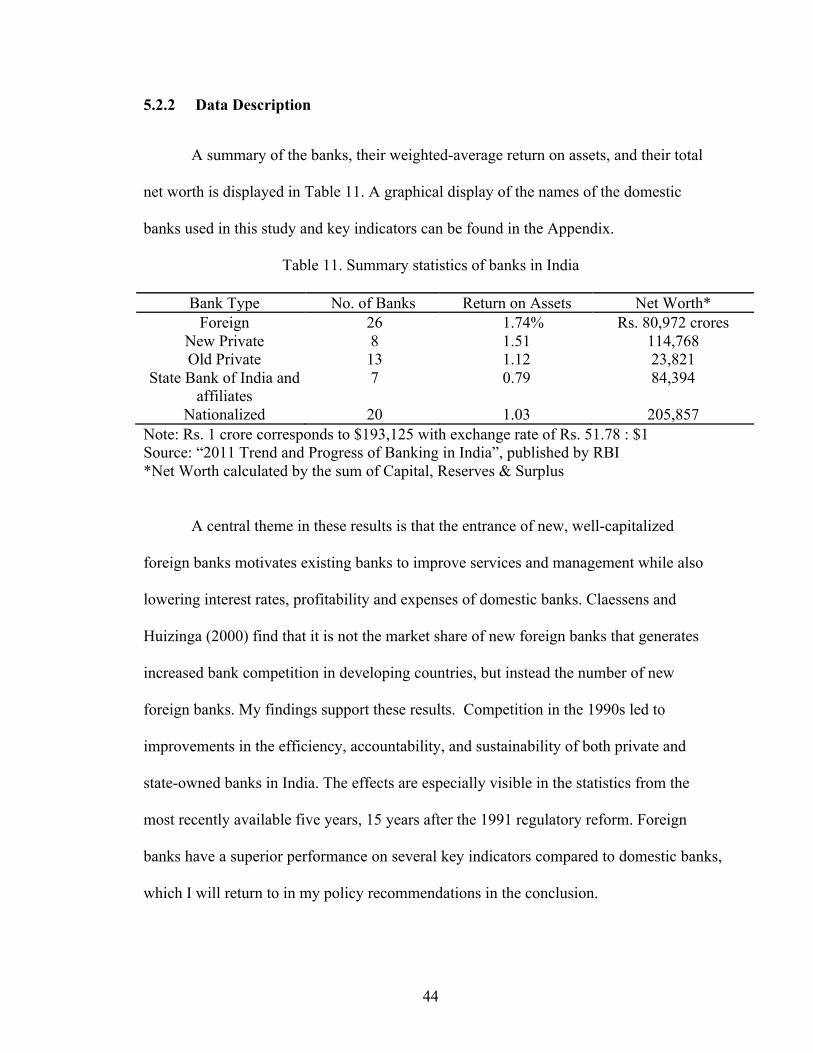
Box 3. Contemporary STPI investments
By 2008, STPI had helped build a new international communications infrastructure across India.
• STPI had HSDC links in 45 locations across India. These facilities act “as the backbone for the success of [offshore exporting] enterprises.”
• Point-to-point radio and fiber networks across the country to address ‘last mile connectivity’ problems, where international bandwidth is available but not domestic.
And expanded its international presence:
• STPI began work on a cyber park in Bhutan, in partnership with the Royal Government of Bhutan and the World Bank, and completed the Ebene Cyber City in Mauritius, modeled on Bangalore.
• STPI built offices in Silicon Valley to provide assistant to Indian entrepreneurs, conduct market research and promote trade.

40
Technology Parks of India, Bangalore’s superior electricity grid attracted early
information technology companies (Rai and Kanchinadham, 2013). In a survey by the
World Bank, firms reported that electricity was also a significant challenge for their
operations in India. Table 10 summarizes results from a countrywide stratified sample of
450 firms from a 2010 run of the Business Enterprise Survey. Firms are ranked in each
column by how they self-rank average corruption, labor regulation, and electricity as an
“obstacle to operations,” with the type of firms facing the most obstacles on top. Even
though Maharashtra, Andhra Pradesh and Tamil Nadu are the #2, 3, and 4 business
owners for software and technology service companies, they still consistently rank
electricity as a major obstacle relative to counterparts in other industries.
Table 10. Cross-industry comparison of firms in Gujarat, Tamil Nadu, Delhi, Andhra Pradesh, and Maharashtra
Rank Corruption as Obstacle
Labor Regulations as Obstacle
Electricity as Obstacle
1 plastics textiles it 2 transport other man textiles 3 other man food plastics 4 textiles construct construct 5 retail transport machinery 6 construct machinery fabricated metals 7 fabricated metals fabricated metals other man 8 machinery motor vehicle services retail 9 wholesale plastics electronics 10 it wholesale wholesale 11 basic metals it garments 12 garments retail motor vehicle 13 motor vehicle basic metals food 14 electronics electronics basic metals 15 hotel/restaurant garments chemicals 16 food chemicals transport 17 chemicals hotel/restaurant hotel/restaurant
Source: 2010 Survey of Firms in India, World Bank Business Enterprise Survey. N = 450.

41
5.1.2 Labor deregulation in the 1990s
Following the establishment of communications infrastructure by STPI, the
gradual deregulation of labor laws within the I.T. sector in the 1990s enabled companies
to maintain strong early growth trajectories. This trend occurred in states with significant
presence in the I.T. sector.
In Karnataka, legislation that would otherwise apply regularly exempts workers in
the I.T. industry. It also provides exemptions for laws to limit working overnight for
women and children:
“The State is committed to simplify all the relevant enactments for the [Business
Process Outsourcing] sector. The barriers including employment of women at
night, flexi-working hours and mandatory weeks off have all been removed…to
create an optimal environment for the growth of the…sector in the state”
(Directorate of Industries and Commerce, State Government of Karnataka in
Penfold 2005)
Other states developed similar policies. Andhra Pradesh created I.T.-specific labor
policies, West Bengal allows employers the flexibility to self-regulate, and Uttar Pradesh
exempts I.T.-related businesses from routine inspections (Penfold 2005). To prevent
unionization, business process outsourcing, or BPO, was declared a ‘public utility’ in
certain states, thereby preventing workers from striking.
Even when there are labor laws, evidence indicates labor inspectors gave
preferential treatment to the I.T. sector: for example, ‘unofficial payments’ to inspectors
can reduce the number of inspections by over 50 percent (Penfold 2005). Between the
delays and corruption, I.T. service firms do not fear prosecution when violating
legislation (Penfold 2005).

42
In practice, even where worker protection applies, employees do not remain in
their jobs long enough to be entitled to benefits. Instead of trying to enforce rights such as
maternity leave, employees leave their jobs (Penfold 2005). Highly skilled workers are in
high demand and, based on demand, jobs are often available for them. Only 5 percent of
India’s 2 million graduates every year are employable by call centers and only 15-20%
are trainable (Penfold 2005).
The gradual deregulation of labor laws in the I.T. sector throughout the 1990s
enabled firms to maintain initially high rates of growth. Without the benefit of
randomization, it is difficult to prove the causal effect of any of these single interventions.
However, the evidence from Sections 4 and 5 points to a story where strong government
investments in R&D, education, defense, combined with early protectionism and gradual
deregulation, enabled local engineers to gain necessary skills to compete and take
leadership in the global economy of I.T. services.
5.2 Industrial policy and deregulation in the banking sector
Most government intervention in the banking sector occurred prior to 1991, as
documented in Section 3.2. After 1991, the Reserve Bank of India (RBI) allowed
entrance of foreign and private banks, and was under to pressure to privatize its state-
owned banking sector. Unlike investments by STPI in the I.T. sector, the banking sector
was not a recipient of a similar “infrastructure commons” that enabled competitors to
create a vibrant local market. Instead, most of the profits in banking sector had been
concentrated in Mumbai, Maharashtra, as a result of the government ownership of the
State Bank of India since 1956. The question that motivates this section is the extent to
which the sequencing of state-facilitated development and liberalization was effective for

43
the performance of banks today; I find that it was. While we do not have a “control”
group to test whether immediate liberalization would have been more effective, the data
suggests that today’s nationalized banks perform almost at the same standard as foreign
banks on key profitability and stability indicators. Moreover, historical evidence on
banking crises prior to the 1950s suggests that nationalization has been very important for
financial stability and promoting broader savings across the country.
5.2.1 Methodology
Bank regulators in the United States use a version of CAMELS to assess the
financial condition of banking institutions. CAMELS stands for Capital adequacy, Asset
quality, Management, Earnings, Liquidity, and Sensitivity to market risk (Manoj 2010).
In 1995, the Reserve Bank of India recommended that a modified version be used in
India, as the RBI was in the process of granting licenses to new private sector banks. The
Reserve Bank of India publishes PDF files of every scheduled (commercial) bank in
India. I assemble statistics from 72 banks that have been in operation for at least five
years in India as of FY 2011 and compile five-year panel data from a subset of the
CAMELS framework. The capital to risk-weighted assets ratio (CRAR) is used to
comment on capital adequacy, the ratio of non-performing assets to total assets is used to
analyze asset quality, the return on assets is used to analyze earnings, and the change in
the cost of funds of each bank during the 2008 macroeconomic crisis is used to analyze
sensitivity to market risk.
44
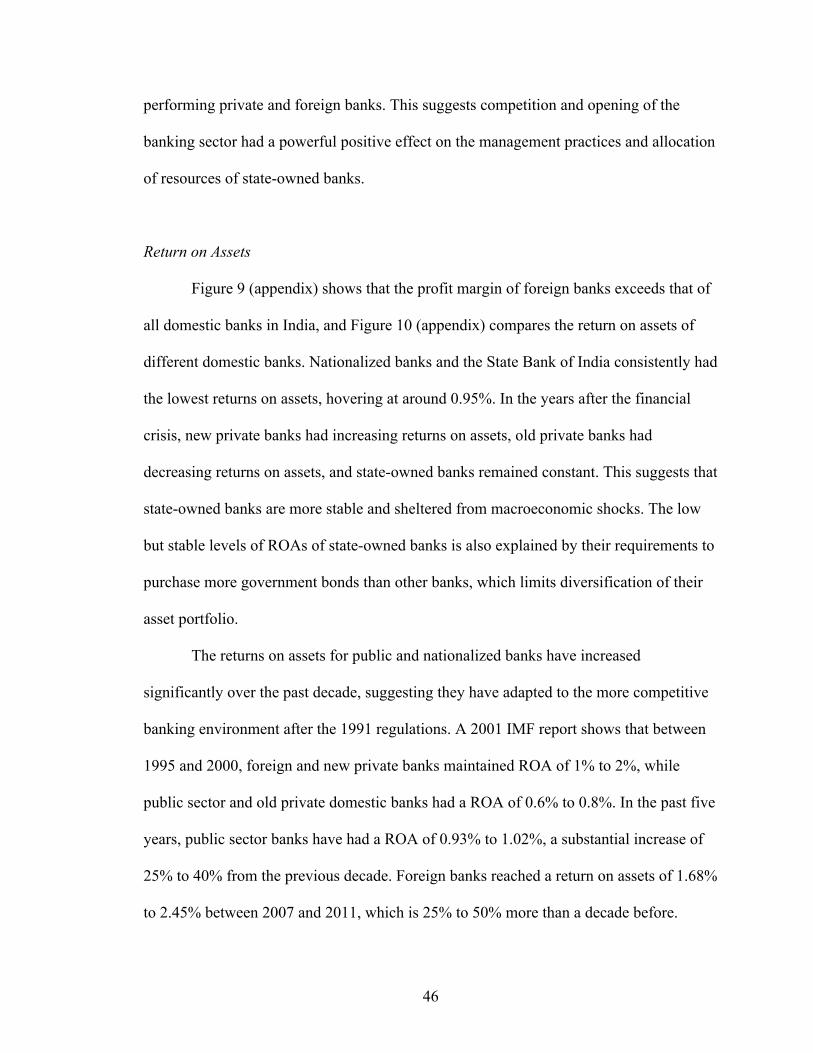
5.2.2 Data Description
A summary of the banks, their weighted-average return on assets, and their total
net worth is displayed in Table 11. A graphical display of the names of the domestic
banks used in this study and key indicators can be found in the Appendix.
Table 11. Summary statistics of banks in India
Bank Type No. of Banks Return on Assets Net Worth* Foreign 26 1.74% Rs. 80,972 crores
New Private 8 1.51 114,768 Old Private 13 1.12 23,821
State Bank of India and affiliates
7 0.79 84,394
Nationalized 20 1.03 205,857 Note: Rs. 1 crore corresponds to $193,125 with exchange rate of Rs. 51.78 : $1 Source: “2011 Trend and Progress of Banking in India”, published by RBI *Net Worth calculated by the sum of Capital, Reserves & Surplus
A central theme in these results is that the entrance of new, well-capitalized
foreign banks motivates existing banks to improve services and management while also
lowering interest rates, profitability and expenses of domestic banks. Claessens and
Huizinga (2000) find that it is not the market share of new foreign banks that generates
increased bank competition in developing countries, but instead the number of new
foreign banks. My findings support these results. Competition in the 1990s led to
improvements in the efficiency, accountability, and sustainability of both private and
state-owned banks in India. The effects are especially visible in the statistics from the
most recently available five years, 15 years after the 1991 regulatory reform. Foreign
banks have a superior performance on several key indicators compared to domestic banks,
which I will return to in my policy recommendations in the conclusion.

45
5.2.3 Analysis
Capital Adequacy Ratio
The capital to risk-weighted asset ratio (CRAR) represents the general financial
position of banks and their ability to meet additional capital requirements in the event of
unexpected losses. In India, the minimum CRAR for commercial banks is 9%. Figure 7
(appendix) shows that all banking categories safely exceed the 9% requirement. The State
Bank of India is the least capitalized and most prone to risk, while other banks have a
lower risk profile. The world’s largest 100 banks have a capital adequacy ratio of
14.87%, according to Bloomberg. The high level of capital adequacy of banks in India
explains in part why India was relatively sheltered from the macroeconomic shocks of the
global financial crisis. On average, nationalized banks are the most leveraged. The two
largest banks in India, State Bank of India and ICICI Bank, have a lower risk profile,
with CRAR at 13.47% and 13.97%, respectively.
Asset Quality
Asset quality can be measured by looking at the ratio of non-performing assets
(NPA) to total assets; the lower the share of NPAs, the higher the quality of the assets.
The levels of NPAs in Figure 8 (appendix) are dramatically lower than they were a
decade earlier. In 1992, the ratio of NPA to total assets of public-sector banks was 24%
(Shirai 2001). By 1996, public-sector banks had 9.2% NPA and by 2000, 7%. Old private
sector banks, also facing fresh competition in the early 1990’s from foreign and new
private banks, had approximately 7% NPA’s. Non-performing assets in public banks
dramatically fell from 1991 to today: they are in 1% to 2% range, on par with the top-
46
performing private and foreign banks. This suggests competition and opening of the
banking sector had a powerful positive effect on the management practices and allocation
of resources of state-owned banks.
Return on Assets
Figure 9 (appendix) shows that the profit margin of foreign banks exceeds that of
all domestic banks in India, and Figure 10 (appendix) compares the return on assets of
different domestic banks. Nationalized banks and the State Bank of India consistently had
the lowest returns on assets, hovering at around 0.95%. In the years after the financial
crisis, new private banks had increasing returns on assets, old private banks had
decreasing returns on assets, and state-owned banks remained constant. This suggests that
state-owned banks are more stable and sheltered from macroeconomic shocks. The low
but stable levels of ROAs of state-owned banks is also explained by their requirements to
purchase more government bonds than other banks, which limits diversification of their
asset portfolio.
The returns on assets for public and nationalized banks have increased
significantly over the past decade, suggesting they have adapted to the more competitive
banking environment after the 1991 regulations. A 2001 IMF report shows that between
1995 and 2000, foreign and new private banks maintained ROA of 1% to 2%, while
public sector and old private domestic banks had a ROA of 0.6% to 0.8%. In the past five
years, public sector banks have had a ROA of 0.93% to 1.02%, a substantial increase of
25% to 40% from the previous decade. Foreign banks reached a return on assets of 1.68%
to 2.45% between 2007 and 2011, which is 25% to 50% more than a decade before.
47
While all other banking sectors increased ROA, new private banks have consistently
hovered between 1% and 1.4% returns, similar to their ROA a decade earlier.
Sensitivity To Market Risk
Figure 11 (appendix) shows that while private banks are more sensitive to price
shocks than state-owned banks, foreign banks react far more rapidly to macroeconomic
shocks. Foreign banks sold US $9.6 billion shares in the first 9 months of 2008, while the
BSE Sensex dropped 50% over the course of the year. These reactions to price shocks are
reflected in the rapid 37% drop in cost of funds paid out by foreign banks over the course
of one year. Their disruptive impact on the Indian economy was mitigated by the stability
of state-owned banks. State-owned banks were less sensitive to macroeconomic price
shocks compared to foreign and new private banks.
Banerjee (2004) supports these findings with evidence that shows the Central
Vigilance Commission discourages loan officers from taking risks. Banerjee (2004) also
shows that neither private nor public banks were supplying loans to firms that were newly
eligible for additional credit. Panagariya (2008) uses this as evidence to show that
“government ownership has a detrimental effect on lending” compared to privately
owned banks (239). He argues government ownership may create institutional inertia and
promote risk-averse investment.
Discussion
My analysis suggests that restrictions on competition through regulatory and
monopolistic barriers to entry, rather than ownership of the bank, limited bank

48
performance prior 1991. These restrictions to competition were similar in character to
those placed on the technology sector during the 1970s (see Section 3). Once these
restrictions were lifted, the nationalized sector gradually improved its performance and
today is nearly at the level of private and foreign banks. The liberalization of the banking
sector led to dramatic improvements in the efficiency. Its long-term effects have made
both private and public banks more profit-oriented and competitive, and less prone to
non-performing assets, thereby leading to lower intermediation costs over time.
Chaudhary (2011) suggests stock price performance of banks in India today indicates that
the market views public banks favorably.
Return on assets of state-owned and old private banks increased 30% between
2001 and 2011, closely following the performance of foreign banks, which increased
their returns between 25% and 40% in the past decade. State-owned banks also had a
rapid drop in non-performing assets. The high levels of NPAs of state-owned and old
private banks in the 1990s decreased to the level of foreign banks in the span of a decade.
While new private banks today perform marginally better than state-owned and old
private banks, they still lag behind the performance of private foreign banks by around 1
percentage point (Figure 9, Appendix).
In recent years, the state used its monopoly position to pay out more than the
equilibrium rate on deposits and charge less than equilibrium rates on advances. This
forced private banks to pay a premium on their deposits (peaking at 6.8%, compared to
6.1% for nationalized banks, over the past five years) in order to remain competitive. The
RBI should, then, encourage private banks to better compete with nationalized banks.
This would improve both the management and efficiency of the private and state-owned

49
sector, encouraging more accountability even within the constraints of the social mandate
of state-owned banks.

50
6 Conclusion and Policy Implications
6.1 Primary findings
This paper proposes that liberalization is effective when pursued in conjunction
with state promotion for India, a late developing nation that today dominates the global
hierarchy of production in the computer services sector. The analysis of India’s banking
and I.T. sector indicates three findings: first, the shortcoming of human capital and urban
agglomeration in predicting the growth of a tertiary service sector; second, the
importance of gradual liberalization after initial domestic investments in the sector; and
third, the importance of government intervention to build a shared infrastructure that
firms and entrepreneurs may use to compete internationally.
First, the evidence suggests that human capital and urban agglomeration
economies are not sufficient to explain the growth of either the information technology or
banking sectors. India is not entirely unique in its levels of urbanization or literacy in the
developing world; its education, health and urbanization indicators are comparable to
Bangladesh, Sri Lanka and Nepal, for example (Sen 2013 and Rodrik 2004). Instead, the
high-technology sector required active industrial policy, where the state acts as an
investment bank while promoting competition and/or agglomeration. A cross-state
analysis suggests that states that received the greatest amount of industrial support had
the most successful tertiary economy by international standards of growth, holding
constant education, wages and urbanization levels.
Second, from the experience of the banking sector, this paper finds that gradual
liberalization – or domestic competition – is more important than ownership in
determining the strength of the sector. In the banking sector, the number of commercial

51
branches and access to savings accounts for Indians lasted after liberalization, while the
performance levels of public banks approached those of the private sector. in loan
allocations, the sector lagged until liberalization after 1991.
Third, this paper finds that the creation of an “infrastructure commons” that gave
entrepreneurs similar access to communications infrastructure as others in developed
countries was critical for the growth of the I.T. sector and can explain why Bangalore’s
growth in particular has been so rapid over the past 20 years. These findings suggest that
state intervention is critical for growth in high-technology sectors, and most effective
when it does not limit competition. Though heavy public ownership and investment both
the I.T. sector and banking sector led to slow growth while these industries were
monopolized between 1950 and 1980, their priority in the government also resulted in
concentrations of skilled workers. This concentration of skilled engineers is a shared
common good that can act as a catalyst for growth.
6.2 Policy Implications
The information technology sector in India has become mature and advanced
enough in the world’s hierarchy of trade that it does not require the same forms of
government promotion that it did decades ago. The goals of the I.T. sector today are to
shift from software maintenance and development to more creative forms of production
driven by start-ups, more similar to the modern day version of Silicon Valley, which is
the result of a culture of experimentation and risk-taking by both entrepreneurs and
investors. The work done in Bangalore is less wage-sensitive and more creative than it
was in the 1990s, and we should expect that with the proper promotion of common

52
infrastructure and close connections between firms, venture capitalists and angel
investors will gradually become more confident in the potential of local entrepreneurs.
STPI’s success in installing international communications portals is not matched
by the country’s performance in electricity infrastructure, limiting the potential growth of
the industry. Electricity is critical for the reliable provision of international software
services; while it might not be under the purview of the Department of Electronics to
ensure access to electricity, this is an area where the government’s collaboration with the
private sector could provide enormous positive benefits to the I.T. and other sectors.
India’s banking sector is, by necessity, more regulated than the I.T. sector and its
performance is still in transition from the nationalized period. My findings suggest that
RBI should lower barriers to entry for new private banks by revising license requirements,
and that the Indian government should reduce its natural monopoly over the nationalized
banking sector by allowing domestic banks to compete with foreign banks, and by
charging market prices to customers that do not fall under its priority sector. These
changes would encourage greater financial inclusion and better banking performance.
To lower barriers to entry, the government could relax its top-down control over
the banking sector – currently, domestic banks must allocate 40% of their loans to the
priority sector and locate 25% of their physical branches in rural and semi-urban areas
(Shirai 2001) – in order to allow new, smaller, domestic banks to better compete with
state-owned and foreign banks. These limitations discourages the growth of a domestic
banking sector and also ignore the fact that the need for financial inclusion is not only an
issue of geography. At least 80% of Indians living in urban areas, for example, do not
have access to formal financial services (Ujjivan 2005). Instead, the government should
53
encourage private banks to pursue financial inclusiveness by allowing them to propose
alternative business models, such as those that leverage mobile banking, have strong
social programs, or replicate some of the successes of MFI’s. This would give private
banks more flexibility and choice, avoiding the large startup costs of opening branches in
rural areas for new, smaller banks below certain capital requirements. Encouraging
smaller mid-sized banks will help with delivery of local services that meet the needs of
lower income households. It would also create positive synergies by encouraging more
use of computerized technology across banks, instead of requiring physical ATM’s and
branches.
The Indian government should also consider reducing its natural monopoly
position that results from its large ownership of the banking sector and preferential
treatment of foreign banks, by narrowing its scope in the financial sector. My findings
show that state-owned banks can give greater returns to investors and charge less for
advances than private banks, making it difficult for private banks to attract new capital.
This distorts the market and discourages new private banks from competing. The private
sector has proven to be just as effective at providing loans to the priority sector as
nationalized banks, by supplying even more to the agricultural sector and weaker sections
compared to public banks. As the government has been successful at rural expansion but
not at lending to public and private enterprises, the government should consider
transforming some of its nationalized banks into narrow savings banks. As such, the
banks would be able to continue satisfying deposit and payment services, while
restricting their lending scope and giving private sector banks more opportunity to lend to
public and private enterprises. These recommendations would help accelerate the positive
54
contributions of state-owned banks, promote financial inclusion by encouraging more
small banks, and mitigate the monopoly position of state-owned banks in relation to
private banks.
It is possible that a few of these recommendations will see the light of day
beginning next month. The Reserve Bank of India, under the leadership of Raghuram
Rajan, announced in November that it will issue new banking licenses for the first time in
ten years as part of an effort to increase the competition and performance in the sector. In
the new proposals by Mr. Rajan, foreign banks will be able to expand through wholly
owned subsidiaries in India and compete directly with domestic private banks. In addition,
all banks would be required to allocate less credit to the priority sector, and for the first
time in decades, industrial houses like Reliance Group will also be allowed to apply for
banking licenses. Mr. Rajan’s goals are to find an expanded role for private and foreign
banks, and to phase out the influence of state-backed lenders. This new RBI strategy
should promote greater competition and gradual liberalization within the sector,
consistent with the findings of this paper.
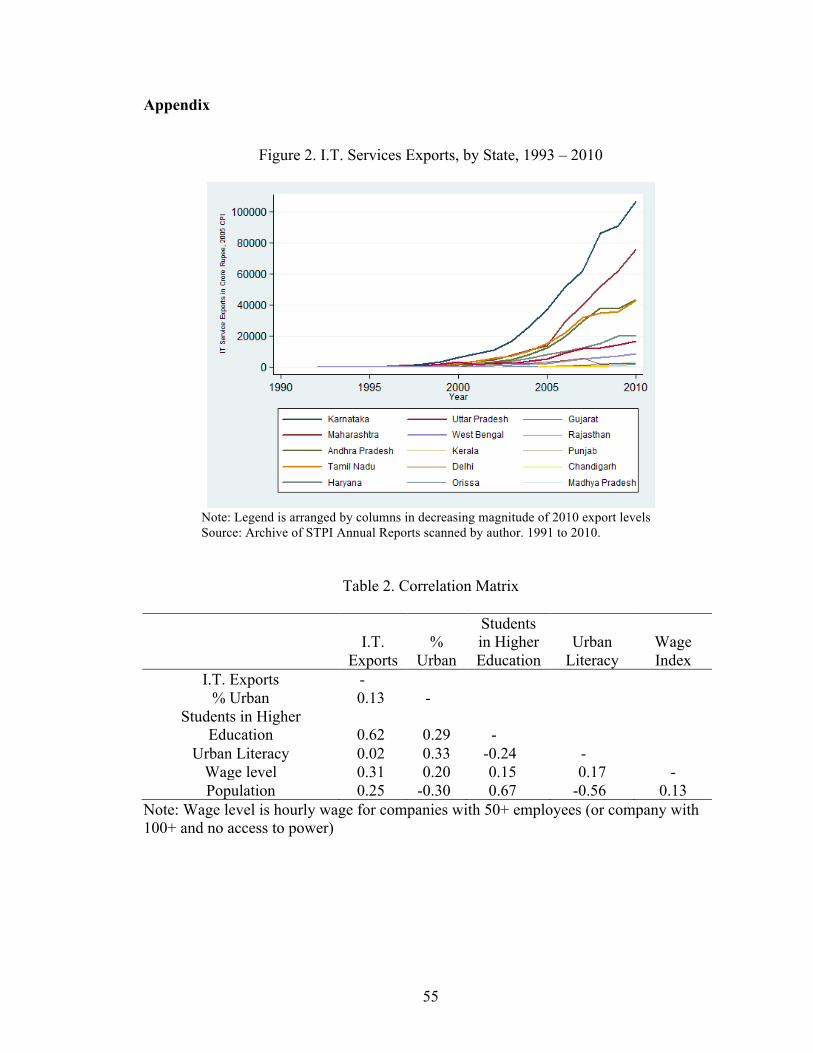
55
Appendix
Figure 2. I.T. Services Exports, by State, 1993 – 2010
Note: Legend is arranged by columns in decreasing magnitude of 2010 export levels Source: Archive of STPI Annual Reports scanned by author. 1991 to 2010.
Table 2. Correlation Matrix
I.T. Exports
% Urban
Students in Higher Education
Urban Literacy
Wage Index
I.T. Exports - % Urban 0.13 -
Students in Higher Education 0.62 0.29 -
Urban Literacy 0.02 0.33 -0.24 - Wage level 0.31 0.20 0.15 0.17 - Population 0.25 -0.30 0.67 -0.56 0.13
Note: Wage level is hourly wage for companies with 50+ employees (or company with 100+ and no access to power)
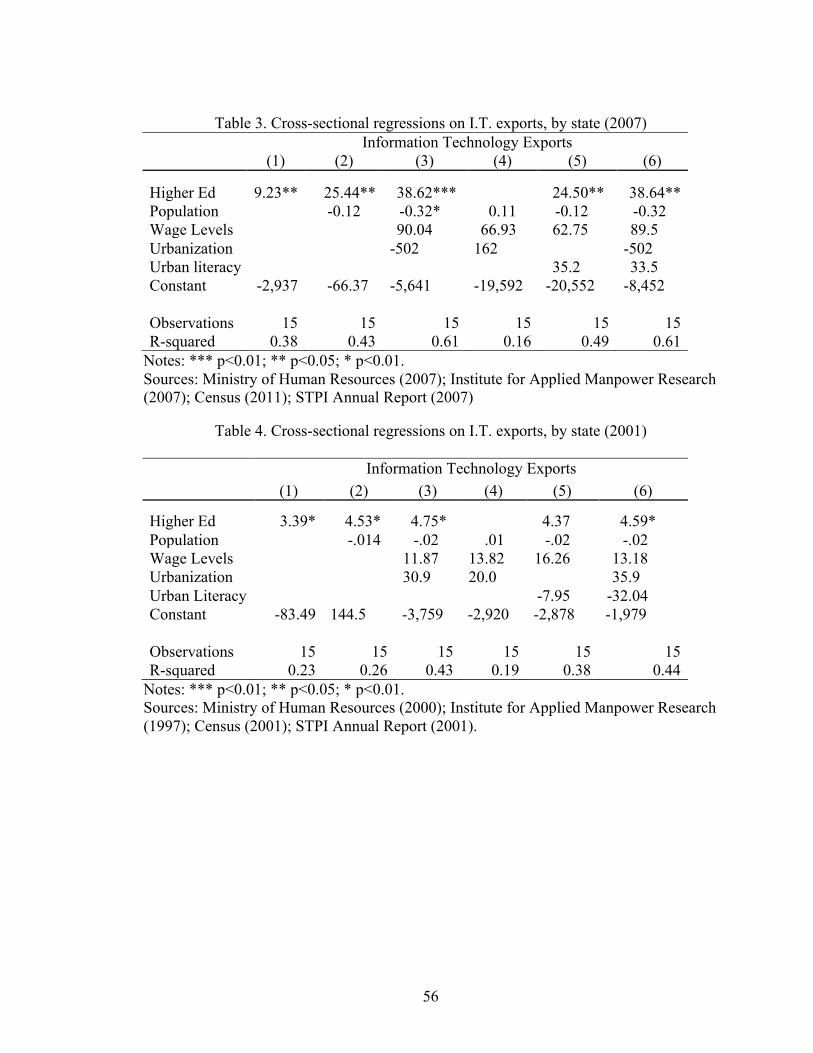
56
Table 3. Cross-sectional regressions on I.T. exports, by state (2007)
Information Technology Exports (1) (2) (3) (4) (5) (6)
Higher Ed 9.23** 25.44** 38.62*** 24.50** 38.64** Population -0.12 -0.32* 0.11 -0.12 -0.32 Wage Levels
90.04 66.93 62.75 89.5
Urbanization
-502 162
-502 Urban literacy
35.2 33.5
Constant -2,937 -66.37 -5,641 -19,592 -20,552 -8,452 Observations 15 15 15 15 15 15 R-squared 0.38 0.43 0.61 0.16 0.49 0.61
Notes: *** p<0.01; ** p<0.05; * p<0.01. Sources: Ministry of Human Resources (2007); Institute for Applied Manpower Research (2007); Census (2011); STPI Annual Report (2007)
Table 4. Cross-sectional regressions on I.T. exports, by state (2001)
Information Technology Exports (1) (2) (3) (4) (5) (6)
Higher Ed 3.39* 4.53* 4.75* 4.37 4.59* Population -.014 -.02 .01 -.02 -.02 Wage Levels 11.87 13.82 16.26 13.18 Urbanization 30.9 20.0 35.9 Urban Literacy -7.95 -32.04 Constant -83.49 144.5 -3,759 -2,920 -2,878 -1,979 Observations 15 15 15 15 15 15 R-squared 0.23 0.26 0.43 0.19 0.38 0.44
Notes: *** p<0.01; ** p<0.05; * p<0.01. Sources: Ministry of Human Resources (2000); Institute for Applied Manpower Research (1997); Census (2001); STPI Annual Report (2001).
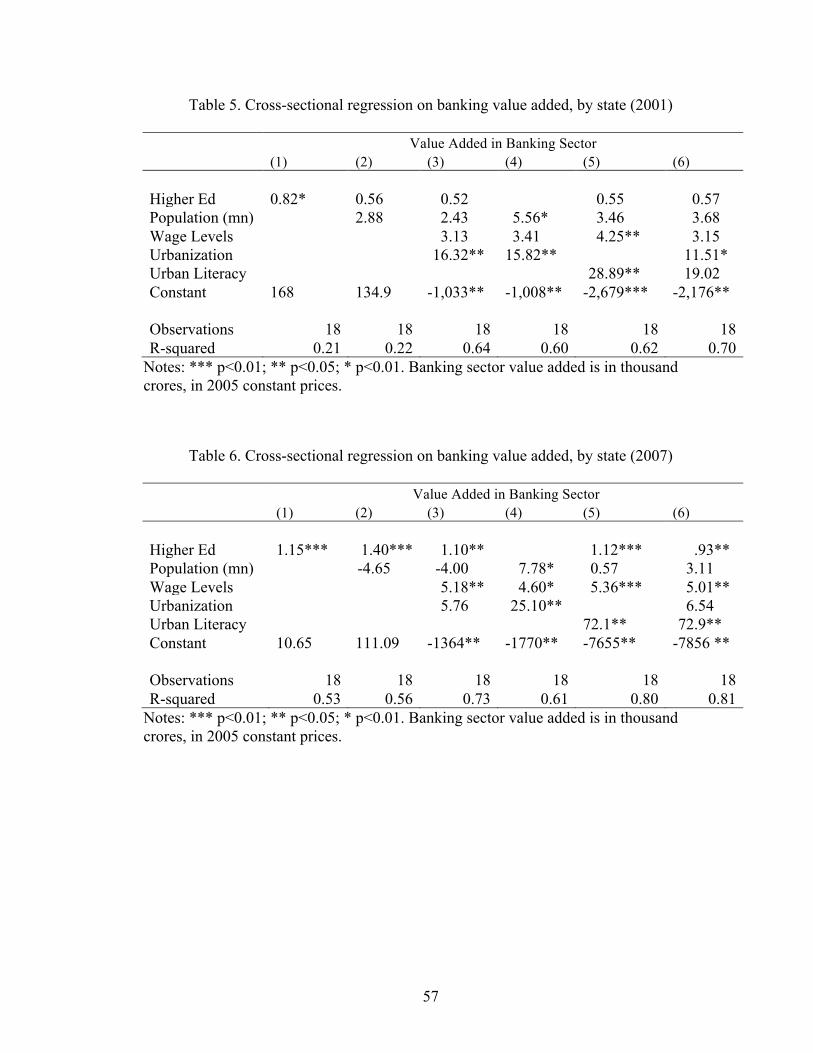
57
Table 5. Cross-sectional regression on banking value added, by state (2001)
Value Added in Banking Sector
(1) (2) (3) (4) (5) (6)
Higher Ed 0.82* 0.56 0.52 0.55 0.57 Population (mn) 2.88 2.43 5.56* 3.46 3.68 Wage Levels 3.13 3.41 4.25** 3.15 Urbanization 16.32** 15.82** 11.51* Urban Literacy 28.89** 19.02 Constant 168 134.9 -1,033** -1,008** -2,679*** -2,176** Observations 18 18 18 18 18 18 R-squared 0.21 0.22 0.64 0.60 0.62 0.70
Notes: *** p<0.01; ** p<0.05; * p<0.01. Banking sector value added is in thousand crores, in 2005 constant prices.
Table 6. Cross-sectional regression on banking value added, by state (2007)
Value Added in Banking Sector
(1) (2) (3) (4) (5) (6)
Higher Ed 1.15*** 1.40*** 1.10** 1.12*** .93** Population (mn) -4.65 -4.00 7.78* 0.57 3.11 Wage Levels 5.18** 4.60* 5.36*** 5.01** Urbanization 5.76 25.10** 6.54 Urban Literacy 72.1** 72.9** Constant 10.65 111.09 -1364** -1770** -7655** -7856 ** Observations 18 18 18 18 18 18 R-squared 0.53 0.56 0.73 0.61 0.80 0.81
Notes: *** p<0.01; ** p<0.05; * p<0.01. Banking sector value added is in thousand crores, in 2005 constant prices.

58
Figure 5. Predicted vs. actual values, Banking Sector Value Added in 2007
Note: data fitted to values from Table 5, Regression 6
Figure 6. Predicted vs. actual values, Banking Sector Value Added, in 2001
Note: data fitted to values from Table 6, Regression 6
AP
ASBH
DEL
GUJ
HR
KNTKRL
MGL
MHR
MP
ORS
PNJRJS
TN
TP
UP
WB
010
0020
0030
0040
00Pr
edict
ed V
alue
s
0 1000 2000 3000 4000Actual Values
Fitted values 45-degree line
APASBH
DEL
GUJHR
KNTKRL
MGL
MHR
MP
ORS PNJRJS
TN
TP
UPWB
-100
00
1000
2000
3000
Pred
icted
Val
ues
0 500 1000 1500 2000 2500Actual Values
Fitted values 45-degree line
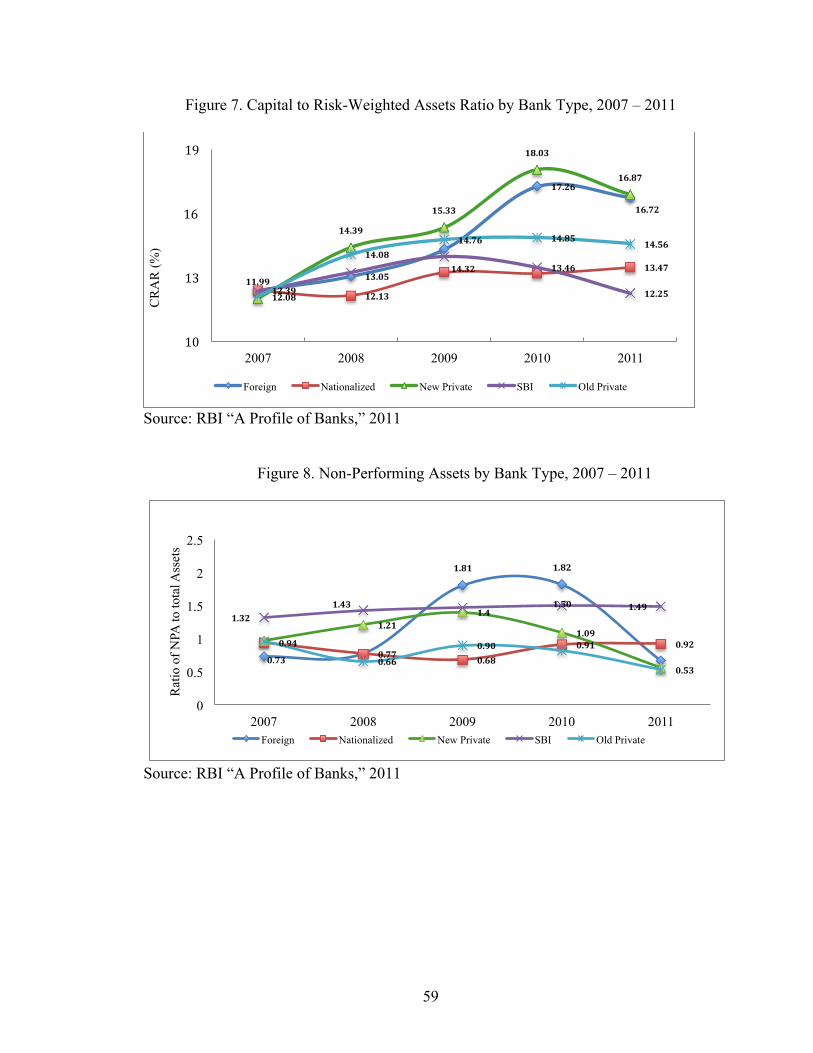
59
Figure 7. Capital to Risk-Weighted Assets Ratio by Bank Type, 2007 – 2011
Source: RBI “A Profile of Banks,” 2011
Figure 8. Non-Performing Assets by Bank Type, 2007 – 2011
Source: RBI “A Profile of Banks,” 2011
12.39 13.05
14.32
17.26
16.72
12.13
13.47 11.99
14.39
15.33
18.03
16.87
13.46
12.25 12.08
14.08 14.76 14.85 14.56
10
13
16
19
2007 2008 2009 2010 2011
CR
AR
(%)
Foreign Nationalized New Private SBI Old Private
0.73
1.81 1.82
0.94 0.77 0.68
0.91 0.92
1.21 1.4
1.09 1.32
1.43 1.50 1.49
0.66
0.90
0.53
0
0.5
1
1.5
2
2.5
2007 2008 2009 2010 2011
Rat
io o
f NPA
to to
tal A
sset
s
Foreign Nationalized New Private SBI Old Private

60
Figure 9. Return on Assets, Foreign and Domestic Banks, 2007 – 2011
Source: RBI “A Profile of Banks,” 2011
Figure 10. Return on Assets, Domestic Banks, 2007 – 2011
Source: RBI “A Profile of Banks,” 2011
2.06
2.45
2.11
1.68 1.86
0.96 1.04 1.09 1.10 1.09
0
0.5
1
1.5
2
2.5
3
2007 2008 2009 2010 2011
% R
etur
ns o
n A
sset
s
Foreign Domestic
0.95 1.00 1.02
1.16
1.47
1.39
0.95 0.95 0.99 0.99
0.93
1.20 1.25
0.96 1.00
0.8
0.9
1
1.1
1.2
1.3
1.4
1.5
2007 2008 2009 2010 2011
% R
etur
n on
Ass
ets
Nationalized New Private SBI Old Private

61
Figure 11. Cost of Funds (Return on Deposits) by Bank Type, 2007 – 2011
Source: RBI “A Profile of Banks,” 2011
4.03 4.33 4.46
2.83 3.11
6.04
4.42
4.27 4.75
5.90 5.94
4.80
2
3
4
5
6
2007 2008 2009 2010 2011
Cos
t of F
unds
Foreign New Private SBI Nationalized
62
References
Ahsan, A., 2006, Labor regulations in India: Impact and policy reform options, SASPR, World Bank, India, Presentation to Human Development Network, 9 November.
Amsden, A., 1989, Asia’s Next Giant: South Korea and Late Industrialization, New York, Oxford University Press.
Angandi, V. B., 1983, “Productivity and Profitability of Banks in India,” Economic and Political Weekly, 18 (48), pp.160–170.
Au, C. and J. Henderson, 2006, “Are Chinese cities too small?” Review of Economic Studies, 73(3), pp. 549–576.
Bajpai, N. and J. Sachs, 1999, “Fiscal Policy in India’s Economic Reforms,” in India in the Era of Economic Reforms, ed., J. Sachs, A. Varshney and N. Bajpai, New York, Oxford University Press.
Balakrishnan, P. and M. Parameswaran, 2007, “Understanding Economic Growth in India: A Prerequisite,” Economic and Political Weekly, 42(28), pp. 2915–22.
Banerjee, A., S. Cole, and E. Duflo, 2004, “Banking Reform in India,” India Policy Forum Journal, Brookings Institution Global Economy and Development Program Policy Paper, 1(1), pp. 277–332.
Bansal, A., 2013, Deputy Director, Software Technology Parks of India, personal
interview, 24 Jul.
Basu, K., 2008, “The Enigma of India’s Arrival: A Review of Arvind Virmani’s r0o‘Propelling India: From Socialist Stagnation to Global Power,” Journal of Economic Literature, 46(2), pp. 396–406.
Basu, K. and A. Maertens, 2007, “The Pattern and Causes of Economic Growth in India,” Oxford Review of Economic Policy, 23(2), pp. 143–67.
Basu, S., 1965, Theory and Practice of Development Banking: A Study in the Asian Context, Bombay, Asia Publication House.
Bhagwati, J. and A. Panagariya, 2013, Why Growth Matters: How Economic Growth in
India Reduced Poverty and the Lessons for Other Developing Countries, New York, Council on Foreign Relations.
Bosworth, B. and S. Collins, 2003, “The Empirics of Growth: An Update,” Washington,
DC, Brookings Institution. Claessens, S. and H. Huizinga, 2000, “How does foreign entry affect the domestic
banking market?” in Claessens and Jansen, eds., The Internationalization of
63
Financial Services: Issues and Lessons for Developing Countries, Dordrecht, Holland, Kluwer Law International.
Combes, P. et al. (2007), “Estimating agglomeration effects: History and geology,”
University of Toronto.
Das, D., 2007, “Trade Barriers in Manufacturing,” in Oxford Companion to Economics in India, ed. K. Basu, New York, Oxford University Press.
Das, P. K., 2013, Director, STPI Bangalore, personal interview, 13 Aug.
Deichmann, U., K. Kaiser, S. Lall, and Z. Shalizi, 2005, “Agglomeration, transport, and regional development in Indonesia,” World Bank.
Delgado, M., M. Porter, S. Stern, 2011, “Clusters, Convergence, and Economic Performance,” unpublished, <http://www.isc.hbs.edu/econ-clusters.htm>, accessed September 2013.
Duraton, G., 2008, “Viewpoint: from cities to productivity and growth in developing countries,” Canadian Journal of Economics, 41(3), pp. 689 – 736.
Economist, The, 1997, “A Connected World: A Survey of Telecommunications,” 13 September.
Electronics Corporation of India, Limited. History. <http://www.ecil.co.in/history.html>.
Evans, P., 1995, Embedded Autonomy: States and Industrial Transformation, Princeton University Press.
Gerschenkron, A., 1962, Economic Backwardness in Historical Perspective, Cambridge, Massachusetts, Belknap.
Glaeser, E. and W. Kerr, 2009, “Local Industrial Conditions and Entrepreneurship: How Much of the Spatial Distribution Can We Explain?” Journal of Economics and Management Strategy, 18(3), pp. 623–663.
Hall, R. and C. Jones, 1999, “Why Do Some Countries Produce So Much More Output per Worker Than Others?,” Quarterly Journal of Economics, February.
Hanson, J., 2004, “The Nature and Scope of State Banking,” 6th Annual Financial Markets and Development Conference, Washington DC, The World Bank.
Heitzman, J., 2004, Network City: Planning the Information Society in Bangalore, New
York, Oxford University Press. Henderson, J. V., 2003, “Marshall’s Scale Economies,” Journal of Urban Economics, 53,
pp. 1–28.
————,1988, “Urban Development: Theory, Fact and Illusion,” Oxford, Oxford University Press.
64
Henderson, J. V., T. Lee, and Y. Lee, 2001, “Scale externalities in Korea,” Journal of Urban Economics, 49(3), pp. 479–504.
Indiastat, Statistical Information, < http://www.indiastat.com/default.aspx>, accessed September 2013.
International Monetary Fund (IMF), 2001, “India: recent economic developments and selected issues,” IMF Country Report No. 01/181.
Jorgenson, D. and E. Yip, “What happened to productivity growth?” in New
Developments in Productivity Analysis, ed. C. Hulten, Chicago, University of Chicago Press.
Khanna, A., 2013, Chief Economist & Director General, NASSCOM, personal interview,
26 Jul. Klenow, P. and A. Rodriguez-Clare, 1997, “Economic Growth: A Review Essay,”
Journal of Monetary Economics, 40(3), pp. 597–617. Kotwal, A., B. Ramaswami and W. Wadhwa, 2010, Economic Liberalization and
Indian Economic Growth: What’s the Evidence? New Delhi, Indian Statistical Institute.
Krugman, P., M. Obstfeld and M. Melitz, 2012, International Economics: Theory and Policy, Boston, Addison-Wesley.
Lall, S., J. Koo, and S. Chakravorty, 2003, “Diversity matters: The economic geography of industry location in India,” World Bank.
Lall, S., Z. Shalizi, and U. Deichmann, 2004, “Agglomeration economies and productivity in Indian industry,” Journal of Development Economics 73(3), pp. 643–673.
Manoj, P. K., 2010, “Determinants of Profitability and Efficiency of Old Private Sector Banks in India with Focus on Banks in Kerala State,” International Research Journal of Finance and Economics, 47.
————,. “Financial Soundness of Old Private Sector Banks in India,” American
Journal of Scientific Research, 11, pp. 132–149. Mukherje, P., 2010, “Union Budget Speech”
<http://www.thehindu.com/multimedia/archive/00034/Union_Budget_Speech__34366a.pdf>, accessed Nov 2011.
Naughton, B., 2006, “The Chinese Economy,” Cambridge, MIT Press. Panagariya, A., 2008, India: The Emerging Giant, New York, Oxford University Press.
65
Parthasarathy, B., 2013, Professor, Indian Institute of Information Technology, personal interview, 17 Aug.
————, 2010, “The computer software industry as a vehicle of late industrialization: lessons from the Indian case,” Journal of the Asia Pacific Economy, 15(3), pp. 247–270.
————, 2004, “India’s Silicon Valley or Silicon Valley’s India? Socially Embedding the computer Software Industry in Bangalore,” International Journal of Urban and Regional Research, 28(3), pp. 664–685.
————, 2000, “Globalization and Agglomeration in the Newly Industrializing Countries: The State and the Information Technology Industry in Bangalore, India,” University of California, Berkley.
Parvatheesam, K., 2013, Chief Risk Officer, Infosys, personal interview, 23 Aug.
Penfold, C., 2005, “Off-shored service workers: labour law and practice in India,” The Economic and Labour Relations Review, 19(2), pp. 91–106.
Rai, O., 2013, Director General, Software Technology Parks of India, personal interview, 24 Jul.
Ramasastri, A. and A. Samuel, 2006, “Banking Sector Developments in India, 1980 – 2005: What the Annual Accounts Speak?” Reserve Bank of India Occasional Papers, 27(1,2).
Reserve Bank of India, 2011, “Entry of New Banks in the Private Sector: Discussion Paper,” < http://www.rbi.org.in/ >, accessed September 2013.
————, 2011, “A Profile of Banks,” < http://www.rbi.org.in/ >, accessed September
2013. Rodrik, D., 1994, “Getting interventions right: how South Korea and Taiwan grew rich,”
NBER, Working Paper 4969.
Rodrik, D. and A. Subramanian, 2004, “From ‘Hindu Growth’ to Productivity Surge: The Mystery of the Indian Growth Transition,” International Monetary Fund Working Paper.
Rosenthal, S. and W. Strange, 2004, “Evidence on the nature and sources of agglomeration economies,” in V. Henderson and J. Thisse, eds., Handbook of Regional and Urban Economics, Volume 4, Amsterdam, North-Holland, pp. 2119–2171.
Sen, A. and J. Drèze, 2013, An Uncertain Glory: India and its Contradictions, New Jersey, Princeton University Press.
Sen, K., 2007, “Why Did the Elephant Start to Trot? India’s Growth Acceleration Re-examined,” Economic and Political Weekly, 42(43), pp. 37-47.
66
Shafaeddin, S. M., 2005, “Trade Liberalization and Economic Reform in Developing Countries: Structural Change or De-Industrialization?” United Nations Conference on Trade and Development, Discussion Paper 179.
Shirai, S., 2001, “Assessment of India’s Banking Sector Reforms From The Perspective of The Governance of the Banking System,” ESCAP-ADB Joint Workshop on Mobilizing Domestic Finance for Development, Bangkok, 22–23 November.
Software Technology Parks of India, 1991 – 2012, Annual Reports, New Delhi, India,
accessed Jul 2013. Stiglitz, J. E., 2005, “The Post Washington Consensus,” The Initiative for Policy
Dialogue. Subramanian, C. R., 1992, India and the computer: a study of planned development, New
Delhi, Oxford University Press.
Tandon, P., 1989, Banking Century: A Short History of Banking in India, New Delhi, Viking Press.
Wade, R., 1982, Governing the Market: Economic Theory and the Role of Government in
East Asian Industrialization, Princeton, Princeton University Press.
Wallack, J., 2003, “Structural Breaks in Indian Macroeconomic Data.” Economic and Political Weekly, 38(41), pp. 4312–15.
World Bank Enterprise Surveys, <http://www.enterprisesurveys.org/>, accessed April 2013.