Embed Size (px)
Citation preview
This article was downloaded by: [The University Of Melbourne Libraries]On: 02 April 2014, At: 20:26Publisher: RoutledgeInforma Ltd Registered in England and Wales Registered Number: 1072954 Registered office: MortimerHouse, 37-41 Mortimer Street, London W1T 3JH, UK
Bulletin of Indonesian Economic StudiesPublication details, including instructions for authors and subscription information:http://www.tandfonline.com/loi/cbie20
The political economy of local governance: findingsfrom an Indonesian field studyChristian von Luebke aa Stanford University ,Published online: 24 Jul 2009.
To cite this article: Christian von Luebke (2009) The political economy of local governance: findings from an Indonesianfield study, Bulletin of Indonesian Economic Studies, 45:2, 201-230
To link to this article: http://dx.doi.org/10.1080/00074910903040310
PLEASE SCROLL DOWN FOR ARTICLE
Taylor & Francis makes every effort to ensure the accuracy of all the information (the “Content”) containedin the publications on our platform. However, Taylor & Francis, our agents, and our licensors make norepresentations or warranties whatsoever as to the accuracy, completeness, or suitability for any purpose ofthe Content. Any opinions and views expressed in this publication are the opinions and views of the authors,and are not the views of or endorsed by Taylor & Francis. The accuracy of the Content should not be reliedupon and should be independently verified with primary sources of information. Taylor and Francis shallnot be liable for any losses, actions, claims, proceedings, demands, costs, expenses, damages, and otherliabilities whatsoever or howsoever caused arising directly or indirectly in connection with, in relation to orarising out of the use of the Content.
This article may be used for research, teaching, and private study purposes. Any substantial or systematicreproduction, redistribution, reselling, loan, sub-licensing, systematic supply, or distribution in anyform to anyone is expressly forbidden. Terms & Conditions of access and use can be found at http://www.tandfonline.com/page/terms-and-conditions
Bulletin of Indonesian Economic Studies, Vol. 45, No. 2, 2009: 201–30
ISSN 0007-4918 print/ISSN 1472-7234 online/09/020201-30 © 2009 Indonesia Project ANUDOI: 10.1080/00074910903040310
THE POLITICAL ECONOMY OF LOCAL GOVERNANCE:FINDINGS FROM AN INDONESIAN FIELD STUDY
Christian von Luebke*
Stanford University
Why do some local governments perform well, while others perform badly? The rapid shift from centralised–authoritarian to decentralised–democratic rule in Indo-nesia has been accompanied by a large variation in sub-national government poli-cies across districts. Based on eight district case studies comprising 1,000 business surveys and 120 in-depth interviews, this paper argues that demand-side pres-sures from local fi rms, associations and district councils are less signifi cant than supply-side pressures from local government leaders in explaining variations in taxation, licensing and corruption practices. In Indonesia’s early transition to demo-cratic decentralisation, societal pressures have been constrained by collective action problems and perverse political incentives. Local government leaders, on the other hand, have strong powers and new incentives for policy reform. In response to the good governance debate, this study’s fi ndings suggest that government leadership is an important, often under-estimated, policy determinant that can compensate for (or aggravate) weak societal checks in transitioning economies.
INTRODUCTION What determines sub-national policy outcomes? Why do some local govern-ments provide effi cient and responsive services, while others exhibit high levels of administrative red tape and corruption? These questions have become increas-ingly important in view of Indonesia’s pronounced shift from authoritarian–centralised to democratic–decentralised governance. Since the collapse of Soe harto’s New Order regime, Indonesia has become one of the most stable and pluralistic democracies in Southeast Asia. Between 1999 and 2009, Indonesian citizens elected roughly 1,600 national representatives, 30,000 local council mem-bers and 800 governors, mayors and district heads. In addition, since the imple-mentation of decentralisation in 2001, local tax and service responsibilities have been fully devolved to more than 450 district governments. These reforms have
* The author wishes to thank Anne Booth, Taco Bottema, Alasdair Bowie, Donald Em-merson, Merilee Grindle, Hal Hill, Yusaku Horiuchi, Tim Lankester, Andrew MacIntyre, Chris Manning, Neil McCulloch, Ross McLeod, Agung Pambudhi, Arianto Patunru, Budy Resosudarmo, Henk Schulte Nordholt, John Sidel, Hadi Soesastro, Thee Kian Wie, Peter Timmer and three anonymous referees for constructive comments; and Juan Fransiska, Martin Johari, Hari Pallapa, and Tanding Sari for their diligent fi eld assistance. The author bears sole responsibility for any errors of omission and commission.
Dow
nloa
ded
by [
The
Uni
vers
ity O
f M
elbo
urne
Lib
rari
es]
at 2
0:26
02
Apr
il 20
14
202 Christian von Luebke
transformed Indonesia into one of the largest and most decentralised democracies in the world.
Unsurprisingly, Indonesia’s rapid and far-reaching regime change has given rise to signifi cant policy differences across its regions. While some districts have introduced more effi cient and responsive service environments, many have burdened the economy with new trade-distorting taxes, ineffi cient procedures and administrative corruption. This pronounced variation in the quality of gov-ernance suggests that a high level of policy uncertainty continues to constrain domestic and international investment. It also provides an opportunity to study the determinants of governance performance more broadly, by identifying what has motivated some districts to perform better than others. Sub-national policy differences offer a window into the political economy of reform and a valuable basis for testing contending good-governance arguments.
This article explores two explanations of good governance: demand-side pres-sures coming from local citizens, in particular small and medium fi rms (henceforth ‘societal pressure’) and supply-side pressures exerted by district heads (henceforth ‘government leadership’). The societal pressure argument features strongly in recent good governance and corruption literatures (Boix, Adsera and Payne 2003; Hellman 1998; Kaufmann, Mehrez and Gurgur 2002; Klitgaard 1998). Combining notions of ‘citizen participation’ (Chambers 1995), ‘voice’ (Hirschman 1970) and ‘social capital’ (Putnam 1993), this literature supports the over-arching proposi-tion that decentralisation and local democracy empower civil societies to push for better government performance. Government leadership, on the other hand, arises as a key determinant in recent policy reform literatures: a common fi nd-ing in comparative policy analyses in Asia (Mahbubani 2007; Rodrik 1996), Latin America (Grindle 2004; 2007) and Africa (Gray and McPherson 2001) is that public leaders shape policy outcomes by initiating reforms and supervising bureaucratic practices.
The empirical results of this study suggest that government leadership is a more consistent explanation than societal pressure for local policy variations. The fi nd-ings from eight controlled case comparisons, comprising 1,000 business surveys and 120 interviews, demonstrate that demand-side pressures in rural Indonesia continue to be weakly developed. In Indonesia’s early transition to democracy, reform initiatives of local fi rms, associations and district councils are often com-promised by collective action problems and perverse political incentives. The quality of government leadership, on the other hand, emerges as a salient force driving the quality of policy outcomes. The case fi ndings indicate that district heads with strong managerial skills and long-term career aspirations have suc-cessfully used their offi cial powers to initiate broad-based reform and supervise bureaucratic performance.
The next section of this article provides a country-wide snapshot of local gov-ernance variation fi ve years after the introduction of democratic decentralisation. The third section explains the study’s methodology: the use of sub-national vari-ation for controlled case comparisons. The fourth section examines the effect of government leadership and societal pressure by assessing local tax, service and corruption practices across eight districts. The fi fth section places the empirical fi ndings in a political economy perspective. The fi nal section draws implications for scholarship and policy.
Dow
nloa
ded
by [
The
Uni
vers
ity O
f M
elbo
urne
Lib
rari
es]
at 2
0:26
02
Apr
il 20
14
The political economy of local governance: fi ndings from an Indonesian fi eld study 203
VARIATIONS IN DISTRICT PERFORMANCE Indonesia’s decentralisation experience demonstrates that local governments have responded in diverse ways to the uniform devolution of tax and service authority. Existing surveys1 indicate that the extent to which district bureaucra-cies have constrained local economies with imprudent taxes, ineffi cient proce-dures and administrative corruption varies markedly across the country.
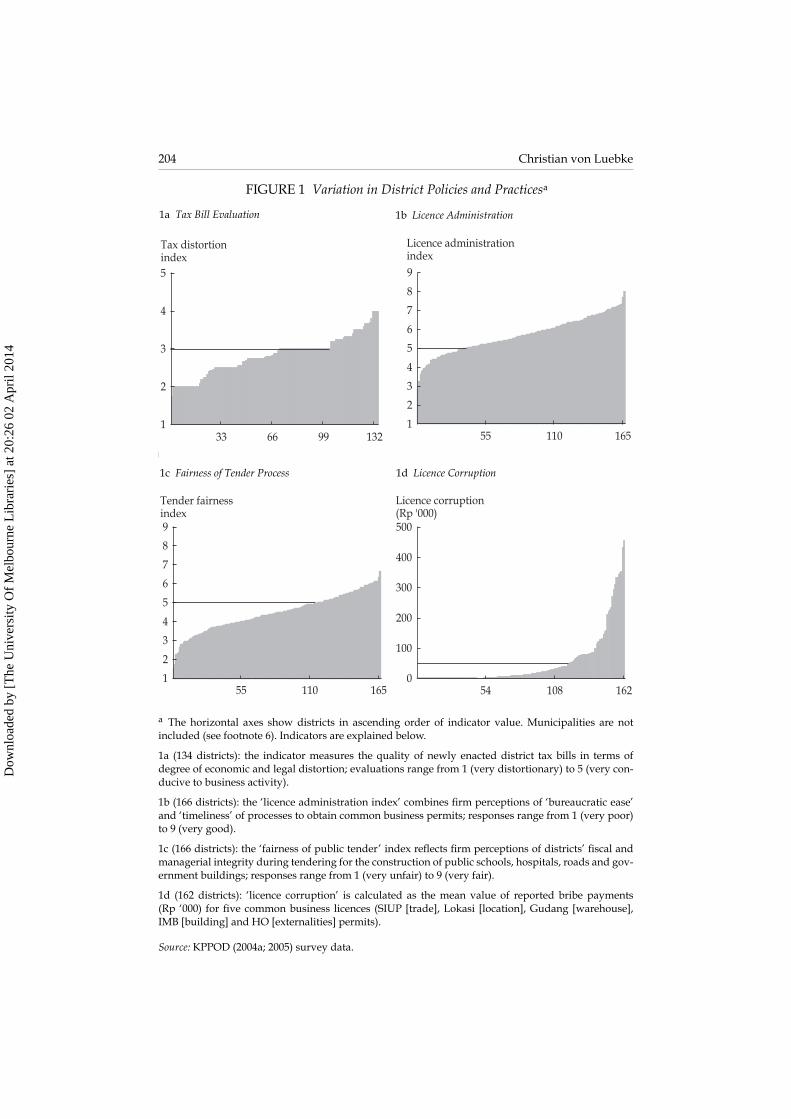
One casualty of the rapid decentralisation process is the design of the local tax system. While the principal taxes (income, value-added and property) have remained with the centre, districts have gained control over existing local taxes (such as hotel, small-scale mining, advertising billboard and road lighting taxes) and the discretion to create new levies.2 Unfortunately, with rising local expendi-tures on the one hand and weakly defi ned national tax laws on the other,3 many districts have enacted distortionary taxes.4 But, as illustrated in fi gure 1a, these regulatory problems are far from uniform. A tax review by Indonesia’s Regional Autonomy Watch (KPPOD)5 indicates that just over one-half of the 134 districts assessed have experienced economic and/or legal distortions (scores below 3); one-quarter have seen moderate tax conditions (scores of 3); and almost one-quarter have enjoyed tax environments conducive to business activity (scores
1 Problems of local tax, licence and business service practices are widely discussed in ex-isting business climate studies; see, for example, Ray (2003); LPEM–FEUI (2002, 2007); and World Bank (2006).
2 Although district own-source revenues (pendapatan asli daerah) have increased gradually since decentralisation, they still make up less than 10% of total local revenues. The lion’s share of district expenditures (93% in 2003) has been covered by transfers from the central government (Lewis and Suharnoko 2009: 228; DRSP 2006: 9).
3 Law 34/2000 on Regional Taxes and Levies (article 2.4) states that new taxes are not to ‘obstruct economic development’, but does not provide precise guidelines. The revision of Law 34 to include a ‘positive list’ of non-distortionary levies is being debated in the na-tional parliament at the time of writing. Another problem, as Ray (2003: 23) points out, is that the monitoring burden lies entirely with the central government. National ministries must identify district shortcomings (‘innocent until proven guilty’), rather than local gov-ernments being required to seek national approvals (‘guilty until proven innocent’). As a result, a large proportion of local regulations have not been reviewed (Lewis 2003; World Bank 2003: 29).
4 The National Chamber of Commerce and Industry (Kadin) estimates that over 70% of the new local regulations hamper economic development, because they either overlap with existing national taxes or constrain regional trade fl ows (Tagukawi 2003: 4). Concerned with economic distortions, the Ministry of Finance cancelled nearly one-third of district tax regulations it reviewed in 2001 (Lewis 2003: 187), and a total of 450 local bills reviewed between 2001 and 2005 (Simanjuntak 2005: 2).
5 KPPOD is a private research institute created in 2001 as a joint project of the National Chamber of Commerce and Industry (Kadin), academic institutions (University of Indo-nesia, Centre for Strategic and International Studies and Prasetiya Mulya Business School) and national media companies (Jakarta Post, Bisnis Indonesia and Suara Pembaruan). Since 2001, KPPOD has increasingly stimulated policy debates by publishing annual rankings of district business climates.
Dow
nloa
ded
by [
The
Uni
vers
ity O
f M
elbo
urne
Lib
rari
es]
at 2
0:26
02
Apr
il 20
14
204 Christian von Luebke
FIGURE 1 Variation in District Policies and Practicesa
Tax distortionindex
33 66 99 1321
2
3
4
5
a The horizontal axes show districts in ascending order of indicator value. Municipalities are not included (see footnote 6). Indicators are explained below.
1a (134 districts): the indicator measures the quality of newly enacted district tax bills in terms of degree of economic and legal distortion; evaluations range from 1 (very distortionary) to 5 (very con-ducive to business activity).
1b (166 districts): the ‘licence administration index’ combines fi rm perceptions of ‘bureaucratic ease’ and ‘timeliness’ of processes to obtain common business permits; responses range from 1 (very poor) to 9 (very good).
1c (166 districts): the ‘fairness of public tender’ index refl ects fi rm perceptions of districts’ fi scal and managerial integrity during tendering for the construction of public schools, hospitals, roads and gov-ernment buildings; responses range from 1 (very unfair) to 9 (very fair).
1d (162 districts): ‘licence corruption’ is calculated as the mean value of reported bribe payments (Rp ‘000) for fi ve common business licences (SIUP [trade], Lokasi [location], Gudang [warehouse], IMB [building] and HO [externalities] permits).
Source: KPPOD (2004a; 2005) survey data.
Licence administrationindex
55 110 1651
2
3
4
5
6
7
8
9
55 110 1651
2
3
4
5
6
7
8
9
Tender fairnessindex
54 108 1620
100
200
300
400
500
Licence corruption(Rp '000)
1a Tax Bill Evaluation 1b Licence Administration
1c Fairness of Tender Process 1d Licence Corruption
Dow
nloa
ded
by [
The
Uni
vers
ity O
f M
elbo
urne
Lib
rari
es]
at 2
0:26
02
Apr
il 20
14
The political economy of local governance: fi ndings from an Indonesian fi eld study 205
above 3) (KPPOD 2004a).6 Thus, the main message arising from these data is that regulatory conditions remain critical, but also differ signifi cantly across districts.
A similarly diverse picture arises in the case of administrative procedures. At this early stage of transition, many local bureaucracies (dinas) have attained monopoly-like positions – no longer under central supervision but not yet under fully-fl edged democratic control (Azis 2003: 3). In its Doing Business 2009 assessment, the World Bank (2008) ranks Indonesia’s administrative procedures for starting a business as among the most time- and cost-intensive in the world (129th among 181 countries). Registering a limited liability company in Indonesia takes more than three months – twice as long as in most other ASEAN countries. In obtaining the necessary per-mits fi rms face a myriad of desks and paperwork at multiple technical agencies.
There is considerable variation in regulatory performance across districts. Rus-tiani (2003: 80), for example, fi nds that the costs of obtaining small-scale indus-try permits (tanda daftar industri, TDI) can range from Rp 5,000 (Yogyakarta) to Rp 477,000 (Bandung), and processing times from two days (Yogyakarta) to 20 days (Medan). The KPPOD (2005) business survey confi rms these pronounced dif-ferences. Information obtained from 8,700 private sector respondents in 224 dis-tricts and municipalities indicates that the quality of local licence administration is far from homogeneous. The licence administration indicator in fi gure 1b (for 166 districts), which comprises fi rm perceptions of bureaucratic ease and timeliness of processing, indicates a distinct spread between high and low ranking districts.
Another illustrative indicator is the extent of administrative corruption. Cor-rupt government practices are not a new phenomenon in Indonesia. Studies show that administrative extortion (often referred to as ‘cigarette’, ‘speed’ or ‘grease’ money) was a persistent feature of the Soeharto era, and in the course of decen-tralisation has merely been dispersed across local governments (Ray 2003: 13; Schulte Nordholt 2005). On the basis of country-wide business surveys, KPPOD concludes that up to 80% of local businesses continue to pay informal fees when dealing with district bureaucracies (KPPOD 2004b: 70). In the fi rst years of decen-tralisation, these corrupt payments could raise licence costs by 60% and overall business expenses by 10% (LPEM–FEUI 2002: 5–7).
But below the aggregate level we fi nd, once again, distinct sub-national dif-ferences. These are particularly apparent in the way local governments admin-ister public infrastructure construction and business licences. Despite uniform laws on transparent tender procedures (Keppres [Presidential Decree] 80/2003), the fairness with which districts allocate public contracts varies considerably. As illustrated in fi gure 1c, the KPPOD (2005) business survey found that just over two-thirds of the districts were characterised by unfair tender procedures (scores between 1 and 5), whereas just under one-third displayed relatively transpar-ent and impartial practices (scores above 5). Similar variations emerge in terms of licence corruption. As depicted in fi gure 1d, survey results suggest that just under one-third of districts impose no unoffi cial licence fees; 44% demand illicit payments of up to Rp 50,000; and 27% infl ict illegal charges ranging between Rp 50,000 and Rp 450,000.
6 For comparability with our own case studies, which are of districts (kabupaten) rather than municipalities (kota), fi gures 1 and 2 present only the district data from the KPPOD studies, and exclude the municipality data.
Dow
nloa
ded
by [
The
Uni
vers
ity O
f M
elbo
urne
Lib
rari
es]
at 2
0:26
02
Apr
il 20
14
206 Christian von Luebke
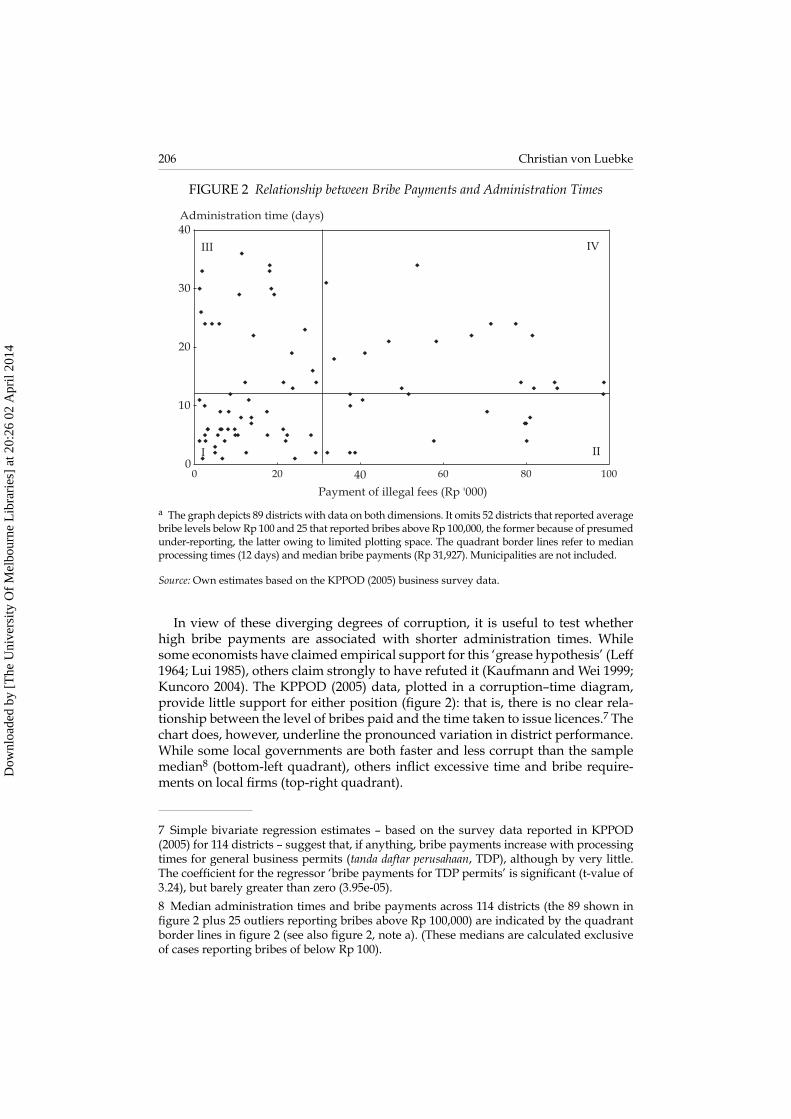
In view of these diverging degrees of corruption, it is useful to test whether high bribe payments are associated with shorter administration times. While some economists have claimed empirical support for this ‘grease hypothesis’ (Leff 1964; Lui 1985), others claim strongly to have refuted it (Kaufmann and Wei 1999; Kuncoro 2004). The KPPOD (2005) data, plotted in a corruption–time diagram, provide little support for either position (fi gure 2): that is, there is no clear rela-tionship between the level of bribes paid and the time taken to issue licences.7 The chart does, however, underline the pronounced variation in district performance. While some local governments are both faster and less corrupt than the sample median8 (bottom-left quadrant), others infl ict excessive time and bribe require-ments on local fi rms (top-right quadrant).
7 Simple bivariate regression estimates – based on the survey data reported in KPPOD (2005) for 114 districts – suggest that, if anything, bribe payments increase with processing times for general business permits (tanda daftar perusahaan, TDP), although by very little. The coeffi cient for the regressor ‘bribe payments for TDP permits’ is signifi cant (t-value of 3.24), but barely greater than zero (3.95e-05).
8 Median administration times and bribe payments across 114 districts (the 89 shown in fi gure 2 plus 25 outliers reporting bribes above Rp 100,000) are indicated by the quadrant border lines in fi gure 2 (see also fi gure 2, note a). (These medians are calculated exclusive of cases reporting bribes of below Rp 100).
FIGURE 2 Relationship between Bribe Payments and Administration Times
F
F
F
F
F
F
F
F
F
F
FF
F
FF
F
F
F
F
F
F
F
F
F
F
FFF
F
F
F
F
F
F
FF
F
F
F
FF
FF
F
F
FF
F
F
F
F
F
F
F
F
F
F
F
F
F
F
F
F
F
F
FF
F
F
FF
F
F F
F
FF
F
F
F
FFF
F
F
0
10
20
30
40
0 20 40 60 80 100
Administration time (days)
Payment of illegal fees (Rp '000)
I II
IVIII
a The graph depicts 89 districts with data on both dimensions. It omits 52 districts that reported average bribe levels below Rp 100 and 25 that reported bribes above Rp 100,000, the former because of presumed under-reporting, the latter owing to limited plotting space. The quadrant border lines refer to median processing times (12 days) and median bribe payments (Rp 31,927). Municipalities are not included.
Source: Own estimates based on the KPPOD (2005) business survey data.
Dow
nloa
ded
by [
The
Uni
vers
ity O
f M
elbo
urne
Lib
rari
es]
at 2
0:26
02
Apr
il 20
14
The political economy of local governance: fi ndings from an Indonesian fi eld study 207
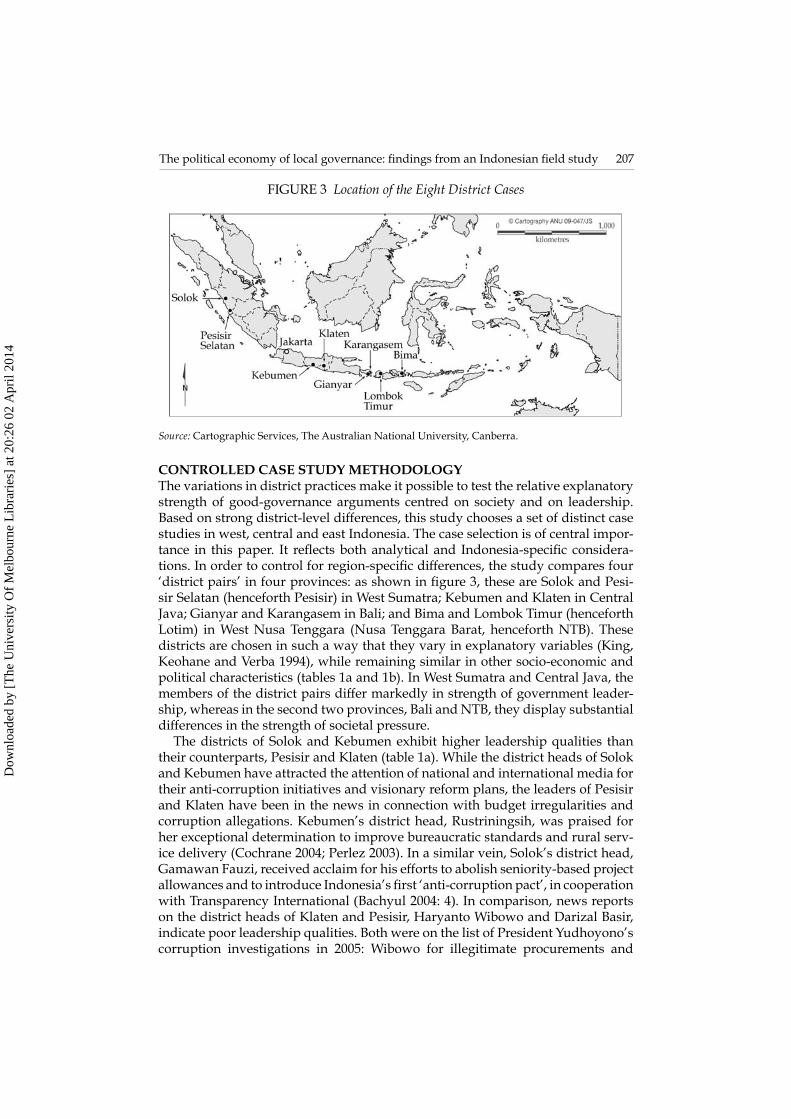
CONTROLLED CASE STUDY METHODOLOGYThe variations in district practices make it possible to test the relative explanatory strength of good-governance arguments centred on society and on leadership. Based on strong district-level differences, this study chooses a set of distinct case studies in west, central and east Indonesia. The case selection is of central impor-tance in this paper. It refl ects both analytical and Indonesia-specifi c considera-tions. In order to control for region-specifi c differences, the study compares four ‘district pairs’ in four provinces: as shown in fi gure 3, these are Solok and Pesi-sir Selatan (henceforth Pesisir) in West Sumatra; Kebumen and Klaten in Central Java; Gianyar and Karangasem in Bali; and Bima and Lombok Timur (henceforth Lotim) in West Nusa Tenggara (Nusa Tenggara Barat, henceforth NTB). These districts are chosen in such a way that they vary in explanatory variables (King, Keohane and Verba 1994), while remaining similar in other socio-economic and political characteristics (tables 1a and 1b). In West Sumatra and Central Java, the members of the district pairs differ markedly in strength of government leader-ship, whereas in the second two provinces, Bali and NTB, they display substantial differences in the strength of societal pressure.
The districts of Solok and Kebumen exhibit higher leadership qualities than their counterparts, Pesisir and Klaten (table 1a). While the district heads of Solok and Kebumen have attracted the attention of national and international media for their anti-corruption initiatives and visionary reform plans, the leaders of Pesisir and Klaten have been in the news in connection with budget irregularities and corruption allegations. Kebumen’s district head, Rustriningsih, was praised for her exceptional determination to improve bureaucratic standards and rural serv-ice delivery (Cochrane 2004; Perlez 2003). In a similar vein, Solok’s district head, Gamawan Fauzi, received acclaim for his efforts to abolish seniority-based project allowances and to introduce Indonesia’s fi rst ‘anti-corruption pact’, in cooperation with Transparency International (Bachyul 2004: 4). In comparison, news reports on the district heads of Klaten and Pesisir, Haryanto Wibowo and Darizal Basir, indicate poor leadership qualities. Both were on the list of President Yudhoyono’s corruption investigations in 2005: Wibowo for illegitimate procurements and
FIGURE 3 Location of the Eight District Cases
Source: Cartographic Services, The Australian National University, Canberra.
Dow
nloa
ded
by [
The
Uni
vers
ity O
f M
elbo
urne
Lib
rari
es]
at 2
0:26
02
Apr
il 20
14
208 Christian von Luebke
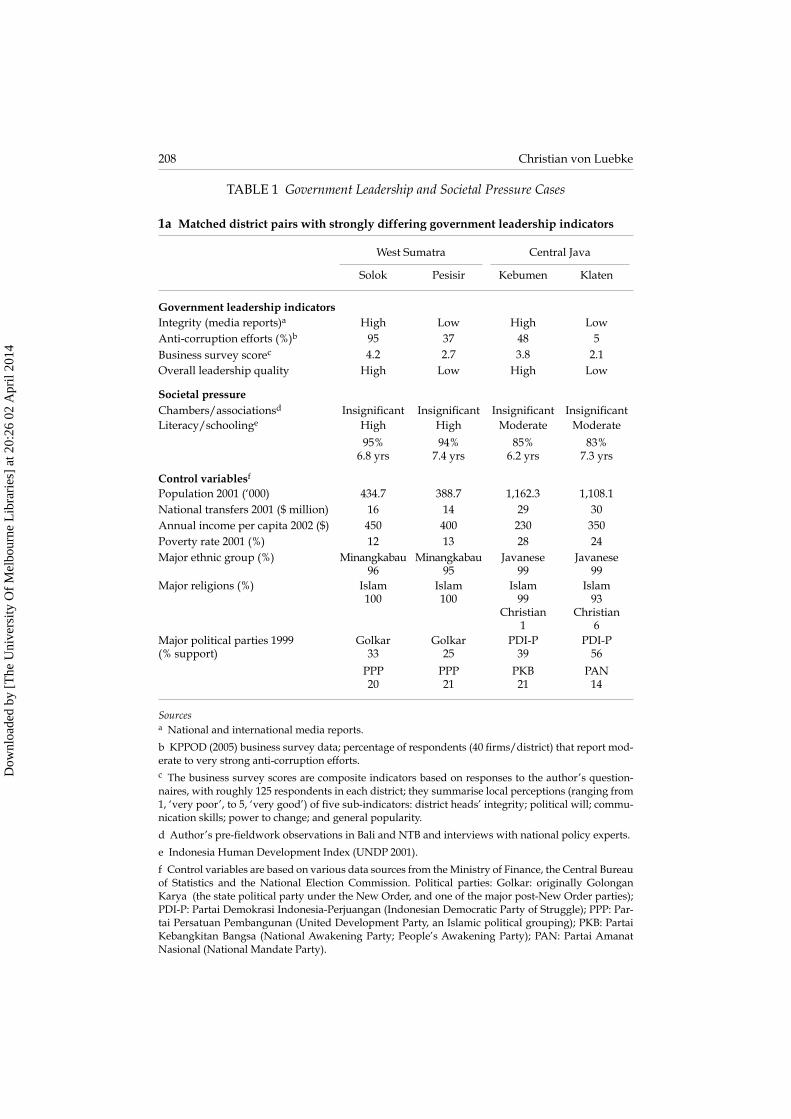
TABLE 1 Government Leadership and Societal Pressure Cases
1a Matched district pairs with strongly differing government leadership indicators
West Sumatra Central Java
Solok Pesisir Kebumen Klaten
Government leadership indicatorsIntegrity (media reports)a High Low High LowAnti-corruption efforts (%)b 95 37 48 5Business survey scorec 4.2 2.7 3.8 2.1Overall leadership quality High Low High Low
Societal pressure Chambers/associationsd Insignifi cant Insignifi cant Insignifi cant Insignifi cantLiteracy/schoolinge High
95%6.8 yrs
High 94%
7.4 yrs
Moderate 85%
6.2 yrs
Moderate 83%
7.3 yrs
Control variablesf
Population 2001 (‘000) 434.7 388.7 1,162.3 1,108.1National transfers 2001 ($ million) 16 14 29 30Annual income per capita 2002 ($) 450 400 230 350Poverty rate 2001 (%) 12 13 28 24Major ethnic group (%) Minangkabau
96Minangkabau
95Javanese
99Javanese
99Major religions (%) Islam
100Islam 100
Islam 99
Christian 1
Islam 93
Christian 6
Major political parties 1999 (% support)
Golkar 33
PPP 20
Golkar25
PPP 21
PDI-P 39
PKB 21
PDI-P 56
PAN 14
Sources a National and international media reports.
b KPPOD (2005) business survey data; percentage of respondents (40 fi rms/district) that report mod-erate to very strong anti-corruption efforts. c The business survey scores are composite indicators based on responses to the author’s question-naires, with roughly 125 respondents in each district; they summarise local perceptions (ranging from 1, ‘very poor’, to 5, ‘very good’) of fi ve sub-indicators: district heads’ integrity; political will; commu-nication skills; power to change; and general popularity.
d Author’s pre-fi eldwork observations in Bali and NTB and interviews with national policy experts.
e Indonesia Human Development Index (UNDP 2001).
f Control variables are based on various data sources from the Ministry of Finance, the Central Bureau of Statistics and the National Election Commission. Political parties: Golkar: originally Golongan Karya (the state political party under the New Order, and one of the major post-New Order parties); PDI-P: Partai Demokrasi Indonesia-Perjuangan (Indonesian Democratic Party of Struggle); PPP: Par-tai Persatuan Pembangunan (United Development Party, an Islamic political grouping); PKB: Partai Kebangkitan Bangsa (National Awakening Party; People’s Awakening Party); PAN: Partai Amanat Nasional (National Mandate Party).
Dow
nloa
ded
by [
The
Uni
vers
ity O
f M
elbo
urne
Lib
rari
es]
at 2
0:26
02
Apr
il 20
14
The political economy of local governance: fi ndings from an Indonesian fi eld study 209
property sales; Basir for misappropriation of agricultural and micro-credit funds.9 These differences in executive integrity are echoed in the KPPOD (2005) business survey results. The survey’s confi rmation of district heads’ anti-corruption efforts is signifi cantly higher in Solok (95%) than in Pesisir (37%); and more pronounced
9 ‘Pertanian dan korupsi berjalan seiring (Agriculture and corruption walk hand in hand)’, Kompas, 18/11/2003: 3; ’Presiden keluarkan izin pemeriksaan dua bupati (President author-ises investigation of two district heads)’, Tempo, 29/4/2005.
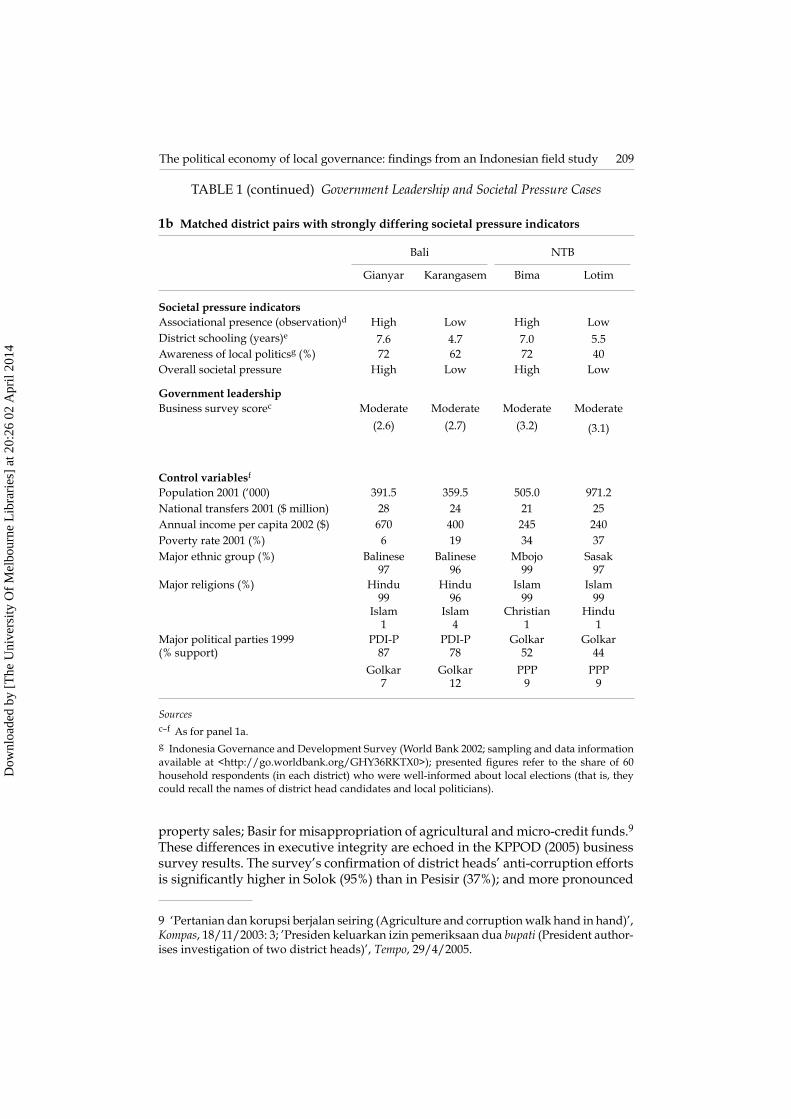
TABLE 1 (continued) Government Leadership and Societal Pressure Cases
1b Matched district pairs with strongly differing societal pressure indicators
Bali NTB
Gianyar Karangasem Bima Lotim
Societal pressure indicatorsAssociational presence (observation)d High Low High LowDistrict schooling (years)e 7.6 4.7 7.0 5.5Awareness of local politicsg (%) 72 62 72 40Overall societal pressure High Low High Low
Government leadershipBusiness survey scorec Moderate
(2.6)Moderate
(2.7)Moderate
(3.2)Moderate
(3.1)
Control variablesf
Population 2001 (‘000) 391.5 359.5 505.0 971.2National transfers 2001 ($ million) 28 24 21 25Annual income per capita 2002 ($) 670 400 245 240Poverty rate 2001 (%) 6 19 34 37Major ethnic group (%) Balinese
97Balinese
96Mbojo
99Sasak
97 Major religions (%) Hindu
99Islam
1
Hindu 96
Islam4
Islam99
Christian 1
Islam 99
Hindu 1
Major political parties 1999 (% support)
PDI-P87
Golkar7
PDI-P78
Golkar12
Golkar52
PPP9
Golkar44
PPP9
Sources c–f As for panel 1a. g Indonesia Governance and Development Survey (World Bank 2002; sampling and data information available at <http://go.worldbank.org/GHY36RKTX0>); presented fi gures refer to the share of 60 household respondents (in each district) who were well-informed about local elections (that is, they could recall the names of district head candidates and local politicians).
Dow
nloa
ded
by [
The
Uni
vers
ity O
f M
elbo
urne
Lib
rari
es]
at 2
0:26
02
Apr
il 20
14
210 Christian von Luebke
in Kebumen (48%) than in Klaten (5%). Moreover, the fi eld survey conducted for this study demonstrates that perceived leadership qualities (a composite indicator consisting of district heads’ integrity, political will, communication skills, power to change and popularity levels) are remarkably high in Solok and Kebumen (4.2 and 3.8, respectively), whereas they remain relatively low in Pesisir and Klaten (2.7 and 2.1, respectively).
Turning to the second explanatory variable, we chose Gianyar and Bima for their distinctiveness in societal pressure indicators. Both districts exhibit higher levels of associational presence, educational achievement and political awareness than the control districts of Karangasem and Lotim (table 1b).10 Gianyar’s associa-tional strength rests on long-standing craftsmanship and sustained tourism fl ows. Numerous handicraft associations have sprung up in villages that produce silver-ware, stone sculptures, ceramics and wood carvings. Moreover, citizens in Gianyar seem better educated than their peers in Karangasem (7.6 versus 4.7 average years of schooling) and somewhat better informed about local politics (72% versus 62%). Similar differences arise in NTB. A lively seaport during the days of the colonial spice trade, Bima continues to host a large community of small-scale traders and agro-businesses. The district stands out for its active chamber of commerce which, according to interview and media data, has repeatedly criticised government prac-tices and encouraged fi rms to engage in public decision making.11 Bima is also characterised by higher average levels of schooling than its neighbour Lotim (7.0 versus 5.5 years) and by greater political awareness (72% versus 40%).
Based on this controlled case selection, the study evaluates differences in local government performance. Two methods in particular were used to collect data on district policies and practices. The fi rst was to carry out local business surveys. During 12 months of fi eldwork, from April 2005 to March 2006, we conducted business surveys with 1,000 respondents (roughly 125 in each district).12 Survey respondents were randomly chosen from listings in local ‘yellow pages’ directo-ries, and were evenly stratifi ed across retail, manufacturing and service sectors. Consistent with employment structures in rural Indonesia, roughly 90% of the surveyed respondents were owners of small and cottage-sized fi rms.13 The second
10 Undoubtedly, there are other ways to measure local societal pressure. In this paper I focus on the outlined private sector indicators for two reasons. First, data on them were available for all district cases (whereas data on media access or NGO activity were patchy in Eastern Indonesia). Second, small and cottage-size fi rms (the primary respondents in the survey) are strongly represented in district societies.
11 The head of Bima’s local chamber of commerce (Kadinda), Qurais Abidin, is reported to have chided government offi cials repeatedly for their failure to provide effective services and attend to public needs (Anwar 2001). Other reports describe Bima’s Kadinda head as a rigorous government observer and a tireless supporter of small fi rms (‘Menggagas kerja sama Kukar–NTB [Envisioning cooperation between Kutai Kartanegara and West Nusa Tenggara]’, Bali Pos, 5/8/2003: 23).
12 The survey greatly benefi ted from the assistance of four local enumerators (most of them undergraduate students) in each district, who received a 5-day training course before administering the survey questionnaires.
13 According to Rice (2000: 7), small and cottage-sized enterprises account for roughly 90% of Indonesia’s labour force and 40% of national GDP.
Dow
nloa
ded
by [
The
Uni
vers
ity O
f M
elbo
urne
Lib
rari
es]
at 2
0:26
02
Apr
il 20
14
The political economy of local governance: fi ndings from an Indonesian fi eld study 211
data collection method was the conduct of in-depth interviews with over 120 local stake-holders and national policy experts.14 Interviews were semi-structured, with questions asked about local business conditions, government performance, cor-ruption and democracy. In each district, the sampling frame included four offi cials (fi nance, planning, small-industry, economic development), four business people (retail, manufacturing, public construction, services), one social science academic, one chamber of commerce and industry representative, two NGO members and two local journalists. Interviews were complemented with direct observation in government offi ces and local markets.
LOCAL GOVERNMENT PERFORMANCE: COMPARATIVE CASE FINDINGS The analysis of local governance in the eight selected districts is based on three performance criteria: fi rst, an evaluation of the quality of administrative regula-tion, as refl ected in the degree to which new tax bills distort regional economies; second, an evaluation of administrative procedures, as exemplifi ed by the effi -ciency and quality of licensing services; and third, an evaluation of administrative corruption, as indicated by irregularities in public recruitment and administrative processes. These district performance assessments draw primarily on our survey and interview data and, occasionally, on evaluations conducted by the Ministry of Finance and KPPOD.
Administrative regulationPairwise differences in administrative regulation were found to be more pro-nounced in the leadership than in the societal pressure cases. A clear distinction emerged between Solok and Pesisir in our study. Since the introduction of decen-tralisation, Solok had refrained from enacting distortionary regulations, whereas Pesisir had passed a tax bill that clearly obstructs regional trade fl ows. Since 2001 all commercial vehicles crossing Pesisir’s borders had been subject to ‘road usage taxes’ (Perda [Regional Regulation] 13/2001). Apart from obstructing regional trade, these local taxes had become particularly controversial, according to fi rms in Pesisir, because more than half of the levies were captured by local offi cials, who gave receipts only to every second truck.15
Formal tax bills were not the only obstacle in Pesisir. Another problem, albeit less obvious, emerged in the form of ‘informal trade levies’. As one senior offi cial
14 Regional perspectives were complemented with national narratives in Jakarta, includ-ing interviews with former Indonesian ministers (for regional autonomy and agriculture), senior offi cials (in the ministries of fi nance and home affairs), policy experts (The World Bank, the United Nations, the German aid agency GTZ, The Asia Foundation, KPPOD) and academics at the University of Indonesia and the Centre for Strategic and International Studies.
15 That border tariffs represent a serious problem, not only in Pesisir but also in other parts of Sumatra, is well illustrated in a study by the SMERU Research Institute (2001). Accord-ing to SMERU’s estimates, trucks transporting oranges from Kabanjahe in North Sumatra to Jakarta pay levies (offi cial and non-offi cial) ranging from Rp 270,000 to Rp 1,000,000 – a burden that can reduce business profi ts by up to 7%.
Dow
nloa
ded
by [
The
Uni
vers
ity O
f M
elbo
urne
Lib
rari
es]
at 2
0:26
02
Apr
il 20
14
212 Christian von Luebke
admitted in a private conversation, many government and military offi cials are more inclined to reap benefi ts from illegal logging than to prevent excessive deforestation in national reserves. Most traders comply with these informal taxes to avoid unnecessary trouble. ‘It does not matter whether we carry legal or illegal logs’, a local trader explains, ‘payments to forest offi cers [polisi hutan] are a neces-sary evil for keeping the business on track … if we don’t comply, our houses will be raided and we end up being convicted for illegal logging, guilty or not’.
Similar informal charges on the transportation of timber occurred in Klaten. As a senior offi cial disclosed, the local forestry offi ce was collecting roughly $20,000 worth of transport levies each year by making use of a legal ‘grey zone’. In the absence of clear district regulations, local offi cials collected charges on timber imports based on an outdated ministerial decree.16 Even more disturbing is that collected revenues were not accounted for in offi cial district budgets: according to informants in Klaten, these informal charges were often divided among senior bureaucrats. The levies imposed unwarranted burdens on Klaten’s furniture and handicraft industries. In Kebumen, on the other hand, there were no reports of formal or informal trade distortions.
On the basis of these observations in Sumatra and Java, the tax environments in Kebumen and Solok at the time of the study can be ranked as ‘very good’ (no distortions), in Klaten as ‘poor’ (informal distortions) and in Pesisir as ‘very poor’ (formal and informal distortions).
Turning to the societal pressure cases, we found regulatory differences to be small in comparison. While both the districts in Bali had eschewed distortionary tax regulations, the opposite was true in NTB. According to records from the Min-istry of Finance, the governments of both Bima and Lotim had enacted tax bills that signifi cantly obstructed regional trade and development.17 In the case of Bima, three regulations stand out in particular: fi rst, a levy on regional exports (Perda 16/2000) that taxes agricultural and manufactured goods at district borders at rates of 5–10%; second, a levy on local fi shers (Perda 7/2001) that charges annual head taxes of up to Rp 200,000, irrespective of sales or profi ts; and third, a levy on local cooperatives (Perda 15/2000) equal to 4% of their annual surpluses. Similar trade distortions, albeit less severe, were found in Lotim. Although Lotim’s par-liament had refrained from enacting head taxes on small fi rms, it too had imposed a 5% export levy on the transport of all commodities across its borders (Perda 16/2001). Concerned about their negative welfare effects, the Ministry of Finance offi cially rejected all of the new tax bills submitted by Bima and Lotim.18 These national rejections, however, had little or no impact. As a senior offi cial in Bima’s economic department explained it:
We are aware that the Ministry of Finance rejected [the export levy] in 2002 … But the head of our law department advised us to disregard the national decree … After
16 Ministry of Forestry Decree 310/Kpts-II/1999 (‘Guidelines for Granting Forestry Rights’).
17 The evaluations presented in this paragraph were obtained from Ministry of Finance reports S26/MK.07/2002; S486/MK.07/2002; and S 523 /MK.07/2002.
18 While the Ministry of Finance can make suggestions for annulments, the fi nal decision lies with the Ministry of Home Affairs.
Dow
nloa
ded
by [
The
Uni
vers
ity O
f M
elbo
urne
Lib
rari
es]
at 2
0:26
02
Apr
il 20
14
The political economy of local governance: fi ndings from an Indonesian fi eld study 213
all, we live in the era of regional autonomy [and] the local trade tax constitutes one of our highest revenue sources.
The analysis of administrative regulations in Bali and NTB highlights two fi nd-ings. First, and more generally, some local tax policies are instructive examples of initial setbacks to decentralisation. The governments in Bima and Lotim con-sciously ignored national-level rejections of trade-distorting tax bills, and gave priority to short-term government revenues over long-term welfare gains. Sec-ond, pairwise comparisons indicate little difference in regulatory quality. Since Gianyar and Karangasem exhibited no tax-induced distortions, the regulatory environment is rated as ‘very good’ in both districts. Bima and Lotim, in contrast, had imposed imprudent trade taxes, a problem further aggravated in Bima’s case by arbitrary taxes on fi shers and local cooperatives. Accordingly, the regulatory environment is categorised as ‘poor’ in Lotim (one distortionary bill) and ‘very poor’ in Bima (three distortionary bills).
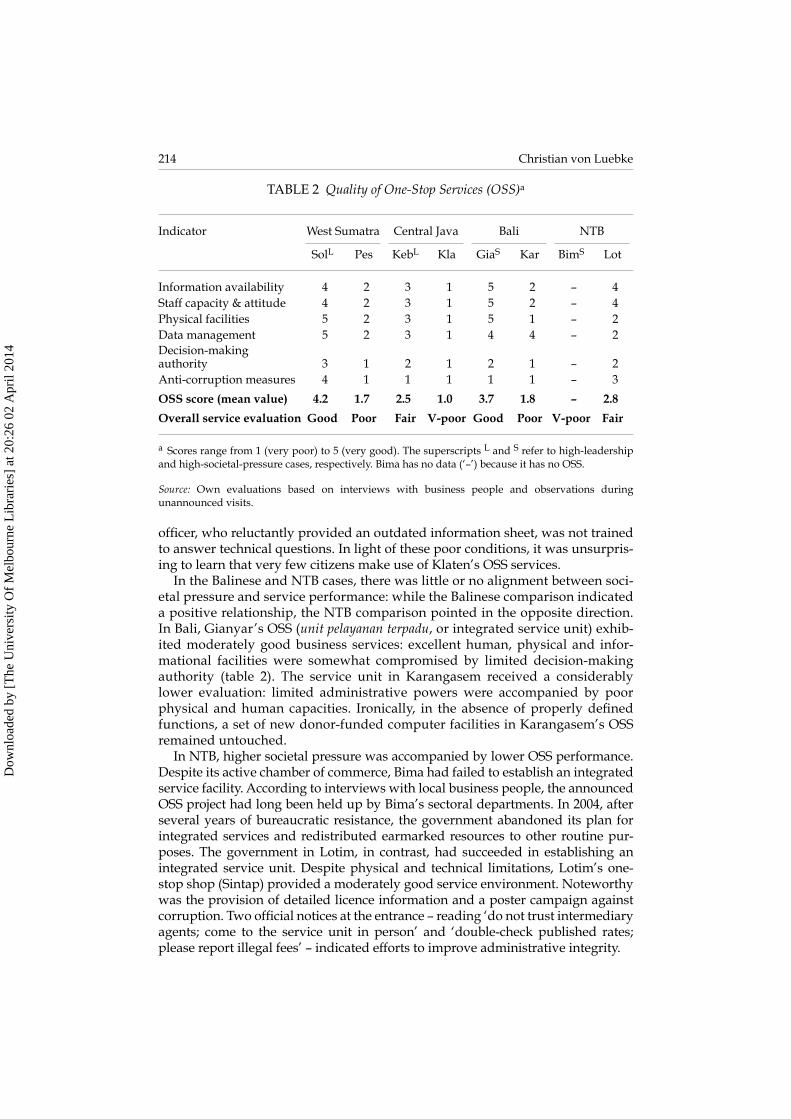
Administrative procedures Local administrative procedures can be distinguished in terms of quality and effi ciency. The quality dimension is exemplifi ed in local service standards at the so-called ‘one-stop shops’ (OSSs). The main objective of OSSs is to streamline licensing procedures: theoretically, citizens can complete bureaucratic formalities with ‘one stop’ in these integrated service units, instead of visiting a succession of offi ces. The qualities of these OSS units were assessed during unannounced visits in each district. The results are summarised in table 2.
In the Sumatran and Javanese cases, superior leadership (indicated by the superscript L on the abbreviated district names in table 2) coincided with better service quality. The most striking differences emerged between Solok and Pesisir. The visit to Solok’s OSS (satu pintu plus [‘one door plus’]) set a high performance benchmark: licensing requirements and fee details were readily available in well-designed brochures (and on display boards); three out of four service counters were attended by knowledgeable and affable staff; duty offi cials were administer-ing licence requests on modern computer facilities; and all service areas displayed anti-corruption signs indicating that bribe payments were prohibited. Pesisir’s service unit (pos yantu, short form of pos pelayanan satu pintu, literally, ‘one-door service post’), on the other hand, turned out to be a poorly managed, one-room facility. The small offi ce, attended by two inexperienced offi cials, was equipped with run-down furniture and an outdated information board. Although eager to assist, the duty offi cers explained that most licensing matters were handled by sectoral departments.
Notable differences emerged also in Central Java. The OSS in Kebumen (pelayanan perijinan, ‘licence service’) displayed a moderately good service envi-ronment. Situated behind three service counters, a group of well-trained civil serv-ants responded instantly to licensing inquiries and provided helpful information brochures. Although interviews revealed the need for additional computer facili-ties and precise job descriptions, Kebumen’s business services compared favoura-bly with those in Klaten. Hidden in the back corridors of the district head’s offi ce, Klaten’s OSS (unit pelayanan satu atap, literally, ‘single-roofed service unit’) was little more than a dark room fi lled with old typewriters and dusty fi les. The duty
Dow
nloa
ded
by [
The
Uni
vers
ity O
f M
elbo
urne
Lib
rari
es]
at 2
0:26
02
Apr
il 20
14
214 Christian von Luebke
offi cer, who reluctantly provided an outdated information sheet, was not trained to answer technical questions. In light of these poor conditions, it was unsurpris-ing to learn that very few citizens make use of Klaten’s OSS services.
In the Balinese and NTB cases, there was little or no alignment between soci-etal pressure and service performance: while the Balinese comparison indicated a positive relationship, the NTB comparison pointed in the opposite direction. In Bali, Gianyar’s OSS (unit pelayanan terpadu, or integrated service unit) exhib-ited moderately good business services: excellent human, physical and infor-mational facilities were somewhat compromised by limited decision-making authority (table 2). The service unit in Karangasem received a considerably lower evaluation: limited administrative powers were accompanied by poor physical and human capacities. Ironically, in the absence of properly defi ned functions, a set of new donor-funded computer facilities in Karangasem’s OSS remained untouched.
In NTB, higher societal pressure was accompanied by lower OSS performance. Despite its active chamber of commerce, Bima had failed to establish an integrated service facility. According to interviews with local business people, the announced OSS project had long been held up by Bima’s sectoral departments. In 2004, after several years of bureaucratic resistance, the government abandoned its plan for integrated services and redistributed earmarked resources to other routine pur-poses. The government in Lotim, in contrast, had succeeded in establishing an integrated service unit. Despite physical and technical limitations, Lotim’s one-stop shop (Sintap) provided a moderately good service environment. Noteworthy was the provision of detailed licence information and a poster campaign against corruption. Two offi cial notices at the entrance – reading ‘do not trust intermediary agents; come to the service unit in person’ and ‘double-check published rates; please report illegal fees’ – indicated efforts to improve administrative integrity.
TABLE 2 Quality of One-Stop Services (OSS)a
Indicator West Sumatra Central Java Bali NTB
SolL Pes KebL Kla GiaS Kar BimS Lot
Information availability 4 2 3 1 5 2 – 4Staff capacity & attitude 4 2 3 1 5 2 – 4Physical facilities 5 2 3 1 5 1 – 2Data management 5 2 3 1 4 4 – 2Decision-making authority 3 1 2 1 2 1 – 2Anti-corruption measures 4 1 1 1 1 1 – 3
OSS score (mean value) 4.2 1.7 2.5 1.0 3.7 1.8 – 2.8
Overall service evaluation Good Poor Fair V-poor Good Poor V-poor Fair
a Scores range from 1 (very poor) to 5 (very good). The superscripts L and S refer to high-leadership and high-societal-pressure cases, respectively. Bima has no data (‘–’) because it has no OSS.
Source: Own evaluations based on interviews with business people and observations during un announced visits.
Dow
nloa
ded
by [
The
Uni
vers
ity O
f M
elbo
urne
Lib
rari
es]
at 2
0:26
02
Apr
il 20
14
The political economy of local governance: fi ndings from an Indonesian fi eld study 215
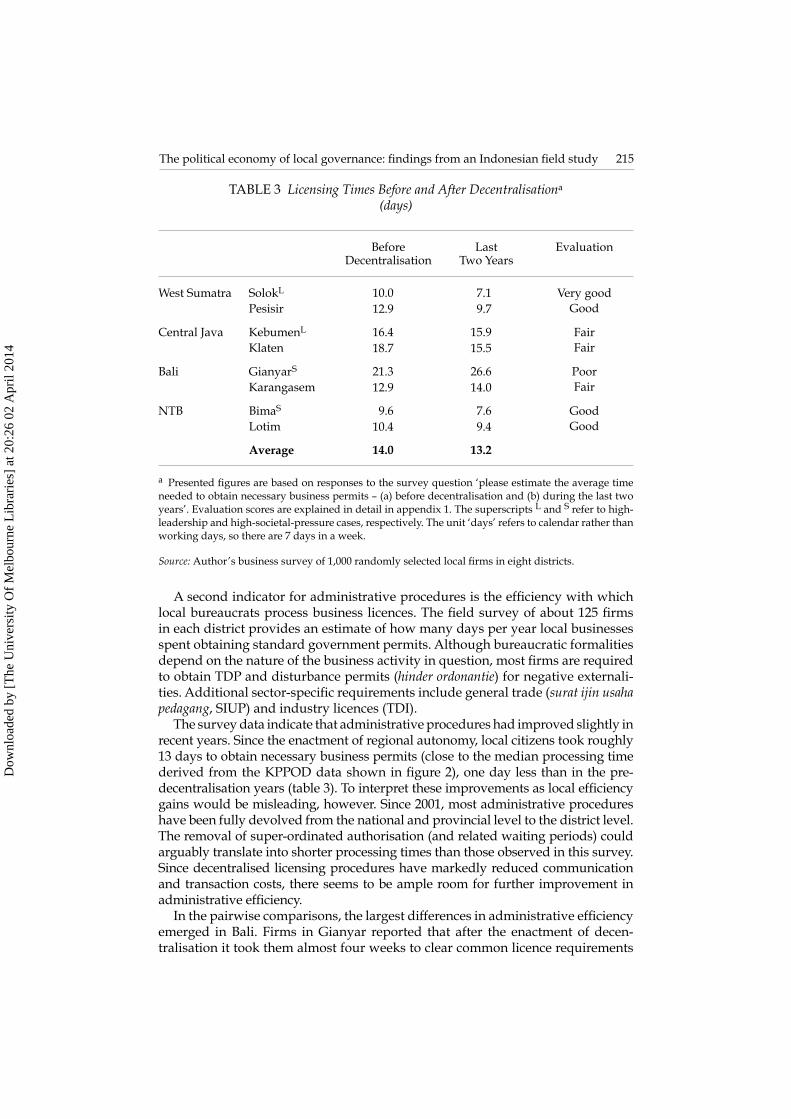
A second indicator for administrative procedures is the effi ciency with which local bureaucrats process business licences. The fi eld survey of about 125 fi rms in each district provides an estimate of how many days per year local businesses spent obtaining standard government permits. Although bureaucratic formalities depend on the nature of the business activity in question, most fi rms are required to obtain TDP and disturbance permits (hinder ordonantie) for negative externali-ties. Additional sector-specifi c requirements include general trade (surat ijin usaha pedagang, SIUP) and industry licences (TDI).
The survey data indicate that administrative procedures had improved slightly in recent years. Since the enactment of regional autonomy, local citizens took roughly 13 days to obtain necessary business permits (close to the median processing time derived from the KPPOD data shown in fi gure 2), one day less than in the pre-decentralisation years (table 3). To interpret these improvements as local effi ciency gains would be misleading, however. Since 2001, most administrative procedures have been fully devolved from the national and provincial level to the district level. The removal of super-ordinated authorisation (and related waiting periods) could arguably translate into shorter processing times than those observed in this survey. Since decentralised licensing procedures have markedly reduced communication and transaction costs, there seems to be ample room for further improvement in administrative effi ciency.
In the pairwise comparisons, the largest differences in administrative effi ciency emerged in Bali. Firms in Gianyar reported that after the enactment of decen-tralisation it took them almost four weeks to clear common licence requirements
TABLE 3 Licensing Times Before and After Decentralisationa
(days)
Before Decentralisation
Last Two Years
Evaluation
West Sumatra SolokL 10.0 7.1 Very goodPesisir 12.9 9.7 Good
Central Java KebumenL 16.4 15.9 FairKlaten 18.7 15.5 Fair
Bali GianyarS 21.3 26.6 PoorKarangasem 12.9 14.0 Fair
NTB BimaS 9.6 7.6 GoodLotim 10.4 9.4 Good
Average 14.0 13.2
a Presented fi gures are based on responses to the survey question ‘please estimate the average time needed to obtain necessary business permits – (a) before decentralisation and (b) during the last two years’. Evaluation scores are explained in detail in appendix 1. The superscripts L and S refer to high-leadership and high-societal-pressure cases, respectively. The unit ‘days’ refers to calendar rather than working days, so there are 7 days in a week.
Source: Author’s business survey of 1,000 randomly selected local fi rms in eight districts.
Dow
nloa
ded
by [
The
Uni
vers
ity O
f M
elbo
urne
Lib
rari
es]
at 2
0:26
02
Apr
il 20
14
216 Christian von Luebke
(almost one week more than before decentralisation), whereas their colleagues in Karangasem took two weeks. While case differences in administration times remained insignifi cant in NTB (just over one week in both cases) and in Central Java (roughly 16 days in both cases), the comparisons in West Sumatra indicated moderate differences. Solok administered business permits within seven days (the best performance in the group), whereas Pesisir’s fi rms took 10 days to fi nal-ise administrative paperwork.
Consistent with these survey results (and evaluation scales outlined in appen-dix 1), administrative effi ciencies are rated as ‘poor’ in Gianyar; ‘fair’ in Kebumen, Klaten and Karangasem; ‘good’ in Bima, Lotim and Pesisir; and ‘very good’ in Solok. Although less pronounced than was the case for administrative regulation, observable case differences provide some indication that effi ciency in administra-tive procedures is negatively linked to societal pressure (Gianyar/Karangasem) and positively linked to government leadership (Solok/Pesisir).
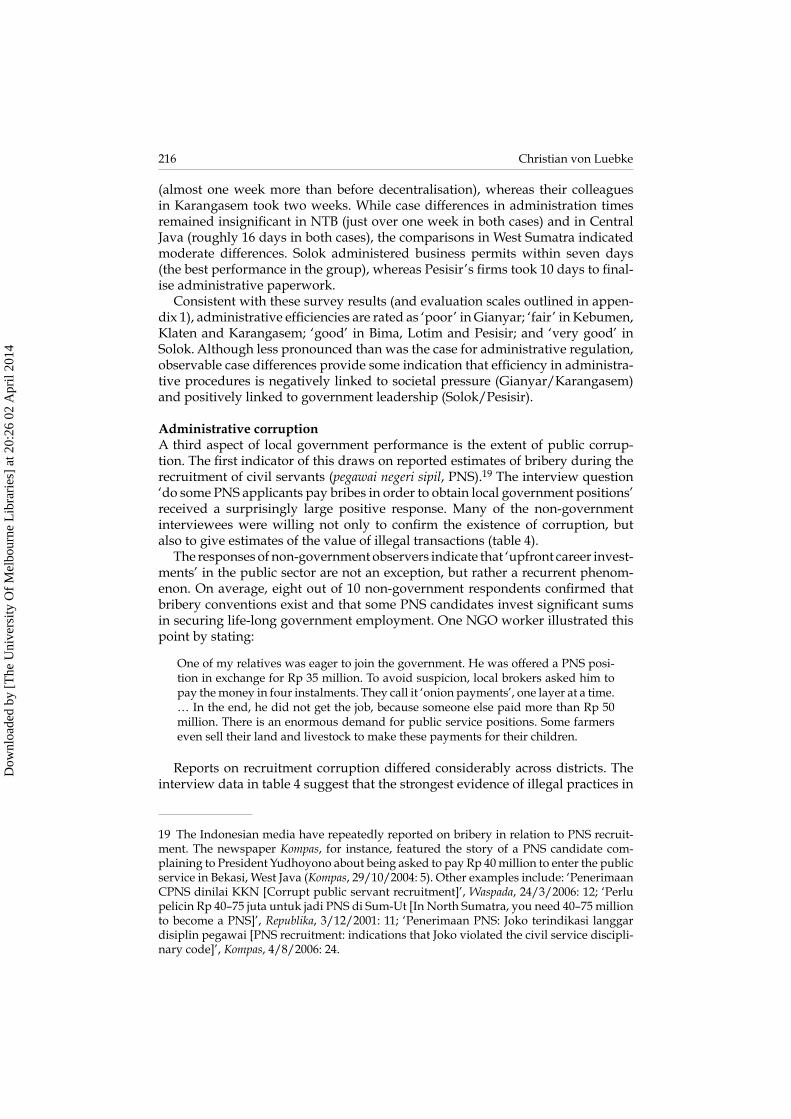
Administrative corruptionA third aspect of local government performance is the extent of public corrup-tion. The fi rst indicator of this draws on reported estimates of bribery during the recruitment of civil servants (pegawai negeri sipil, PNS).19 The interview question ‘do some PNS applicants pay bribes in order to obtain local government positions’ received a surprisingly large positive response. Many of the non-government interviewees were willing not only to confi rm the existence of corruption, but also to give estimates of the value of illegal transactions (table 4).
The responses of non-government observers indicate that ‘upfront career invest-ments’ in the public sector are not an exception, but rather a recurrent phenom-enon. On average, eight out of 10 non-government respondents confi rmed that bribery conventions exist and that some PNS candidates invest signifi cant sums in securing life-long government employment. One NGO worker illustrated this point by stating:
One of my relatives was eager to join the government. He was offered a PNS posi-tion in exchange for Rp 35 million. To avoid suspicion, local brokers asked him to pay the money in four instalments. They call it ‘onion payments’, one layer at a time. … In the end, he did not get the job, because someone else paid more than Rp 50 million. There is an enormous demand for public service positions. Some farmers even sell their land and livestock to make these payments for their children.
Reports on recruitment corruption differed considerably across districts. The interview data in table 4 suggest that the strongest evidence of illegal practices in
19 The Indonesian media have repeatedly reported on bribery in relation to PNS recruit-ment. The newspaper Kompas, for instance, featured the story of a PNS candidate com-plaining to President Yudhoyono about being asked to pay Rp 40 million to enter the public service in Bekasi, West Java (Kompas, 29/10/2004: 5). Other examples include: ‘Penerimaan CPNS dinilai KKN [Corrupt public servant recruitment]’, Waspada, 24/3/2006: 12; ‘Perlu pelicin Rp 40–75 juta untuk jadi PNS di Sum-Ut [In North Sumatra, you need 40–75 million to become a PNS]’, Republika, 3/12/2001: 11; ‘Penerimaan PNS: Joko terindikasi langgar disiplin pegawai [PNS recruitment: indications that Joko violated the civil service discipli-nary code]’, Kompas, 4/8/2006: 24.
Dow
nloa
ded
by [
The
Uni
vers
ity O
f M
elbo
urne
Lib
rari
es]
at 2
0:26
02
Apr
il 20
14
The political economy of local governance: fi ndings from an Indonesian fi eld study 217
the surveyed districts is to be found in Klaten. Here, all 10 respondents confi rmed the existence of upfront bribe payments and estimated that some civil servants have invested Rp 45–90 million (an average of Rp 65 million) in securing their government positions. Given that monthly starting wages of PNS barely exceed Rp 1 million, these outlays are equivalent to roughly 4–8 years of offi cial salaries. These simple, rough calculations suggest that new government offi cials have an incentive to engage in illegitimate practices in order to secure a return on their investment. In Kebumen, by contrast, only a few interviewees reported such irregularities. With estimates ranging from 0 to Rp 15 million (average Rp 6 mil-lion), Kebumen’s interviewees observed distinctly lower bribe conventions.
A similar contrast can be seen in the two Sumatran cases. In Pesisir, inter-view respondents estimated ‘entry fees’ in the range Rp 15–30 million (average Rp 23 million), and declared that the prevalence of corruption had increased since 2001. Solok’s recruitment process, in contrast, received an exceptionally good evaluation. All interviewees in Solok – without exception – asserted that bribe payments were unheard of in recent years. While some acknowledged that
TABLE 4 Corruption during Public Service Recruitment (interview perceptions, Rp million per transaction)
Respondent No. Ø Evaluation
1 2 3 4 5 6 7 8 9 10
Central JavaKebumenL 15 8 8 0 0 exists exists – – – 6 FairKlaten 90 75 75 75 70 60 55 50 50 45 65 Very poor
West SumatraSolokL 0 0 0 0 0 0 0 0 0 – 0 Very goodPesisir 30 28 23 23 20 15 exists exists – – 23 Poor
BaliGianyarS 30 25 exists exists exists exists exists 0 – – 18 PoorKarangasem 40 30 20 15 15 12 8 exists exists – 20 Poor
NTBBimaS 45 45 40 40 38 35 30 30 25 exists 36 Very poorLotim 50 50 35 35 35 30 30 25 – – 36 Very poor
a Presented fi gures are based on the interview question ‘please provide an estimate of the bribe pay-ments that some PNS [civil servant] candidates make to obtain a government position’. Ø = average of responses with a numerical value. Respondents in each district are displayed in descending order of reported bribes. The response ‘exists’ indicates that respondents affi rm bribe payments without pro-viding clear estimates; ‘–’ indicates non-responses; evaluation scores are explained in detail in appen-dix 1. The superscripts L and S refer to high-leadership and high-societal-pressure cases, respectively.
Source: Data from interviews with 10 non-government respondents in each district.
Dow
nloa
ded
by [
The
Uni
vers
ity O
f M
elbo
urne
Lib
rari
es]
at 2
0:26
02
Apr
il 20
14
218 Christian von Luebke
irregularities occurred in the 1980s and early 1990s, there was general agreement that incoming offi cials had been selected in a fair and transparent manner since the introduction of decentralisation.
The interviews in Bali and NTB suggested high, but less divergent, levels of corruption. In both Bima and Lotim, average bribe payments were reported at Rp 36 million. A striking feature was the similarity not only of these average fi g-ures, but also of individual statements: six respondents in Bima and fi ve in Lotim reported bribery payments of Rp 30–40 million. The survey data in Bali also point to rather uniform levels of corruption, indicating that average PNS recruitment bribes amounted to Rp 20 million in Karangasem and Rp 18 million in Gianyar.
Undoubtedly, given the limited number of observations, these fi gures should be interpreted with some caution. They serve not as proof, but rather as an indica-tion, of bribery practices. Such qualifi cations notwithstanding, the results help to identify diverging corruption trends: in one district there is no indication, in one district there is some indication, and in six districts there are strong indications, that some civil servants have secured offi ce by paying bribes rather than perform-ing well in entrance exams. Based on these trends (and consistent with the evalu-ation scale in appendix 1), the level of integrity in public recruitment is evaluated in this study as ‘very good’ in Solok, ‘fair’ in Kebumen, ‘poor’ in Pesisir, Gianyar and Karangasem and ‘very poor’ in Klaten, Bima and Lotim. These results indi-cate a clear alignment with underlying leadership differences, but no relationship between corruption scores and pairwise distinctions in societal pressure.
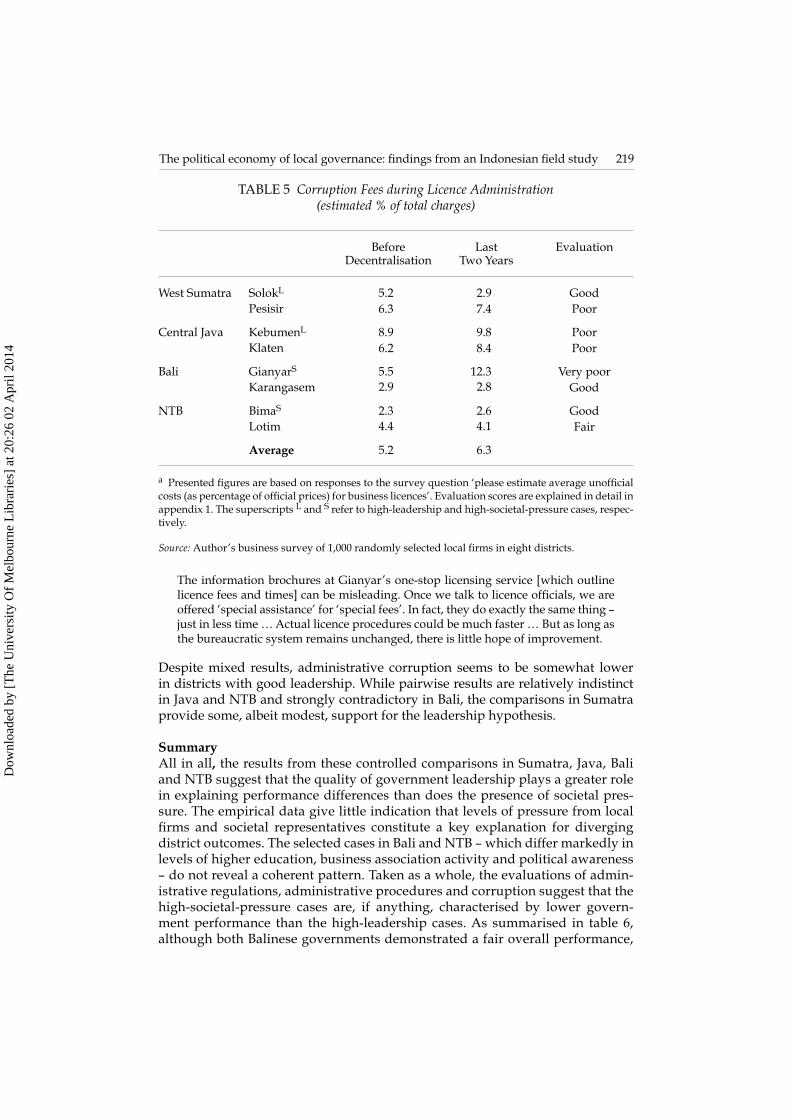
The results for the second corruption indicator, administrative integrity during licensing procedures, were less clear cut. In West Sumatra, Solok’s good recruit-ment practices coincided with low levels of licensing irregularities (table 5). Respondents in Solok reported that illegal add-on fees for business permits had fallen signifi cantly, from 5.2% of total charges during the pre-decentralisation years to 2.9% in recent years. In contrast, business people in Pesisir had expe-rienced rising extortion since decentralisation, and had recently been paying average corruption premiums of 7.4%. Bureaucratic extortion in the two Central Javanese cases was higher and remained fairly equal across the two cases. Accord-ing to our surveys, local fi rms in Kebumen encountered average corruption fees of 9.8%, whereas their colleagues in Klaten reported fees of 8.4%. Although the fi gures were slightly lower in Klaten than in Kebumen, they had increased more steeply since decentralisation. In view of these corruption tendencies, administra-tive integrity is ranked as ‘good’ in Solok and as ‘poor’ in Pesisir, Kebumen and Klaten (appendix 1).
The survey results for the societal pressure cases in Bali and NTB provide an inconsistent picture. Respondents in Gianyar stated that average corruption fees had more than doubled, from about 5.5% to 12.3%, since the beginning of decentralisation (table 5). In the other three districts, business people faced far less government extortion. In Karangasem, Bima and Lotim, survey participants reported recent add-on fees of 2.6–4.1%, fi gures that had hardly changed since decentralisation. Based on these corruption indicators in the societal pressure cases, administrative integrity is evaluated as ‘very poor’ in Gianyar, as ‘fair’ in Lotim and as ‘good’ in Karangasem and Bima. Interestingly, Gianyar’s case shows that administrative corruption can prevail regardless of high OSS standards. An NGO representative in Gianyar explains this as follows:
Dow
nloa
ded
by [
The
Uni
vers
ity O
f M
elbo
urne
Lib
rari
es]
at 2
0:26
02
Apr
il 20
14
The political economy of local governance: fi ndings from an Indonesian fi eld study 219
The information brochures at Gianyar’s one-stop licensing service [which outline licence fees and times] can be misleading. Once we talk to licence offi cials, we are offered ‘special assistance’ for ‘special fees’. In fact, they do exactly the same thing – just in less time … Actual licence procedures could be much faster … But as long as the bureaucratic system remains unchanged, there is little hope of improvement.
Despite mixed results, administrative corruption seems to be somewhat lower in districts with good leadership. While pairwise results are relatively indistinct in Java and NTB and strongly contradictory in Bali, the comparisons in Sumatra provide some, albeit modest, support for the leadership hypothesis.
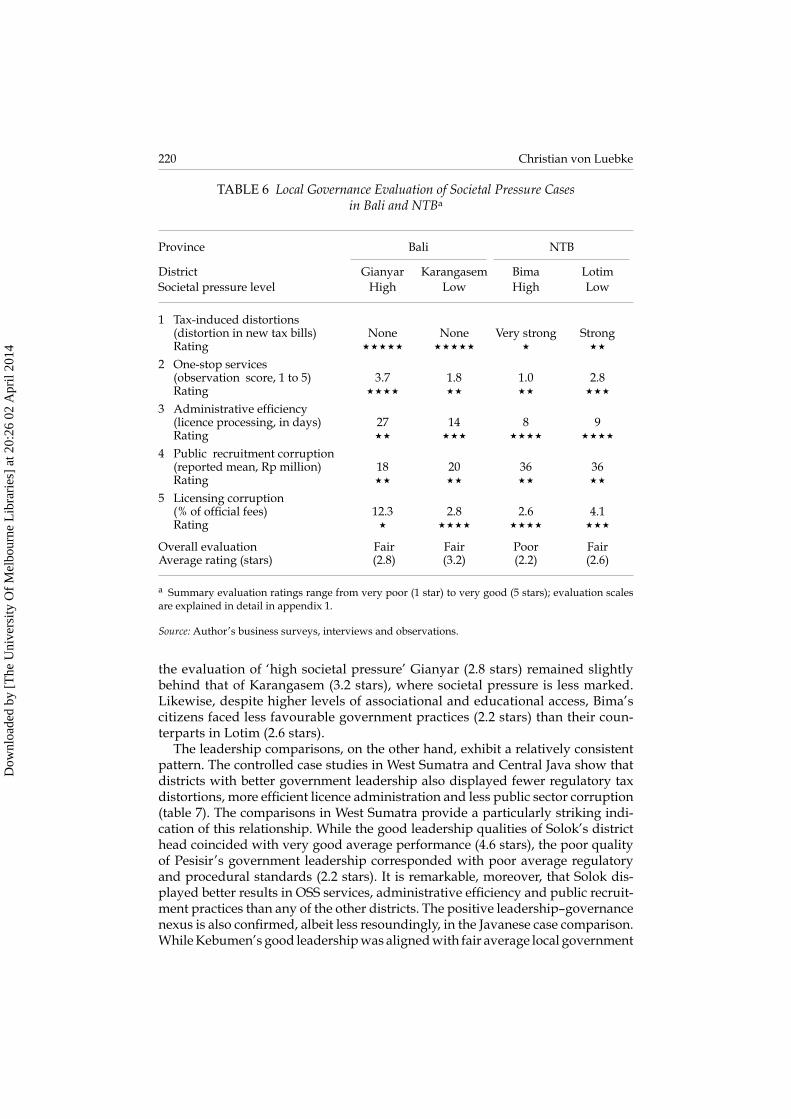
SummaryAll in all, the results from these controlled comparisons in Sumatra, Java, Bali and NTB suggest that the quality of government leadership plays a greater role in explaining performance differences than does the presence of societal pres-sure. The empirical data give little indication that levels of pressure from local fi rms and societal representatives constitute a key explanation for diverging district outcomes. The selected cases in Bali and NTB – which differ markedly in levels of higher education, business association activity and political awareness – do not reveal a coherent pattern. Taken as a whole, the evaluations of admin-istrative regulations, administrative procedures and corruption suggest that the high-societal-pressure cases are, if anything, characterised by lower govern-ment performance than the high-leadership cases. As summarised in table 6, although both Balinese governments demonstrated a fair overall performance,
TABLE 5 Corruption Fees during Licence Administration (estimated % of total charges)
Before Decentralisation
Last Two Years
Evaluation
West Sumatra SolokL 5.2 2.9 GoodPesisir 6.3 7.4 Poor
Central Java KebumenL 8.9 9.8 PoorKlaten 6.2 8.4 Poor
Bali GianyarS 5.5 12.3 Very poorKarangasem 2.9 2.8 Good
NTB BimaS 2.3 2.6 GoodLotim 4.4 4.1 Fair
Average 5.2 6.3
a Presented fi gures are based on responses to the survey question ‘please estimate average unoffi cial costs (as percentage of offi cial prices) for business licences’. Evaluation scores are explained in detail in appendix 1. The superscripts L and S refer to high-leadership and high-societal-pressure cases, respec-tively.
Source: Author’s business survey of 1,000 randomly selected local fi rms in eight districts.
Dow
nloa
ded
by [
The
Uni
vers
ity O
f M
elbo
urne
Lib
rari
es]
at 2
0:26
02
Apr
il 20
14
220 Christian von Luebke
the evaluation of ‘high societal pressure’ Gianyar (2.8 stars) remained slightly behind that of Karangasem (3.2 stars), where societal pressure is less marked. Likewise, despite higher levels of associational and educational access, Bima’s citizens faced less favourable government practices (2.2 stars) than their coun-terparts in Lotim (2.6 stars).
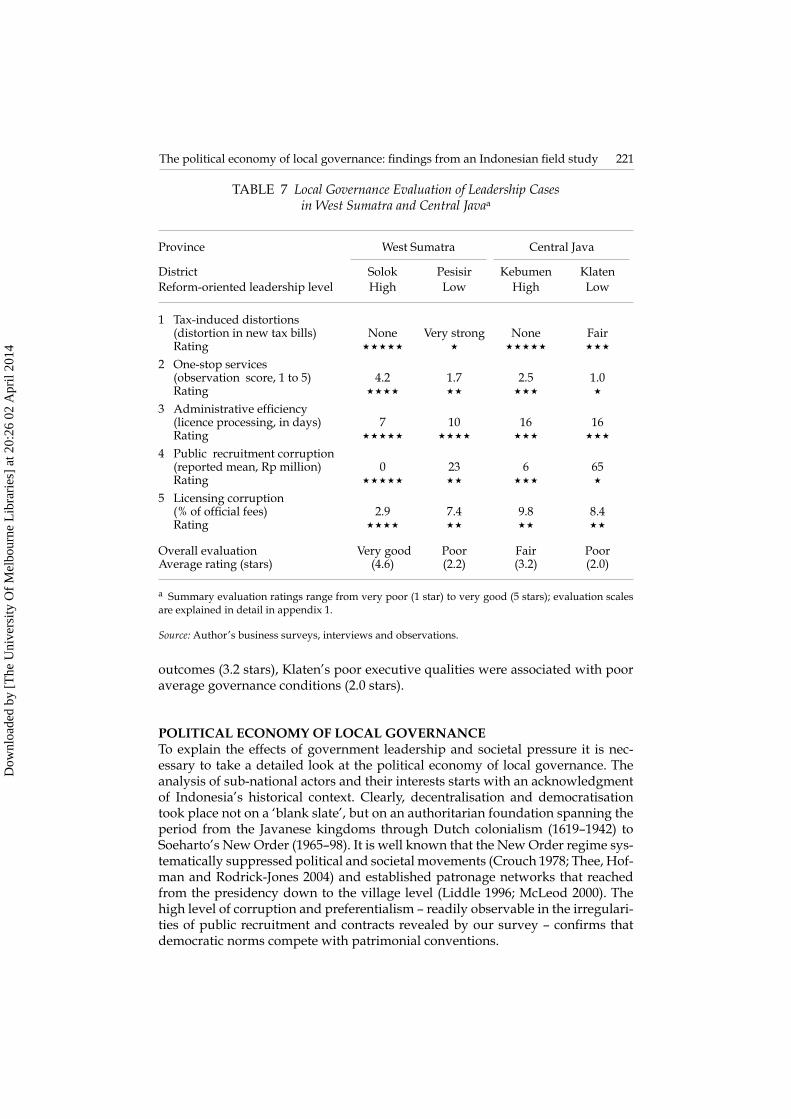
The leadership comparisons, on the other hand, exhibit a relatively consistent pattern. The controlled case studies in West Sumatra and Central Java show that districts with better government leadership also displayed fewer regulatory tax distortions, more effi cient licence administration and less public sector corruption (table 7). The comparisons in West Sumatra provide a particularly striking indi-cation of this relationship. While the good leadership qualities of Solok’s district head coincided with very good average performance (4.6 stars), the poor quality of Pesisir’s government leadership corresponded with poor average regulatory and procedural standards (2.2 stars). It is remarkable, moreover, that Solok dis-played better results in OSS services, administrative effi ciency and public recruit-ment practices than any of the other districts. The positive leadership–governance nexus is also confi rmed, albeit less resoundingly, in the Javanese case comparison. While Kebumen’s good leadership was aligned with fair average local government
TABLE 6 Local Governance Evaluation of Societal Pressure Cases in Bali and NTBa
Province Bali NTB
District Gianyar Karangasem Bima LotimSocietal pressure level High Low High Low
1 Tax-induced distortions (distortion in new tax bills) Rating
None
´´´´´
None
´´´´´
Very strong ´
Strong´´
2 One-stop services (observation score, 1 to 5) Rating
3.7 ´´´´
1.8 ´´
1.0 ´´
2.8 ´´´
3 Administrative effi ciency (licence processing, in days) Rating
27 ´´
14
´´´
8´´´´
9 ´´´´
4 Public recruitment corruption (reported mean, Rp million) Rating
18 ´´
20´´
36´´
36 ´´
5 Licensing corruption (% of offi cial fees) Rating
12.3 ´
2.8 ´´´´
2.6 ´´´´
4.1 ´´´
Overall evaluationAverage rating (stars)
Fair (2.8)
Fair (3.2)
Poor (2.2)
Fair (2.6)
a Summary evaluation ratings range from very poor (1 star) to very good (5 stars); evaluation scales are explained in detail in appendix 1.
Source: Author’s business surveys, interviews and observations.
Dow
nloa
ded
by [
The
Uni
vers
ity O
f M
elbo
urne
Lib
rari
es]
at 2
0:26
02
Apr
il 20
14
The political economy of local governance: fi ndings from an Indonesian fi eld study 221
outcomes (3.2 stars), Klaten’s poor executive qualities were associated with poor average governance conditions (2.0 stars).
POLITICAL ECONOMY OF LOCAL GOVERNANCE To explain the effects of government leadership and societal pressure it is nec-essary to take a detailed look at the political economy of local governance. The analysis of sub-national actors and their interests starts with an acknowledgment of Indonesia’s historical context. Clearly, decentralisation and democratisation took place not on a ‘blank slate’, but on an authoritarian foundation spanning the period from the Javanese kingdoms through Dutch colonialism (1619–1942) to Soeharto’s New Order (1965–98). It is well known that the New Order regime sys-tematically suppressed political and societal movements (Crouch 1978; Thee, Hof-man and Rodrick-Jones 2004) and established patronage networks that reached from the presidency down to the village level (Liddle 1996; McLeod 2000). The high level of corruption and preferentialism – readily observable in the irregulari-ties of public recruitment and contracts revealed by our survey – confi rms that democratic norms compete with patrimonial conventions.
TABLE 7 Local Governance Evaluation of Leadership Cases in West Sumatra and Central Javaa
Province West Sumatra Central Java
District Solok Pesisir Kebumen KlatenReform-oriented leadership level High Low High Low
1 Tax-induced distortions (distortion in new tax bills) Rating
None ´´´´´
Very strong ´
None ´´´´´
Fair ´´´
2 One-stop services (observation score, 1 to 5) Rating
4.2´´´´
1.7´´
2.5 ´´´
1.0´
3 Administrative effi ciency (licence processing, in days) Rating
7´´´´´
10´´´´
16´´´
16´´´
4 Public recruitment corruption (reported mean, Rp million) Rating
0´´´´´
23´´
6´´´
65´
5 Licensing corruption (% of offi cial fees) Rating
2.9´´´´
7.4´´
9.8´´
8.4´´
Overall evaluationAverage rating (stars)
Very good(4.6)
Poor(2.2)
Fair(3.2)
Poor (2.0)
a Summary evaluation ratings range from very poor (1 star) to very good (5 stars); evaluation scales are explained in detail in appendix 1.
Source: Author’s business surveys, interviews and observations.
Dow
nloa
ded
by [
The
Uni
vers
ity O
f M
elbo
urne
Lib
rari
es]
at 2
0:26
02
Apr
il 20
14
222 Christian von Luebke
As I will argue in this section, initial impulses for improvements in govern-ment are most likely to come from district heads. Indonesia’s regime change has not only further enlarged the offi cial powers of district leaders, but also provided them with new incentives to improve governance. Reform impulses from societal forces, on the other hand, remain less signifi cant: in Indonesia’s early transition to democracy, local fi rms, associations and council members continue to be con-strained by collective action problems and perverse political incentives.
In order to illustrate the constraints facing local fi rms it is helpful to distin-guish three groups: fi rst, a very large group of small indigenous fi rms – local trad-ers, shop-keepers and craftsmen – of various ethnic origins and representing a large part of civil society; second, a small group of ethnic-Chinese fi rms, engaged mainly in wholesale and retail trade; and third, a small group of large indigenous fi rms that generate revenue from construction, procurement, resource extraction and manufacturing. In relation to the fi rst group, fi eld observations suggest that small fi rms are constrained by common collective action problems and deep-seated risk aversion. First, consistent with Mancur Olson’s (1965) argument, this group’s large and dispersed structure hinders attempts to organise (high coordi-nation costs) and enforce (high detection costs) joint activities among small fi rms. As a result, individual members tend to free-ride on others’ efforts and render joint initiatives ineffective. Second, small fi rms remain sceptical about the effec-tiveness of reform petitions. Based on their experiences during the Soeharto era, many interviewees concur that the personal risks involved in criticising govern-ment shortcomings clearly outweigh the possible benefi ts of doing so. Even today, a majority of small fi rms share the view that their complaints fall on deaf ears – or, worse, evoke bureaucratic retaliation.
Scepticism is equally strong among Chinese Indonesian fi rms. Notwithstand-ing their small and coherent group structure, which allows for effective collec-tive action, ethnic Chinese communities strictly refrain from engaging in public debate. This cautious behaviour emerges as a response to social hardship in recent decades. Many of the local Chinese fi rms (particularly in NTB and Java) report experience of ethnic violence and discriminatory treatment. Some witnessed anti-communist and anti-Chinese riots in the 1960s; others experienced anti-Chinese demolition and looting in the late 1990s. Against this background of social vul-nerability, Chinese minorities are concerned primarily with maintaining friendly and stable relationships with local power-holders. As one Chinese entrepreneur in Kebumen summarises it: ‘Many Chinese people are afraid to speak out in pub-lic. They believe that criticising offi cials harms their business … Anxieties have strongly increased since Chinese shops were burnt down in the 1998 riots.’ Thus, despite their economic power in rural economies,20 Chinese business communities are reluctant to participate in societal efforts to improve government outcomes.
Apart from social vulnerabilities, there are also monetary disincentives to pressing for reform. These are particularly obvious in the case of large indigenous fi rms. In light of the small size of rural consumer markets, many indigenous entrepreneurs in the eight districts studied derive a substantial proportion of their
20 In Bima, for instance, most supermarkets, restaurants and hotels are in the hands of ethnic Chinese. Also in Lotim, Klaten, Kebumen, Gianyar and Karangasem, respondents report that Chinese entrepreneurs dominate local markets.
Dow
nloa
ded
by [
The
Uni
vers
ity O
f M
elbo
urne
Lib
rari
es]
at 2
0:26
02
Apr
il 20
14
The political economy of local governance: fi ndings from an Indonesian fi eld study 223
revenue from public sector contracts. Government projects remain very attractive, as they promise high returns and involve relatively low risks. Against this back-drop, it is unsurprising to fi nd that many large fi rms prefer to maintain close ties with government offi cials rather than to criticise administrative shortcomings. As one businessman in Bima noted, ‘government contracts for the construction of local schools, hospitals and roads are so lucrative that they easily compensate for the costs of bad governance’. Especially in the absence of credible law enforce-ment, fi rms involved in public sector projects have stronger incentives to cooper-ate (or collude) with government offi cials than to push for administrative reform. Indeed, one of the objectives of reform is fair procurement, which would result in more genuine competition for – and lower profi ts from – government contracts.
A lack of reform pressure is also evident in local chambers of commerce and industry (Kadinda). With the public tender legislation introduced by the Mega-wati administration,21 local Kadinda units lost much of their former infl uence: the discontinuation of their coordination function and the lack of tangible services for business communities resulted in sharp declines in membership. Even relatively active chambers such as those in Bima and Gianyar seem to have had limited success in mobilising the private sector in support of reform initiatives. The direc-tor of Bima’s Kadinda, for instance, acknowledges that joint activities often fail because chamber members lack cohesion. Despite the introduction of democratic rights, he contends, ‘many fi rms avoid anything that may cause friction with gov-ernment offi cials – either because they are socially vulnerable or because they have large stakes in public contracts’.
Perverse incentive structures have also undermined representative functions in district councils (DPRD). In the fi rst years of decentralisation, the combination of centralised party structures and non-transparent compilation of party lists nota-bly weakened local electoral accountability. Studies show that national party elites continue to exert great infl uence on local politics, particularly through the com-pilation of local party lists (Sherlock 2004; Ufen 2008). The persistence of political centralisation can be attributed partly to the stipulations of the electoral laws. The 1999 parliamentary elections were based on ‘closed party lists’, which gave voters no choice between candidates and provided national parties with ample room to establish clientelistic networks with local politicians. Even the ‘semi-open list’ elections in 2004, which introduced candidate names onto the ballet paper, pre-served the infl uence of national party boards, because electoral outcomes contin-ued to be biased heavily towards top-listed candidates.22 According to local NGO
21 New public tender regulations were outlined in Presidential Decrees (Keppres) 18/2003 and 80/2003.
22 Sherlock (2004: 40) explains how the electoral rules disadvantaged low-listed candidates in the 2004 elections: consider a situation where ‘Party B receives 50,000 votes in an electoral district. The quota for that district is 50,000 votes – therefore Party B is allocated 1 seat. Can-didate 1 on the party list receives no individual votes. Candidate 4 on the party list receives 49,000 votes (i.e. just under the quota). [As a result] Candidate 1 is elected, despite having received no individual votes’, whereas Candidate 4 loses all his votes to the top-listed can-didate (and does not take a seat). A December 2008 Constitutional Court ruling abolishing party-internal vote transfers reduced this list-position bias in the 2009 elections, but party boards still wield considerable power by determining which candidates appear on the lists.
Dow
nloa
ded
by [
The
Uni
vers
ity O
f M
elbo
urne
Lib
rari
es]
at 2
0:26
02
Apr
il 20
14

224 Christian von Luebke
and media observers, these clientelistic party structures have created a situation where list positions are auctioned off to local candidates who make considerable ‘donations’ to party headquarters. In the absence of punitive voting mechanisms, many DPRD politicians were preoccupied with managing internal party relations and campaign funding – often through illegitimate means23 – and often neglected the interests of local constituencies.
District heads, on the other hand, face incentives that align them more closely with local citizens, for three basic reasons. First, government leaders stand in the spotlight of local and national media. In contrast with council members, whose actions can be obfuscated by party agreements and coalitions, district heads’ achievements and failures are more clearly discernible in local news reports. Sec-ond, and relatedly, Indonesia’s decentralisation reforms have prompted a nota-ble rise in the number of donor-funded governance projects, with corresponding opportunities to gain national acknowledgment and additional project funding.24 Third, the introduction of direct elections for district heads (pilkada) in 2004 has provided those elected with additional political incentives to attend to broad-based interests. In contrast to the non-transparent party-list system of DPRD elec-tions, the plurality (fi rst past the post) system of the pilkada exposes government leaders to greater electoral competition. Above all, it enables local citizens to vote out non-performing or corrupt district heads.
Motivated by electoral pressure, media exposure and donor funding, some dis-trict heads have attended closely to the interests of society in general and small business owners in particular. The case evidence suggests that district heads who are imbued with political ambition and good managerial skills have been strong driving forces for policy reform. Consistent with reformist leadership accounts in other Asian, Latin American and African transition countries (Grindle 2004; 2007; Gray and McPherson 2001; Mahbubani 2007), the district heads in Solok and Kebumen have skilfully used their offi cial powers to forge strategic reform pacts. They have successfully aligned the interests of local communities and national supporters and, in doing so, have created a valuable momentum to break bureau-cratic resistance to government reforms. Backed by these reform coalitions, they have employed an effective mix of monitoring (call-in talk shows, SMS com-plaint boxes); penalties (demotion and dismissal of corrupt staff); and reward systems (merit-based promotion, performance awards) to improve bureaucratic practices.
23 Between 1999 and 2006, Indonesia Corruption Watch (ICW) identifi ed over 80 DPRD corruption cases – amounting to a total welfare loss of roughly $50 million (DRSP 2006: 118).
24 As the two examples in Solok and Kebumen illustrate, projecting a ‘reformist image’ can be a promising strategy for attracting fi nancial support from donor agencies. Between 2000 and 2005, district heads Rustriningsih of Kebumen and Gamawan of Solok formed good-governance partnerships with The World Bank, USAID and the German aid agency GTZ. Both heads were repeatedly invited to conferences and study tours. District head Gamawan, for instance, attended the International Anti-Corruption Conference in Seoul in 2004 (fi nanced by German donors) and the International City Management Conference in San Diego in 2005 (fi nanced by USAID).
Dow
nloa
ded
by [
The
Uni
vers
ity O
f M
elbo
urne
Lib
rari
es]
at 2
0:26
02
Apr
il 20
14
The political economy of local governance: fi ndings from an Indonesian fi eld study 225
The fi nding that district heads are well positioned and motivated to push for public reforms should not lead to the conclusion that societal forces are irrelevant. Quite the contrary is true. Although district heads initiate reform coalitions, soci-etal groups constitute an important pillar within these coalitions. And although common channels of societal pressure – local fi rms, business associations and district councils – are currently compromised by perverse incentive structures, local citizens nonetheless play a key role in monitoring bureaucratic practices and signalling shortcomings to local government leaders. Moreover, as local democ-racy and information technology progress, local citizens will increasingly compare the performance of their incumbents with other benchmark cases. Although Indo-nesia may have been endowed with a mere handful of reformist district heads at the outset of decentralisation, succeeding election cycles and rising political awareness are likely to encourage better leadership standards over time. More-over, since the Constitutional Court abolished the dysfunctional DPRD list system in December 2008, there is hope that local council members will provide addi-tional checks and balances.
CONCLUSIONS AND POLICY IMPLICATIONS Have Indonesia’s democratic decentralisation reforms led to improvements in local governance? The answer offered in this study is ‘yes’, but only in some dis-tricts. Both nation-wide snapshots and case study results indicate that overall per-formance levels remain relatively low. During the fi rst years of decentralisation, many districts continued to exhibit high levels of tax distortion, red tape and pub-lic corruption. Beneath this aggregate perspective, however, we fi nd considerable variation. While some local governments have provided effi cient and responsive services, others have burdened local economies with administrative uncertainty, ineffi ciency and extortion.
These district-level variations refl ect ongoing dynamics in local political econo-mies. In the early years of decentralisation, local actors have been exposed to both democratic and non-democratic norms – with free elections and rights of associa-tion on the one hand and pervasive preferentialism and patronage on the other. The case fi ndings in Bali and NTB show that societal pressures from local fi rms, business associations and council members are less signifi cant as an infl uence on local governance than traditional good-governance literatures suggest. For most local fi rms, the benefi ts of engaging in reform efforts rarely justify the costs of doing so: this holds true for small business owners who face high coordination and retaliation costs, for Chinese Indonesian entrepreneurs who foresee dispro-portionate social risks, and for large construction and procurement fi rms that expect high benefi ts from sustaining close government ties. Thus far, neither local business chambers nor district councils have provided the means to solve these incentive problems. The former have been weakened by a declining mandate and membership, whereas the latter have been attending more to party elites than to local citizens.
Local government leaders, on the other hand, have stronger incentives to push for policy reform. The fi eld interviews indicate that district heads increasingly realise that ‘reformist agendas’ attract voter support, national acknowledgment and donor funding, thereby enhancing prospects for career advancement. Reform
Dow
nloa
ded
by [
The
Uni
vers
ity O
f M
elbo
urne
Lib
rari
es]
at 2
0:26
02
Apr
il 20
14
226 Christian von Luebke
orientations have been strengthened further by the introduction of direct elec-tions for district heads and the growth of independent media. Government lead-ers are increasingly scrutinised by local journalists and, unlike their legislative colleagues, require a majority vote to attain offi ce. Responding to these politi-cal incentives, the district heads of Solok and Kebumen have become catalysts for change, translating citizen interests into policy initiatives, sustaining reform momentum with local and national support networks and supervising the prac-tices of district bureaucracies. The results of these efforts are readily observable in the controlled case comparisons. The case studies in West Sumatra and Central Java demonstrate that higher leadership qualities are accompanied by less distor-tionary tax regulations, more effi cient administrative services and more effective controls on corruption.
The fi ndings of this study carry several implications for scholarship and policy. In the context of current governance debates, the empirical results chal-lenge the view that government improvements and public reform are primarily the result of demand-side pressures. After 30 years of social and political sup-pression, Indonesian citizens need time to gain confi dence in democratic values. As long as societal actors remain dependent on the goodwill and patronage of government offi cials, they are ill-positioned to push for improvements in gov-ernance. Field observations indicate that many public sector jobs, government contracts and party-list positions have continued to be allocated on the basis of non-transparent, elite-centric agreements. Thus, in early post-authoritarian tran-sitions, where democratic norms co-exist with patrimonial conventions, it is not so much the pressure of societal groups as the presence of good (or bad) leader-ship that explains local policy outcomes.
The signifi cance of government leadership should not, however, lead to the conclusion that societal factors are irrelevant. The case fi ndings from Solok and Kebumen show that district heads increasingly respond to public opinion and electoral incentives. Arguably, incentives for reformist leadership become more pronounced with rising transparency and societal awareness. Policy measures that make local government performance more comparable and competitive are likely to encourage public reform in other Indonesian districts. These measures may include more widely disseminated good governance rankings,25 a functional framework for local ‘minimum service standards’ (in education, health and infra-structure services) and an expansion of support programs for independent and investigative journalism.
25 Sub-national performance indicators can be drawn from the World Bank (2007) Public Finance Management Framework, the KPPOD (2008) local economic governance survey, the Jawa Pos Institute of Pro-Otonomi (JPIP 2008) rankings and the LPEM–FEUI (2007) in-vestment climate assessment, just to name a few sources.
Dow
nloa
ded
by [
The
Uni
vers
ity O
f M
elbo
urne
Lib
rari
es]
at 2
0:26
02
Apr
il 20
14
The political economy of local governance: fi ndings from an Indonesian fi eld study 227
REFERENCES Anwar, K. (2001) ‘Kembalikan predikat Bima lewat hasil bumi [Revitalizing Bima’s agri-
cultural trademarks]’, Kompas, 21 November: 23.Azis, I. (2003) Concepts and practice of decentralization: some notes on the case of Indo-
nesia, Paper prepared for the Permanent Mission of Indonesia to the United Nations, New York NY.
Bachyul, S. (2004) ‘Gamawan Fauzi, pioneering regent’, Jakarta Post, 24 September: 5.Boix, C., Adsera, A. and Payne, M. (2003) ‘Are you being served? Political accountability
and quality of government’, Journal of Law, Economics, and Organization 19 (2): 445–90.Chambers, R. (1995) ‘Poverty and livelihoods: whose reality counts?’, Environment and
Urbanization 7 (1): 173–204.Cochrane, J. (2004) ‘Looking for a real leader; when it comes to talent at the top, Indo-
nesians have to wait’, Newsweek International, 8 March: 2.Crouch, H. (1978) The Army and Politics in Indonesia, Cornell University Press, Ithaca NY.DRSP (Democratic Reform Support Program) (2006) ‘Decentralization 2006: stock taking
on Indonesia’s recent decentralization reforms’, USAID (US Agency for International Development) Democratic Reform Support Program, Jakarta.
Gray, C. and McPherson, M. (2001) ‘The leadership factor in African policy reform and growth’, Economic Development and Cultural Change 49 (4): 707–40.
Grindle, M.S. (2004) Despite the Odds: Contentious Politics and Education Reform, Princeton University Press, Princeton NJ.
Grindle, M.S. (2007) Going Local: Decentralization, and the Promise of Good Governance, Princeton University Press, Princeton NJ.
Hellman, J. (1998) ‘Winners take all: the politics of partial reform in post-communist transi-tions’, World Politics 50 (2): 203–34.
Hirschman, A.O. (1970) Exit, Voice, and Loyalty: Responses to Decline in Firms, Organizations, and States, Harvard University Press, Cambridge MA.
JPIP (The Jawa Pos Institute of Pro-Otonomi) (2007) Otonomi Award 2007: Mentradisikan Kompetisi Memintas Kemajuan [Autonomy Award 2007: Establishing Competition to Accelerate Progress], JPIP, Surabaya.
Kaufmann, D., Mehrez, G. and Gurgur, T. (2002) Voice or Public Sector Management? An Empirical Investigation of Determinants of Public Sector Performance, World Bank, Wash-ington DC.
Kaufmann, D. and Wei, J. (1999) ‘Does “grease money” speed up the wheels of commerce?‘, Working Paper No. 7093, National Bureau of Economic Research (NBER), Cambridge MA.
King, G., Keohane, R.O. and Verba, S. (1994) Designing Social Inquiry: Scientifi c Inference in Qualitative Research, Princeton University Press, Princeton NJ.
Klitgaard, R. (1998) Controlling Corruption, University of California Press, Berkeley CA.KPPOD (Komite Pemantauan Pelaksanaan Otonomi Daerah, Regional Autonomy Watch)
(2004a) Kajian Textual Perda Pajak dan Retribusi Daerah [Contextual Assessment of Local Taxes and Levies], Unpublished report, KPPOD, Jakarta.
KPPOD (Komite Pemantauan Pelaksanaan Otonomi Daerah, Regional Autonomy Watch) (2004b) Daya Tarik Investasi Kabupaten/Kota di Indonesia 2003: Persepsi Dunia Usaha: Peringkat 200 Kabupaten/Kota di Indonesia (Regional Investment Attractiveness 2003: A Survey of Business Perception: Rating of 200 Districts/Municipalities in Indonesia), KPPOD and The Asia Foundation, Jakarta, viewed 13 June 2009 at <http://kppod.org/ind/datapdf/rating/2003/rating2003.pdf>.
KPPOD (Komite Pemantauan Pelaksanaan Otonomi Daerah, Regional Autonomy Watch) (2005) Daya Tarik Investasi Kabupaten/Kota di Indonesia 2004 (Regional Investment Attrac-tiveness 2004: A Survey of 214 Districts/Municipalities in Indonesia), KPPOD, Jakarta.
Dow
nloa
ded
by [
The
Uni
vers
ity O
f M
elbo
urne
Lib
rari
es]
at 2
0:26
02
Apr
il 20
14
228 Christian von Luebke
KPPOD (Komite Pemantauan Pelaksanaan Otonomi Daerah, Regional Autonomy Watch) (2008) Local Economic Governance: A Survey in 243 Regencies and Cities in Indonesia, KPPOD, Jakarta.
Kuncoro, A. (2004) ‘Bribery in Indonesia: some evidence from micro-level data’, Bulletin of Indonesian Economic Studies 40 (3): 329–54.
Leff, N.H. (1964) ‘Economic development through bureaucratic corruption’, American Behavioral Scientist 8 (3): 8.
Lewis, B.D. (2003) ‘Tax and charge creation by regional governments under fi scal decen-tralisation: estimates and explanations’, Bulletin of Indonesian Economic Studies 39 (2): 177–92.
Lewis, B.D. and Suharnoko, B. (2009) ‘Local tax effects on the business climate’, in Rural Investment Climate in Indonesia, ed. N. McCulloch, Institute of Southeast Asian Studies, Singapore: 224–45.
Liddle, R.W. (1996) Leadership and Culture in Indonesian Politics, Allen and Unwin, Sydney.LPEM–FEUI (Institute for Economic and Social Research, Faculty of Economics, University
of Indonesia) (2002) Ketidakpastian Usaha di Indonesia: Dampak dari Otonomi Daerah dan Suap [Business Uncertainty in Indonesia: Impact of Regional Autonomy and Bribery] (‘Cost of Doing Business Survey’), LPEM–FEUI, Jakarta.
LPEM–FEUI (Institute for Economic and Social Research, Faculty of Economics, University of Indonesia) (2007) Monitoring Investment Climate in Indonesia: A Report from the Mid 2006 Survey, LPEM–FEUI, Jakarta.
Lui, F.T. (1985) ‘An equilibrium queuing model of bribery’, Journal of Political Economy 93 (4): 760–81.
Mahbubani, K. (2007) ‘From Confucius to Kennedy: principles of East Asian governance’, in East Asian Visions: Perspectives on Economic Development, eds I. Gill, Y. Huang and H. Kharas, World Bank, Washington DC: 188–203.
McLeod, R.H. (2000) ‘Government–business relations in Soeharto’s Indonesia’, in Reform and Recovery in East Asia: The Role of the State and Economic Enterprise, ed. P. Drysdale, Routledge, London: 146–68.
Olson, M. (1965) The Logic of Collective Action: Public Goods and the Theory of Groups, Harvard University Press, Cambridge MA.
Perlez, J. (2003) ‘An Indonesian leader wins attention for her clean politics’, New York Times, 8 September: 6.
Putnam, R. (1993) Making Democracy Work: Civic Traditions in Modern Italy, Princeton Uni-versity Press, Princeton NJ.
Ray, D. (2003) ‘Decentralization, regulatory reform and the business climate’, in Proceed-ings of the Conference on Decentralization, Regulatory Reform and the Business Climate, ed. D. Ray, Partnership for Economic Growth – US Agency for International Development (PEG–USAID), Jakarta: 1–40.
Rice, R. (2000) ‘Small enterprises as an essential part of the Indonesian development strat-egy’, PEG Policy Paper 18, Partnership for Economic Growth, Jakarta.
Rodrik, D. (1996) ‘Understanding economic policy reform’, Journal of Economic Literature 34 (1): 9–41.
Rustiani, F. (2003) ‘Izin: mampukah melindungi masyarakat dan seharusnya beban siapa? [Licences: can they protect society – and whose responsibility are they?]’, in Proceed-ings of the Conference on Decentralization, Regulatory Reform and the Business Climate, ed. D. Ray, Partnership for Economic Growth – US Agency for International Development (PEG–USAID), Jakarta: 71–83.
Schulte Nordholt, H. (2005) ‘Decentralisation in Indonesia: less state, more democracy?’, in Politicising Democracy: Local Politics and Democratisation in Developing Countries, eds J. Harriss, K. Stokke and O. Tornquist, Palgrave Macmillan, Basingstoke: 29–50.
Dow
nloa
ded
by [
The
Uni
vers
ity O
f M
elbo
urne
Lib
rari
es]
at 2
0:26
02
Apr
il 20
14
The political economy of local governance: fi ndings from an Indonesian fi eld study 229
Sherlock, S. (2004) ‘The 2004 Indonesian elections: how the system works and what the parties stand for’, Working Paper No. 1 (February), Centre for Democratic Institutions, Australian National University, Canberra.
Simanjuntak, R. (2005) Rural investment climate and regional taxes and licensing proce-dures, Working Paper, Rural Investment Climate Assessment, University of Indonesia, Jakarta (mimeo).
SMERU (Social Monitoring and Early Response Unit) Research Institute (2001) Regional Autonomy and the Business Climate: Three Kabupaten Case Studies from North Sumatra, SMERU, Jakarta.
Tagukawi, D. (2003) ‘Kadin: 73 persen Perda bermasalah [Indonesian Chamber of Com-merce: 73 percent of local regulations problematic]’, Sinar Harapan, 6 April: 4.
Thee Kian Wie, Hofman, B. and Rodrick-Jones, E. (2004) ‘Indonesia: rapid growth – weak institutions’, Policy Working Paper, World Bank, Washington DC.
Ufen, A. (2008) ‘From aliran to dealignment: political parties in post-Suharto Indonesia’, South East Asia Research 16 (1): 5–41.
UNDP (United Nations Development Programme) (2001) Indonesia Human Development Report 2001: Towards a New Consensus - Democracy and Human Development in Indonesia, UNDP, Jakarta.
World Bank (2002) Indonesia Governance and Development Survey, World Bank, Washington DC.
World Bank (2003) Decentralizing Indonesia: A Regional Public Expenditure Review, East Asia Poverty Reduction and Economic Management Unit, World Bank, Jakarta.
World Bank (2006) Revitalizing the Rural Economy: An Assessment of the Investment Climate Faced by Non-Farm Enterprises at the District Level, World Bank, Jakarta.
World Bank (2007) Public Financial Management in Aceh: Measuring Financial Management Performance in Aceh’s Local Governments, World Bank, Jakarta.
World Bank (2008) Doing Business 2009: Comparing Regulation in 181 Economies, World Bank, Washington DC.
Dow
nloa
ded
by [
The
Uni
vers
ity O
f M
elbo
urne
Lib
rari
es]
at 2
0:26
02
Apr
il 20
14
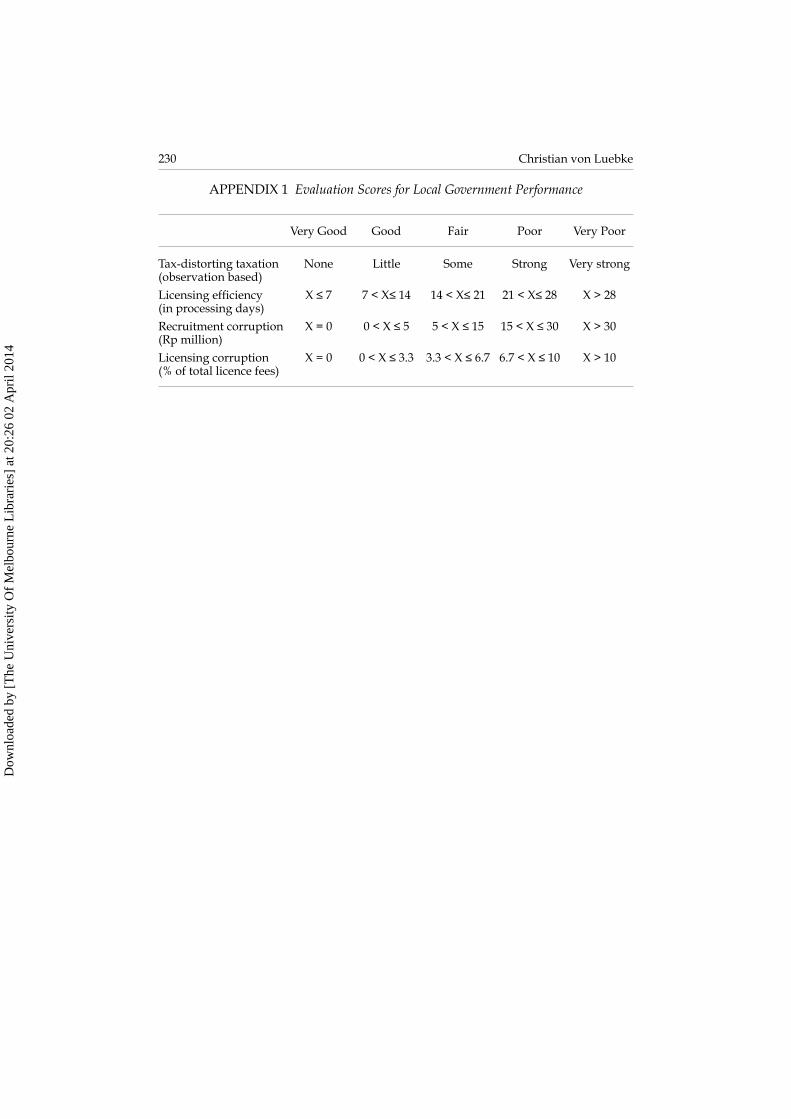
230 Christian von Luebke
APPENDIX 1 Evaluation Scores for Local Government Performance
Very Good Good Fair Poor Very Poor
Tax-distorting taxation(observation based)
None Little Some Strong Very strong
Licensing effi ciency (in processing days)
X ≤ 7 7 < X≤ 14 14 < X≤ 21 21 < X≤ 28 X > 28
Recruitment corruption(Rp million)
X = 0 0 < X ≤ 5 5 < X ≤ 15 15 < X ≤ 30 X > 30
Licensing corruption (% of total licence fees)
X = 0 0 < X ≤ 3.3 3.3 < X ≤ 6.7 6.7 < X ≤ 10 X > 10
Dow
nloa
ded
by [
The
Uni
vers
ity O
f M
elbo
urne
Lib
rari
es]
at 2
0:26
02
Apr
il 20
14