Embed Size (px)
Citation preview
1
The Political Economy of Private Firms in China*
Di Guo, University of Hong Kong
Kun Jiang, University of Hong Kong
Byung-Yeon Kim, Seoul National University
Chenggang Xu, University of Hong Kong
June 2013
Abstract
The sweeping change in political economy associated with the spectacular growth of the private sector in China is not much studied in economics literature. This paper fills in this gap. The central subject of this paper is the political economy nature of the Chinese private sector and of the CPC. Empirically, we examine the dynamics of rent creation from the party membership and other political connections when the regime is changed from anti-capitalistic to pro-capitalistic. Endogeneity problems are addressed. We identify the causality of rents and private entrepreneurs’ political connections, and explore the implications of these political elites’ rents for social welfare in terms of productivity.
Keywords: Party membership, China, political connections, private firms
*: The earlier versions of this paper were presented at University of Hong Kong, Seoul National University, Kyoto Institute of Economic Research, and Sogang University. The authors are grateful for valuable comments and suggestions by the participants of the seminars and the conferences. B-Y Kim and Chenggang Xu acknowledge that this work was supported by grant No. R32-2009-000-20055-0 from the World Class University (WCU) project of the Ministry of Education, Science & Technology (MEST) and the National Research Foundation of Korea (NRF) through Seoul National University.
2
"My property, even my life, belongs to the Party. This is the quality a Communist must have”
-- Liang Wengen (12 Nov 2012, Guangming Daily) Founder and CEO of the Sany Group The richest person in China in 2011 Deputy of the 17th,18th CPC National Congress
I. Introduction
The spectacular growth of the private sector in China, which started from scratch in the 1990s, is well documented. This growth would not be possible to occur without changes in politics. However, the sweeping change in political economy associated with this growth is not much studied empirically in economics literature. This paper fills in this gap.
Without a surprise, the first amended version of the Constitution of the Communist Party of China (CPC) when “the reform” started is unambiguously anti-capitalism. It declares, “[t]he proletariat dictatorship will inevitably replace the dictatorship of bourgeoisie…Basically, the socialist system has incomparable superiority over the capitalist system …” (The CPC Constitution, 1982). Consistently, the reform agenda did not allow for setting up private firms, neither for privatization, and the private sector counted for zero percent of the Chinese GDP. But the reform agenda has transformed, both the CPC constitution and the state constitution were amended one more time in 20021 and 2004 respectively, and the institutions were changed (for reasons of these changes see Xu, 2011). Party members are now encouraged to become private entrepreneurs. As a result, now private sector counts for more than half of the Chinese GDP. Moreover, ironically, most of the richest people in China are Communist Party members and many of those are selected (not elected) to the People’s Congress, the legislator. Yet most striking phenomenon is that China’s National People’s Congress becomes far the wealthiest in the world, even with a highly incomplete and heavily underestimated data about these elites. The total wealth of the richest 70 People’s Congress members in China is US$90 billion, which is 12 times that of the total wealth of all the members in the Congress, the Supreme Court and the White House of the U.S., which is US$7.5 billion (Bloomberg, 27/2/2012).
The central subject of this paper is the political economy nature of the Chinese private sector and of the CPC. For this purpose, we examine the dynamics of rent creation from the party membership and other political connections when the regime is changed from anti-capitalistic to pro-capitalistic. Since the Party is the dominant force both in politics and in the national economy in China (next section will elaborate this point), political connections in this paper are captured by a membership of the Communist Party of China (CPC) or a People’s Congress (PC) membership.2 And we use the
1 “We must and we are determined to encourage, support and guide the development of the nonpublic sectors of the economy…’ ‘ nonpublic sectors are important elements of the socialist market economy…”(Jiang Zhemin Speech at the 16th CPC National Congress, 2002). 2 A PC member may not be a CPC member, but he/she must be pro-CPC since all the PC members are selected by the CPC. Moreover, in terms of social status and power, an average PC member is at higher level elite than an average CPC
3
terms “political connection” and “political elites” interchangeably. The major questions to be addressed are the following. Comparing with non-political elite entrepreneurs, do political elite entrepreneurs enjoy rents when they enter the private sector in the old regime (before 2002)? And what happened in the new regime (after 2002)? This paper will identify the causality of rents and private entrepreneurs’ political connections, and will explore the implications of these political elites’ rents for social welfare in terms of productivity.
There is an extensive literature on the relationships between political connections and economic variables. A group of economists investigate the economic value of political connections. In a seminal paper, Fisman (2001) finds that the Suharto’s health-related events caused significant loss in the return on the price of the securities of politically connected firms. By extending the scope of investigation to 47 countries, Faccio (2006) suggests that the announcement of entering politics by officers or large shareholders of a company is positively associated with cumulative abnormal return which varies depending upon political power. This line of research applied to various countries in different settings: late Victorian Britain (Braggion and Moore, 2011), a longitudinal dataset of Italian companies (Cingano and Pinotti, 2009), Russia’s politically connected firms receiving preferential treatments by regional laws and regulations (Slinko, Yakovlev and Zhuravskaya, 2005), and U.S. firms connected to Geithner as a nominee for Treasury Secretary by President Obama (Acemoglu, Johnson and Kermani, 2010).
Another group looks at the effect of political connections on access to bank loans and government subsidies. Using data from Pakistan, Khwaja and Mian (2005) claim that politically-connected firms are able to borrow 45 percent more but they are more likely to default by 50 percent in comparison with ones without political connections. Johnson and Mitton (2003) and Faccio, Masulis and McConnell (2006)’s findings support that political connections affect government or bank decisions. The former presents results that the decision on government subsidies is associated with political connections while the latter shows that politically connected firms are more likely to be bailed out.
A multiple number of sociological studies document the potential advantages of being a party member in China. Evidence documented by Walder (2000) shows that joining the party is a necessary condition to become a leader in China. Li and Walder (2001) find that joining the Party at earlier careers makes the difference. In more detail, those who have become a party member at early time of their careers are found to have significantly higher chances to become social elites while those who are already successful before joining the Party would not make the difference in their career by joining the Party. Bian (2001) suggests that everything being equal, i.e. controlling for talents and education/experience backgrounds etc., Party members have higher chances than non-Party members to become top managers in state-owned firms. By investigating the changes after the massive purges of the “Cultural Revolution”, Walder and Hu (2009) find that party elites, particularly their offspring, recovered much more quickly than others.
member.
4
Political connections and their associated economic performance among Chinese firms have attracted attention from economists. Using the listed firms, Fan et.al (2007) show that firms with politically connected top executives of newly partially privatized firms are less efficient than others in terms of post-IPO performance. In contrast, Peng and Luo (2007) and Francis et.al (2009) use listed data to show that political ties are beneficial to firms in terms of obtaining resources but these are efficiency enhancing. Li et al. (2008) find the positive effect of political connection on firm performance using one year cross-sectional data of private firms collected in 2002. Chen et al (2011) and Wu et al (2012) document the heterogeneous effects of political connections: performance of SOEs is negatively affected while that of private firms little or positively by political connections. Unlike works using cross sectional differences among Chinese firms, Calomiris, Fisman and Wang (2010) apply the event study method to firm level data, and find that the policy announcement of the sale of government-owned shares received a negative response in stock markets but the cancellation of such policy a symmetric a positive response.
Our project complements the literature in the following ways: First, it is the first paper that studies the change or the dynamics of political economy of Chinese private firms. Our approach provides a more credible identification of the impact of political connections on firm performance by showing that it depends critically on institutional settings, such as changes in constitutions. To our best knowledge, none of the current literature except Calomiris, Fisman and Wang (2010) looks at dynamics of the effects of political connections on economic variables.3 Second, this paper carefully addresses the endogeneity and identification problem. We instrument the Party members by the existence of party branches or party organizations within the firm. In addition, we use part of the data to exclude new party members from the sample to deal with reversed causality. We also show evidence about those who want to join the Party to further resolve the identification problem. Finally, the data we use, many years of nationwide random sampling survey firm level data of Chinese private sector in the years of 1995, 2000, 2006 and 2010, is unique in the literature.
Our major findings are summarized in the following. First, the politically connected elites did not enjoy statistically detectable rents before the amendment in Constitutions in 2002-2004. However, following the changes in Constitutions that recognized the private sector, political connections became a major determinant of access to bank loans. Second, political connections failed to improve firm performance. Rather, they are positively associated with paying themselves in a form of dividends.
The rest of the paper is organized as follows. In Section II, we discuss the institutional background about the Communist Party vis-à-vis the private sector. Section III discusses institutional background surrounding the amendment in the Constitution. Section IV introduces the data and provides the basic observations. Section IV shows our baseline results. Section V addresses the endogeneity and
3 A main difference between our paper and Calomiris, Fisman and Wang (2010) is that we look at a more fundamental change in Constitution on private property rights while the latter focuses on policy change on the sales of government-owned shares. In addition, Calomiris, Fisman and Wang (2010) apply the event study method that requires the efficiency of Chinese financial markets and the unexpected policy change. Our method using cross-sectional comparisons of firms across different periods do not need such assumptions.
5
the identification problem using an instrumental variable approach and excluding the sample that might be affected by reverse causality. Section VI concludes.
II. Institutional Background
It is well documented that the backbone of China’s institution is the Communist Party of China (CPC) (Xu, 2011). The Party controls all levels of governments, which directly determines or deeply influences the allocation of local resources, through personnel control. Moreover the party determines the appointments of all the most important posts in the state sector, like the CEOs and presidents of the major banks and largest state-owned enterprises. Almost all important posts are occupied by party members. The rest are occupied by party-trusted non-party members. Thus, being a party member, particularly being a veteran party member, facilitates opportunities for political connections, which can be used for business. This is particularly true for those who purposely cultivate the connections. Furthermore, the Party controls all levels of the legislature, the People’s Congress, from the national down to county, mostly through influences of selecting members of the congress. Literally, all non-party congress members must be party-trusted persons.
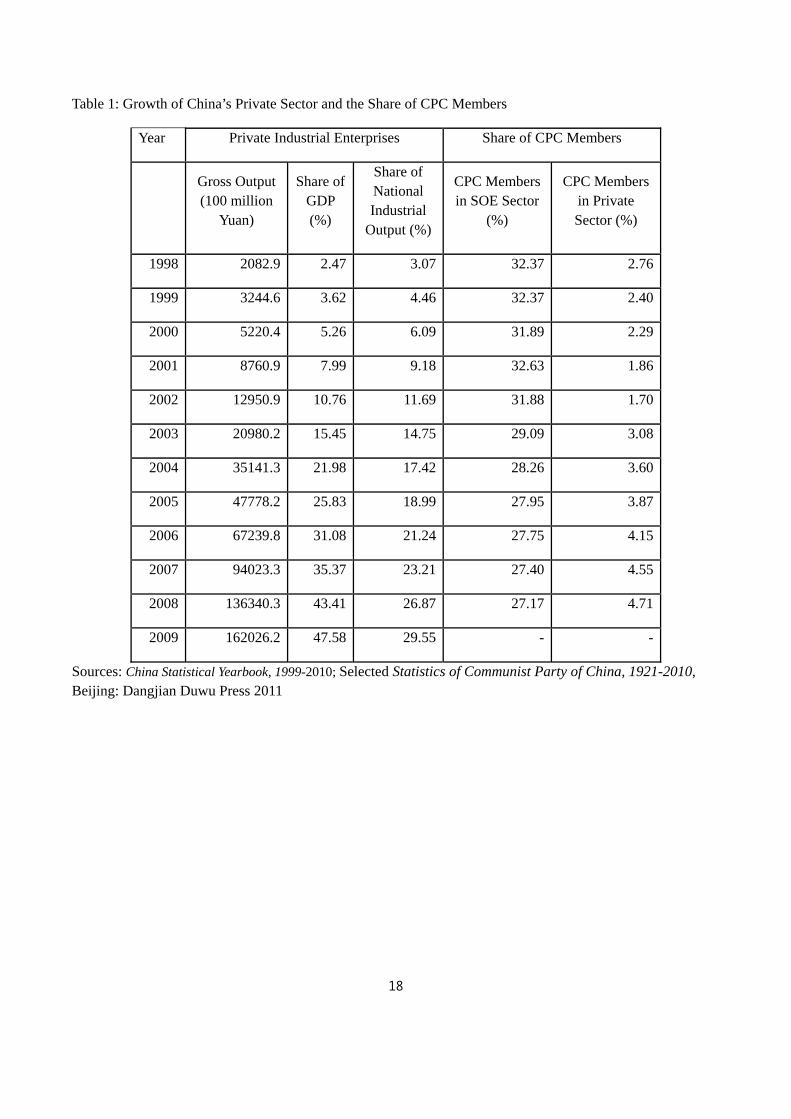
The Communist Party launched economic reform since 1978. The private sector was not allowed under the communist rule and a change in this policy was not in the reform agenda. The major development of private sector and privatization occurred after the mid-1990s when the state sector was in deep troubles (Xu, 2011). Once had a chance to grow, the private sector took off rapidly. From 1998 to 2005 the output of private sector increased by 20 times, and the share of the private sector in total GDP increased from only 2.5% in 1998 to nearly 50% in 2009, so it becomes the largest sector in the Chinese economy.
Becoming the major engine of Chinese economy out of reform agenda, the very fast growth of private sector surprised the party. From 1998 to 2002, when the private sector has expanded by six folds, the Party’s presence in terms of the number of members in the private sector was shrinking. The official nationwide statistics shows, the share of the party membership in the private sector declined by more than 36%, from 2.8% in 1995 to 1.7% in 2002 (Table 1). This is echoed by the fact that in the year 2000 only 17% of private firms in our sample have party organizations within the firm.4
These conflicting consequences between a fast economic growth resulted from the abrupt progress of private economy and the sign of the ruling party’s losing representation in the private sector are due to the self-conflicting institutions, which put private business in an illegal status or at least a disadvantageous status.
4 In 2004 the Financial Times reported that in Shanghai only 1.1% of the private firms had party organizations. One should keep in mind that the average size of the firms in our sample is larger than the average size of the firms in the population, thus it is over representing the firms which have established party branches.
6
Facing a fast growing private sector, which is rocking the social foundation of the CPC, Jiang Zemin, the Chairman of the Party and the President of the state, challenged the constitutions of the party and of the state. In his inspection tour in Guangdong province at the beginning of year 2000, he proclaimed that entrepreneurs should be recognized as “advanced productive force” (The CPC Maoming City Propaganda Department, 2002)5, that party members should be encouraged to become entrepreneurs and the Party should legitimately recruit entrepreneurs in a large scale. Two years later at the 16th National Congress of the Chinese Communist Party this principle is codified into the constitution of the party. Following this change, in 2004, the constitution of the state was also amended that the Chinese government will recognize and protect private property rights. Contradicting Marxism, the core spirit of communist ideology, this is the first time in the international communist movement history that capitalists are explicitly embraced by a communist party both ideologically and organizationally. This change not only reflects the Chinese Communist Party’s recognition of the growing importance of the private sector to China’s economy, but more importantly, it is a change of institution, and a change of business environment.
It is well-publicized that a large number of party elites have entered the private sector since the changes of constitutions. Our data confirms this (Table 3). It is also widely reported or alleged that political elites benefit from the political connections they have for obtaining scarce resources when they become private entrepreneurs. Furthermore, many non-party member entrepreneurs under the new environment might love to be recruited by the party-state (either joining the party or try hard to become a congressman), since by doing so they may improve their chances of accessing scarce resources.
The central question to be addressed by this paper is the impact of the change of laws and institutions on the relationship between political connections and economic rents. This dynamics is unexplored in the existing literature. The first question is, comparing with commoners do political elites enjoy rents when they enter the private sector in the old regime? And the same question for the new regime. Moreover, how did the relationship between political connections and economic rents evolve from the old regime to the new regime?
From our data, which are collected from nationwide random sampling surveys over 15 years, we find in the period of 1995 and 2000, the Party social elites did not enjoy statistically detectable rents. Controlled for all other factors (e.g. characteristics of individual, firm, industry and location etc.), the resources (such as bank loans) that they obtained are not different from other entrepreneurs. However, the political rent became significant. In 2006 and 2010 firms owned by Party members associated social elites obtained significantly more bank loans than others.
III. Data and Descriptive Statistics
5 The term “productive force” is a central concept in Marxism. The productive forces consist of means of production, and labor power. The central argument of Marxism is that advanced productive forces determine the progress of an economy, but capitalism inherently and ultimately prevents the advancement of productive forces.
7
The major data set used in this paper is four cross-sectional surveys on private sector in China. These surveys were conducted in 1995, 2000, 2006, and 2010 through face-to-face interviews. The survey questionnaires and sampling schemes were designed by a research team which involved economists and sociologists from the CAAS and some Chinese universities. The survey series was organized by a CPC central committee department, the United Front Work Department, and two ministry level central government agencies, The National Association of Industry and Commerce, and The State Administration for Industry and Commerce. This survey series is the largest of this kind in China that it has traced the development of the private sector nationwide since the sector emerges from scratch.
To make the survey be representative to the population of nationwide registered private firms, a stratified random sampling procedure is applied. The stratifications include locations, industries, stages of economic development, and distribution of the private firms in urban and rural areas within each location (a city or a county). The surveys covered more than one third of the cities in China. The sample size of the 1995 survey is 2,869, which are located in 160 cities; 3,073 from 129 cities for the survey in 2000; 3,837 from 109 cities for 2006; and 4,624 from 158 cities for 2010.
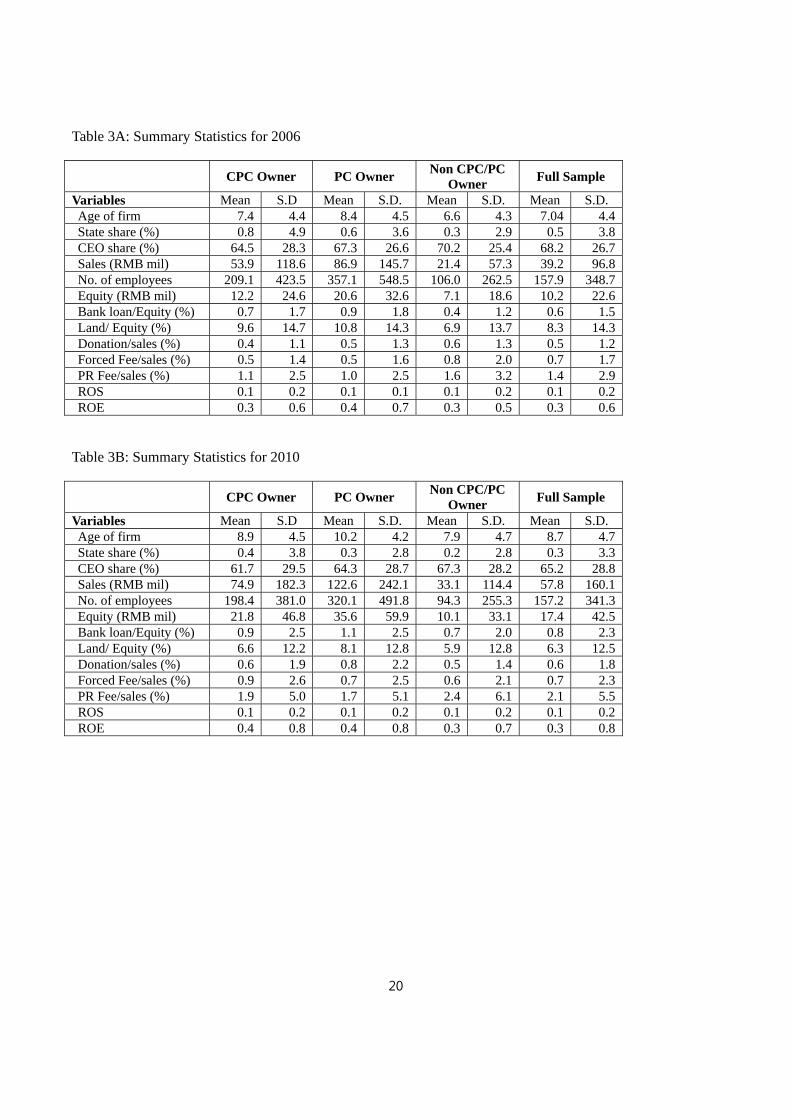
Tables 2A, 2B, 3A, and 3B are the summary statistics of the firms’ financial data over the four survey years. The statistics show that by average firms owned by CPC or PC members are larger than those by non CPC/PC owners in terms of sales, number of employees, and the value of equity for all the years. It is also noteworthy that by average CPC member owners and PC member owners obtain more bank loans (measured by bank loan to equity ratio) than other owners for the years of 2006 and 2010.
IV. Political Connections, Rents, and Firm Performance
Political Connections and Rents
The amendments of the Constitution of the party (the CPC) in 20026 and of the Constitution of the state (the PRC) in 20047 have transformed institutional settings for economic agents in China. Before the amendments, private entrepreneurship was not legal by state constitution and was in direct conflict with the party’s ideology and policy. Chinese private enterprises were formally discriminated against state-owned ones in terms of access to bank loan and other resources (Brendt and Li, 2003). For anyone with political capital, e.g. a PC member or a veteran party member
6 The key of this amendment is to recognize private entrepreneurs’ legitimate social status and encourage private entrepreneurship. 7 The key of this amendment is to recognize and protect private ownership, including private businesses.
8
working in a government agency or SOE, consider to convert his/her –self to become a private entrepreneur, he/she needed to weigh between the political/economic risks and economic gains, which might only be temporary.
In contrast, after the amendments of the two constitutions, when private entrepreneurship becomes legitimate and is encouraged, the risks and benefits for becoming an entrepreneur might be changed, at least formally. Moreover, given the monopolistic position of the government in controlling resources, those PC members or veteran party members might gain access to resources from their political connections. Hence, we hypothesize that, the period of 2003-2004 is a turning point that political connections became a significant factor in determining business advantages for those with connections, whereas was unlike before the period.
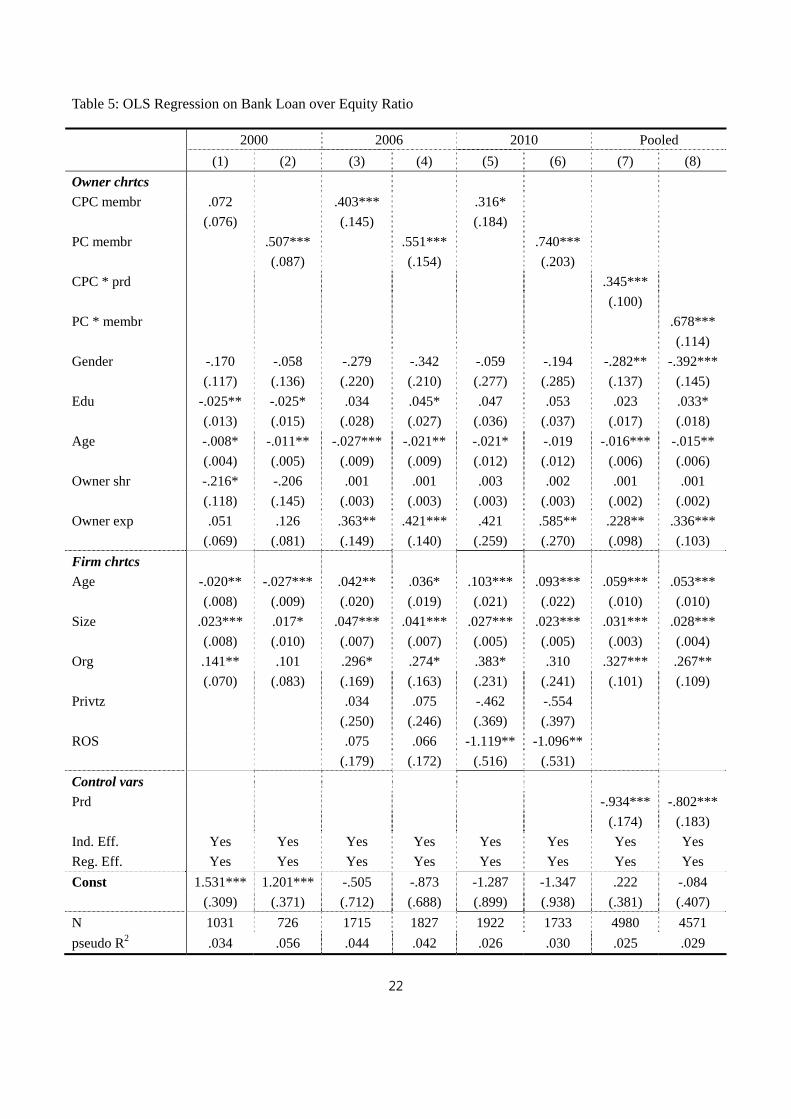
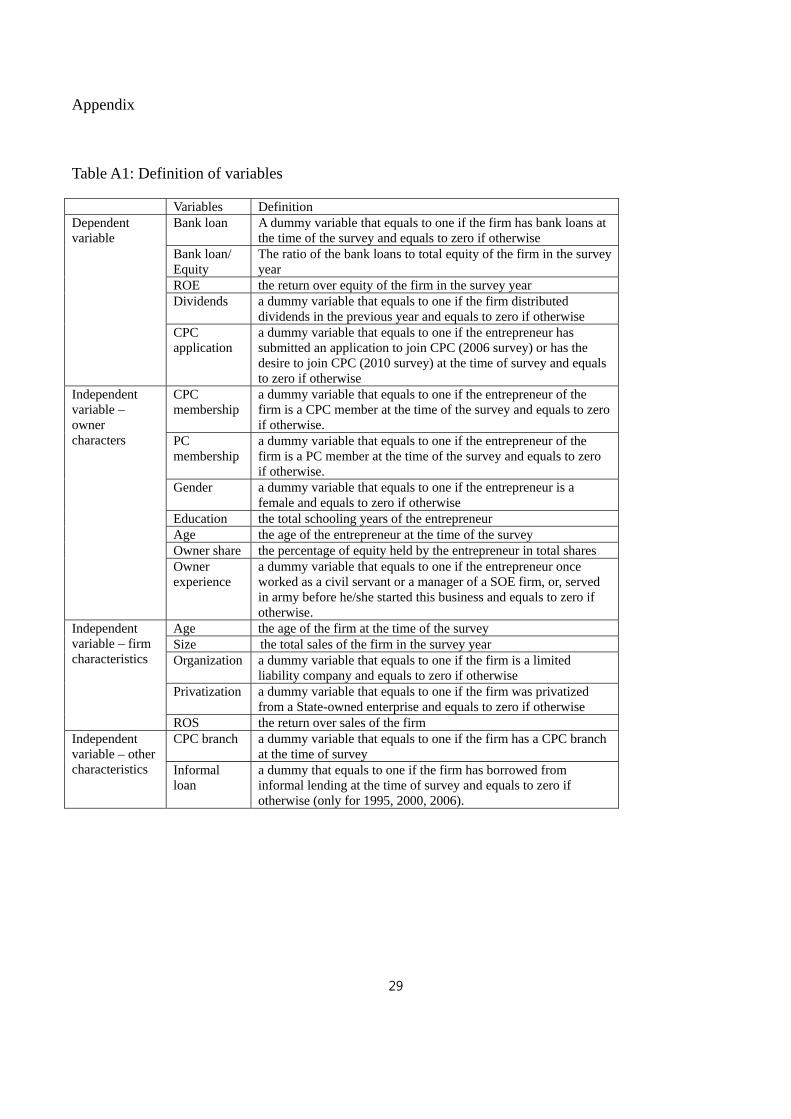
Potentially, one of the important advantages for political elites in running private businesses than commoners is access to bank loans. On the one hand, the majority of the bank loans are issued by the State-owned banks and the interest rates are set by the government. In this case, it means the government has a lot say on the allocation of the credit. On the other hand, bank loans are heavily subsidized such that the cost of capital and other important input factors in China are among the lowest in the world. Starting from 2003, the cost of capital in China became the lowest in the world from 2004 (Lardy, 2012). Consequently, whoever is able to obtain bank loans enjoys the rent, enjoys subsidies. In order to test whether a significant change occurred after the amendment in the Constitution, “access to bank loans” is regressed against “CPC/PC membership” for four cross-sections, i.e. 1995, 2000, 2006 and 2010. The definitions of the variables used in estimations are presented in Appendix (Table A1).
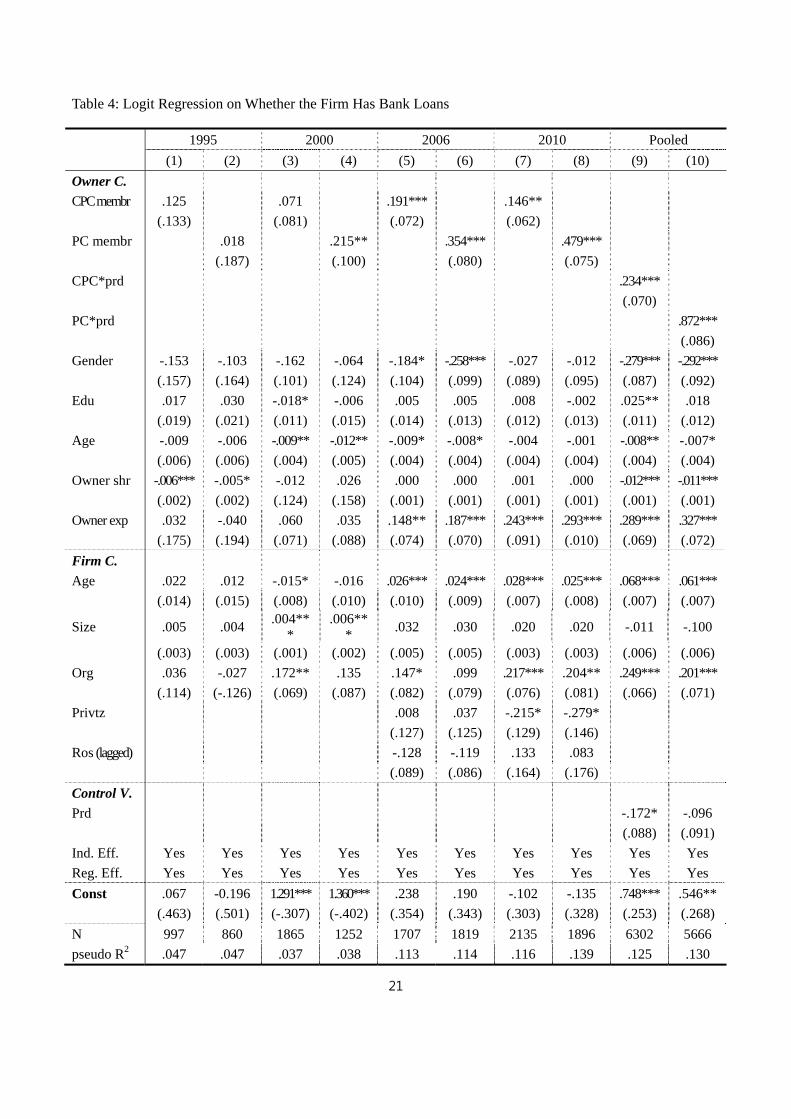
We measure political connections by CPC and PC membership, and estimate the effects of CPC/PC memberships on bank loans employing two measurements. The first one is derived from the answer to the question on whether the firm has bank loans, yes or no. The second one is the ratio of total bank loans over the value of total equity. The former variable is available for all the four years while the latter only for the years of 2000, 2006 and 2010. Tables 6 and 7 show the estimation results using the two measurements respectively. In each table, we conduct regressions using both yearly data and the pooled data. For the latter, we test whether the interaction term between political membership and period (0: pre-amendment period, 1: post-amendment period) is significant.
Table 4 indicates that CPC membership is positively and significantly correlated with bank loan only for the post-amendment period, i.e. years of 2006 and 2010 (columns (5)-(8)). Moreover, the interaction term between CPC and period is also significant in the pooled regressions (columns (9) and (10)). All of these results suggest that political connections resulted in better access to bank loan only for the period of 2006 and 2010. Similar results are obtained from OLS estimations using the bank-loan over total-equity ratio. As shown in Table 5, a firm owned by a CPC member gained significantly more bank loans measured by the ratio in 2006 and 2010 (columns (3)-(6)) but not in 2000 (column (1)) comparing to a firm owned by non-CPC member.
9
The impact of the PC membership on access to bank-loans follows the same pattern as that of the CPC membership. Yet, there is one notable difference between the two groups. In both Tables 4 and 5, although insignificant for the year 1995 (column (2) in Table 4), the same as for CPC membership, PC membership is significant in determining bank loans for the year 2000 (column (4) in Table 4 and column (2) in Table 5). Moreover, the magnitude of the effects and the coefficient of the significance are larger than those of CPC membership. These results may reflect the fact that PC members are higher level elites than CPC members. Thus, they might be able to take advantage of their more prestigious position and better information earlier and faster than CPC members. When Jiang Zemin proclaimed recognizing entrepreneurs at the beginning of year 2000, many of them might be informed about the profound political/economic meaning of this. Thus, some of them already moved ahead before the laws are formally changed. Moreover, with more prestigious position and deeper political connections they are more likely to enjoy greater benefits than CPC members.
It is a natural concern that our results might also be driven by some other factors between the entrepreneur/firm and the government, e.g. a connection with the government regardless of party membership or connections with the government inherited in the case of privatized SOEs.8 In order to rule out these concerns, in the above-mentioned regressions we controlled two related variables. First, we controlled the previous working experience of the entrepreneur. This is a dummy variable that equals to one if the entrepreneur once worked as a civil servant or a manager in a SOE, or, served in the army before he started up the private business and equals to zero if otherwise. As shown in Table 4, indeed, having worked in government-related agencies increased the probability of the entrepreneur to gain bank loan access for the firm in 2006 and 2010. At the same time, according to Table 5, these working experiences of the entrepreneur are significantly and positively associated with the firm’s bank loan over equity ratio in 2006. As our results stand, yet, the effects of the CPC membership and PC membership of the entrepreneur stay robust after controlling the previous working experience of the entrepreneur.
Secondly, we also controlled whether the firm was privatized from a SOE for the year 2006 and 2010 (these data are unavailable for earlier years). According to our estimates, the privatized firms do not seem be different from the de novo firms in bank loan access. Again, controlling this variable does not affect the impacts of the CPC membership and PC membership of the entrepreneur on the firm’s bank loan access.
Political Connections and Firm Performance
8 Staring from the late 1990s, there was a strong wave of privatization of SOEs in China (Guo et al., 2010). A concern is whether with the inherited relationships with the governments, these privatized SOEs have better access to bank loans than others.
10
The findings of previous section imply rent-seeking in bank credits for the entrepreneurs with political connections. An interesting question to be addressed is wether the rents are productive enhancing or not. If the answer is yes, then the consequence of rent-seeking is mainly inequality; and a remedy policy might be designed to correct this distortion. As a result, the Chinese-style capitalism may be sustainable. However, if the answer is no, if political connections have little influence on firm performance but enrich politically-connected entrepreneurs, it means the rent-seeking leads to social welfare losses and there is little economic justification. If so, prevalence and growing of this kind of unjustified rent-seeking could lead to undermine political support for Chinese-style capitalism.
In this section, we will explore the social welfare implications of the rents. The key is to find out if the CPC/PC member-owned firms perform better than others. In case they are not, then a question of interest is what they do with the bank loans that they obtained.
The existing discussions on the effect of political connections on firm performance in China are divided. Fan et al (2007) suggest that political connections hurt firm performance but Li et al (2008) and Francis et.al (2009) find their positive impacts on firm performance. Recent papers by Chen et al (2011) and Wu et al (2012) highlight that political connections affect firms differently depending on whether the firm is state-owned or private-owned.9
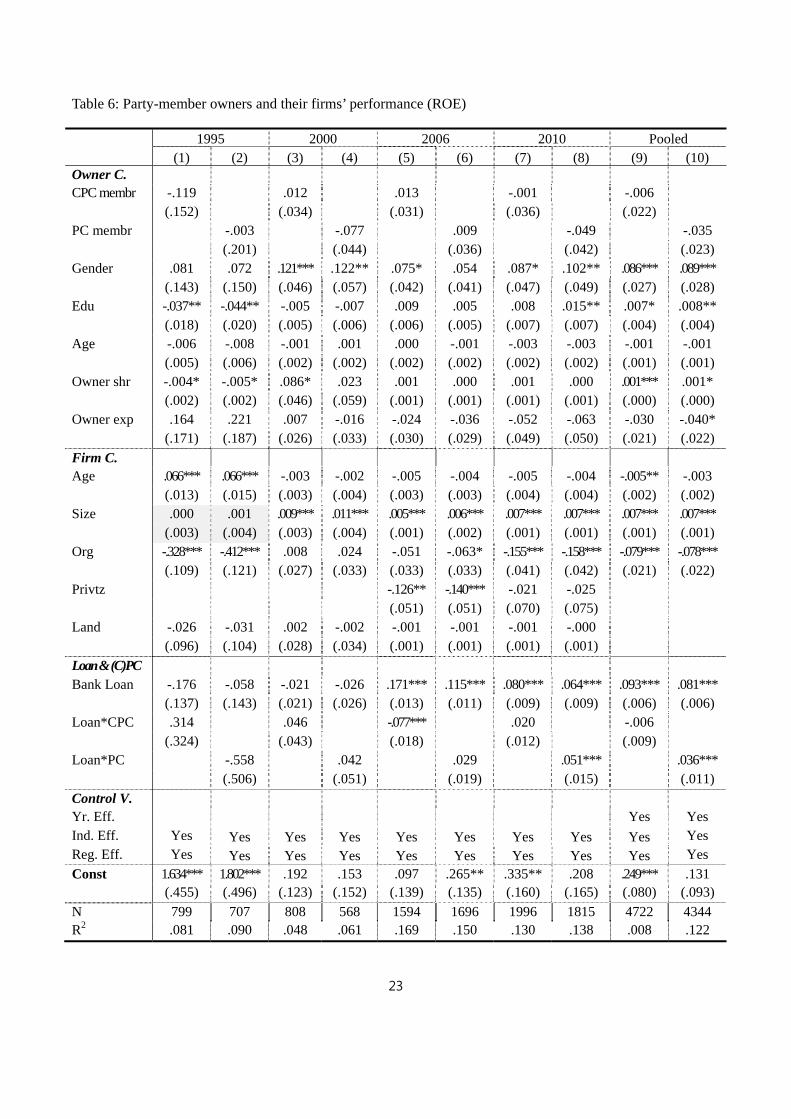
We measure the performance of private firms as return on equity (ROE) for the period of 1995-2010. In our regressions, we controlled broad range of variables related to CEOs and firms, which may affect firm performance. For example, the CEO share of investment can exert influence on firm performance through managerial incentives. Table 6 shows that political connections are not correlated with firm performance measured by ROE, in all the four years. Controlled characteristics of firm-owners and firms, and finance of the firm, neither CPC membership nor PC membership have significant impact to performance in any of the years (columns (1)-(8)) and in all the years when we pool the data together (columns (9)-(10)).10
To explore how political connections affect performance via the channel of bank loans, we include the interaction term between bank loans and CPC/PC membership in the regressions.11 It is not surprise that in the years of 1995 and 2000, when political connections did not lead to obtaining more
9 Except Li et al (2008), which measure political connection using CPC membership, the other papers such as Fan et al (2007), Chen et al (2011), Wu et al (2012) define a politically-connected firm as one whose CEO or Chairman is a current or former government official.
10 The seemingly different results between this paper and Li et al (2008) are likely due to the following reasons. a) We use different data than Li et al (2008), which is based on the data of year 2002. Given data of year 2002 reflect the business environment before the change of constitution, the operations in that year should be more similar to that of year 2000, and not surprise should be significantly different from those of year 2006 and 2010. b) We deploy more control variables than theirs. For example, CEO share of investment is significant for most years, but their paper does not control this. c) They use leverage in all regressions, which is likely to be correlated with CPC membership. 11 We find bank loans have positive impact on performance. This is in line with existing studies (Khwaja and Mian, 2005; Claessens et al., 2008; Li et al., 2008).
11
bank loans, these interaction terms are all insignificant (columns (1)-(4)). However, for the other years, the CPC and bank-loan interaction term is negative and significant in 2006 (column (5)) but insignificant in 2010 (column 7); the PC and bank-loan interaction term is insignificant in 2006 (column (6)) but positive and significant in 2010 (column 8), and the magnitude is small. When we pool all the cross section data together, we obtain similar results (column (9)-(10)).
Overall, we can conclude that political connections failed to lead to better performance. Although there are some positive effects of political connections on firm performance for CPC members when they obtained bank loan, the effects are found only for 2010 and the size is small. If the elite owners borrowed more from banks but did not perform better, a natural question arises is the way resources used.
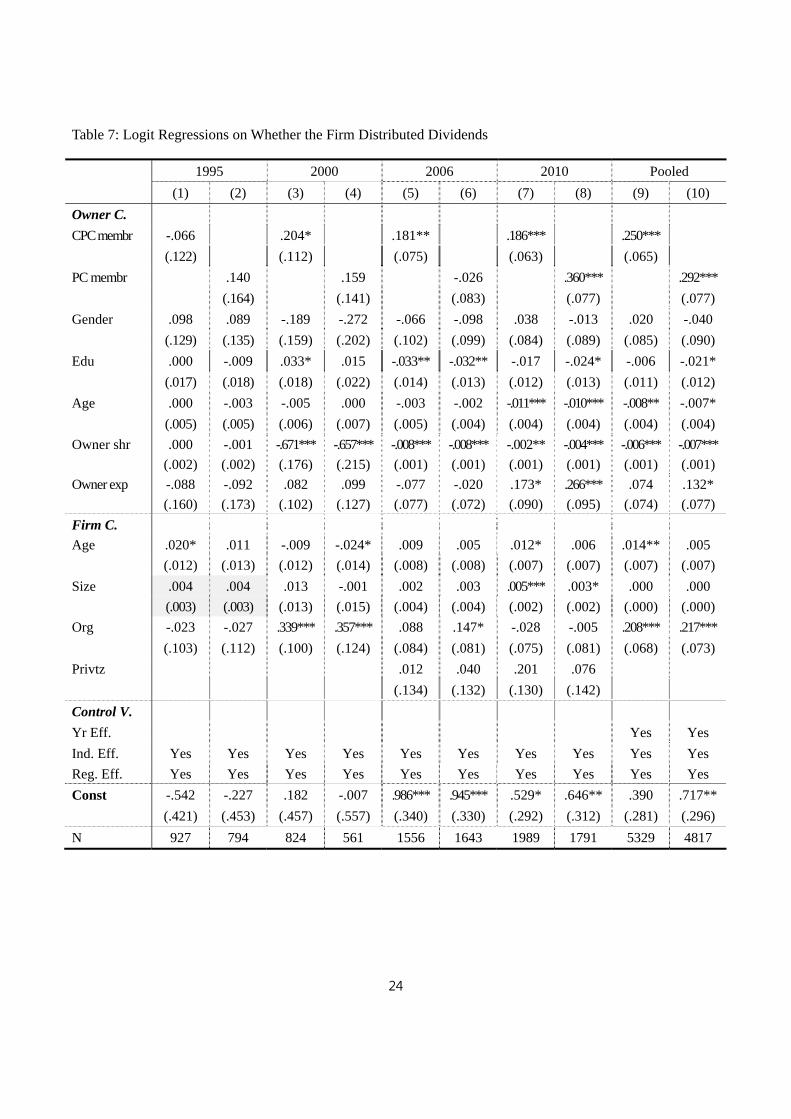
To address this question, we investigate personal gains of the elite owners from their firms. Given elite entrepreneurs own at least 60% of total shares of equity in their firms (Tables 2-3), paying dividends could be an effective channel to benefit from the resources they obtained. A major feature of Chinese private firms is that most of them do not regularly distribute dividends. This is partly because the difficulties in accessing bank loans, which forces them rely on self-financing, e.g. from re-investing accumulated profits of their firms. In Table 7 we look at factors which may affect firms’ decision on either to pay dividends, with a particular attention to political connections of the firm owners.
Our overall estimates are clear cut when we pool all the cross-sectional data together. The elites are more likely to pay dividends to themselves than other entrepreneurs, as shown in columns (9) and (10) of Table 7. Columns (1) and (2) of Table 7 show that CPC/PC memberships has insignificant impact to distribution of dividends in year 1995. However, as shown in columns (3), (5) and (7), firms owned by CPC members are significantly more likely to pay dividends than other firms in years 2000, 2006 and 2010. What happened in 2000 is particularly problematic since in that year they did not obtain more bank loans (column (4) of Table 4 and column (2) of Table 5), and the interaction term between CPC-membership and bank loan plays a negative and significant role in performance of their firms (column (4) of Table 6).
These findings indicate serious problems in resource allocation of the Chinese economy. Looks like bank loans in the hand of politically-connected private firms are used less efficiently than those without political connections. The Chinese Communist Party encouraged its elites to enter the private sector to strengthen its grip on the economy and the society, but, as a result, economic efficiency sacrificed as economic power has acquired political influence and used it mainly for their own benefits. In other words, since the change in the Constitution, economic rents and thus inefficiency have increased because those who have political connections obtained more resources but failed to improve firm performance. In a typical capitalist economy, entrepreneurs have the incentives to re-invest (Smith, 1776), and thus increases in bank loans likely lead to more investment. This has been systematically documented all over the world. However, our findings imply this is not the case in Chinese politically connected entrepreneurs. Instead, our findings indicate losses from distorted incentives due to their political connections and the institutional environment.
12
V. Robustness Check: Dealing Endogeneity
There may be different interpretations of the above-shown correlations. For example, when we use party membership as an independent variable, we implicitly assume its exogeneity to outcomes. However, it is not very likely that this is true. It might be possible that more successful entrepreneurs are recruited into the Party. In this case, there would be a positive correlation between party membership and firm performance and the nature of the story might be changed. Moreover, some worse-performing entrepreneurs might join the Party if he thought failing in business was due to lack of political connections. In this case there would be a negative correlation between party membership and firm performance. If both cases appear, the overall effects of the two could cancelled out, and could might drive the result that there is no performance difference between the elite owned firms and other firms. The other potential problem is that party membership might be positively related with ability. Capable individuals might have become party members and also successful entrepreneurs. Consequently, firm performance or bank loans are affected not by party membership itself but by ability which is conveyed in the variable of party membership. Indeed we have controlled entrepreneurs’ characteristics, including capabilities, as much as we can. Still, there are omitted factors.
We address these problems in the following aspects. The first is to apply an instrument-variable approach. The second approach is to directly exploit the data by excluding the party member recruited after starting up a private business. This allows us to exclude endogeneity that an owner of a private enterprise purposefully became a party member in order to increase accessibility to bank loan. This also helps to sharpen our estimates by focusing on the veteran Party members, i.e. the true political elites that are senior enough. Thirdly, we are going to investigate the qualifications of entrepreneurs who want to join the Party. Through this channel, we can figure out whether they are better performers or not. Lastly, we examine if the reason that CPC/PC member owners borrow more bank loans is due to extra financial constraints than others. If so, it might be somewhat justifiable.
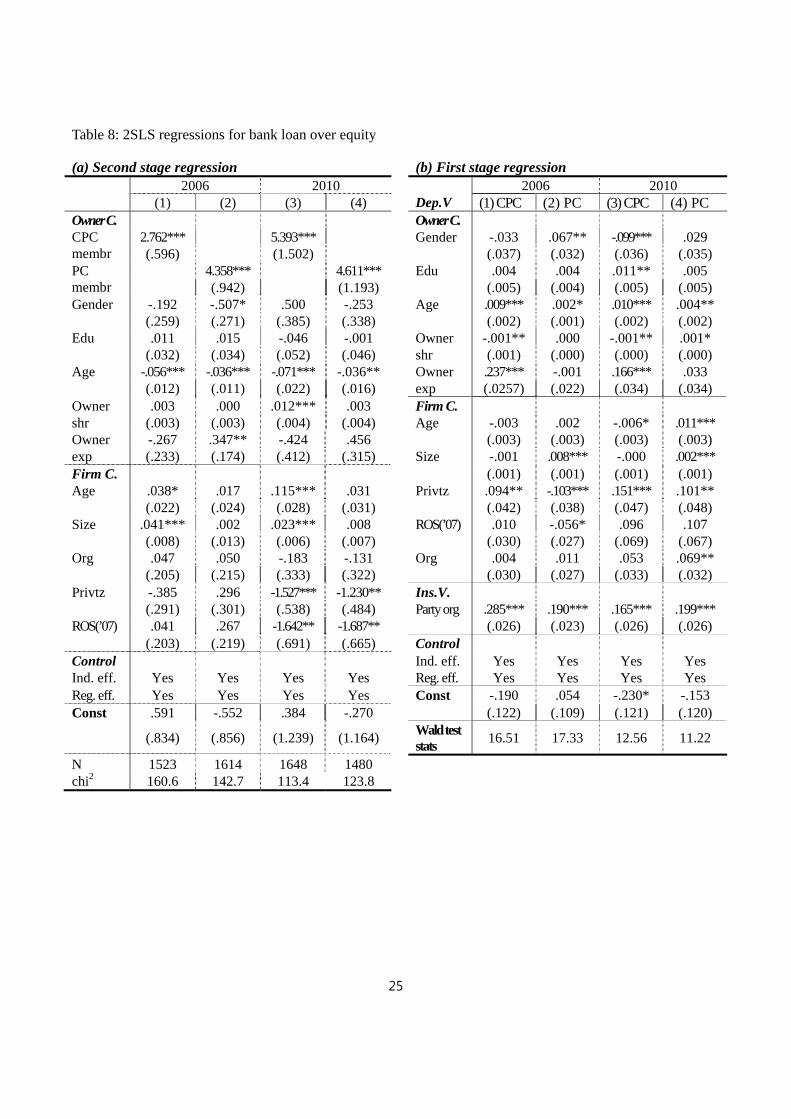
We start from the instrument-variable approach. We instrument entrepreneurs’ party membership by the existence of party branches within the firms. A good instrument should satisfy two conditions: relevance and exogeneity. We believe that party organization within the firm satisfies these two conditions. First, it can be relevant to our key variables, CPC and PC memberships, because if the firm owner is a Party member or PC member, he/ she will have more incentives and also easier to set up a party branch. In the following we are going to further elaborate this point. Second, it is likely to be exogenous to dependent variable such as bank loan or firm performance.
Under the rule of Communist Party of China and socialist ownership (i.e. no private ownership allowed), all firms and business units in China must have party branches until the appearance of private firms in the 1990s. When the private sector becomes significant in the national economy, the
13
fact that these firms do not have CPC’s grassroots’ branches12 has drawn serious concerns from the party. In response, the CPC central committee issued a decree in September 2000, which asks all the private firms set up grassroots party branches.13 Therefore, if an owner is a veteran party member, under the request of the party and to keep good political connections with the party, he/she should be more likely to set up a party branch in his/her own firm than non-party member entrepreneurs. The same should also be true for the PC members, at least for those who are also party members, since they are political elites at higher up levels, which means they would follow closer to the party’s appeals. These are all statistically confirmed in the first-stage regressions.
In the first stage, we look at how the CPC or PC membership of the owners is determined by the existence of party branch in their firms, the instrument variable, together with a set of control variables. The results displayed in the Table 8b confirm that party branch is highly significant in determining an owner’s CPC/PC membership.14 In addition, Wald test statistic shows it is highly relevant.
Table 8a presents estimation results of the second stage, where CPC or PC membership are instrumented using the predicted value of the first stage regressions. Panel (a) of Table 8 shows that that both CPC and PC memberships are positively and significantly correlated with the bank loan to equity ratio.15 This establishes the causality that political connections lead to easy access to bank loans. Moreover, if we compare the 2SLS estimates (columns (1) - (4) in Table 8a) with the OLS estimates (columns (1) - (4) in Table 5), it is clear that both statistically and economically the significant levels of the 2SLS estimates are much higher than the OLS estimates. It indicates that the OLS estimates may under-estimate the benefits of the connections.
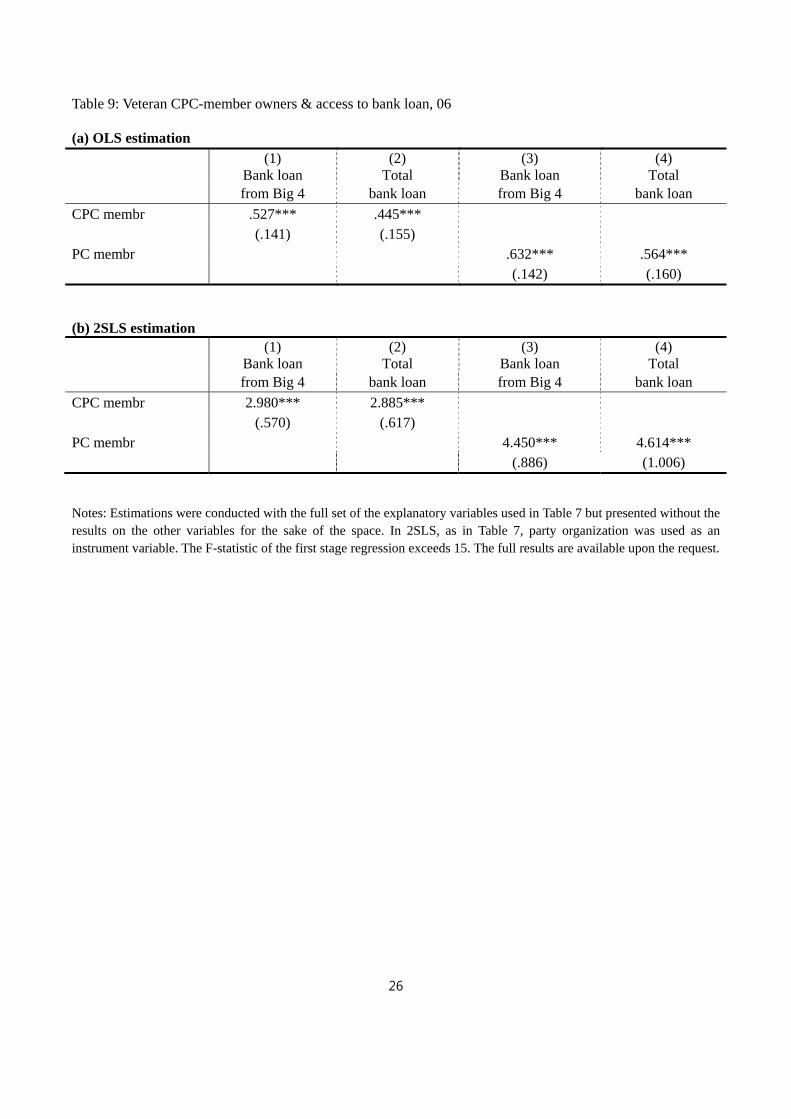
To further confirm the causality, our second approach is to focus only at veteran party members by using a subsample of the data and excluding other data. This eliminates all the party members who join the party after starting private business. Unfortunately, this kind of data is only available in 2006. Table 9 presents estimation results.
We have two sets of data measuring bank loans. One is banks loans for the four largest banks and the other is the total amount of bank loans. The upper panel is the result of OLS regressions and the lower panel is the result from the 2SLS. In the 2SLS regressions, the CPC/PC memberships are
12 In the 2000 only 17% of private firms in our sample have party branches. In 2004 the Financial Times reported that in Shanghai only 1.1% of the private firms had party branches. 13 The decree is entitled “The provisions on strengthening grassroots Party branches in private and non-state-owned enterprises (guan-yu zai ge-ti he si-ying deng fei-gong-you-zhi jingji zhuzhi zhong jiaqiang dang de jianshe gongzuo de yijian (shixing)).” It emphasizes the importance of the Party’s leadership and influence in non-state-owned enterprises. Concretely, it requested all private firms with more than three CPC members to establish grassroots branches. Moreover, it appeals city and county party committees send party representatives to firms with less than three CPC members, particularly large private firms, to attract more people to join the party and to guide them set up grassroots party branches. 14 Summary statistics between party organizations and its owners as party members and People’s Congress members are presented in appendix. 15 The reason we only look at 2006 and 2010 is because only in these two years the political elites get more bank loans.
14
instrumented in the same way as in Table 8, i.e. by the existence of party branches in the firm. Columns (1) and (2) are for the Party members, and (3) and (4) are for Congress members. The results show that both CPC and PC memberships are significant in all OLS and 2SLS regressions. This further confirms that the veteran party members, who are more likely to be senior elites, obtain more bank loans than others.
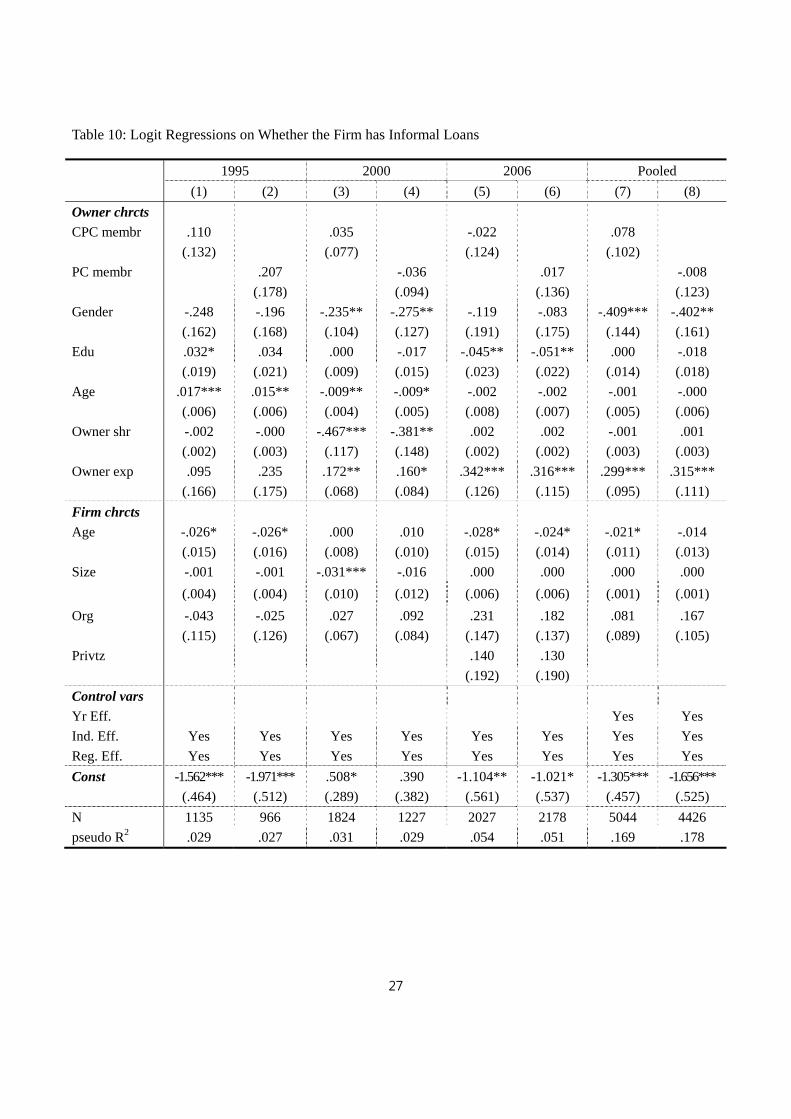
In the next step, we are going to address a question concerning the motive of borrowing more bank loans by politically connected entrepreneurs. Concretely, when the party-member owners obtain more bank loans than others, did they face more financial constraints than others? If so, the extra bank loans they obtained should rather be interpreted as neediness to deal with financial difficulties. To address this matter, we use borrowing from informal financial sector as a proxy to measure financial constraints. The reason this is a valid proxy to measure the financial constraints of a firm is because the high interest rates and the legal risks associated with the loans in that sector.16 Firms without serious financial constraints tend to avoid this kind of high-cost high-risk loans.
Table 10 shows regressions results for the three years (1995, 2000, and 2006) (no relevant data available for 2010). From all the cross-sections and pooled data, we find no evidence that the CPC and PC membership of the firm owners involve different informal lending activities than others. Together with the evidence that these firms are more likely to distribute dividends than other firms, all of these findings indicate that they are not financially more constrained than the others.
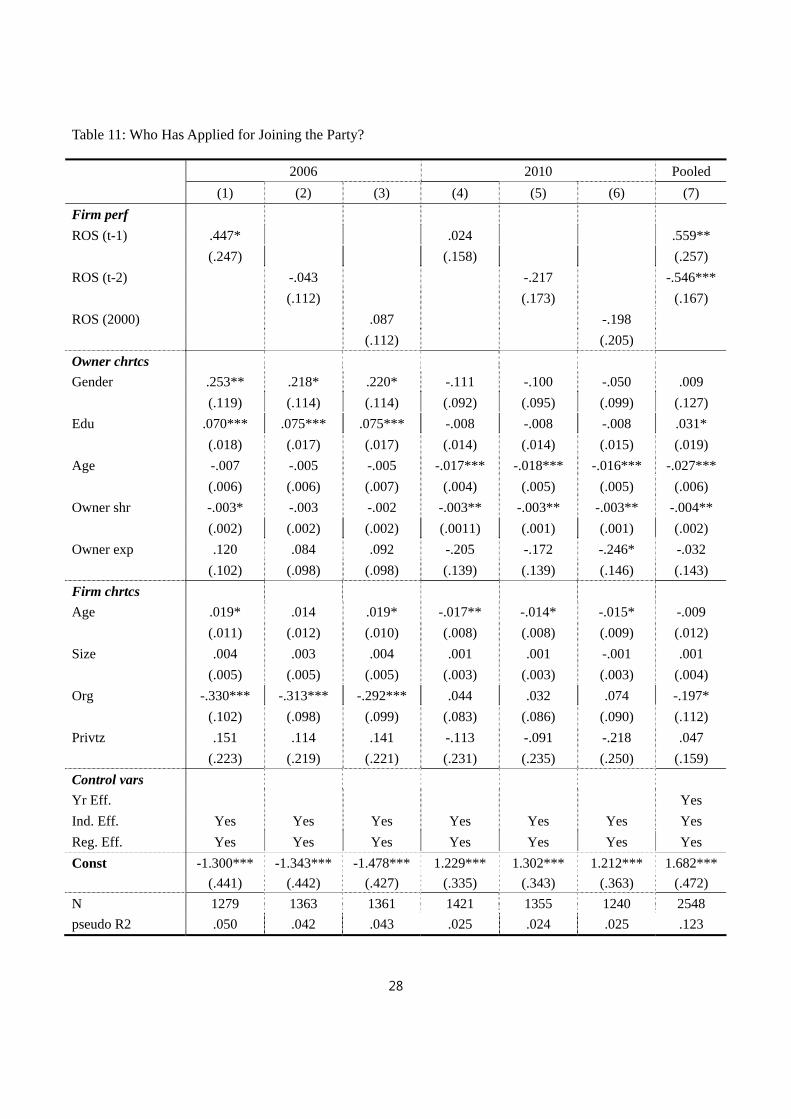
The last question we are going to address in this paper is what types of entrepreneurs were recruited into the party? Are those recruited into the party performed better or worse than others? In the questionnaires of 2006 and 2010, we have the data on those who indicated that they want to join the party. In the regressions shown in Table 11, we look at the correlation between those who want to join the party and their performance, which is measured by the return-over-sales ratio (ROS) in the past years (this is the only data available for tracking down their past performance). Overall it is clear that those who want to join the party do not statistically perform differently from the others.17
VI. Conclusion
Most existing studies on political connections looked at their relationships with firm performance in a static setting. The amendment in the Chinese Constitution in 2002-2004 presents an important
16 In China, financial sector is highly regulated. Informal lending in almost any form is illegal. Nonetheless, informal lending has surged as small businesses are often eschewed by the nation's major state-owned banks, which lend mainly to major state-owned enterprises (WSJ, March 14, 2012). According to UBS’s report, informal loans could be between two trillion yuan and four trillion yuan in total, or $316 billion to $632 billion, a bit less than 10% of the country's gross domestic product in 2011. Without legal protection, entrepreneurs who borrow informal loans not only take legal risks but also pay a reported annualized lending rate of 14%-70% for loans (reported by Credit Suisse, Spet, 2011). 17 In the pooled regression in Column (7), ROS (t-1) and ROS (t-2) are significant but the sign and the magnitudes of the coefficients suggest the effects are cancelled out.
15
opportunity to analyze the effects of political connections on resource allocations and firm performance in a dynamic setting, by looking at what happened before and after major changes of laws and institutional settings.
Our results suggest that politically connected entrepreneurs did not have much rent-seeking opportunities when the private sector was not appreciated by the party and the constitutions. However, after the laws and institutions were changed, the political elite entrepreneurs were treated differently, although these changes might not be written down in the law and might not be formal. What we discovered is that rent-seeking opportunities now became available. Concretely, we find everything else being equal these entrepreneurs could obtain more bank loans than others. Moreover, with more low-cost financial resources they did not perform better than others. Instead, we find politically-connected entrepreneurs are more likely to pay dividends to themselves than other entrepreneurs.
In addition to these discoveries, methodologically, this paper uses four cross-section data. Not only this is necessary for dealing with dynamics, this multiple cross-section data also reduce the omitted variable bias which is caused frequently in a single-year cross-section analysis due to the uncontrolled association between political connections and an omitted variable. Moreover, we have addressed endogeneity problem carefully by deploying instrument variable approach and several other approaches. Furthermore, our instrument variable, the existence of party branches within a firm, not only solves causality problem, but also reveals an interesting mechanism of party-firm relationship.
Our findings imply that the rents enjoyed by politically connected entrepreneurs lead to inefficiencies and unjustifiable collusion of economic power with political influence in China. What is the implication of this phenomenon to Chinese economic growth? What are the implications of these to the citizens, the ruling party, and the social stability? These are important open questions to be addressed in future research.
16
References
Acemoglu, Daron, Simon Johnson, Amir Kermani, James Kwak, Todd Mitton, 2010, “The Value of Political Connections in the United States,” mimeo.
Berkowitz,Daniel,Katharina Pistor, Jean-Francois Richard,Economic development, legality, and the
transplant effect, European Economic Review 47 (2003) 165 – 195
Bian, Yanjie, Xiaoling Shu, and John R. Logan, 2001, “Communist Party Membership and Regime Dynamics in China”, Social Forces, Vol. 79, pp. 805–41
Braggion, Fabio and Lyndon Moore, 2011, “The Economic Benefits of Political Connections in Late Victorian,” mimeo.
Brandt, Loren, Trevor Tombe and Xiaodong Zhu .2010. “Factor Market Distortions Across Time, Space and Sectors in China”, NBER Working Papers.
Calomiris, Charles W, Raymond Fisman and Yongxiang Wang, 2010, “Profiting from Government Stakes in a Command Economy: Evidence from Chinese Asset Sales,” Journal of Financial Economics, Vol. 96, pp. 399-412.
Chen, Shimin, Zheng Sun, Song Tang, and Donghui Wu, 2011, “Government Intervention and Investment Efficiency: Evidence from China,” Journal of Corporate Finance, Vol. 17, pp. 259-271.
Cingano, Federico and Paolo Pinotti, 2009, “Politicians at Work. The Private Returns and Social Costs of Political Connections,” Banca D’Italia, Working Paper 709.
Claessens, Stijn, Erik Feijen, and Luc Laeven, 2008, “Political Connections and Preferential Access to Finance: The Role of Campaign Contributions,” Journal of Financial Economics, Vol. 88, pp. 554-580.
Dixit, Avinash, On Moded of Economic Governance, Econometrica, Vol. 71, No. 2 (March, 2003), 449–481
Faccio, Mara, 2006, “Politically Connected Firms,” American Economic Review, Vol. 96, No. 1 (Mar., 2006), pp. 369-386.
Faccio, Mara, Ronald Masulis, and John Mcconnell, 2006, “Political Connections and Corporate Bailouts,” Journal of Finance, Vol. LXI, No. 6, pp. 2597-2635.
Fan, Joseph, T. J. Wong and Tianyu Zhang. 2007. “Politically connected CEOs, corporate governance, and Post-IPO performance of China's newly partially privatized firms”, Journal of Financial Economics, 84-2 (May 2007): 330-357.
Fisman, Ray. 2001. “Estimating the Value of Political Connections,” American Economic Review, Vol. 91(4),1095-1102.
Francis, Bill B., Iftekhar Hasan and Xian Sun. 2009. “Political connections and the process of going public: Evidence from China”, Journal of International Money and Finance, 28-4 (June 2009): 696-719
17
Hsieh, Chang-Tai and Peter J. Klenow. 2009. Misallocation and Manufacturing TFP in China and India, The Quarterly Journal of Economics (2009) 124 (4): 1403-1448.
Johnson, Simon, and Todd Mitton, 2003, “Cronyism and Capital Controls: Evidence from Malaysia,” Journal of Financial Economics, 67, pp. 351-382.
Khwaja, Asim Ijaz and Atif Mian, 2005, “Do Lenders Favor Politically Connected Firms? Rent Provision in an Emerging Financial Market,” Quarterly Journal of Economics, Vol. 120, No. 4, pp. 1371-1411.
La Porta, Rafael Florencio Lopez-De-Silanes, and Andrei Shleifer,What Works in Securities Laws? The
Journal of Finance, Vol. LXI, No. 1, Feb. 2006. Lardy, N.R., 2012, “Sustaining China’s Growth after the Global Financial Crisis”, Washington DC: Peterson Institute for International Economics, January.
Li, Bobai and Andrew G. Walder. 2001. “Career Advancement as Party Patronage: Sponsored Mobility into the Chinese Administrative Elite, 1949–1996”, American Journal of Sociology, 106-5 (March 2001): 1371-1408
Li, Bobai, and Andrew G. Walder, 2001, “Career Advancement as Party Patronage: Sponsored Mobility into the Chinese Administrative Elite, 1949–1996”, American Journal of Sociology, Vol. 106, pp. 1371-1408
Li, Hongbin, Lingsheng Meng, Qian Wang, and Li-An Zhou, 2008, “Political connections, financing and firm performance: Evidence from Chinese private firms”, Journal of Development Economics, 87-2 (October 2008): 283-299
Loren Brandt, Hongbin Li, 2003, “Bank discrimination in transition economies: ideology, information, or incentives?”, Journal of Comparative Economics, Vol. 31, pp.387-413
Peng, Mike W. and Yadong Luo. 2000. “Managerial Ties and Firm Performance in a Transition Economy: The Nature of a Micro-Macro Link”, The Academy of Management Journal, 43-3 (Jun., 2000): 486-501.
Slinko, Irina, Evegeny Yakovlev and Ekaterina Zhuravskaya, 2005, “Laws for Sale: Evidence from Russia,” American Law and Economics Review, Vol. 7, No. 1, pp. 284-318.
Walder, Andrew G, Bobai Li and Donald J. Treiman. 2000. “Politics and Life Chances in a State Socialist Regime: Dual Career Paths into the Urban Chinese Elite, 1949 to 1996”, American Sociological Review, 65-2 (Apr., 2000): 191-209.
Walder, Andrew G., Bobai Li, and Donald J. Treiman, 2000, “Politics and Life Chances in a State Socialist Regime: Dual Career Paths into the Urban Chinese Elite, 1949 to 1996”, American Sociological Review, Vol. 65, pp. 191–209
Walder, Andrew G., and Songhua Hu, 2009, “Revolution, Reform, and Status Inheritance: Urban China, 1949–1996”, American Journal of Sociology, Vol. 114, pp. 1395-1427
Wu, Wenfeng, Chongfeng Wua, Chunyang Zhou and Jun Wub, 2012, “Political Connections, Tax Benefits and Firm Performance: Evidence from China,” Journal of Accounting and Public Policy, Vol.31, No. 3, pp. 277-300.
18
Table 1: Growth of China’s Private Sector and the Share of CPC Members
Year Private Industrial Enterprises Share of CPC Members
Gross Output (100 million
Yuan)
Share of GDP (%)
Share of National Industrial
Output (%)
CPC Members in SOE Sector
(%)
CPC Members in Private Sector (%)
1998 2082.9 2.47 3.07 32.37 2.76
1999 3244.6 3.62 4.46 32.37 2.40
2000 5220.4 5.26 6.09 31.89 2.29
2001 8760.9 7.99 9.18 32.63 1.86
2002 12950.9 10.76 11.69 31.88 1.70
2003 20980.2 15.45 14.75 29.09 3.08
2004 35141.3 21.98 17.42 28.26 3.60
2005 47778.2 25.83 18.99 27.95 3.87
2006 67239.8 31.08 21.24 27.75 4.15
2007 94023.3 35.37 23.21 27.40 4.55
2008 136340.3 43.41 26.87 27.17 4.71
2009 162026.2 47.58 29.55 - -
Sources: China Statistical Yearbook, 1999-2010; Selected Statistics of Communist Party of China, 1921-2010, Beijing: Dangjian Duwu Press 2011

19
Table 2A Summary Statistics for 1995
CPC Owner PC Owner Non CPC/PC
Owner Full Sample
Variables Mean S.D Mean S.D. Mean S.D. Mean S.D. Age of firm 4.32 2.64 5.9 4.26 4.53 3.66 4.61 3.72 State share (%) 1.2 5.4 1.02 4.98 0.68 3.97 0.77 4.27 CEO share (%) 89.9 23.0 87.7 25.2 92.0 20.5 91.4 21.0 Sales (RMB mil) 6.7 19.6 11.9 23.9 5.3 14.1 5.6 14.9 No. of employees 104.0 177.3 160.7 224.9 80.7 149.9 85.0 153.2 Equity (RMB mil) 2.7 7.1 4.8 10.6 2.1 6.3 2.4 6.8 Donation/ Profit (%) 2.4 3.6 2.6 3.4 2.3 3.5 2.3 3.6 Forced Fee/ Profit (%) 1.8 3.1 1.9 3.2 1.8 3.1 1.8 3.1 PR Fee/ Profit (%) 5.3 6.8 5.0 5.3 5.3 6.1 5.4 6.3 ROE 0.62 1.19 0.68 1.27 0.68 1.34 0.65 1.27 ROA 0.18 0.25 0.17 0.26 0.21 0.34 0.21 0.32
Table 2B: Summary Statistics for 2000
CPC Owner PC Owner Non CPC/PC
Owner Full Sample
Variables Mean S.D Mean S.D. Mean S.D. Mean S.D. Age of firm 5.82 3.86 6.80 4.21 6.51 5.9 6.48 4.00 State share (%) 0.3 2.0 0.0 0.0 0.0 0.0 0.2 2.3 CEO share (%) 72.6 30.4 75.5 28.8 81.0 25.6 78.2 27.7 Sales (RMB mil) 18.6 39.8 28.2 49.8 9.9 26.9 15.9 37.0 No. of employees 216.3 636.6 319.3 730.2 92.5 230.9 171.1 637.2 Equity (RMB mil) 9.4 21.3 13.7 26.2 4.5 12.8 7.8 19.7 Bank loan/Equity (%) 0.6 0.9 0.7 1.0 0.3 0.7 0.5 0.8 Donation/sales (%) 0.5 1.0 0.4 0.9 0.5 1.0 0.5 1.0 Forced Fee/sales (%) 0.5 1.0 0.3 0.7 0.5 1.1 0.5 1.1 PR Fee/sales (%) 1.1 1.7 0.8 1.4 1.4 2.1 1.3 2.0 ROS 0.1 0.1 0.1 0.1 0.1 0.1 0.1 0.1 ROA 0.1 0.1 0.1 0.1 0.1 0.2 0.1 0.2 ROE 0.2 0.3 0.2 0.3 0.2 0.3 0.2 0.3
20
Table 3A: Summary Statistics for 2006
CPC Owner PC Owner Non CPC/PC
Owner Full Sample
Variables Mean S.D Mean S.D. Mean S.D. Mean S.D. Age of firm 7.4 4.4 8.4 4.5 6.6 4.3 7.04 4.4 State share (%) 0.8 4.9 0.6 3.6 0.3 2.9 0.5 3.8 CEO share (%) 64.5 28.3 67.3 26.6 70.2 25.4 68.2 26.7 Sales (RMB mil) 53.9 118.6 86.9 145.7 21.4 57.3 39.2 96.8 No. of employees 209.1 423.5 357.1 548.5 106.0 262.5 157.9 348.7 Equity (RMB mil) 12.2 24.6 20.6 32.6 7.1 18.6 10.2 22.6 Bank loan/Equity (%) 0.7 1.7 0.9 1.8 0.4 1.2 0.6 1.5 Land/ Equity (%) 9.6 14.7 10.8 14.3 6.9 13.7 8.3 14.3 Donation/sales (%) 0.4 1.1 0.5 1.3 0.6 1.3 0.5 1.2 Forced Fee/sales (%) 0.5 1.4 0.5 1.6 0.8 2.0 0.7 1.7 PR Fee/sales (%) 1.1 2.5 1.0 2.5 1.6 3.2 1.4 2.9 ROS 0.1 0.2 0.1 0.1 0.1 0.2 0.1 0.2 ROE 0.3 0.6 0.4 0.7 0.3 0.5 0.3 0.6
Table 3B: Summary Statistics for 2010
CPC Owner PC Owner Non CPC/PC
Owner Full Sample
Variables Mean S.D Mean S.D. Mean S.D. Mean S.D. Age of firm 8.9 4.5 10.2 4.2 7.9 4.7 8.7 4.7 State share (%) 0.4 3.8 0.3 2.8 0.2 2.8 0.3 3.3 CEO share (%) 61.7 29.5 64.3 28.7 67.3 28.2 65.2 28.8 Sales (RMB mil) 74.9 182.3 122.6 242.1 33.1 114.4 57.8 160.1 No. of employees 198.4 381.0 320.1 491.8 94.3 255.3 157.2 341.3 Equity (RMB mil) 21.8 46.8 35.6 59.9 10.1 33.1 17.4 42.5 Bank loan/Equity (%) 0.9 2.5 1.1 2.5 0.7 2.0 0.8 2.3 Land/ Equity (%) 6.6 12.2 8.1 12.8 5.9 12.8 6.3 12.5 Donation/sales (%) 0.6 1.9 0.8 2.2 0.5 1.4 0.6 1.8 Forced Fee/sales (%) 0.9 2.6 0.7 2.5 0.6 2.1 0.7 2.3 PR Fee/sales (%) 1.9 5.0 1.7 5.1 2.4 6.1 2.1 5.5 ROS 0.1 0.2 0.1 0.2 0.1 0.2 0.1 0.2 ROE 0.4 0.8 0.4 0.8 0.3 0.7 0.3 0.8
21
Table 4: Logit Regression on Whether the Firm Has Bank Loans
1995 2000 2006 2010 Pooled
(1) (2) (3) (4) (5) (6) (7) (8) (9) (10)
Owner C.
CPC membr .125 .071 .191*** .146**
(.133) (.081) (.072) (.062)
PC membr .018 .215** .354*** .479***
(.187) (.100) (.080) (.075)
CPC*prd .234***
(.070)
PC*prd .872***
(.086)
Gender -.153 -.103 -.162 -.064 -.184* -.258*** -.027 -.012 -.279*** -.292***
(.157) (.164) (.101) (.124) (.104) (.099) (.089) (.095) (.087) (.092)
Edu .017 .030 -.018* -.006 .005 .005 .008 -.002 .025** .018
(.019) (.021) (.011) (.015) (.014) (.013) (.012) (.013) (.011) (.012)
Age -.009 -.006 -.009** -.012** -.009* -.008* -.004 -.001 -.008** -.007*
(.006) (.006) (.004) (.005) (.004) (.004) (.004) (.004) (.004) (.004)
Owner shr -.006*** -.005* -.012 .026 .000 .000 .001 .000 -.012*** -.011***
(.002) (.002) (.124) (.158) (.001) (.001) (.001) (.001) (.001) (.001)
Owner exp .032 -.040 .060 .035 .148** .187*** .243*** .293*** .289*** .327***
(.175) (.194) (.071) (.088) (.074) (.070) (.091) (.010) (.069) (.072)
Firm C.
Age .022 .012 -.015* -.016 .026*** .024*** .028*** .025*** .068*** .061***
(.014) (.015) (.008) (.010) (.010) (.009) (.007) (.008) (.007) (.007)
Size .005 .004 .004**
* .006**
* .032 .030 .020 .020 -.011 -.100
(.003) (.003) (.001) (.002) (.005) (.005) (.003) (.003) (.006) (.006)
Org .036 -.027 .172** .135 .147* .099 .217*** .204** .249*** .201***
(.114) (-.126) (.069) (.087) (.082) (.079) (.076) (.081) (.066) (.071)
Privtz .008 .037 -.215* -.279*
(.127) (.125) (.129) (.146)
Ros (lagged) -.128 -.119 .133 .083
(.089) (.086) (.164) (.176)
Control V.
Prd -.172* -.096
(.088) (.091)
Ind. Eff. Yes Yes Yes Yes Yes Yes Yes Yes Yes Yes
Reg. Eff. Yes Yes Yes Yes Yes Yes Yes Yes Yes Yes
Const .067 -0.196 1.291*** 1.360*** .238 .190 -.102 -.135 .748*** .546**
(.463) (.501) (-.307) (-.402) (.354) (.343) (.303) (.328) (.253) (.268)
N 997 860 1865 1252 1707 1819 2135 1896 6302 5666
pseudo R2 .047 .047 .037 .038 .113 .114 .116 .139 .125 .130
22
Table 5: OLS Regression on Bank Loan over Equity Ratio
2000 2006 2010 Pooled
(1) (2) (3) (4) (5) (6) (7) (8)
Owner chrtcs
CPC membr .072 .403*** .316*
(.076) (.145) (.184)
PC membr .507*** .551*** .740***
(.087) (.154) (.203)
CPC * prd .345***
(.100)
PC * membr .678***
(.114)
Gender -.170 -.058 -.279 -.342 -.059 -.194 -.282** -.392***
(.117) (.136) (.220) (.210) (.277) (.285) (.137) (.145)
Edu -.025** -.025* .034 .045* .047 .053 .023 .033*
(.013) (.015) (.028) (.027) (.036) (.037) (.017) (.018)
Age -.008* -.011** -.027*** -.021** -.021* -.019 -.016*** -.015**
(.004) (.005) (.009) (.009) (.012) (.012) (.006) (.006)
Owner shr -.216* -.206 .001 .001 .003 .002 .001 .001
(.118) (.145) (.003) (.003) (.003) (.003) (.002) (.002)
Owner exp .051 .126 .363** .421*** .421 .585** .228** .336***
(.069) (.081) (.149) (.140) (.259) (.270) (.098) (.103)
Firm chrtcs
Age -.020** -.027*** .042** .036* .103*** .093*** .059*** .053***
(.008) (.009) (.020) (.019) (.021) (.022) (.010) (.010)
Size .023*** .017* .047*** .041*** .027*** .023*** .031*** .028***
(.008) (.010) (.007) (.007) (.005) (.005) (.003) (.004)
Org .141** .101 .296* .274* .383* .310 .327*** .267**
(.070) (.083) (.169) (.163) (.231) (.241) (.101) (.109)
Privtz .034 .075 -.462 -.554
(.250) (.246) (.369) (.397)
ROS .075 .066 -1.119** -1.096**
(.179) (.172) (.516) (.531)
Control vars
Prd -.934*** -.802***
(.174) (.183)
Ind. Eff. Yes Yes Yes Yes Yes Yes Yes Yes
Reg. Eff. Yes Yes Yes Yes Yes Yes Yes Yes
Const 1.531*** 1.201*** -.505 -.873 -1.287 -1.347 .222 -.084
(.309) (.371) (.712) (.688) (.899) (.938) (.381) (.407)
N 1031 726 1715 1827 1922 1733 4980 4571
pseudo R2 .034 .056 .044 .042 .026 .030 .025 .029
23
Table 6: Party-member owners and their firms’ performance (ROE)
1995 2000 2006 2010 Pooled
(1) (2) (3) (4) (5) (6) (7) (8) (9) (10) Owner C. CPC membr -.119 .012 .013 -.001 -.006
(.152) (.034) (.031) (.036) (.022) PC membr -.003 -.077 .009 -.049 -.035
(.201) (.044) (.036) (.042) (.023) Gender .081 .072 .121*** .122** .075* .054 .087* .102** .086*** .089***
(.143) (.150) (.046) (.057) (.042) (.041) (.047) (.049) (.027) (.028) Edu -.037** -.044** -.005 -.007 .009 .005 .008 .015** .007* .008**
(.018) (.020) (.005) (.006) (.006) (.005) (.007) (.007) (.004) (.004) Age -.006 -.008 -.001 .001 .000 -.001 -.003 -.003 -.001 -.001
(.005) (.006) (.002) (.002) (.002) (.002) (.002) (.002) (.001) (.001) Owner shr -.004* -.005* .086* .023 .001 .000 .001 .000 .001*** .001*
(.002) (.002) (.046) (.059) (.001) (.001) (.001) (.001) (.000) (.000) Owner exp .164 .221 .007 -.016 -.024 -.036 -.052 -.063 -.030 -.040*
(.171) (.187) (.026) (.033) (.030) (.029) (.049) (.050) (.021) (.022)
Firm C. Age .066*** .066*** -.003 -.002 -.005 -.004 -.005 -.004 -.005** -.003
(.013) (.015) (.003) (.004) (.003) (.003) (.004) (.004) (.002) (.002) Size .000 .001 .009*** .011*** .005*** .006*** .007*** .007*** .007*** .007***
(.003) (.004) (.003) (.004) (.001) (.002) (.001) (.001) (.001) (.001) Org -.328*** -.412*** .008 .024 -.051 -.063* -.155*** -.158*** -.079*** -.078***
(.109) (.121) (.027) (.033) (.033) (.033) (.041) (.042) (.021) (.022) Privtz -.126** -.140*** -.021 -.025
(.051) (.051) (.070) (.075) Land -.026 -.031 .002 -.002 -.001 -.001 -.001 -.000
(.096) (.104) (.028) (.034) (.001) (.001) (.001) (.001)
Loan & (C)PC Bank Loan -.176 -.058 -.021 -.026 .171*** .115*** .080*** .064*** .093*** .081***
(.137) (.143) (.021) (.026) (.013) (.011) (.009) (.009) (.006) (.006) Loan*CPC .314 .046 -.077*** .020 -.006
(.324) (.043) (.018) (.012) (.009) Loan*PC -.558 .042 .029 .051*** .036***
(.506) (.051) (.019) (.015) (.011)
Control V. Yr. Eff. Yes Yes Ind. Eff. Yes Yes Yes Yes Yes Yes Yes Yes Yes Yes Reg. Eff. Yes Yes Yes Yes Yes Yes Yes Yes Yes Yes
Const
1.634*** 1.802*** .192 .153 .097 .265** .335** .208 .249*** .131 (.455) (.496) (.123) (.152) (.139) (.135) (.160) (.165) (.080) (.093)
N 799 707 808 568 1594 1696 1996 1815 4722 4344 R2 .081 .090 .048 .061 .169 .150 .130 .138 .008 .122
24
Table 7: Logit Regressions on Whether the Firm Distributed Dividends
1995 2000 2006 2010 Pooled
(1) (2) (3) (4) (5) (6) (7) (8) (9) (10)
Owner C.
CPC membr -.066 .204* .181** .186*** .250***
(.122) (.112) (.075) (.063) (.065)
PC membr .140 .159 -.026 .360*** .292***
(.164) (.141) (.083) (.077) (.077)
Gender .098 .089 -.189 -.272 -.066 -.098 .038 -.013 .020 -.040
(.129) (.135) (.159) (.202) (.102) (.099) (.084) (.089) (.085) (.090)
Edu .000 -.009 .033* .015 -.033** -.032** -.017 -.024* -.006 -.021*
(.017) (.018) (.018) (.022) (.014) (.013) (.012) (.013) (.011) (.012)
Age .000 -.003 -.005 .000 -.003 -.002 -.011*** -.010*** -.008** -.007*
(.005) (.005) (.006) (.007) (.005) (.004) (.004) (.004) (.004) (.004)
Owner shr .000 -.001 -.671*** -.657*** -.008*** -.008*** -.002** -.004*** -.006*** -.007***
(.002) (.002) (.176) (.215) (.001) (.001) (.001) (.001) (.001) (.001)
Owner exp -.088 -.092 .082 .099 -.077 -.020 .173* .266*** .074 .132*
(.160) (.173) (.102) (.127) (.077) (.072) (.090) (.095) (.074) (.077)
Firm C.
Age .020* .011 -.009 -.024* .009 .005 .012* .006 .014** .005
(.012) (.013) (.012) (.014) (.008) (.008) (.007) (.007) (.007) (.007)
Size .004 .004 .013 -.001 .002 .003 .005*** .003* .000 .000
(.003) (.003) (.013) (.015) (.004) (.004) (.002) (.002) (.000) (.000)
Org -.023 -.027 .339*** .357*** .088 .147* -.028 -.005 .208*** .217***
(.103) (.112) (.100) (.124) (.084) (.081) (.075) (.081) (.068) (.073)
Privtz .012 .040 .201 .076
(.134) (.132) (.130) (.142)
Control V.
Yr Eff. Yes Yes
Ind. Eff. Yes Yes Yes Yes Yes Yes Yes Yes Yes Yes
Reg. Eff. Yes Yes Yes Yes Yes Yes Yes Yes Yes Yes
Const -.542 -.227 .182 -.007 .986*** .945*** .529* .646** .390 .717**
(.421) (.453) (.457) (.557) (.340) (.330) (.292) (.312) (.281) (.296)
N 927 794 824 561 1556 1643 1989 1791 5329 4817
25
Table 8: 2SLS regressions for bank loan over equity
(a) Second stage regression (b) First stage regression 2006 2010 2006 2010
(1) (2) (3) (4) Dep.V (1) CPC (2) PC (3) CPC (4) PC Owner C. Owner C. CPC 2.762*** 5.393*** Gender -.033 .067** -.099*** .029 membr (.596) (1.502) (.037) (.032) (.036) (.035) PC 4.358*** 4.611*** Edu .004 .004 .011** .005 membr (.942) (1.193) (.005) (.004) (.005) (.005) Gender -.192 -.507* .500 -.253 Age .009*** .002* .010*** .004** (.259) (.271) (.385) (.338) (.002) (.001) (.002) (.002) Edu .011 .015 -.046 -.001 Owner -.001** .000 -.001** .001* (.032) (.034) (.052) (.046) shr (.001) (.000) (.000) (.000) Age -.056*** -.036*** -.071*** -.036** Owner .237*** -.001 .166*** .033 (.012) (.011) (.022) (.016) exp (.0257) (.022) (.034) (.034) Owner .003 .000 .012*** .003 Firm C. shr (.003) (.003) (.004) (.004) Age -.003 .002 -.006* .011*** Owner -.267 .347** -.424 .456 (.003) (.003) (.003) (.003) exp (.233) (.174) (.412) (.315) Size -.001 .008*** -.000 .002*** Firm C. (.001) (.001) (.001) (.001) Age .038* .017 .115*** .031 Privtz .094** -.103*** .151*** .101** (.022) (.024) (.028) (.031) (.042) (.038) (.047) (.048) Size .041*** .002 .023*** .008 ROS(’07) .010 -.056* .096 .107 (.008) (.013) (.006) (.007) (.030) (.027) (.069) (.067) Org .047 .050 -.183 -.131 Org .004 .011 .053 .069** (.205) (.215) (.333) (.322) (.030) (.027) (.033) (.032) Privtz -.385 .296 -1.527*** -1.230** Ins.V. (.291) (.301) (.538) (.484) Party org .285*** .190*** .165*** .199*** ROS(’07) .041 .267 -1.642** -1.687** (.026) (.023) (.026) (.026) (.203) (.219) (.691) (.665) Control Control Ind. eff. Yes Yes Yes Yes Ind. eff. Yes Yes Yes Yes Reg. eff. Yes Yes Yes Yes Reg. eff. Yes Yes Yes Yes Const -.190 .054 -.230* -.153 Const .591 -.552 .384 -.270 (.122) (.109) (.121) (.120)
(.834) (.856) (1.239) (1.164) Wald test stats
16.51 17.33 12.56 11.22
N 1523 1614 1648 1480 chi2 160.6 142.7 113.4 123.8
26
Table 9: Veteran CPC-member owners & access to bank loan, 06
(a) OLS estimation
(1)
Bank loan (2)
Total (3)
Bank loan (4)
Total from Big 4 bank loan from Big 4 bank loan
CPC membr .527*** .445*** (.141) (.155)
PC membr .632*** .564*** (.142) (.160)
(b) 2SLS estimation
(1)
Bank loan (2)
Total (3)
Bank loan (4)
Total from Big 4 bank loan from Big 4 bank loan
CPC membr 2.980*** 2.885*** (.570) (.617)
PC membr 4.450*** 4.614*** (.886) (1.006)
Notes: Estimations were conducted with the full set of the explanatory variables used in Table 7 but presented without the results on the other variables for the sake of the space. In 2SLS, as in Table 7, party organization was used as an instrument variable. The F-statistic of the first stage regression exceeds 15. The full results are available upon the request.
27
Table 10: Logit Regressions on Whether the Firm has Informal Loans
1995 2000 2006 Pooled
(1) (2) (3) (4) (5) (6) (7) (8)
Owner chrcts
CPC membr .110 .035 -.022 .078
(.132) (.077) (.124) (.102)
PC membr .207 -.036 .017 -.008
(.178) (.094) (.136) (.123)
Gender -.248 -.196 -.235** -.275** -.119 -.083 -.409*** -.402**
(.162) (.168) (.104) (.127) (.191) (.175) (.144) (.161)
Edu .032* .034 .000 -.017 -.045** -.051** .000 -.018
(.019) (.021) (.009) (.015) (.023) (.022) (.014) (.018)
Age .017*** .015** -.009** -.009* -.002 -.002 -.001 -.000
(.006) (.006) (.004) (.005) (.008) (.007) (.005) (.006)
Owner shr -.002 -.000 -.467*** -.381** .002 .002 -.001 .001
(.002) (.003) (.117) (.148) (.002) (.002) (.003) (.003)
Owner exp .095 .235 .172** .160* .342*** .316*** .299*** .315***
(.166) (.175) (.068) (.084) (.126) (.115) (.095) (.111)
Firm chrcts
Age -.026* -.026* .000 .010 -.028* -.024* -.021* -.014
(.015) (.016) (.008) (.010) (.015) (.014) (.011) (.013)
Size -.001 -.001 -.031*** -.016 .000 .000 .000 .000
(.004) (.004) (.010) (.012) (.006) (.006) (.001) (.001)
Org -.043 -.025 .027 .092 .231 .182 .081 .167
(.115) (.126) (.067) (.084) (.147) (.137) (.089) (.105)
Privtz .140 .130
(.192) (.190)
Control vars
Yr Eff. Yes Yes
Ind. Eff. Yes Yes Yes Yes Yes Yes Yes Yes
Reg. Eff. Yes Yes Yes Yes Yes Yes Yes Yes
Const -1.562*** -1.971*** .508* .390 -1.104** -1.021* -1.305*** -1.656***
(.464) (.512) (.289) (.382) (.561) (.537) (.457) (.525)
N 1135 966 1824 1227 2027 2178 5044 4426
pseudo R2 .029 .027 .031 .029 .054 .051 .169 .178
28
Table 11: Who Has Applied for Joining the Party?
2006 2010 Pooled
(1) (2) (3) (4) (5) (6) (7)
Firm perf
ROS (t-1) .447* .024 .559**
(.247) (.158) (.257)
ROS (t-2) -.043 -.217 -.546***
(.112) (.173) (.167)
ROS (2000) .087 -.198
(.112) (.205)
Owner chrtcs
Gender .253** .218* .220* -.111 -.100 -.050 .009
(.119) (.114) (.114) (.092) (.095) (.099) (.127)
Edu .070*** .075*** .075*** -.008 -.008 -.008 .031*
(.018) (.017) (.017) (.014) (.014) (.015) (.019)
Age -.007 -.005 -.005 -.017*** -.018*** -.016*** -.027***
(.006) (.006) (.007) (.004) (.005) (.005) (.006)
Owner shr -.003* -.003 -.002 -.003** -.003** -.003** -.004**
(.002) (.002) (.002) (.0011) (.001) (.001) (.002)
Owner exp .120 .084 .092 -.205 -.172 -.246* -.032
(.102) (.098) (.098) (.139) (.139) (.146) (.143)
Firm chrtcs
Age .019* .014 .019* -.017** -.014* -.015* -.009
(.011) (.012) (.010) (.008) (.008) (.009) (.012)
Size .004 .003 .004 .001 .001 -.001 .001
(.005) (.005) (.005) (.003) (.003) (.003) (.004)
Org -.330*** -.313*** -.292*** .044 .032 .074 -.197*
(.102) (.098) (.099) (.083) (.086) (.090) (.112)
Privtz .151 .114 .141 -.113 -.091 -.218 .047
(.223) (.219) (.221) (.231) (.235) (.250) (.159)
Control vars
Yr Eff. Yes
Ind. Eff. Yes Yes Yes Yes Yes Yes Yes
Reg. Eff. Yes Yes Yes Yes Yes Yes Yes
Const -1.300*** -1.343*** -1.478*** 1.229*** 1.302*** 1.212*** 1.682***
(.441) (.442) (.427) (.335) (.343) (.363) (.472)
N 1279 1363 1361 1421 1355 1240 2548
pseudo R2 .050 .042 .043 .025 .024 .025 .123
29
Appendix
Table A1: Definition of variables
Variables Definition Dependent variable
Bank loan A dummy variable that equals to one if the firm has bank loans at the time of the survey and equals to zero if otherwise
Bank loan/ Equity
The ratio of the bank loans to total equity of the firm in the survey year
ROE the return over equity of the firm in the survey year Dividends a dummy variable that equals to one if the firm distributed
dividends in the previous year and equals to zero if otherwise CPC application
a dummy variable that equals to one if the entrepreneur has submitted an application to join CPC (2006 survey) or has the desire to join CPC (2010 survey) at the time of survey and equals to zero if otherwise
Independent variable – owner characters
CPC membership
a dummy variable that equals to one if the entrepreneur of the firm is a CPC member at the time of the survey and equals to zero if otherwise.
PC membership
a dummy variable that equals to one if the entrepreneur of the firm is a PC member at the time of the survey and equals to zero if otherwise.
Gender a dummy variable that equals to one if the entrepreneur is a female and equals to zero if otherwise
Education the total schooling years of the entrepreneur Age the age of the entrepreneur at the time of the survey Owner share the percentage of equity held by the entrepreneur in total shares Owner experience
a dummy variable that equals to one if the entrepreneur once worked as a civil servant or a manager of a SOE firm, or, served in army before he/she started this business and equals to zero if otherwise.
Independent variable – firm characteristics
Age the age of the firm at the time of the survey Size the total sales of the firm in the survey year Organization a dummy variable that equals to one if the firm is a limited
liability company and equals to zero if otherwise Privatization a dummy variable that equals to one if the firm was privatized
from a State-owned enterprise and equals to zero if otherwise ROS the return over sales of the firm
Independent variable – other characteristics
CPC branch a dummy variable that equals to one if the firm has a CPC branch at the time of survey
Informal loan
a dummy that equals to one if the firm has borrowed from informal lending at the time of survey and equals to zero if otherwise (only for 1995, 2000, 2006).