Embed Size (px)
Citation preview

The Political Economy of Unfinished
Development Projects: Corruption, Clientelism,
or Collective Choice?
Martin J. Williams ∗
Forthcoming: American Political Science Review, November 2017
Abstract
Development projects like schools and latrines are popular with politi-cians and voters alike, yet many developing countries are littered withhalf-finished projects that were abandoned mid-construction. Using anoriginal database of over 14,000 small development projects in Ghana, Iestimate that one-third of projects that start are never completed, con-suming nearly one-fifth of all local government investment. I develop atheory of project non-completion as the outcome of a dynamically incon-sistent collective choice process among political actors facing commitmentproblems in contexts of limited resources. I find evidence consistent withkey predictions of this theory, but inconsistent with alternative explana-tions based on corruption or clientelism. I show that fiscal institutionscan increase completion rates by mitigating the operational consequencesof these collective choice failures. These findings have theoretical andmethodological implications for distributive politics, the design of inter-governmental transfers and aid, and the development of state capacity.
∗Associate Professor in Public Management, University of Oxford, Blavatnik School ofGovernment, Radcliffe Observatory Quarter, Oxford OX2 6GG, United Kingdom. Email:[email protected]. This version of the paper is for private research and studyonly and may not be redistributed. This project has benefited from data and discussions withindividuals from numerous institutions in Ghana, including the National Development Plan-ning Commission, Ministry of Local Government and Rural Development, Local GovernmentService Secretariat, Ministry of Finance, District Assemblies Common Fund Administrator,Ghana Audit Service, World Bank, Ministry of Education, and GETFund Secretariat. How-ever, the findings and opinions herein should not be attributed to any of these institutions. Iam grateful for comments from Nana Agyekum-Dwamena, Ben Ansell, Daniel Berger, Cather-ine Boone, Christian Breunig, Stefano Caria, Ali Cirone, Darin Christensen, Patrick Dunleavy,Douglas Gollin, Nahomi Ichino, Ryan Jablonski, Julien Labonne, Noah Nathan, Pia Raffler,Imran Rasul, Dan Rogger, Anisha Sharma, Joachim Wehner, Erik Wibbels, Stephane Wolton,three anonymous reviewers, and workshop participants at the LSE, Ghana CSTC, ODI, DFID,EPSA, APSA, PacDev, Princeton, Georgetown, IMF, ABCDE, MPSA, WGAPE, and theGhana Ministry of Finance, and to Nahomi Ichino and Erik Wibbels for sharing data. Thisresearch was funded by International Growth Centre grant 1-VRG-VGHA-VXXXX-89105. Al-lan Kasapa, Joseph Napen, and Abdul-Kadir Mumuni provided excellent research assistance.Any remaining errors are my own.
1

Introduction
The provision of social infrastructure is a crucial function of government in
developing countries, where access to basic facilities like schools, clinics, and
latrines is often low. These targeted, visible, and popular projects are also
exactly the type of public goods that politicians seek to deliver in theories of pork
barrel politics, tactical redistribution, and credit claiming. Yet it is anecdotally
common for governments in developing countries to start work on such projects
but never actually complete them, leaving behind half-finished projects of no
value to users and voters. Though widely remarked upon and substantively
important, the extent and causes of this phenomenon have received surprisingly
little attention.1
Unfinished projects also pose a theoretical puzzle: conditional on a govern-
ment having started a project, why would the same government subsequently
not finish the project?2 This question is not well explained by existing theories
of politically motivated misallocation of public expenditure associated with dis-
tributive politics and clientelism, in which inefficiency arises due to the tactical
targeting of expenditure (Cox and McCubbins 1986; Dixit and Londregan 1996;
Golden and Min 2013) or over- or under-spending on infrastructure relative to
private transfers (Keefer 2007; Robinson and Verdier 2013). Similarly, although
corruption has been the overwhelming focus of studies of the implementation
of public good provision in developing countries (Banerjee, Hanna, and Mul-
lainathan 2013) and the allocation of infrastructure contracts to political sup-
porters has been widely remarked (Samuels 2002), corruption in project delivery
need not lead to non-completion of the project. Indeed, when corruption takes
1For instance, Samuels (2002, 852) refers in passing to “the literally thousands of unfin-ished pork-barrel projects that dot the Brazilian countryside”, and there are reportedly 19,000abandoned government projects in Nigeria (Vanguard 2016). In the only large-sample studyof project completion, to my knowledge, Rasul and Rogger (2016) estimate that 25 percentof government projects in Nigeria that start are not completed.
2To focus on the core theoretical question, I abstract from considerations of regime changeor electoral alternation, the identity or capacity of politicians and bureaucrats, project com-plexity, and other environmental shocks. These factors are either controlled for in my empiricalresearch design or are not salient features of the implementation of the small and technicallysimple projects I examine, although they could be important determinants of project comple-tion in other contexts.
1

the common form of inflated contract values or sub-standard quality (Olken
2007; World Bank 2011), contractors may actually have stronger incentives to
complete projects in order to fully reap their excess rents.
Figure 1: Unfinished projects
I develop an alternative theory of project non-completion as the dynami-
cally inconsistent outcome of a collective choice process in contexts of limited
resources, in which multiple political actors bargain over the distribution of a
limited number of discrete, targeted projects. Building coalitions around a set of
projects to be implemented in the current period requires intertemporal bargain-
ing among these actors over future project distribution, but actors face credible
commitment problems and so these bargains are inherently unstable, meaning
that collective expenditure choices may not be dynamically consistent. Since
project construction happens over a period of time, this time-inconsistency leads
some projects to be interrupted mid-construction when collective expenditure
priorities shift to new projects. The idea that collective choice over locally tar-
geted projects among actors with commitment problems can lead to inefficient
government expenditure has a long tradition in theory on public choice and
legislative bargaining (Riker and Brams 1973; Weingast and Marshall 1988).
However, it has received significantly less attention in developing country con-
texts, where research has focused almost exclusively on instrumental forms of
public expenditure inefficiency.
I examine project completion empirically using an original dataset of over
2

14,000 small local government projects in Ghana from 2011-13, which I compiled
using administrative records that I collected, digitized, and coded. I estimate
that approximately one-third of projects that start are never finished, consum-
ing nearly 20 percent of all local government capital expenditure.3 Although not
directly comparable in welfare terms, this estimate of the fiscal waste from non-
completion is of similar magnitude to Olken’s (2007) estimate of resource loss
from corruption in road building (24 percent) and Finan and Mazzocco’s (2016)
estimate of the percentage of public expenditure that is misallocated due to po-
litically motivated distortions (26 percent). The social costs of non-completion
are large: the money spent on non-completed projects by local governments
alone would be enough to fully construct 667 additional three-room schools
serving over 73,000 children, every year.4 Since school construction has been
shown to lead to increased educational attainment and higher future wages in
infrastructure-poor developing countries such as Ghana (Duflo 2001), this fiscal
waste may have long-term developmental consequences. The political opportu-
nity costs are also potentially substantial: delivering infrastructure projects has
been shown to win votes for the incumbent in Ghanaian elections (Briggs 2012;
Weghorst and Lindberg 2013; Harding 2015), citizens and media often refer to
unfinished projects in negative performance evaluations of government (Ghana
News Agency 2014), and elections in Ghana are often closely contested, with the
2008 presidential election being decided by just 40,586 votes (Whitfield 2009).
I derive and test observable implications of the corruption, clientelism, and
collective choice theories of non-completion in the context of decentralized pub-
lic good provision in Ghana. I overcome the endogeneity concerns that plague
much of the empirical distributive politics literature (Larcinese, Snyder, and
Testa 2012) by exploiting the fact that the same types of projects are delivered
in the same districts and communities by the same local politicians, bureaucrats,
3Since I am only able to directly observe projects during this three-year window, estimatingthe percentage of projects that are ever completed requires some extrapolation (see sectionand Appendix E), and this percentage could be higher or lower during different time periods.
4Based on an average class size of 36.6, as reported in the World Bank’s EdStats databasefor 2011.
3

and contractors, but funded through two different intergovernmental transfer
mechanisms. These transfers are similar in design and implementation, except
that one has an exogenously imposed funding rule that places districts at risk
of losing future transfers if they fail to complete ongoing projects before start-
ing new ones. Consistent with the predictions of the collective choice theory,
this rule has a large effect in districts whose partisan composition is likely to
make efficient collective choice difficult and a much weaker effect elsewhere. I
further support this result by showing that central government projects are un-
affected by district partisan composition, by addressing concerns about endoge-
nous project selection using Oster’s (forthcoming) coefficient stability approach,
and through extensive robustness checks. I also find considerable evidence that
is inconsistent with either corruption or clientelism being significant causes of
project non-completion.
These findings on the extent and causes of project non-completion contribute
to the broader literature on government expenditure inefficiency in several ways.
The emphasis on the non-instrumentality of much expenditure inefficiency con-
nects with Bandiera, Prat, and Valletti’s (2009) distinction between active waste
(which creates utility for the decision-maker) and passive waste (which does
not), and their finding that the latter is quantitatively more important in pro-
curement in Italy. While recent literature on developing countries has empha-
sized ways in which an agent might actively distort expenditure for private gain,
whether through corruption or clientelism, expenditure decisions are arguably
made through formal or informal collective choice processes at least as often
as they are made by a unitary agent acting strategically. This is consistent
with recent empirical studies by Hodler and Raschky (2014) and Burgess et al
(2015), which find that greater constraints on the executive are associated with
reduced ethnic favoritism in public good provision. Whereas these papers ex-
amine the effects of institutional change over time on public good provision, I
demonstrate that different institutional rules can lead to different (and signifi-
cantly improved) outcomes even when applied simultaneously to the same set of
4

politicians and bureaucrats. The idea that institutions can mediate the workings
of distributive politics parallels a similar literature on administrative agencies
in US politics (Bertelli and Grose 2009). These findings also provide the first
project-level evidence that the source of public funds matters for expenditure
outcomes (Gadenne 2015).
Viewing project allocation and implementation as distinct, but not inde-
pendent, processes has significant methodological and theoretical implications
for future studies of public good provision. Numerous empirical studies of dis-
tributive politics in developing countries measure politicians’ revealed tactical
targeting strategies using either input-based measures of expenditure allocation
(e.g. Keefer and Khemani 2009; Banful 2011) or output- or outcome-based
measures of access or service quality (e.g. Franck and Rainer 2012; Kramon
and Posner 2013).5 However, these measures are only equivalent if the deter-
minants of project implementation are unrelated to the determinants of project
distribution, which this study suggests may not always be the case. Policy
implementation can thus have distributive causes and consequences, yet the im-
plementation of distributive policies has been largely overlooked in theory and
empirics alike.
More broadly, this study provides a link between micro-level studies of pub-
lic good provision and the more abstract theoretical literature on institutions,
states, and development. In particular, this study’s empirical finding that insti-
tutions can improve efficiency by helping political actors collectively overcome
credible commitment problems to resolve distributive conflicts is also a central
idea in theories of institutions (Ostrom 1990) and the long-term development
of state capacity (Acemoglu, Johnson, and Robinson 2005; Besley and Pers-
son 2011). While the impact of institutions on development and state capacity
has thus far been empirically examined mainly through longitudinal and cross-
country or -region studies, this article shows that specific institutional rules can
5Burgess et al (2015) use both an input-based measure of expenditure and an output-basedmeasure of physical completion as alternative dependent variables, but do not investigate thediscrepancy between them.
5

play a similar role even within a single polity at a single point in time.
Background: decentralized public good provision
in Ghana
The provision of local public goods is highly salient in both local (Ghana News
Agency 2015) and national (Joy News 2014) politics in Ghana, and voters
have been shown to reward the delivery of visible public goods (Briggs 2012;
Weghorst and Lindberg 2013; Harding 2015). Yet voters and politicians alike
frequently complain about projects being abandoned mid-construction. Unfin-
ished projects are widely reported on by the media (Ghana News Agency 2014),
with even Parliament (Citi FM 2014) and the President (Joy News 2014) com-
plaining about non-completion. National elections are closely contested by two
dominant parties, the National Democratic Congress (NDC, which won elec-
tions in 2008 and 2012 and was in power throughout this paper’s study period)
and the National Patriotic Party (NPP). The President is elected by national
popular vote, so there is a strong incentive for the incumbent to deliver public
goods in order to win votes across all districts.6
The responsibility for actually delivering many of these local public goods
rests with local governments, since Ghana has decentralized responsibility for
delivering a range of public amenities such as schools for primary education,
sanitation, primary care clinics, marketplaces, and housing and offices for dis-
trict staff. While districts are statutorily restricted to relatively small projects,
total local government expenditure on capital projects is nonetheless substan-
tial: GHS 317 million (equivalent to just over US $135 million) in 2013, or 42.5
percent of their total revenue.7
6For example, prior to the 2016 election the incumbent launched its “Operation 1 MillionVotes” campaign in the opposition stronghold Ashanti Region seeking to showcase its infras-tructural achievements in the region in order to increase its vote totals (Daily Graphic 2015).I am grateful to Similarly, senior Local Government Service Secretariat (LGSS) officials reportthat local governments also sometimes target opposition areas with projects in a bid to winvotes (Focus group, Accra, 21 November 2016).
7Author’s calculations from Ministry of Local Government and Rural Development budget
6

All districts are headed by a District Chief Executive (DCE) who is ap-
pointed by the President and presides over a directly elected district assembly,
in which 70 percent of members are elected from geographically defined single-
member electoral areas and 30 percent are appointed by the President.8 DCEs
do not have a fixed term and so would expect to serve until their party loses
power or they are removed. Although district assembly elections are formally
non-partisan, district assemblies and DCEs are widely perceived in Ghana as
politicized, partisan actors.9 Assembly members are elected to four-year terms
in elections that occur simultaneously nationwide; these took place in 2010, so
the composition of assemblies was constant throughout this paper’s study pe-
riod of 2011-2013. District bureaucracies are composed of professional public
servants, and the hiring and transfer of personnel is decided centrally.
Project selection is voted on in an annual budgeting process by assembly
members and the DCE. The process begins with the District Planning and Co-
ordinating Unit (DPCU), comprised of bureaucrats, which draws up a prelimi-
nary list of projects that then goes to the Executive Committee of the assembly
for review and amendment.10 The Executive Committee is chaired by the DCE,
and membership is decided jointly by the DCE and the Presiding Member of the
assembly, who is elected by assembly members. The Executive Committee then
puts a project proposal to the full assembly, which debates the list, suggests
priority projects, and ultimately approves the list as part of the final budget. In
practice, however, political negotiations over expenditure priorities are ongoing
data. The Public Procurement Act (2003, Act 663) fixes this threshold at GHS 200,000(approximately USD 85,000). Calculations based on an exchange rate of USD 1 = GHS 2.35at 31 December, 2013.
8Depending on their size, Ghana’s local government units are classified as district, munici-pal, and metropolitan assemblies. These legal and administrative distinctions are not relevantfor this study, so for brevity I refer generically to districts and DCEs.
9Political parties often lend informal support to candidates during district assembly elec-tions (GNA 2015), DCEs are accused of unduly politicizing their roles (Today 2015), and anationwide study by Ghana’s National Commission on Civic Education found that 68.6 per-cent of respondents believed that district assemblies were partisan in their operation (NCCE2015).
10The process varies somewhat across districts. In particular, in some districts the WorksCommittee also plays an important role in feeding project proposals into the Executive Com-mittee (Focus group with four senior LGSS officials, Accra, 21 November 2016).
7

throughout the year, as plans and budgets are often not strictly implemented.11
These ongoing negotiations occur through both formal and informal means: the
assembly itself meets three to four times throughout the year to receive an up-
date on project progress and express their priorities, and may make mid-year
changes to the plan and budget; and informal lobbying and protests by assembly
members, other local elites, and communities in an attempt to influence expen-
diture decisions are common.12 Although DCEs are not formally downwardly
accountable to the assembly, they nonetheless actively seek to maintain their
popularity in districts as persistent protests can lead to their removal by the
President. While DCEs may be the most powerful individual actors in project
selection and expenditure decisions, both formally and informally these deci-
sions are the products not just of the executive’s tactical targeting choices, but
also of a collective choice process that includes other influential district-level
actors.
These choices are made in a context where demand for public goods is great,
but resources are scarce. For example, Kwabre East District Assembly spent
GHS 1.36 million on capital projects in 2013 (just above the national median),
and was comprised of 42 geographically distinct settlements represented by 31
elected assembly members. In the same year, the mean cost for a six-room
classroom block (the modal project type) was GHS 169,909. Even if the dis-
trict spent its infrastructure budget entirely on classroom blocks, it could still
only deliver eight of them within the year – roughly two-thirds of its assembly
members and over four-fifths of its communities would not receive anything.
Yet Kwabre East, as with many other districts, spends these scarce resources
in somewhat puzzling ways. In December 2010, for instance, the Assembly be-
11In a report on districts’ project delivery, the Ghana Audit Service wrote: “The need foran Annual Action Plan to guide the implementation of the assemblies’ programmes seems tobe well-understood since virtually all the assemblies prepared action plans each year. How-ever...[t]hey also did not show commitment to carry through their own plans by implementingthe action plan thereby executing projects outside the action plans.” (2016a, 16)
12For example, in Adansi South District angry residents burned the DCE’s car in protestagainst his failure to deliver promised infrastructure projects to their communities (Ghanaweb2016). Similarly, in a focus group senior LGSS officials stated that real or perceived realloca-tions of projects or resources from one community to another often lead to protests (Accra,21 November 2016).
8

gan construction of a six-room school block in the community of Aboaso that
was expected to be complete within seven months. By the end of 2011 the
construction had only reached the lintel level, however, and by the end of 2013
the project was still not complete despite the expenditure of GHS 50,500. The
non-completion was not due to the lack of the GHS 79,164 it would have taken
to complete the project: between the commencement of the Aboaso school and
the end of 2013, the District Assembly spent over GHS 6 million on other in-
frastructure projects in the district, including starting nine new schools in other
communities (of which it completed four). Similarly, the District Assembly
started a weaving center in the community of Bamang in July 2009 and con-
struction proceeded to the lintel level, but then no further funds were spent
on the project and by 2013 the center still remained unfinished. Meanwhile, a
different weaving center that had been started in another community after the
Bamang center was completed promptly in 2011. This apparent inconsistency
of priorities is a source of great frustration in Ghana among citizens and public
servants alike, with the Ghana Audit Service making some version of the recom-
mendation “that management of the Assemblies should endeavour to complete
these projects before embarking on new ones” no fewer than six times in their
2013 audit report alone (2014, 20).
Districts’ capital expenditures are funded primarily through intergovern-
mental transfers, as is common for local governments in developing countries
(Gadenne and Singhal 2014). The two largest transfers are the District Assem-
blies Common Fund (DACF) and District Development Facility (DDF), both
of which are periodic, lump sum, formula-based transfers to districts (similar to
block grants in a federal system).13 The DACF is funded entirely by the central
13The DACF allocation formula is set each year by Parliament. While there is evidencethat this formula has previously been manipulated to target funds to favored constituencies(Banful 2011), the magnitude of the effect is small and in any case should affect the abso-lute number of projects completed by districts, not the completion rate. The DDF allocationformula is based in part on an annual assessment of compliance with statutory regulationsand administrative processes. Districts that perform better receive incrementally higher allo-cations, while districts that do not meet the minimum requirements do not receive funds forinvestment in that year’s allocation. However, failure to meet minimum requirements has beenrare after first year (prior to this sample) and the disbursements are made with a two-yearlag from the assessment year, and as with the DACF any cross-district differences in quantity
9
government, while the DDF is funded by a multi-donor pool with the central
government also contributing 30 percent co-financing. (For ease of exposition,
I will refer to DACF projects as “government-funded” and DDF projects as
“donor-funded” henceforth.) Funds are transferred to district governments as
a lump sum (i.e. they are not earmarked for specific projects or kept in sepa-
rate accounts), so districts can prioritize and reallocate funds across projects.
Whereas there are no administrative restrictions with respect to expenditure
allocation across government-funded projects, under the donor-funded trans-
fer districts are required to budget to complete existing projects before starting
new ones. Otherwise, the two fund sources are operationally almost identical: in
both cases project selection, procurement, and implementation are entirely con-
ducted at the district level, by the same politicians and bureaucrats and through
the same planning and budgeting process. Both are restricted to spending on
capital investments rather than recurrent expenditures or private transfers, both
are financially audited by the same central government auditors as part of the
routine annual district audit process, and both are administered by small cen-
tral government secretariats to which annual budgets and reports are submitted
but which play no direct role in implementation.
While my primary focus is on district-level projects funded by these two in-
tergovernmental transfers, I also examine a third major source of project fund-
ing, the Ghana Education Trust Fund (“centralized projects” henceforth), under
which districts propose a list of projects from which a central government com-
mittee selects some to fund. Unlike the government- and donor-funded transfers,
for centralized projects resources are not transferred directly to districts but are
used centrally to pay contractors directly for work done in the districts.
of funds received should affect the level rather than rate of project completion. For both fundsources, funds are disbursed to all districts simultaneously so delays in disbursements affect alldistricts equally, and there is no evidence of any differential delay or manipulation of releasetiming. During my study period of 2011-13, there was no statistically significant correlationbetween the ruling party’s vote share in a district and districts’ revenue outturns (calculatedas actual revenue divided by budgeted revenue), either for these intergovernmental transfersor total district revenue.
10

Unfinished projects as dynamically inconsistent
collective choice
This section presents a theory of project selection and implementation as collec-
tive choice, and sets out the observable implications of this theory in the context
of decentralized public good provision in Ghana. I then discuss two alternative
political economy-related explanations - corruption and clientelism - and their
observable implications.
Collective choice and project delivery
While theories of distributive politics in developing countries have largely viewed
expenditure decisions as the tactical choices of a unitary incumbent (Golden and
Min 2013), in many contexts expenditure choices are made not by a unitary in-
cumbent but by a group of political actors who have different distributive pref-
erences. The canonical scenario is a legislature that must collectively select a set
of projects that each deliver benefits to only one constituency. No legislator has
an incentive to support a project in any other constituency, but each needs the
support of others in order to gain majority approval of their own project, and so
legislators must assemble coalitions by agreeing to vote for each other’s projects.
This is often referred to as “logrolling” over pork-barrel projects. Since not all
projects can be implemented simultaneously and not all votes occur simultane-
ously - non-contemporaneous benefit flows and non-simultaneous exchange, in
Weingast and Marshall’s (1988) terms - forming vote-trading coalitions requires
intertemporal bargaining among legislators. But these intertemporal bargains
- vote for my project this year, and I will vote for your project next year -
are difficult to maintain, since legislators who have just received a project have
an incentive to renege on their promise ex post. Knowing this, non-recipient
legislators have little incentive to sacrifice their own immediate self-interest (re-
ceiving a project in their constituency) in order to support another legislator’s
project. These commitment failures make coalitions inherently unstable, as any
11

structure of actor preferences that enables bargaining also enables voting cycles,
making any existing coalition vulnerable to an alternative proposal (Riker and
Brams 1973).
Political bargaining over projects in developing country contexts such as
Ghana’s local governments is typically not as formalized as logrolling in the US
Congress, given the importance of informal politics and the relative weakness
of legislatures, and may have de facto decision rules that are more complex or
ambiguous than a simple majority vote. However, the project selection and de-
livery process in Ghana shares the key features of logrolling: spatially-targeted
projects that deliver concentrated benefits to one political actor but few or no
benefits to other actors; the necessity of nonetheless gathering some degree of
support from non-recipient actors; and the time-inconsistency and thus instabil-
ity inherent in the resulting intertemporal bargains. Senior Local Government
Service officials also confirm the existence of these dynamics: while individual
assembly members are primarily interested in projects in their own areas, formal
and informal vote trading does occur as members seek broader support for their
projects, and resources that had been allocated to one community are often
reallocated later, leading to protests from the community.14
While project implementation (as distinct from selection) is not a feature of
existing formal models of collective choice, it is straightforward to see how the
instability of collective expenditure priorities could affect development projects
that are not instantaneously implemented. As Figure 2 illustrates, the technical
and contractual process of constructing even small projects involves not just
an initial phase of project selection and budgeting, but also an iterated process
of construction (by the contractor) followed by payment (by the government)
throughout the life of a project. A six-room school in Ghana, for example, has
a median expected project duration of five months and may be divided into five
payment tranches, the non-payment of any of which can lead the contractor to
14Such protests occur in both opposition- and government-supporting communities. Focusgroup with four senior Local Government Service Secretariat officials, Accra, 21 November2016.
12

stop work until payment is made. Since each disbursement on a project takes
funds away from other potential projects, each payment tranche effectively re-
quires a reaffirmation of collective expenditure priorities. The more unstable
these collective priorities are, the more likely it is that a project will be inter-
rupted with no guarantee when (or if) its completion will once again become a
collective priority. The effect of this political instability is aggravated by techni-
cal and contractual characteristics of infrastructure projects: mid-project delays
increase the cost of completing the project due to interest costs, physical decay
in exposed works, and eventual relocation of the contractor’s staff and plant.15
Since the contract sums of small development projects are typically not indexed
to inflation or exchange rates, these cost increases can render further work on
contracts unprofitable for contractors after even relatively short delays.
Figure 2: Stylized timeline of a small infrastructure project
Final payment
Selection and
budgetingFirst
payment
Second phase of
workSecond
paymentComplete
workProcure-
ment
First phase of
work
While novel to the political economy literature, the idea that unstable polit-
ical support coalitions can affect project implementation features prominently
in the qualitative policy implementation literature within public administra-
tion. For example, Pressman and Wildavsky note in their classic study of ur-
ban development projects in Oakland that “Agreements [among project stake-
15For example, Flyvbjerg, Holm, and Buhl (2004) estimate that each year of delay ontransportation projects in OECD countries is associated with a 4.6 percent cost increase;in developing countries with higher inflation and interest rates and weaker legal systems,this figure would presumably be even larger. The Ghana Audit Service has also noted that“[d]elay in project execution eventually results in additional cost as prices of building materialscontinue to rise” (2014, 95). The cost of mid-project interruptions also explains why onestandard response to coalition instability - the formation of universal or oversized coalitions(Weingast, Shepsle, and Johnsen 1981) - is an inadequate solution. Since projects (unliketransfers or budget allocations) are non-fungible there is a limit to which they can be sub-divided to spread benefits more widely, and simultaneous implementation of too many projectsnecessarily leads some to be interrupted.
13

holders] were reached, eroded, and remade. The frequent calls for coordina-
tion. . . reflected the inability of the machinery for implementation to move fast
enough to capture the agreements while they lasted” (1984 [1973], 92). Sim-
ilarly, political actors in Ghana express concern that the government’s ability
to efficiently provide public goods is undermined by its inability to simultane-
ously satisfy all the distributive demands on it. This is perhaps most clearly
illustrated in a speech by the President of Ghana, John Mahama:
“We all have demands on government but we have to be moderate
in these demands in order that we do not disrupt the budget and
government expenditure. . .As the head of your family, you cannot
provide all that your family needs at once. . .Alhassan needs a shoe,
Fuseini needs a bicycle, your wife needs a new cloth, and your mother
needs a refrigerator. You cannot provide all these at once and so
what you have to do is to prioritize. . .The fact that government has
not yet provided a certain development that was requested does not
mean that government will not provide it.” (TV3 Network 2015)
The President’s invocation of a familial metaphor to explain the necessity
of sequencing project delivery, and his pleading with voters for patience “in or-
der that we do not disrupt the budget and government expenditure”, concisely
summarizes both the necessity and difficulty for politicians of intertemporal
bargaining over the delivery of public goods, as well as the negative efficiency
consequences of failing to maintain these agreements. District-level actors also
express similar concerns about how distributive pressures can undermine project
execution. At a public hearing about a project audit, the bureaucratic head of
Sekyere South district explained that the district bureaucracy “implements rec-
ommendations from the General Assembly. They have reduced projects but the
citizens keep demanding projects...They [the General Assembly] try to prioritise
but it is not easy to do so” (Ghana Audit Service 2016b, 68). A senior Audit
Service official involved in project audits explained the consequences of having
14

to pay for the constant stream of new projects: “It’s not shown that it’s being
taken from the budget, but what it means is that the other projects won’t be
completed. And unfortunately these districts, a lot of the projects that they
start they don’t complete.”16
Observable implications
These collective choice dynamics cannot be examined directly in my empirical
case, as much of the bargaining is informal and there is no data on proceedings
and voting in district assemblies in Ghana (as is the case with local-level gover-
nance in many developing countries). I instead identify the impact of collective
choice failures indirectly, by making theoretical predictions about characteristics
of districts and fund sources that are likely to make sustaining intertemporal
bargains over project distribution more (less) challenging, and thus lower (raise)
completion rates.
Legislative institutions such as committees that enable agenda-setting and
facilitate enforcement through rewards or punishments are key to resolving prob-
lems of the durability and enforceability of legislative bargains (Weingast and
Marshall 1988, Baron and Ferejohn 1989). In the Ghanaian context, the ex-
ecutive is more likely to be able to stabilize local project support coalitions in
districts that are politically aligned with the ruling party, due to two asym-
metries in the structure of district governance in Ghana: the DCE is always
appointed by the President, regardless of district vote shares; and in every dis-
trict 30 percent of assembly members are appointed by the President to at-large
seats.
DCEs can use their powers of ex ante agenda-setting - through their control
of the DPCU, their chairing of the powerful Executive Committee, and their
influence on committee memberships - and ex post implementation of assembly
decisions to try to ensure that started projects get finished. However, their
incentives to do so are much stronger when these projects benefit the ruling party
16Telephone interview, senior officer in the Performance Audit division, 27 January, 2017.
15
- projects which incumbent-leaning assemblies are more likely to have started
in the first place. Since DCEs control many non-project aspects of expenditure,
they can also use other side-payments to induce cooperation from assembly
members. Not only are they likely to be more willing to do so with respect to
members of their own party but they may also be better able to commit to doing
so due to the availability of intra-party sanctioning mechanisms. The Presiding
Member of the assembly can also help stabilize resource allocations through
their committee appointment powers, but this power is likely to support the
DCE’s efforts when they are co-partisans and work at cross-purposes when they
are not.
There is ample qualitative support for the idea that DCEs selectively use
their formal and informal powers to coordinate with co-partisans on project
delivery. Local Government Service officers confirm that DCEs and opposition
assembly members often have different preferences on project locations, stating
that “DCEs in opposition strongholds will have a fight” to agree on project
locations with the assembly.17 Similarly, Nathan (2016, 8) quotes one NDC
assembly member as explaining, “He’s [the DCE] a government appointee and
I’m also from the same government. . . He listens to the NDC assembly members
more than the others. It’s the norm”, while in contrast an NPP assembly mem-
ber lamented, “But then your project, you have to spend years chasing it before
you get the money. . . I don’t bother going to the [DCE’s] office. . . because the
[DCE] has his own agenda, his own political agenda. . . The other assemblymen
will have finished their projects, and they’ll be saying no money for you.”
Likewise, whereas the electoral incentives and thus project distribution pref-
erences of elected assembly members are divided between bringing projects to
their own electoral area and supporting projects in other areas that would be
electorally beneficial to their party, the incentives of the appointed assembly
members are to support whatever projects will be electorally beneficial for the
incumbent. This is consistent with qualitative accounts of appointed members’
17Focus group, Accra, 21 November 2016.
16

partisan affiliations, with (for example) a former president of the National As-
sociation of Local Government Authorities of Ghana stating “about 95 percent
of the appointees to the assembly by the President belong to the party of the
President” (Citi FM 2016). Appointed assembly members can thus act as a
stabilizing force for project support coalitions of elected members, but have
stronger incentives to do so when these coalitions are comprised of members of
their own party.
Project completion should therefore be positively correlated with the dis-
trict’s partisan alignment with the ruling party, which I proxy by the ruling
party’s vote share in the presidential election preceding the study period.18
However, a simple test of this prediction using cross-district variation in par-
tisan vote shares and project completion could be biased due to the potential
endogeneity of voting patterns and public good provision or to unobservable
confounds more generally.
Instead, I exploit within-district variation in the completion of projects across
different fund sources. As discussed above, the donor-funded transfer pro-
gram’s rule that districts must budget to finish ongoing projects before starting
new ones makes donor-funded projects less vulnerable than government-funded
projects to collective choice failures, by strengthening non-recipient assembly
members’ incentives to complete ongoing projects located outside their electoral
area. The within-district difference between donor- and government-funded
project completion rates should thus be an indicator of the impact of collec-
tive choice failures on project completion.19 This funding rule is likely to have
18District-level election results would provide a more precise proxy, but they are formallynon-partisan. The effect of ruling party vote share could, in theory, be non-linear, if theopposition party is numerically dominant enough in some districts to form stable coalitions andalso bargain effectively with the appointed DCE. However since only 70 percent of assemblymembers are elected, the opposition would need to win over 95 percent of elected assemblyseats to reach the two-thirds threshold of the assembly that is necessary to revoke or block aDCE’s appointment. In practice this is unlikely, since the opposition’s maximum vote sharein any district in the 2008 presidential elections was 88 percent.
19Even with perfect enforcement, this rule should reduce, but not necessarily eliminate, theincidence of such collective choice failures on project completion. In practice the monitoringand enforcement of the rule is also likely to be imperfect. The within-district differencebetween donor- and government-funded completion rates is therefore likely to understate thetrue effect of collective choice problems on non-completion.
17

the strongest effect in districts that are politically aligned with the opposition
party, where these collective choice failures are most acute.
The key observable implication of the collective choice theory is therefore
that the completion rate of government-funded projects should increase in dis-
tricts with higher ruling party vote share relative to the completion rate of
donor-funded projects in the same district. Since this prediction relies on within-
rather than across-district variation in completion rates, it is possible to control
for the observable and unobservable characteristics of districts, as well as for the
politicians and bureaucrats selecting and implementing the projects, thus elim-
inating concerns about endogeneity and unobservable district characteristics.
A further implication of the idea that the ruling party’s vote share in a
district is a proxy for district-level collective choice failures (rather than a char-
acteristic on which the incumbent tactically targets completion) is that vote
share should have no effect on the completion of centrally delivered projects in
the district. The completion rate of centralized projects relative to the com-
pletion rate of donor-funded projects should therefore be unrelated to district
ruling party vote share.
Alternative explanations: corruption and clientelism
There are two other plausible explanations for project non-completion, in which
non-completion is a deliberate outcome rather than a collective choice failure.
First, non-completion could be caused by a specific form of corruption: projects
could be left incomplete if contracts were given to favored contractors who are
paid for the work but placed under little pressure to complete it. This would
enable the contractors to keep as profit or pay as kickbacks the cost savings
from not completing the project.20
20Corruption in the form of aggregate diversion of funds (e.g. Reinikka and Svensson2004), as opposed to project-specific embezzlement or kickbacks, seems less plausible as adriver of project non-completion. Even if a percentage of a district’s total funds were divertedfrom the infrastructure budget, it is not clear why reelection-seeking incumbents would notspend the remainder on fully completing a smaller number of projects. Aggregate resourcediversion should therefore reduce the absolute number of projects completed rather thanthe completion rate, especially when project funds are drawn from a general pool and are not
18

While this type of corruption on the “quantity” margin - as opposed to the
quality and price margins that the existing literature has focused on (Olken
2007; World Bank 2011) - has not previously been documented, it does have
a clear empirical implication: financial expenditure on non-completed projects
should be greater than the physical progress of construction on these projects.
In effect, this test is analogous to Olken’s (2007) well-known indicator of “miss-
ing expenditures”, albeit where the “missing” expenditure is on the quantity
rather than the quality margin. In contrast, an observable implication of the
collective choice theory is that the “missing expenditures” measure described
above should be negative, reflecting underpayment to contractors for work done,
as projects are interrupted mid-construction by non-payment due to shifting col-
lective expenditure priorities.
Second, non-completion could be the outcome of a clientelist strategy by the
ruling party to use project completion decisions as a way to reward or punish
voters. However, existing theories of clientelism as tactical targeting of voters
overwhelmingly focus on the allocation of projects, not their completion, so
on their own these theories do not explain why a government would choose
to allocate its scarce resources to begin a project in a particular community,
but then not finish it. This observation is not to challenge the prevalence of
clientelism in project allocations or voting patterns in Ghana or elsewhere, on
which there is a large and well-established literature (cf. Golden and Min 2013),
but rather to distinguish theories of the distribution of projects (which is not
my focus) from theories of the implementation of these projects conditional on
them having been started (which is).
Nevertheless, one way in which clientelist dynamics could lead to project non-
completion is if politicians deliberately leave projects incomplete before elections
earmarked for specific projects, as is the case in my empirical setting. Similary, the explanationthat unfinished projects are simply used by politicians as a way to direct private transfers tocommunities in the form of labor income seems implausible as a general explanation of projectnon-completion, as a politician could deliver the same private benefits by seeing a projectthrough to completion and also reap the additional political benefits of having provided auseful local public good. Even if politicians were motivated solely by the pecuniary gainsto private individuals from public projects, it is unclear why a politician would opt to onlypartially implement such a project when completing it would entail even more such payments.
19
due to voters’ inability to credibly commit to reward projects with votes. This
alternative version of the clientelism theory builds on the logic underlying theo-
ries of clientelism as a two-way credibility problem (Robinson and Torvik 2005;
Robinson and Verdier 2013). While project completion is not the focus of these
models, the logic of two-way credibility problems - that politicians sometimes
find it rational to make apparently inefficient public expenditure choices in order
to “tie the continuation utility of a voter to their political success” (Robinson
and Verdier 2013, 261) - could potentially be applicable to project completion.
If credit-claiming dynamics make the incumbent more likely than a challenger
to complete a project started by the incumbent, starting but not finishing a
project would increase nearby voters’ incentives to vote for the incumbent, and
so immediately before an election incomplete projects may actually be more
desirable from the incumbent’s point of view than completed projects.
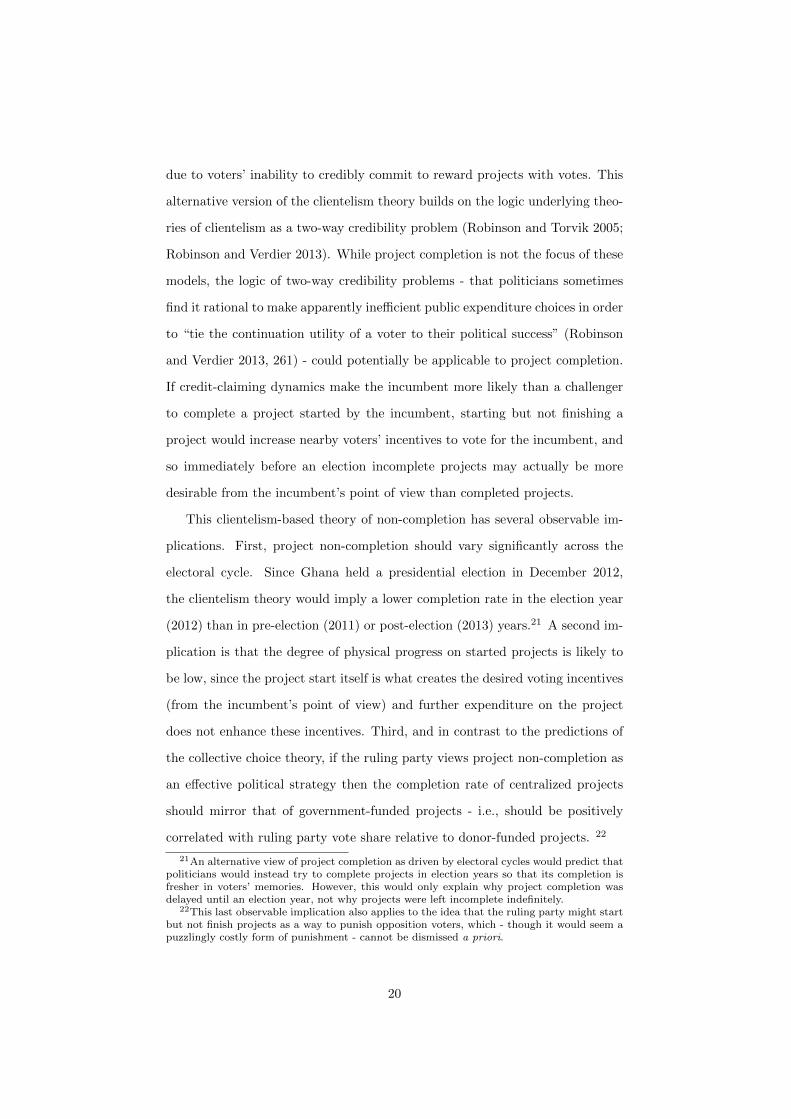
This clientelism-based theory of non-completion has several observable im-
plications. First, project non-completion should vary significantly across the
electoral cycle. Since Ghana held a presidential election in December 2012,
the clientelism theory would imply a lower completion rate in the election year
(2012) than in pre-election (2011) or post-election (2013) years.21 A second im-
plication is that the degree of physical progress on started projects is likely to
be low, since the project start itself is what creates the desired voting incentives
(from the incumbent’s point of view) and further expenditure on the project
does not enhance these incentives. Third, and in contrast to the predictions of
the collective choice theory, if the ruling party views project non-completion as
an effective political strategy then the completion rate of centralized projects
should mirror that of government-funded projects - i.e., should be positively
correlated with ruling party vote share relative to donor-funded projects. 22
21An alternative view of project completion as driven by electoral cycles would predict thatpoliticians would instead try to complete projects in election years so that its completion isfresher in voters’ memories. However, this would only explain why project completion wasdelayed until an election year, not why projects were left incomplete indefinitely.
22This last observable implication also applies to the idea that the ruling party might startbut not finish projects as a way to punish opposition voters, which - though it would seem apuzzlingly costly form of punishment - cannot be dismissed a priori.
20

Table 1: Observable implications of theories of non-completion
Theory Observable implications
Collective choice • Completion rate of government-funded projects positively corre-lated with district ruling party vote share, relative to completionof donor-funded projects• Completion rate of centralized projects uncorrelated with dis-trict ruling party vote share, relative to completion of donor-funded projects• Non-completion associated with underpayment to contractorsrelative to physical progress on the project
Corruption • Non-completion associated with overpayment to contractorsrelative to physical progress on the project, i.e. “missingexpenditures”
Clientelism • Completion rates vary across electoral cycle; lower in 2012 than2011 or 2013• Level of physical progress and expenditure on incompleteprojects typically low• Completion rate of centralized projects positively correlatedwith district ruling party vote share, relative to completion ofdonor-funded projects
Finally, there could also be other causes of project non-completion that are
outside the scope of this paper, either because they are not directly related to
political economy dynamics or because they are not relevant in my empirical
context. Examples of the former could include the competence of bureaucrats
and contractors, geographical or economy characteristics of communities, dis-
trict budget sizes, or simple bureaucratic turnover, which I am able to fully
control for empirically and thus should not bias the analysis. Examples of fac-
tors that are not relevant in my context could include elections that lead to
the incumbent’s removal or severe economic shocks that lead to unanticipated
fiscal contractions, although it is easy to see how these could also cause project
non-completion in other contexts. I discuss the scope conditions of this paper’s
theoretical argument further in Section .
Measuring and describing non-completion
Data
To measure the completion of infrastructure projects, I collected, digitized, and
coded all available district Annual Progress Reports (APRs) for the years 2011-
21

13. These reports are written annually by each district’s bureaucracy and sub-
mitted to the central government, and include a table listing basic information
about projects that were ongoing or active during the calendar year (Appendix
A). Altogether it was possible to locate 479 out of a potential 602 district-year
APRs (79.6 percent), of which 407 (67.6 percent) had sufficient information to
be entered into the database.23 After cleaning and removing non-infrastructure
projects, this yielded a database of 14,246 project-year observations, which is
the core dataset used in this study’s analysis.
Figure 3: Project type by fund source
0 .25 .5 .75 1Percentage of projects
All others (n=7,354)
Centralized (n=2,030)
Donor-funded (n=2,274)
Gov't-funded (n=2,588)
Note: See text and appendices for details of fund source and project type categories. Projectscoded as multiple or missing types or fund sources included in 'All others'.
School Staff housing Latrine Road Culvert Office All others
Tracking the progress of projects across years is challenging, since many
projects do not have commencement dates reported, few districts make use of
unique project identification numbers, data is censored before 2011 and after
2013, and many incomplete projects attrite out of the dataset. I use three
alternative methods of linking project observations across years and take nu-
merous steps to verify that the key results are not being driven by reporting
23Project completion rates and other district characteristics are balanced across districts’reporting completeness (Appendix B).
22

bias, attrition, or double-counting; these are reported in Appendices D, E, and
F. Most importantly for my empirical strategy, Appendix D shows that attri-
tion is uncorrelated with project fund source and thus should not bias my main
estimates.
All reports were manually double-entered into the database and variables
were coded through text-matching from these strings, with manual disambigua-
tion for key variables (see Appendix C). Projects were coded into 17 different
basic “types”, such as schools, clinics, and staff housing. The category “schools”
was broken down into five sub-categories according to the number of classrooms,
leaving a total of 22 project type categories. Project completion was coded for
each observation as a binary variable by combining information from three raw
variables. For instance, project completion was coded as 1 for values such as
“COMPLETE”, “100%”, or “INSTALLED AND IN USE”, and 0 for values such
as “ONGOING”, “90%”, or “LINTEL LEVEL”.24 I validated the accuracy of
districts’ completion reporting in several ways, including site visits, comparison
against smaller datasets on project completion compiled through independent
evaluation reports, interviews, and alternative government data sources, and
found no evidence of systematic bias or misreporting of completion status in
the reports (Appendix E).
In addition, for 140 districts I was also able to digitize District Medium-
Term Development Plans. These were three-year plans written in late 2010
that included tables of planned development projects through 2013, and for the
subset of districts with no missing APRs, I linked these planned projects (using
the same procedure as linking across years of the APRs) to records of actual
projects undertaken over the plan period from the APR dataset.
24I focus on the physical completion of projects because it directly corresponds to thispaper’s theoretical question about why a government would fail to complete a project it hadstarted. However, it should be noted that my measure of project completion may differ fromthe actual utility communities derive from the projects: some completed projects may not bein use, and some projects nearing completion could be used by communities without beingfully functional. Unfortunately I lack data on project use or user satisfaction to quantify thisdirectly; doing so would be a useful extension for further research.
23
Extent, dynamics, and costs of non-completion
Less than half of projects (45.8 percent) were finished within their first year of
implementation, and even after three years 35.5 percent remained unfinished.25
These low completion rates were not due to long completion schedules: the
median project had a scheduled duration of five months and 88.8 percent were
scheduled to be complete within twelve months. The completion hazard rate
decreases after the first year of a project: conditional on not being complete
after one year, over half of projects see zero or near-zero physical progress in
the subsequent year.26 A similar bifurcation of project outcomes is evident when
examining delays: the median completed project was delayed by just one month,
81.0 percent were finished in less than twelve months, and just 10.7 percent were
delayed by a year or more. The median incomplete project, however, is twelve
months past its expected completion date – a 200 percent delay – and there
is a long tail of over a quarter of incomplete projects that are more than two
years past their planned completion date. These dynamics are consistent across
project types, as Figure 4 shows for the three most common types.
While the availability of only three years of data makes it impossible to
directly observe the eventual completion rate of projects left incomplete after
three years, 99.5 percent of projects were scheduled to be completed within three
years, and examining the completion dates of completed projects reveals that
just 2.9 percent of completed projects took three years or more to complete.
Assuming that the past distribution of project completion times reflects the
time-to-completion distribution of projects started in a given year, extrapolating
this rate out from the observed three-year completion rate implies that 33.5
percent of all projects are never completed.27 Of course, this estimate is based on
the available three-year window of data that may or may not be representative
25Appendix D presents upper- and lower-bound estimates for these completion rates underalternative methodologies.
26Reported progress is precisely zero for 32.7 percent of projects and is 10 percent or lessfor 55.0 percent.
27If 64.5 percent of all projects were completed in three years or less and 2.9 percent ofcompleted projects were completed in more than three years, then the percentage of projectsever completed is given by 0.645 + 0.029 ∗ (0.645 + 0.029) = 0.665.
24

Figure 4: Project completion
0
.25
.5
.75
1
Cum
ulat
ive
Com
plet
ion
Rat
e
0 1 2 3Project year
All projects Latrines Staff housing Schools
Note: Sample is all projects from districts with all three years of data.
within Ghana, and thus project completion rates could be lower or higher in
other time periods (or other countries).
A key observable implication of the clientelism theory of non-completion is
that project completion rates should vary across the electoral cycle, and be lower
in the election year, 2012. However, Figure 5 shows that there is no statistically
significant variation in completion rates across years for government- or donor-
funded projects. Completion rates are actually slightly higher in the election
year for centralized projects for which the central government is responsible for
implementation, suggesting that - if anything - the incumbent views complet-
ing projects just prior to elections as more electorally beneficial than leaving
them unfinished. While electoral cycles could affect project completion in other
contexts, particularly if the incumbent loses, in this case the phenomenon of
unfinished projects is remarkably consistent across the electoral cycle.
Most unfinished projects have had a significant amount of work done on
them: projects that remain unfinished after their third year average 64.9 percent
25

Figure 5: Non-completion not driven by electoral cycle
0
.25
.5
.75
1
Ann
ual c
ompl
etio
n ra
te
2011 2012 2013 2011 2012 2013 2011 2012 2013 Government-funded Donor-funded Centralized
Note: Sample is all projects less than three years old (using project commencement date) within each fund source.95% confidence interval shown. Election in December 2012.
physical completion and have seen 55.5 percent of the contract sum disbursed
to the contractor. The heavy investment into unfinished projects contradicts
a key observable implication of the clientelism explanation for non-completion,
and also illustrates the fiscal and social costs of non-completion. If 33.5 percent
of projects are never finished and expenditure on these averages 55.5 of the
contract value, a back-of-the-envelope calculation suggests that 18.6 percent
of total local government capital expenditure is spent on projects which will
never be finished. Scaling this by the total capital expenditure of Ghana’s local
governments in 2013 of USD 135 million implies annual spending on never-
to-be-completed projects of approximately USD 25.1 million. If this wasted
expenditure were to be spent entirely on new three-room school buildings, it
would be enough to fully construct 667 additional schools per year, so the social
opportunity cost of non-completion is also substantial.28
To examine the observable implications of the corruption and collective
28Based on the mean contract sum of a new three-room classroom block in 2013 of GHS88,389.09 (USD 37,612.38).
26

choice theories of non-completion related to over- and under-payment of con-
tractors, I construct a two-sided analog to Olken’s (2007) missing expenditures
measure by subtracting the percentage of physical construction that has been
completed on a project from the percentage of the contract’s value that has
been paid by the district to the contractor. Positive values would be consis-
tent with corruption in procurement - either through kickbacks or by selecting
politically connected contractors who are paid but not put under pressure to
finish projects - as a cause of non-completion, while negative values would be
consistent with non-payment of contractors due to districts’ unstable collective
expenditure choices. Of course, positive values may also be due to factors other
than corruption, such as project cost overruns, so this measure likely overstates
the extent of corruption-related overpayment. While the relationship between
these values need not be strictly linear, depending on the details of contracts
and construction, for these small projects there are unlikely to be large discon-
tinuities and for completed projects at least they should be equal. Appendix
E discusses steps taken to validate these completion measures and shows that
underpayment is not explained by normal time lags in processing payment.
Empirically, Figure 6 shows that underpayment of contractors is far more
common than overpayment. For incomplete projects, underpayment by 10 per-
cent or more is over three times more frequent than overpayment by 10 percent
or more, and for completed projects underpayment is over sixteen times more
common than overpayment. This is the opposite of what would be observed if
corruption on projects were a significant driver of non-completion, but is consis-
tent with project interruptions driven by unstable collective priorities: projects
start, the contractor does part of the work, but at some point during construc-
tion the government’s collective priorities shift and the government thus fails to
make a payment for work done, so construction stops.29
The prevalence of underpayment is also consistent with qualitative accounts
29While an exact calculation of the cost to contractors of underpayment would requiregreater detail on construction costs and contracts than is available, a naıve estimate based onthe 9.4 percentage point difference between average physical progress and payment disburse-ment would imply USD 12.7 million in annual underpayment to contractors.
27

Figure 6: Missing expenditures and underpayment for completed work
0
10
20
30
Pct.
-100 -80 -60 -40 -20 0 20 40 60 80 100Pct. contract sum disbursed minus pct. work complete
a: Completed projects
0
10
20
30
Pct.
-100 -80 -60 -40 -20 0 20 40 60 80 100Pct. contract sum disbursed minus pct. work complete
b: Incomplete projects
Note: Sample is 2,810 projects with data on contract sum, expenditure to date, and percent work completed.
of frequent complaints by contractors in Ghana about delayed- and non-payment
by government (Abotsi 2013) and with the conclusions of central government
auditors (Ghana Audit Service 2016a; see Appendix E). The link between
districts’ failure to pay contractors for work done and districts’ shifting collective
expenditure priorities has also been noted by auditors: a 2013 report of districts’
spending of statutory funds criticized “the failure of the Assemblies to complete
and pay for projects before embarking on new ones” and “recommended that
management of the Assemblies should endeavour to discharge all obligations
on time and also ensure completion and payment of ongoing projects before
commencing new projects” (Ghana Audit Service 2014, 19).30
Finally, comparing planned projects to actual projects reveals a high degree
30This underpayment to contractors was not due to overall fiscal contractions or unex-pected budget shortfalls: mean MMDA revenue grew by 8-9 percent annually from 2011-13,just slightly below the rate of inflation, so budget sizes were roughly stable in real terms. Fur-thermore, district-level revenue shortfalls do not seem to predict project completion rates inthe data. District-year annual outturns of both total revenue and transfer revenue (calculatedas actual revenue divided by budgeted revenue) are actually slightly negatively correlated withproject completion rates, although these are not statistically significant at conventional lev-els. In any case, district-year fluctuations in revenue would be controlled for by the empiricalspecification used in Section below.
28

of instability in district expenditure priorities. For the 39 districts with digitized
medium-term plans and all three years of APR data, on average only 5.7 percent
of projects that districts planned for the period were actually started, and only
3.8 percent of projects reported in the APR database could be identified in the
plan for the period.31 These patterns are consistent with the premises of the
collective choice theory that there is a large number of potential projects for
which demand exists, and a great deal of temporal instability in which projects
are recognized as collective priorities at any given moment.
Analysis
Empirical strategy
To examine the remaining observable implications of the collective choice and
clientelism theories, I estimate a linear probability model (LPM) of the form:
yi,j,k,t = FSi,j,k,tβ + FSi,j,k,t ∗ Vk ∗ τ + Pi,j,k,tγ + λj + θk,t + εi,j,k,t (1)
where yi,j,k,t is a binary indicator of completion of project i of type j in district k
and year t,32 FSi,j,k,t is a vector of fund source indicator variables (government-
funded and centralized, with donor-funded the omitted category), Vk is the vote
share in the district of the ruling party during the study period (the NDC)
from the first round of the 2008 presidential elections33, Pi,j,k,t is a vector
31I discuss attrition in linking in more detail in Appendix D, but even with a generousallowance for measurement error the correspondence between planned and actual projectswould still be extremely low.
32Due to left and right censoring in the data and missing district-year observations, I amrestricted to using as a dependent variable the annual completion rate - whether a project-year observation was completed during that year - rather than whether the project was everfinished. I estimate the model using LPM due to the large number of fixed effects (thousands,in some specifications) which make estimation by logit or probit impractical and potentiallybiased. Appendix F provides evidence that the results are not driven by these modelingchoices.
33Vk is not included by itself in the main model because it is time invariant and is thusabsorbed by the district-year fixed effects. Ghana has a strongly two-party dominant system:the NDC and NPP were the top two parties in every constituency nationwide in the 2008election and there were only a small number of constituencies where any third party obtained
29
of project characteristics including construction type (i.e. new construction vs.
maintenance or repair) and the number of years since project start, λj is a vector
of project type fixed effects, θk,t is a vector of district-year fixed effects, εi,j,k,t
is an error term, and β, γ, and τ are vectors of parameters to be estimated.
The parameters τ are of primary analytical interest. The parameter τGov′t
represents the marginal effect of partisan vote share on government-funded
project completion relative to the marginal effect on donor-funded project com-
pletion. A positive τGov′t would be consistent with the key observable impli-
cation of local-level collective choice failure in project completion. The iden-
tifying assumption is that any correlation between the within-district donor-
government completion rate gap and the district’s partisan alignment is driven
only by the collective choice mechanism discussed above, so other factors could
cause differences between the overall completion rates of donor- and government-
funded projects without biasing my analysis so long as they are uncorrelated
with district vote share Vk. Selection of projects into fund sources on unobserv-
able project characteristics is the major concern with this assumption’s validity,
but I show below that such selection effects appear to generate, if anything, a
downward bias on τGov′t and thus understate the true effect.
In turn, the parameter τCentral shows the marginal effect of district parti-
san vote share on centralized project completion relative to its effect on donor-
funded project completion. This interaction term functions similarly to a placebo
test, in that if the effect τGov′t is driven by district-level collective choice failures,
then τCentral should be zero since these district-level collective choice processes
should not impact project completion decisions by the central government. On
the other hand, if τCentral is also positive, then τGov′t could be reflecting a de-
liberate clientelistic strategy by the government which it is somehow constrained
in employing with donor-funded projects.
a significant number of votes, so the ruling party vote share is almost perfectly correlatedwith other measures of partisan alignment, such as the winning margin or margin betweenthe NDC and the NPP.
30

Interaction of fund source and partisan alignment
I begin by estimating a simplified version of Equation 1 (Table 2, Column 1) on
the sample of government- and donor-funded projects, with no fund source-vote
share interaction term and with district-year random effects rather than fixed ef-
fects to enable the inclusion of the time-invariant variable Vk (NDC vote share).
As expected, the coefficient on the Government-funded dummy is negative -
government-funded projects have a conditional annual completion probability
10.9 percentage points lower than that of donor-funded projects34 - and the
coefficient on NDC vote share is positive, although not statistically significant.
This direct test of the effect of NDC vote share is potentially misleading for
two reasons, however: first, it assumes that this effect will be the same for both
government- and donor-funded projects; and second, it does not fully control
for district characteristics that could be correlated with both project completion
and NDC vote share.
To address the first issue, Column 2 adds the Gov’t-funded * NDC vote
share interaction term. Consistent with the collective choice theory, the effect
of NDC vote share is entirely driven by government-funded projects: τGov′t is
positive and statistically significant (p = 0.031), while the main effect disappears
entirely.
34This point estimate using the annual project completion is smaller than the three-yearcompletion difference between donor- and government-funded projects of 14.5 percentagepoints. Using annual completion rather than eventual completion thus diminishes the magni-tude of the estimated differences between fund sources, so this analysis if anything underesti-mates the true effects of other covariates on eventual project completion.
31

Table 2: Interaction of project fund source and partisan vote share
(1) (2) (3) (4) (5) (6) (7)
Government-funded -0.109 -0.226 -0.229 -0.214 -0.214 -0.225 -0.215(0.023) (0.060) (0.062) (0.059) (0.077) (0.078) (0.089)
NDC vote share 0.111 -0.028(0.084) (0.115)
Gov’t-funded * NDC vote share 0.252 0.258 0.238 0.257 0.316 0.344(0.116) (0.122) (0.115) (0.145) (0.149) (0.176)
Centralized -0.215 -0.254 -0.286 -0.071(0.071) (0.081) (0.099) (0.144)
Centralized * NDC vote share -0.069 -0.016 0.099 -0.137(0.127) (0.152) (0.175) (0.250)
District-Year random effects Yes YesDistrict-Year fixed effects Yes Yes YesCommunity fixed effects YesCommunity-year fixed effects YesContractor fixed effects YesDistrict-Year groups 327 327 327 338 186Community groups 2934Community-year groups 3650Contractor groups 2592R2 0.103 0.106 0.374 0.353 0.727 0.810 0.813N 4563 4563 4563 6460 5483 5483 4655
Note: Dependent variable is project completion. All specifications include: fixed effects for 22 project types,with schools grouped by number of classrooms; construction type (construction or maintenance); and indicatorsfor number of years since project start. Year fixed effects included in Columns 1-2 and 6. NDC vote share2008 is the ruling party’s voteshare in the 2008 presidential elections in the district (or its antecedent district,for districts that split in 2012). Huber-White robust standard errors clustered by district-year in Columns 1-4,by contractor in Column 5, by community in Column 6, and by community-year in Column 7.

Column 3 presents the full model in Equation 1, using district-year fixed
effects to fully control for all observable and unobservable district characteristics,
both time-variant and -invariant.35 The coefficient τGov′t remains positive and
statistically significant (p = 0.035). The estimated effect is also economically
important: a one standard-deviation increase in the ruling party’s 2008 vote
share in the district (16.9 percentage points, from a mean of 49.7) is associated
with a 4.36 percentage point decrease in the donor-government completion rate
gap.36 This is equivalent to closing 39.8 percent of the total completion gap
between donor- and government-funded projects. In absolute terms, a new six-
room school in a district at the 5th percentile of NDC vote share (corresponding
to a strongly opposition-supporting district where the NDC received only 21.1
percent of the vote) would have an estimated annual completion probability
of 49.7 percent if it were donor-funded (CI: 38.9-60.4) but just 32.4 percent if
government-funded (CI: 22.4-42.4), a gap of 17.3 percentage points. In a district
at the 95th percentile of NDC vote share (88.9 percent), however, this gap
disappears: the government-funded school would have a completion probability
of 47.6 percent (CI: 36.1-59.1), almost identical to that of the donor-funded
school (47.8 percent, CI: 34.6-60.9).37 This is strong evidence in support of
the collective choice theory of non-completion: in districts where local political
actors are almost uniformly aligned with the incumbent, the executive is better
able to use its agenda-setting, implementation, and intra-party enforcement
mechanisms to uphold intertemporal bargains on project sequencing and thus
avoid leaving projects incomplete.
35This would include potential determinants of project completion such as the qualityof, or turnover in, district-level bureaucrats and politicians, budget sizes, and other districtgeographic, economic, and political characteristics.
36I estimate the fixed effects models using the Stata command xtreg rather than areg, sinceareg calculates standard errors using an overly conservative degrees-of-freedom adjustmentthat is unnecessary when fixed effect groups are nested within clusters (Gormley and Matsa2014). For comparison, re-estimating the Column 3 specification with areg produces a p-
value for τGov′t of 0.042. However, for each model I report the R2 generated by the Statacommand areg, since the R2 generated by xtreg is for the demeaned dependent variable andthus considerably understates the explained variation when fixed effects are numerous andpowerful, as in my context.
37These absolute estimates are based on the Column 2 specification without district-yearfixed effects.
33

Figure 7: Marginal effect of partisan alignment by fund source
|||||| || || || |||||| || || || || || || | || | ||| | || ||| || || ||| || || || || || | || || |||| | || | | || ||| || |||| | || | |||| | || ||| |||| ||| |||| | | || || || || | || | |||| | || || | ||| ||| || | || | || ||| | | ||| || | || | |||| ||| | | | || ||| |||| || ||| || || || | | || | || || ||| | || |||| || ||| ||| | | || ||| || || || ||| || || || || ||| |||| | ||| | ||| | || || ||| | ||| || ||| || ||| || | ||| ||| | | ||| ||| | ||| |||| | ||| || |||| || || || ||| ||| || | | | ||| | ||||||||| | |||| || || | || ||| | | | | ||| ||| || ||| ||| ||| | || || ||| | | || || || || | ||| || || ||| ||| | | |||| |||| ||| | |||| ||| || || || || || | ||| ||| || || ||| || | |||| |||| || ||| ||| | || || || || | ||| || ||| | || || || | ||| | || | || || ||| || | ||| | || | ||||| | || ||| || | || | || || |||| || | | | || | || ||| | || | ||| | ||| || || ||| || ||| || | ||| | || |||| |||| |||| | || | || | || | ||| || || || | || | ||| ||| |||| | ||| || || | ||| ||| || | || || || || | || | ||| ||| |||| | ||||| | ||| |||| || || || ||| ||| ||| || ||| || ||| ||| || | | ||| |||| || |||| ||| | || ||| ||| |||| | ||||| || || || |||||| || |||| | || | |||| |||| || |||||| | |||||| | || ||| | || || ||| || || ||| |||| ||| || ||| || | || |||| | |||| || | || || ||| || ||| ||||| || || || |||| || | || || | ||| | || ||| || | || || ||| || || | || ||| || |||| || ||| | || ||| ||||| || | | || | || || | | || || || || | || | ||| | |||| | || | | | |||| ||||| || | ||| ||| | | | |||||| | |||| | || | ||| ||| | ||||| | ||| || || |||| |||| ||| || || || || | ||| || || | || | || | |||| | ||| | || | |||| || | || || || |||| ||| ||| | || ||| ||| || || ||| ||| ||| | ||| || | |||| | ||| || | ||| || | | | || | |||| | || ||||| | || | || || | || ||| || | || || || ||| | || | || ||| ||| | ||| || || || ||| || || |||| |||| | ||| || | |||| || |||| ||| | || ||| | || ||| || ||| | || | | ||| || || | || || ||| ||||| | | || ||| || | |||| |||| || |||| | | || |||| || || | ||| | || | ||| |||| || | | |||| || || ||| || ||| | || || || ||||| | || ||| ||| |||| | |||| |||||| || || ||| || |||| ||| || ||| |||| | |||| ||| || || |||| || |||| || || ||| ||| |||| | || | ||| |||| | | || || ||| ||| | ||||| || |||| ||| || || || || | || |||| ||| || ||| | ||| || |||| || || | |||| ||| || | ||| |||| |||||| ||||| || || |||| || || | | || ||||||| || | | || || ||| || ||| || ||||| || || ||| || ||| || ||| ||||| | || | || || | |||| || | |||||| | | || |||| || || || ||| | ||| | | || | ||| | ||| |||| | ||||| | |||| || | ||| | || | | || | || || || ||||| | || || | || ||| || | | |||| |||| | || || || || || | | | || | ||| ||| | | ||| |||| | ||| |||| | || ||| | ||| ||| | ||| | ||| | || |||| | || ||| ||||| ||| | || || |||| | ||| | ||| || ||| || | |||||| | || |||| ||| ||| || || || | | || | || || | ||| | || | || | |||| | ||| | ||| || | | | || || || ||| | || | | || || ||| | || || ||| | || ||| || || ||| ||| || || || ||| | | ||| || | ||||| || ||||| | || ||| || | || || || || || |||| ||| | || | ||| | ||| | || || || || | ||| || |||| | || |||| || || || || ||||| | || || | |||| || || || || | |||| | ||||| ||| |||| || | || || || || | ||| ||| |||| || | | ||| || || | || | ||| | ||| || | ||||| | || ||| ||| |||| || | || | |||| | | |||| ||| || | || | || ||| || ||| ||| || | || | || || | |||| || | ||||| ||| |||| || | ||| ||| || ||| | || || ||| | ||| | ||| | || ||| | || | | ||| ||| | | ||| || || || || || ||| | || | ||| || ||| || ||| ||| | || | || ||| |||| ||| ||||| || | ||| || | ||| |||| |||| || | || ||| | || || || || ||| | ||| ||| ||| || || ||| | |||| ||| || || | || | || | | || | || | || | ||| |||| | || || || | ||| | || | || || || || || || | ||| | || || ||| || | |||| || | ||| ||||| ||| | | || || | || ||| | | || || || | ||| || |||| || || || || |||| | | |||| || ||| || || ||| ||||| | ||| || ||| || ||||| | | ||| ||| || || ||| ||| ||| || ||| | || || || ||| || ||| | | || || | |||| | || || ||| | | | ||| ||| | ||| || || ||| | || ||| | || |||| | || |||| || | || ||| || || || | ||| || | || || | || | |||| | || || ||| | | | || | || || ||| || |||| || || || || || |||| ||| | || || || || ||| || || || || | | |||| || || ||| | | || ||| ||| || | |||| ||| | || |||| | |||| || || | | | | ||| ||| || || |||| || | || | ||| ||| | || || || || || || | |||| | || || ||| ||| | || | || | || ||| | ||| ||| || |||| || |||| || | | ||| | || || || || ||||| || || || || || ||| || | || || || || ||| | ||| || |||| | || ||| | ||| || || || | | || ||| || | | | ||| || || |||| || ||| | ||| | || || | ||| ||| | || || || | |||| || | || || | || || || ||| |||| || | || || || ||| || || ||| || || || ||| ||| || ||| | || || || ||| || | || ||| | | || |||| | ||| ||| ||| || | ||| ||||| | || | ||| || || ||| || | ||| ||| || ||| |||| |||| ||| | ||| | |||| || | | | || | || | |||| ||| || || | |||| | || | || || || || | | |||| | || || | ||| | ||| ||| || || ||| | || || ||| | | ||| | || || || ||| | || | || ||| || | || | || || || | | || |||| |||| || || ||| || || | |||| ||| |||| | | ||| | |||| || || ||| | |||| || ||| | | |||||| || || || || || | ||| ||| | || ||| || || | || || || || || || ||| ||| || ||| | || | ||| || || || | || | ||| || ||||| |||| || | || || || ||| | || |||| | ||| | ||| || || | || ||||| | |||| ||| || || | || || ||| || || | || || ||| || || |||| | ||| || ||| || | || | || ||| || || | | ||| || ||| || || | | ||| ||| || | || |||| | || |||| | ||| | || | || |||||| |||| ||| | | || ||| | || | ||| || || || || || | ||| || | ||| || || |||| | || |||| | || || | || | | || | || |||| | || | |||| || | || ||| || ||| || |||| | || || || ||||| | ||| | || | || |||| | || ||| | | || | | || ||| | | ||| | ||| ||| ||| ||| | | || || ||| | ||| | || || || | | | || | ||| | ||| || | || || || | || | | ||| ||| | || | ||| || || | |||| ||| ||| | || ||| | || ||| | |||| ||| || || ||| | ||| ||| | ||| || | || | || |||| || || || || | || | ||| | || || || | ||| || ||||| | || || |||| | ||| | ||||| || | | ||| || | ||| | | || | || || ||| | ||| || || | || || ||| | || || ||| || ||| || || | ||| | || | | | || | | | || | | | ||| || | | ||| ||| | |||| || || | || || | ||| ||| ||| |||| | ||| || || ||| | ||| ||| || | || ||| ||||| || | | ||| ||| | | || || | ||| | ||| || || || |||| ||| || ||||| ||| ||| || || || || || || | | || | || || | || ||| || | || || | ||| | |||| ||| | ||| | ||||| || |||| | |||| | |||| | || | || || ||||| | |||| | || | || || |||| || | | ||| ||| |||| | | || || || | || || || || | || | |||| |||| |||||| | || | ||| || ||| || |||| |||| | | |||| ||| || | | ||| || ||| ||| |||| | || || | ||| || |||||| || | || | || || ||| || || | || || | |||| || || || || | | | | || || || | | |||| || || || |||| |||| || ||| | ||| || || |||| ||| | || | | | || || ||| ||| || || | || || | ||| | |||| | | |||| | |||| | || | ||| || || || || || | | | | ||| | || || |||| || |||| |||| || || |||| | || ||||| ||| ||| | || || || | |||| || ||| | || || || | | || || | |||| | | ||| || || || | || | | ||| | || || |||| || || ||| | |||| ||| ||| || ||| | || ||| | || || || | || || || ||| || ||| || || | || ||| ||| ||| | ||| || || || || || || ||| | || ||| | || |||| || | || ||| | ||| ||| || ||| | || || |||| | | ||||||| | || |||| ||||| || | || ||| | | || |||| ||| |||| | ||| | ||| | || || ||||| | ||| || | ||| || || | |||||| || || | | || |||| ||| || | || | ||| | |||| ||| ||| ||| || | || | | |||||| | ||| ||| | || |||| |||| || | || || || ||| | || | | |||| || | || | || || | || ||| ||| | | | |||| |||| | | ||| || || || || || ||| | || ||| ||| | | ||| | || || ||||| || |||| || | |||| || | | ||| ||| | ||| || ||| ||||| || || || || |||| | | || || | ||| | || ||| || | | |||||| || || | || |||| || ||| ||| | |||| || |||||| ||| |||| || | ||| | | || | || ||| | ||| | || ||| || || || ||| || || || | || |||| | | | || || || ||||| ||| || || ||| || | || | ||| | ||| | ||||| || || ||| || || || || || ||||| | ||| || || || | || || || |||| | || || || | || ||| |||| | ||| | | || | ||| | ||| || ||| ||| || || || || || || ||| | | |||| || | || | || ||| | ||| || | || || || | ||| | || | || | || ||| || || |||| | || ||| || | | || | | || || || | |||| ||| | ||| || || || ||| || | || || | || | || || | ||| | | || ||| || || | || ||| | | ||| |||| || ||| | || ||| | | ||| | | || | || |||| || |||| | || || || |||| ||| || | ||| | || |||| |||| || | | || || || || ||| | | ||| || ||| ||| || | ||| || ||||| | | || || || || | || ||| | || || | | || | ||| ||| | | || ||| ||| || ||| | || | ||| || | || | || | || || |||| | |||| || | |||| | || ||| || | |||| || | || || | ||| | || | ||| || ||| | || ||| || | | || || ||| | ||| || | ||| || || ||| | ||| | | | || || || |||| | ||| | | || | || || ||| | || | || | ||| || || | | | || ||| || || | || ||| ||| || || |||| || | || || || || |||| || ||| || ||| || || | || | || |||| || | ||| || || ||| | | ||| | || | || || | | ||| | || ||| | || || | ||| | || | || || || | |||| | || || || | || || || || ||| | | | || | || | | || |||| ||| | || || | |||| | ||| ||||| | ||| || ||| ||| || ||| | ||| | || | ||| | ||| || | ||| | || | | || | ||| || ||| | || || ||| || | || ||| || || || |||| || || ||||| || ||| ||| | || || ||||| | | ||| || | |||| | ||| |||| || ||| || || || ||| | || || || | ||| ||| | ||| || ||||| || | | | ||| | ||| ||| || ||| || | ||| | ||| || || || |||| || | ||| | || || ||| ||| || || || || || || | || | ||| ||| || | || || | || | || ||| |||| | | || ||| || || ||| | || | | | || || || || || | || || ||| || || ||| |||| | || | ||| | | | |||| || ||||| || ||| | || ||| ||| ||| | || ||| || || ||| | | ||| |||| |||| || ||| | | ||| | || | | | |||| | | | || || || ||| ||| ||| | ||| || || || | ||| | | || | || || | ||| || || || | || ||| || || | ||| ||| || | || | | || ||| |||||| | || | | || || ||| || || ||| || || || | || || | || | | || | | || | | || | ||| || || || || || || | | ||| || || |||| |||| || || | || ||| ||| || ||| ||| || | || | || | | ||| | ||| || || || ||| || | ||| |||| ||| || | | |||| || | || ||| ||||| | |||| | |||| || | || || | || | |||| | || || |||| ||| || || || | |||| || || || || | | || | || ||| ||| || ||||| ||| | || || || |||| ||| ||| || || ||| || | || || || | ||| || || | || | || || | |||| || || |||| || ||| || | | || ||| || |||| || || || || ||| || || ||| || | || ||||| || | || || || || || |||| || || | || | | || || | | || | ||| ||| || | | ||| | | | | || ||| || | || || || | || | | ||| || | |||| | ||| || ||| || | || ||| | | | | ||| | || ||| ||| |||| ||| || || ||| ||| |||| || || || || | || || || || || | || || ||| | | || || || || || ||| | || |||||| | | || ||| || | || || || | ||| | || || || | || | | || || | ||| || || | | || || | || | || ||| || | || || || | | || || | || || || || |||| ||| || ||| || | | || |||| ||| | || | ||| || || || || | || || | | | || || | | |||| | || || || | | || || || |||| ||| || | || | |||| || || | ||| || | || | || || || || | ||| ||| | || ||| || || ||| || || |||| ||| || | || || | || | | || ||| ||| || || || | | ||| || || | | || ||| || || ||| ||| | || | ||| || || ||| |||| | || ||| | |||| || || | || || || ||||| ||| | |||| || ||| || || || ||| || | | | ||| | | | |||||| ||| | ||| | |||| | |||| | || ||| || | ||| | | |||| | ||| || | ||| | |||| | | | || | || | | ||| || || | | || ||||| | || ||| | || | || | |||| || | || | | ||| || | ||| || || | || | || || || | ||| | | || ||| || |||| | | ||| || ||| || || || || || || ||| | | || || ||| || | | || ||| || || ||| ||| ||| | || | || |||| || ||| || || || ||| ||| || | || || | ||| || || || || | ||| || || || || | | || ||| ||||| | | | |||| || || || | ||| ||| |||| | || || ||| ||| | ||| || || ||| ||| ||| | | ||||| | || | ||| | | || || |||| || | || || || ||| ||| | || || | | ||| || | | || ||| || || || ||| || | || || ||| | | | || ||| || | ||| || || ||| | || | ||| ||| || || | ||| || || | | || || ||| ||| || | || ||| | | || || | | | || | || ||| | || ||| ||| | | || || || | || || || ||| || | || |||| || |||| | || || || |||| || || || || ||| | ||| || | || || | ||||| | || || ||| || || || || || ||| || ||| | ||||| | |||| ||| || ||| | |||||| |||| || || ||| ||| || | | || || |||| | || ||| | | ||| | | ||| | |||| || || | |||| | | |||| || ||| || ||| || || ||| | | ||| ||| || | | |||| ||| || || |||| | | | ||| || || || ||| | || || ||| | || ||| | ||| ||| || ||| | | | || || || | | ||| || | ||| || || | ||| ||| | |||| || | || || | |||| ||| || || ||| ||||| | | | |||| || | || || || || || | || || || || ||| | | |||| ||| | || | || ||| || |||| || || || || || | || ||| || ||| | ||| || || | | |||| ||| | | ||| ||| || | || | | || | ||| | || ||| || || || | ||| || || |||| || || ||| || || || || | | || || || ||| || || || || || | || ||| | | | || | || || | || ||| || | || | || ||| || || || | ||| | | | || || || || || | ||| | || | || || || || | | || ||| || || || ||| ||| || || ||| | |||| || | || ||| || ||| |||| | | ||| | ||| || | || | ||| || |||| ||| || ||| || ||| | || || ||| || | || ||| || || || | |||| || || || || |||| || || || | || || || | ||| || ||||| || || || |||| ||| ||||| | ||| ||| || || || | || || ||| || || || | | | ||| || | | || ||| || || | | ||| || | || || || ||| ||| | |||| || | | | || || ||| | ||| | || || || ||| |||| | || | ||| |||| | || || | | || || ||| || || ||||| | || ||| || ||| | || || || | || ||| || ||| | | || | |||| | || || ||| || || | || || | || || ||| | ||||| | | || || || || | ||| || ||| ||| | | ||||| | || ||| || | || | | || | || | | |||| || | ||| | || || || | | | || |||| ||| | |||| || | |||| |||| |||| || || ||| || ||| || ||||| || ||| | || || || || || || || || || || || || || | |||| | ||| | || | ||| || | || || | | ||| ||| || || | || | | ||| || || ||| || ||| || || || ||||| | || | || || | || || || ||| || || || ||| || || ||| || | | ||| | |||| | || || | |||| | || || || | |||| ||| | || ||| ||| ||| | | || ||| || ||| || | ||||| || ||||| ||| ||| || || |||| ||| || || ||| | ||| || || | ||| || || ||| || ||| | || | ||| || ||| || || ||| || |||| | ||| | | || || ||| || || || || || | ||| ||| ||| | | || | ||| ||| || ||| || | || |||| | ||| || ||| | || || |||| || | | | || | | || |||| || || || ||||||| || || || | | |||| ||| | ||| | || | | || | ||| || || ||| | | || | ||||| | || || | ||| | ||| | | || ||| || | ||| | ||| || |||| || | |||| ||| ||||| | || || || | || |||| | ||| || || || | |||| |||| | |||| || || | |||| | ||| || | || | ||| | || | ||| ||| | ||| ||||| ||| | | || || || || || |||| | ||| | || || | |||| | ||| || ||| | ||| | || |||| || ||| || | ||| ||| | || | || || | || || ||| |||| || |||||| ||| | || || || | | || || | ||| ||| || | || | || || ||| || | || || ||| | || || || | ||| | || | ||| ||| || | || | || | || | || || || || ||||| | |||||| | || ||| | | ||| || || | || || || || || || || ||| | | |||| || || ||| | | ||| | || || || ||| ||| | | | || | || |||| ||| ||| | ||||| || ||| || | || ||| || ||||| | | || ||| ||| || ||| || | | || || || | || |||| | || | || || || || | | ||| | || | ||| | || | ||| | || ||| | || || || || | || ||| ||| ||| | | || || ||| | | || ||||| | |||| ||| || | ||| || | || || | ||||||| | ||| || | || | ||| ||| || || || ||| | ||| | || || || | ||||| | || | || ||| || |||| | || || | | |||| ||| || || || || | | ||| ||| |||| || || |||| |||| || ||| || || | ||| || || | || || ||| | | ||| || |||| | || | || |||| || ||||| || | || || | || |||| || ||| ||| ||||| || || ||| ||| ||| ||| || || ||| || || | ||| | || ||| | |||| || ||| |||| | |||| || || || || || | | | ||| | ||| | || || || | || || || | | | ||| | || ||| || | ||| || | || | |||||| ||| || || || | ||| | || | | || ||| || || || || |||| || || ||| |||| ||| ||| || |||| | | ||| | || | || || | ||| || || || || || || ||| | |||| || || |||| || ||| || || | |||| | | || || || | |||| | ||| | || | || || | || |||| | | ||| |||| | ||||| | || || || | ||||| ||| || || | | || || || | || | ||| | | || | |||| ||| || | || || ||| || | ||| || | ||| | || || || ||| || ||| | ||| || | | || || | || || || | ||| | || ||| || |||| ||| || || || || ||| ||| || |||| | | | ||||| ||| | || ||| ||| ||| | || || ||||| || ||| || ||| || | || ||| |||||| | ||| |||| || || || || | || || | |||| || | | | | || ||| ||| | || | ||| | | | ||| |||| ||| || || || || | | | || || || | || || ||| || ||| | || || || || | ||| | || | || || | || | ||| | ||| || || || ||| | || || ||| |||| |||| || || | || | || ||| || || ||| || | ||| | || || || | | | || |||| | || || | | ||| | ||| ||| | || || || |||| ||| || | || | | ||| |||||| | | || ||| || |||| | || | ||| |||| || || || || | ||| ||| || | || || | || || || ||| | || |||| ||| ||| | || ||| | || || ||| | || | |||||| | | || || || || || |||| ||| || | |||| | || |||| || | || ||| || ||| | | ||| ||| | ||| | ||| | || || | || || || || || |||| | | | || ||| || || |||| || || ||| | || |||||| | | |||| || | | | ||| || | || ||| || || | || | | || |||| | ||||| | || | |||| || || | || || ||||| || | ||||| | | | | ||| || |||| | | ||| ||| | ||| | | || | | || | ||| | ||| |||| | |||| | | | ||| | || | || | | || || || | || ||||| | ||| || || |||| ||| | ||| || ||||| || | ||| |||| | || || || || || | || || ||| | | ||| || || || || | ||| | || || || ||| | ||||| || | | ||| ||||| | || || ||| || || || || || | || | || || || ||||| | ||| || | | | ||| ||| ||| || |||| ||| || | || || | || || || | |||| | || | || || || | ||| || | || || || | | || ||||| ||| || | |||| | || | || ||||| ||| ||| || | || ||| || ||| || || || | ||| | || | || || ||| || || || || ||| | || || || ||| ||| |||| || ||| || | || | || | | |||| || ||| || | || || | || || || || || ||| | || | | |||| | ||| ||| || || | || || | || | ||| |||| ||| | || || || | || || | | || ||| | |||| ||| || ||| || || || || || ||| ||| || || | || |||| || || || ||| || | | || || | ||| | ||| ||| | || || || ||| ||| || || ||| | || ||| | || ||| |||| ||| |||||| | || || || ||||| | || || ||| || | || | ||| || || || | ||| || | ||| | ||| || | | |||| || | | || || ||| | | | || |||| |||| |||| | || || ||| || || | || ||| || | || || | ||| || ||| || || || | || || ||| || ||| || || ||| ||| ||||| | |||| || ||| || || ||| |||| | || | ||| | || | ||| ||| || |||| ||| | | || || ||||| |||| |||| | || ||| | || || | || || ||| || | | || ||||| ||| | || ||| | ||| || |||| | || ||| || | ||| || || | ||| | || |||| |||| || ||| || || || | |||| ||| | || || | ||| | ||| | |||| ||| ||| || |||| | || ||| ||| | || || || | || || ||| | || ||| || || || | | || | ||| ||| || | | | || ||||| | | | ||| || | ||| |||||| |||| || | | || || || ||| || || || | |||| || || || | || | || || || | || | ||| ||||| | | ||||| || |||| | || | ||| | || | || || ||| | || || | |||| | || || | ||| || | | ||| || || ||| ||| | |||| || | | || | || || || | || || || ||| | || ||| || | ||| | || ||| || | | | ||| || | | | ||| | ||| || |||| | ||| | | || || || | | ||| | || ||||| ||| ||| || || || || || ||| || || | ||| | |||| | || || ||| | | || | ||| || | || ||| | ||| || || | |||||| ||| || || || || | || |||| ||| ||| | || || | || || || | | | ||| ||| | | || ||| | |||| || ||| || || ||| | || || | |||| || || ||| | || | || | | || | || || ||| ||| | | | || || | ||| | ||| ||| || ||||| || ||| | |||| || || ||| ||| || || |||| | || ||||| ||| | |||| || ||| ||| || | | ||| | ||| | || | || || || |||| ||| || ||| || || || ||| || || || ||| ||| || | || || | || | | || ||| | ||||| || |||||| | | ||| ||| | || || | || |||| ||| | || || |||||| || ||| || || || |||| || | || || |||| ||| | |||| | ||| |||| | | |||| || |||| | | || ||| || || || | ||| || || || || |||| | |||| | || | | ||||| || |||| || || || | | ||| ||| ||||| ||| | || | ||| || || ||| ||| | ||| || | || ||| || || ||| ||| || ||| | ||| || || || | ||| | ||| || | || ||| ||| ||| || | ||| | || | ||| | || | |||| || |||| | ||| | | | || || || | || | | || || | | ||| | |||| | |||| || | | || || |||| | || || | || ||| | | ||| || | || || || ||| || ||| | | |||| ||| | || | ||| || ||| || || || ||| | || | | ||| || || | | ||| ||| || ||| | ||| || ||| || | ||||| || | || || ||| | | | || || | ||| ||| ||| |||| ||| ||| | |||| || | |||| | ||||||| || ||| ||| || || || || || | ||| ||| ||| | || || || | | ||| ||| | ||| |||||| || |||| | || ||| | || || | || | || | ||| ||| | | ||| ||| || |||||| || || ||| || ||| || || || ||| | |||| || ||| | ||| ||| |||| || | || | | || ||| | ||| |||| || |||| | || || |||| || |||| || | ||| | | || ||| | ||| | || ||| || ||| || |||| |||| | ||| || ||| | ||| ||| || || || | || ||| | | || || ||| || ||| ||| ||| || | || | | ||| | ||| || | ||| || |||| ||| ||| |||| || | ||| | || |||| | || | ||| | |||||| | | || |||||| | | || || ||| ||| ||||| ||| | ||| | ||| || | || ||| || || || ||| || || |||| ||| ||| || || || | || |||| |||| | ||||| |||| ||| ||| ||| | ||||| |||| || ||||| || | ||| | || | ||| | || || | ||||||| | ||| |||| || ||| | || | || | || || || || || ||| ||||| | ||| | ||| | || || || ||| | || ||| | | ||| ||| || | | || ||| ||| ||| | || || || || || | | || | ||| || || |||| ||||| ||||| | || || || ||| ||| | || |||| || | ||| || || ||| || || | | ||||| | | | || || || | ||| || ||| || | | ||| || | ||| ||| |||| | || || || ||| || | |||| ||| | || || ||| ||| | |||| ||| | ||| | ||| ||||| | || || ||| || || || || ||| ||| | | || || || || || | ||| | || | | ||| | || || || || | || || | | |||| || || ||||| || || | | ||| || ||| ||| | || || | |||| || || ||||| | || || | || | || || | || || || || | |||| ||| | ||| || | ||| || || | || |||| || | ||||| || || || | ||| || ||| ||| || ||| || || || ||| | || || | || || || |||| |||| | || | || | || | |||| | | | || | |||| ||| | | ||| | || | ||| || | ||| || ||| ||| ||| | || ||| | | ||| | || | ||| || | | || | ||| ||| || | | ||| | | || | ||| || || | || |||| | || || || || || ||| || || || | || |||| || | | ||| || || ||| || || ||| | || | || || || | || || | ||| || | ||||| |||| || | ||||| || ||| |||| ||| ||| | || || ||| || ||| || || | | || ||| | || || ||| || ||| || ||| || | | ||| | || || |||| || | || | |||||| | || || || | | || | || || | ||| || |||| | || || || || | || |||| || ||| | | ||| | ||| | | ||||||| || | || || | || |||| | || | || ||| |||| | || | || ||| ||| ||||| || | || |||| || ||| ||| || || | || | ||| | ||| | || | || | | | || ||| | || || | || | || ||| || | ||| || || | | || ||| | |||| || | | || || || || || ||| | || | ||| || |||| ||| | ||| | ||| || || || ||| ||| || | || | || | ||| || |
-.25
0
.25
Pred
icte
d m
argi
nal e
ffec
t
0 .1 .2 .3 .4 .5 .6 .7 .8 .9 1NDC vote share 2008
Gov't-funded Centralized
Note: Marginal effects of partisan alignment on predicted completion of government-funded and centralized projectsare shown relative to its effect on donor-funded projects (dashed line at zero), with 95% confidence intervals. Basedon Table 2, Column 4.
To further discriminate between the observable implications of the collective
choice and clientelism theories, Column 4 adds centralized projects into the es-
timation sample and introduces the centralized dummy and interaction term.
While τCentral is not significantly different than zero (indeed, is slightly nega-
tive), τGov′t remains positive and significant, and the difference between the two
coefficients is statistically significant (p = 0.017). This is inconsistent with the
clientelism theory that government-funded project completion patterns reflect a
deliberate policy of the incumbent either to leave projects unfinished in order to
give voters an incentive to return them to office or to punish opposition voters.
If the government thought this to be an effective political strategy, we would
have expected that NDC vote share should have a similar effect on centralized
projects as it does on government-funded projects executed by districts. Instead,
the markedly different effects are consistent with the collective choice theory that
the incumbent is constrained in the completion of government-funded projects
by local-level collective choice problems that are more difficult to resolve in
34

opposition-leaning districts. The district-year fixed effects in this specification
also exclude the possibility that the observed effects are driven by changes in
districts’ political leanings over the study period, which is further evidence that
these results are not driven by clientelist dynamics of using project completion
tactically to reward or punish voters. Figure 7 presents the marginal effects
of NDC vote share on the three fund sources graphically, with donor-funded
projects as the baseline category represented by the dashed horizontal line at
zero.
A further concern is that the relevant clientelist dynamics might operate not
at the level of whole districts, but rather across communities within districts.
For example, if within each district the government systematically allocated
donor-funded projects to its core supporter communities and government-funded
or centralized projects to opposition communities, and if donor-projects were
more likely to be completed and projects in core supporter communities were
also more likely to be completed, then the estimates of τGov′t in Columns 1-4
could be biased upwards. To address this, Column 5 re-estimates Equation 1
with fixed effects for the 2,934 communities in which projects were executed,
to control for all observable and unobservable characteristics of these commu-
nities, including partisan affiliations as well as other more general community-
level determinants of project completion. Controlling for these community-level
factors actually slightly increases the point estimate of τGov′t, although the
statistical significance drops slightly (p = 0.077) due to an increase in stan-
dard errors. Column 6 pushes this even further by controlling for community-
year fixed effects, thus capturing any shifts over time in partisan affiliations
that might affect project completion, leading to τGov′t increasing even further
and becoming more statistically significant (p = .034). The continued signifi-
cance of district-level partisan affiliation in explaining government-funded (but
not donor-funded or centralized) project completion - even after controlling for
time-variant community-specific determinants of project completion - is strong
evidence that these results are driven not by clientelist strategies of using project
35

completion as a reward or punishment, but rather by district characteristics that
affect collective choice outcomes.
Finally, Column 7 adds contractor fixed effects, since τGov′t could be bi-
ased upward by contractor identity if the donor-government completion gap
was driven by contractor quality and less able contractors were more likely to
be selected in opposition-leaning districts. This specification takes advantage of
the fact that some of the 2,592 contractors who implemented these projects did
so in multiple districts and/or for multiple fund sources. The estimated τGov′t
actually increases slightly and remains statistically significant (p = 0.050). This
provides further evidence that the observed patterns of project non-completion
are not being driven by theories of corruption and clientelism that focus on
rent-seeking behavior in procurement by politicians, bureaucrats, and politi-
cally connected contractors.
These results are robust to a wide range of alternative specifications and
additional controls; Appendix F presents these specifications.
Addressing endogenous selection into fund sources
Even though the district-year, project type, community, and contractor fixed
effects control for a wide range of observable and unobservable variables that
could bias the analysis, one remaining concern is that communities may be
sufficiently heterogeneous that projects could even be targeted (i.e., be locally
excludable) within communities, for instance based on very local ethnic or par-
tisan geography (Ichino and Nathan 2013). If projects are locally excludable
and thus can be targeted based on within-community unobservable variation,
this could potentially bias τGov′t upwards if the extent of within-community
selection of projects into fund sources was also positively correlated with the
ruling party’s vote share in the district.
Although I lack detailed geographic data with which to measure this within-
community heterogeneity directly, I am able to gauge whether this bias could
plausibly be driving τGov′t using the coefficient stability approach developed by
36

Table 3: Community fixed effects
(1) (2)
Government-funded -0.243 -0.214(0.061) (0.077)
Centralized -0.247 -0.254(0.076) (0.081)
Gov’t-funded * NDC vote share 0.263 0.257(0.118) (0.145)
Centralized * NDC vote share -0.045 -0.016(0.134) (0.152)
District-Year fixed effects YesCommunity fixed effects YesDistrict-Year groups 288Community groups 2934R2 0.373 0.727N 5483 5483
Note: Dependent variable is project completion.Sample is all projects with non-missing communityname. All specifications include project type andcharacteristics as in Table 2. Year fixed effects in-cluded in Column 2. Huber-White robust standarderrors clustered by district-year in Column 1 andcommunity in Column 2.
Altonji, Elder, and Taber (2005) with corrections from Oster (forthcoming) and
Gonzalez and Miguel (2015). Oster shows that, if selection on unobservables
(such as within-community variation) is as strong as selection on observables
(across-community variation), a bias-adjusted estimate of τ is:
τ∗ = τ − (τ − τ)Rmax − RR− R
(2)
where τ is the estimated coefficient from a regression including community
fixed effects (Column 2) and R is the R2 from this regression, τ is the estimated
coefficient from the regression excluding community fixed effects (Column 1) and
R is the R2 from this regression, and Rmax is the percentage of all variation
in the dependent variable theoretically explainable by all possible observables
and unobservables. Even under the most conservative case of Rmax = 1 where
within-community unobservables account for all remaining unexplained vari-
ation and there is no measurement error, calculating τ∗Gov′t using Equation
2 and the estimates from Table 3 still generates a bias-adjusted coefficient of
37

0.253. More intuitively, these estimates imply that the process of endogenous
selection into fund sources on unobservable within-community variation would
have to be 58 times stronger than the process of within-district selection across
communities in order for the observed τGov′t to be driven entirely by selection
on unobservables. While a correlation between NDC vote share and the de-
gree of endogenous selection of projects into fund sources cannot be ruled out,
it seems implausible that selection on unobservables accounts for more than a
tiny share of the differential effect of NDC vote share on government-funded
projects relative to donor-funded ones.
Conclusion
This article has: 1) provided the most comprehensive evidence to date on the
extent and costs of development project non-completion in one country, Ghana;
2) argued that this phenomenon is best understood as the inefficient outcome of
a dynamically inconsistent collective choice process among local political actors,
rather than an instrumental outcome of corruption or clientelism; and 3) shown
that the effects of these collective political failures are mediated by the fiscal
institutions through which projects are delivered. I conclude by discussing some
broader implications of these three contributions.
First, whereas recent literature on the political economy of public good provi-
sion has overwhelmingly focused on corruption as a cause of implementation fail-
ure, this article echoes Bandiera et al ’s (2009) emphasis on the non-instrumental
nature of much expenditure efficiency. In contrast to Bandiera et al, though, I
show that implementation failure can be caused by distributive pressures and
have consequences for distributive outcomes. The view of implementation as
potentially endogenous to distribution presents an opportunity for theory devel-
opment, as well as a major methodological and measurement challenge: whereas
empirical studies of distributive politics usually treat measures of the partisan,
geographic, or ethnic incidence of public good inputs, outputs, and outcomes as
38

interchangeable (mostly out of convenience), if implementation is endogenous
to distribution then these associations will differ and thus be potentially biased
measures of politicians’ “true” targeting strategies.
Second, the insight that significant fiscal waste can arise due to the de jure
and de facto collective nature of government expenditure decisions - rather than
simply the private incentives of a powerful agent - has wide-ranging implications
for research on the political economy of public good provision in developing
countries. Whereas political economy theories of clientelism and distributive
politics focus on the potentially distortionary impact of elections on the expen-
diture choices of an incumbent politican, these findings emphasize that much
of the formal and informal politics of delivery actually takes place in between
elections. Greater attention to the institutional and bureaucratic details of how
and by which actor(s) expenditure decisions are actually made could shed light
on these understudied dynamics, and - together with the endogeneity between
distributive concerns and implementation - may help to explain the puzzling
variation in public good provision patterns observed in the empirical distribu-
tive politics literature (Golden and Min 2013).
While the collective choice mechanism proposed in this paper seems most
applicable to contexts of electoral competition and relatively scarce resources,
it is likely to have broader relevance. Building coalitions of competing interest
groups is a central aspect of politics in democracies and autocracies alike, and
access to government expenditure is often the object of coalitions’ formation as
well as one of the main tools that can be used to sustain them. Similarly, most
polities are characterized by limited budgets and excess demand for government
expenditure.38 Although my analysis has focused on physical infrastructure
projects, the same mechanism could also apply to any non-physical types of ex-
penditure whose implementation is not instantaneous. The strength of institu-
38The Senate testimony of a former head of Nigeria’s Bureau of Public Procurement re-garding the abandonment of 19,000 government projects provides suggestive evidence that themechanism described in this article is not restricted to Ghana: “[He] told the lawmakers thatabandonment of the projects occurred mainly because of non-payment for interim certificatesfor work done” (Vanguard 2016).
39

tions that stabilize political coalitions or limit the impact of political instability
on implementation processes seem likely to be key determinants of the extent
to which these collective choice issues manifest in policy implementation across
contexts.
Finally, these findings have important policy implications for government,
donors, and aid. The extent of wasteful expenditure and the impact of fiscal
institutions in improving project completion suggest that greater investment
in expenditure monitoring and control in intergovernmental transfer systems
can be an effective way to improve public good provision. Another implication
is that donor involvement in project delivery in developing countries may be
beneficial not only by contributing funds, but also by strengthening government
delivery institutions, especially since it may be easier for donors to credibly
commit to enforcing rules than the government. This is a largely unexplored
area for research and policy design, and a new perspective on debates around
aid effectiveness.
References
Abotsi, Pascal Kafu. 2013. “Contractors Blame Economic Hardship on Gov.”
The Chronicle, 18 September, 〈http://thechronicle.com.gh/contractors-blame-
economic-hardship-on-gov/〉, accessed 8 April 2015.
Acemoglu, Daron, Simon Johnson, and James A. Robinson. 2005. “Institutions
as a Fundamental Cause of Long-Run Growth.” In Aghion, Philippe, and
Steven N. Durlauf (eds), Handbook of Economic Growth, Volume 1A, 385-472.
Altonji, Joseph, Todd G. Elder, and Christopher E. Taber. 2005. “Selection
on observed and unobserved variables: assessing the effectiveness of Catholic
schools.” Journal of Political Economy 113 (1): 151–184.
Bandiera, Oriana, Andrea Prat, and Tommaso Valletti. 2009. “Active and
Passive Waste in Government Spending: Evidence from a Policy Experiment.”
40

American Economic Review 99(4): 1278–1308.
Banerjee, Abhijit, Rema Hanna and Sendhil Mullainathan. 2013. “Corrup-
tion”. In Gibbons, Robert, and John Roberts (eds.) (2012), The Handbook of
Organizational Economics, Princeton: Princeton University Press, 1109-1147.
Banful, Afua Branoah. 2011. “Do formula-based intergovernmental transfer
mechanisms eliminate politically motivated targeting? Evidence from Ghana.”
Journal of Development Economics 96: 380-390.
Baron, David, and John Ferejohn. 1989. “Bargaining in Legislatures.” Ameri-
can Political Science Review 83(4): 1181-1206.
Bertelli, Anthony, and Christian R. Grose. 2009. “Secretaries of Pork? A New
Theory of Distributive Public Policy.” Journal of Politics 71(3): 926-945.
Besley, Timothy, and Torsten Persson. 2011. Pillars of Prosperity: The Political
Economics of Development Clusters. Princeton: Princeton University Press.
Briggs, Ryan C. 2012. “Electrifying the base? Aid and incumbent advantage in
Ghana.” Journal of Modern African Studies 50(4): 603-624.
Burgess, Robin, Remi Jedwab, Edward Miguel, Ameet Morjaria, and Gerard
Padro i Miquel. 2015. “The Value of Democracy: Evidence from Road Build-
ing in Kenya.” American Economic Review 105(6): 1817–1851.
Citi FM. 2014. “MMDAs to be forced to complete projects – PAC.” 〈http://
citifmonline.com/2014/11/01/mmdas-to-be-forced-to-complete-projects-pac/
#sthash.KBZMV5fB.dpbs〉, accessed 27 March, 2015.
Citi FM. 2016. “Assembly system outmoded; MMDCEs must be elected – Kyei
Baffour.” 〈http://citifmonline.com/2016/09/28/assemblies-must-go-partisan-
local-governance-expert/#sthash.au08NvZf.dpuf〉, accessed 10 January, 2017.
Cox, Gary, and Mathew McCubbins. 1986. “Electoral Politics as a Redistribu-
tive Game.” Journal of Politics 48(2): 370-389.
41

Daily Graphic. 2015. “NDC to win one million votes in Ashanti.” 〈http://www.
graphic.com.gh/news/politics/ndc-to-win-one-million-votes-in-ashanti.html〉, ac-
cessed 23 January, 2017.
Dixit, Avinash, and John Londregan. 1996. “The Determinants of Success of
Special Interests in Redistributive Politics.” Journal of Politics 58(4): 1132-
1155.
Duflo, Esther. 2001. “Schooling and Labor Market Consequences of School
Construction in Indonesia: Evidence from an Unusual Policy Experiment.”
American Economic Review 91(4): 795-813.
Finan, Frederico, and Maurizio Mazzocco. 2016. “Electoral Incentives and the
Allocation of Public Funds.” NBER Working Paper 21859, January.
Flyvbjerg, Bent, Mette K. Skamris Holm, and Soren L. Buhl. 2004. “What
Causes Cost Overrun in Transport Infrastructure Projects?” Transport Re-
views: A Transnational Transdisciplinary Journal 24(1): 3-18.
Franck, Raphael, and Ilia Rainer. 2012. “Does the Leader’s Ethnicity Matter?
Ethnic Favoritism, Education, and Health in Sub-Saharan Africa.” American
Political Science Review 106(2): 294-325.
Gadenne, Lucie. 2015. “Tax Me, but Spend Wisely? Sources of Public Finance
and Government Accountability.” Mimeo, June.
Ghana Audit Service. 2014. “Report of the Auditor-General on the Public
Accounts of Ghana Ministries, Departments and Other Agencies (MDAs) for
the Year Ended 31 December 2013.” Accra, 1 September.
Ghana Audit Service. 2016a. “Consolidated Report of the Auditor-General on
the 50 District Assemblies Audited under GSAM Project.” Accra, August.
Ghana Audit Service. 2016b. “Report on the Dissemination of Audit Findings
on the Infrastructure Audits Carried Out by Ghana Audit Service under the
GSAM Programme.” Accra, May.
42

Ghana News Agency. 2014. “Ghana @ 50 Project left to rot.” 〈http://www.
ghananewsagency.org/print/75622〉, accessed 27 March, 2015.
Ghana News Agency. 2015. “Political Party Interference Marks Upcoming As-
semblies’ Elections – CODEO.” 〈http://www.ghanaweb.com/GhanaHomePage/
NewsArchive/Political-party-interference-marks-upcoming-assemblies-elections-
CODEO-376599〉, accessed 14 September, 2015.
Ghanaweb. 2016. “Angry youth burn MP’s car over failed campaign promises.”
http://www.ghanaweb.com/GhanaHomePage/NewsArchive/Angry-youth-burn-
MP-s-car-over-failed-campaign-promises-446147, accessed 9 June, 2016.
Golden, Miriam, and Brian Min. 2013. “Distributive Politics around the
World.” Annual Review of Political Science 16: 73-99.
Gonzalez, Felipe, and Edward Miguel. 2015. “War and local collective action
in Sierra Leone: A comment on the use of coefficient stability approaches.”
Journal of Public Economics 128: 30-33.
Gormley, Todd, and David Matsa. 2014. “Common Errors: How to (and Not
to) Control for Unobserved Heterogeneity.” Review of Financial Studies 27(2):
617-661.
Harding, Robin. 2015. “Attribution and Accountability: Voting for Roads in
Ghana.” World Politics 67(4): 656-689.
Hodler, Roland, and Paul Raschky. 2014. “Regional Favoritism.” Quarterly
Journal of Economics 129(2): 995-1033.
Ichino, Nahomi, and Noah Nathan. 2013. “Crossing the Line: Local Ethnic
Geography and Voting in Ghana.” American Political Science Review 107(2):
344-361.
Keefer, Philip. 2007. “Clientelism, Credibility, and the Policy Choices of Young
Democracies.” American Journal of Political Science 51(4): 804-821.
43

Keefer Philip, and Stuti Khemani S. 2009. “When do legislators pass on pork?
The role of political parties in determining legislator effort.” American Polit-
ical Science Review 103(1): 99–112.
Kramon, Eric, and Daniel Posner. 2013. “Who Benefits from Distributive
Politics? How the Outcome One Studies Affects the Answer One Gets.” Per-
spectives on Politics 11(2): 461-474.
Joy News. 2014. “President Mahama: I will continue all abandoned projects.”
〈http://www.myjoyonline.com/news/2014/September-10th/president-mahama-
i-will-continue-all-abandoned-projects.php〉, accessed 25 March, 2015.
Larcinese, Valentino, James Snyder, and Cecilia Testa. 2012. “Testing Models
of Distributive Politics using Exit Polls to Measure Voters’ Preferences and
Partisanship.” British Journal of Political Science 43: 845-875.
National Commission on Civic Education (NCCE). 2015. “Assessing the Effec-
tiveness of District Assemblies in Ghana’s Democracy.”
Olken, Benjamin. 2007. “Monitoring Corruption: Evidence from a Field Ex-
periment in Indonesia.” Journal of Political Economy 115(2): 200-249.
Oster, Emily. Forthcoming. “Unobservable Selection and Coefficient Stability:
Theory and Evidence.” Journal of Business Economics and Statistics.
Pressman, Jeffrey L., and Aaron Wildavsky. 1974. Implementation. Berkeley:
University of California Press.
Rasul, Imran, and Daniel Rogger 2016. “Management of Bureaucrats and Public
Service Delivery: Evidence from the Nigerian Civil Service.” Forthcoming,
Economic Journal.
Reinikka, Ritva, and Jakob Svensson. 2004. “Local Capture: Evidence from
a Central Government Transfer Program in Uganda.” Quarterly Journal of
Economics 119(2): 679-705.
44

Riker, William, and Steven Brams. 1973. “The Paradox of Vote Trading.”
American Political Science Review 67(4): 1235-1247.
Robinson, James A., and Ragnar Torvik. 2005. “White Elephants.” Journal of
Public Economics 89: 197-210.
Robinson, James A., and Thierry Verdier. 2013. “The Political Economy of
Clientelism.” Scandinavian Journal of Economics 115(2): 260-291.
Samuels, David. 2002. “Pork Barreling Is Not Credit Claiming or Advertising:
Campaign Finance and the Sources of the Personal Vote in Brazil.” Journal
of Politics 64(3): 845-863.
Today Newspaper. 2015. “Election of MMDCEs: Ahwoi got it wrong – Nduom.”
25 August. 〈http://www.ghanaweb.com/GhanaHomePage/NewsArchive/Election-
of-MMDCEs-Ahwoi-got-it-wrong-Nduom-377412〉, accessed 25 August 2015.
TV3 Network. 2015. “Mahama calls for moderation in demands on gov’t.”
〈http://www.ghanaweb.com/GhanaHomePage/NewsArchive/artikel.php?ID=
353332〉, accessed 4 July 2015.
Vanguard News. 2016. “19,000 projects abandoned in Nigeria, ex-BPP DG tells
Senate.” 〈http://www.vanguardngr.com/2016/05/19000-projects-abandoned-
nigeria-ex-bpp-dg-tells-senate/〉, accessed 11 August, 2016.
Weghorst, Keith R., and Staffan I. Lindberg. 2013. “What Drives the Swing
Voter in Africa?” American Journal of Political Science 57(3): 717-734.
Weingast, Barry, and William Marshall. 1988. “The Industrial Organization of
Congress; or, Why Legislatures, Like Firms, Are Not Organized as Markets.”
Journal of Political Economy 96(1): 132-163.
Whitfield, Lindsay. 2009. “‘Change for a Better Ghana’: Party Competition,
Institutionalization and Alternation in Ghana’s 2008 Elections.” African Af-
fairs 108: 621-641.
45

World Bank. 2011. “Curbing Fraud, Corruption, and Collusion in the Roads
Sector.” Washington, DC: June.
46

Appendix A Sample Annual Progress Report
47

Appendix B Sample balance
The Annual Progress Reports (APRs) used to construct the database had to be
located in hard or soft copy in the offices of the National Development Planning
Commission (NDPC) in Accra or of the Regional Coordinating Councils (RCCs)
in the ten regional capitals. Altogether 479 APRs were located. The maximum
notional number of APRs for the period 2011-13 would be 602: 170 for 2011,
216 each for 2012 and 2013. Of these, 407 APRs contained project tables with
sufficient information to be entered into the database. The final database thus
covers 67.6 percent of possible district-year observations.
There is little evidence that missing reports are correlated with district char-
acteristics. Figure A1 plots the unweighted means and 95 percent confidence
intervals of a wide range of district characteristics, by the number of APRs that
are missing for each district. The most important balancing test is for average
annual project completion, this study’s main dependent variable. Although it is
not possible to calculate this for districts with all three APRs missing, there is
no statistically significant difference in average project completion rates across
districts with different levels of APR completeness.
The sample also appears to be balanced across the other variables reported
in Figure A1. In addition to a wide range of demographic, social, and economic
variables drawn from the 2010 Population and Housing Census, this includes:
districts’ scores on the Functional and Organizational Assessment Tool (FOAT)
evaluation undertaken to assess districts’ compliance with a set of procedural
requirements as part of the allocation and disbursement procedure for DDF
funds; the vote share in the district of the National Democratic Congress (NDC),
which was the ruling party during the sample period, from the 2008 presidential
elections; and budget size, as measured by the total revenue of the district in
2013. There are no apparent patterns across reporting completeness in any of
the variables examined, so there is no evidence that the sample coverage of the
APR database is biased.
48

Figure A1: APR sample balance on selected variables
.3
.4
.5
.6
Mea
n an
nual
com
p. ra
te
0 1 2 3APRs missing
Project completion
11
11.5
12
Log
pop'
n
0 1 2 3APRs missing
Total population
.1
.2
.3
.4
.5
% u
rban
0 1 2 3APRs missing
Population % urban
70
75
80
85
90
Mea
n 20
11-1
2 sc
ore
0 1 2 3APRs missing
FOAT score
.3
.4
.5
.6
.7
.8%
eve
r att.
scho
ol (1
8+)
0 1 2 3APRs missing
Ever attended school
.2
.3
.4
.5
.6
% o
wn
mob
. pho
ne (1
8+)
0 1 2 3APRs missing
Mobile phone ownership
.01
.02
.03
.04
.05
.06
% in
pub
. sec
tor (
18+)
0 1 2 3APRs missing
Public sector labor share
.2
.3
.4
.5
.6
.7
% a
cces
s
0 1 2 3APRs missing
Access to electricity
.5
.6
.7
.8
% a
cces
s
0 1 2 3APRs missing
Access to water
.3
.4
.5
.6
.7
.8
.9
% a
cces
s
0 1 2 3APRs missing
Access to toilet facilities
.4
.5
.6
.7
Vote
shar
e
0 1 2 3APRs missing
NDC voteshare 2008
12345678
GH
S m
illio
ns
0 1 2 3APRs missing
Revenue 2013 (actual)
Note: Mean and 95% confidence intervals shown for each group of districts. Access to electricity is percentageof individuals reporting using mains electricity for lighting; access to water is percentage reporting usingpipe-borne, borehole, or public tap water for drinking; access to toilet facilities is percentage using a WC,KVIP, pit latrine, or public toilet facility (all from Population and Housing Census 2010).
Table A1: Coverage of key variables in dataset
Non-missing Non-missingVariable Obs. Pct. Variable Obs. Pct.
Project title 14,246 100.0% Contract sum 9,869 69.3%Completion status 13,339 93.6% Commencement date 5,518 38.7%Fund source 11,226 78.8% Completion date (expected) 5,061 35.5%Location 11,326 79.5% Completion date (actual) 1,424 10.0%Contractor 9,319 65.4% Expenditure to date 6,224 43.7%
Note: See Appendix C for full variable descriptions.Percentages are as percent of total (n=14,246).
49

Due to the inconsistent reporting formats used by districts in producing their
APRs, many observations are missing important variables, thus restricting the
effective sample for certain types of analysis. Table A1 gives an indication of this
for a selected number of variables. Although this affects the types of analysis
that can be done on the data, there is no indication that the missing variables
are anything other than a result of districts’ use of different reporting formats.
50
Appendix C Variable coding
All APR database variables were coded algorithmically from text strings by
defining a set of word or phrases corresponding to values; the particularities of
this process for each variable, along with other relevant data and coding notes,
are detailed below. Project numbers and statistics in this appendix are given at
the point of coding, and thus may differ from those in the final database from
which repeat observations and non-infrastructure projects have been excluded.
Fund source Project fund source was constructed from APR entries for
project’s fund source for nearly all observations, although in a small number
of cases (178, or 1.1 percent) there was no dedicated entry for fund source but
fund sources were named in the project title. These were combined, and then
coded into fund source categories according to a set of text strings commonly oc-
curring in the data – e.g. for DACF, these were “DACF”, “COMMON FUND”,
“D A C F”, and “CF”. All projects where the fund source was listed as the dis-
trict itself were coded as using internally generated funds (IGF), together with
those where IGF was directly identified as the fund source. A small number
of projects (143) were funded by the local Member of Parliament (MP) using
the small portion allocation of the DACF which is disbursed to them as a con-
stituency development fund; these were coded under “Other” rather than DACF
because they are selected and implemented separately. All projects with more
than one identifiable fund source (about 3 percent) were coded as “Multiple”.
Project type Project type was constructed using sets of commonly used text
strings in the project title to first group projects into sixteen types of infras-
tructure projects:
• Agriculture: dams, irrigation, dug-outs;
• Borehole: boreholes, wells;
• Clinic: clinics, health centres, hospitals, wards;
• Construction – other: abattoirs, computer centers, libraries, taxi ranks,
51

lorry parks, community centers, sports stadiums, light industrial areas,
warehouses;
• Culvert: culverts, drains, ditches, gutters;
• Electricity: electrification, substations;
• Latrine: latrines, Kumasi ventilated improved pits (KVIPs), toilets, water
closets;
• Market: market stalls, stores, sheds, meat shops;
• Office: administration blocks, assembly/town/council halls, courts, police
stations, fire stations;
• Road: roads (paved, graveled, or dirt), bridges, spot improvements, speed
humps, paving works;
• School: classroom blocks, kindergartens, nurseries, early childhood devel-
opment centres;
• School – other: dormitories, dining halls, hostels, school feeding kitchens;
• Staff housing: bungalows, guest houses, accommodation blocks, residences,
quarters;
• Streetlights
• Waste management: refuse dumps, rubbish storage; and
• Water: water systems, water harvesting, water supply, reservoirs and stor-
age, pipe-borne water works, water distribution.
In addition, two categories of non-infrastructure projects were constructed
but not included in the analysis:
• Procurement: purchase, supply, distribution, and furnishing (e.g. tractors,
desks, computers), acquiring land for projects, equipment of facilities; and
52

• Services: a wide variety of activities related to service-provision and other
non-infrastructure activities, e.g. training, vaccination campaigns, capac-
ity building, tax collection, celebrations, monitoring, public education,
sponsoring.
The guiding principle in distinguishing between infrastructure and non-
infrastructure projects was that projects involving physical transformation were
coded as infrastructure (e.g. building a classroom block), whereas projects con-
sisting only of related activities that did not themselves involve physical trans-
formation (e.g. acquiring land to build a classroom block, supplying a classroom
block with textbooks) were coded as non-infrastructure.
This algorithmic coding resulted in unique project types for 74.4 percent of
projects, while 12.8 percent were not assigned a type and another 12.8 percent
were assigned two or more types. These 5,569 projects were manually inspected
and disambiguated if possible, or if the project genuinely straddled two types it
was coded as “multiple”.
Finally, the category “school” was sub-divided into six categories accord-
ing to the size of the classroom block: five categories for 2-, 3-, 4-, 6-, and
12-unit classroom blocks, and a sixth residual category for classroom blocks of
indeterminate size, or reported projects which actually involved more than one
discrete structure (e.g. construction of two 3-unit classroom blocks). Number of
units was coded algorithmically by defining a set of 41 common text string per-
mutations used to denote construction of a single classroom block (e.g. “1NO
3-UNIT [CLASSROOM BLOCK]”, “[CONSTRUCTION] OF 3-UNIT [CLASS-
ROOM BLOCK]”).
Prior to analysis, projects with missing type or coded as “services”, “pro-
curement” were dropped. The project categories used in the analysis therefore
comprise the fifteen non-school infrastructure types listed above; six types of
schools (five according to classroom block size, and one residual category); and
the type “multiple” comprising all projects that could not be manually coded
into a unique type.
53

Construction type Project titles often include a phrase that identifies whether
the project constitutes new (greenfield) construction, or repair, maintenance,
renovation, or rehabilitation of an existing project that had been completed
previously. The former category was coded as projects including the general
text string “CONSTRUCTION OF” and abbreviations or misspellings of this;
project type-specific construction verbs such as “DRILLING OF”, “PAVING”,
and “SPOT IMPROVEMENT”; and strings indicating that the project is a
greenfield project in its second or subsequent year, such as “COMPLETION
OF”, “CONTINUE”, and “CLADDING”. (The APRs are inconsistent in the
extent to which they alter these prefaces for a given project across years (i.e.
whether they change “CONSTRUCTION OF” in the first year of a project to
“COMPLETION OF” in its second year), so these were coded together as green-
field projects.) Project titles containing general phrases such as “MAINTE-
NANCE”, “REPAIR”, “RENOVATION”, and “REHABILITATION”, or project
type-specific phrases such as “DESILTING”, “RE-ROOFING”, “RESURFAC-
ING”, and “RESHAPING” were coded as maintenance/repair/renovation projects.
Altogether 76.4 percent of projects were coded as greenfield construction, 11.9
percent as maintenance/repair/renovation, and the remaining 11.6 percent could
not be uniquely identified as either type.
Project completion Project completion was coded as a binary variable by
combining information from three raw variables, of which one or two are typi-
cally reported in each APR: ProjectStatus (e.g. “COMPLETED”, “INSTALLED
AND IN USE,” “100 WORK DONE”), Remarks (similar), and PercentWork (on
the scale 0-100; 100 coded as complete). Projects were coded as complete if they
were at a stage where physical construction work had been completed, regardless
of whether they had been formally handed over, furnished, commissioned, and
put into use – for example “COMPLETED YET TO BE FURNISHED AND
COMMISSIONED” was coded as complete. This yielded a unique completion
coding for 91.6 percent of observations; the remainder were disambiguated by
visual inspection if possible, and given a missing value if it was impossible to
54

determine the project’s status conclusively.
Although the gap between physical completion and putting the facility into
use is of potential interest, physical completion was chosen as a cutoff point for
the purposes of the APR database because: 1) the status of post-construction
activities like furnishing, commissioning, and use are reported inconsistently in
the APRs; and 2) the analytical focus of this paper is on infrastructure project
construction, not subsequent service provision using those facilities.
Contractor A total of 6,798 unique contractor names are listed in the APR
database for 10,701 infrastructure projects. However, many of these are clearly
the same contractor but with different spellings (e.g. “WRKS” for “WORKS”),
abbreviations (e.g. “LTD.” for “LIMITED”), or omissions (e.g. dropping
“LIMITED” or “INC.”). In order to combine these, contractor names were
stripped of these and other generic elements of company names (e.g. “EN-
TERPRISE”, “TRADING”, “MESSRS.”, “M/S”, “COMPANY”), as well as
punctuation marks and spaces. This reduced the number of unique contractor
names from 6,798 to 5,113. Using these corrected contractor names rather than
the raw names slightly changes the point estimates on fund source regression
coefficients, but not the differences between these coefficients, which are the
quantities of interest.
District In mid-2012, 45 of Ghana’s 170 districts were split to create 46 new
districts (one district was split into three), leaving a total of 216 districts. The
46 new districts were all entirely contained within a single parent district, so
there was no realignment of borders between districts. The 2011 and 2013 APRs
thus reflect the 170 and 216 districts, respectively. For 2012 districts reported
according to the new (216) district names, although many of the newly created
districts did not report as they had only been in existence for approximately six
months and were still waiting offices, personnel, etc. This creates some concern
about duplications or omissions in the reporting of projects in split districts
that started prior to the split, and it is unclear how consistently these matters
were handled across districts. However, restricting the sample to districts that
55

did not split in 2012 does not affect any of the results presented above, and
the regression results include district-year fixed effects that would capture any
disruption caused by these administrative splits, so the potential data concerns
created by the district splits do not appear to affect the analysis.
For purposes of project linking and fixed effects, the post-split “parent” dis-
trict (the one that maintained the existing district capital, political leadership,
and the majority of its administrative staff) is treated as the same district as
the pre-split combined district, regardless of whether it changed its name, while
the new “child” district is treated as a new district.
The other secondary data sources drawn on by this paper differ in whether
they report the old 170 or new 216 districts for 2012. This means that in
some cases (e.g. with budget data) APR data from a post-split 2012 district is
matched to other secondary data from a pre-split 2012 combined district. The
2010 Population and Housing Census initially used the 170 districts but has
been recoded to correctly reflect the new 216 districts for the analysis years
2012 and 2013.
Classroom block additional facilities For all classroom blocks for which it
was possible to identify the number of units (2, 3, 4, 6, or 12), three indicator
variables representing additional facilities included in the project were defined:
latrines and toilets (project titles including the strings “LATRINE”, “TOI-
LET”, “KVIP”, etc.); offices/stores/libraries (“OFFICE”, “STORE”, “COM-
MON ROOM”, “LIBRARY”); and general ancillary facilities (various spellings
and abbreviations of “ANCILLARY”). These variables were not coded as mu-
tually exclusive, although it is not common for one project to combine multiple
types of ancillary facilities. A residual variable was defined for the 38.0 percent
of projects that do not appear to include any of these ancillary facilities.
56

Appendix D Attrition
Because very few districts assign unique tracking numbers to projects, linking
projects across years had to be done manually. For each district for which all
three years of data were available, records of projects coded as being in the same
location (e.g. village, neighborhood) in different years were visually inspected
according to their project title, fund source, completion status, contract sum,
and other potentially identifying information, and linked if they were obviously
the same project. Conditional on being incomplete in 2011 or 2012, only 33.8
percent of projects could be identified in the following year, indicating a high
degree of attrition in reporting and linking. This gives rise to two concerns:
first, differential attrition rates across fund sources could bias the within-district
estimates of fund source completion rates.39 Second, attrition is likely to be
correlated with project completion (if bureaucrats stop reporting unfinished
projects that have been abandoned) and thus poses a challenge for estimating
the overall completion rate.
To investigate the first possibility, I construct an attrition indicator variable
equal to one if a project that is incomplete in 2011 or 2012 can be linked to
the same project’s record in the following year (2012 or 2013, respectively),
and zero otherwise. This variable is defined only for projects in districts that
have three years of APR data. I then use this as the dependent variable in an
attrition probability model, estimated as a linear probability model, where the
key variables of interest are fund source indicator variables.
The results are presented in Table A2. Column 1 estimates the model with no
controls and indicator variables only for the three major fund sources; Column 2
adds the baseline set of district-year and project type fixed effects, plus project
characteristics; and Column 3 estimates the model with community fixed effects.
39Attrition rates also vary across districts, and it is possible that districts interpret thereporting mandate in slightly different ways: some may report all projects that were underwayin the district, whether or not they were active during the year, while others may only reportprojects that were active or included in annual budgets. However, this does not pose a majorthreat to this paper’s main analysis, as the district fixed effects would cancel out district-leveldifferences in attrition.
57

Table A2: Attrition probability by fund source
(1) (2) (3)
Gov’t-funded -0.033 -0.012 -0.010(0.069) (0.046) (0.078)
Centralized 0.019 -0.047 -0.002(0.066) (0.045) (0.115)
District-Year fixed effects YesCommunity fixed effectsDistrict-Year groups 71Community groups 496R2 0.002 0.518 0.812N 915 915 807
Note: Dependent variable is project attrition. All speci-fications include: fixed effects for 22 project types, withschools grouped by number of classrooms; constructiontype (construction or maintenance); and indicators fornumber of years since project start. Year fixed effectsincluded in Column 3. Huber-White robust standarderrors clustered by district-year in Columns 1-2 and bycommunity in Column 3. Constant term not shown.
The differences among the coefficients on the three major fund sources are small
and are not statistically significant in any of the specifications.
To address the second concern, I estimate three different sets of completion
rates, which are almost identical for projects’ first year but diverge thereafter:
• Upper bound. Projects are classified into years (1-3) according to their
reported year of commencement (e.g. a 2012 observation of a project that
started in 2011 is in its second year). No correction is made for attrition.
Sample is all projects with non-missing commencement year.
• Middle estimate. Projects are classified into years according to manual
linking (see above). Incomplete projects that cannot be traced to the
subsequent year are treated as missing in the subsequent year (i.e. no
correction is made for attrition). Projects that have not been linked to
an observation from previous year are assumed to be in their first year.
Sample is all projects from districts for which all three years of data are
available. This is the method used in the main body of the paper.
• Lower bound. Same as middle estimate, but incomplete projects that
cannot be traced to the subsequent year are assumed not to have been
58

Figure A2: Alternative completion rate estimates
0
.25
.5
.75
1
Com
plet
ion
Rat
e
0 1 2 3Project year
Upper bound Middle estimate Lower bound
Note: See text for details of methodology.
finished (i.e. attriting observations are treated as incomplete).
The upper bound estimate will be biased upward if unfinished/abandoned
projects are more likely to attrite from the dataset than completed projects,
which is probable. Likewise, the lower bound estimate will be biased downward
if untraceable projects are actually completed in the subsequent year but not
reported, or if the projects were completed and reported but not linked by the
manual tracing methodology. The middle estimate is situated between these two
but may also be biased, although the direction of this bias is unclear a priori. To
the extent that the middle and lower estimates incorrectly group projects that
are in their second or subsequent years but are appearing in the dataset for the
first time as first-year projects, the first-year completion rates may be biased;
in practice however this bias appears to be small, as the first-year completion
rates are very similar under all three estimates.
Figure A2 presents the three-year completion rates using these different es-
timation methods. The differences in the second and third years among the
59

methods are large, although the completion hazard rate continues to decrease
over time across each methodology.
Figure A3: Project completion by fund source - alternative estimates
0
.25
.5
.75
1
Com
plet
ion
Rat
e
0 1 2 3Project year
a. Upper bound estimate
0
.25
.5
.75
1
0 1 2 3Project year
b. Middle estimate
0
.25
.5
.75
1
0 1 2 3Project year
c. Lower bound estimate
Note: See text for details of methodology.
Donor-funded Gov't-funded Centralized
However, Figure A3 shows that the differences across fund sources vary little
across the estimation methodologies. This provides further reassurance that the
main findings of the paper are not affected by attrition.
Finally, the attrition in linking projects from year-to-year suggests that the
low rates of correspondence between district medium-term plans and projects
actually implemented (5.7 percent of projects in district plans could be located
in the APR database, and 3.8 percent of projects reported in the APR database
could be identified in the plan) could overstate the true variance. Since the same
linking methodology was used for the plan-APR linking as for the year-to-year
linking within the APR database, a conservative approximation of the potential
extent of bias can be generated using the observed attrition rate within the APR
database (66.2 percent). Under the extremely conservative assumption that all
of this attrition is due to error in the linking process (rather than districts
60

ceasing to report on projects on which no new progress had been made), then
the plan-APR linking rates could represent only 33.8 percent of the true rate
of correspondence. This would roughly triple the true rate of correspondence,
to 16.9 percent of planned projects that were implemented and 11.2 percent
of implemented projects that were planned. Even these generous estimates
are still extremely low in absolute terms, however, and would still support the
conclusion that there is a high degree of temporal instability in district collective
expenditure priorities.
61

Appendix E Validating completion measures
This appendix reports the numerous steps taken to address concerns about bias
in districts’ reported levels of project completion. The project completion rates
estimated from the APR database used in this paper are in a similar range to
figures compiled on smaller project samples through (1) a donor-commission
independent evaluation report, (2) an internal Ministry of Education database
compiled through separate means, and (3) a Ghana Audit Service monitor-
ing report. I also (4) conducted two sets of site visits to small sub-samples
of projects, 128 in total, and found no evidence of systematic bias in report-
ing. On the specific concern that the finding of systematic under- or delayed
payment to contractors may be biased by over-reporting of physical completion
or under-reporting of financial expenditure, I (5) present a Ghana Audit Ser-
vice audit report of 100 projects that found under-payment to be pervasive and
over-payment almost non-existent, and (6) show evidence that underpayment
to contractors does not appear to be explained by normal delays in payment
processing or difficulties in tracking financial expenditure across years. Finally,
I (7) argue that districts’ have little incentive to misreport completion in the
APRs since these reports are not used for accountability purposes, and even
if there were some degree of bias in completion reporting, an opinion that is
shared by central government auditors. Furthermore, in order to bias the key
predictions of the collective choice and clientelism theories, any bias in comple-
tion reporting would have to be within rather than across districts, differential
across fund sources, and the extent of this difference would have to be correlated
with district partisan vote shares.
(1) An independent, donor-commission evaluation report on a sample of 90
projects across 28 districts in late 2013 (Salasan Consulting 2013) found that 78
percent of DDF projects were completed (compared to a three-year completion
rate of 78.5 percent from the APR database) and 53 percent of DACF projects
were completed (compared to a three-year completion rate of 64.0 percent from
62

the APR database). These completion rates are not directly comparable, since
no information is given on the start date or expected completion time of these
projects and the sample is non-representative, but it is reassuring that the com-
pletion rates are nonetheless in a similar range.
(2) The Ministry of Education maintains its own internal monitoring database
of 1,146 GETFund projects, which is compiled by central officials rather than
the district officals who write APRs. It reports that of 6-unit classrooms and
dormitories started between 2009 and 2013 nationwide, only 36.6 percent had
been completed. It is not possible to disaggregate this by year of project com-
mencement, and the date of reporting is not indicated (these figures are based
on a database provided by the Ministry of Education in January 2015). (3) In
addition, the Ghana Audit Service reports that a June 2013 monitoring effort of
179 school projects in seven regions started in 2010 and 2011 found that 27 per-
cent were complete, despite scheduled completion times of six to twelve months
– a similar length to most GETFund projects in the APR database (Ghana
Audit Service 2014, 290). While these estimates differ slightly in timespan and
project coverage, they are in the same range as APR database estimates that
GETFund projects have one-year completion rates of 25.4 percent and three-
year completion rates of 44.8 percent.
(4) Though the high cost of locating and travelling to projects in remote
areas made it impractical to conduct visits to a representative sample of projects
in each district (hence the need to rely on administrative data), I conducted
physical site visits to a small sub-sample of projects that had been coded as
complete in 2013, spread across four randomly selected districts in two regions.
Seventeen of the twenty projects were fully complete, while the remainder were
functionally complete but with minor areas of incompleteness (e.g. no windows,
untiled floors, holes in roof, some roofing remaining to be done). Sixteen of
the projects were in full use; of the remaining four, one was in partial use,
one was out of use because of cracks and accessibility issues, and one had not
been commissioned yet. The site visits were conducted in October 2014, ten
63

months after the project had been reported as complete; in only one case did
people present at the project site report that the project had actually been fully
completed in 2014 rather than 2013. The physical evidence from this limited
sample suggests that while construction quality, maintenance, and finishing may
be issues, there is little evidence that districts’ reports of substantial aspects of
physical construction are systematically biased towards completion.
In January-March 2017 I conducted a second set of site visits to 108 projects
that were reported on in 2015 (selected using preliminary data drawn from the
2015 APRs). The projects were randomly selected from 12 districts in three re-
gions, covered the three most common project types (schools, latrines, and staff
housing), and included projects that had been reported as incomplete as well as
complete. A research assistant was trained by Ghana government engineers to
estimate percentage completion status. In total, 63.6 percent of actual project
percentage physical completion estimates were within 10 percentage points of
the estimate reported in the APR, 27.3 percent had significantly higher physical
completion than reported, and 9.1 percent had significantly lower physical com-
pletion rates than reported. Of the eight projects for which physical progress had
been overreported, in only three was the gap between estimates larger than 25
percentage points. The overreported projects were spread across fund sources:
two from the GETFund (“centralized”), two from the DACF (“government-
funded”), two from the DDF (“donor-funded”), one from district own revenue,
and one had no fund source data.
To estimate how much influence the handful of projects for which completion
was over-reported might have on the missing expenditure calculations used in
discussing the incidence of over- versus under-payment, for these 108 projects I
calculate the missing expenditures variable in two ways: first, by using the phys-
ical completion status as reported in the APR, as in the main text; and second,
using a “corrected” physical completion status measure in which I replace the
self-reported completion percentage with the “correct” estimate from the site
visit. This is the most conservative possible way to implement this correction,
64
since it assumes that all measurement or reporting error on physical completion
is positive (i.e. overestimates completion). Compared to the corrected measure,
the APR dataset overstates the percentage of projects where missing expen-
ditures are significantly negative (underpayment) by 8.3 percent (and has no
impact on the percentage of projects with positive missing expenditures). The
key ratio presented in the main text was that underpayment by 10 percent or
more is 3.2 times more frequent than overpayment by 10 percent or more for in-
complete projects. If the percentage of projects with significant underpayment
were actually 8.3 percent lower due to over-reporting of completion, then this
ratio would be 3.0 instead of 3.2. Even under the most conservative assump-
tions about potential over-reporting of physical completion data, then, the key
qualitative finding of the analysis still holds: underpayment for work done is far
more common than overpayment for work done.
(5) In 2015 the Ghana Audit Service undertook intensive performance au-
dits of a (non-representative) sample of 100 projects from 50 districts around
the country. On the subject of “payment for works”, it concluded the delayed
payment and underpayment to contractors was pervasive: “Payment to con-
tractors was a serious problem in all the assemblies. In most cases it was [only]
the advance mobilization payment that was made on time. All other payments
were not regular as envisaged by the conditions of contract.” (Ghana Audit
Service 2016a, 26) In contrast, the only instance of overpayment it noted - in a
section on “Uncommon But Significant Audit Findings” - was the payment of
an entire bill of quantities line item for a library that was constructed smaller
than had been specified, resulting in overpayment of GHS 18,610.8240 (Ghana
Audit Service 2016a, 28). A senior auditor who worked on the project confirmed
that such instances of overpayment were rare: “I don’t think it was a common
thing. I don’t think I saw that in the areas I went. . . That may have been if they
were falsifying information on the payment certificates. There was one district
that had something like that. It wasn’t something that was cutting across all.
40Equivalent to USD 4,561.48 using the exchange rate of June 1, 2015.
65

Maybe two or three” (Telephone interview, 27 January, 2017).
(6) Districts usually have a period of 28 days after contractors have submit-
ted payment requests in which to inspect work and make payment; the length of
this period can vary by contract. Since both financial and physical status are re-
ported by districts at the end of the year, this time lag could exaggerate the true
extent of underpayment if payment delays were normal or merely a short-term
phenomenon. If this measurement issue were driving the over/under-payment
(“missing expenditures”) measure, then projects completed earlier in the year
should have lower rates of underpayment than projects completed later in the
year. However, there is no correlation (-0.0026, p = 0.966) between projects’
reported month of completion and missing expenditures. Thus, negative values
really do seem to be measuring severely delayed payment or non-payment rather
than normal lags in processing payment.
(7) Finally, district officials would have no incentive to lie in compiling their
APRs, since the APRs are not submitted directly to any of the funding insti-
tutions, and prior to the compilation of this database were not being used by
these institutions for monitoring purposes. The reports were subject only to
a perfunctory check by central government officials and there are no reported
instances of any district-level being punished based on information reported in
an APR. Scrutiny of district operations is somewhat more intense in terms of
financial management due to the Ghana Audit Service’s annual audits, but if
anything this provides an incentive for district-level officers not to misreport
the financial status of projects on APRs. This is because the information on fi-
nancial expenditure in APRs is easy to verify against other payment records, so
any discrepancy would be likely to be noticed and attract unwanted attention.
In an interview, a senior Audit Service official expressed skepticism regarding
district officials’ incentives to misrepresent projects’ physical or financial status
in the APRs: “I don’t think any of them will represent false information. It’s
not something that really happens actually. . . They don’t have an incentive to
lie at all.” (Telephone interview, 27 January, 2017)
66

Furthermore, it is important to note that data quality and reporting hon-
esty are most likely to vary at the district level, since this is the level at which
APRs are written. Since this paper’s analysis focuses mainly on within-district
variation, however, misreporting would only bias the key results if it were dif-
ferential across fund sources and the extent of this across-fund source difference
was correlated with partisan vote shares.
Supplementary References
Salasan Consulting. 2013. “The District Development Facility (DDF) and the
District-Wide Assistance Transition Project (DWAP) in Ghana: An Indepen-
dent Review.” August-September.
67

Appendix F Robustness
F.1 Robustness
Table A3 presents the results of several robustness checks on the main results.
To account for the binary dependent variable, Column 1 presents the baseline
model from Equation 1 estimated with a random effects logit. The large number
of district-year groups makes estimation with fixed effects unfeasible, hence the
preference for the linear probability model throughout, but Column 1 shows
that this estimator choice is not driving the results.
To address the concern that the project type fixed effects do not adequately
control for heterogeneity in the physical characteristics of projects, Column 2
restricts the sample to schools (with project type defined by the number of
classrooms in the school) and introduces controls for the presence of ancillary
facilities attached to the school buildings. The estimated τGov′t remains large
and statistically significant, and significantly greater than τCentral.
Another potential concern is that the use of annual project completion rate as
dependent variable might be biasing the estimated fund source effects, as could
be the case if project completion rates declined over years since project start, if
this led latter-year projects from some fund sources to remain in the sample, and
if the project-year controls included in the regression did not adequately control
for this effect. Column 3 therefore restricts the same to the subset of projects
for which commencement dates are available, and thus for which it is possible to
determine with certainty that they are in their first year of implementation. The
point estimate of τGov′t is almost unchanged from the baseline model in Table
2 Column 4, but loses statistical significance at conventional levels because the
sample restriction dramatically increases the standard error of the estimate.
Another concern is that τGov′t could be driven by some aspects of project
size that are not captured by the project type controls and are correlated with
project fund source and partisan alignment. To examine this, Columns 4 and
5 include controls for project contract sum and scheduled project duration, re-
68

Table A3: Robustness checks
(1) (2) (3) (4) (5)Logit Schools First-year Cost Duration
Gov’t-funded -1.179 -0.423 -0.210 -0.222 -0.392(0.271) (0.076) (0.133) (0.064) (0.077)
Centralized -1.159 -0.377 -0.333 -0.160 -0.357(0.393) (0.082) (0.213) (0.084) (0.096)
Gov’t-funded * NDC vote share 1.266 0.573 0.252 0.176 0.553(0.508) (0.160) (0.289) (0.126) (0.197)
Centralized * NDC vote share -0.554 0.291 0.053 0.018 0.236(0.688) (0.154) (0.512) (0.160) (0.242)
Ancillary facilities -0.108(0.031)
Toilet -0.026(0.044)
Office/ store/ library 0.026(0.028)
Ln(contract sum) -0.134(0.016)
Scheduled duration -0.025(0.030)
District-Year RE YesDistrict-Year FE Yes Yes Yes YesDistrict-Year groups 305 147 276 140R2 0.421 0.518 0.390 0.405N 6460 2815 1110 4358 1955
Dependent variable is project completion. All specifications include: fixed effects for 22project types, with schools grouped by number of classrooms; construction type (con-struction or maintenance); and indicators for number of years since project start. NDCvote share 2008 is the ruling party’s voteshare in the 2008 presidential elections in thedistrict (or its antecedent district, for districts that split in 2012). Huber-White robuststandard errors clustered by district-year. Constant term not shown.
spectively, although properly speaking both these measures of project size are
post-treatment variables and so their inclusion could bias τGov′t up or down.
Again, these can only be estimated on restricted samples due to many districts
not reporting these variables. The point estimates vary somewhat across speci-
fications and samples, but the key interaction term results are unchanged.
As Hainmueller et al (2017) note, interaction models such as the one used in
this article are often subject to problems of non-linearity and lack of common
support. To address this issue, I implement Hainmueller et al ’s recommended
“binning” procedure that allows for non-linear marginal effects and displays
the common support of government- and donor-funded projects. As Figure A4
69

Figure A4: Robustness of marginal effects
L M H
-.6
-.4
-.2
0
.2
.4
Mar
gina
l Eff
ect o
f Gov
't-fu
nded
on
Proj
ect c
ompl
etio
n
0 .2 .4 .6 .8 1Moderator: NDC vote share 2008
a. No FE
L M H
-.6
-.4
-.2
0
.2
.4
Mar
gina
l Eff
ect o
f Gov
't-fu
nded
on
Proj
ect c
ompl
etio
n
0 .2 .4 .6 .8 1Moderator: NDC vote share 2008
b. District-year FE
Note: Marginal effects calculated using Stata command interflex. Sample is all donor- orgovernment- funded projects. Both graphs include controls described in Table A3. Robuststandard errors clustered by district-year.
shows, there is a common support of projects from both fund sources across
the spectrum of values for NDC vote share. Panel (a) of Figure A4 without
district-year fixed effects shows no evidence of non-linearity, and a Wald test
fails to reject the null of a linear marginal effect. When district-year fixed ef-
fects are added in Panel (b) there is some evidence that the marginal effect
of government funding is concentrated in the lower and middle terciles of the
distribution of NDC vote share, and the Wald test is rejected. This suggests
that there could potentially be non-linearities or threshold effects in coalition
formation and project priority stabilization. However, this article’s key theo-
retical prediction is simply that the government-funded completion rate should
be increasing in NDC vote share relative to that of donor projects, and does
not specify the functional form of this relationship, so this possibility is not in-
consistent with the theory. Further exploring this would be an interesting topic
for further research and possibly formal modelling. While Panel (b) suggests
that the interaction between partisan alignment and project fund source may
70

be stronger in some parts of the distribution than others, there is no evidence
that the effect is non-increasing or significantly non-negative.
F.2 Ethnicity
The main body of this article uses district ruling party vote share to proxy for
the ease of achieving efficient collective choice outcomes at district-level, for rea-
sons described in Section , and shows that this proxy affects government-funded
projects where expenditure decisions are taken at local level but not centralized
projects. As a robustness check on the idea that non-completion is caused by
district-level collective decisionmaking problems, Table A4 re-estimates Equa-
tion 1 using two measures of district ethnic diversity as alternative proxies for
the difficulty of sustaining intertemporal bargains among district-level political
actors. Since poor public good provision has often been attributed to ethnic
diversity (Miguel and Gugerty 2005), ethnic diversity could serve as an alter-
native proxy for the efficiency of district-level collective choices over project
distribution, although there is considerable disagreement in the literature over
whether and when ethnic diversity reduces public good provision and the pro-
posed mechanism is usually through collective action rather than collective
choice (Glennerster, Miguel, and Rothenberg 2013). The two measures of eth-
nic diversity are: ethnic fractionalization, calculated as standard (e.g. Miguel
and Gugerty 2005); and ethnic polarization, calculated following Montalvo and
Reynal-Querol (2005). Both are calculated using the primary ethnic categories
from Ghana’s 2010 Population and Housing Census.
The estimated coefficients on the ethnicity-fund source interaction terms in
Columns 1 and 2 imply that government-funded project completion is weakly de-
creasing in ethnic diversity relative to donor-funded project completion, while
the effect on centralized projects is even weaker and actually positive-signed.
These patterns are somewhat stronger for ethnic polarization than ethnic frac-
tionalization, consistent with the idea that it is the political salience of ethnic
diversity rather than diversity itself that is problematic for collective choice,
71

Table A4: Ethnic diversity and fund source interactions
(1) (2) (3) (4)
Gov’t-funded -0.072 -0.024 -0.183 -0.139(0.055) (0.074) (0.080) (0.098)
Centralized -0.276 -0.288 -0.240 -0.251(0.067) (0.082) (0.102) (0.120)
Gov’t-funded * Ethnic fractionalization -0.071 -0.072(0.110) (0.108)
Centralized * Ethnic fractionalization 0.054 0.047(0.126) (0.127)
Gov’t-funded * Ethnic polarization -0.133 -0.123(0.120) (0.120)
Centralized * Ethnic polarization 0.062 0.053(0.124) (0.127)
Gov’t-funded * NDC vote share 0.240 0.233(0.116) (0.117)
Centralized * NDC vote share -0.062 -0.058(0.129) (0.132)
District-Year FE Yes Yes Yes YesDistrict-Year groups 338 338 338 338R2 0.351 0.352 0.353 0.353N 6460 6460 6460 6460
Dependent variable is project completion. All specifications include: fixed effectsfor 22 project types, with schools grouped by number of classrooms; constructiontype (construction or maintenance); and indicators for number of years sinceproject start. Ethnic fractionalization and polarization are calculated as standardin the literature (see Miguel and Gugerty 2005, Montalvo and Reynal-Querol2005), using the primary ethnic categories from Ghana’s 2010 Population andHousing Census; and NDC vote share 2008 is the ruling party’s voteshare in the2008 presidential elections in the district (or its antecedent district, for districtsthat split in 2012). Huber-White robust standard errors clustered by district-year. Constant term not shown.
but even for polarization the differences across fund sources are not statistically
significant: p = 0.269 for the donor-government comparison, and p = 0.072 for
the difference between government-funded and centralized projects.
Columns 3 and 4 show that the point estimates and statistical significance
of the interaction terms between project fund source and NDC vote share are
unaffected by the inclusion of the ethnic diversity interaction terms. The rele-
vant collective choice problems - and means of resolving them - thus appear to
be more closely associated with partisan politics rather than ethnic divisions,
at least in the Ghanaian context.
72

Supplementary References
Glennerster, Rachel, Edward Miguel, and Alexander D. Rothenberg. 2013.
“Collective Action in Diverse Sierra Leone Communities.” The Economic Jour-
nal 123: 285-316.
Hainmueller, Jens, Jonathan Mummolo, and Yiqing Xu. 2017. “How Much
Should We Trust Estimates from Multiplicative Interaction Models? Simple
Tools to Improve Empirical Practice.” Mimeo, 13 February.
Miguel, Edward, and Mary Kay Gugerty. 2005. “Ethnic diversity, social
sanctions, and public goods in Kenya.” Journal of Public Economics 89: 2325-
2368.
Montalvo, Jose G. and Marta Reynal-Querol. 2005. “Ethnic Polarization,
Potential Conflict, and Civil Wars.” American Economic Review 95(3): 796-
816.
73