Embed Size (px)
Citation preview
RESEARCH ARTICLE
The population genetics of human disease:
The case of recessive, lethal mutations
Carlos Eduardo G. Amorim1,2*, Ziyue Gao3, Zachary Baker4, Jose Francisco Diesel5,
Yuval B. Simons1, Imran S. Haque6¤, Joseph Pickrell1,7‡, Molly Przeworski1,4‡
1 Department of Biological Sciences, Columbia University, New York, NY, United States of America,
2 CAPES Foundation, Ministry of Education of Brazil, Brasılia, DF, Brazil, 3 Howard Hughes Medical
Institution, Stanford University, Stanford, CA, United States of America, 4 Department of Systems Biology,
Columbia University, New York, NY, United States of America, 5 Universidade Federal de Santa Maria,
Santa Maria, RS, Brazil, 6 Counsyl, 180 Kimball Way, South San Francisco, CA, United States of America,
7 New York Genome Center, New York, NY, United States of America
¤ Current address: Freenome, South San Francisco, CA, United States of America
‡ These authors co-supervised this work.
Abstract
Do the frequencies of disease mutations in human populations reflect a simple balance
between mutation and purifying selection? What other factors shape the prevalence of dis-
ease mutations? To begin to answer these questions, we focused on one of the simplest
cases: recessive mutations that alone cause lethal diseases or complete sterility. To this
end, we generated a hand-curated set of 417 Mendelian mutations in 32 genes reported to
cause a recessive, lethal Mendelian disease. We then considered analytic models of muta-
tion-selection balance in infinite and finite populations of constant sizes and simulations of
purifying selection in a more realistic demographic setting, and tested how well these mod-
els fit allele frequencies estimated from 33,370 individuals of European ancestry. In doing
so, we distinguished between CpG transitions, which occur at a substantially elevated rate,
and three other mutation types. Intriguingly, the observed frequency for CpG transitions is
slightly higher than expectation but close, whereas the frequencies observed for the three
other mutation types are an order of magnitude higher than expected, with a bigger deviation
from expectation seen for less mutable types. This discrepancy is even larger when subtle
fitness effects in heterozygotes or lethal compound heterozygotes are taken into account.
In principle, higher than expected frequencies of disease mutations could be due to wide-
spread errors in reporting causal variants, compensation by other mutations, or balancing
selection. It is unclear why these factors would have a greater impact on disease mutations
that occur at lower rates, however. We argue instead that the unexpectedly high frequency
of disease mutations and the relationship to the mutation rate likely reflect an ascertainment
bias: of all the mutations that cause recessive lethal diseases, those that by chance have
reached higher frequencies are more likely to have been identified and thus to have been
included in this study. Beyond the specific application, this study highlights the parameters
likely to be important in shaping the frequencies of Mendelian disease alleles.
PLOS Genetics | https://doi.org/10.1371/journal.pgen.1006915 September 28, 2017 1 / 23
a1111111111
a1111111111
a1111111111
a1111111111
a1111111111
OPENACCESS
Citation: Amorim CEG, Gao Z, Baker Z, Diesel JF,
Simons YB, Haque IS, et al. (2017) The population
genetics of human disease: The case of recessive,
lethal mutations. PLoS Genet 13(9): e1006915.
https://doi.org/10.1371/journal.pgen.1006915
Editor: Philipp W. Messer, Cornell University,
UNITED STATES
Received: December 4, 2016
Accepted: July 9, 2017
Published: September 28, 2017
Copyright: © 2017 Amorim et al. This is an open
access article distributed under the terms of the
Creative Commons Attribution License, which
permits unrestricted use, distribution, and
reproduction in any medium, provided the original
author and source are credited.
Data Availability Statement: All relevant data are
within the paper and its Supporting Information
files and code from gitHub (https://github.com/
cegamorim/PopGenHumDisease; https://github.
com/sellalab/ForwardSimulator).
Funding: CEGA was partially funded by a Science
Without Borders fellowship from CAPES
foundation (BEX 8279/11-0) and Conselho
Nacional de Desenvolvimento Cientıfico e
Tecnologico (PDE 201145/2015-4), Brazil. ZG was
partially supported by a postdoctoral fellowship
funded by Stanford Center for Computational,
Author summary
What determines the frequencies of disease mutations in human populations? To begin to
answer this question, we focus on one of the simplest cases: mutations that cause com-
pletely recessive, lethal Mendelian diseases. We first review theory about what to expect
from mutation and selection in a population of finite size and generate predictions based
on simulations using a plausible demographic scenario of recent human evolution. For a
highly mutable type of mutation, transitions at CpG sites, we find that the predictions are
close to the observed frequencies of recessive lethal disease mutations. For less mutable
types, however, predictions substantially under-estimate the observed frequency. We dis-
cuss possible explanations for the discrepancy and point to a complication that, to our
knowledge, is not widely appreciated: that there exists ascertainment bias in disease muta-
tion discovery. Specifically, we suggest that alleles that have been identified to date are
likely the ones that by chance have reached higher frequencies and are thus more likely to
have been mapped. More generally, our study highlights the factors that influence the fre-
quencies of Mendelian disease alleles.
Introduction
New disease mutations arise in heterozygotes and either drift to higher frequencies or are rap-
idly purged from the population, depending on the strength of selection and the demographic
history of the population [1–6]. Elucidating the relative contributions of mutation, natural
selection and genetic drift will help to understand why disease alleles persist in humans.
Answers to these questions are also of practical importance, in informing how genetic varia-
tion data can be used to identify additional disease mutations [7].
In this regard, rare, Mendelian diseases, which are caused by single highly penetrant and
deleterious alleles, are perhaps most amenable to investigation. A simple model for the persis-
tence of mutations that lead to Mendelian diseases is that their frequencies reflect an equilib-
rium between their introduction by mutation and elimination by purifying selection, i.e., that
they should be found at “mutation-selection balance” [4]. In finite populations, random drift
leads to stochastic changes in the frequency of any mutation, so demographic history, in addi-
tion to mutation and natural selection, plays an important role in shaping the frequency distri-
bution of deleterious mutations [3].
Another factor that may be important in determining the frequencies of highly penetrant
disease mutations is genetic interactions. The mutation-selection balance model has been
extended to scenarios with more than one disease allele, as is often seen for Mendelian diseases
[8,9]. When compound heterozygotes have the same fitness as homozygotes for the disease
allele (i.e., there is no complementation), the combined frequency of all disease alleles can be
modeled similarly as the bi-allelic case, with the mutation rate given by the sum of the muta-
tion rate to each disease allele [8]. In other cases, a disease mutation may be rescued by another
mutation in the same gene [10–12] or by a modifier locus elsewhere in the genome that modu-
lates the severity of the disease symptoms or the penetrance of the disease allele (e.g. [13–15]).
For a subset of disease alleles that are recessive, an alternative model for their persistence in
the population is that there is an advantage to carrying one copy but a disadvantage to carrying
two or none, such that the alleles persist due to overdominance, a form of balancing selection.
Well known examples include sickle cell anemia, thalassemia and G6PD deficiency in populations
The population genetics of recessive, lethal mutations
PLOS Genetics | https://doi.org/10.1371/journal.pgen.1006915 September 28, 2017 2 / 23
Evolutionary and Human Genomics. JFD was
funded by a Science Without Borders fellowship
from CAPES foundation (88888.038761/2013-00).
YBS was supported by NIH grant GM115889. The
work was partially supported by a Research
Initiative in Science and Engineering grant from
Columbia University and NIGMS grants
(GM121372) to JKP and MP. The computing in
this project was supported by two National
Institutes of Health instrumentation grants
(S10OD012351 and S10OD021764) received by
the Department of Systems Biology at Columbia
University. The funders had no role in study
design, data collection and analysis, decision to
publish, or preparation of the manuscript.
Competing interests: The authors have declared
that no competing interests exist.

living where malaria exerts strong selection pressures [16]. The importance of overdominance in
maintaining the high frequency of disease mutations is unknown beyond these specific cases.
Here, we tested hypotheses about the persistence of mutations that cause lethal, recessive,
Mendelian disorders. This case provides a good starting point, because a large number of Men-
delian disorders have been mapped (e.g., genes have already been associated with>56% of
Mendelian disease phenotypes; [17]). Moreover, while the fitness effects of most diseases are
hard to estimate, for recessive lethal diseases, the selection coefficient is clearly 1 for homozy-
gote carriers in the absence of modern medical care (which, when available, became so only in
the last couple of generations, a timescale that is much too short to substantially affect disease
allele frequencies). Moreover, assuming mutation-selection balance in an infinite population
and no effects in heterozygotes would suggest that, given a per base pair (bp) mutation rate uon the order of 10−8 per generation [18], the frequency of such alleles would be
ffiffiffiup
, i.e., ~10−4
[4]. Thus, sample sizes in human genetics are now sufficiently large that we should be able to
observe completely recessive, lethal disease alleles segregating in heterozygote carriers.
To this end, we compiled genetic information for a set of 417 mutations reported to cause
fatal, recessive Mendelian diseases and estimated the frequencies of the disease-causing alleles
from large exome datasets. We then compared these data to the expected frequencies of delete-
rious alleles based on models of mutation-selection balance in order to evaluate the effects of
mutation rates and other factors in influencing these frequencies.
Results
Mendelian recessive disease allele set
We relied on two datasets, one that describes 173 autosomal recessive diseases [19] and another
from a genetic testing laboratory (Counsyl [20];<https://www.counsyl.com/>) that includes 110
recessive diseases of clinical interest. From these lists, we obtained a set of 44 “recessive lethal” dis-
eases associated with 45 genes (S1 Table), requiring that at least one of the following conditions is
met: (i) in the absence of treatment, the affected individuals die of the disease before reproductive
age, (ii) reproduction is completely impaired in patients of both sexes, (iii) the phenotype includes
severe mental retardation that in practice precludes reproduction, or (iv) the phenotype includes
severely compromised physical development, again precluding reproduction.
Based on clinical genetics datasets and the medical literature (see Methods for details), we
were able to confirm that 417 Single Nucleotide Variants (SNVs) in 32 (of the 44) genes had
been reported with compelling evidence of association to the severe form of the corresponding
disease and an early-onset, as well as no indication of effects in heterozygote carriers (S2 Table).
By this approach, we obtained a set of mutations for which, at least in principle, there is no het-
erozygote effect, i.e., for which the dominance coefficient h = 0 in a model with relative fitness
of 1 for the homozygote for the reference allele, 1-hs for the heterozygote, and 1-s for the homo-
zygote for the deleterious allele, and the selective coefficient s is 1.
A large subset of these mutations (29.3%) consists of transitions at CpG sites (henceforth
CpGti), which occur at a highly elevated rates (~17-fold higher on average) compared to other
mutation types, namely CpG transversions, and non-CpG transitions and transversions [18].
This proportion is in agreement with previous estimates for a smaller set of disease genes [21]
and for DMD [22].
Empirical distribution of allele frequencies of disease mutations in Europe
Allele frequency data for the 417 variants were obtained from the Exome Aggregation Consor-
tium (ExAC) for 60,706 individuals, of whom 33,370 are non-Finnish Europeans [23]. Out of
The population genetics of recessive, lethal mutations
PLOS Genetics | https://doi.org/10.1371/journal.pgen.1006915 September 28, 2017 3 / 23
the 417 variants associated with putative recessive lethal diseases, three were found homozy-
gous in at least one individual in this dataset (rs35269064, p.Arg108Leu in ASS1; rs28933375,
p.Asn252Ser in PRF1; and rs113857788, p.Gln1352His in CFTR). Available data quality infor-
mation for these variants does not suggest genotype calling artifacts (S2 Table). Since these
diseases have severe symptoms that lead to early death without treatment and these ExAC indi-
viduals are healthy (i.e., do not manifest severe Mendelian diseases) [23], the reported muta-
tions are likely errors in pathogenicity classification or cases of incomplete penetrance (see a
similar observation for CFTR and DHCR7 in [24]). We therefore excluded them from our anal-
yses. In addition to the mutations present in homozygotes, we also filtered out sites that had
lower coverage in ExAC (see Methods), resulting in a final dataset of 385 variants in 32 genes
(S2 Table).
Genotypes for a subset (91) of these mutations were also available for a larger sample size
(76,314 individuals with self-reported European ancestry) generated by the company Counsyl
(S3 Table). A comparison of the allele frequencies in this larger dataset to that of ExAC sug-
gests that the allele frequencies for individual variants are concordant between the two datasets
(Pearson’s correlation coefficient of 0.79, S1 Fig) and that the overall distributions do not differ
appreciably (Kolmogorov–Smirnov test, p-value = 0.23). Thus, both data sets appear to reflect
the general distribution of these disease alleles in Europeans. In what follows, we focused on
ExAC, which includes a greater number of disease mutations.
Models of mutation-selection balance
To generate expectations for the frequencies of these disease mutations under mutation-selec-
tion balance, we considered models of infinite and finite populations of constant size [3] and
conducted forward simulations using a plausible demographic model for African and Euro-
pean populations [25] (see Methods for details). In all these models, there is a wild-type allele
(A) and a deleterious allele (a, which could also represent a class of distinct deleterious alleles
with the same fitness effect) at each site, such that the relative fitness of individuals of geno-
types AA, Aa, or aa is given respectively by:
• wAA = 1;
• wAa = 1-hs;
• waa = 1-s;
The mutation rate from A to a is u; we assume that there are no back mutations.
For a constant population of infinite size, Wright [26] showed that under these conditions,
there exists a stable equilibrium between mutation and selection, when the selection pressure
is sufficiently strong (s>>u). In particular, when the deleterious effect of allele a is completely
recessive (h = 0), its equilibrium frequency q is given by:
q ¼ffiffiffiffiffiffiffiu=s
p: ð1Þ
For a finite population of constant size, Nei [3] derived the mean (Eq 2) and variance (Eq 3)
of the frequency of a fully recessive deleterious mutation (h = 0) based on a diffusion model,
leading to:
�q ¼Gð2Nu þ 1=2Þffiffiffiffiffiffiffiffi2Nsp
Gð2NuÞ; ð2Þ
s2
q ¼ u=s � �q2; ð3Þ
The population genetics of recessive, lethal mutations
PLOS Genetics | https://doi.org/10.1371/journal.pgen.1006915 September 28, 2017 4 / 23
where N is the diploid population size and Γ is the gamma function (see Simons et al. [1] for a
similar approximation).
In a finite population, the mean frequency, �q, therefore depends on assumptions about the
population mutation rate (2Nu). If the population mutation rate is high, such that 2Nu>>1, �qis approximated by
�q �ffiffiffiffiffiffiffiu=s
p; ð4Þ
which is independent of the population size and equal to the equilibrium frequency in an infi-
nite population, i.e., the right hand side of Eq (1). The important difference between the two
models above is that in a finite population, there is a distribution of frequencies q (because of
genetic drift), whose variance is given in Eq (3), rather than a single value, as in an infinite
population.
In contrast, when the finite population has a low population mutation rate (2Nu<<1), the
mean allele frequency, �q, is approximated by:
�q � uffiffiffiffiffiffiffiffiffiffiffiffiffi2pN=s
p; ð5Þ
which depends on the population size [3].
We note that Nei [3] assumed a Wright-Fisher model, in which there is no distinction
between census and the effective population sizes. However, when the two differ, it is the effec-
tive population size that governs the dynamics of deleterious alleles, so the N in the analytical
results in fact represents the effective population size. In humans, the mutation rate at each bp
is very small (on the order of 10−8 [18]) and the effective population size not that large, even
recently [27,28], so the second approximation should apply when considering each single site
independently.
The expectation and variance of the frequency of a fatal, fully recessive allele (i.e., s = 1,
h = 0) are then given by:
�q ¼ uffiffiffiffiffiffiffiffiffi2pNp
; ð6Þ
and
s2
q ¼ u � �q2 ¼ uð1 � 2pNuÞ � u: ð7Þ
This single site model implicitly ignores the existence of compound heterozygosity in model-
ing the strength of selection acting on an individual site.
Comparing mutation-selection balance models
Although an infinite population size has often been assumed when modeling deleterious allele
frequencies (e.g. [5,29–32]), predictions under this assumption can differ markedly from what
is expected from models of finite population sizes, assuming plausible parameter values for
humans. For example, the long-term estimate of the effective population size from total poly-
morphism levels is ~20,000 individuals (assuming a mutation rate of 1.2 x 10⁻⁸ per bp per gen-
eration [18] and diversity levels of 0.1% [33]). In this case and considering a mutation rate of
1.5 x 10⁻⁸ for exons (which have a higher mutation rate than the rest of the genome, because of
their base composition [34]), the average deleterious allele frequency in the model of finite
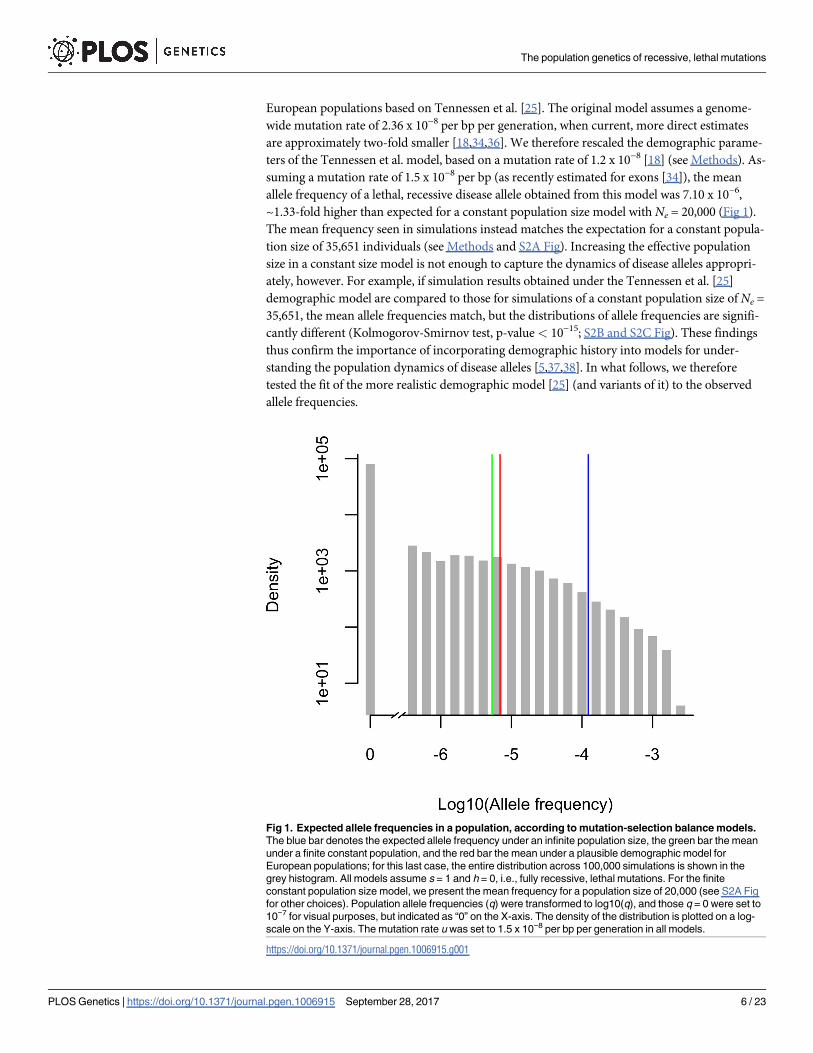
population size is ~23-fold lower than that in the infinite population model (Fig 1).
Because the human population size has not been constant and changes in the population
size can affect the frequencies of deleterious alleles in the population (e.g. [2,35]), we also simu-
lated the population dynamics of disease alleles under a plausible demographic model for
The population genetics of recessive, lethal mutations
PLOS Genetics | https://doi.org/10.1371/journal.pgen.1006915 September 28, 2017 5 / 23
European populations based on Tennessen et al. [25]. The original model assumes a genome-
wide mutation rate of 2.36 x 10⁻⁸ per bp per generation, when current, more direct estimates
are approximately two-fold smaller [18,34,36]. We therefore rescaled the demographic parame-
ters of the Tennessen et al. model, based on a mutation rate of 1.2 x 10⁻⁸ [18] (see Methods). As-
suming a mutation rate of 1.5 x 10⁻⁸ per bp (as recently estimated for exons [34]), the mean
allele frequency of a lethal, recessive disease allele obtained from this model was 7.10 x 10⁻⁶,
~1.33-fold higher than expected for a constant population size model with Ne = 20,000 (Fig 1).
The mean frequency seen in simulations instead matches the expectation for a constant popula-
tion size of 35,651 individuals (see Methods and S2A Fig). Increasing the effective population
size in a constant size model is not enough to capture the dynamics of disease alleles appropri-
ately, however. For example, if simulation results obtained under the Tennessen et al. [25]
demographic model are compared to those for simulations of a constant population size of Ne =
35,651, the mean allele frequencies match, but the distributions of allele frequencies are signifi-
cantly different (Kolmogorov-Smirnov test, p-value< 10−15; S2B and S2C Fig). These findings
thus confirm the importance of incorporating demographic history into models for under-
standing the population dynamics of disease alleles [5,37,38]. In what follows, we therefore
tested the fit of the more realistic demographic model [25] (and variants of it) to the observed
allele frequencies.
Fig 1. Expected allele frequencies in a population, according to mutation-selection balance models.
The blue bar denotes the expected allele frequency under an infinite population size, the green bar the mean
under a finite constant population, and the red bar the mean under a plausible demographic model for
European populations; for this last case, the entire distribution across 100,000 simulations is shown in the
grey histogram. All models assume s = 1 and h = 0, i.e., fully recessive, lethal mutations. For the finite
constant population size model, we present the mean frequency for a population size of 20,000 (see S2A Fig
for other choices). Population allele frequencies (q) were transformed to log10(q), and those q = 0 were set to
10−7 for visual purposes, but indicated as “0” on the X-axis. The density of the distribution is plotted on a log-
scale on the Y-axis. The mutation rate u was set to 1.5 x 10⁻⁸ per bp per generation in all models.
https://doi.org/10.1371/journal.pgen.1006915.g001
The population genetics of recessive, lethal mutations
PLOS Genetics | https://doi.org/10.1371/journal.pgen.1006915 September 28, 2017 6 / 23
Comparing empirical and expected distributions of disease allele
frequencies
The mutation rate from wild-type allele to disease allele, u, is a critical parameter in predicting
the frequencies of a deleterious allele [4,39]. To model disease alleles, we considered four muta-
tion types separately, with the goal of capturing most of the fine-scale heterogeneity in muta-
tion rates [27,36,40,41]: transitions in methylated CpG sites (CpGti) and three less mutable
types, namely transversions in CpG sites (CpGtv) and transitions and transversions outside a
CpG site (nonCpGti and nonCpGtv, respectively). In order to control for the methylation sta-
tus of CpG sites, we excluded 12 CpGti that occurred in CpG islands, which tend not to be
methylated and thus are likely to have a lower mutation rate [36] (following Moorjani et al.
[42]). To allow for heterogeneity in mutation rates within each one of these four classes consid-
ered, we modeled the within-class variation in mutation rates according to a lognormal distri-
bution (see details in Methods and [27]).
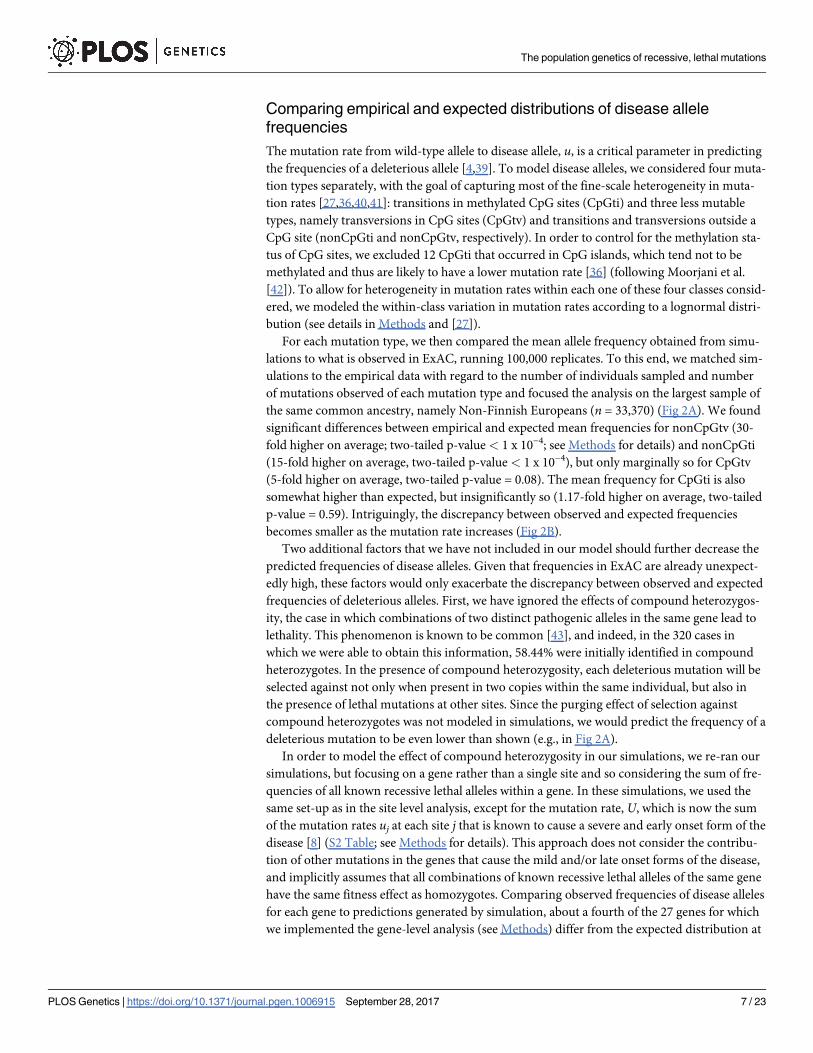
For each mutation type, we then compared the mean allele frequency obtained from simu-
lations to what is observed in ExAC, running 100,000 replicates. To this end, we matched sim-
ulations to the empirical data with regard to the number of individuals sampled and number
of mutations observed of each mutation type and focused the analysis on the largest sample of
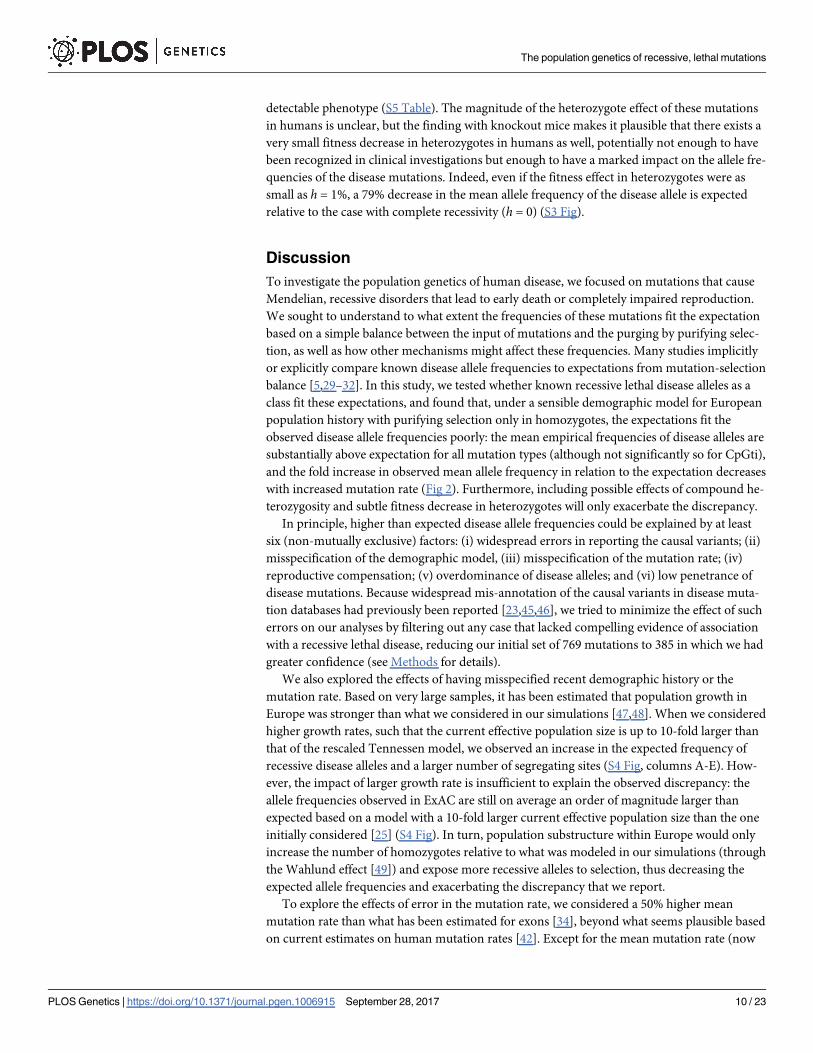
the same common ancestry, namely Non-Finnish Europeans (n = 33,370) (Fig 2A). We found
significant differences between empirical and expected mean frequencies for nonCpGtv (30-
fold higher on average; two-tailed p-value < 1 x 10⁻⁴; see Methods for details) and nonCpGti
(15-fold higher on average, two-tailed p-value < 1 x 10⁻⁴), but only marginally so for CpGtv
(5-fold higher on average, two-tailed p-value = 0.08). The mean frequency for CpGti is also
somewhat higher than expected, but insignificantly so (1.17-fold higher on average, two-tailed
p-value = 0.59). Intriguingly, the discrepancy between observed and expected frequencies
becomes smaller as the mutation rate increases (Fig 2B).
Two additional factors that we have not included in our model should further decrease the
predicted frequencies of disease alleles. Given that frequencies in ExAC are already unexpect-
edly high, these factors would only exacerbate the discrepancy between observed and expected
frequencies of deleterious alleles. First, we have ignored the effects of compound heterozygos-
ity, the case in which combinations of two distinct pathogenic alleles in the same gene lead to
lethality. This phenomenon is known to be common [43], and indeed, in the 320 cases in
which we were able to obtain this information, 58.44% were initially identified in compound
heterozygotes. In the presence of compound heterozygosity, each deleterious mutation will be
selected against not only when present in two copies within the same individual, but also in
the presence of lethal mutations at other sites. Since the purging effect of selection against
compound heterozygotes was not modeled in simulations, we would predict the frequency of a
deleterious mutation to be even lower than shown (e.g., in Fig 2A).
In order to model the effect of compound heterozygosity in our simulations, we re-ran our
simulations, but focusing on a gene rather than a single site and so considering the sum of fre-
quencies of all known recessive lethal alleles within a gene. In these simulations, we used the
same set-up as in the site level analysis, except for the mutation rate, U, which is now the sum
of the mutation rates uj at each site j that is known to cause a severe and early onset form of the
disease [8] (S2 Table; see Methods for details). This approach does not consider the contribu-
tion of other mutations in the genes that cause the mild and/or late onset forms of the disease,
and implicitly assumes that all combinations of known recessive lethal alleles of the same gene
have the same fitness effect as homozygotes. Comparing observed frequencies of disease alleles
for each gene to predictions generated by simulation, about a fourth of the 27 genes for which
we implemented the gene-level analysis (see Methods) differ from the expected distribution at
The population genetics of recessive, lethal mutations
PLOS Genetics | https://doi.org/10.1371/journal.pgen.1006915 September 28, 2017 7 / 23
The population genetics of recessive, lethal mutations
PLOS Genetics | https://doi.org/10.1371/journal.pgen.1006915 September 28, 2017 8 / 23
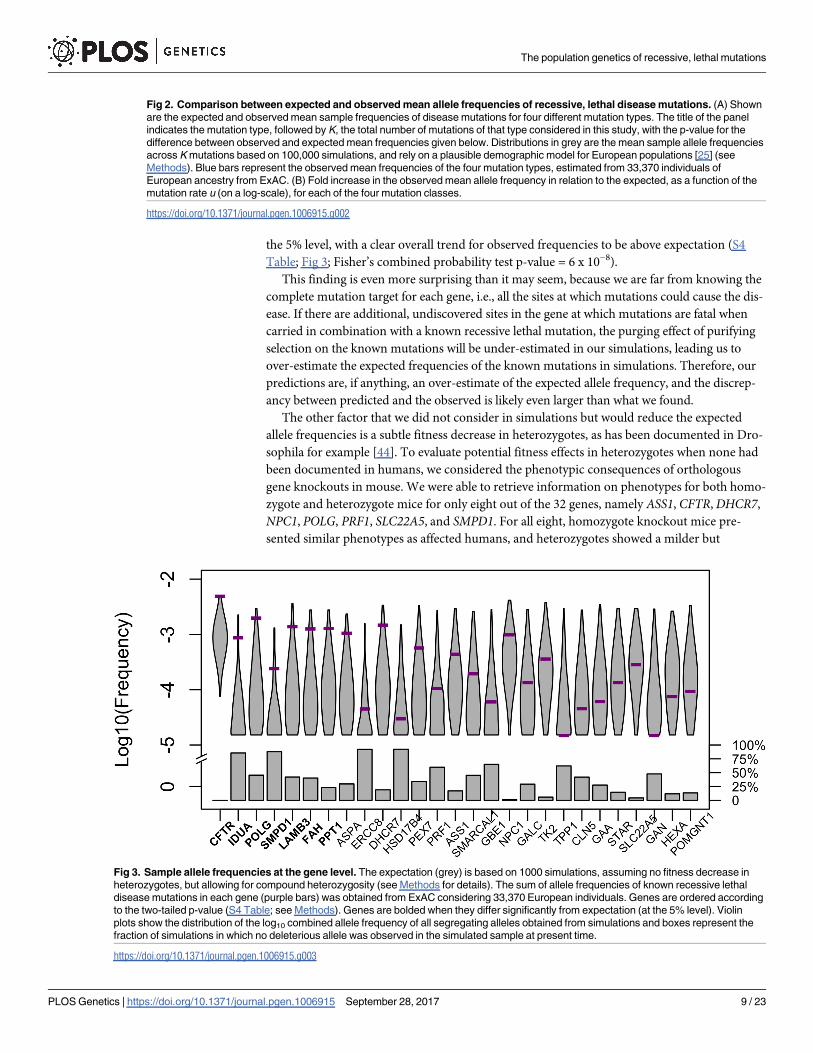
the 5% level, with a clear overall trend for observed frequencies to be above expectation (S4
Table; Fig 3; Fisher’s combined probability test p-value = 6 x 10⁻⁸).
This finding is even more surprising than it may seem, because we are far from knowing the
complete mutation target for each gene, i.e., all the sites at which mutations could cause the dis-
ease. If there are additional, undiscovered sites in the gene at which mutations are fatal when
carried in combination with a known recessive lethal mutation, the purging effect of purifying
selection on the known mutations will be under-estimated in our simulations, leading us to
over-estimate the expected frequencies of the known mutations in simulations. Therefore, our
predictions are, if anything, an over-estimate of the expected allele frequency, and the discrep-
ancy between predicted and the observed is likely even larger than what we found.
The other factor that we did not consider in simulations but would reduce the expected
allele frequencies is a subtle fitness decrease in heterozygotes, as has been documented in Dro-
sophila for example [44]. To evaluate potential fitness effects in heterozygotes when none had
been documented in humans, we considered the phenotypic consequences of orthologous
gene knockouts in mouse. We were able to retrieve information on phenotypes for both homo-
zygote and heterozygote mice for only eight out of the 32 genes, namely ASS1, CFTR, DHCR7,
NPC1, POLG, PRF1, SLC22A5, and SMPD1. For all eight, homozygote knockout mice pre-
sented similar phenotypes as affected humans, and heterozygotes showed a milder but
Fig 2. Comparison between expected and observed mean allele frequencies of recessive, lethal disease mutations. (A) Shown
are the expected and observed mean sample frequencies of disease mutations for four different mutation types. The title of the panel
indicates the mutation type, followed by K, the total number of mutations of that type considered in this study, with the p-value for the
difference between observed and expected mean frequencies given below. Distributions in grey are the mean sample allele frequencies
across K mutations based on 100,000 simulations, and rely on a plausible demographic model for European populations [25] (see
Methods). Blue bars represent the observed mean frequencies of the four mutation types, estimated from 33,370 individuals of
European ancestry from ExAC. (B) Fold increase in the observed mean allele frequency in relation to the expected, as a function of the
mutation rate u (on a log-scale), for each of the four mutation classes.
https://doi.org/10.1371/journal.pgen.1006915.g002
Fig 3. Sample allele frequencies at the gene level. The expectation (grey) is based on 1000 simulations, assuming no fitness decrease in
heterozygotes, but allowing for compound heterozygosity (see Methods for details). The sum of allele frequencies of known recessive lethal
disease mutations in each gene (purple bars) was obtained from ExAC considering 33,370 European individuals. Genes are ordered according
to the two-tailed p-value (S4 Table; see Methods). Genes are bolded when they differ significantly from expectation (at the 5% level). Violin
plots show the distribution of the log10 combined allele frequency of all segregating alleles obtained from simulations and boxes represent the
fraction of simulations in which no deleterious allele was observed in the simulated sample at present time.
https://doi.org/10.1371/journal.pgen.1006915.g003
The population genetics of recessive, lethal mutations
PLOS Genetics | https://doi.org/10.1371/journal.pgen.1006915 September 28, 2017 9 / 23
detectable phenotype (S5 Table). The magnitude of the heterozygote effect of these mutations
in humans is unclear, but the finding with knockout mice makes it plausible that there exists a
very small fitness decrease in heterozygotes in humans as well, potentially not enough to have
been recognized in clinical investigations but enough to have a marked impact on the allele fre-
quencies of the disease mutations. Indeed, even if the fitness effect in heterozygotes were as
small as h = 1%, a 79% decrease in the mean allele frequency of the disease allele is expected
relative to the case with complete recessivity (h = 0) (S3 Fig).
Discussion
To investigate the population genetics of human disease, we focused on mutations that cause
Mendelian, recessive disorders that lead to early death or completely impaired reproduction.
We sought to understand to what extent the frequencies of these mutations fit the expectation
based on a simple balance between the input of mutations and the purging by purifying selec-
tion, as well as how other mechanisms might affect these frequencies. Many studies implicitly
or explicitly compare known disease allele frequencies to expectations from mutation-selection
balance [5,29–32]. In this study, we tested whether known recessive lethal disease alleles as a
class fit these expectations, and found that, under a sensible demographic model for European
population history with purifying selection only in homozygotes, the expectations fit the
observed disease allele frequencies poorly: the mean empirical frequencies of disease alleles are
substantially above expectation for all mutation types (although not significantly so for CpGti),
and the fold increase in observed mean allele frequency in relation to the expectation decreases
with increased mutation rate (Fig 2). Furthermore, including possible effects of compound he-
terozygosity and subtle fitness decrease in heterozygotes will only exacerbate the discrepancy.
In principle, higher than expected disease allele frequencies could be explained by at least
six (non-mutually exclusive) factors: (i) widespread errors in reporting the causal variants; (ii)
misspecification of the demographic model, (iii) misspecification of the mutation rate; (iv)
reproductive compensation; (v) overdominance of disease alleles; and (vi) low penetrance of
disease mutations. Because widespread mis-annotation of the causal variants in disease muta-
tion databases had previously been reported [23,45,46], we tried to minimize the effect of such
errors on our analyses by filtering out any case that lacked compelling evidence of association
with a recessive lethal disease, reducing our initial set of 769 mutations to 385 in which we had
greater confidence (see Methods for details).
We also explored the effects of having misspecified recent demographic history or the
mutation rate. Based on very large samples, it has been estimated that population growth in
Europe was stronger than what we considered in our simulations [47,48]. When we considered
higher growth rates, such that the current effective population size is up to 10-fold larger than
that of the rescaled Tennessen model, we observed an increase in the expected frequency of
recessive disease alleles and a larger number of segregating sites (S4 Fig, columns A-E). How-
ever, the impact of larger growth rate is insufficient to explain the observed discrepancy: the
allele frequencies observed in ExAC are still on average an order of magnitude larger than
expected based on a model with a 10-fold larger current effective population size than the one
initially considered [25] (S4 Fig). In turn, population substructure within Europe would only
increase the number of homozygotes relative to what was modeled in our simulations (through
the Wahlund effect [49]) and expose more recessive alleles to selection, thus decreasing the
expected allele frequencies and exacerbating the discrepancy that we report.
To explore the effects of error in the mutation rate, we considered a 50% higher mean
mutation rate than what has been estimated for exons [34], beyond what seems plausible based
on current estimates on human mutation rates [42]. Except for the mean mutation rate (now
The population genetics of recessive, lethal mutations
PLOS Genetics | https://doi.org/10.1371/journal.pgen.1006915 September 28, 2017 10 / 23
set to 2.25 x 10⁻⁸), all other parameters used for these simulations (i.e. the variance in mutation
rate across simulations, the demographic model [25], absence of selective effect in heterozy-
gotes, and selection coefficient) were kept the same as the ones used for generating S4 Fig, col-
umn A. The observed mean frequency remains significantly above what those predicted and
qualitative conclusions are unchanged (S4 Fig, column F).
Another factor to consider is that for disease phenotypes that are lethal very early on in life,
there may be partial or complete reproductive compensation (e.g. [50]). This phenomenon
would decrease the fitness effects of the recessive lethal mutations and could therefore lead to
an increase in the allele frequency in data relative to what we predict for a selection coefficient
of 1. There are no reasons, however, for this phenomenon to correlate with the mutation rate,
as seen in Fig 2B.
The other two factors, overdominance and low penetrance, are likely explanations for a sub-
set of cases. For instance, CFTR, the gene in which some mutations lead to cystic fibrosis, is the
farthest above expectation (p-value < 0.004; Fig 3). It was long noted that there is an unusually
high frequency of the CFTR deletion ΔF508 in Europeans, which led to speculation that disease
alleles of this gene may be subject to over-dominance ([51,52], but see [53]). Regardless, it is
known that disease mutations in this gene can complement one another [10,11] and that modi-
fier loci in other genes also influence their penetrance [11,14]. Consistent with variable pene-
trance, Chen et al. [24] identified three purportedly healthy individuals carrying two copies of
disease mutations in this gene. Similarly, DHCR7, the gene associated with the Smith-Lemli-
Opitz syndrome, is somewhat above expectation in our analysis (p-value = 0.056; Fig 3) and
healthy individuals were found to be homozygous carriers of putatively lethal disease alleles in
other studies [24]. These observations make it plausible that, in a subset of cases (particularly
for CFTR), the high frequency of deleterious mutations associated with recessive, lethal diseases
are due to genetic interactions that modify the penetrance of certain recessive disease mutations.
It is hard to assess the importance of this phenomenon in driving the general pattern that we
observe, but two factors argue against it being a sufficient explanation for our findings at the
level of single sites. First, when we removed 130 mutations in CFTR and 12 in DHCR7, the two
genes that were outliers at the gene level (Fig 3; S4 Table) and for which there is evidence of
incomplete penetrance [24], the discrepancy between observed and expected allele frequencies
is barely impacted (S5 Fig). Moreover, there is no obvious reason why the degree of incomplete
penetrance would vary systematically with the mutation rate of a site, as observed (Fig 2B).
Instead, it seems plausible that there is an ascertainment bias in disease allele discovery and
mutation identification [52,54,55]. Unlike missense or protein-truncating variants, Mendelian
disease mutations cannot be annotated based solely on DNA sequences, and their identifica-
tion requires reliable diagnosis of affected individuals (usually in more than one pedigree) fol-
lowed by mapping of the underlying gene/mutation. Therefore, those mutations that have
been identified to date are likely the ones that are segregating at higher frequencies in the pop-
ulation. Moreover, mutation-selection balance models predict that the frequency of a deleteri-
ous mutation should correlate with the mutation rate. Together, these considerations suggest
that disease variants of a highly mutable class, such as CpGti, are more likely to have been
mapped and that the mean frequency of mapped mutations will tend to be only slightly above
all disease mutations in that class. In contrast, less mutable disease mutations are less likely to
have been discovered to date, and the mean frequency of the subset of mutations that have
been identified may tend to be far above that of all mutations in that class.
To quantify these effects, we modeled the ascertainment of disease mutations both analyti-
cally and in simulations. A large proportion of recessive Mendelian disease mutations were
identified in inbred populations, likely because inbreeding leads to an excess of homozygotes
compared to expected under random mating, increasing the probability that a recessive
The population genetics of recessive, lethal mutations
PLOS Genetics | https://doi.org/10.1371/journal.pgen.1006915 September 28, 2017 11 / 23
mutation would be discovered as causing a disease. Therefore, we modeled ascertainment in
disease discovery in human populations with a plausible degree of inbreeding (see Methods).
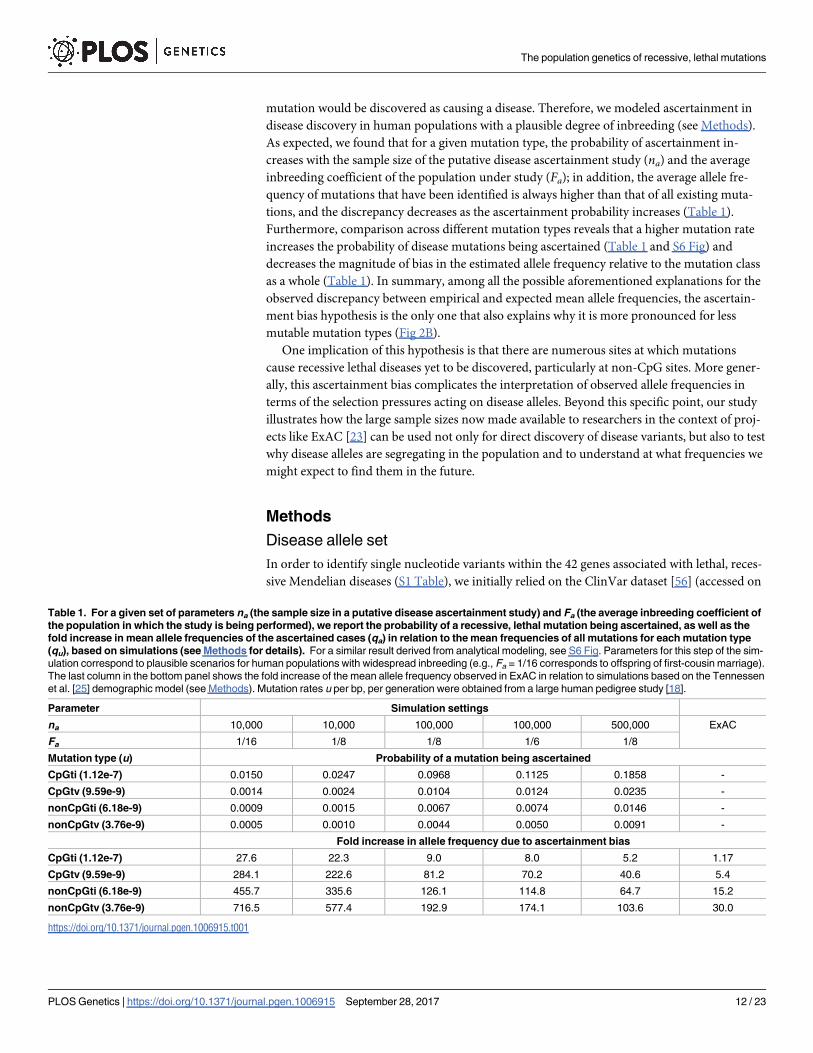
As expected, we found that for a given mutation type, the probability of ascertainment in-
creases with the sample size of the putative disease ascertainment study (na) and the average
inbreeding coefficient of the population under study (Fa); in addition, the average allele fre-
quency of mutations that have been identified is always higher than that of all existing muta-
tions, and the discrepancy decreases as the ascertainment probability increases (Table 1).
Furthermore, comparison across different mutation types reveals that a higher mutation rate
increases the probability of disease mutations being ascertained (Table 1 and S6 Fig) and
decreases the magnitude of bias in the estimated allele frequency relative to the mutation class
as a whole (Table 1). In summary, among all the possible aforementioned explanations for the
observed discrepancy between empirical and expected mean allele frequencies, the ascertain-
ment bias hypothesis is the only one that also explains why it is more pronounced for less
mutable mutation types (Fig 2B).
One implication of this hypothesis is that there are numerous sites at which mutations
cause recessive lethal diseases yet to be discovered, particularly at non-CpG sites. More gener-
ally, this ascertainment bias complicates the interpretation of observed allele frequencies in
terms of the selection pressures acting on disease alleles. Beyond this specific point, our study
illustrates how the large sample sizes now made available to researchers in the context of proj-
ects like ExAC [23] can be used not only for direct discovery of disease variants, but also to test
why disease alleles are segregating in the population and to understand at what frequencies we
might expect to find them in the future.
Methods
Disease allele set
In order to identify single nucleotide variants within the 42 genes associated with lethal, reces-
sive Mendelian diseases (S1 Table), we initially relied on the ClinVar dataset [56] (accessed on
Table 1. For a given set of parameters na (the sample size in a putative disease ascertainment study) and Fa (the average inbreeding coefficient of
the population in which the study is being performed), we report the probability of a recessive, lethal mutation being ascertained, as well as the
fold increase in mean allele frequencies of the ascertained cases (qa) in relation to the mean frequencies of all mutations for each mutation type
(qu), based on simulations (see Methods for details). For a similar result derived from analytical modeling, see S6 Fig. Parameters for this step of the sim-
ulation correspond to plausible scenarios for human populations with widespread inbreeding (e.g., Fa = 1/16 corresponds to offspring of first-cousin marriage).
The last column in the bottom panel shows the fold increase of the mean allele frequency observed in ExAC in relation to simulations based on the Tennessen
et al. [25] demographic model (see Methods). Mutation rates u per bp, per generation were obtained from a large human pedigree study [18].
Parameter Simulation settings
na 10,000 10,000 100,000 100,000 500,000 ExAC
Fa 1/16 1/8 1/8 1/6 1/8
Mutation type (u) Probability of a mutation being ascertained
CpGti (1.12e-7) 0.0150 0.0247 0.0968 0.1125 0.1858 -
CpGtv (9.59e-9) 0.0014 0.0024 0.0104 0.0124 0.0235 -
nonCpGti (6.18e-9) 0.0009 0.0015 0.0067 0.0074 0.0146 -
nonCpGtv (3.76e-9) 0.0005 0.0010 0.0044 0.0050 0.0091 -
Fold increase in allele frequency due to ascertainment bias
CpGti (1.12e-7) 27.6 22.3 9.0 8.0 5.2 1.17
CpGtv (9.59e-9) 284.1 222.6 81.2 70.2 40.6 5.4
nonCpGti (6.18e-9) 455.7 335.6 126.1 114.8 64.7 15.2
nonCpGtv (3.76e-9) 716.5 577.4 192.9 174.1 103.6 30.0
https://doi.org/10.1371/journal.pgen.1006915.t001
The population genetics of recessive, lethal mutations
PLOS Genetics | https://doi.org/10.1371/journal.pgen.1006915 September 28, 2017 12 / 23
June 3rd, 2015). We filtered out any variant that is an indel or a more complex copy number
variant or that is ever classified as benign or likely benign in ClinVar (whether or not it is also
classified as pathogenic or likely pathogenic). By this approach, we obtained 769 SNVs
described as pathogenic or likely pathogenic. For each one of these variants, we searched the
literature for evidence that it is exclusively associated to the lethal and early onset form of the
disease and was never reported as causing the mild and/or late-onset form of the disease. We
considered effects in the absence of medical treatment, as we were interested in the selection
pressures acting on the alleles over evolutionary time scales rather than in the last one or two
generations, i.e., the period over which treatment became available for some of diseases con-
sidered. To evaluate the impact of treatment, we decreased s from 1 to 0 (i.e., we assumed a
complete absence of selective effects due to treatment) in the last three generations and com-
pared the mean allele frequencies across 100,000 simulations implemented with or without
this readjustment in selection coefficient. Because of the stochastic nature of the simulations,
we repeated this pairwise comparison 10 times in order to get a range of expected increase in
allele frequencies. We observed only a minor increase in the mean allele frequency (2.6% at
most) across the 10 replicates. This simulation procedure corresponds to a scenario in which
there is an extremely effective treatment for all diseases for the past three generations, which is
an overestimate of the effect and length of treatment for the disease set considered.
Variants with mention of incomplete penetrance (i.e. for which homozygotes were not
always affected) or with known effects in heterozygote carriers were removed from the analy-
sis. This process yielded 417 SNVs in 32 genes associated with distinct Mendelian recessive
lethal disorders (S2 Table). Although these mutations were purportedly associated with
completely recessive diseases, we sought to examine whether there would be possible, unre-
ported effects in heterozygous carriers. To this end, we used the Mouse Genome Database
(MGD) [57] (accessed July 29th, 2015) and were able to retrieve information for both homozy-
gote and heterozygote mice for eight out of the 32 genes (all of which with a homologue in
mice) (S5 Table).
In addition to the information provided by ClinVar for each one of these variants, we con-
sidered the immediate sequence context of each SNV, to tailor the mutation rate estimate
accordingly [18]. To do so, we used an in-house Python script and the human genome refer-
ence sequence hg19 from UCSC (<http://hgdownload.soe.ucsc.edu/goldenPath/hg19/
chromosomes/>).
Genetic datasets
The Exome Aggregation Consortium (ExAC) [23] was accessed on August 9th, 2016. The data
consist of genotype frequencies for 60,706 individuals, assigned after Principal Component
Analysis to one of seven population labels: African (n = 5,203), East Asian (n = 4,327), Finnish
(n = 3,307), Latino (n = 5,789), Non-Finnish European (n = 33,370), South Asian (n = 8,256)
and “other” (n = 454) [23]. We focused our analyses on those individuals of Non-Finnish
European descent, because they constitute the largest sample size from a single ancestry group.
We note that, some diseases mutations, for instance, those in ASPA, HEXA and SMPD1, are
known to be especially prevalent in Ashkenazi Jewish populations, which could potentially
bias our results if Ashkenazi Jewish individuals constituted a great portion of the sample we
considered. However, this sample includes only ~2,000 (~6%) Ashkenazi individuals (Dr.
Daniel MacArthur, personal communication).
From the initial 417 mutations, we filtered out three that were homozygous in at least one
individual in ExAC and 29 that had lower coverage, i.e., fewer than 80% of the individuals
were sequenced to at least 15x. This approach left us with a set of 385 mutations with a
The population genetics of recessive, lethal mutations
PLOS Genetics | https://doi.org/10.1371/journal.pgen.1006915 September 28, 2017 13 / 23
minimum coverage of 27x per sample and an average coverage of 69x per sample (S2 Table).
For 248 sites with non-zero sample frequencies, ExAC reported the number of non-Finnish
European individuals that were sequenced, which was on average 32,881 individuals [23]. For
the remaining 137 sites, we did not have this information. Nonetheless, the coverage across all
samples is reported and does not differ significantly between the two sets of sites (by a Kolmo-
gorov-Smirnov test, p-value = 0.90; S7 Fig). We therefore assumed that mean number of indi-
viduals covered for all sites was 32,881 and used this number to obtain sample frequencies
from simulations, as explained below.
A second genetic dataset was obtained from Counsyl (<https://www.counsyl.com/>).
Counsyl is a commercial genetic screening laboratory that offers, among other products, the
“Family Prep Screen”, a genetic screening test intended to detect carrier status for up to 110
recessive Mendelian diseases in couples that are planning to have a child [20]. A subset of
294,000 of its customers was surveyed by genotyping or sequencing for “routine carrier screen-
ing”. This subset excludes individuals with indications for testing because of known personal
or family history of Mendelian diseases, infertility, and consanguinity. It therefore represents a
more random (with regard to the presence of disease alleles), population-based survey. For
these individuals, we had details on self-reported ancestry (14 distinct ethnic/ancestry/geo-
graphic groups) and the allele frequencies for 98 mutations that match those that passed our
variant selection criteria described above, of which 91 are also sequenced to high coverage in
the ExAC database (S2 Table). We focused our analysis of this dataset on the 76,314 individu-
als of self-reported Northern or Southern European ancestry.
Simulating the evolution of disease alleles with population size change
We modeled the frequency of a deleterious allele in human populations by forward simula-
tions based on a crude but plausible demographic model for human populations from Africa
and Europe, inferred from exome data for African-Americans and European-Americans [25].
To this end, we used a program described in [1]. In brief, the demographic scenario consists of
an Out-of-Africa demographic model, with changes in population size throughout the popula-
tion history, including a severe bottleneck in Europeans following the split from the African
population and a rapid, recent population growth in both populations [25]. As in Simons et al.
[1], we simulated genetic drift and two-way gene flow between Africans and Europeans in
recent history.
The original demographic model was inferred using a mutation rate u of 2.36 x 10⁻⁸ per bp
per generation [25,58]. More recent estimates, based on direct resequencing of human pedi-
grees, instead point to mutation rates about 50% smaller than that [18,34,36]. To incorporate
what is believed to be a more accurate mutation rate estimate, we rescaled all demographic and
time parameters in the original Tennessen et al. [25] model by a factor of 1.97, based on the
difference between the mutation rate considered in the original study and that of Kong et al.
[18] (which is similar to that found in other studies [48]). We refer to this model as the rescaled
Tennessen model and rely on it throughout.
Negative selection acting on a single bi-allelic site was modeled as in the analytic models.
Allele frequencies follow a Wright-Fisher sampling scheme in each generation according to
these viabilities, with migration rate and population sizes varying according to the demo-
graphic scenario considered. Whenever a demographic event (e.g., growth) altered the number
of individuals and the resulting number was not an integer, we rounded it to the nearest inte-
ger, as in Simons et al. [1]. A burn-in period of 10Ne generations with constant population size
Ne = 14,328 individuals was implemented in order to ensure an equilibrium distribution of
segregating alleles at the onset of demographic changes in Africa, 11,643 generations ago.
The population genetics of recessive, lethal mutations
PLOS Genetics | https://doi.org/10.1371/journal.pgen.1006915 September 28, 2017 14 / 23
In contrast to Simons et al. [1], our simulations always start with the ancestral allele A fixed
and mutation occurs exclusively from this allele to the deleterious one (a), i.e., a mutation
occurs with mean probability u per gamete, per generation, and there is no back-mutation.
However, recurrent mutations at a site are allowed, as in Simons et al. [1].
When implementing the simulations, we considered a mean mutation rate u of 1.5x10⁻⁸ per
bp, per generation, as has been estimated for exons [34], as well as mutation rates for four dis-
tinct mutation types (CpGti = 1.12 x 10⁻⁷; CpGtv = 9.59 x 10⁻⁹; nonCpGti = 6.18 x 10⁻⁹; and
nonCpGtv = 3.76 x 10⁻⁹) estimated from a large human pedigree study [18]. While these four
categories capture much of the variation in germline mutation rates across sites, a number of
other factors (e.g., the larger sequence context or the replication timing) also influence muta-
tion rates, introducing heterogeneity in the mutation rate within each class considered
[27,36,40,59]. To allow for this heterogeneity as well as for uncertainty in the point mutation
rates estimates, in each simulation, when compared to human exome data (Figs 1, 2, S4 and
S5), instead of using a fixed rate u, we drew the mutation rate M from a lognormal distribution
with the following parameters:
log10Mju � Nðlog
10u �
s2
2lnð10Þ;s2Þ ð8Þ
such that that E[M] = u. σ was set to 0.57 (following [27]).
For each mutation type, we then proceeded as follows:
1. We ran two million simulations, thus obtaining the distribution of deleterious allele fre-
quencies expected for the European population.
2. We sampled K allele frequencies from the two million simulations implemented for each
mutation type, where K is the number of identified mutations of that type. Sample allele fre-
quencies were simulated from these population frequencies by Poisson sampling, so to
match ExAC’s number of chromosomes.
3. We repeated step (2) 100,000 times, thus obtaining a distribution for the mean allele fre-
quency across K mutations.
To assess the significance of the deviation between observed and expected mean, we
obtained a two-tailed p-value, defined as 2 x (r+1)/(100000+1), where r is the number of simu-
lated allele frequencies that were greater or equal to that of the empirical mean [60], for each
mutation type separately.
A well-known source of heterogeneity in mutation rate within the CpGti class is methyla-
tion status, with a high transition rate seen only at methylated CpGs [21]. In our analyses, we
tried to control for the methylation status of CpG sites by excluding sites located in CpG
islands (CGIs), which tend to not be methylated [42]. The CGI annotation for hg19 was
obtained from UCSC Genome Browser (track “Unmasked CpG”; <http://hgdownload.soe.
ucsc.edu/goldenPath/hg19/database/cpgIslandExtUnmasked.txt.gz>, accessed in June 6th,
2016). BEDTools [61] was used to exclude those CpG sites located in CGIs. We note that the
CpGti estimate from [18] includes CGIs, and in that sense the average mutation rate that we
are using for CpGti may be a very slight underestimate of the mean rate for transitions at
methylated CpG sites.
Unless otherwise noted, the expectation assumes fully recessive, lethal alleles with complete
penetrance. Notably, by calculating the expected frequency one site at a time, we are ignoring
possible interaction between genes (i.e., effects of the genetic background) and among differ-
ent mutations within a gene (i.e., compound heterozygotes). These assumptions are relaxed in
two ways. In one analysis (S3 Fig), we considered a very low selective effect in heterozygous
The population genetics of recessive, lethal mutations
PLOS Genetics | https://doi.org/10.1371/journal.pgen.1006915 September 28, 2017 15 / 23
individuals (h = 1%), reasoning that such an effect could plausibly go undetected in medical
examinations and yet would nonetheless impact the frequency of the disease allele. Second,
when considering the gene-level analysis (Fig 3), we implicitly allowed for compound hetero-
zygosity between any pair of known lethal mutations [8]. For this analysis, we ran 1000 simula-
tions for a total mutation rate U per gene that was calculated accounting for the heterogeneity
and uncertainty in the mutation rates estimates as follows: (i) For j sites in a gene known to
cause a recessive lethal disease and that passed our filtering criteria (S2 Table), we drew a
mutation rate uj from the lognormal distribution, as described above; (ii) We then took the
sum of uj as the total mutation rate U; (iii) We then ran one replicate with U as the mutation
parameter, and other parameters as specified for site level analysis. Because the mutational tar-
get size considered in simulations is only comprised of those sites at which mutations are
known to cause a lethal recessive disease, it is almost certainly an underestimate of the true
mutation rate—potentially by a lot. We note further that by this approach, we are assuming
that compound heterozygotes formed by any two lethal alleles have fitness zero, i.e., that they
are identical in their effects to homozygotes for any of the lethal alleles. Moreover, we are
implicitly ignoring the possibility of complementation, which is (somewhat) justified by our
focus on mutations with severe effects and complete penetrance (but see Discussion). Since we
were interested in understanding the effect of compound heterozygosity, for this analysis, we
did not consider the five genes in which only one mutation passed our filters (BCS1L, FKTN,
LAMA3, PLA3G6, and TCIRG1).
Modeling the effect of the ascertainment bias in disease discovery
To calculate the probability of ascertaining a recessive, lethal mutation, we assumed that all
currently known disease mutations were identified in a putative ascertainment study of sample
size na in a population with an inbreeding coefficient of Fa. Under this model, we can estimate
Pasc, the probability of ascertaining a disease mutation, as following:
For a disease allele (denoted as a) at frequency q in the present population, if we randomly
sample an individual with inbreeding coefficient of Fa, the probabilities of the three genotypes
are:
PðAAÞ ¼ Fað1 � qÞ þ ð1 � FaÞð1 � qÞ2; ð9Þ
PðAaÞ ¼ ð1 � FaÞ2qð1 � qÞ; ð10Þ
PðaaÞ ¼ Faqþ ð1 � FaÞq2: ð11Þ
Thus, if na unrelated individual are surveyed, the probability of not seeing any homozygote
for the disease allele (which is the same as the probability of not being ascertained in this set) is:
Pnasc ¼ ð1 � PðaaÞÞna : ð12Þ
Therefore, the probability of ascertainment is
Pasc ¼ 1 � Pnasc ¼ 1 � ð1 � PðaaÞÞna
¼ 1 � ½1 � Faq � ð1 � FaÞq2�na
¼ 1 � ½ð1 � qÞð1þ q � FaqÞ�na ;
ð13Þ
which is an increasing function with regard to q (the population allele frequency), Fa (the
inbreeding coefficient of the population under study) as well as na (the sample size of the puta-
tive ascertainment study) (S6 Fig).
The population genetics of recessive, lethal mutations
PLOS Genetics | https://doi.org/10.1371/journal.pgen.1006915 September 28, 2017 16 / 23
We also demonstrate the relationship between the probability of ascertainment and muta-
tion rate using simulations of ascertainment bias implemented according to the following steps:
1. For each of the four mutation types considered, we generated 106 allele frequencies q from
the results of the simulations based on a realistic demographic model [25].
2. We generated na independent diploid genotypes, given the allele frequencies from step 1
and an inbreeding coefficient Fa. We ran this step for a range of na and Fa values (Table 1).
3. With a given combination of na and Fa values, we identified the cases (out of the 106 obser-
vations from step 1) where at least one homozygote individual was observed in step 2.
These cases correspond to disease mutations that were ascertained; the reasoning being that
given complete penetrance, a recessive disease mutation can only be identified if there is at
least one affected individual in the studied population. With this step, we calculated the
probability of ascertainment by taking the fraction of cases that satisfy the criteria above.
4. Finally, for each one of the 106 simulations from step 1, we generated a sample allele fre-
quency of the disease mutation, matching ExAC’s sample size (i.e., considering 2n = 65,762
chromosomes). We can then compare qu, the unbiased average allele frequency of all dis-
ease mutations, to qa, the mean frequency of the subset of cases ascertained in step 3, i.e.,
those cases for which at least one homozygote individual is observed.
These simulations were meant to illustrate the likely impact of ascertainment bias, rather
than to precisely describe the disease mutation identification process or to quantify the ex-
pected effect. Notably, we performed these simulations for single sites, so the criteria for ascer-
tainment in step 3 did not include the possibility of compound heterozygotes, despite the fact
that an estimated 58.4% of the disease mutations included in our study were initially identified
in compound heterozygotes. However, this simulation framework could readily be extended
in this direction and it would not change our qualitative conclusion.
Supporting information
S1 Table. List of lethal, recessive Mendelian diseases considered in this study.
(DOCX)
S2 Table. Information on 417 mutations associated with the severe form of lethal, recessive
Mendelian diseases.
(XLSX)
S3 Table. Information on 91 mutations associated with the severe form of lethal, recessive
Mendelian diseases in Counsyl and ExAC databases.
(XLSX)
S4 Table. P-values for each gene estimated by simulation, under a model of mutation-
selection balance with a plausible demographic history.
(DOCX)
S5 Table. Phenotypic effect of mouse knock-outs (see main text).
(DOCX)
S1 Fig. Comparison of the empirical allele frequencies of recessive, lethal disease muta-
tions in individuals of European ancestry from two large exome studies. Shown are the
allele frequencies for 91 variants associated with lethal, recessive diseases, as estimated from
33,370 individuals of non-Finnish, European ancestry in the Exome Aggregation Consortium
(ExAC) database [23] and 76,314 European-ancestry individuals from a genetic testing
The population genetics of recessive, lethal mutations
PLOS Genetics | https://doi.org/10.1371/journal.pgen.1006915 September 28, 2017 17 / 23
laboratory (Counsyl [20]) (see Methods). Points lie on the dashed blue line if the allele frequen-
cies in Counsyl and ExAC are the same.
(TIF)
S2 Fig. Comparisons of mutation-selection balance models with constant versus changing
population sizes. (A) Population mean allele frequency as a function of effective population
size, under a model of constant population size. The X-axis range corresponds to the range of
effective population size over time estimated in [25]. The red bar indicates the value of a con-
stant population size at which the mean allele frequency is the same as in simulations, for an
average mutation rate of 1.5 x10⁻⁸ per bp per generation [34]. (B-C) The allele frequency distri-
bution (in grey) is presented for 2 x 10⁶ simulations based on (B) the complex demographic
scenario inferred by Tennessen et al. [25] for the evolution of European populations based on
simulations (see Methods) and of (C) the finite, constant size population model, with N set to
35,651 individuals to match the mean allele frequency with (B). Both models assume complete
lethality (s = 1) and recessivity (h = 0).
(TIF)
S3 Fig. The impact on disease allele frequencies of a small fitness effect in heterozygotes
(h = 0.01). Shown in each case is the distribution of the deleterious allele frequencies in the
population, generated from 100,000 simulations. Means are represented by red vertical bars.
For visualization, an allele frequency of q = 0 is set to 0.5 x 10⁻⁶. When a small fitness effect in
heterozygotes is considered in the simulations, the mean allele frequency decreases by 79% rel-
ative to no effect. The two distributions differ significantly by a Kolmogorov-Smirnov test (p-
value < 10−15). The mutation rate u was set to 1.5 x 10⁻⁸ per bp per generation, reflective of the
mean mutation rate for exons [34].
(TIF)
S4 Fig. Effect of varying the end population size and the average mutation rate on the sam-
ple allele frequency of recessive, lethal mutations. Tennessen et al. [25] inferred the present
effective population size of Europeans to be 512,000 individuals based on a mutation rate of
2.36 x 10⁻⁸ per bp per generation. We rescaled the parameters of this model based on a lower
mutation rate estimate of 1.2 x 10⁻⁸ [18] and show the expected distribution of sample allele
frequencies of recessive, lethal mutations in column A. We further considered the effect of
larger population sizes at present (2-, 4-, and 10-fold increase, denoted by columns B, C and
D respectively), keeping other rescaled demographic parameters the same as in A. We also
included a model (E) where rapid growth begins immediately after the out-of-Africa bottle-
neck, representing a more extreme scenario of population growth in comparison to the two-
stage and more gradual scenario proposed by Tennessen et al. (2012). For A-E, we drew the
mutation rate M from a lognormal distribution with parameters set as in Eq 8, with u = 1.5 x
10−8 (as implemented for Fig 2; see Methods). Model F considers a larger u (2.25 x 10⁻⁸, i.e., a
1.5-fold increase from A-E), with all other parameters (e.g., variance in mutation rates across
simulations, the demographic model) the same as in column A. The observed sample allele fre-
quency distribution of 385 disease mutations in ExAC is shown in white. Violin plots show the
density distribution of the log10 allele frequencies for variants that were segregating in these
samples, whereas boxes indicate the proportion of sites for which the deleterious mutation was
not observed segregating in the sample. All distributions differ significantly from one another
(i.e., all p-values are < 10−15 by a Kolmogorov-Smirnov test).
(TIF)
S5 Fig. Expected distribution and the observed mean allele frequencies of recessive, lethal
disease mutations (excluding mutations in CFTR and DHCR7). As in Fig 2, the four panels
The population genetics of recessive, lethal mutations
PLOS Genetics | https://doi.org/10.1371/journal.pgen.1006915 September 28, 2017 18 / 23
correspond to four different mutation types. The title of the panel indicates the mutation type,
followed by K, the total number of mutations of that type, with p-values for the difference
between observed and expected mean frequencies below. Distributions in grey are for 100,000
observations of the expected mean sample allele frequencies across K mutations, and were
obtained from simulations based on a plausible demographic model for European populations
[25] (see Methods). Blue bars represent the observed values estimated from 33,370 individuals
of European ancestry from ExAC. As opposed to in Fig 2, here, we did not include mutations
present in two genes (CFTR and DHCR7) that were outliers in the gene-level analysis (Fig 3)
and were reported elsewhere to be carried by healthy homozygous individuals [24].
(TIF)
S6 Fig. The probability Pasc of a mutation being ascertained, given its population allele fre-
quency q, the sample size na of the putative ascertainment study and the inbreeding coeffi-
cient Fa in the population in which the ascertainment study was conducted. In each case,
we let only one parameter (q, na or Fa) vary, while fixing the others at q = 7.10 x 10⁻⁶ (corre-
sponding to the mean allele frequency from simulations), na = 10,000, and Fa = 1/16 (corre-
sponding to marriage between first cousins, a plausible scenario for a population with
widespread inbreeding).
(TIF)
S7 Fig. Depth of coverage for 385 mutations in ExAC known to cause lethal, Mendelian
diseases. Box plots show the mean (black bar) and the lower and upper quartiles for (A) the
248 sites with non-zero sample frequencies in ExAC, for which the number of sequenced non-
Finnish European individuals was reported (n = 32,881) and (B) the 137 sites for which we did
not have this information. Since distributions of depth of coverage are similar between the two
sets (by a Kolmogorov–Smirnov test, p-value = 0.90), we assumed that 32,881 individuals were
sequenced at all sites, and used this number to subsample simulations to match the sample size
of the ExAC data.
(TIF)
Acknowledgments
We thank Daniel MacArthur for his help with the ExAC data, Ellen Leffler for providing her
Python script (available at https://github.com/cegamorim/PopGenHumDisease), as well as
members of the Pickrell, Przeworski and Sella labs, Aravinda Chakravarti, Brian Charlesworth,
Damien Labuda and four anonymous reviewers for helpful discussions and comments on an
earlier version of the manuscript. All codes and data to generate the figures in R [62] and the
script used to get the sequence context of each mutation are available at https://github.com/
cegamorim/PopGenHumDisease. The code to run the simulations is available at https://
github.com/sellalab/ForwardSimulator. Allele frequencies and other information for the dis-
ease mutations employed in the analyses are in S2 and S3 Tables.
Author Contributions
Conceptualization: Carlos Eduardo G. Amorim, Ziyue Gao, Joseph Pickrell, Molly
Przeworski.
Data curation: Carlos Eduardo G. Amorim, Zachary Baker, Jose Francisco Diesel, Imran S.
Haque, Joseph Pickrell, Molly Przeworski.
Formal analysis: Carlos Eduardo G. Amorim, Ziyue Gao.
The population genetics of recessive, lethal mutations
PLOS Genetics | https://doi.org/10.1371/journal.pgen.1006915 September 28, 2017 19 / 23
Funding acquisition: Joseph Pickrell, Molly Przeworski.
Investigation: Carlos Eduardo G. Amorim, Ziyue Gao, Molly Przeworski.
Methodology: Ziyue Gao, Joseph Pickrell, Molly Przeworski.
Project administration: Joseph Pickrell, Molly Przeworski.
Resources: Imran S. Haque, Molly Przeworski.
Software: Yuval B. Simons.
Supervision: Joseph Pickrell, Molly Przeworski.
Validation: Carlos Eduardo G. Amorim, Ziyue Gao, Molly Przeworski.
Visualization: Carlos Eduardo G. Amorim.
Writing – original draft: Carlos Eduardo G. Amorim, Ziyue Gao, Molly Przeworski.
Writing – review & editing: Yuval B. Simons, Imran S. Haque, Joseph Pickrell.
References1. Simons YB, Turchin MC, Pritchard JK, Sella G (2014) The deleterious mutation load is insensitive to
recent population history. Nat Genet 46: 220–224. https://doi.org/10.1038/ng.2896 PMID: 24509481
2. Simons YB, Sella G (2016) The impact of recent population history on the deleterious mutation load in
humans and close evolutionary relatives. Curr Opin Genet Dev 41: 150–158. https://doi.org/10.1016/j.
gde.2016.09.006 PMID: 27744216
3. Nei M (1968) The frequency distribution of lethal chromosomes in finite populations. Proc Natl Acad Sci
U S A 60: 517–524. PMID: 5248809
4. Gillespie JH (2004) Population Genetics: A Concise Guide. Baltimore, MD: Johns Hopkins University
Press.
5. Brandvain Y, Wright SI (2016) The Limits of Natural Selection in a Nonequilibrium World. Trends Genet
32: 201–210. https://doi.org/10.1016/j.tig.2016.01.004 PMID: 26874998
6. Balick DJ, Do R, Cassa CA, Reich D, Sunyaev SR (2015) Dominance of Deleterious Alleles Controls
the Response to a Population Bottleneck. PLoS Genet 11: e1005436. https://doi.org/10.1371/journal.
pgen.1005436 PMID: 26317225
7. Beauchamp KA, Muzzey D, Wong KK, Hogan GJ, Karimi K, et al. (2017) Systematic Design and Com-
parison of Expanded Carrier Screening Panels. Genet Med—ePub ahead of print
8. Clark AG (1998) Mutation-selection balance with multiple alleles. Genetica 102–103: 41–47. PMID:
9720270
9. Crow JF, Kimura M (1970) Introduction to Population Genetics Theory New York: Harper & Row Pub-
lishers. 591 p.
10. Cormet-Boyaka E, Jablonsky M, Naren AP, Jackson PL, Muccio DD, et al. (2004) Rescuing cystic fibro-
sis transmembrane conductance regulator (CFTR)-processing mutants by transcomplementation. Proc
Natl Acad Sci U S A 101: 8221–8226. https://doi.org/10.1073/pnas.0400459101 PMID: 15141088
11. Rapino D, Sabirzhanova I, Lopes-Pacheco M, Grover R, Guggino WB, et al. (2015) Rescue of NBD2
mutants N1303K and S1235R of CFTR by small-molecule correctors and transcomplementation. PLoS
One 10: e0119796. https://doi.org/10.1371/journal.pone.0119796 PMID: 25799511
12. Andressoo JO, Jans J, de Wit J, Coin F, Hoogstraten D, et al. (2006) Rescue of progeria in trichothiody-
strophy by homozygous lethal Xpd alleles. PLoS Biol 4: e322. https://doi.org/10.1371/journal.pbio.
0040322 PMID: 17020410
13. Gallati S (2014) Disease-modifying genes and monogenic disorders: experience in cystic fibrosis. Appl
Clin Genet 7: 133–146. https://doi.org/10.2147/TACG.S18675 PMID: 25053892
14. Corvol H, Blackman SM, Boelle PY, Gallins PJ, Pace RG, et al. (2015) Genome-wide association meta-
analysis identifies five modifier loci of lung disease severity in cystic fibrosis. Nat Commun 6: 8382.
https://doi.org/10.1038/ncomms9382 PMID: 26417704
15. Habara A, Steinberg MH (2016) Minireview: Genetic basis of heterogeneity and severity in sickle cell
disease. Exp Biol Med (Maywood) 241: 689–696.
The population genetics of recessive, lethal mutations
PLOS Genetics | https://doi.org/10.1371/journal.pgen.1006915 September 28, 2017 20 / 23
16. Hedrick PW (2011) Population genetics of malaria resistance in humans. Heredity (Edinb) 107: 283–
304. https://doi.org/10.1038/hdy.2011.16 PMID: 21427751
17. Chong JX, Buckingham KJ, Jhangiani SN, Boehm C, Sobreira N, et al. (2015) The Genetic Basis of
Mendelian Phenotypes: Discoveries, Challenges, and Opportunities. Am J Hum Genet 97: 199–215.
https://doi.org/10.1016/j.ajhg.2015.06.009 PMID: 26166479
18. Kong A, Frigge ML, Masson G, Besenbacher S, Sulem P, et al. (2012) Rate of de novo mutations and
the importance of father’s age to disease risk. Nature 488: 471–475. https://doi.org/10.1038/
nature11396 PMID: 22914163
19. Turner TN, Douville C, Kim D, Stenson PD, Cooper DN, et al. (2015) Proteins linked to autosomal domi-
nant and autosomal recessive disorders harbor characteristic rare missense mutation distribution pat-
terns. Hum Mol Genet 24: 5995–6002. https://doi.org/10.1093/hmg/ddv309 PMID: 26246501
20. Haque IS, Lazarin GA, Kang H, Evans EA, Goldberg JD, et al. (2016) Modeled fetal risk of genetic dis-
eases identified by expanded carrier screening. JAMA 316: 734–742. https://doi.org/10.1001/jama.
2016.11139 PMID: 27533158
21. Cooper DN, Youssoufian H (1988) The CpG dinucleotide and human genetic disease. Hum Genet 78:
151–155. PMID: 3338800
22. Akalin N, Zietkiewicz E, Makalowski W, Labuda D (1994) Are CpG sites mutation hot spots in the dystro-
phin gene? Hum Mol Genet 3.
23. Lek M, Karczewski KJ, Minikel EV, Samocha KE, Banks E, et al. (2016) Analysis of protein-coding
genetic variation in 60,706 humans. Nature 536: 285–291. https://doi.org/10.1038/nature19057 PMID:
27535533
24. Chen R, Shi L, Hakenberg J, Naughton B, Sklar P, et al. (2016) Analysis of 589,306 genomes identifies
individuals resilient to severe Mendelian childhood diseases. Nat Biotechnol 34: 531–538. https://doi.
org/10.1038/nbt.3514 PMID: 27065010
25. Tennessen JA, Bigham AW, O’Connor TD, Fu W, Kenny EE, et al. (2012) Evolution and functional
impact of rare coding variation from deep sequencing of human exomes. Science 337: 64–69. https://
doi.org/10.1126/science.1219240 PMID: 22604720
26. Wright S (1937) The Distribution of Gene Frequencies in Populations. Proc Natl Acad Sci U S A 23:
307–320. PMID: 16577780
27. Harpak A, Bhaskar A, Pritchard JK (2016) Mutation Rate Variation is a Primary Determinant of the Dis-
tribution of Allele Frequencies in Humans. PLoS Genet 12: e1006489. https://doi.org/10.1371/journal.
pgen.1006489 PMID: 27977673
28. Browning Sharon R, Browning Brian L (2015) Accurate Non-parametric Estimation of Recent Effective
Population Size from Segments of Identity by Descent. The American Journal of Human Genetics 97:
404–418. https://doi.org/10.1016/j.ajhg.2015.07.012 PMID: 26299365
29. Reich DE, Lander ES (2001) On the allelic spectrum of human disease. Trends Genet 17: 502–510.
PMID: 11525833
30. Pritchard JK, Cox NJ (2002) The allelic architecture of human disease genes: common disease-com-
mon variant. . .or not? Hum Mol Genet 11: 2417–2423. PMID: 12351577
31. Zwick ME, Cutler DJ, Chakravarti A (2000) Patterns of genetic variation in Mendelian and complex
traits. Annu Rev Genomics Hum Genet 1: 387–407. https://doi.org/10.1146/annurev.genom.1.1.387
PMID: 11701635
32. Cassa CA, Weghorn D, Balick DJ, Jordan DM, Nusinow D, et al. (2017) Estimating the Selective Effect
of Heterozygous Protein Truncating Variants from Human Exome Data. Nat Genet 49: 806–810.
https://doi.org/10.1038/ng.3831 PMID: 28369035
33. The Thousand Genomes Consortium (2015) A global reference for human genetic variation. Nature
526: 68–74. https://doi.org/10.1038/nature15393 PMID: 26432245
34. Neale BM, Kou Y, Liu L, Ma/’ayan A, Samocha KE, et al. (2012) Patterns and rates of exonic de novo
mutations in autism spectrum disorders. Nature 485: 242–245. https://doi.org/10.1038/nature11011
PMID: 22495311
35. Fu W, O’Connor T, Jun G, Kang H, Abecasis G, et al. (2013) Analysis of 6,515 exomes reveals the
recent origin of most human protein-coding variants. Nature 493: 216–220. https://doi.org/10.1038/
nature11690 PMID: 23201682
36. Segurel L, Wyman MJ, Przeworski M (2014) Determinants of mutation rate variation in the human germ-
line. Annu Rev Genomics Hum Genet 15: 47–70. https://doi.org/10.1146/annurev-genom-031714-
125740 PMID: 25000986
37. Lohmueller KE, Indap AR, Schmidt S, Boyko AR, Hernandez RD, et al. (2008) Proportionally more dele-
terious genetic variation in European than in African populations. Nature 451: 994–997. https://doi.org/
10.1038/nature06611 PMID: 18288194
The population genetics of recessive, lethal mutations
PLOS Genetics | https://doi.org/10.1371/journal.pgen.1006915 September 28, 2017 21 / 23
38. Peischl S, Dupanloup I, Bosshard L, Excoffier L (2016) Genetic surfing in human populations: from
genes to genomes. Curr Opin Genet Dev 41: 53–61. https://doi.org/10.1016/j.gde.2016.08.003 PMID:
27584859
39. Pritchard JK, Cox NJ (2002) The allelic architecture of human disease genes: common disease-com-
mon variant. . .or not? PMID: 12351577
40. Aggarwala V, Voight BF (2016) An expanded sequence context model broadly explains variability in
polymorphism levels across the human genome. Nat Genet 48: 349–355. https://doi.org/10.1038/ng.
3511 PMID: 26878723
41. Hodgkinson A, Eyre-Walker A Variation in the mutation rate across mammalian genomes. Nat Rev
Genet 12: 756–766. https://doi.org/10.1038/nrg3098 PMID: 21969038
42. Moorjani P, Amorim CE, Arndt PF, Przeworski M (2016) Variation in the molecular clock of primates.
Proc Natl Acad Sci U S A 113: 10607–10612. https://doi.org/10.1073/pnas.1600374113 PMID:
27601674
43. Kamphans T, Sabri P, Zhu N, Heinrich V, Mundlos S, et al. (2013) Filtering for compound heterozygous
sequence variants in non-consanguineous pedigrees. PLoS One 8: e70151. https://doi.org/10.1371/
journal.pone.0070151 PMID: 23940540
44. Burkhart BD, Montgomery E, Langley CH, Voelker RA (1984) Characterization of Allozyme Null and
Low Activity Alleles from Two Natural Populations of DROSOPHILA MELANOGASTER. Genetics 107:
295–306. PMID: 17246217
45. Xue Y, Chen Y, Ayub Q, Huang N, Ball EV, et al. (2012) Deleterious- and disease-allele prevalence in
healthy individuals: insights from current predictions, mutation databases, and population-scale rese-
quencing. Am J Hum Genet 91: 1022–1032. https://doi.org/10.1016/j.ajhg.2012.10.015 PMID:
23217326
46. Piton A, Redin C, Mandel JL (2013) XLID-causing mutations and associated genes challenged in light
of data from large-scale human exome sequencing. Am J Hum Genet 93: 368–383. https://doi.org/10.
1016/j.ajhg.2013.06.013 PMID: 23871722
47. Gazave E, Ma L, Chang D, Coventry A, Gao F, et al. (2014) Neutral genomic regions refine models of
recent rapid human population growth. Proc Natl Acad Sci U S A 111: 757–762. https://doi.org/10.
1073/pnas.1310398110 PMID: 24379384
48. Gao F, Keinan A (2016) Explosive genetic evidence for explosive human population growth. Curr Opin
Genet Dev 41: 130–139. https://doi.org/10.1016/j.gde.2016.09.002 PMID: 27710906
49. Wright S (1931) Evolution in Mendelian populations. Genetics 16: 97–159. PMID: 17246615
50. Ober C, Hyslop T, Hauck WW (1999) Inbreeding Effects on Fertility in Humans: Evidence for Reproduc-
tive Compensation. The American Journal of Human Genetics 64: 225–231. https://doi.org/10.1086/
302198 PMID: 9915962
51. Gabriel SE, Brigman KN, Koller BH, Boucher RC, Stutts MJ (1994) Cystic fibrosis heterozygote resis-
tance to cholera toxin in the cystic fibrosis mouse model. Science 266: 107–109. PMID: 7524148
52. Wagener D, Cavalli-Sforza LL, Barakat R (1978) Ethnic variation of genetic disease: roles of drift for
recessive lethal genes. American Journal of Human Genetics 30: 262–270. PMID: 677123
53. Quinton PM (1994) Human genetics. What is good about cystic fibrosis? Curr Biol 4: 742–743. PMID:
7525005
54. Chakravarti A, Chakraborty R (1978) Elevated frequency of Tay-Sachs disease among Ashkenazic
Jews unlikely by genetic drift alone. American Journal of Human Genetics 30: 256–261. PMID: 677122
55. Ewens WJ (1978) Tay-Sachs disease and theoretical population genetics. American Journal of Human
Genetics 30: 328–329. PMID: 677129
56. Landrum MJ, Lee JM, Riley GR, Jang W, Rubinstein WS, et al. (2014) ClinVar: public archive of rela-
tionships among sequence variation and human phenotype. Nucleic acids research 42: D980–D985.
https://doi.org/10.1093/nar/gkt1113 PMID: 24234437
57. Eppig JT, Blake JA, Bult CJ, Kadin JA, Richardson JE (2015) The Mouse Genome Database (MGD):
facilitating mouse as a model for human biology and disease. Nucleic Acids Res 43: D726–736. https://
doi.org/10.1093/nar/gku967 PMID: 25348401
58. Gravel S, Henn BM, Gutenkunst RN, Indap AR, Marth GT, et al. (2011) Demographic history and rare
allele sharing among human populations. Proc Natl Acad Sci U S A 108: 11983–11988. https://doi.org/
10.1073/pnas.1019276108 PMID: 21730125
59. Mugal CF, Ellegren H (2011) Substitution rate variation at human CpG sites correlates with non-CpG
divergence, methylation level and GC content. Genome Biol 12: R58. https://doi.org/10.1186/gb-2011-
12-6-r58 PMID: 21696599
The population genetics of recessive, lethal mutations
PLOS Genetics | https://doi.org/10.1371/journal.pgen.1006915 September 28, 2017 22 / 23
60. North BV, Curtis D, Sham PC (2002) A Note on the Calculation of Empirical Values from Monte Carlo
Procedures. The American Journal of Human Genetics 71: 439–441. https://doi.org/10.1086/341527
PMID: 12111669
61. Quinlan AR, Hall IM (2010) BEDTools: a flexible suite of utilities for comparing genomic features. Bioin-
formatics 26: 841–842. https://doi.org/10.1093/bioinformatics/btq033 PMID: 20110278
62. R Core Team (2015) R: A Language and Environment for Statistical Computing. Vienna, Austria.
The population genetics of recessive, lethal mutations
PLOS Genetics | https://doi.org/10.1371/journal.pgen.1006915 September 28, 2017 23 / 23