Embed Size (px)
DESCRIPTION
Keyword Quiz :. Settler :. The population of the world is increasing by ______________________ The average number of children born per 1000 people: _____________ Average number of deaths per 1000 people: _______________________ - PowerPoint PPT Presentation
Citation preview
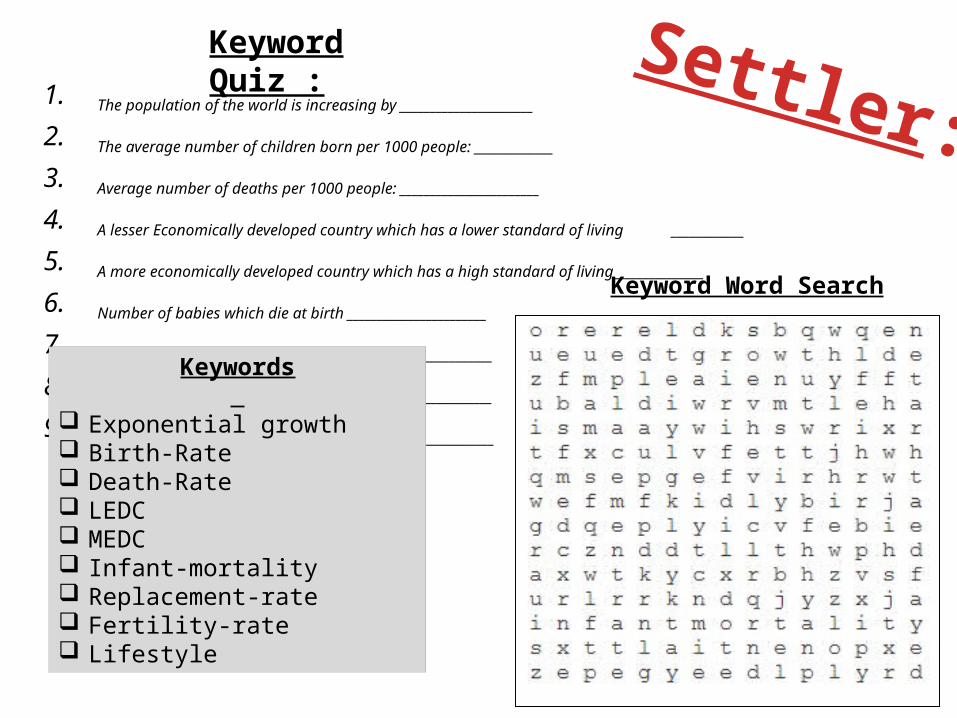
1. The population of the world is increasing by ______________________
2. The average number of children born per 1000 people: _____________
3. Average number of deaths per 1000 people: _______________________
4. A lesser Economically developed country which has a lower standard of living ____________
5. A more economically developed country which has a high standard of living_______________
6. Number of babies which die at birth _______________________
7. How a population replaces itself over time__________________
8. Average number of children a woman has__________________
9. How people act and think in a given country________________
Keyword Quiz :
Keywords
Exponential growth Birth-Rate Death-Rate LEDC MEDC Infant-mortality Replacement-rate Fertility-rate Lifestyle
Settler:
Keyword Word Search
What has this got to do with Geography?
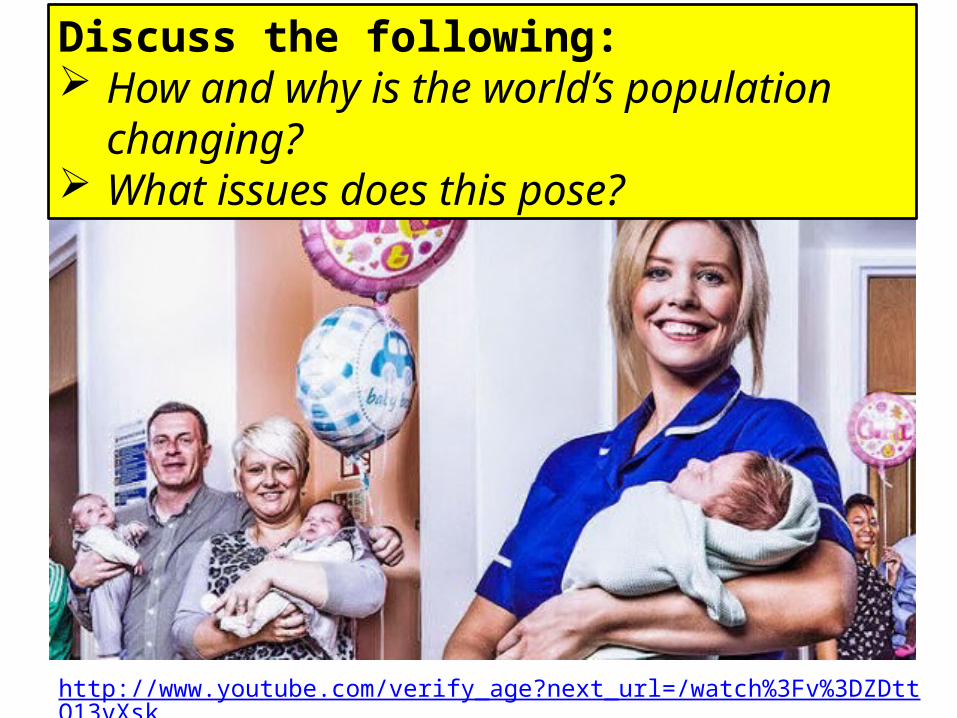
Discuss the following: How and why is the world’s population
changing? What issues does this pose?
http://www.youtube.com/verify_age?next_url=/watch%3Fv%3DZDttQ13vXsk
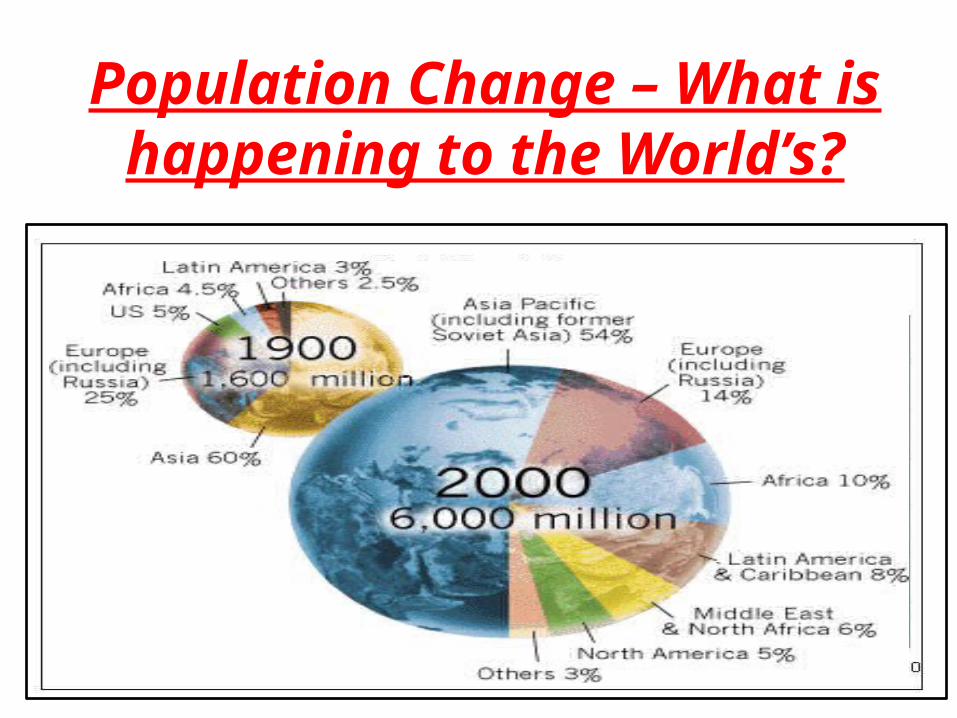
Population Change – What is happening to the World’s?
• Subject target:• To understand reasons for changes in the global
population, including how & why the birth and death rates have changed and the effects of these changes.
• Literacy target:• To decode a piece of text in order to critically evaluate
its effectiveness.
• Competence: Research
Why is global population changing?
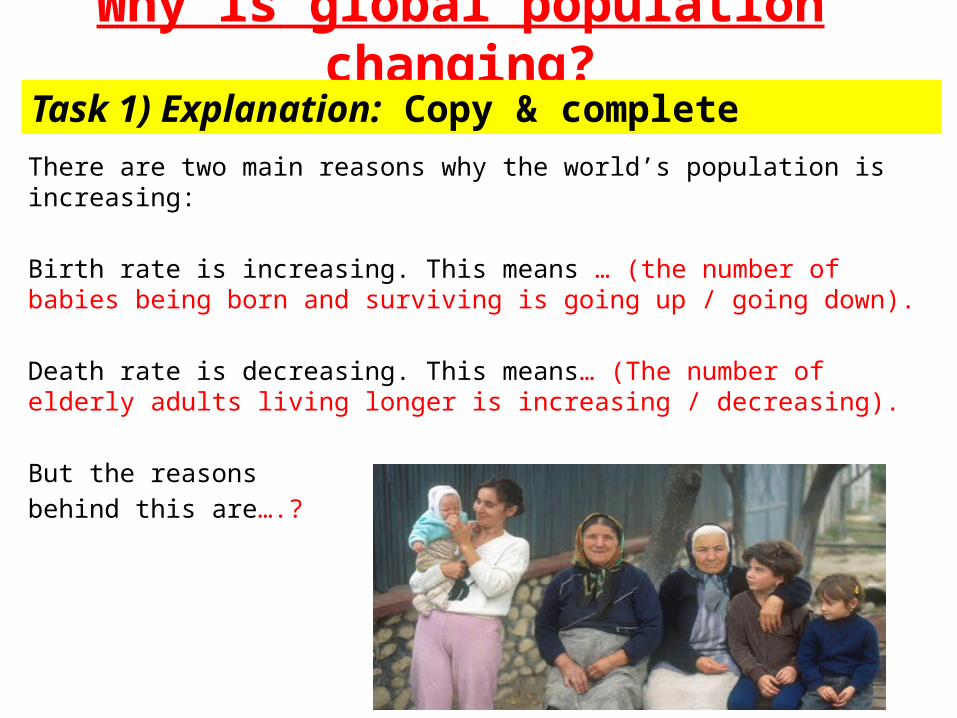
There are two main reasons why the world’s population is increasing:
Birth rate is increasing. This means … (the number of babies being born and surviving is going up / going down).
Death rate is decreasing. This means… (The number of elderly adults living longer is increasing / decreasing).
But the reasons
behind this are….?
Task 1) Explanation: Copy & complete
Task explanation: 1 teacher per group Learners identify reasons why you think the birth
rate is increasing and the death has decreased.
Why is global population changing?
Task 2) Why is the birth rate and death rate changing?
Extension:Why else do you think
people are living longer?
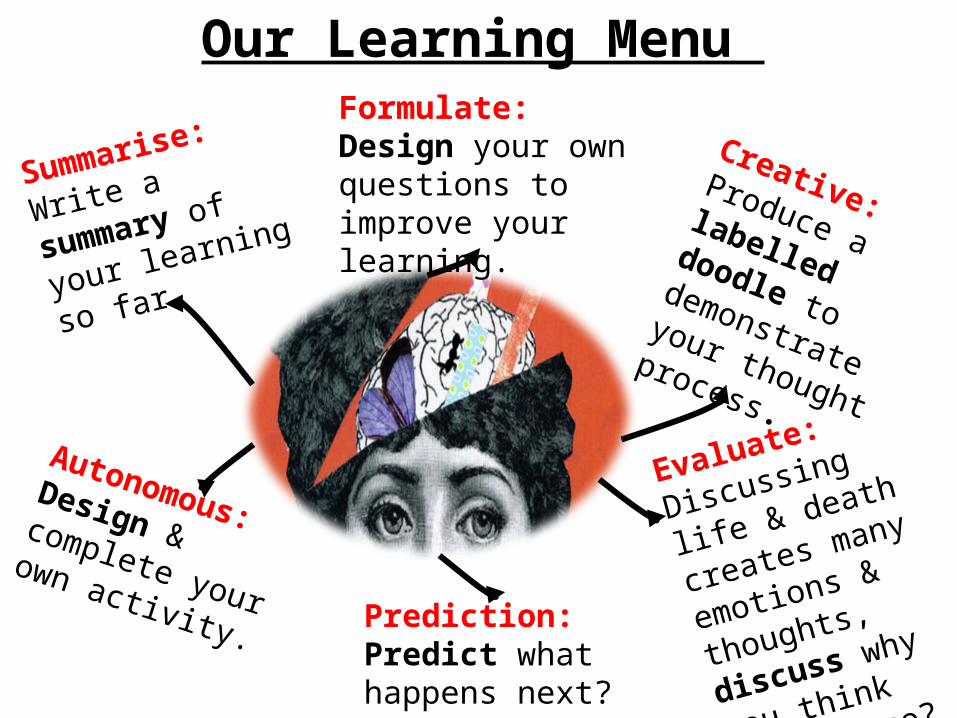
Our Learning Menu
Summarise:
Write a summary
of your learning so
far.
Creative:Produce a labelled doodle
to demonstrate your thought
process.
Evaluate:
Discussing life &
death creates
many emotions &
thoughts, discuss
why you think this
is so?
Autonomous:Design & complete your
own activity. Prediction:Predict what happens next?
Formulate: Design your own questions to improve your learning.
Mini Plenary:• Lingo Bingo Activity
Learning Outcome:To understand reasons for changes in the global population, including how & why the birth and death rates have changed and the effects of these changes
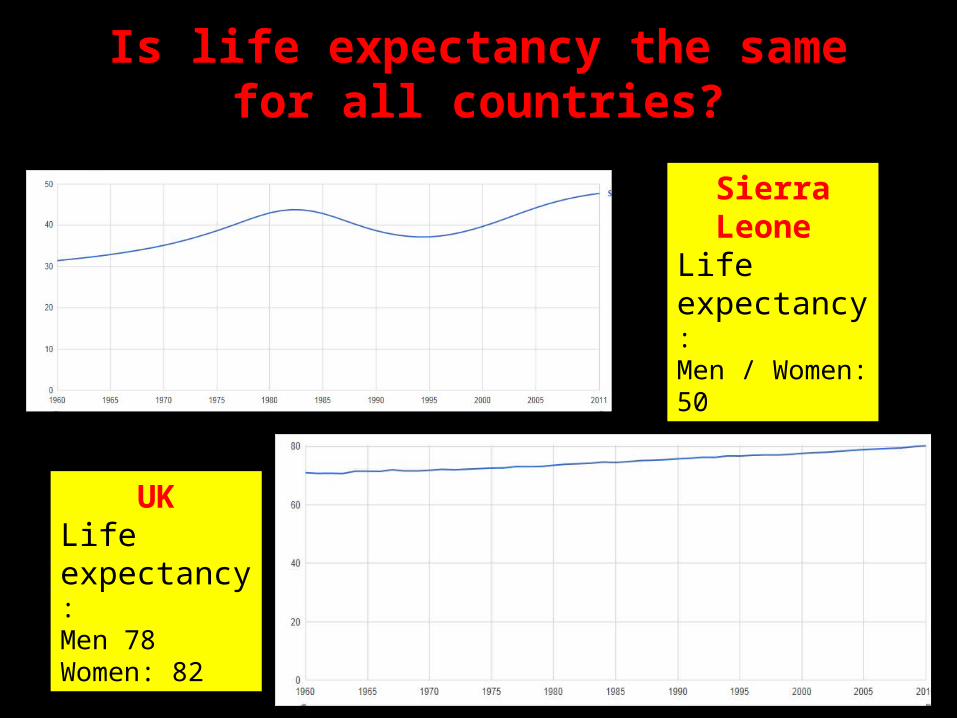
Is life expectancy the same for all countries?
UKLife expectancy:Men 78Women: 82
Sierra Leone
Life expectancy:Men / Women: 50
Key Question: But why….?
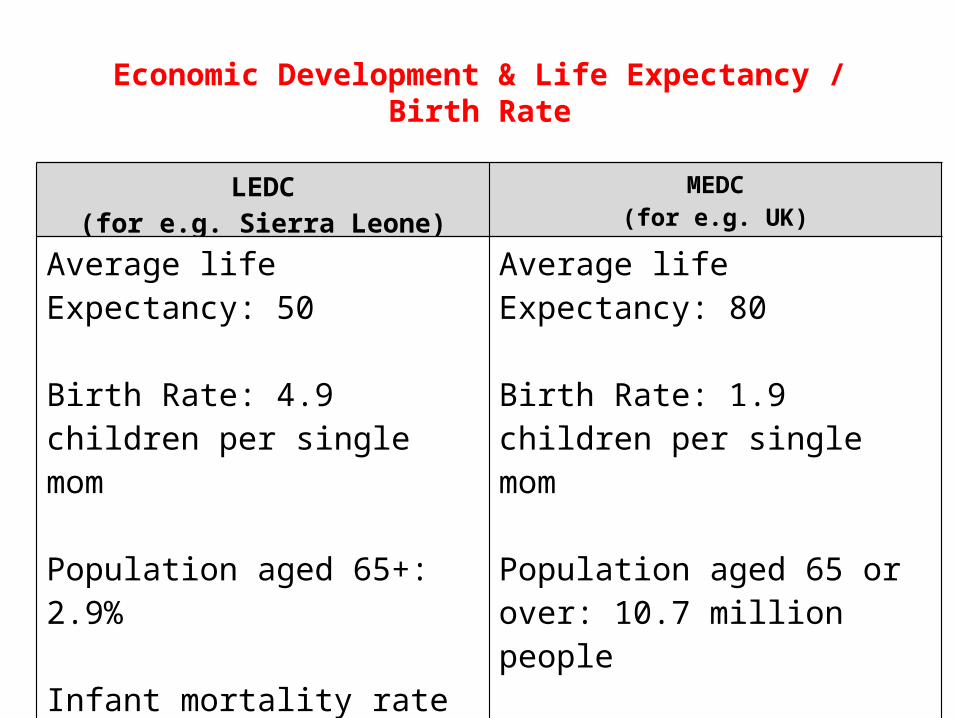
Economic Development & Life Expectancy / Birth Rate
Learning Outcome:To understand reasons for changes in the global population, including how & why the birth and death rates have changed and the effects of these changes
Economic Development & Life Expectancy / Birth Rate
a) Introduce Sierra Leone & the UKb) Play board game and make notesc) Group discussion: why is the one country an MEDC and the other country an LEDC
The birth rate, death rate and life expectancy of a country can tell us how economically developed (or wealthy) a country is.
LEDC(for e.g. Sierra Leone)
MEDC(for e.g. UK)
Average life Expectancy: 50
Birth Rate: 4.9 children per single mom
Population aged 65+: 2.9%
Infant mortality rate per 1000 children: 114
Average life Expectancy: 80
Birth Rate: 1.9 children per single mom
Population aged 65 or over: 10.7 million people
Infant mortality rate per 1000 children: 4.1
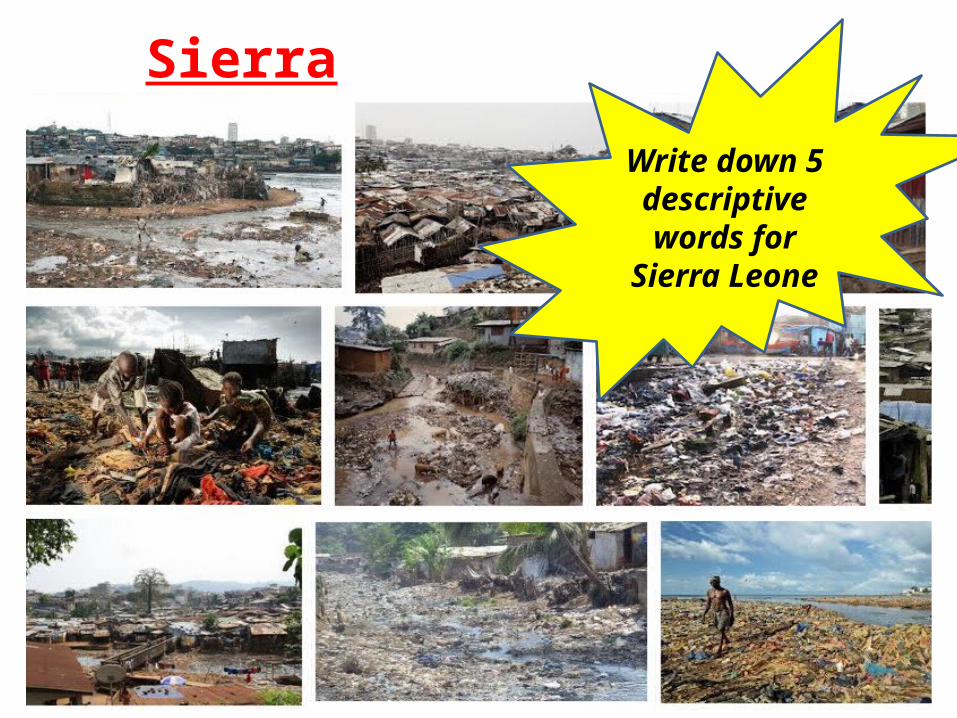
Sierra Leone
Write down 5 descriptive words for
Sierra Leone
Economic Development – MEDC Versus LEDC
DevelopedCountries
Un-DevelopedCountries

UK
Similarities /
differences
Sierra Leone
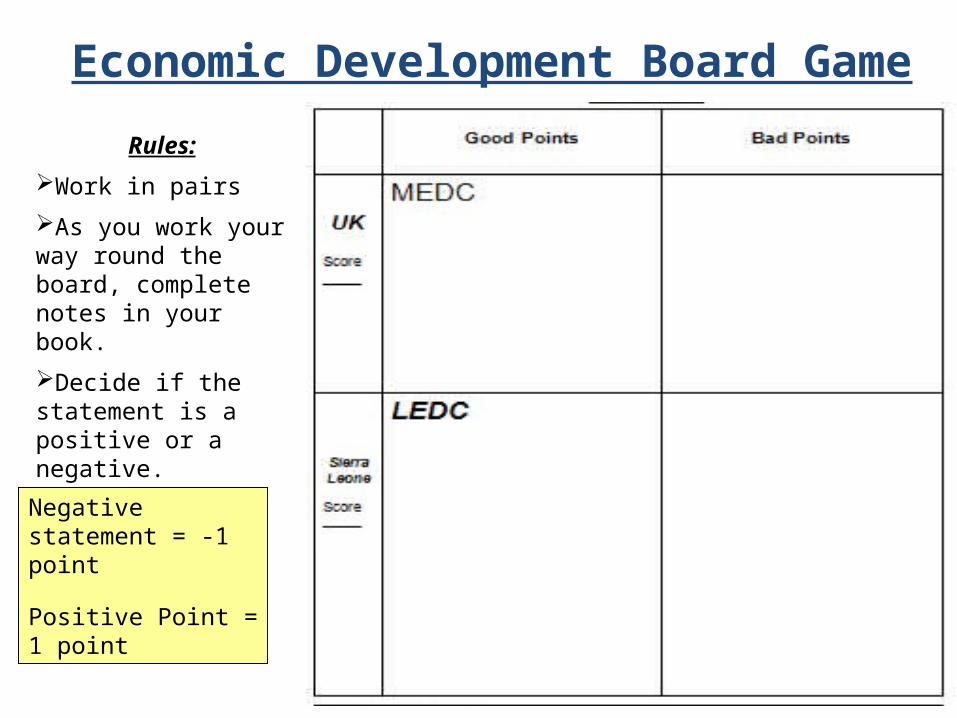
Economic Development Board Game
Rules:
Work in pairs
As you work your way round the board, complete notes in your book.
Decide if the statement is a positive or a negative.
Negative statement = -1 point
Positive Point = 1 point

Mini Plenary: • Find someone you know activity
• 4 minutes• Write down your answers• One answer per person
Learning Outcome:To understand reasons for changes in the global population, including how & why the birth and death rates have changed and the effects of these changes
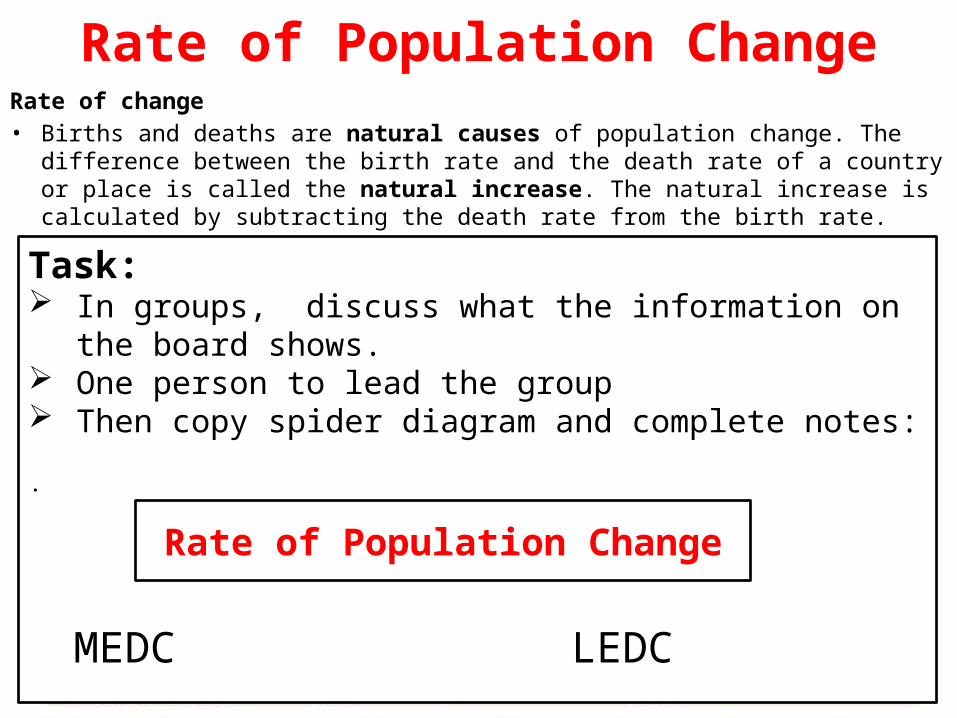
Rate of Population ChangeRate of change• Births and deaths are natural causes of population change. The difference
between the birth rate and the death rate of a country or place is called the natural increase. The natural increase is calculated by subtracting the death rate from the birth rate.
Natural increase = birth rate - death rateTask: In groups, discuss what the information on the board
shows. One person to lead the group Then copy spider diagram and complete notes:
.
Rate of Population Change
MEDC LEDC
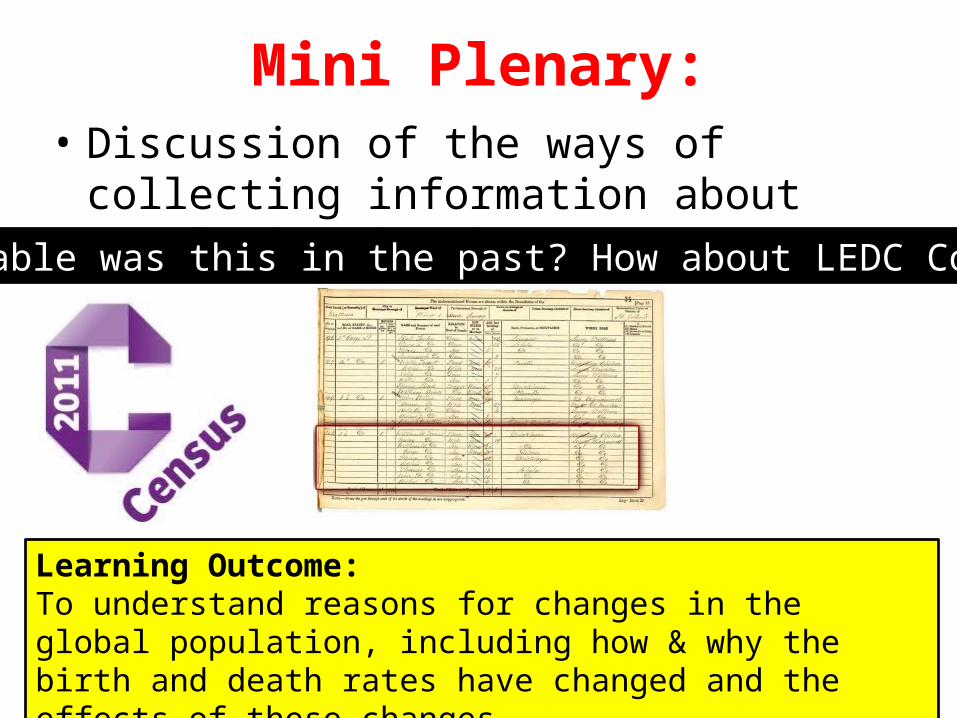
Mini Plenary:• Discussion of the ways of collecting
information about population in the UK.How reliable was this in the past? How about LEDC Countries?
Learning Outcome:To understand reasons for changes in the global population, including how & why the birth and death rates have changed and the effects of these changes

Task 5) How and why have birth and death rates changed over time?
Facts from memory exercise
3 minutes to visit the laptop screen. Share with your group what you learn. 1 person to visit the screen at a time.
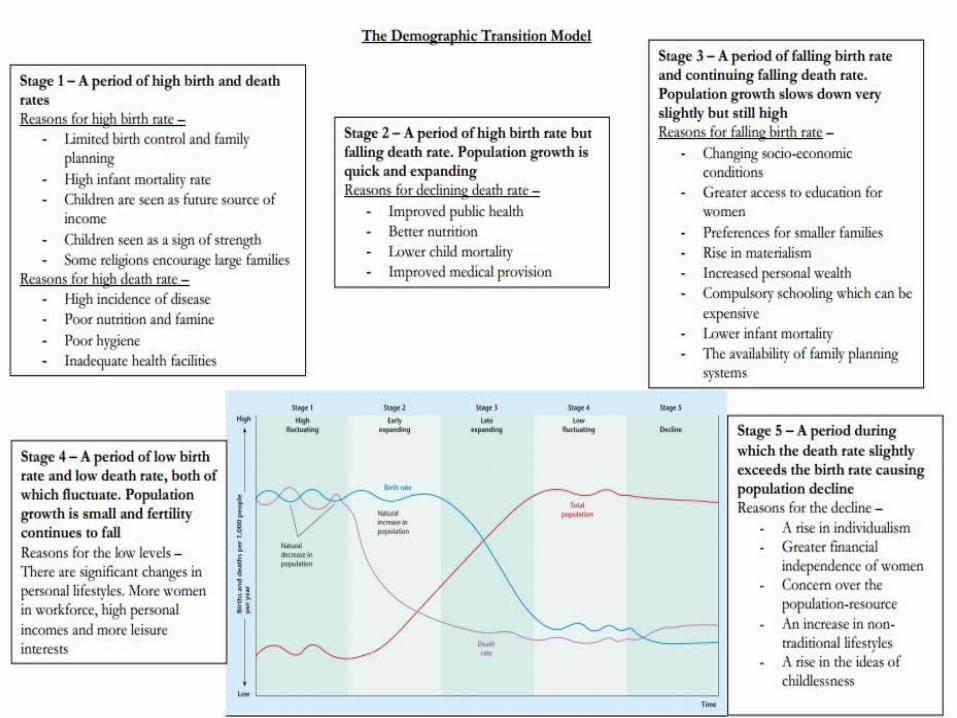
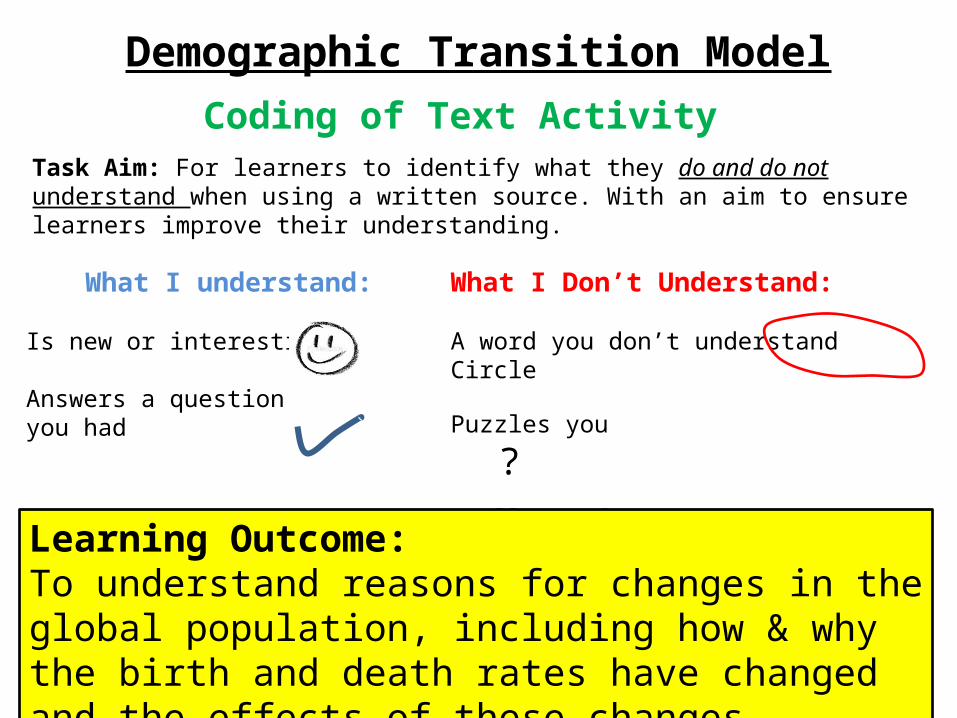
Demographic Transition Model
What I understand:
Is new or interesting
Answers a question you had
What I Don’t Understand:
A word you don’t understand Circle
Puzzles you ?
Really confuses you ??
Coding of Text Activity Task Aim: For learners to identify what they do and do not understand when using a written source. With an aim to ensure learners improve their understanding.
Learning Outcome:To understand reasons for changes in the global population, including how & why the birth and death rates have changed and the effects of these changes
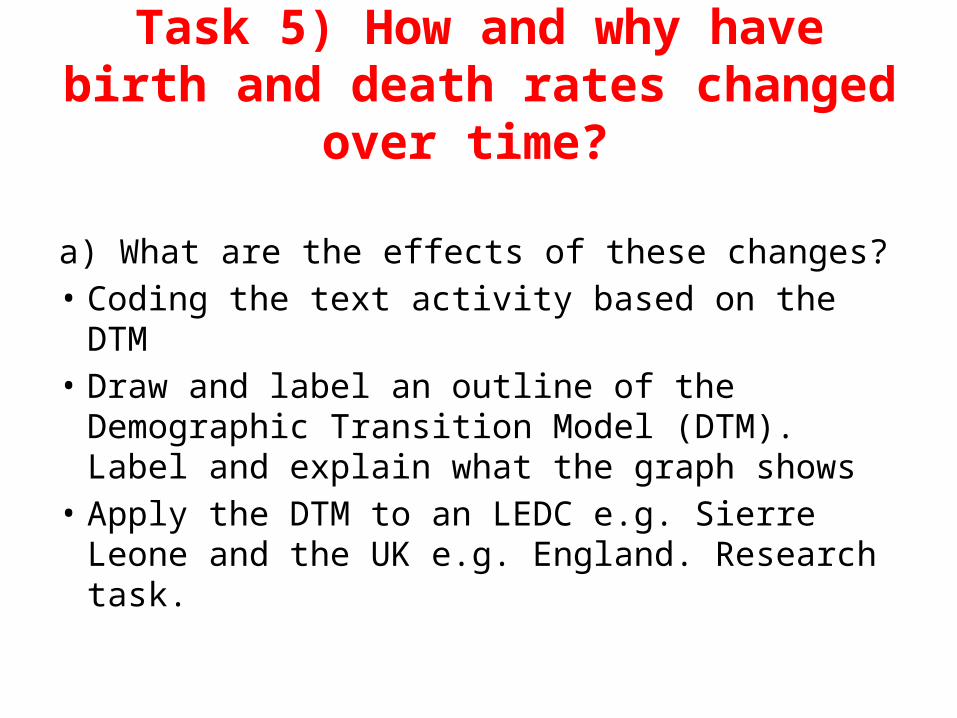
Task 5) How and why have birth and death rates changed over time?
a) What are the effects of these changes?• Coding the text activity based on the DTM• Draw and label an outline of the Demographic
Transition Model (DTM). Label and explain what the graph shows
• Apply the DTM to an LEDC e.g. Sierre Leone and the UK e.g. England. Research task.
Learning Outcome:To understand reasons for changes in the global population, including how & why the birth and death rates have changed and the effects of these changes