Embed Size (px)
Citation preview
Vanguard Research August 2018
The portfolio currency-hedging decision, by objective and block by block
■ Investors typically make currency-hedging decisions at the asset class rather than the portfolio level. The result can be an incomplete and even misleading perspective on the relationship between hedging strategy and portfolio objectives.
■ We present a framework that puts the typical asset-class approach in a portfolio context. This approach makes clear that the hedging decision depends on the strategic asset allocation decision that aligns a portfolio’s performance with an investor’s objectives.
■ A number of local market and idiosyncratic variables can modify this general rule, but this approach is a valuable starting point. It recognises that the strategic asset allocation decision is the most important step toward meeting a portfolio’s goals. And hedging decisions that preserve the risk-and-return characteristics of the underlying assets lead to a portfolio-level hedging strategy that is consistent with the portfolio’s objectives.
Daren R. Roberts; Paul M. Bosse, CFA; Scott J. Donaldson, CFA, CFP®; Matthew C. Tufano
For professional investors as defined under the MiFID II Directive only. In Switzerland for professional investors only. Not for Public Distribution.This document is published by The Vanguard Group, Inc. It is for educational purposes only and is not a recommendation or solicitation to buy or sell investments. It should be noted that it is written in the context of the US market and contains data and analysis specific to the US.

2
Notes on risk
All investment is subject to risk, including the possible loss of the money you invest. Past performance is no guarantee of future success. Investments in bond funds are subject to interest rate, credit and inflation risk. Foreign investing involves additional risks including currency fluctuations and political uncertainty. Diversification does not ensure a profit or protect against a loss. There is no guarantee that any particular asset allocation or mix of funds will meet your investment objectives or provide you with a given level of income. A fund can be subject to currency hedging risk, which is the chance that currency hedging transactions may not perfectly offset the fund’s foreign currency exposures and may eliminate any chance for a fund to benefit from favourable fluctuations in relevant currency exchange rates. A specific fund with currency hedging can incur expenses to hedge its currency exposures.
This paper focuses on the impact that currency has on the strategic asset allocation and assumes broadly diversified exposures to stocks and bonds. The hedging viewpoints expressed here do not consider the tactical use of hedging, active management, or concentrated country positions beyond typical home-bias positions.
Investors often look at currency hedging from an asset-class perspective — asking, for example, “Should I hedge my international equity position?”1 Combining individual portfolio component hedging decisions results in a portfolio hedge position. This begs the question: Is a building-block approach the right way to arrive at the currency-hedging view for the entire portfolio? Does it change as the portfolio allocation shifts? This paper examines that. But first, consider these premises:
• Investor objectives and preferences (risk, return, behaviour, and investment horizon) drive portfolio construction decisions.
• The strategic asset allocation is an appropriate mix of asset classes dependent on the investor objectives. It is the primary determinant of variability of the risk and return of a broadly diversified portfolio that is not engaged in market timing or active issue selection.
• Currency has no intrinsic return, but it can add material short-term volatility, thereby introducing performance differences. Any hedge position (on/off/partial) that diverges from local benchmarks and/or preference can introduce investor behavioural risks.
We examine the hedging of a portfolio’s international components. Our research concludes:
• The hedging framework begins with the investor’s risk–return preference. This feeds into the asset-class choices, then down to the decisions on diversification and currency hedging.
• Those with a long investment horizon who are comfortable with equity’s high potential return and volatility will allocate more to that asset class. They may be similarly disposed to accept short-term currency volatility.
• Fixed income provides the portfolio “ballast” that diversifies and counters equity volatility. To maintain this ability to control portfolio risk, it’s prudent to hedge international fixed income currency exposure (Philips et al., 2012).
• Investors with shorter investment horizons or low-risk/low-volatility targets will favour allocations to bonds, which will already have a high local-currency exposure resulting from domestic bonds and hedged global bond positions. Low-volatility objectives may also invite hedging or partial hedging of the portfolio’s international equity position in certain situations.
• With the objective-driven strategic asset allocation complete and, with it, the general currency position, it’s time to consider the nuances of the decision. The cost of hedging and the risks associated with its execution should be weighed against the hedge benefit, which can be modest and dependent on the equity–currency relationship. The capitalisation
1 Currency hedging is the process of reducing risk to fluctuations in foreign currency exchange rates.
For professional investors as defined under the MiFID II Directive only. In Switzerland for professional investors only. Not for Public Distribution.

3
Figure 1. Long-term currency exposure has little effect on returns
Notes: Three-year and 20-year currency returns are based on the US Dollar Index (DXY) return. DXY measures the value of the US dollar relative to a basket of foreign currencies. Data cover 31 December 1970, through 31 December 2016.Source: US Dollar Index.
Notes: dot size = p4
to change size: select same appearance; go to effect > convert to shape > ellipse > absolute
0%
20%
40%
60%
80%
100%
-6 -4 -2 0 2 4 6
-15
-10
-5
0
5
10
15
0%
100%
200%
300%
400%
500%
2012201120102009200820072006200520042003
1p
5th
95th
Percentileskey:
75th
25th
Median
5th
95th
Percentileskey:
75th
25th
Median
–6
–3
0
3
6
9
12
15%
Top Bottom
Axi
s la
bel
if n
eed
ed
Axis label if needed
-6%
-3%
0%
3%
6%
9%
12%
15%
!"#$$%
!$#&$%
$#$$%
$#&$%
"#$$%
"'($"
()*%
"'($"
()+%
"'($"
())%
"'($"
(),%
"'($"
(,$%
!"##$%&'(')*+,'-",,*#+."%'/'0123'24,,*%-)'5+67*8'96'0123':#"5+#'
Cu
rren
cy r
etu
rns
–15
–5
0
5
10%
1999 2007 20111995 20151991
–10
2003
Three-year trailing currency returns20-year trailing currency returns
size of the local-market and the preferred “home bias” (overweighting of local market securities) can affect the investor’s hedge decision. Smaller-market investors may prefer some currency hedging given their outsized foreign currency risk, and local benchmarking practices may dictate how much tracking error (the difference between a portfolio’s returns and its benchmark’s) investors are comfortable with.
Following is a look at how the conclusions were reached, plus many important caveats to these general views.
Currency-hedging decisions during portfolio construction
Portfolio construction starts with the investor’s objectives — the time horizon, need for return, and degree of willingness to assume risk. These inputs are the basis for an investor’s first and most important decision: the portfolio’s strategic allocation between the major asset classes, equities and fixed income. The next step is to implement this allocation with broadly diversified global portfolios, with exposure to assets from outside the investor’s home market.
When investors buy foreign assets, they obtain exposure not only to the underlying securities but also to foreign currency. Over the long term, currency has no intrinsic return; it has no yield, coupon or earnings growth. It reflects the local economy, inflation, interest rates and government policy. Although these factor profiles vary by country, the currency “entity” itself has no built-in return (Philips et al, 2012).
Therefore, over the long term, currency exposure adds only return volatility to an investment. Keeping that exposure means added volatility in the short term in the international asset returns, but long-term, minor and fluctuating changes in total return can be expected (Greiner, 2013). Figure 1 compares three-year and 20-year currency return averages and shows that over extended horizons, currency has little impact on asset return.
For professional investors as defined under the MiFID II Directive only. In Switzerland for professional investors only. Not for Public Distribution.
4
2 This calculation converts the hedged returns at the spot rate for an unhedged approximation. This may differ from a hedged return, as it does not account for the hedging mechanism, such as movements in currency forwards or swaps.
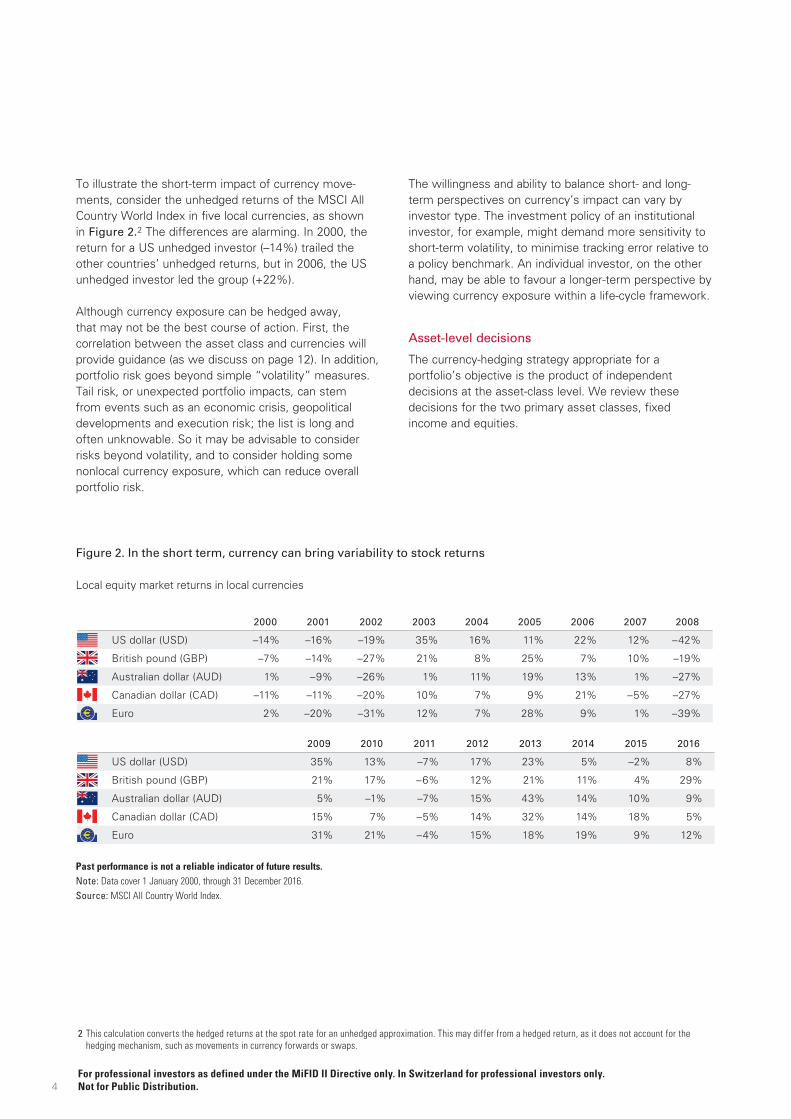
To illustrate the short-term impact of currency move-ments, consider the unhedged returns of the MSCI All Country World Index in five local currencies, as shown in Figure 2.2 The differences are alarming. In 2000, the return for a US unhedged investor (–14%) trailed the other countries’ unhedged returns, but in 2006, the US unhedged investor led the group (+22%).
Although currency exposure can be hedged away, that may not be the best course of action. First, the correlation between the asset class and currencies will provide guidance (as we discuss on page 12). In addition, portfolio risk goes beyond simple “volatility” measures. Tail risk, or unexpected portfolio impacts, can stem from events such as an economic crisis, geopolitical developments and execution risk; the list is long and often unknowable. So it may be advisable to consider risks beyond volatility, and to consider holding some nonlocal currency exposure, which can reduce overall portfolio risk.
The willingness and ability to balance short- and long-term perspectives on currency’s impact can vary by investor type. The investment policy of an institutional investor, for example, might demand more sensitivity to short-term volatility, to minimise tracking error relative to a policy benchmark. An individual investor, on the other hand, may be able to favour a longer-term perspective by viewing currency exposure within a life-cycle framework.
Asset-level decisions
The currency-hedging strategy appropriate for a portfolio’s objective is the product of independent decisions at the asset-class level. We review these decisions for the two primary asset classes, fixed income and equities.
Figure 2. In the short term, currency can bring variability to stock returns
Local equity market returns in local currencies
Past performance is not a reliable indicator of future results.Note: Data cover 1 January 2000, through 31 December 2016.Source: MSCI All Country World Index.
2000 2001 2002 2003 2004 2005 2006 2007 2008
US dollar (USD) –14% –16% –19% 35% 16% 11% 22% 12% –42%
British pound (GBP) –7% –14% –27% 21% 8% 25% 7% 10% –19%
Australian dollar (AUD) 1% –9% –26% 1% 11% 19% 13% 1% –27%
Canadian dollar (CAD) –11% –11% –20% 10% 7% 9% 21% –5% –27%
Euro 2% –20% –31% 12% 7% 28% 9% 1% –39%
2009 2010 2011 2012 2013 2014 2015 2016
US dollar (USD) 35% 13% –7% 17% 23% 5% –2% 8%
British pound (GBP) 21% 17% –6% 12% 21% 11% 4% 29%
Australian dollar (AUD) 5% –1% –7% 15% 43% 14% 10% 9%
Canadian dollar (CAD) 15% 7% –5% 14% 32% 14% 18% 5%
Euro 31% 21% –4% 15% 18% 19% 9% 12%
For professional investors as defined under the MiFID II Directive only. In Switzerland for professional investors only. Not for Public Distribution.
5
To maintain asset character, fixed income should be hedged to local currency
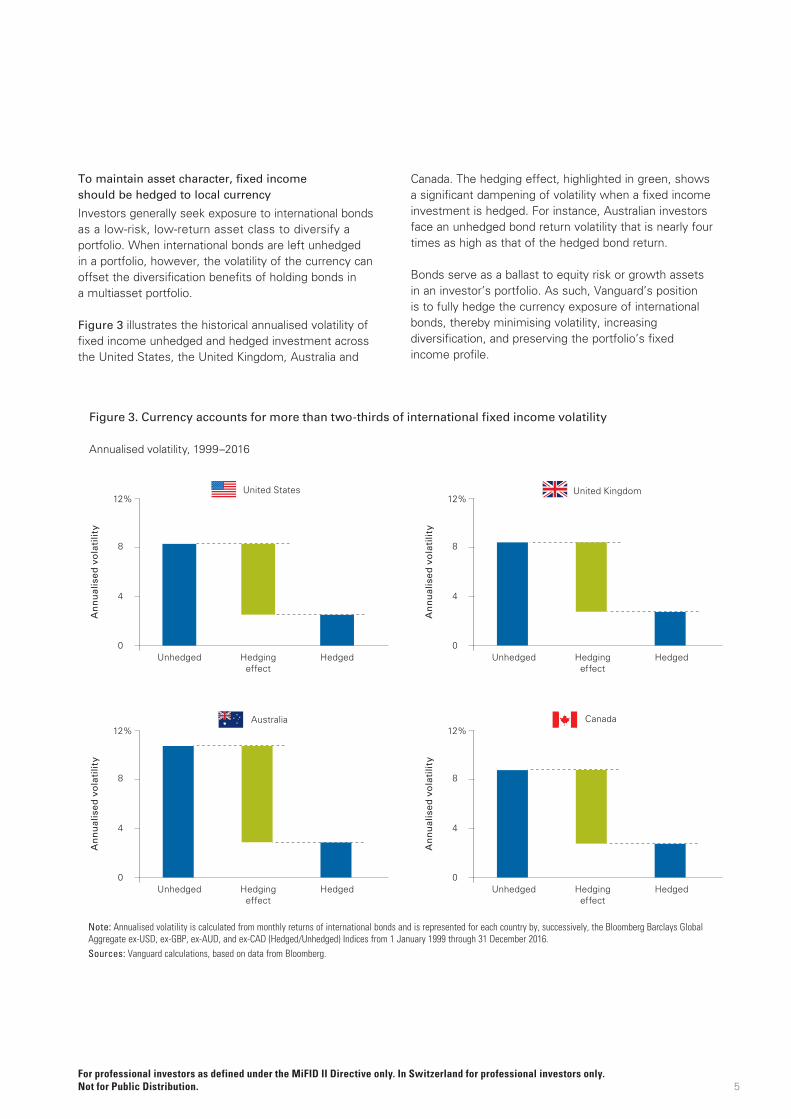
Investors generally seek exposure to international bonds as a low-risk, low-return asset class to diversify a portfolio. When international bonds are left unhedged in a portfolio, however, the volatility of the currency can offset the diversification benefits of holding bonds in a multiasset portfolio.
Figure 3 illustrates the historical annualised volatility of fixed income unhedged and hedged investment across the United States, the United Kingdom, Australia and
Canada. The hedging effect, highlighted in green, shows a significant dampening of volatility when a fixed income investment is hedged. For instance, Australian investors face an unhedged bond return volatility that is nearly four times as high as that of the hedged bond return.
Bonds serve as a ballast to equity risk or growth assets in an investor’s portfolio. As such, Vanguard’s position is to fully hedge the currency exposure of international bonds, thereby minimising volatility, increasing diversification, and preserving the portfolio’s fixed income profile.
Figure 3. Currency accounts for more than two-thirds of international fixed income volatility
Annualised volatility, 1999–2016
Note: Annualised volatility is calculated from monthly returns of international bonds and is represented for each country by, successively, the Bloomberg Barclays Global Aggregate ex-USD, ex-GBP, ex-AUD, and ex-CAD (Hedged/Unhedged) Indices from 1 January 1999 through 31 December 2016.Sources: Vanguard calculations, based on data from Bloomberg.
1p
5th
95th
Percentileskey:
75th
25th
Median
5th
95th
Percentileskey:
75th
25th
Median
–6
–3
0
3
6
9
12
15%
Top Bottom
Axi
s la
bel
if n
eed
ed
Axis label if needed
-6%
-3%
0%
3%
6%
9%
12%
15%
"'($"
(,$%
Legend 1Legend 2
United Kingdom
Australia Canada
United States
An
nu
alis
ed v
ola
tilit
y
0
4
8
12%
HedgedUnhedged Hedgingeffect
An
nu
alis
ed v
ola
tilit
y
0
4
8
12%
HedgedUnhedged Hedgingeffect
An
nu
alis
ed v
ola
tilit
y
0
4
8
12%
HedgedUnhedged Hedgingeffect
An
nu
alis
ed v
ola
tilit
y
0
4
8
12%
HedgedUnhedged Hedgingeffect
For professional investors as defined under the MiFID II Directive only. In Switzerland for professional investors only. Not for Public Distribution.

The equity hedging decision depends on the equity–currency interaction
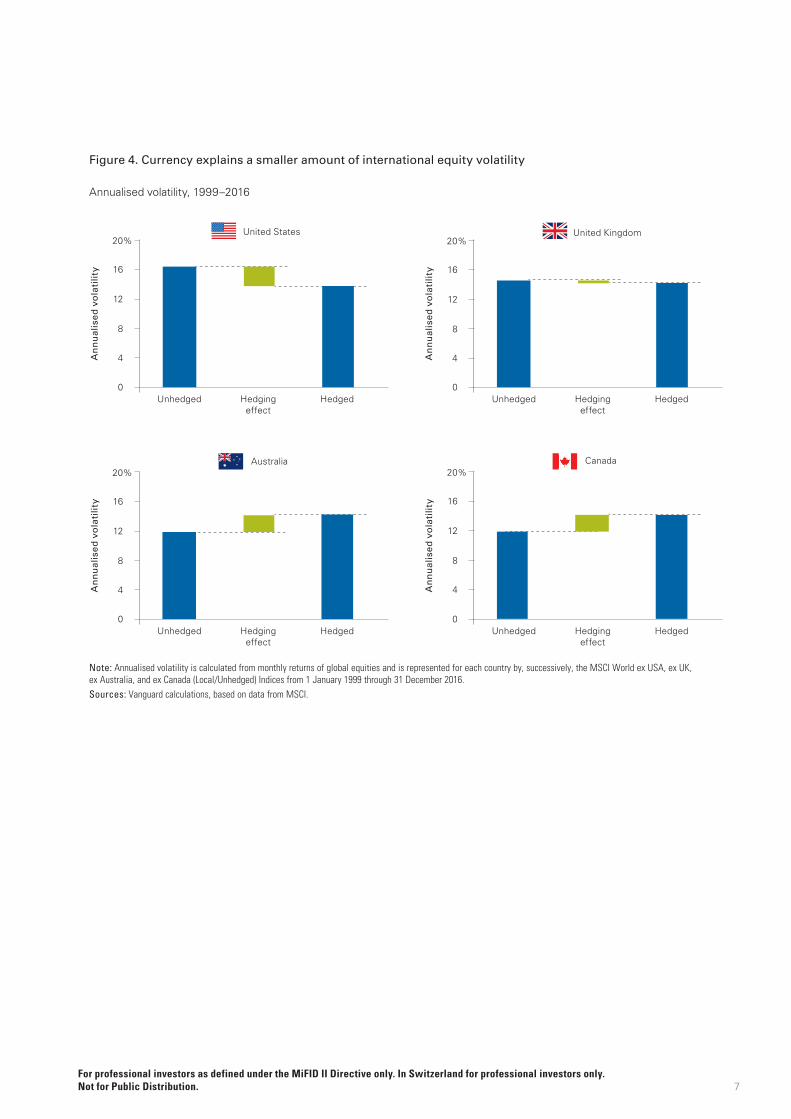
Currency volatility can be a major driver of risk for fixed income return volatility, but it plays less of a role for international equities (Philips et al., 2012). Figure 4 illustrates the annualised volatility of unhedged international equities and the currency hedging impact (green bars). In all regions, the hedging effect is relatively marginal and sometimes removes volatility.
Hedging at times may actually lead to higher volatility — note the slightly higher risk for Australian and Canadian investors over the period studied. The decision to hedge or not is driven by the relationship between the currency and the underlying asset — in other words, the equity–currency correlation (as well as other variables we discuss on page 8). For the countries we analysed, the equity–currency correlation has been dynamic and varied through time. Depending on the investor’s home market, there have been periods historically when hedging one’s international equity increased volatility (positive correlation) and times when doing so reduced volatility (negative correlation).
Portfolio-level hedging: Asset blocks drive the portfolio result
If you follow the asset-class hedging decisions, then the portfolio result is logical.
A portfolio with a large bond exposure is driven by investor preference for low volatility. The large bond allocation would be in local currency terms, from owning either domestic bonds or hedged international bonds. Only the portion of the equity portfolio that is invested internationally has currency exposure. Should that be hedged? Perhaps yes, as the investor wants to minimise volatility, but perhaps no, as the impact is small. It’s also worth noting that a small allocation to other currencies may provide some protection from tail risks — a currency, economic, or military crisis — not captured in the historical data.
On the other hand, a portfolio with large equity exposures should belong to an investor comfortable with volatility. A large international equity position has sizable currency risk. The long-term investor may accept the volatility that currency brings, as short-term currency fluctuations matter little over the long haul. Investors sensitive to shorter-term volatility may prefer to carry less currency exposure and to hedge it, perhaps partially. Executing the hedging strategy does have an associated cost and risks, so a reduction in short-term volatility should be weighed against diminished return. This matters more with equities, as the degree of gain is far less, as Figure 4 illustrates.
6For professional investors as defined under the MiFID II Directive only. In Switzerland for professional investors only. Not for Public Distribution.
7
Figure 4. Currency explains a smaller amount of international equity volatility
Annualised volatility, 1999–2016
Note: Annualised volatility is calculated from monthly returns of global equities and is represented for each country by, successively, the MSCI World ex USA, ex UK, ex Australia, and ex Canada (Local/Unhedged) Indices from 1 January 1999 through 31 December 2016. Sources: Vanguard calculations, based on data from MSCI.
1p
5th
95th
Percentileskey:
75th
25th
Median
5th
95th
Percentileskey:
75th
25th
Median
–6
–3
0
3
6
9
12
15%
Top Bottom
Axi
s la
bel
if n
eed
ed
Axis label if needed
-6%
-3%
0%
3%
6%
9%
12%
15%
Legend 1Legend 2
United Kingdom
Australia Canada
United States
An
nu
alis
ed v
ola
tilit
y
0HedgedUnhedged Hedging
effect
An
nu
alis
ed v
ola
tilit
y
0HedgedUnhedged Hedging
effect
An
nu
alis
ed v
ola
tilit
y
0HedgedUnhedged Hedging
effect
An
nu
alis
ed v
ola
tilit
y
0HedgedUnhedged Hedging
effect
4
16
12
8
20%
4
16
12
8
20%
4
16
12
8
20%
4
16
12
8
20%
For professional investors as defined under the MiFID II Directive only. In Switzerland for professional investors only. Not for Public Distribution.
3 Vanguard home-bias assumptions reflect the percentage allocated to domestic securities within Vanguard’s portfolios, by country.
8
Analysis: Portfolio currency exposure and hedging considerations
A more conservative fixed income-dominated mix reduces currency exposure
Based on our aforementioned positions on international bonds and equities, investors’ decisions to hedge will depend on their strategic asset allocation (assuming a portfolio of equities and fixed income only). As an example, let’s consider two common types of balanced funds: target-date funds and static asset allocation funds.
A target-date investor’s glide path represents the strategic allocation to equities — an allocation that declines over time as the investor prepares for retirement. For a static asset allocation investor, whose risk tolerance may range from aggressive to conservative, the equity allocation will also range from high (aggressive) to low (conservative).
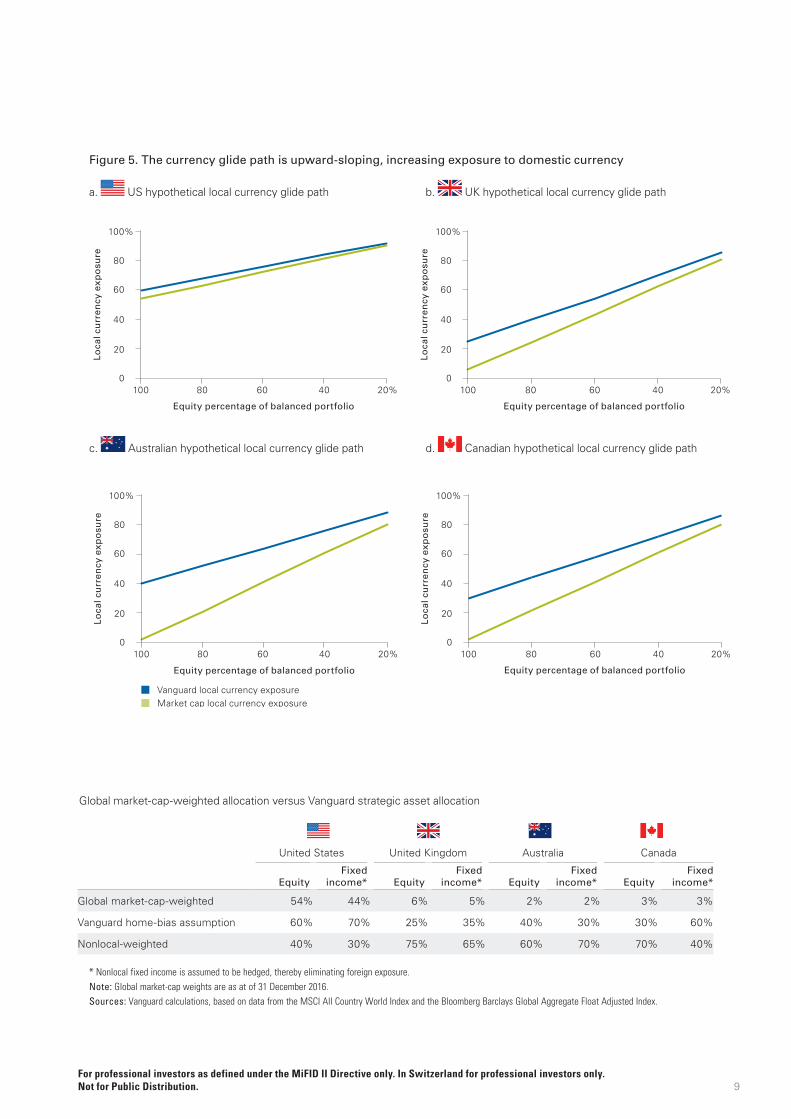
The portfolio of either a target-date investor or a static allocation investor with a position in international equities is mapped to a currency glide path. Figure 5 illustrates this point. We constructed two hypothetical portfolios for each country, highlighting the percentage of local currency exposure for a given allocation to equity. Based on Vanguard’s home-bias assumptions (shown in blue) and a market-cap-weighted local exposure (shown in green), the local currency glide path is the inverse of a retirement glide path, as it is upward-sloping.3
As an investor prepares for retirement or becomes more conservative (with equities declining in either case), the foreign currency exposure shrinks and the proportion in the investor’s local currency increases. This holds true whether an investor has a home bias or holds the local currency’s market cap; the only difference between those is the slope of the currency glide path. Nonethe-less, the total portfolio currency exposure becomes minimal as investors move toward retirement or become more conservative.
Dynamic portfolios: A shifting strategic asset allocation, from one extreme to the other
The portfolio currency-hedging position is defined by the asset-class character and related investor risk preferences. A sizable equity position may largely be fine with currency exposure (unhedged), whereas a portfolio with sizable bond positions would prefer little (hedged). Put this logic into portfolios with a dynamic asset mix, such as a target-date fund, and the transition from less hedging to more hedging becomes clear and mechanical. This will vary by country, and there are several other variables to consider.
Variables affecting the currency-hedging decision
What’s described above is a simplified approach to the currency-hedging decision. Although “hedge fixed income and not equities” is a good starting place, we discuss below several factors that influence the outcome.
Structural variables
These variables arise from the statistics of portfolio volatility or from market structure. In both frames, we think of currency as an additional asset (and source of risk) for the portfolio. We can rewrite the portfolio variance formula to separate the statistical properties of currency exposure:
s2r= w 2
assets2asset+w2
FX s2FX+2wassetwFXsassetsFXrasset,FX
Volatility (rasset
s2FX ). The local currency has its own degree
of volatility, so its impact on the overall variance of the asset class depends on the relative volatility. For fixed income, currency is much more volatile, meaning it disrupts the character of bonds and hence the portfolio’s design. If left unhedged, currency effectively transforms fixed income investing to currency bets (Philips et al., 2012). Generally, the relative volatility of currency to fixed income is the most important factor when determining whether to hedge international fixed income.
For professional investors as defined under the MiFID II Directive only. In Switzerland for professional investors only. Not for Public Distribution.
9
Figure 5. The currency glide path is upward-sloping, increasing exposure to domestic currency
a. US hypothetical local currency glide path b. UK hypothetical local currency glide path
c. Australian hypothetical local currency glide path d. Canadian hypothetical local currency glide path
* Nonlocal fixed income is assumed to be hedged, thereby eliminating foreign exposure.Note: Global market-cap weights are as at of 31 December 2016.Sources: Vanguard calculations, based on data from the MSCI All Country World Index and the Bloomberg Barclays Global Aggregate Float Adjusted Index.
Vanguard local currency exposureMarket cap local currency exposure
0
20
40
60
80
100
0
20
40
60
80
100
0
20
40
60
80
100
0
20
40
60
80
100
United States United Kingdom Austraila Canada
Loca
l cu
rren
cy e
xpo
sure
0
20
40
60
80
100%
100 80 60 40 20%
Loca
l cu
rren
cy e
xpo
sure
0
20
40
60
80
100%
100
Loca
l cu
rren
cy e
xpo
sure
0
20
40
60
80
100%
100
Loca
l cu
rren
cy e
xpo
sure
0
20
40
60
80
100%
100 80 60 40 20%80 60 40 20%
80 60 40 20%
Equity percentage of balanced portfolio Equity percentage of balanced portfolio
Equity percentage of balanced portfolioEquity percentage of balanced portfolio
Global market-cap-weighted allocation versus Vanguard strategic asset allocation
United States United Kingdom Australia Canada
EquityFixed
income* EquityFixed
income* EquityFixed
income* EquityFixed
income*
Global market-cap-weighted 54% 44% 6% 5% 2% 2% 3% 3%
Vanguard home-bias assumption 60% 70% 25% 35% 40% 30% 30% 60%
Nonlocal-weighted 40% 30% 75% 65% 60% 70% 70% 40%
For professional investors as defined under the MiFID II Directive only. In Switzerland for professional investors only. Not for Public Distribution.

Correlation (rasset,FX). The correlation between the international exposure and local currency determines whether we call the currency risk-on or risk-off. If the correlation is positive, then the local currency generally adds to overall volatility. Hedging to local currency would add volatility, so it’s best not to do so. The inverse is true if the correlation is negative: Hedging to local currency reduces volatility. Armed with a reliable estimate of the correlation, an investor could make a strategic decision to hedge or not hedge equities.
Instability. If the volatility and correlation terms discussed above were stable, then whether to hedge away the currency risk would be a straightforward, one-time policy decision. However, both the underlying volatility and the correlation between currency and the portfolio will drift over time, making it difficult to assess the value of hedging. The correlation also introduces the chance that the portfolio is “wrong” for periods of time. As an input into the decision, prudent investors would be well-served to consider how stable the equity–currency correlation is. This drift determines the risk-and-return characteristics, and more important, offers a glimpse into the costs of being “wrong” if economic conditions stray from market expectations.
Local market size. If market capitalisation is the starting point for a portfolio, then smaller-market-cap countries (virtually all those outside the United States) face large currency exposures when an investor holds a global market-cap portfolio.
Investors in Canada, Australia or the United Kingdom will have greater foreign currency exposure at any asset allocation, so home bias and currency hedging are naturally two ways that investors building diversified portfolios think of balancing currency against other objectives.
Liquidity and operations. Awareness of these variables is key. Liquidity is normally plentiful, as currency is the most traded commodity in global markets. In times of crisis or even elevated uncertainty, however, a group of currencies may be under pressure—especially if global interest rates are moving materially. In extreme cases, currencies could face a run, but more often, currencies could be swayed by economic, monetary or political surprises and may become harder to trade efficiently at a given spread.
Currency hedging adds another layer to portfolio management — and thus another potential source of human error. Managing liquidity risk, counterparty risk, and even simple execution risk must be considered as costs when assessing the prudence of a hedging strategy.
Cost. As the gains from hedging are more on the risk-control side (currency exposure should have no intrinsic return), the return impact may be of less consequence to the decision. That said, hedging currency risk is not free. Simply, the higher the cost, the less attractive hedging may be. Hedging strategies often involve derivative instruments (forwards, futures, swaps and options), which all have bid–ask spreads driven by short-term market conditions, other transaction costs, and additional operational risks that must be managed effectively. Any currency hedging should be thought of as a toll or fare that routinely comes due (for example, hedging costs have a monthly cadence if portfolio managers use derivatives with a one-month time to maturity). Today, most hedging costs amount to a handful of basis points, but keep an eye on the fee for the service: currency hedging in less-liquid currencies (primarily, emerging markets) can become prohibitively expensive or erode any volatility benefit.
10
Should currency exposure also be diversified to manage portfolio risk?
Although hedging sounds like a risk-reduction strategy, it could be that owning only local currency exposure is undesirable. Consider that a local currency crisis arises; if all your assets are hedged to that currency, the crisis could significantly affect your portfolio. But this is a tail-risk situation (tails being the ends of the expected return distribution, which are often abnormally large) that is difficult to model, yet we recognise that fat tails do exist in the investment field. To mitigate this “known unknown”, it can be wise to maintain some currency diversification in a portfolio. Hedging currency does not absolve a portfolio of currency risk.
For professional investors as defined under the MiFID II Directive only. In Switzerland for professional investors only. Not for Public Distribution.

Behavioural variables
Discipline. When a portfolio includes a hedging strategy, it represents another variable open to active management. Previous Vanguard research has shown how investors often default to the “past-performance heuristic” — performance-chasing — and the corrosive effects it can have on a portfolio’s long-term performance (Kinniry et al., 2016). Currencies should be treated as random walks, meaning that past performance offers no information about future performance.
Figure 6 highlights the historical performance difference between a hedged and an unhedged portfolio on a one-year basis. The jaggedness of the line, rising as high as 20% and as low as –50%, demonstrates the volatility of the currency impact. This volatile nature tempts some investors to try timing currency positions — a decision that, like most decisions based on forecasts, is a difficult one.
Local market preference and practice
The principles of strategic investing transcend borders, yet each market has its own view on risk and return and hence its own ideas on best practices for building
portfolios. Sometimes these habits result from prudent investor guidance; significant consequences can result from being too different from peers if all investors are following this framework. Local market preferences are an important variable in the currency-hedging decision; they may be less easy to quantify as savings in transaction costs or volatility, but their impact (the end-investors’ behaviour) will quickly be seen if overlooked in the portfolio construction process.
Small market size often introduces the subject of home bias. The degree of home bias affects the level of currency exposure that investors choose to carry. Increasing (overweighting) exposure to domestic securities comes at the price of diminished divers-ification; in our framework, setting home bias — like setting the overall asset allocation — is independent of the resulting currency exposure.
Given our assumption that currency’s return in the long run approaches zero, we do not suggest that investors use home bias solely to achieve their desired currency exposure. Over longer horizons, the reduced divers-ification effects will overwhelm currency-driven effects by several orders of magnitude.
11
Figure 6. Currency has a large impact on equity returns and may tempt investors to time its exposure
One-year trailing annualised return difference between hedged and unhedged equity
Past performance is not a reliable indicator of future results.Notes: The one-year historical performance difference is based on MSCI World ex USA Hedged Index (local) and MSCI World ex USA Index returns. Data cover 31 December 1969 through 31 July 2017.Source: Vanguard calculations, based on data from MSCI.
Notes: dot size = p4
to change size: select same appearance; go to effect > convert to shape > ellipse > absolute
0%
20%
40%
60%
80%
100%
-6 -4 -2 0 2 4 6
-15
-10
-5
0
5
10
15
0%
100%
200%
300%
400%
500%
2012201120102009200820072006200520042003
1p
5th
95th
Percentileskey:
75th
25th
Median
5th
95th
Percentileskey:
75th
25th
Median
–6
–3
0
3
6
9
12
15%
Top Bottom
Axi
s la
bel
if n
eed
ed
Axis label if needed
-6%
-3%
0%
3%
6%
9%
12%
15%
0.0
0.1
0.2
0.3
0.4
0.5
0.6
0.7
0.8
0.0
0.1
0.2
0.3
0.4
0.5
0.6
0.7
0.8
On
e-y
ear
trai
ling
ret
urn
dif
fere
nce
–50
–25
0
25%
1980 19851975 1990 1995 2000 2005 2010 20151970
For professional investors as defined under the MiFID II Directive only. In Switzerland for professional investors only. Not for Public Distribution.

Country analysis
Given our principles, we examine more closely in this section the stability of the equity–currency correlation, the historical relative performance of unhedged/hedged international equity, and the magnitude of volatility reduction of hedging within a balanced portfolio as an investor increases international equity exposure to market weight.4
United States
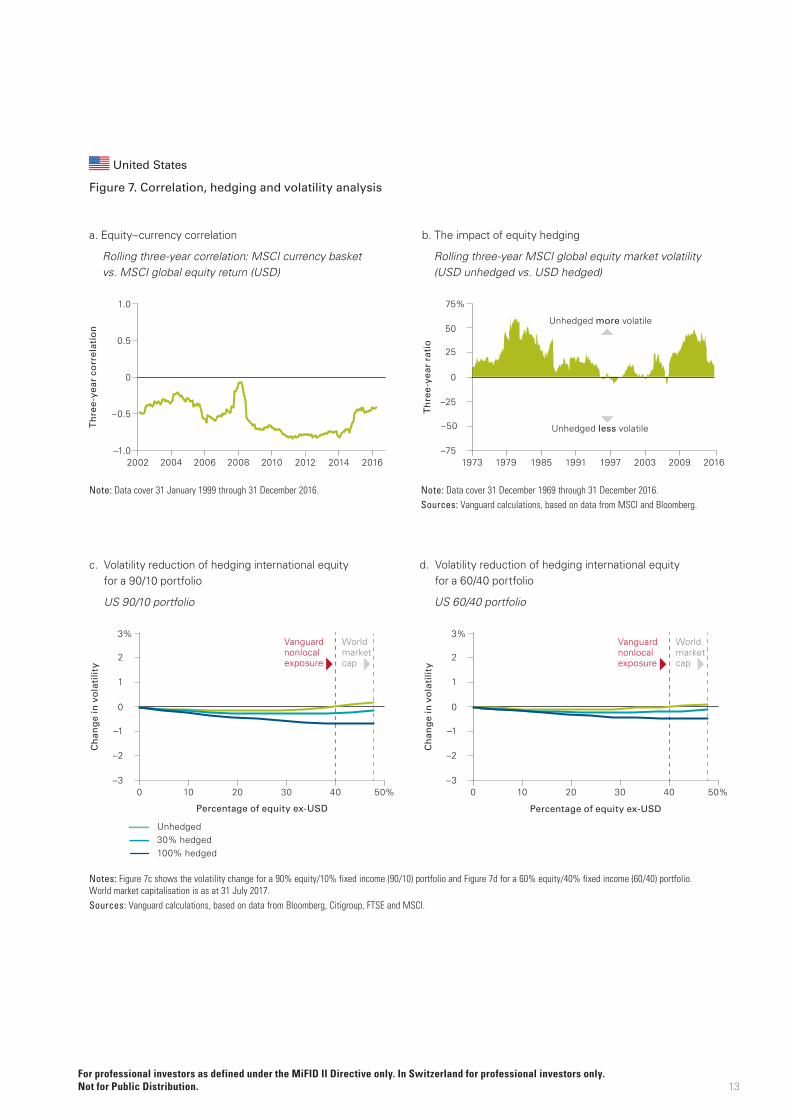
Figure 7a shows the rolling equity–currency correlation between the MSCI currency basket and the MSCI World ex USA Index (measured in US dollars). Over the period shown, the equity–currency correlation was negative, suggesting a diversification benefit to equity hedging.5
The relative historical performance of unhedged and hedged international equity supports the equity–USD correlation observation. Figure 7b represents the relative market volatility between the unhedged and hedged global equity index (excluding USD). If the market volatility was higher than zero, leaving an international equity portfolio unhedged would have resulted in higher volatility. For a US investor, hedging the international equity portfolio over this period would have resulted in lower volatility.
This analytical approach suggests that, all else being equal, the US investor should hedge the international equity position. As we discussed in the “Variables affecting the currency-hedging decision” section on page 8, a number of other factors that can alter that view are not included in the hard numbers. For instance, a long-term investor may be indifferent to short-term volatility, and the magnitude of the gain may be limited. Further-more, the impacts of several variables, often difficult to quantify, influence the investor decision. These include the fact that the period studied may not be prologue,
the risk of large concentrations in a single currency, the costs and risks of executing a hedging programme, the investor behavioural risks of another investment choice, and the performance volatility that hedging can bring compared with local practice and benchmarking.
As we noted earlier, the asset-level decision drives the portfolio result. Figure 7c shows the volatility change for a 90% equity/10% fixed income (90/10) portfolio, and Figure 7d shows that for a 60% equity/40% fixed income (60/40) portfolio. For both portfolios, as investors increase their exposure to international equity (moving toward global market cap), volatility decreases if their international equity position in the portfolio is 100% hedged.
But the next question for an investor should be the magnitude of the volatility reduction. Putting the potential portfolio result in terms of that magnitude is an important exercise. Under both a 90/10 and a 60/40 portfolio, we see the most benefit between a 100% hedged and 100% unhedged portfolio. Given the high equity allocation, however, the overall benefit of volatility reduction from hedging appears to be marginal. For instance, a 60/40 portfolio with a 30% hedge has 18 basis points less volatility than an unhedged portfolio at the Vanguard home-bias position. (A basis point is one one-hundredth of a percentage point.)
A US investor has a unique circumstance as well. The US dollar represents approximately 50% of all equity and fixed income issuance, and depending on the strategic asset allocation, a majority of a US investor’s exposure may already be held in one currency. A US investor therefore must weigh the potential volatility reduction with the structural and behavioural variables (including US dollar market representation) that can also influence the portfolio-hedging decision.
12
4 We review the effects of hedging international equity exposure only, for two main reasons: to isolate the effects of hedging international equity on volatility reduction and to acknowledge that hedging fixed income reduces volatility.
5 The MSCI currency basket in USD comprises the six largest currencies that make up the MSCI World ex USA Index in proportion to their index weights. The currencies are the euro, Japanese yen, British pound, Canadian dollar, Swiss franc and Australian dollar.
For professional investors as defined under the MiFID II Directive only. In Switzerland for professional investors only. Not for Public Distribution.
13
United States
Figure 7. Correlation, hedging and volatility analysis
Note: Data cover 31 January 1999 through 31 December 2016. Note: Data cover 31 December 1969 through 31 December 2016.Sources: Vanguard calculations, based on data from MSCI and Bloomberg.
Notes: dot size = p4
to change size: select same appearance; go to effect > convert to shape > ellipse > absolute
0%
20%
40%
60%
80%
100%
-6 -4 -2 0 2 4 6
-15
-10
-5
0
5
10
15
0%
100%
200%
300%
400%
500%
2012201120102009200820072006200520042003
1p
5th
95th
Percentileskey:
75th
25th
Median
5th
95th
Percentileskey:
75th
25th
Median
–6
–3
0
3
6
9
12
15%
Top Bottom
Axi
s la
bel
if n
eed
ed
Axis label if needed
-6%
-3%
0%
3%
6%
9%
12%
15%
0.0
0.1
0.2
0.3
0.4
0.5
0.6
0.7
0.8
-1.0
-0.5
0.0
0.5
-1.0
-0.5
0.0
0.5
1.0
0.0
0.1
0.2
0.3
0.4
0.5
0.6
0.7
0.8
Th
ree
-yea
r co
rrel
atio
n
–1.0
–0.5
0
0.5
1.0
2006 2010 2012 2014 20162002 2004 2008
Unhedged more volatile
Unhedged less volatileT
hre
e-y
ear
rati
o
–75
–50
–25
0
50
25
75%
1979 20161973 1985 1991 1997 2003 2009
Notes: dot size = p4
to change size: select same appearance; go to effect > convert to shape > ellipse > absolute
0%
20%
40%
60%
80%
100%
-6 -4 -2 0 2 4 6
-15
-10
-5
0
5
10
15
0%
100%
200%
300%
400%
500%
2012201120102009200820072006200520042003
1p
5th
95th
Percentileskey:
75th
25th
Median
5th
95th
Percentileskey:
75th
25th
Median
–6
–3
0
3
6
9
12
15%
Top Bottom
Axi
s la
bel
if n
eed
ed
Axis label if needed
-6%
-3%
0%
3%
6%
9%
12%
15%
!"#$$%
!$#&$%
$#$$%
$#&$%
"#$$%
"'($"
()*%
"'($"
()+%
"'($"
())%
"'($"
(),%
"'($"
(,$%
!"##$%&'(')*+,'-",,*#+."%'/'0123'24,,*%-)'5+67*8'96'0123':#"5+#'
Vanguard nonlocal exposure
World market cap
Vanguard nonlocal exposure
World market cap
Unhedged30% hedged100% hedged
Ch
ang
e in
vo
lati
lity
–3
–1
–2
0
1
2
3%
0 10 20 30 40 50%
Ch
ang
e in
vo
lati
lity
–3
–1
–2
0
1
2
3%
0 10 20 30 40 50%
US - 90/10 Portfolio
Percentage of equity ex-USD Percentage of equity ex-USD
Notes: Figure 7c shows the volatility change for a 90% equity/10% fixed income (90/10) portfolio and Figure 7d for a 60% equity/40% fixed income (60/40) portfolio. World market capitalisation is as at 31 July 2017.Sources: Vanguard calculations, based on data from Bloomberg, Citigroup, FTSE and MSCI.
b. The impact of equity hedging
Rolling three-year MSCI global equity market volatility (USD unhedged vs. USD hedged)
a. Equity–currency correlation
Rolling three-year correlation: MSCI currency basket vs. MSCI global equity return (USD)
d. Volatility reduction of hedging international equity for a 60/40 portfolio
US 60/40 portfolio
c. Volatility reduction of hedging international equity for a 90/10 portfolio
US 90/10 portfolio
For professional investors as defined under the MiFID II Directive only. In Switzerland for professional investors only. Not for Public Distribution.
United Kingdom
Figure 8a shows the rolling equity–currency correlation between the MSCI currency basket and the MSCI World ex UK Index (measured in pound sterling). Over the period shown, the equity–currency correlation was negative, suggesting a diversification benefit to equity hedging.6
The relative historical performance of unhedged and hedged international equity supports the equity–currency correlation observation. Figure 8b represents the relative market volatility between an unhedged and hedged global equity index (excluding GBP). If the relative market volatility was higher than zero, leaving an international equity portfolio unhedged would have resulted in higher volatility. For a GBP investor, hedging the international equity portfolio over this period would have resulted in lower volatility. It is important to highlight that this
relationship was not stable; there were interim periods when leaving international equity unhedged resulted in lower volatility.
As we noted earlier, the asset-level decision drives the portfolio result. Figure 8c shows the volatility change for a 90/10 portfolio, and Figure 8d shows it for a 60/40 portfolio. For both portfolios, as an investor increases international equity (moving toward world market cap), the magnitude of the volatility reduction appears to be marginal, with a slight increase in volatility as an investor moves nearer to international equity (excluding GBP) market weight.7 Although this benefit is only from a historical perspective, investors must weigh the potential volatility reduction with the structural and behavioural variables that can also influence the portfolio-hedging decision.
14
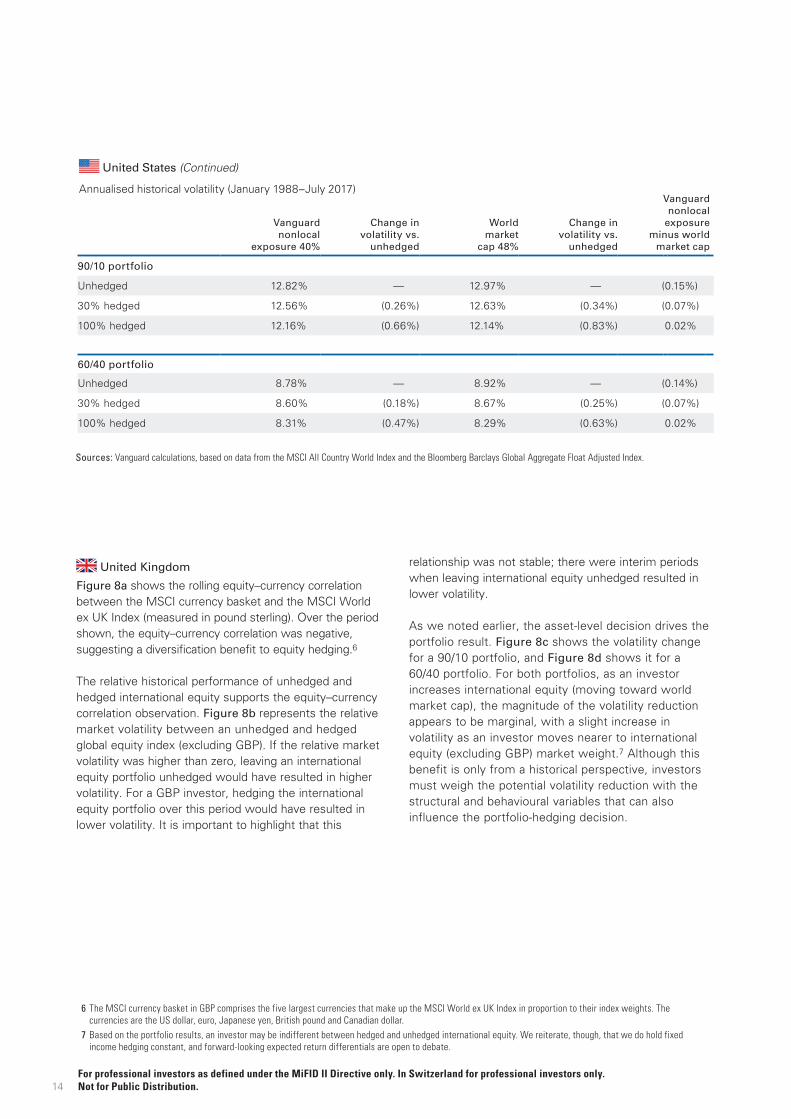
United States (Continued)
Annualised historical volatility (January 1988–July 2017)
Vanguard nonlocal
exposure 40%
Change in volatility vs.
unhedged
World market
cap 48%
Change in volatility vs.
unhedged
Vanguard nonlocal
exposure minus world
market cap
90/10 portfolio
Unhedged 12.82% — 12.97% — (0.15%)
30% hedged 12.56% (0.26%) 12.63% (0.34%) (0.07%)
100% hedged 12.16% (0.66%) 12.14% (0.83%) 0.02%
60/40 portfolio
Unhedged 8.78% — 8.92% — (0.14%)
30% hedged 8.60% (0.18%) 8.67% (0.25%) (0.07%)
100% hedged 8.31% (0.47%) 8.29% (0.63%) 0.02%
6 The MSCI currency basket in GBP comprises the five largest currencies that make up the MSCI World ex UK Index in proportion to their index weights. The currencies are the US dollar, euro, Japanese yen, British pound and Canadian dollar.
7 Based on the portfolio results, an investor may be indifferent between hedged and unhedged international equity. We reiterate, though, that we do hold fixed income hedging constant, and forward-looking expected return differentials are open to debate.
For professional investors as defined under the MiFID II Directive only. In Switzerland for professional investors only. Not for Public Distribution.
Sources: Vanguard calculations, based on data from the MSCI All Country World Index and the Bloomberg Barclays Global Aggregate Float Adjusted Index.

15
United Kingdom
Figure 8. Correlation, hedging and volatility analysis
Note: Data cover 31 December 1983 through 31 December 2016. Note: Data cover 31 December 1969, through 31 December 2016.Sources: Vanguard calculations, based on data from MSCI and Bloomberg.
Notes: dot size = p4
to change size: select same appearance; go to effect > convert to shape > ellipse > absolute
0%
20%
40%
60%
80%
100%
-6 -4 -2 0 2 4 6
-15
-10
-5
0
5
10
15
0%
100%
200%
300%
400%
500%
2012201120102009200820072006200520042003
1p
5th
95th
Percentileskey:
75th
25th
Median
5th
95th
Percentileskey:
75th
25th
Median
–6
–3
0
3
6
9
12
15%
Top Bottom
Axi
s la
bel
if n
eed
ed
Axis label if needed
-6%
-3%
0%
3%
6%
9%
12%
15%
0.0
0.1
0.2
0.3
0.4
0.5
0.6
0.7
0.8
-1.0
-0.5
0.0
0.5
-1.0
-0.5
0.0
0.5
1.0
0.0
0.1
0.2
0.3
0.4
0.5
0.6
0.7
0.8
Th
ree
-yea
r co
rrel
atio
n
–1.0
–0.5
0
0.5
1.0
1991 1996 2001 2006 2011 20161986
Th
ree
-yea
r ra
tio
–250
–150
–50
0
150
50
250%
1997 2003 2009 20161973 1997 1985 1991
Unhedged more volatile
Unhedged less volatile
Notes: dot size = p4
to change size: select same appearance; go to effect > convert to shape > ellipse > absolute
0%
20%
40%
60%
80%
100%
-6 -4 -2 0 2 4 6
-15
-10
-5
0
5
10
15
0%
100%
200%
300%
400%
500%
2012201120102009200820072006200520042003
1p
5th
95th
Percentileskey:
75th
25th
Median
5th
95th
Percentileskey:
75th
25th
Median
–6
–3
0
3
6
9
12
15%
Top Bottom
Axi
s la
bel
if n
eed
ed
Axis label if needed
-6%
-3%
0%
3%
6%
9%
12%
15%
!"#$$%
!$#&$%
$#$$%
$#&$%
"#$$%
"'($"
()*%
"'($"
()+%
"'($"
())%
"'($"
(),%
"'($"
(,$%
!"##$%&'(')*+,'-",,*#+."%'/'0123'24,,*%-)'5+67*8'96'0123':#"5+#'
Unhedged30% hedged100% hedged
Percentage of equity ex-GBP Percentage of equity ex-GBP
Ch
ang
e in
vo
lati
lity
–3
–1
–2 –2
0
1
2 2
3%
Ch
ang
e in
vo
lati
lity
–3
–1
0
1
3%
UK - 90/10 Portfolio UK - 60/40 Portfolio
0 20 40 60 80 100% 0 20 40 60 80 100%
Vanguard nonlocal exposure
World market cap
Vanguard nonlocal exposure
World market cap
Notes: Figure 8c shows the volatility change for a 90% equity/10% fixed income (90/10) portfolio and Figure 8d for a 60% equity/40% fixed income (60/40) portfolio. World market capitalisation is as at 31 July 2017.Sources: Vanguard calculations, based on data from Bloomberg, Citigroup, FTSE and MSCI.
b. The impact of equity hedging
Rolling three-year MSCI global equity market volatility (GBP unhedged vs. GBP hedged)
a. Equity–currency correlation
Rolling three-year correlation: MSCI currency basket vs. MSCI global equity return (GBP)
d. Volatility reduction of hedging international equity for a 60/40 portfolio
UK 60/40 portfolio
c. Volatility reduction of hedging international equity for a 90/10 portfolio
UK 90/10 portfolio
For professional investors as defined under the MiFID II Directive only. In Switzerland for professional investors only. Not for Public Distribution.
16
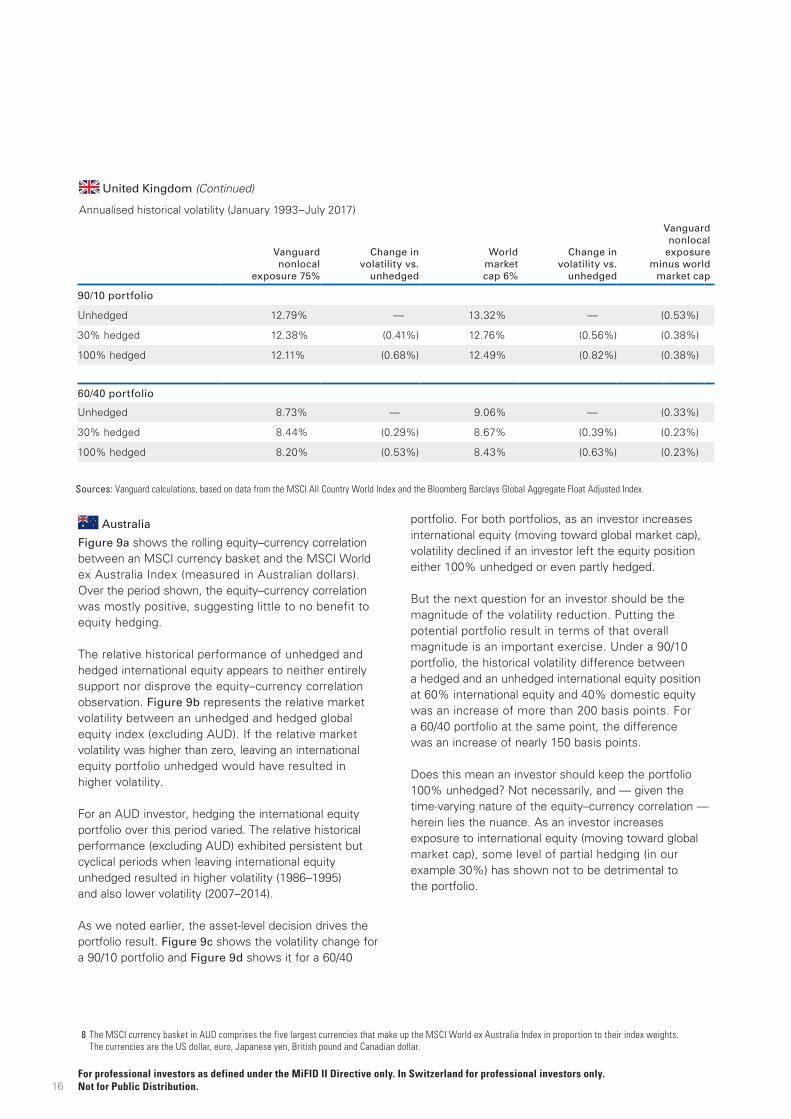
Australia
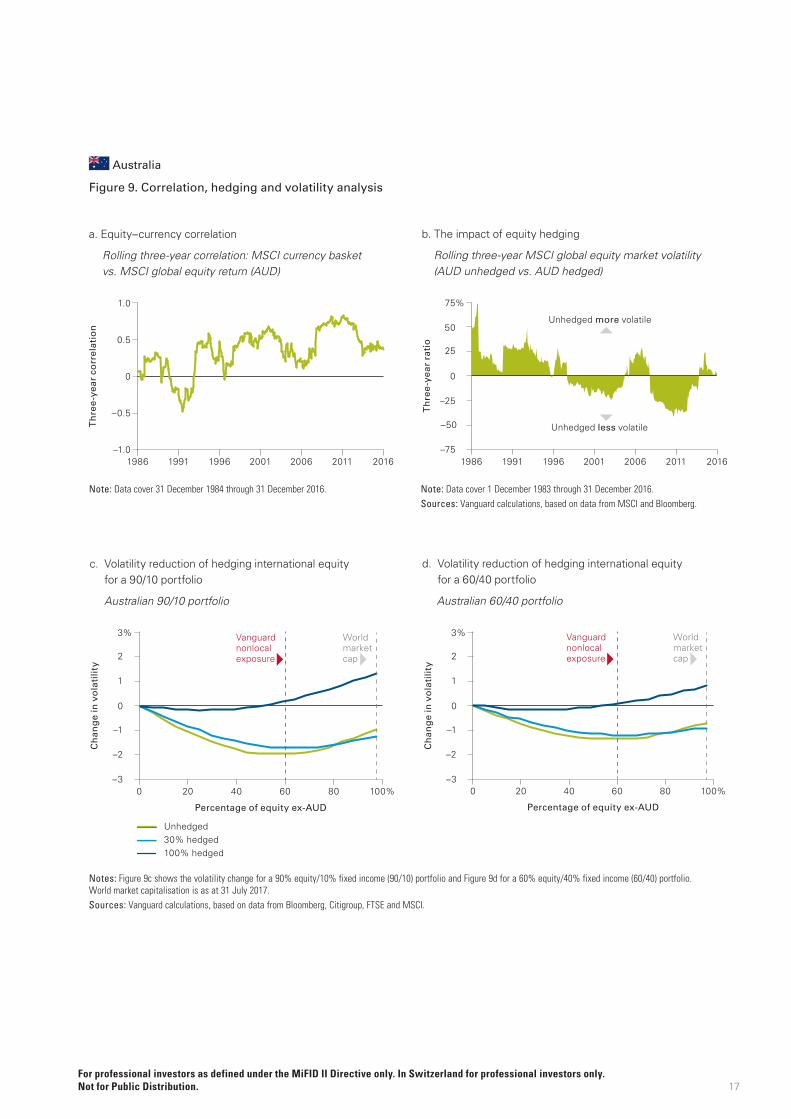
Figure 9a shows the rolling equity–currency correlation between an MSCI currency basket and the MSCI World ex Australia Index (measured in Australian dollars). Over the period shown, the equity–currency correlation was mostly positive, suggesting little to no benefit to equity hedging.
The relative historical performance of unhedged and hedged international equity appears to neither entirely support nor disprove the equity–currency correlation observation. Figure 9b represents the relative market volatility between an unhedged and hedged global equity index (excluding AUD). If the relative market volatility was higher than zero, leaving an international equity portfolio unhedged would have resulted in higher volatility.
For an AUD investor, hedging the international equity portfolio over this period varied. The relative historical performance (excluding AUD) exhibited persistent but cyclical periods when leaving international equity unhedged resulted in higher volatility (1986–1995) and also lower volatility (2007–2014).
As we noted earlier, the asset-level decision drives the portfolio result. Figure 9c shows the volatility change for a 90/10 portfolio and Figure 9d shows it for a 60/40
portfolio. For both portfolios, as an investor increases international equity (moving toward global market cap), volatility declined if an investor left the equity position either 100% unhedged or even partly hedged.
But the next question for an investor should be the magnitude of the volatility reduction. Putting the potential portfolio result in terms of that overall magnitude is an important exercise. Under a 90/10 portfolio, the historical volatility difference between a hedged and an unhedged international equity position at 60% international equity and 40% domestic equity was an increase of more than 200 basis points. For a 60/40 portfolio at the same point, the difference was an increase of nearly 150 basis points.
Does this mean an investor should keep the portfolio 100% unhedged? Not necessarily, and — given the time-varying nature of the equity–currency correlation — herein lies the nuance. As an investor increases exposure to international equity (moving toward global market cap), some level of partial hedging (in our example 30%) has shown not to be detrimental to the portfolio.
United Kingdom (Continued)
Annualised historical volatility (January 1993–July 2017)
Vanguard nonlocal
exposure 75%
Change in volatility vs.
unhedged
World market cap 6%
Change in volatility vs.
unhedged
Vanguard nonlocal
exposure minus world
market cap
90/10 portfolio
Unhedged 12.79% — 13.32% — (0.53%)
30% hedged 12.38% (0.41%) 12.76% (0.56%) (0.38%)
100% hedged 12.11% (0.68%) 12.49% (0.82%) (0.38%)
60/40 portfolio
Unhedged 8.73% — 9.06% — (0.33%)
30% hedged 8.44% (0.29%) 8.67% (0.39%) (0.23%)
100% hedged 8.20% (0.53%) 8.43% (0.63%) (0.23%)
8 The MSCI currency basket in AUD comprises the five largest currencies that make up the MSCI World ex Australia Index in proportion to their index weights. The currencies are the US dollar, euro, Japanese yen, British pound and Canadian dollar.
For professional investors as defined under the MiFID II Directive only. In Switzerland for professional investors only. Not for Public Distribution.
Sources: Vanguard calculations, based on data from the MSCI All Country World Index and the Bloomberg Barclays Global Aggregate Float Adjusted Index.
17
Australia
Figure 9. Correlation, hedging and volatility analysis
Note: Data cover 31 December 1984 through 31 December 2016. Note: Data cover 1 December 1983 through 31 December 2016.Sources: Vanguard calculations, based on data from MSCI and Bloomberg.
Th
ree
-yea
r co
rrel
atio
n
–1.0
–0.5
0
0.5
1.0
1991 1996 2001 2006 2011 20161986
Th
ree
-yea
r ra
tio
–75
–50
–25
0
50
25
75%
1991 1996 2001 2006 2011 20161986
Notes: dot size = p4
to change size: select same appearance; go to effect > convert to shape > ellipse > absolute
0%
20%
40%
60%
80%
100%
-6 -4 -2 0 2 4 6
-15
-10
-5
0
5
10
15
0%
100%
200%
300%
400%
500%
2012201120102009200820072006200520042003
1p
5th
95th
Percentileskey:
75th
25th
Median
5th
95th
Percentileskey:
75th
25th
Median
–6
–3
0
3
6
9
12
15%
Top Bottom
Axi
s la
bel
if n
eed
ed
Axis label if needed
-6%
-3%
0%
3%
6%
9%
12%
15%
0.0
0.1
0.2
0.3
0.4
0.5
0.6
0.7
0.8
Unhedged more volatile
Unhedged less volatile
-1.0
-0.5
0.0
0.5
-1.0
-0.5
0.0
0.5
1.0
0.0
0.1
0.2
0.3
0.4
0.5
0.6
0.7
0.8
Notes: dot size = p4
to change size: select same appearance; go to effect > convert to shape > ellipse > absolute
0%
20%
40%
60%
80%
100%
-6 -4 -2 0 2 4 6
-15
-10
-5
0
5
10
15
0%
100%
200%
300%
400%
500%
2012201120102009200820072006200520042003
1p
5th
95th
Percentileskey:
75th
25th
Median
5th
95th
Percentileskey:
75th
25th
Median
–6
–3
0
3
6
9
12
15%
Top Bottom
Axi
s la
bel
if n
eed
ed
Axis label if needed
-6%
-3%
0%
3%
6%
9%
12%
15%
AUS - 90/10 Portfolio AUS - 60/40 Portfolio
!"#$$%
!$#&$%
$#$$%
$#&$%
"#$$%
"'($"
()*%
"'($"
()+%
"'($"
())%
"'($"
(),%
"'($"
(,$%
!"##$%&'(')*+,'-",,*#+."%'/'0123'24,,*%-)'5+67*8'96'0123':#"5+#'
Ch
ang
e in
vo
lati
lity
–3
–1
–2
0
1
2
3%
Ch
ang
e in
vo
lati
lity
–3
–1
–2
0
1
2
3%
0 20 40 60 80 100%0 20 40 60 80 100%
Unhedged30% hedged100% hedged
Percentage of equity ex-AUD Percentage of equity ex-AUD
Vanguard nonlocal exposure
World market cap
Vanguard nonlocal exposure
World market cap
Notes: Figure 9c shows the volatility change for a 90% equity/10% fixed income (90/10) portfolio and Figure 9d for a 60% equity/40% fixed income (60/40) portfolio. World market capitalisation is as at 31 July 2017.Sources: Vanguard calculations, based on data from Bloomberg, Citigroup, FTSE and MSCI.
b. The impact of equity hedging
Rolling three-year MSCI global equity market volatility (AUD unhedged vs. AUD hedged)
a. Equity–currency correlation
Rolling three-year correlation: MSCI currency basket vs. MSCI global equity return (AUD)
d. Volatility reduction of hedging international equity for a 60/40 portfolio
Australian 60/40 portfolio
c. Volatility reduction of hedging international equity for a 90/10 portfolio
Australian 90/10 portfolio
For professional investors as defined under the MiFID II Directive only. In Switzerland for professional investors only. Not for Public Distribution.
Although this represents only a historical perspective, investors must weigh the potential volatility reduction with the structural and behavioural variables that can also influence the portfolio-hedging decision.
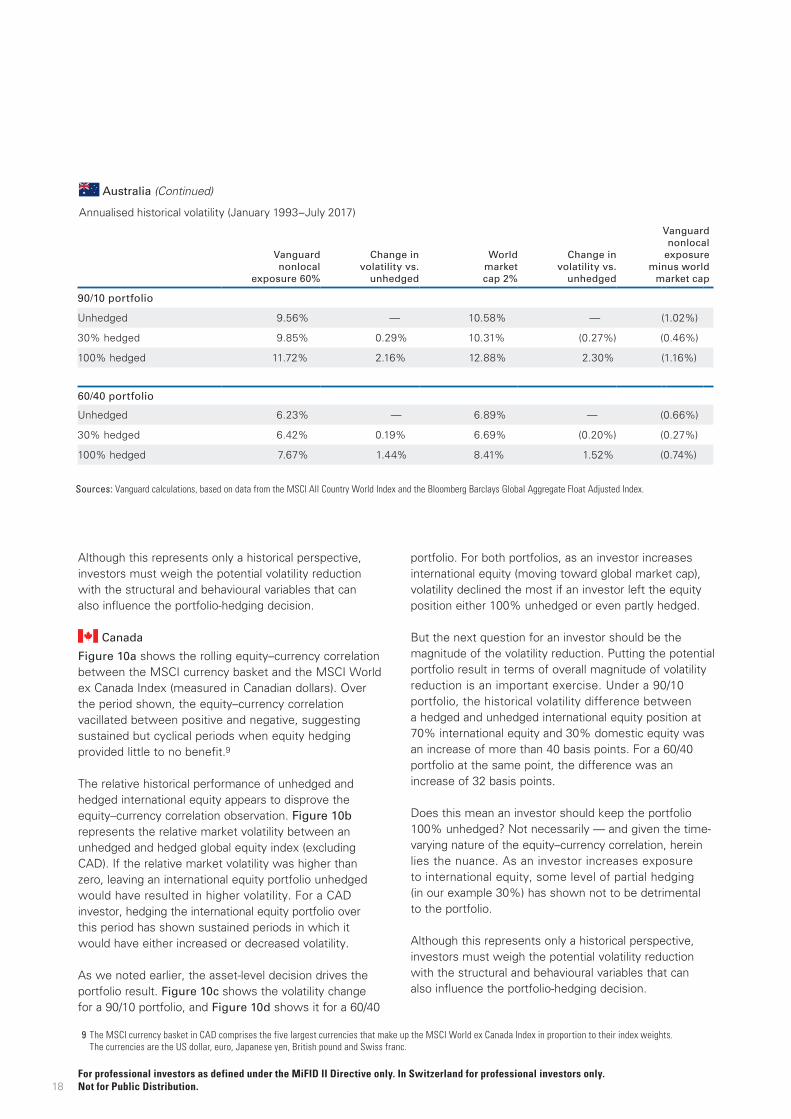
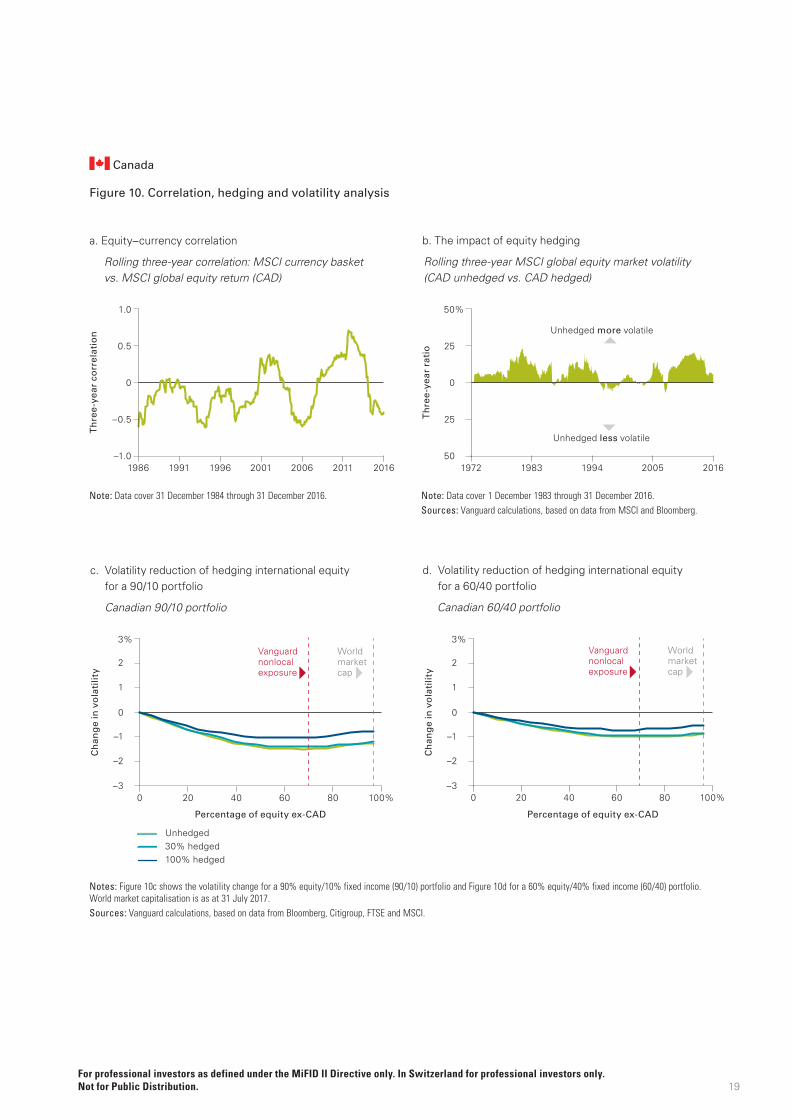
Canada
Figure 10a shows the rolling equity–currency correlation between the MSCI currency basket and the MSCI World ex Canada Index (measured in Canadian dollars). Over the period shown, the equity–currency correlation vacillated between positive and negative, suggesting sustained but cyclical periods when equity hedging provided little to no benefit.9
The relative historical performance of unhedged and hedged international equity appears to disprove the equity–currency correlation observation. Figure 10b represents the relative market volatility between an unhedged and hedged global equity index (excluding CAD). If the relative market volatility was higher than zero, leaving an international equity portfolio unhedged would have resulted in higher volatility. For a CAD investor, hedging the international equity portfolio over this period has shown sustained periods in which it would have either increased or decreased volatility.
As we noted earlier, the asset-level decision drives the portfolio result. Figure 10c shows the volatility change for a 90/10 portfolio, and Figure 10d shows it for a 60/40
portfolio. For both portfolios, as an investor increases international equity (moving toward global market cap), volatility declined the most if an investor left the equity position either 100% unhedged or even partly hedged.
But the next question for an investor should be the magnitude of the volatility reduction. Putting the potential portfolio result in terms of overall magnitude of volatility reduction is an important exercise. Under a 90/10 portfolio, the historical volatility difference between a hedged and unhedged international equity position at 70% international equity and 30% domestic equity was an increase of more than 40 basis points. For a 60/40 portfolio at the same point, the difference was an increase of 32 basis points.
Does this mean an investor should keep the portfolio 100% unhedged? Not necessarily — and given the time-varying nature of the equity–currency correlation, herein lies the nuance. As an investor increases exposure to international equity, some level of partial hedging (in our example 30%) has shown not to be detrimental to the portfolio.
Although this represents only a historical perspective, investors must weigh the potential volatility reduction with the structural and behavioural variables that can also influence the portfolio-hedging decision.
18
Australia (Continued)
Annualised historical volatility (January 1993–July 2017)
Vanguard nonlocal
exposure 60%
Change in volatility vs.
unhedged
World market cap 2%
Change in volatility vs.
unhedged
Vanguard nonlocal
exposure minus world
market cap
90/10 portfolio
Unhedged 9.56% — 10.58% — (1.02%)
30% hedged 9.85% 0.29% 10.31% (0.27%) (0.46%)
100% hedged 11.72% 2.16% 12.88% 2.30% (1.16%)
60/40 portfolio
Unhedged 6.23% — 6.89% — (0.66%)
30% hedged 6.42% 0.19% 6.69% (0.20%) (0.27%)
100% hedged 7.67% 1.44% 8.41% 1.52% (0.74%)
9 The MSCI currency basket in CAD comprises the five largest currencies that make up the MSCI World ex Canada Index in proportion to their index weights. The currencies are the US dollar, euro, Japanese yen, British pound and Swiss franc.
For professional investors as defined under the MiFID II Directive only. In Switzerland for professional investors only. Not for Public Distribution.
Sources: Vanguard calculations, based on data from the MSCI All Country World Index and the Bloomberg Barclays Global Aggregate Float Adjusted Index.
19
Canada
Figure 10. Correlation, hedging and volatility analysis
Note: Data cover 31 December 1984 through 31 December 2016. Note: Data cover 1 December 1983 through 31 December 2016.Sources: Vanguard calculations, based on data from MSCI and Bloomberg.
Notes: dot size = p4
to change size: select same appearance; go to effect > convert to shape > ellipse > absolute
0%
20%
40%
60%
80%
100%
-6 -4 -2 0 2 4 6
-15
-10
-5
0
5
10
15
0%
100%
200%
300%
400%
500%
2012201120102009200820072006200520042003
1p
5th
95th
Percentileskey:
75th
25th
Median
5th
95th
Percentileskey:
75th
25th
Median
–6
–3
0
3
6
9
12
15%
Top Bottom
Axi
s la
bel
if n
eed
ed
Axis label if needed
-6%
-3%
0%
3%
6%
9%
12%
15%
0.0
0.1
0.2
0.3
0.4
0.5
0.6
0.7
0.8
-1.0
-0.5
0.0
0.5
-1.0
-0.5
0.0
0.5
1.0
-1.0
-0.5
0.0
0.5
1.0
0.0
0.1
0.2
0.3
0.4
0.5
0.6
0.7
0.8
!"#$$%
!$#&$%
$#$$%
$#&$%
"#$$%
"'($"
()*%
"'($"
()+%
"'($"
())%
"'($"
(),%
"'($"
(,$%
!"##$%&'(')*+,'-",,*#+."%'/'0123'24,,*%-)'5+67*8'96'0123':#"5+#'
Th
ree
-yea
r ra
tio
50
25
0
25
50%
1994 20161972 1983 2005
Th
ree
-yea
r co
rrel
atio
n
–1.0
–0.5
0
0.5
1.0
1991 1996 2001 2006 2011 20161986
Unhedged more volatile
Unhedged less volatile
Notes: dot size = p4
to change size: select same appearance; go to effect > convert to shape > ellipse > absolute
0%
20%
40%
60%
80%
100%
-6 -4 -2 0 2 4 6
-15
-10
-5
0
5
10
15
0%
100%
200%
300%
400%
500%
2012201120102009200820072006200520042003
1p
5th
95th
Percentileskey:
75th
25th
Median
5th
95th
Percentileskey:
75th
25th
Median
–6
–3
0
3
6
9
12
15%
Top Bottom
Axi
s la
bel
if n
eed
ed
Axis label if needed
-6%
-3%
0%
3%
6%
9%
12%
15%
CAN - 90/10 Portfolio
!"#$$%
!$#&$%
$#$$%
$#&$%
"#$$%
"'($"
()*%
"'($"
()+%
"'($"
())%
"'($"
(),%
"'($"
(,$%
!"##$%&'(')*+,'-",,*#+."%'/'0123'24,,*%-)'5+67*8'96'0123':#"5+#'
Ch
ang
e in
vo
lati
lity
–3
–1
–2
0
1
2
3%
Ch
ang
e in
vo
lati
lity
–3
–2
–1
0
1
2
3%
0 20 40 60 80 100%0 20 40 60 80 100%
Unhedged30% hedged100% hedged
Percentage of equity ex-CAD Percentage of equity ex-CAD
Vanguard nonlocal exposure
World market cap
Vanguard nonlocal exposure
World market cap
Vanguard nonlocal exposure
World market cap
Notes: Figure 10c shows the volatility change for a 90% equity/10% fixed income (90/10) portfolio and Figure 10d for a 60% equity/40% fixed income (60/40) portfolio. World market capitalisation is as at 31 July 2017.Sources: Vanguard calculations, based on data from Bloomberg, Citigroup, FTSE and MSCI.
b. The impact of equity hedging
Rolling three-year MSCI global equity market volatility (CAD unhedged vs. CAD hedged)
a. Equity–currency correlation
Rolling three-year correlation: MSCI currency basket vs. MSCI global equity return (CAD)
d. Volatility reduction of hedging international equity for a 60/40 portfolio
Canadian 60/40 portfolio
c. Volatility reduction of hedging international equity for a 90/10 portfolio
Canadian 90/10 portfolio
For professional investors as defined under the MiFID II Directive only. In Switzerland for professional investors only. Not for Public Distribution.
20
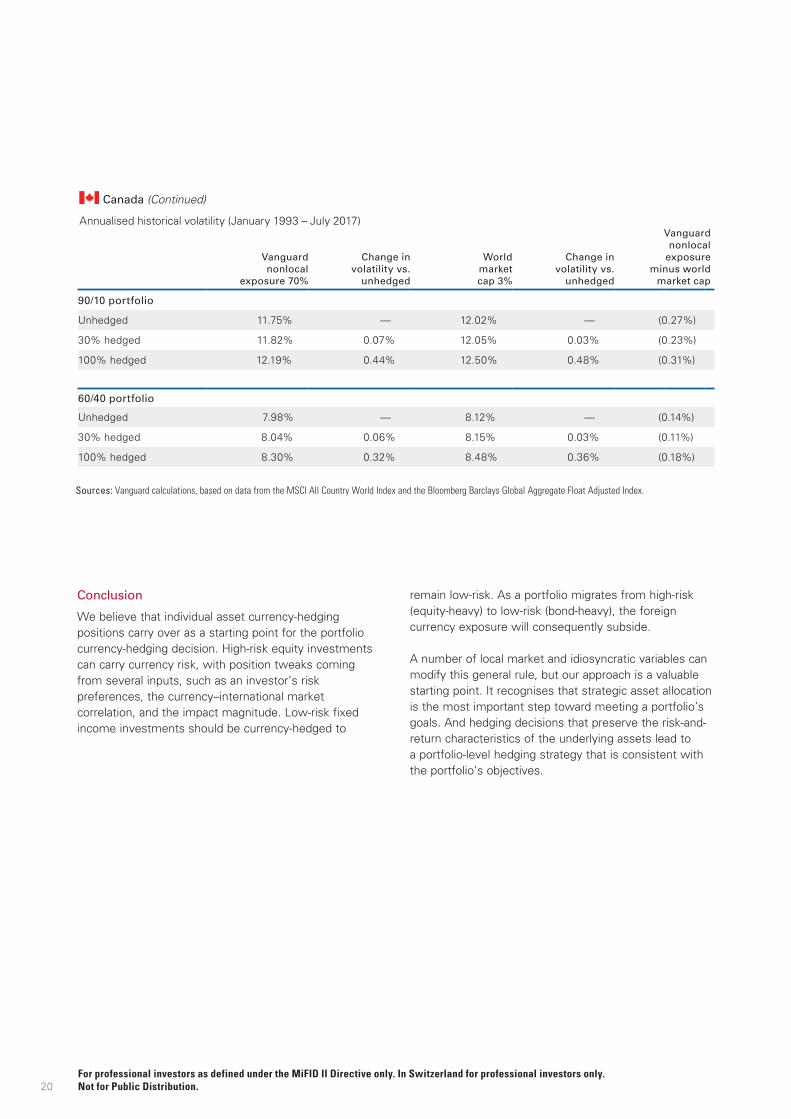
Conclusion
We believe that individual asset currency-hedging positions carry over as a starting point for the portfolio currency-hedging decision. High-risk equity investments can carry currency risk, with position tweaks coming from several inputs, such as an investor’s risk preferences, the currency–international market correlation, and the impact magnitude. Low-risk fixed income investments should be currency-hedged to
remain low-risk. As a portfolio migrates from high-risk (equity-heavy) to low-risk (bond-heavy), the foreign currency exposure will consequently subside.
A number of local market and idiosyncratic variables can modify this general rule, but our approach is a valuable starting point. It recognises that strategic asset allocation is the most important step toward meeting a portfolio’s goals. And hedging decisions that preserve the risk-and-return characteristics of the underlying assets lead to a portfolio-level hedging strategy that is consistent with the portfolio’s objectives.
Canada (Continued)
Annualised historical volatility (January 1993 – July 2017)
Vanguard nonlocal
exposure 70%
Change in volatility vs.
unhedged
World market cap 3%
Change in volatility vs.
unhedged
Vanguard nonlocal
exposure minus world
market cap
90/10 portfolio
Unhedged 11.75% — 12.02% — (0.27%)
30% hedged 11.82% 0.07% 12.05% 0.03% (0.23%)
100% hedged 12.19% 0.44% 12.50% 0.48% (0.31%)
60/40 portfolio
Unhedged 7.98% — 8.12% — (0.14%)
30% hedged 8.04% 0.06% 8.15% 0.03% (0.11%)
100% hedged 8.30% 0.32% 8.48% 0.36% (0.18%)
For professional investors as defined under the MiFID II Directive only. In Switzerland for professional investors only. Not for Public Distribution.
Sources: Vanguard calculations, based on data from the MSCI All Country World Index and the Bloomberg Barclays Global Aggregate Float Adjusted Index.

21
References
Philips, Christopher B., Joseph Davis, Andrew J. Patterson, and Charles J. Thomas, 2012. Global Fixed Income: Considerations for U.S. Investors. Valley Forge, Pa.: The Vanguard Group.
Kinniry, Francis M. Jr., Colleen M. Jaconetti, Donald G. Bennyhoff, and Michael A. DiJoseph, 2016. Reframing Investor Choices: Right Mindset, Wrong Market. Valley Forge, Pa.: The Vanguard Group.
Greiner, Steven, 2013. Investment Risk and Uncertainty: Advanced Risk Awareness Techniques for the Intelligent Investor. Hoboken, N.J.: John Wiley & Sons.
For professional investors as defined under the MiFID II Directive only. In Switzerland for professional investors only. Not for Public Distribution.

© 2018 The Vanguard Group, Inc. All rights reserved. Vanguard Marketing Corporation, Distributor.
ISGPCH_E 092018
Vanguard Research
Connect with Vanguard® > global.vanguard.com
For professional investors as defined under the MiFID II Directive only. In Switzerland for professional investors only. Not for Public Distribution.
This document is published by The Vanguard Group, Inc. It is for educational purposes only and is not a recommendation or solicitation to buy or sell investments. It should be noted that it is written in the context of the US market and contains data and analysis specific to the US.
CFA® is a registered trademark owned by CFA Institute.