Embed Size (px)
Citation preview

The Positive Externalities of IFRS R&D Rule:
Enhanced Voluntary Disclosure
By
Ester Chen∗
Ilanit Gavious*
and
Baruch Lev**
March 2015
∗ Ben Gurion University, Israel ** New York University The authors thank Zack Assaf, Yiwei Dou, Nir Ehud, Zvika Eckstein, Ilan Guttman, Mascia Ferrari, Doron Israeli, Gideon Kandler, Simon Kogan, Tamir Masuri, Dan Segal, Ron Shalev, Michael Tang, Joseph Tendler, Guy Tabibian, Danny Vitan, Paul Zarowin, and workshop participants at Arison School of Business, Interdisciplinary Center, Israel. We gratefully acknowledge the financial support of the New York University Stern School of Business and the Guilford Glazer School of Business and Management at Ben-Gurion University. All errors remain our responsibility.

Abstract
Studies comparing IFRS with U.S. GAAP generally focus on differences in the attributes and
consequences of the recognized financial items. We, in contrast, focus on a major externality of
arguably the most significant difference between IFRS and GAAP: the capitalization of
development costs, the “D” of R&D, required by IFRS but prohibited by GAAP. We document
on a sample of Israeli firms, some using IFRS and others U.S. GAAP, a significant externality of
development capitalization in the form of extensive voluntary forward−looking information on
development potential and consequences disclosed by IFRS firms. A disclosure which we
document is value-relevant to investors beyond the mandated financial information. In the on-
going debate about the merits of R&D capitalization, such a value-relevant externality should be
of interest to both standard-setters and researchers.
1

1. Introduction
There is scant experimentation in setting accounting standards and therefore no trial and
error lessons are available to improve standard setting. Accounting standards are uniform
throughout all states in the US, and once these standards are enacted, they are rarely abolished. In
contrast, corporate laws and many other regulations, like environmental or insurance, differ by
state, and are frequently changed and improved, such as the state–specific natural gas fracking
regulations. Whatever experimentation there is in accounting standards, is restricted to the two
leading systems: US GAAP and the international standard (IFRS) adopted by European and certain
other countries. No wonder then that a large number of accounting studies examined the differences
between these two reporting systems and their impact on investors’ and firms’ decisions, such as
the effects on information asymmetry and firm performance, in order to assess the pros and cons of
each reporting system (e.g., Leuz, 2003, Barth et al., 2008; Jamal et al. 2010; Kim et al. 2012; Hail
et al. 2010).
We also compare US GAAP with IFRS, but with a different and hitherto unexamined
objective: we conjecture that certain accounting standards not only affect the mandated
(recognized) disclosures, but also motivate firms to voluntarily release relevant information to
investors, thereby enriching the information environment beyond the direct disclosure impact of
the standards. A positive externality of accounting standard-setting, so to speak.
Specifically, we focus in this study on accounting for R&D, which creates one of the most
significant differences between US GAAP and IFRS: while GAAP mandates the immediate
expensing of all internal R&D outlays, IFRS calls for the capitalization of development costs, under
certain circumstances. Indeed, R&D capitalization is quite prevalent among IFRS-using R&D-
intensive firms: forty percent of our IFRS sample firms capitalize development costs.
While not taking a stand in this study on the merits of R&D capitalization, we hypothesize
that IFRS process of capitalization generates a substantial amount of valuation-relevant
2
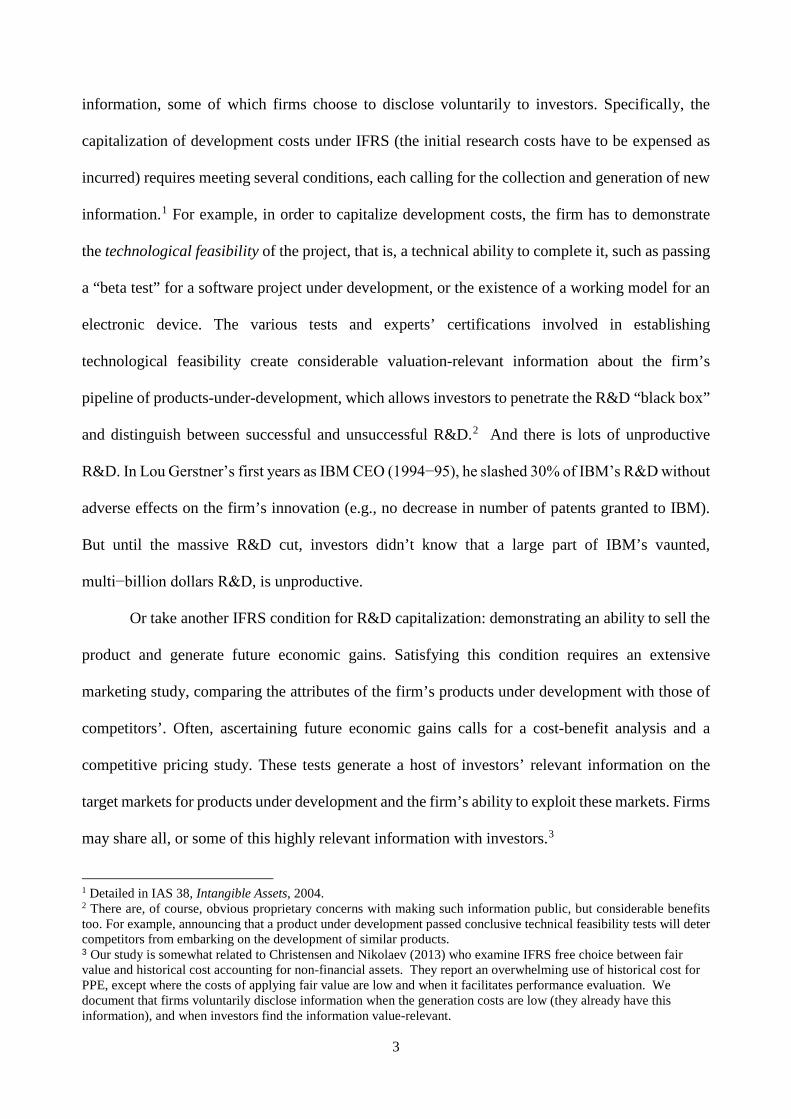
information, some of which firms choose to disclose voluntarily to investors. Specifically, the
capitalization of development costs under IFRS (the initial research costs have to be expensed as
incurred) requires meeting several conditions, each calling for the collection and generation of new
information.1 For example, in order to capitalize development costs, the firm has to demonstrate
the technological feasibility of the project, that is, a technical ability to complete it, such as passing
a “beta test” for a software project under development, or the existence of a working model for an
electronic device. The various tests and experts’ certifications involved in establishing
technological feasibility create considerable valuation-relevant information about the firm’s
pipeline of products-under-development, which allows investors to penetrate the R&D “black box”
and distinguish between successful and unsuccessful R&D.2 And there is lots of unproductive
R&D. In Lou Gerstner’s first years as IBM CEO (1994−95), he slashed 30% of IBM’s R&D without
adverse effects on the firm’s innovation (e.g., no decrease in number of patents granted to IBM).
But until the massive R&D cut, investors didn’t know that a large part of IBM’s vaunted,
multi−billion dollars R&D, is unproductive.
Or take another IFRS condition for R&D capitalization: demonstrating an ability to sell the
product and generate future economic gains. Satisfying this condition requires an extensive
marketing study, comparing the attributes of the firm’s products under development with those of
competitors’. Often, ascertaining future economic gains calls for a cost-benefit analysis and a
competitive pricing study. These tests generate a host of investors’ relevant information on the
target markets for products under development and the firm’s ability to exploit these markets. Firms
may share all, or some of this highly relevant information with investors.3
1 Detailed in IAS 38, Intangible Assets, 2004. 2 There are, of course, obvious proprietary concerns with making such information public, but considerable benefits too. For example, announcing that a product under development passed conclusive technical feasibility tests will deter competitors from embarking on the development of similar products. 3 Our study is somewhat related to Christensen and Nikolaev (2013) who examine IFRS free choice between fair value and historical cost accounting for non-financial assets. They report an overwhelming use of historical cost for PPE, except where the costs of applying fair value are low and when it facilitates performance evaluation. We document that firms voluntarily disclose information when the generation costs are low (they already have this information), and when investors find the information value-relevant.
3

Thus, IFRS standard for R&D capitalization (IAS 38) requires adopters to generate
substantial investment-relevant information, mostly of the type of strategic considerations analysts
try to elicit from managers in conference calls. Will managers disclose this information to
investors—thereby creating an important externality of accounting-standard-setting? Disclosure
models (e.g., Grossman, 1981) predict, based on adverse selection, that when investors know that
managers possess certain information, it will be disclosed. In our case, investors obviously know
that mangers have the capitalization-related information, since it is required to be generated in the
process of R&D capitalization. However, if the disclosure is costly (e.g., benefitting competitors),
managers may exercise discretion in disclosing their information, suppressing unfavorable news
(Jovanovic, 1982; Verrecchia, 1983). In our case, most of the capitalization-related information is
favorable (e.g., the product passed a feasibility test, or it’s expected to generate net benefits), since
otherwise, development costs will not capitalized. But competitor-related concerns may still deter
full information disclosure. So, ultimately, the extent of capitalization-related disclosure by IFRS
companies, and the relevance to investors of such information are empirical questions to be
examined in this study. We thus study the spillover effect of accounting regulation on voluntary
information disclosure, a question that, to the best of our knowledge, was not examined before.
We chose to focus on R&D-intensive firms not only because the accounting for R&D differs
markedly between GAAP and IFRS, but also because constant technological changes and the
considerable scientific complexity of the business models of high tech and science-based firms
create particularly large information asymmetries which make it difficult, sometimes even
impossible, for investors to reliably assess the performance and financial condition of these firms
without considerable disclosure of voluntary, value-relevant information. In fact, R&D intensity is
often chosen by researchers as a proxy for financial information opaqueness (e.g., Aboody and Lev,
2000; Vincente-Lorente, 2001). Strong investor demand for R&D-related information is thus
expected to induce certain voluntary disclosure. Our sample choice was also motivated by the fact
4

that R&D-intensive firms populate large sectors of developed economies and the most important
ones in terms of growth, innovation, and contribution to social welfare. There are thus compelling
reasons to focus on R&D-intensive firms in our comparison of GAAP with IFRS regarding
regulatory impact on voluntary disclosure.
Our sample consists of 180 (798) Israeli high-technology firms (firm-years), of which 116
(497) report financial statements in accordance with IFRS, and 64 (301) adopted US GAAP. The
sample period is 2007 through 2011.5F
4 Although IFRS is mandated in Israel, the many Israeli firms
listed in the US (either in US exclusively, or cross listed with Israel) are allowed by the Israeli SEC
to report under US GAAP. We chose to focus on Israeli firms because Israel’s unique setting,
allowing the use of IFRS and GAAP, provides a rare opportunity to explore our research question
on firms using IFRS or US GAAP while operating in the same country. By focusing on a single
country, we maintain the institutional, legal and economic factors constant across all sample firms,
thereby avoiding the onerous need to control for the different economic, cultural and institutional
differences in the typical cross-country GAAP-IFRS studies. Israel also befits an R&D study like
our since it is recognized globally as a leader in innovation: at 4.27% of GDP, Israel has the world’s
highest R&D intensity, which is over twice the OECD average of 2.01%, and substantially higher
than the US 2.77% average. 6 F
5
For our empirical analyses, we construct a firm-specific disclosure index which quantifies the
extent of voluntary information conveyed by firms in their annual financial statements (including
MD&A). This hand-collected index summarizes information items that are relevant to investors in
science-based and technology companies, as well as information items required by IAS 38 as a
condition for development cost capitalization. Specifically, our disclosure index reflects the following
eight information categories: capitalization-related information, R&D activities, feasibility of
4 Adoption of IFRS in Israel became mandatory for public companies in 2008. However, most companies had already started reporting according to IFRS in the previous year (2007). 5 OECD Internet Economy Outlook, 2013. http://www.oecd-ilibrary.org/sites/factbook-2013-en/08/02/01/index.html.
5

project completion, assessment of future benefits and market information, product specifications,
product target uses, future plans, and “innovation revenues” (share of total revenues from new
products).
Our major finding corroborates our conjecture: whereas in the pre-IFRS adoption period the
disclosure level of the two sub-samples was practically identical, in the post-adoption period the extent
of voluntary, R&D-related disclosure is significantly higher in IFRS firms than in US GAAP firms.
Furthermore, based on a difference-in-difference test, we document that while the voluntary
disclosure by IFRS firms significantly increased from the first year of its implementation in Israel
(2007) to the last year of our sample (2011), the voluntary disclosure by Israeli firms using US
GAAP has not changed throughout this period. These findings thus document an important positive
externality of IFRS generated by the capitalization of R&D. An intriguing question still remains
whether the extra voluntary disclosure by IFRS firms is relevant to investors. We address this
question by two tests: price regressions, relating the disclosure index at the firm level to the firm’s
market value, and the impact of disclosure on the informativeness of share prices. The results
indicate that indeed the voluntary disclosed information has a positive incremental value for
investors over the mandated accounting information (earnings, book value of equity, R&D
expenditures), and that it enhances significantly share price informativeness. This incremental
value-relevance of the voluntary disclosures is significantly higher for IFRS firms, compared with
US GAAP firms.
When dealing with voluntary disclosure, the question of disclosure costs arises naturally.
Consistent with Guo et al. (2004), we document that four proprietary cost proxies affect the amount of
information disclosed by Israeli R&D intensive firms: the firm’s extent of patent protection of its R&D
innovations, the firm’s progress in its product development, the availability of venture capital funding,
and firm size. This holds for IFRS as well as for US GAAP adopters. But even after controlling for
the impact of these determinants of disclosure, we find that firms reporting under IFRS voluntarily
6

disclose more relevant information on their R&D activities than their US GAAP counterparts. We
conduct several robustness tests to the price analyses and obtain consistent results: the positive
relation between our disclosure index and firms’ market values validates the positive consequences
of voluntary disclosure, particularly by IFRS firms. All in all, we establish here an important
externality of accounting standard-setting: voluntary information disclosure.
The next section briefly presents the differences between US GAAP and IFRS’ treatment
of R&D expenditures and provides examples of the conditions for capitalization set by IAS 38 that
are expected to affect the firms’ extent of voluntary disclosures. Section 3 describes our sample,
while Section 4 presents the disclosure index (with detailed examples provided in Appendix A).
Section 5 reports disclosure changes over time for GAAP and IFRS firms, while Section 6 validates
the higher voluntary disclosure level by IFRS firms. Section 7 reports the market consequences of
voluntary disclosure, and Section 8 concludes the study.
2. R&D Disclosure under IFRS versus US GAAP
US GAAP mandates the full expensing of all internally-generated R&D expenditures, due
to concerns with the reliability, objectivity and value-relevance of R&D capitalization (SFAS 2).
In contrast, IFRS requires firms to recognize an intangible R&D asset if certain criteria are met
(IAS 38). The standard also specifies how to determine the carrying value of these intangible assets.
According to IAS 38, in order to capitalize development costs (the initial research costs
must be expensed as incurred), a firm has to show that it meets several conditions related to the
successful completion and marketing of the developed product or service. These conditions include:
the technical feasibility of the product under development, the intention and availability of financial
resources to complete the development, an ability of the firm to use or sell the product, specifying
how the product will generate future economic benefits, and an ability to reliably measure the
expenditures attributable to the product development, separately from the research phase. These
7

capitalization conditions are quite stringent, but nevertheless, 40% of our IFRS adopters capitalize
all or some development costs. Obviously, firms seeking to capitalize development costs, as per
IAS 38, generate a substantial amount of information complying with the conditions set by the
standard for capitalization, information that they may not have generated otherwise.
In what follows we briefly discuss the most relevant conditions of IFRS’ R&D capitalization
and the voluntary disclosures they are likely to elicit.
• Control over the product: An entity controls an asset if it has the power to capture the future
economic benefits emanating from it and restrict the access of others to those benefits. The capacity
of an entity to control the future benefits stems from legal rights that are enforceable in court,
generally in the form of patents and trademarks on the developed concept. According to section 22
of IAS 38, an entity should assess the probability of obtaining future economic benefits, using
reasonable assumptions that represent the best estimates of management of the economic conditions
that will exist during the life of the capitalized asset. This requirement calls for the collection of
information on intellectual capital ownership (patents, trademarks), as well as conducting
systematic market research about the prospective product (service), potentially yielding highly
relevant information for investors (and often for management too).
• Meeting capitalization conditions: according to section 57 of IAS 38, an intangible asset
arising from the development phase of an internal project shall be recognized as such if and only if
the entity can demonstrate all of the following:
(a) The technical feasibility of completing the development of the product (service) so that it may
be available for use or sale.
(b) The firm’s intention to complete the project.
(c) The ability to use or sell the developed product.
(d) Obtaining future economic benefits from the product. (The entity should demonstrate the
existence of a market for the product, or, in the event that it will be used internally, the usefulness
8

of the product to the firm.)
(e) The existence of adequate technical and financial resources to complete the development of the
product.
(f) The ability to measure reliably the expenditures attributable to the product during its
development.
Meeting these capitalization conditions requires the generation of considerable data on results of
feasibility tests, estimates of resources needed to complete and market the product, and prospective
sales projections, all relevant to investors.
• What should be capitalized: According to section 59 of IAS 38, development activities
include:
(a) The design, construction and testing prior to production or use of models and prototypes,
(b) The design of tools, dies, molds and templates involving new technology,
(c) The design, construction and operation of a pilot plan feasible for commercial production, and
(d) The design, construction and testing of a chosen alternative for materials, devices, products,
processes, systems or services that are new or have been improved.
• Business plan: According to section 61 of IAS 38, the availability of resources to complete,
use, and benefit from the product should be demonstrated by a business plan that highlights the
firm’s technical and financial capacity. In some cases, an entity should demonstrate the availability
of external funding. A business plan, or parts of it, are obviously of interest to investors.
It is thus clear that a considerable amount and variety of valuation-relevant information is
collected and generated in the process of meeting IFRS R&D capitalization conditions, available to
be shared with investors. Our tests are aimed at ascertaining the extent of such information sharing
and the relevance of the information to investors.
9

3. Sample Selection
Our sample selection procedure begins with all the 186 Israeli high-technology and science-
based firms that had been listed on the Tel Aviv Stock Exchange (TASE), and/or on US exchanges
between 2007 and 2011. Of the 186 firms, 118 are listed on TASE only, 34 are listed on US
exchanges only, and the remaining 34 firms are cross-listed on TASE and the US. Adoption of
IFRS in Israel became mandatory for public companies in 2008. However, most companies had
already adopted IFRS in 2007, hence, our sample period begins in 2007. All dual listed firms in the
US are allowed by the SEC to report under IFRS and by the Israeli SEC to report under US GAAP.
Most of these firms report under US GAAP. Specifically, all the sample 118 firms listed on TASE
use IFRS. Of the 68 US listed or cross listed firms, two firms report under IFRS, and the remaining
66 firms use US GAAP.
The list of Israeli high-technology firms during the sample period was obtained from the
Israel Venture Capital (IVC) Online database. IVC Online is a comprehensive database on Israel's
high-tech and science–based industries, created by the Israel Venture Capital Research Center.
Consistent with prior studies, we identify high-tech firms by the likelihood that they have
significant unrecorded intangible assets (e.g., Core et al. 2003; Francis and Schipper 1999). By this
definition, high-tech firms are those included in the following industry segments: life sciences
(pharmaceuticals and biotechnology), computer hardware and electronic equipment (computers and
electronics for parsimony), software, and telecommunications. To focus on R&D intensive firms,
we eliminated from the sample 3 IFRS and 2 US GAAP firms having no R&D expenditures.
We obtained the financial information for our sample from the Bloomberg Professional
database, and supplemented this data with information from the firms’ disclosures, manually
collected from the PDF files of financial statements in the Bloomberg Professional database. Firms
with insufficient Bloomberg data are excluded from the analysis. Table 1 summarizes the sample
selection procedure. After excluding firms with no R&D, along with those with insufficient data, we
10

obtained a sample of 180 (798) firms (firm-years) with sufficient information required for our
various analyses, of which 611 (497) use IFRS and 64 (301) use US GAAP. Table 2, Panel A shows
the sample firms by industrial affiliation. Life sciences, computers and electronics firms comprise
roughly half of our sample. Table 2, Panel B — Summary Statistics — shows that GAAP firms are
larger (total assets) than IFRS firms, but the two groups are very similar in revenue growth rate and
R&D intensity (relative to total assets).
4. The Disclosure Index
The disclosure index is constructed by hand collecting information from the firms’ annual
financial statements and MD&As, focusing on R&D-related information. Our disclosure index
consists of eight information categories: capitalization-related information, R&D activities,
feasibility of project completion, assessment of future benefits and market information, product
specifications, product target uses, future plans, and innovation revenues (% sales from recently
introduced products).
Appendix B specifies the components of the disclosure index and the scores assigned to
each item. In what follows, we provide a brief description of the eight categories and the scoring
system making up our index. Appendix A provides examples of specific disclosures for each
category.
4.1. Capitalization-related information
This index category captures information related to meeting the requirements for
capitalizing development costs. To capitalize development costs, IFRS firms must be able to
distinguish the research phase from the development of the product or service, and identify the
expenditures incurred in each phase. If a firm shares this information with investors, we assign a
11

score of 1 if it discusses the two phases, and 0 otherwise. An additional score of 1 is given if the
firm provides the amounts of research and development, and 0 otherwise. The human capital
associated with the R&D activities is an important information element.6 Based on the extent of
discussion of the human capital, a score of 3 is given if a detailed description (including names and
numbers) of key research personnel is provided, 2 if a general description (including numbers) is
provided, 1 if a brief description (with no numbers) is provided, and 0 if there is no discussion of
the R&D human capital. The firm’s protection of its R&D innovations through patents, licenses,
or trademarks (confirming ownership), along with the various risk factors related to R&D activities,
and regulations potentially affecting the products under development are essential information for
capitalization. Based on the extent of discussion of each of these three items, a score of 3 is given
if a detailed description that extends over at least 5 sentences per product is provided, 2 if a general
description covered by 3-4 sentences is provided, and 1 if a brief description is provided by 1-2
sentences. Zero score is given if there is no discussion of the product protection, risk factors, or
related regulation. Adding these individual scores, the capitalization-related information category
of the disclosure index has a maximum score of 14 points and a minimum of 0.
4.2. R&D activities
This index category is designed to capture the extent of specific R&D-related information
provided by the firm. The first item is the description of the R&D activities aimed at obtaining new
knowledge or products, including: exploration, evaluation and final selection from applications of
research proposals; the search for alternative materials, devices, products, processes, systems or
services used by the firm;7 and the formulation, design, evaluation and final selection of devices,
products, processes, systems or services that are new or have been improved. Based on the extent
6 Personnel costs constitute about 60% of R&D expenditures. 7 This is generally known as “process R&D,” aimed at economizing on production processes, in contrast with “product R&D,” aimed at developing new products or services.
12

of description of such R&D activities, a score of 3 is given if a detailed description (including
numbers, such as R&D expenditures) that extends over at least 5 sentences is provided, 2 if a general
description (including numbers) covered by 3-4 sentences is provided, 1 if only a brief description
(with no numbers) is provided by 1-2 sentences, and 0 for no description of R&D activities.
The timing of the various stages of R&D is an important information dimension. A score
of 3 is given if the firm provides details on the timing (e.g., “the company plans to launch the
combined solution in the second half of 2012…”), duration (e.g., “the project’s duration started on
May 1, 2011 and will extend up until April 30, 2012.”), or frequency (e.g., “we annually invest in
changing and improving our products in response to changes…”). A score of 2 (1) is given if the
firm provides details on at least two (one) of the three features (timing, duration, frequency), and 0
if none of the features are mentioned. A firm may also discuss the results of the trial/s conducted
throughout the development process. A score of 3 is given if it provides a detailed discussion, citing
test results and analyzing the results; 2 if the firm provides a general discussion of the results, citing
data but not analyzing them; 1 if the firm provides only a brief discussion of trial results without
data; and 0 if the firm does not mention any trial results, though trials were included in the
development process. A discussion of existing R&D alliances/collaborations yields a score of 2 if
it included the names of the entities with which the firm collaborates, 1 if no names were mentioned,
and 0 otherwise. A further point is given if the firm provided breakdowns of the amounts spent on
R&D (e.g., payment to consultants, cost of laboratory equipment, etc.), and 0 otherwise. Finally,
regarding the discussion of how is the R&D related to existing products, 2 points are given for a 3-
sentence or more discussion; a brief description of 1 sentence is given1 point; and 0 otherwise.
Adding these individual scores, the research and development activities category of the disclosure
index can have a maximum score of 15 points and a minimum of 0.
4.3 Feasibility of Completion
13

This index category aims to capture the feasibility of completing the development, as
prescribed by IAS 38. We give 3 points if the firm provides a detailed description of a business plan
that highlights the technical requirements and its ability to complete development; 2 points for a
general discussion of this dimension; 1 point if it provides only a brief presentation; and 0 otherwise.
Another prerequisite for capitalization is demonstrating adequate financial resources to complete
the development. A score of 3 is given if the firm presents a detailed plan, including amounts that
highlights the financial requirements and its ability to secure them; 2 points, if the firm provides a
general presentation including numbers, one point if it provides only a brief discussion with no
numbers; and 0 otherwise.8 The firm is further required to indicate its intention to complete the
development. A score of 1 is given if the firm provides such indication and 0 otherwise.
Furthermore, the firm is required to show its ability to use or sell the new product. A score of 3 is
given for a detailed marketing description per product that extends over at least 5 sentences; 2 points
for a general description covered by 3-4 sentences; 1 point for a brief description provided by 1-2
sentences only; and 0 otherwise. Adding these scores, the firm can have a maximum of 10 and a
minimum of 0 points in the feasibility of completion category.
4.4 Future Benefits and Product Market Information
Demonstrating ability to assess the future benefits from the products under development
and to provide relevant target market information is another condition for capitalization. We give a
score of 2 (1, 0) points if the firm provides a detailed (only general, or no) description indicating
whether the product is expected to generate revenues from its sale; a score of 2 (1, 0) if the firm
provides a detailed (only general, or no) description indicating whether the product is expected
generate cost savings; and a score of 2 (1, 0) if the firm provides a detailed (general, no) description
8 For example, an entity demonstrates the availability of external funding by obtaining a lender's indication of its willingness to finance the plan, or grants from the Office of the Chief Scientist of the Israeli Ministry of Economy, etc.
14

indicating whether the product is expected to generate income from its own use of the product. The
firm is also required to disclose information about the target market for the product. A score of 3 is
given for a detailed description that extends over at least 5 sentences, including numbers,
demonstrating the existence of a market for the product, 2 points for a general description with
numbers covered by 3-4 sentences; 1 for a brief description provided by 1-2 sentences only with
no numbers; and 0 otherwise.
In the event that the asset will be used internally, we give a score of 3 for a detailed
description of the internal use per product that extends over at least 5 sentences, 2 points for a
general description covered by 3-4 sentences, 1 point for a brief description provided by 1-2
sentences only, and 0 otherwise. The firm must also discuss the degree of certainty attached to the
future economic benefits attributable to the product. Accordingly, we give a score of 2 points if it
provides reliable evidence in this regard (e.g., evidence from external sources, such as drug
resellers), 1 point if no independent sources are quoted, and 0 if no evidence of benefits is provided.
Lastly, information on the timing of marketing or internal use—both dates and duration—grants
the firm 2 points; 1 point if only one of the two (dates or duration) is given; and 0 otherwise.
Adding the maximum score given for information items regarding probable future economic
benefits, gives a maximum score of 9 points and a minimum of 0.
4.5 Product Specifications
This index category is designed to capture information on the properties of the firm’s
products under development.9 Based on the extent of discussion of product properties and
particularly of the effectiveness of the product, a score of 3 is given if the discussion per product
extends over at least 5 sentences, 2 if properties are covered by 3-4 sentences, 1 if the information
9 Notably, for firms in our sample with more than one product under development, the extent of information provided by the firm was similar for its different products.
15

is provided by 1-2 sentences, and 0 if there is no discussion of product properties. Occasionally,
firms compare the product under development with existing products on the market, and point out
whether the former is superior to competing products. A score of 2 is given if other products are
mentioned by name, 1 if other products are discussed without mentioning names, and 0 if no
competing products are mentioned.10 From the discussion of the product structure (e.g., chemical,
biological, technological aspects) a score of 2 is given if the firm provides a detailed discussion, 1
for a general discussion, and 0 if the product structure is not mentioned. With respect to the useful
life of the product, 1 point is given if the firm indicates either the period during which it expects to
use or generate benefits from the product, or the number of units expected to be sold, and 0
otherwise. Adding these individual scores, the product specifications category can have a maximum
score of 8 points and a minimum of 0.
4.6 Target Uses
This index category is designed to capture information on the intended use of the product.
A score of 2 is given if the firm discusses consumers needs that the product satisfies, or any other
uses of the product, mentioning specific consumers or needs (e.g., diseases). One point is given if
the firm provides just a general discussion without mentioning specific consumers or needs. Adding
these scores, the firm can have a maximum score of 2 and a minimum score of 0 in the target uses
category.
4.7 Future Research and Development Plans
This category includes the firm’s future plans for research and development activities. A
score of 3 is given for a detailed description that extends over at least 5 sentences, including
numbers, of the planned research and development activities aimed at obtaining new knowledge or
10 Consistent with Guo et al. (2004), we take the maximum score on either of the two sub-categories—the developed product in relation to existing products or in relation to products under development. This is because firms often discuss their products in relation to either available products or competing products under development.
16

products; 2 points if the firm provides just a general description, including numbers, covered by 3-
4 sentences; 1 for a brief description with no numbers, covered by 1-2 sentences, and 0 otherwise.
A score of 1 is further given if expected or planned dates are mentioned, and 0 otherwise. Also, a
score of 1 is given if expected or planned development duration is mentioned, and 0 otherwise. This
category may also include the firm’s plans to form alliances with other entities. A score of 2 is
given if the alliance partners are mentioned by name, 1 if alliances are generally discussed but not
mentioned by name, and 0 if alliances are not mentioned, but other information indicates the firm
has alliances. Finally this category may include plans to try the product for other than original uses
or in combination with other products. A score of 2 is given if other uses, or if the names of other
products, are mentioned; 1 if these plans are discussed without specificity, and 0 otherwise. Adding
these scores, the firm can have a maximum of 9 and a minimum of 0 points for the future plans
category.
4.8 Innovation Revenues
The final category of the disclosure index relates to an important indicator of firm
innovativeness — “innovation revenues,” namely the percentage of total revenue generated by
recently−introduced products.11 If the firm launched new products, a score of 1 is given for
disclosure of innovation revenues, and 0 otherwise. If the firm has not introduced new products to
the market recently, it gets 1 point so that its total score will be comparable to firms that did.
Overall, the firm can have a maximum of 1 and a minimum of 0 points on the innovation revenues
category.
11 Studies have documented a strong association between this indicator and future firm growth; see Thornhill (2006) and Hall and Bagchi-Sen (2002).
17

4.9. Total Disclosure Index
The total score of the disclosure index for each sample firm is obtained by summing the
eight category scores outlined above. Within the second category, ‘R&D Activities’, one item—
‘trial results’—is relevant only for the “life sciences” industry. As such, firms in the life sciences
industry can potentially obtain the maximum sub-total score of 15 points from this category,
whereas firms in all the other industries can obtain a maximum subtotal score of 12 points only (the
maximum score of the trial results item is 3).12 To assure the cross-sectional comparability of
sample firms’ scores, we scale the total score of the sample life science firms by 68, and the scores
of firms in all the other industries by 65 (see appendix B for scoring details). We thus construct a
scaled disclosure index for each of the 798 firm-years.
4.10. Index Attributes
As shown in panel A of Table 3, the mean (median) of the scaled total disclosure score for
our pooled sample is 0.46 (0.44), indicating that the actual voluntary disclosure by sample firms
was, on average, 46% of the maximum score. The interquartile range of disclosure (0.30-0.62) and
the standard deviation (0.19) indicate considerable cross-sectional variability of R&D-related
disclosures by the sample firms. Panel A of Table 3 further shows the descriptive statistics of the
disclosure scores by the individual categories of the index. The lowest level of disclosure, on
average, is about future plans (24%), likely due to competitive concerns, followed by the disclosure
12 In the fifth category, ‘Product Specifications’, item 4.b.: “The number of production or similar units expected to be obtained from the product” is relevant only for the life sciences and computers and electronics industries. Nevertheless, since the score for question 4 in this category is max(4a, 4b), and the maximum score for both 4a and 4b is 1, the total score for all other industries is unaffected by the exclusion of question 4.b. Similarly, in the sixth category, ‘Target uses’, item 2: “What are the other possible uses of the product?” may be relevant for some companies in an industry whereas for other companies it may be irrelevant. The distribution of the scores for this item shows us that this question is relevant for a significant number of companies in each industry. Nonetheless, we determine the subtotal score of this category to be max (1,2), assuring that firms for whom this question may not be relevant are not affected by the inclusion of the question in the index. Lastly, in the seventh category, ‘Future Plans’, item 2.a.: “Is there any plan to try the product for other uses?” may be irrelevant for some companies in an industry whereas for other companies it may be relevant. Clearly, this question is more relevant for life sciences. Notwithstanding, here too the total scoring is unaffected by this question since the score for question 2 in this category is max(2a, 2b), and the maximum score for both 2a and 2b is 2.
18
on feasibility of completion (37%), future benefits and market information (39%), R&D activities
(43%), capitalization-related information (54%), product specifications (58%), innovation revenues
(73%), and target uses (88%).
Panels B and C of Table 3 present the descriptive statistics of the disclosure scores
separately for IFRS and US GAAP firms. Notably, the actual voluntary disclosure by IFRS firms
was, on average (median), 50% (48%) of the maximum disclosure, compared with only 38% (36%)
of disclosure by US GAAP firms.13 These differences in the means and medians of the overall
disclosure between IFRS and US GAAP firms are highly significant (p<0.01), as shown in Panel D
of Table 3. When we split the IFRS firms to those that capitalized development costs and those that
didn’t capitalize development costs, we find, as expected, that capitalizers disclosed more
information (mean/median scores of 0.56/0.50) than IFRS non-capitalizers (0.46/0.47 scores). Note
that the disclosure level by IFRS non-capitalizers (0.46/0.47) is significantly higher than that of
GAAP firms (0.38/0.36), which also don’t capitalize R&D. The reason apparently is that IFRS
capitalization requirement leads most firms to collect certain capitalization-required data (e.g., on
expected product benefits, technological feasibility, or funds availability to complete the
development), whether they ultimately decide to capitalize R&D or not. And some of this
information is shared with investors by most IFRS users.14 Regarding the individual disclosure
categories, the level of disclosure by IFRS firms is significantly higher than that of GAAP firms for
all the categories except for target uses and patent protection of the innovation. The reason:
information about these categories is readily available to managers even without complying with
IFRS capitalization requirements, and competitive concerns are minimal. The significant disclosure
13 We point out that the US GAAP sample firms include three firms with very high disclosure scores. When these three firms are deleted from the sample, the average scaled disclosure score for US GAAP firms drops to 35%. 14 IFRS “Management Commentary” disclosed by most IFRS users includes performance measures and indicators, risk statistics and certain prospective information, some of it potentially relevant to investors.
19

differences in Table 3 is our first indication that IFRS mandate of development cost capitalization
leads to a substantial increase in voluntary disclosure.
5. Intertemporal Disclosure Improvement
We have documented above that, on average, IFRS firms disclose voluntarily more R&D-
related information than GAAP firms. But what about the pattern, or trend, of information
disclosure? Table 4 presents the mean scaled disclosure scores, totals as well as category subtotals,
by year, for IFRS versus US GAAP firms. The medians (untabulated) yield similar inferences.
Panel A of Table 4 shows that the total disclosure score for IFRS firms gradually increased from
the first year of its implementation (0.380 in 2007) to the last year of the sample period (0.549 in
2011), and that the difference in disclosure scores between 2007 and 2011 is statistically significant
(0.100, p-value<0.01). The IFRS firms’ disclosure increase is likely due to a learning curve effect:
as firms increase their knowledge of IFRS requirements and observe other firms’ capitalization
choices, they enhance their own disclosure. In contrast, the total disclosure score for US GAAP
firms has not changed throughout the period. Notably, we observe a significant difference between
the total disclosure score for IFRS and that of GAAP firms in each of the years 2007−2011, with
the former being higher than the latter, and the difference increase over time. The difference-in-
differences between the IFRS and GAAP firms’ total score between 2007 and 2011 is 0.094,
significant at the 1% level.
When we examine the disclosure in the year prior to IFRS adoption (2006), we find that
both groups of firms had an identical level of disclosure—38% of the maximum score. This
similarity is expected, given that prior to IFRS adoption, Israeli GAAP was largely based on the
accounting principles generally accepted in the US (US GAAP; see Chen et al., 2013). As shown
in Table 4, while IFRS firms significantly increased their disclosure in the year of adoption (from
20

38% to 45% of the maximum disclosure), and more so throughout the sample period, US GAAP
firms remained on a fairly stable and relatively low level of disclosure over time. Panels B and C
of Table 4 show similar results for the subtotals of the disclosure index. Thus, we can safely
conclude that it was the exogenous IFRS adoption in 2007, rather than other endogenous factors,
that triggered the sharp increase in voluntary disclosure by IFRS firms.
6. IFRS vs. GAAP Disclosure Differences: Multivariate Analysis
The univariate data in Table 3 indicate that the extent of R&D-related voluntary disclosure
by IFRS firms is substantially higher than that of GAAP firms, as measured by the overall index
(mean 0.50 for IFRS vs. 0.38 for GAAP), as well as for most of the individual components of the
disclosure index. This difference, however, may reflect the effect of various structural differences
between IFRS and GAAP firms affecting their disclosure strategies.15 For example, it has been
documented that the extent of voluntary disclosure varies positively with the stage of development
of the R&D projects: the more advanced the stage, the lower the concern that competitors will
imitate the products under development, and therefore the stronger the incentive to disclose
information. Thus, for example, if IFRS firms have, on average, products in a more advanced stage
of development than GAAP firms, it will explain the more extensive disclosure by IFRS firms. We
accordingly need to control for the major determinants of voluntary disclosure by IFRS and GAAP
firms. Given that we deal with R&D-related disclosures, previous studies on voluntary disclosure
by high-tech and biotech companies, such as Guo et al. (2004), are particularly relevant to our
choice of control variables.
15 Given that all our sample firms are headquartered and largely operate in Israel, and subject to Israeli laws, we are not concerned in this study with legal and institutional factors affecting disclosure.
21

Specifically, in our multivariate analyses we control for five disclosure determinants: (1)
the legal protection of R&D innovations; (2) the extent of progress in the product pipeline; (3)
venture capital backing of the firm; (4) ownership concentration; and (5) firm size. Protection of
R&D innovations is a binary variable that equals 1 if the firm discloses that it has protected its R&D
innovations by patents, licenses, or trademarks, and 0 otherwise. Legal protection is expected to
motivate higher disclosure levels, because managers are less concerned about imitation by
competitors. Progress of the product pipeline is also a binary variable that equals 1 if the firm
disclosed that it indeed progressed in the stage of product development, like “the project progressed
from Phase I to Phase II clinical test,” and 0 otherwise. Given the considerable technological
uncertainty which characterizes the development process of R&D projects, the progress made in
the product pipeline is a very favorable and highly value-relevant information to investors, and it is
therefore safe to assume that a firm will disclose any progress made. Moreover, for advanced
products under development, there is less concern of imitation by competitors and, therefore, a
higher incentive to disclose voluntarily. Venture backing is a binary variable that equals 1 for firms
backed by venture capitalists, and 0 otherwise.16 Venture capitalists generally wish to exit from the
firm and will, therefore, be motivated to disclose information that will boost share prices. For each
firm, information on the progress made in the product pipeline, the legal protection of R&D
innovations, as well as venture capital backing is collected from the annual financial statements.
Ownership concentration is the percentage ownership held by managers, directors, and 5%
or greater beneficial owners. The information on ownership structure was extracted from the Israeli
If'at Capital Disc Co. database. We conjecture that managers of firms with a concentrated
16 In this variable we included support by venture capitalists and/or by The Office of the Chief Scientist [OCS] in the Ministry of Economy in Israel. “The OCS is charged with execution of government policy for support of industrial R&D. The goal of the OCS is to assist in the development of technology in Israel as a means of fostering economic growth, encouraging technological innovation and entrepreneurship, leveraging Israel’s scientific potential, enhancing the knowledge base of industry in Israel, stimulating high value-added R&D and encouraging R&D collaboration both nationally and internationally. A variety of ongoing support programs developed and offered by the OCS play a major role in enabling Israel to be a key center for high tech entrepreneurship” (http://www.matimop.org.il/ocs.html).
22

ownership, feel less investor pressure to impart strategic information, potentially benefiting
competitors, and will therefore disclose less. Indeed, previous research indicates a negative relation
between ownership concentration and disclosure (e.g., McKinnon and Dalimunthe, 1993; Mitchell
et al., 1995; Schadewitz and Blevins, 1998), though one study suggests that blockholder ownership
is not related to disclosure (Eng and Mak, 2003). Our fifth control variable, firm size, is measured
by total market value, and is expected to be positively correlated with the extent of disclosure, as
has been shown in previous studies.
Table 3 (bottom) presents descriptive statistics of the five disclosure determinants. For the
pooled sample (panel A of Table 3), we find that 88% of the sample firms protected their R&D
innovations through patents, 48% disclosed that progress was made in their product pipeline during
the last year, and 52% were backed by venture capitalists. The average (median) percentage of
insider ownership was 48% (55%). Examining differences between IFRS and US GAAP firms
(panels B and C of Table 3), we find that 85% (92%) of IFRS (US GAAP) firms protected their
R&D innovations, 50% (38%) disclosed progress in their product pipeline, and 50% (55%) were
backed by venture capitalists. As for ownership structure, the average (median) percentage of
insider ownership in IFRS firms is 51% (55%), compared with 44% (52%) for US GAAP firms.
Notably, these differences are significant only with respect to patent protection of R&D
innovations, progress in the product pipeline and firm size. Nonetheless, despite the lower
prevalence of R&D protection and the lower market cap, the extent of voluntary disclosure is higher
for IFRS firms, as shown in Table 3.
Table 5 presents univariate data of voluntary disclosure classified by the protection of R&D
innovations (panel A), and by the progress of the product pipeline (panel B). The data show a
significant disclosure difference between firms that protected their R&D innovations and those that
did not: both the means and medians of the scaled disclosure score are significantly higher (at the
1% level) with R&D protection than without it, regardless of the accounting standard adopted
23

(IFRS, GAAP). Similarly, we obtain a univariate confirmation of the conjectured relation between
the progress of the product pipeline (panel B in Table 5), as well as the three other disclosure
determinants (untabulated for parsimony), and the extent of voluntary disclosure. These results
corroborate our five disclosure determinants as valid control variables for the following multivariate
tests.
Table 6 presents estimates from regressions of our disclosure index on an indicator variable
(IFRS dummy) that takes the value of 1 for an IFRS reporting firm, and 0 for GAAP firms, as well
as on the five determinants of disclosure (control variables): protection of R&D innovations,
progress of the product pipeline, venture capital backing, ownership concentration, and firm size.
Industry and year fixed effects are also included in the regression. The results displayed in Table 6
present the estimates from the regressions on the pooled sample. In all the four regression
configurations of Table 6, the IFRS dummy is positive and highly statistically significant, implying
that reporting under IFRS is associated with more extensive voluntary R&D and product
development disclosure.17 With respect to the control variables, the coefficients on R&D protection,
progress of the product pipeline, venture backing, and firm size are all positive, as conjectured, and
highly significant (p<0.01). R&D protection and development progress seem to capture similar
proportions of the variation in the disclosure scores, as the adjusted R-squared is similar in the
regressions on each of these disclosure determinants alone (33% in models 1 and 2). Model 4 of
Table 6 indicates that, as expected, the disclosure score is higher for firms with venture capital
backing than those without, and lower for high ownership concentration. We also ran the
regressions reported in Table 6 by interacting the five control variables with the IFRS disclosure
dummy. The only significant interaction (positive) was that with venture capital backing. Thus,
IFRS companies’ venture capitalists—mostly Israeli firms, while GAAP venture capitalists are
17 When we replace the IFRS dummy with a capitalization dummy (for IFRS R&D capitalizers), we obtain, as expected, a larger and more significant regression coefficient.
24

mostly U.S. firms—apparently induce managers to disclose more value–relevant information.
Overall, our regressions analysis indicates that, after controlling for the various determinants of
disclosure, firms reporting under IFRS voluntarily disclose more information on their R&D
activities and prospects compared with their US GAAP counterparts.
A. Disclosure Relevance: Contemporaneous Price Regressions
Is the voluntary disclosure captured by our index relevant to investors’ decisions? And if
relevant, does it depend on whether the firm reports under IFRS or US GAAP? Importantly, this
consequence investigation also provides a validity check of our disclosure index, which is based on
certain subjective judgments regarding the choice of information variables and the assigned scores.
If the disclosure index is associated with market values, then our choices of information items and
weights indeed yields relevant information.
We relate the disclosure index (DISCLOSURE) to the price of the firms’ shares, based on a
version of the Ohlson (1995) model:
(1) itititititit vDISCLOSURERDEBVP +++++= 43210 βββββ ,
where P is price per share five months after fiscal year-end; BV is the most recent book value of
equity per share; E is current earnings per share before the (tax adjusted) R&D expense and
extraordinary items;18 RD is the annual R&D expense plus the change in capitalized R&D;19 and
18 Accounting-based valuation models that use net earnings as an explanatory variable generally separate earnings into positive and negative earnings to account for differences in the valuation of profits and losses (Hyan 1995; Basu, 1997; Collins et al., 1997). This separation is particularly important in studies of R&D-intensive industries. Previous studies have shown that the earnings in such industries are depressed due to the immediate expensing of large R&D amounts, resulting in firms predominately reporting losses. Because our earnings measure is taken before R&D expense, this variable is positive for most of our sample firm-years (around 70% of the IFRS and of the US GAAP firm-years). As such, Eq. (1) does not include a separate coefficient for negative E. When we allow for a separate coefficient for negative and positive E we find no significant difference between the two.
19 For our sample of R&D-intensive high-tech firms, we test and find that other proxies for growth in future earnings, such as sales growth, capital expenditures and advertising expenditures, have no incremental contribution to the explanation of stock prices beyond the firm’s expenditures on R&D.
25

DISCLOSURE is the firm’s scaled disclosure index. Note that for IFRS firms, RD in Eq. (1) consists
of both the annually capitalized and expensed R&D expenditures. We repeat the regressions using
price per share three and four months after fiscal year-end and obtain similar results. Market price
data were derived from Bloomberg Professional database.
To allow for differentiation between IFRS and US GAAP firms, we interact each of the
explanatory variables in Eq. (1), including the intercept, with a dummy variable that takes the value
of 1 if the firm reports in accordance with IFRS, and zero for US GAAP firms. The regression
estimates for equation (1), including the interaction variables, are presented in Table 7. We note
that the coefficients on book value (BV) and earnings (E) are, as expected, positive and significant
at the 1% level. The value-relevance of these fundamental financial variables does not differ
between IFRS and US GAAP firms, as indicated by the insignificant coefficients of the interactions
of BV and E with IFRS. In contrast, we do find a significant difference in the valuation of R&D
between IFRS and US GAAP. As expected for our sample R&D-intensive firms, the coefficient on
R&D (RD) is positive (rather than negative for a regular expense), and significant (at the 1% level).
But the coefficient on RD is 0.422 for US GAAP firms, whereas for IFRS firms it is substantially
higher, by 1.060 (p<0.01), as indicated by the significant interaction term. Recall that for IFRS
firms, the R&D variable includes the annually capitalized R&D, indicating that IFRS’ R&D
capitalization is deemed highly relevant by investors. The reason for the relevant capitalized R&D
coefficient is that such R&D passed technological feasibility tests, among others, which regular
R&D does not, reducing significantly the uncertainty associated with R&D outcomes.
Importantly, the coefficient on the scaled disclosure index—the focus of our study—has the
expected positive sign and is highly significant. Moreover, in comparison to US GAAP firms, for
whom the coefficient on DISCLOSURE is 0.557 (p<0.01), for IFRS firms the coefficient is
significantly larger, by 0.859 (p<0.01). Thus the regression estimates provide evidence that the
26

more extensive voluntary disclosure elicited by IFRS’ capitalization rule, is relevant to investors
beyond the GAAP information reflected by earnings and book value.
The right column of Table 7 shows the price regressions where the disclosure index is
decomposed into its eight categories. This mitigates somewhat our judgment in constructing the
index since by running the eight index components separately, we don’t impose equal weight as in
the overall index. The estimates indicate that most of the index components are value-relevant
(significant). Particularly relevant to investors is information on the various R&D activities of the
firm, the feasibility of project completion, the expected benefits of the projects, and data on
“innovation revenues” (percentage of revenues from recently-introduced products) which is an
important innovation capabilities indicator not required by GAAP.
To examine the robustness of our regression results, we conducted the following sensitivity
analyses (not tabulated for parsimony). First, we repeat the price regression analysis without the
interaction variables (multiplied by an IFRS dummy) and find very close results to those of Table
7. Second, we run the regressions for IFRS firms and for US GAAP firms separately and find, as
expected, that the coefficients on the disclosure index, and on certain index components (feasibility
of completion, future benefits, innovation revenues) are substantially higher for IFRS than for
GAAP firms. Third, we run a regression specification with unscaled financial variables for the
pooled sample as well as for IFRS and US GAAP firms separately, namely total market
capitalization regressed on book value, earnings, and the remaining independent variables, plus the
number of outstanding shares. Results are very close to those of Table 7. Finally, to avoid issues
with pooling our data over years, we run year-by-year regressions of model (1). The results across
all years are similar to those reported. We thus conclude that IFRS’ R&D capitalization provision
incents firms to disclose voluntarily highly relevant information to investors.
27

B. Share Price Informativeness
A recent, widely quoted study examined the informativeness of financial markets over the
last 50 years by regressing corporate earnings on lagged markets values and controls (Bai,
Philippon, and Savov, 2014). We adopt this study’s methodology to examine the following
question: has the voluntary R&D-related disclosure elicited by IFRS capitalization rule improved
the informativeness of IFRS firms’ share prices relative to US GAAP reporters?
We run the Bai et al. (2014) regression:
𝐸𝐸𝑖𝑖,𝑡𝑡+𝑘𝑘𝐴𝐴𝑖𝑖,𝑡𝑡
= 𝑎𝑎𝑡𝑡 log �𝑀𝑀𝑖𝑖,𝑡𝑡𝐴𝐴𝑖𝑖,𝑡𝑡� + 𝑏𝑏𝑡𝑡 �
𝐸𝐸𝑖𝑖,𝑡𝑡𝐴𝐴𝑖𝑖,𝑡𝑡� + ∈𝑖𝑖,𝑡𝑡, (2)
Were 𝐸𝐸𝑖𝑖,𝑡𝑡+𝑘𝑘 are subsequent, three year earnings (EBIT), 𝐴𝐴𝑖𝑖,𝑡𝑡 is total assets, 𝑀𝑀𝑖𝑖,𝑡𝑡 is current market
value, and 𝐸𝐸𝑖𝑖,𝑡𝑡 is current earnings (EBIT). We also run a version with the independent variables
interacted with a year dummy, and industry dummies. We run these regressions separately for IFRS
and GAAP reporters, and for IFRS R&D capitalizers and non-capitalizers. Regression estimates
are reported in Table 8.
Panel A of Table 8 compares IFRS with GAAP firms. The coefficients on current earnings
(E/A) for the three subsequent years are practically identical for the two groups. Thus, Israeli IFRS
and GAAP users report earnings with essentially identical association with future earnings. In
contrast, the estimate of market value (M/A) — indicating share informativeness — are markedly
different between the two groups: for each of the three subsequent years, IFRS coefficients are
orders of magnitude larger than the GAAP coefficients (e.g., for year t+1, IFRS market value
coefficient is 0.241 vs. GAAP coefficient of 0.008). IFRS 𝑅𝑅𝑠𝑠2 are also substantially larger than
GAAP 𝑅𝑅𝑠𝑠2.
Panel B of Table 8 shows the regression estimates for IFRS R&D capitalizers and non-
capitalizer. The difference in price informativeness (coefficient of M/A) is once more striking: the
coefficient of R&D capitalizers in all three future years are substantially higher than of non-
capitalizers, as are the regressions’ 𝑅𝑅𝑠𝑠2. Panel C provides the estimates of the independent variables
28

with year interactions and industry dummies. Here too, IFRS M/A (share informativeness)
coefficients are substantially larger than GAAP reporting coefficients.
We believe that a major reason for the (M/A) coefficient — or share price informativeness
— differences is the value-relevant voluntary product-related disclosure by IFRS firms, a result
consistent with our preceding tests. However, given that IFRS and GAAP reporters are different
firms, we cannot rule out other factors making the share prices of IFRS reporters more predictive
of future earnings than those of GAAP reporters. To alleviate some of these concerns we note that
IFRS and GAAP reporters are fairly well matched on factors that affect share price informativeness:
As shown in Panel B of Table 2, the revenue growth and R&D intensity of the two groups are
virtually identical. The mean market-to-book ratio of IFRS and GAAP firms is also very close
(2.96 vs. 3.00). Also recall that the earnings coefficients (E/A) of IFRS and GAAP firms —
indicating earnings’ predictive ability — are virtually identical (Panel A, Table 8). Moreover, the
findings of Panel B (Table 8) relate to IFRS R&D capitalizers and non-capitalizers all trading on
the Tel Aviv stock exchange, and have similar industry composition, and therefore seem to be quite
similar except for the extra voluntary disclosure by the R&D capitalizers. And yet, the price
informativeness of IFRS capitalizers is substantially higher than that of non-capitalizers. All this
enhances our confidence that the extra voluntary disclosure by IFRS firms, and particularly by R&D
capitalizers, is a major factor in the substantially higher share price informativeness.
8. Summary
We examine in this study our conjecture that IFRS’ requirement to capitalize product
development costs has a spillover effect on voluntary R&D-related disclosure, beyond the
recognized capitalized values. The reason for this conjecture is that IFRS’ R&D capitalization
conditions require firms to collect and process extensive information concerning the feasibility of
the developed products, the likelihood of their completion and marketability, among other strategic
29

information of considerable interest to investors, some or all of which managers may choose to
disclose to investors.
For a sample of Israeli technology and science-based firms, some using IFRS and others US
GAAP, we indeed document a considerable amount of voluntary disclosure by IFRS’ R&D
capitalizers, which is unmatched by GAAP users. Furthermore, we find that this R&D-related
voluntary disclosure is value-relevant to investors beyond the recognized earnings and book values,
and is associated with higher share price informativeness. We are also able to distinguish the types
of voluntary disclosures by their value relevance. We thus identify a positive externality of a
specific accounting regulation.
In the on-going debate about the merits of R&D (and intangible investments, in general)
expensing versus capitalization, our finding of an important positive externality of capitalization
should be of considerable interest to both standard-setters and researchers.
30

References
Aboody, D. and B. Lev, 2000. Information asymmetry, R&D and insider gains, Journal of Finance 55(6), 2747-2766.
Bai, J., T. Philippon, and A. Savov, 2014. Have financial markets become more informative? Working Paper, New York University.
Basu, S., 1997. The conservatism principle and the asymmetric timeliness of earnings. Journal of Accounting and Economics 24, 3–37.
Chen, E., Gavious, I. and Yosef, R. (2013). "The Relationship between the Management of Book Income and Taxable Income under a Moderate Level of Book-Tax Conformity". Journal of Accounting, Auditing and Finance 28(4): 323 – 347.
Christensen, H., and Nikolaev V., 2013, Does fair value accounting for non-financial assets pass the market test? Working Paper, the University of Chicago.
Collins, D., Maydew, E., Weiss, I., 1997. Changes in the value-relevance of earnings and book values over the past forty years. Journal of Accounting and Economics 24, 39–67.
Core, J.E., Guay, W.R., Van Buskirk, A., 2003. Market valuations in the new economy: An
investigation of what has changed. Journal of Accounting and Economics 34, 43-67.
Eng, L.L. and Mak, Y.T. Corporate governance and voluntary disclosure. Journal of Accounting and Public Policy 22 (4): 325-345.
Francis, J., Schipper, K., 1999. Have financial statements lost their relevance? Journal of Accounting Research 37, 320-352.
Guo, R., Lev, B. and Zhou, N., 2004. Competitive costs of disclosure by biotech IPOs. Journal of Accounting Research 42(2), 319-355.
Grossman, S., 1981. The informational role of warranties and private disclosure about product quality, Journal of Law and Economics, 461-83.
Hail, L., Leuz, C., Wysocki, P. 2010. Global Accounting Convergence and the Potential Adoption of IFRS by the United States: An Analysis of Economic and Policy Factors. Accounting Horizon, 24(3): 355-394.
Hall, L.A. and S. Bagchi–Sen. 2002. A study of R&D, innovation, and business performance in the Canadian biotechnology industry. Technovation 22(4), 231-244.
Hayn, C., 1995. The information content of losses. Journal of Accounting and Economics 20, 125–153.
Jamal, K., Bloomfield, R., Christensen H.E., Colson, R.H., Moehrle, S., Ohlson, J., Penman, S., Stober, T., Sunder, S., Watts, R.L. 2010. A Research-Based Perspective on the SEC’s Proposed Rule—Roadmap for the Potential Use of Financial Statements Prepared in Accordance with International Financial Reporting Standards (IFRS) by U.S. Issuers. Accounting Horizon, 24(1), 139-147.
Jovanovic, B., 1982. Truthful disclosure of information, Bell Journal of Economics, 36-44.
31

Kim, Y., Li, H. and Li, S. 2012. Does eliminating the form 20-F reconciliation from IFRS to US GAAP have capital market consequences? Journal of Accounting and Economics 53 (1-2): 249-270.
Leuz, C., 2003. IAS versus U.S. GAAP: information asymmetry-based evidence from Germany’s new market. Journal of Accounting Research 41, 445-472.
McKinnon, J.L., Dalimunthe, L., 1993. Voluntary disclosure of segment information by Australian diversified companies. Accounting and Finance 33 (1), 33–50.
Mitchell, J.D., Chia, C.W.L., Loh, A.S., 1995. Voluntary disclosure of segment information: Further Australian evidence. Accounting and Finance 35 (2), 1–16.
Ohlson, J. A., 1995, Earnings, Book Value and Dividends in Security Valuation, Contemporary Accounting Research, 11, 661-687.
Schadewitz, H.J., Blevins, D.R., 1998. Major determinants of interim disclosures in an emerging market. American Business Review 16 (1), 41–55.
Thornhill, S., 2006. Knowledge, innovation and firm performance in high- and low-technology regimes. Journal of Business Venturing 21(5), 687-703.
Verrecchia, R., 1983. Discretionary disclosure, Journal of Accounting and Economics, 179-94.
Vincente-Lorente, J. 2001, Specificity and opacity as resource-based determinants of capital structure: evidence from Spanish manufacturing firms, Strategic Management Journal 22(2), 157-177.
32

Appendix A: Examples of voluntary disclosure from sample firms’ financial statements
A description of human capital:
Division At the time of publishing this report On 31st December 2010 Employees Service
Providers Employees Service
Providers Sales, marketing, operations, and business development
5 1 6 (1 part time) 1
Management, finance, and administration
1 3 3 (1 part time) 1
R&D, production and logistics (including chief scientist and regulation)
1 part time 2 2 (1 part time) 1
Total 7 6 11 3
Dr. Benyamin Gavish – 20 years of experience researching small blood vessels and how breathing influences the cardio-vascular system. Developed the company's technology and IP. Given his knowledge and experience in the area of developing the interactive breathing technology, the IP and the clinical development – which are of crucial importance to the company – we believe that if the need arises it would take a long time to find a suitable replacement for Dr. Gavish.
A description of protection of R&D innovations:
Our intellectual property assets are our principal assets. These assets include the intellectual property rights subsisting in our proprietary know-how and trade secrets underlying our predictive biology capabilities and discovery platforms, our patents and patent applications, particularly with respect to Compugen discovered molecules and utilities, and the copyrights subsisting in our software and related documentation. We seek to vigorously protect our rights and interests in our intellectual property. We expect that our commercial success will depend on, among other things, our ability to obtain commercially valuable patents, especially for our therapeutic and diagnostic product candidates, maintain the confidentiality of our proprietary know-how and trade secrets and otherwise protect our intellectual property.
33
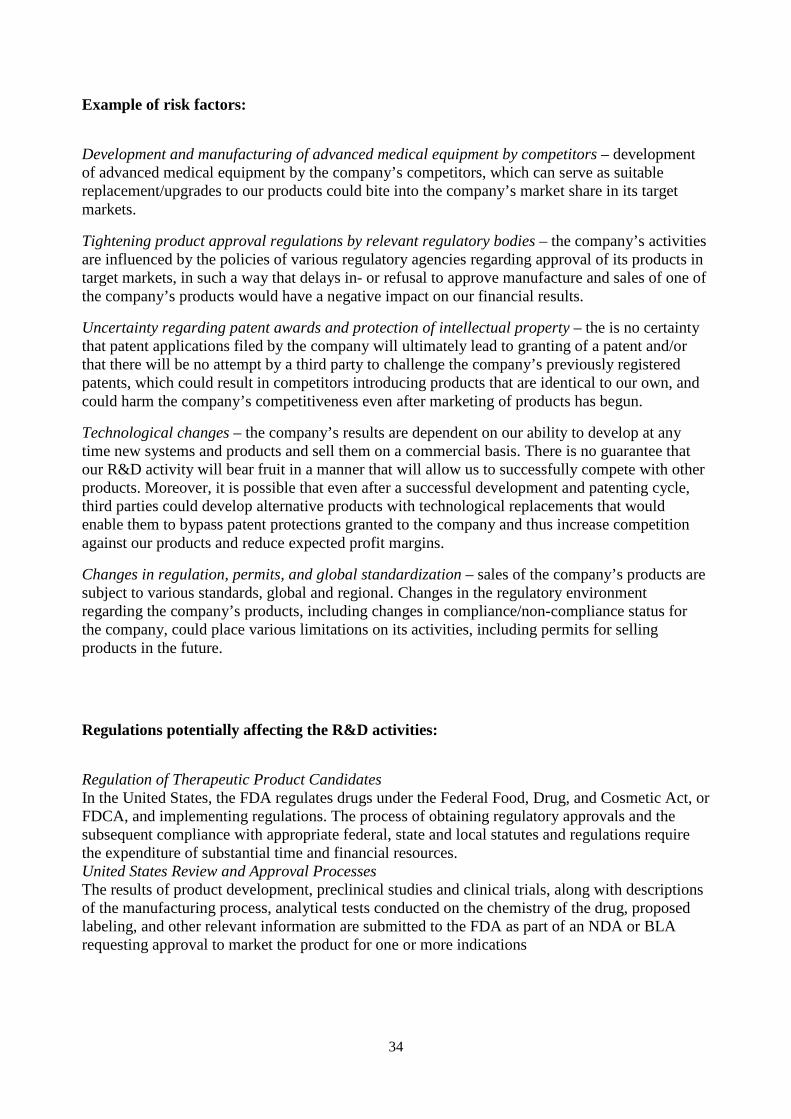
Example of risk factors:
Development and manufacturing of advanced medical equipment by competitors – development of advanced medical equipment by the company’s competitors, which can serve as suitable replacement/upgrades to our products could bite into the company’s market share in its target markets.
Tightening product approval regulations by relevant regulatory bodies – the company’s activities are influenced by the policies of various regulatory agencies regarding approval of its products in target markets, in such a way that delays in- or refusal to approve manufacture and sales of one of the company’s products would have a negative impact on our financial results.
Uncertainty regarding patent awards and protection of intellectual property – the is no certainty that patent applications filed by the company will ultimately lead to granting of a patent and/or that there will be no attempt by a third party to challenge the company’s previously registered patents, which could result in competitors introducing products that are identical to our own, and could harm the company’s competitiveness even after marketing of products has begun.
Technological changes – the company’s results are dependent on our ability to develop at any time new systems and products and sell them on a commercial basis. There is no guarantee that our R&D activity will bear fruit in a manner that will allow us to successfully compete with other products. Moreover, it is possible that even after a successful development and patenting cycle, third parties could develop alternative products with technological replacements that would enable them to bypass patent protections granted to the company and thus increase competition against our products and reduce expected profit margins.
Changes in regulation, permits, and global standardization – sales of the company’s products are subject to various standards, global and regional. Changes in the regulatory environment regarding the company’s products, including changes in compliance/non-compliance status for the company, could place various limitations on its activities, including permits for selling products in the future.
Regulations potentially affecting the R&D activities:
Regulation of Therapeutic Product Candidates In the United States, the FDA regulates drugs under the Federal Food, Drug, and Cosmetic Act, or FDCA, and implementing regulations. The process of obtaining regulatory approvals and the subsequent compliance with appropriate federal, state and local statutes and regulations require the expenditure of substantial time and financial resources. United States Review and Approval Processes The results of product development, preclinical studies and clinical trials, along with descriptions of the manufacturing process, analytical tests conducted on the chemistry of the drug, proposed labeling, and other relevant information are submitted to the FDA as part of an NDA or BLA requesting approval to market the product for one or more indications
34

A description of the R&D activities:
Significant R&D projects nearing maturity or market entry relating to civilian applications: alongside continued development of the 40/40 series of detectors and introducing it to market, the company plans to strengthen the product’s market penetration by improving manufacturing processes, completing compliance requirements, and continuing to reduce the prices of raw materials for the series. In addition, the company plans to expand this product lineup with the development of the 40/40 F detector which is a rapid detector that combines an explosion detector (military) with a civilian detector with a 15 meter range, that is intended for applications in explosive manufacturing or for areas where an explosion could occur and rapid detection is necessary without harming the sensitivity of the detector. In addition, the company has completed development of a line of accessories for the 40/40 product family.
The company has also begun to explore new and advanced technologies for developing gas detectors using cameras and volumetric analysis of gasses, and developing a fire camera with integrated multi-channel spectral analysis capabilities. Research in these two areas is conducted in partnership with external R&D firms. In addition, the company is nearing the final development stages of a series of gas detectors with improved performances.
Outlook for future developments in the coming year
The group will complete development of the 900 series gas detectors, capable of detecting Hydrocarbon (HC) gasses for the drilling rig and petrochemical industry sectors, with the goal of strengthening the group’s position in the linear gas detector field. This detector will be a cheaper and better-performing alternative to detectors in the 200 and 300 lines.
At the same time, the company is working on expanding its technological capabilities in the field of optical sensing systems for detecting fires and gasses. Towards this aim, the company is in contact with a number of R&D firms with capabilities that are complementary to our own.
Schedule of research/development activities:
The company plans to begin commercial launch of the combined solution in the second half of 2012, following completion of clinical trial runs in the company’s centers for excellence and completion of clinical development.
Trial results: Additionally, we have leveraged our ability to manufacture high purity liquid AAT to develop the next generation of our AAT product, Inhaled AAT for AATD, which is in pivotal Phase II/III clinical trials in Europe and is entering Phase II clinical trials in the United States. If approved, Inhaled AAT for AATD will be the first AAT product that is not required to be delivered intravenously and, instead, is administered through an easy to use nebulizer in two short daily sessions. We believe that the non-invasive Inhaled AAT for AATD will increase patient convenience and reduce the need for patients to use intravenous infusions of AAT products, thereby further reducing the risk of infection, decreasing the need for clinic visits or nurse home visits and reducing medical costs.
35

Existing alliances/collaborations: During December 2011 we entered into collaboration with BiolineRx for the purpose of developing and commercializing mutually selected Compugen discovered drug candidates that are not in our areas of focus, ranging from acute and chronic inflammatory diseases through cardiac diseases, retinopathy and cancer. According to this agreement, we will provide promising drug candidates, primarily peptides, which were identified using our predictive drug discovery platforms, while BiolineRx will develop these candidates through Phase II clinical trials, with the goal of ultimately licensing them to pharmaceutical companies for advanced clinical development and commercialization. This collaboration has been initiated with the mutual selection of three peptides discovered by Compugen. A description of the amounts expensed on the R&D: Research and development expenses were $56.8 million for the year ended December 31, 2010 compared to $42.2 million for the year ended December 31, 2009, representing an increase of approximately 35%. The increase was primarily attributable to higher employee related expenses of approximately $10.0 million due to additional headcount and merit increases, higher facility related expenses of approximately $1.9 million related to additional office space in Israel, higher share-based compensation of approximately $1.5 million associated with new share-based awards, and an increase in outsourcing expenses of approximately $1.1 million partially offset by a decrease in new product expenses of approximately $2.1 million primarily due to tapeout costs during 2009. We expect that research and development expenses will increase in absolute dollars in future periods as we continue to devote resources to develop new products, meet the changing requirements of our customers, expand into new markets and technologies and hire additional personnel. A discussion of whether the R&D is related to other research and/or to existing products:
As part of the para-clinical and clinical testing the company performs on these drugs as described above, the company also carries out various development activities for possible companion and complementary products for our drugs, which grow out of the R&D activities carried out by the company. On September 24, 2007, the company announced that it had developed a blood test for measuring levels of Adenosine receptors (A3, the receptor targeted by the company’s drugs) for candidate patients for treatment by the company’s drugs. The company estimates that this blood test will raise the likelihood for successful trials of our drugs.
Discussion of the technical feasibility of completing the production of the intangible asset:
As of this report’s publication date, StemEx is “fresh” product: it must arrive and be transplanted in the patient within no more than 18 hours after manufacturing is completed. This fact has crucial bearing on location of manufacturing sites and the overall logistical support network required at the stage of commercial production. At the end of 2010, in the course of the joint project, Gamida-Cell successfully proved the technological feasibility of producing a frozen StemEx product (henceforth: the frozen product), which would have long-term durability and would allow
36

flexibility in the timeframe between finishing production and the implantation procedure, and as a result would lead to reduction of manufacturing and distribution costs by making it possible to construct a central manufacturing center. In 2011, Gamida-Cell completed, in the course of the joint project, the main development process of the frozen product. However, Gamida-Cell is working to complete various aspects relating to the development of the frozen product. During 2012, Gamid-Cell plans to continue working with the FDA in order to receive guidelines regarding the necessary clinical tests required for receiving approval for marketing the frozen product.
Availability of adequate financial resources:
We may need additional financing to operate or grow our business. We may not be able to raise additional financing for our capital needs on favorable terms, or at all, which could limit our ability to grow and to continue our longer term expansion plans. We may need additional financing to operate our business or continue our longer term expansion plans. To the extent that we cannot fund our activities and acquisitions through our existing cash resources and any cash we generate from operations, we may need to raise equity or debt funds through additional public or private financings.
Firm’s ability to use or sell the intangible asset: There is no certainty that the use of the company’s products will be possible in the future with any or all cellular phones on the market at a given time. Similarly, the is no assurance that use of the company’s products will be possible in the future with any or all cellular phones on which they can be used today, including, but not limited to, in the case of technological changes that would prevent or limit in some form the use of the company’s products in these devices. An inability to use the company’s products in current or future cellular phones, including but not limited to, devices that can be used as of this report, could substantially harm the company, its forecasts and its future financial and/or business results. As of this report, it is impossible to predict the company’s ability, or lack thereof, to adjust the use of its products to all or most of the cellular phones existing in the market or that may exist in the future.
37

Discussion of whether the product will generate probable future economic benefits:
Global pharmaceutical market potential and the company’s products: management assesses that the effectiveness of the aforementioned drugs, on the one hand, and the optimum safety profile they have, on the other, give our drugs a potential for holding a large market share in the market for drugs for autoimmune diseases, cancer and eye diseases (with OphthaliX) which is estimated at tens of billions of USD. The company estimates, based on various studies, that the market for these drugs as of 2011 looks like this (in billions USD):
CF101 CF102 Rheumatoid Arthritis 12.0 Liver Cancer 1 Psoriasis 3.5 Hepatitis C 6.0 Dry eye 2.0 Glaucoma 3 Crohn’s 3.5 Uveitis 0.3
Demonstration of the existence of a market for the output of the asset or the intangible asset itself:
The primary field the company has operated in since its founding has been R&D of technologies and devices for non-pharmaceutical, non-invasive treatment of chronic diseases including hypertension, heart failure, sleep disorders and stress. Here follows a discussion of the hypertension (HTN) market, with a discussion of the need for effective non-pharmaceutical treatments. Hypertension, also referred to as “the silent killer”, is one of the most prevalent diseases amongst the population at large and amongst the elderly in particular. In the US there are 75 million sufferers from the disease, and worldwide there are more than a billion. In Israel, for instance, around one million people suffer from the disease, and they represent 20% of the adult population. The total annual cost of treating HTN in the company’s central market, the US, is estimated at USD 76.6 billion, of which 25 billion are spent on various antihypertensive drugs. Even before the redefinition of high blood pressure, the disease and its complications led to more US doctors’ visits than any other disease. In addition, HTN is on average the most expensive disease for individual American patients themselves, who pay on average USD 550 per year to treat the disease, not including additional treatments covered by insurance companies.
Discussion of the degree of certainty attached to the flow of future economic benefits:
In order to increase our annual revenues, we must continue to achieve design wins over other InfiniBand and Ethernet providers and providers of competing interconnect technologies. We consider a design win to occur when an original equipment manufacturer, or OEM, or contract manufacturer notifies us that it has selected our products to be incorporated into a product or system under development. Because the life cycles for our customers’ products can last for several years if these products have successful commercial introductions, we expect to continue to generate revenues over an extended period of time for each successful design win.
38

Timing of marketing or use:
According to a recent international study, the next six years (2011-2017) are predicted to see a significant growth in the market for AMI systems (smart meters). Expected shipments of smart meters are expected to grow from a level of approximately 550 thousand product units in 2011, to around 2300 million product units in 2016. The expected growth is due to regulatory influences, alongside a growth in research and development grants in the field of water conservation. Additionally, in the next 20 years demand for water is expected to rise by 40% - and as a result there will be pressure on owners of water utility companies to enforce more efficient monitoring of water usage through smart metering. According to the study, the growth in the smart meter market during the years 2010-2015 is expected to come primarily from countries in North America and Western Europe.
A description of how the product works:
Security Management Architecture (SMART) – A core component of our unified security architecture, SMART enables our customers to configure and manage security policies from a central administrative point. This technology enables the definition and ongoing management of security policies for enterprises of all sizes. This object-oriented architecture maps real-world entities, such as networks and users, to graphical representations that can be manipulated in a database. Integrated monitoring and reporting tools improve the manageability of the system by providing administrators with real-time information on the state of network and security systems. These tools also provide longer term trending information that is useful for periodic security management tasks, such as security audit.
A discussion of why the product is better than previous ones:
In addition to reselling our adapter cards, one of our major OEM customers has begun to embed our ConnectX VPI Ethernet and InfiniBand silicon devices directly on motherboards of a number of server and server blade products. This will increase the proliferation of our IB and Ethernet solutions in the market. Over time, we expect other major OEMs will similarly embed our high-speed interconnect products due to the market demand for higher I/O throughput and performance. We have established significant expertise with high-performance interconnect solutions from successfully developing and implementing multiple generations of our products. Our expertise enables us to develop and deliver products that serve as building blocks for creating reliable and scalable InfiniBand and Ethernet solutions with leading performance.
39

A discussion of why the product is better than competing products: The following table shows the advantages and drawbacks of the company’s product in comparison to competing products. The table also compares safety of the company’s product with competing products.
Attributes Company’s product
Competing product – SEEK
Competing product – DynaVax
Competing product – Juvaris
Competing product – Sanofl-Pasteur
Universal Vaccination
Yes, based on preserved common peptides for flu viruses
Yes, based on synthetic peptides
Yes, based on whole proteins: M2e, NP
Yes, based on M2e protein and B-type flu
Yes, based on M2e protein
Regulatory Compliance
Yes (under the guideline of improving existing vaccines)
No No No No
Harmfulness Testing
Vaccine is safe
Vaccine is safe
Vaccine is safe
Hasn’t been tested on humans
Vaccine is safe
Discussion of the product structure:
We use our proprietary platform technology and know-how for the extraction and purification of proteins from human plasma to produce Alpha-1 Antitrypsin (“AAT”) in a high purity, liquid form, as well as other plasma-derived proteins. AAT is a protein derived from human plasma with known and newly discovered therapeutic roles given its immuno-modulatory, anti-inflammatory, tissue protective and antimicrobial properties. Our flagship product, Glassia, is the first and only liquid, ready-to-use, intravenous plasma-derived AAT product approved by the United States Food and Drug Administration (the “FDA”). Indication of the useful life of the product:
The following table sets forth the components of intangible assets associated with the Protect Data development: Core technology (2) 107,000 5 years.
Discussion of future plans for research and development:
The company plans to enter this field with a modular platform for aggregation of a large number of Gigabit channels to several 10G channels. The main goal is to provide a compact product, similar to MetroStar – but with higher performance and a competitive price. This product is not meant to compete directly with similar products on the market, especially from large manufacturers, but to provide slightly reduced capabilities in exchange for a much lower price-
40

point. In addition, there will be large peripheral integration with the Falcon product family – enabling us to offer a complete solution. Under this platform, the company also plans to develop integration and connectivity modules for SDH networks.
R&D activities are slated to begin towards the end of 2012.
Disclosure of recently introduced product(s):
In the fourth quarter of 2009, the company launched a computerized “Self” (self-propelled, self-loading mixer), that was the first of its kind, henceforth: Computerized Self (“MIXELLENT”).
Disclosure of the percentage of total revenue generated by recently introduced products:
During the years 2010 and 2011, the Company received a total of $10 million for the achievement of the first two milestones in the License Agreement and an advance in respect of the Distribution Agreement in the amount of $20 million. The advanced payment related to the distribution right was recorded as deferred revenues and is recognized as revenues according to the actual products sales during the reporting period, divided by the total products sales achieved to date plus the expected products sales in the remaining Distribution Agreement period, which is expected to end in late 2015, with the start of production by Baxter. Non-refundable revenues due to the achievement of milestones were recognized upon reaching the milestone.
41

Appendix B: Scoring Procedure for the R&D Disclosure Index The disclosure index is constructed for each firm by hand collecting relevant information from the annual financial statements. Information is derived for the following eight categories: Capitalization-related information, R&D activities, feasibility of completion, assessment of future benefits and market information, product specifications, target uses, future plans, and innovation revenues.
I. Capitalization-related information
1. Does the firm distinguish the research phase from the development phase to create an
intangible asset? (yes=1; no=0)
2. Does the firm distinguish expenditures incurred within each phase? (yes=1; no=0)
3. Human capital information (Detailed description including names of key personnel and
numbers=3; general description+ numbers= 2; brief description with no numbers= 1; none=
0)
4. Protection on R&D innovations (e.g., through patents, licenses, trademarks, intellectual
property) (Detailed description= 3; general description= 2; brief description= 1; none= 0)
5. Risk factors related to R&D activities (Detailed description= 3; general description= 2; brief
description= 1; none= 0)
6. Regulation potentially affecting the R&D activities (Detailed description= 3; general
description= 2; brief description= 1; none= 0)
Subtotal I = total scores of (1+2+3+4+5+6)
II. R&D activities
1. A description of the R&D activities aimed at obtaining new knowledge or new products
(Detailed description+numbers= 3; general description+ numbers= 2; brief description with
no numbers= 1; none= 0)
2. Schedule of R&D activities (timing, duration, or frequency) (all of the three given=3; two
of the three given=2; one of the three given=1; none given=0)
3. Trial results (Detailed = pro and cons +numbers (3); general = numbers (2); brief = no
numbers (1); none (0))
4. Existing alliances/collaborations (2= name mentioned; 1=no name mentioned, 0= not
mentioned)
5. Description of the amounts expensed on R&D (detailed components of R&D expenditures
provided=1; detailed components of R&D expenditures not provided=0)
42

6. Is the R&D related to other R&D and/or to existing products (Detailed description = 3;
general description = 2; brief description = 1; none= 0)
Subtotal II = total scores of (1+2+3+4+5+6)
III. Feasibility of Completion
1. The technical feasibility of completing the production of the intangible asset so that it may
be available for use or sale (the firm presents a business plan that highlights the technical
requirements and its ability to complete the production: detailed presentation=3; general
presentation=2; brief presentation=1; none=0)
2. The availability of adequate financial resources to complete the development and use or sell
the intangible asset (the firm presents a business plan that highlights the financial
requirements and it's ability to source these resources: detailed presentation+numbers=3;
general presentation+numbers=2; brief presentation with no numbers=1; none=0)
3. The firm’s intention to complete the intangible asset, and use or sell it (1=given; 0=absent)
4. The firm’s ability to use or sell the intangible asset (detailed description=3; general
description =2; brief description =1; none=0)
Subtotal III = total scores of (1+2+3+4)
IV. Assessment of Future Benefits and Market Information
1. Will the intangible asset generate probable future economic benefits?
(a) Is the product/service expected to generate revenues from its sale (detailed
description=2; general description =1; none=0)
(b) Is the product/service expected to result in cost savings (detailed description=2; general
description =1; none=0)
(c) Is the product/service expected to generate other income different from the use of the
asset by the entity? (detailed description=2; general description =1; none=0)
2. How will the intangible asset generate probable future economic benefits?
(a) The firm demonstrates the existence of a market for the output of the asset or the
intangible asset itself (Detailed description+numbers= 3; general description+
numbers= 2; brief description with no numbers= 1; none= 0)
(b) In the event that the asset will be used internally, the firm demonstrates the usefulness
43

of the intangible asset (detailed description=3; general description =2; brief
description =1; none=0).
3. The degree of certainty attached to the flow of future economic benefits attributable to the
use of the asset (2= reliable evidence provided (e.g., evidence from external sources, patent
protection); 1= unreliable evidence provided; none= 0).
4. The timing of marketing or use (dates and duration) (both dates and duration given=2; one
of the two given=1; none given=0)
Subtotal IV = total scores of (max (1a, 1b, 1c)+ max (2a, 2b)+3+4)
V. Product Specifications
1. How does the product work? (3 points = three sentences; 2 points = two sentences; 1= one
sentence; 0= none)
2a. Why is it better than previous products? (2= name mentioned; 1=no name mentioned, 0=
no discussion)
2b.Why is it better than competing products? (2= name mentioned; 1=no name mentioned,
0= no discussion)
3. What is the product structure (chemical/biological/technological etc.)? (2= detailed
discussion; 1= general discussion; 0 = not mentioned)
4. What is the useful life of the product:
(a) The period during which the firm expects to use or generate benefits from the product
(1=given; 0=absent)
(b) The number of production or similar units expected to be obtained from the product
(1=given; 0=absent).
Subtotal V= total scores of (1+max(2a, 2b)+3+ max(4a, 4b))
VI. Target uses
1. What kind of consumers/needs does the product target/fulfill? (2= specific consumers/needs
mentioned; 1= specific consumers/needs not mentioned; 0= no discussion)
2. What are the other possible uses of the product? (2= specific consumers/needs mentioned; 1=
specific consumers/needs not mentioned; 0= no discussion)
Subtotal VI= max (1,2)
44

VII. Future Plans
1. Future plans for research and development activities:
(a) Planned date (1 = mentioned; o= not mentioned)
(b) A description of the planned research and development activities aimed at obtaining new
knowledge or new products (Detailed description+numbers= 3; general description+
numbers= 2; brief description with no numbers= 1; none= 0)
(c) Duration (1 = mentioned; o= not mentioned)
(d) Possible alliances (2= name mentioned; 1=no name mentioned, 0= not mentioned)
2a. Is there any plan to try the product for other uses? (2= use mentioned; 1=use not mentioned,
0= no discussion)
2b. Is there any plan to try the product with other products? (2= name mentioned; 1=no name
mentioned, 0= no discussion)
Subtotal VII= total scores of (1a+1b+1c+1d+max(2a, 2b))
VIII. Innovation Revenues
1. Does the firm have product(s) that were recently introduced to the market? (1= no; 0=
yes)
2. Does the firm disclose the percentage of total revenue generated by recently introduced
products (yes= 1; no= 0)
Subtotal VIII= max(1, 2)
45

Table1: Sample-Selection Procedure
No. of firms
Pooled IFRS firms
US GAAP firms
Israeli high-technology firms listed in the Israel Venture
Capital (IVC) Online database 618 012 66
Excluding firms with no R&D 5 3 2
Excluding firms with insufficient Bloomberg data 1 1 0
Final firm sample 180 611 64
46

Table 2: Summary Statistics
The sample consists of 798 Israeli high-tech firm-years: 497 observations of firms reporting in accordance with IFRS and 301 observations of firms reporting in accordance with US GAAP during the years 2007-2011.
Panel A: Industry Affiliation
No. of firms No. of firm-years
Industry: IFRS firms
US GAAP firms
Pooled IFRS firms
US GAAP firms
Pooled
Life sciences 40 (35%)
14 (22%)
54 (30%)
156 (32%)
63 (21%)
219 (27%)
Computers and electronics 26 (22%)
12 (19%)
38 (21%)
46 (9%)
89 (30%)
135 (17%)
Software 8 (7%)
11 (17%)
19 (11%)
116 (23%)
59 (20%)
175 (22%)
Telecommunications 12 (10%)
20 (31%)
32 (18%)
40 (8%)
55 (18%)
95 (12%)
Other technologies 30 (26%)
7 (11%)
37 (20%)
139 (28%)
35 (11%)
174 (22%)
Total 116 (100%)
64 (100%)
180 (100%)
497 (100%)
301 (100%)
798 (100%)
47

Table 2: Continued
Panel B: Descriptive Statistics
Variable No.
of Obs.
Mean 25th Percentile
50th Percentile
75th Percentile
Std. Dev.
Pooled sample 798 Total assets ($ millions) 108.089 8.668 31.613 103.292 240.118
Revenue growth% 0.274 0.045 0.105 0.283 0.489
R&D intensity 0.161 0.017 0.109 0.200 0.222
IFRS firms 497 Total assets 70.975 5.784 16.294 57.540 171.356 Revenue growth% 0.268 0.076 0.101 0.280 0.429 R&D intensity 0.160 0.018 0.108 0.209 0.241
US GAAP firms
301
Total assets 169.415*** 12.145 50.288*** 144.496 295.479 Revenue growth% 0.285 0.009 0.110 0.291 0.621 R&D intensity 0.162 0.014 0.111 0.183 0.208
48

Table 3: Disclosure Index Attributes
Total (subtotal) Scaled Disclosure Score is calculated by dividing the disclosure index, obtained by the scoring procedure in Appendix B, by the overall (category’s) available scores of 68 for life sciences firms and 65 otherwise (Capitalization-related information - 14; R&D activities- 15 for life sciences firms and 12 otherwise; Feasibility of Completion- 10; Future Benefits and Market Information- 9; Product Specifications- 8; Target Uses- 2; Future Plans- 9; Innovation Revenues- 1). For each firm, information on the progress made in the product pipeline, the protection on R&D innovation as well as venture capital backing is collected from the annual financial statements. Progress in Product Pipeline is a binary variable that equals to 1 if the firm has disclosed that a progress was made in its products pipeline, and 0 otherwise. Protection on R&D Innovation is a binary variable that equals to 1 if the firm has protected its R&D innovations (e.g., through patents, licenses, trademarks, intellectual property), and 0 otherwise. Venture Backing is a binary variable that equals 1 for firms backed by venture capitalists, and 0 otherwise. Ownership Concentration is the percentage share ownership of managers, directors and 5% or greater beneficial owners. Firm Size is the firm’s total market value (in $ millions). *** and * indicate that the difference between IFRS and US GAAP firms is significant at the 1% and 10% level, respectively.
Panel A - Pooled Sample
Variable No. of
Obs.
Mean 25th Percentile
50th Percentile
75th Percentile
Std. Dev.
Scaled Disclosure Score- Total 798 0.46 0.30 0.44 0.62 0.19
By subtotals of disclosure:
Capitalization-related information 798 0.54 0.43 0.57 0.71 0.22
R&D activities 798 0.43 0.25 0.41 0.60 0.25
Feasibility of Completion 798 0.37 0.20 0.30 0.50 0.21
Future Benefits and Market Information
798 0.39 0.17 0.42 0.58 0.24
Product Specifications 798 0.58 0.38 0.63 0.88 0.26
Target Uses 798 0.88 1 1 1 0.26
Future Plans 798 0.24 0.00 0.11 0.33 0.26
Innovation Revenues 798 0.73 0 1 1 0.44
Progress in Product Pipeline 798 0.48 0 0 1 0.50
Protection of R&D Innovation 798 0.88 1 1 1 0.33
Venture Backing 798 0.52 0 1 1 0.50
Ownership Concentration 798 0.48 0.43 0.55 0.59
0.29
Firm Size 798 65.08 6.67 22.00 90.55 16.801
49

Table 3: Continued
Panel B - IFRS Firms
Variable No. of
Obs.
Mean 25th Percentile
50th Percentile
75th Percentile
Std. Dev.
Scaled Disclosure Score 497 0.50 0.34 0.48 0.66 0.21
By subtotals of disclosure:
Capitalization-related information 497 0.55 0.36 0.57 0.71 0.22
R&D activities 497 0.46 0.25 0.42 0.67 0.27
Feasibility of Completion 497 0.39 0.20 0.40 0.50 0.23
Future Benefits and market information 497 0.43 0.25 0.50 0.67 0.25
Product Specifications 497 0.61 0.38 0.63 0.88 0.28
Target uses 497 0.87 1 1 1 0.276
Future Plans 497 0.28 0.00 0.22 0.44 0.28
Innovation Revenues 497 0.74 0 1 1 0.44
Progress in Product Pipeline 497 0.50 0 1 1 0.50
Protection of R&D Innovation 497 0.85 1 1 1 0.35
Venture Capital 497 0.50 0 0 1 0.50
Ownership Concentration 497 0.51 0.47 0.55 0.61 0.28
Firm Size 497 40.02 4.93 14.64 65.3 10.82
50

Table 3: Continued
Panel C – US GAAP Firms
Variable No. of
Obs.
Mean 25th Percentile
50th Percentile
75th Percentile
Std. Dev.
Scaled Disclosure Score 301 0.38 0.24 0.36 0.46 0.15
By subtotals of disclosure:
Capitalization-related information 301 0.53 0.43 0.57 0.64 0.21
R&D activities 301 0.37 0.25 0.33 0.50 0.21
Feasibility of Completion 301 0.32 0.20 0.30 0.40 0.17
Future Benefits and market information
301 0.31 0.17 0.33 0.42 0.20
Product Specifications 301 0.54 0.38 0.50 0.75 0.23
Target uses 301 0.89 1 1 1 0.25
Future Plans 301 0.17 0.00 0.11 0.22 0.20
Innovation Revenues 301 0.67 0 1 1 0.45
Progress in Product Pipeline 301 0.38 0 0 1 0.49
Protection of R&D Innovation 301 0.92 1 1 1 0.27
Venture Capital 301 0.55 0 1 1 0.50
Ownership Concentration 301 0.44 0.33 0.52 0.57 0.31
Firm Size 301 106.45 22.00 51.71 134.50 24.32
51

Table 3: Continued
Panel D – Differences between IFRS and US GAAP firms
Variable Mean Median
Scaled Disclosure Score 0.12***
(t=5.738)
0.12***
(z=5.334)
By subtotals of disclosure: Capitalization-related information 0.02
(t=1.052) 0.00
(z=1.021) R&D activities 0.09***
(t=5.688) 0.09***
(z=4.878) Feasibility of Completion 0.07***
(t=4.667) 0.10***
(z=4.202) Future Benefits and market information 0.12***
(t=7.084) 0.17***
(z=6.835) Product Specifications 0.07
(t=0.596) 0.13
(z=0.596) Target uses -0.02
(t=1.292) 0.00
(z=1.547) Future Plans 0.11***
(t=6.027) 0.11***
(z=5.499) Innovation Revenues 0.07***
(t=5.489)
0.00
(z=0.596)
Progress in Product Pipeline 0.12*** (t=4.612)
1.00*** (z=4.560)
Protection on R&D Innovation -0.07*** (t =-2.853)
-0.00*** (z=-2.841)
Venture Capital -0.05 (t =-1.504)
-1.00 (z =-1.503)
Ownership Concentration 0.07 (t =-1.116)
0.03 (z =-1.022)
Firm Size -66.43*** (-5.775)
-37.07*** (-10.205)
52

Table 4: Patterns of voluntary disclosure over time
This table presents mean scaled disclosure scores by year over the sample period. Panel A shows the total scores for the subsamples of IFRS and US GAAP firms. Panels B and C show the annual subtotals for IFRS and for US GAAP firms, respectively. *** and ** indicate that the differences in the respective scores between 2007 and 2011 are significant at the 1% and 5% level, respectively.
Panel A: Mean scaled disclosure score by year: a difference-in-difference analysis
2006 2007 2008 2009 2010 2011 Difference 2006-2007
Difference 2007-2011
IFRS 0.380 0.449 0.471 0.500 0.518 0.549 0.069*** (t=2.27)
0.100*** (t=2.74)
US GAAP 0.382 0.380 0.374 0.373 0.391 0.386 0.004 (t=0.32)
0.006 (t=0.45)
Difference-in-differences
0.065*** (t=2.58)
0.094*** (t=2.99)
Panel B: Subtotal scaled disclosure scores by year- IFRS firms
Difference
2007-2011
Difference
2006-2007
2011 2010 2009 2008 2007 2006
0.069***
(t= 3.08)
0.049***
(t=2.89) 0.587 0.571 0.549 0.509 0.518 0.469
Capitalization-related information
0.045***
(t= 6.28)
0.060***
(t=5.41) 0.485 0.484 0.456 0.461 0.440 0.380
R&D activities
0.043***
(t= 5.47)
0.048***
(t=5.06) 0.410 0.406 0.393 0.374 0.367 0.319
Feasibility of Completion
0.037***
(t= 5.65)
0.082***
(t=4.62) 0.444 0.439 0.421 0.426 0.407 0.325
Future Benefits and market information
0.055***
(t= 2.75)
0.039
(t=3.11) 0.625 0.640 0.618 0.597 0.570 0.531
Product Specifications
0.038***
(t= 3.12)
0.055***
(t=2.99) 0.895 0.895 0.875 0.838 0.857 0.802
Target uses
0.022***
(t= 3.45)
0.086***
(t=5.13) 0.294 0.268 0.271 0.299 0.272 0.186
Future Plans
0.106***
(t= 5.45)
0.032***
(t=4.76) 0.782 0.768 0.750 0.711 0.675 0.643
Innovation Revenues
53

Table 4: Continued
Panel C: Subtotal scaled disclosure scores by year- US GAAP firms
Difference
2007-2011
Difference
2006-2007
2011 2010 2009 2008 2007 2006
0.014
(t= 0.30)
0.009
(t=0.43) 0.528 0.523 0.521 0.518 0.514 0.505
Capitalization-related information
-0.012
(t= -0.88)
-0.004
(t=-0.29) 0.357 0.378 0.365 0.358 0.369 0.373
R&D activities
0.001
(t= 0.59)
-0.005
(t=-0.18) 0.326 0.316 0.330 0.308 0.325 0.330
Feasibility of Completion
0.005
(t= 1.17)
-0.003
(t=-0.95) 0.322 0.302 0.292 0.329 0.316 0.319
Future Benefits and market information
0.002
(t= 0.96)
0.006
(t=1.01) 0.535 0.540 0.543 0.540 0.533 0.527
Product Specifications
-0.032
(t= -0.64)
0.049
(t=1.12) 0.887 0.875 0.891 0.906 0.919 0.870
Target uses
-0.007
(t=-1.01)
-0.005
(t=-0.82) 0.167 0.168 0.179 0.168 0.174 0.169
Future Plans
-0.031
(t= -0.50)
0.058
(t=0.77) 0.669 0.660 0.638 0.676 0.700 0.642
Innovation Revenues
54

Table 5: Firm Level Disclosure Scores
This table shows the difference in the scaled disclosure score of firms that have protected their R&D innovations versus firms that did not (panel A) and of firms that reported on a progress in their product pipeline versus firms that did not (panel B). The scaled disclosure score for each firm is calculated by dividing the disclosure index by overall available scores (68 for life sciences firms and 65 otherwise). *** indicates the two-tailed significance at the 1% level.
Panel A - Sample Firms Grouped by Protection vs. No Protection on R&D
Pooled Protection on
R&D No Protection on
R&D Differenc
e Full Sample No. (Percentage) of Obs. 798 699
(88%)
99
(12%)
Mean Scaled Disclosure Score 0.46 0.49 0.22 T-test: 14.638***
Median Scaled Disclosure Score 0.44 0.45 0.20 Wilcoxon Z:
12.745***
IFRS Firms
No. (Percentage) of Obs. 497 422
(85%)
75
(15%)
Mean Scaled Disclosure Score 0.50 0.55 0.24 T-test: 12.437***
Median Scaled Disclosure Score 0.48 0.54 0.23 Wilcoxon Z:
10.640*** US GAAP Firms No. (Percentage) of Obs. 301 277
(92%)
24
(8%)
Mean Scaled Disclosure Score 0.38 0.40 0.14 T-test: 10.461***
Median Scaled Disclosure Score 0.36 0.37 0.13 Wilcoxon Z:
8.165***
55

Table 5: Continued
Panel B - Sample Firms Grouped by Progress in the Product Pipeline
Pooled Progress in
Pipeline No Progress in
Pipeline Difference
Full Sample No. (Percentage) of Obs. 798 356
(44%)
442
(56%)
Mean Scaled Disclosure Score 0.46 0.57 0.36 T-test: 17.709***
Median Scaled Disclosure Score 0.44 0.58 0.35 Wilcoxon Z:
15.328***
IFRS Firms
No. (Percentage) of Obs. 497 250
(50%)
247
(50%)
Mean Scaled Disclosure Score 0.50 0.52 0.37 T-test: 13.888***
Median Scaled Disclosure Score 0.48 0.55 0.35 Wilcoxon Z:
12.046*** US GAAP Firms No. (Percentage) of Obs. 301 106
(35%)
195
(65%)
Mean Scaled Disclosure Score 0.38 0.45 0.34 T-test: 10.123***
Median Scaled Disclosure Score 0.36 0.46 0.35 Wilcoxon Z:
8.876***
56

Table 6: Regressions of scaled disclosure scores on IFRS Dummy and Control determinants of disclosure
Scaled Disclosure Score =αo + α1 (R&D Protection) + α2 (Progress of Product) + α3 (Venture Banking)
+ α4 (Ownership Concentration) + α5 (Firm Size) +ε.
Scaled Disclosure Score for each firm is calculated by dividing the disclosure index by overall available scores (68 for life sciences firms and 65 otherwise). R&D Protection is a binary variable that equals to 1 if the firm has protected its R&D innovations (e.g., through patents, licenses, trademarks, intellectual property), and 0 otherwise. Progress of Product is a binary variable that equals to 1 if the firm has disclosed that a progress was made in its product pipeline, and 0 otherwise. Venture Backing is a binary variable that equals 1 for firms backed by venture capitalists, and 0 otherwise. Ownership Concentration is the percentage share ownership of managers, directors and 5% or greater beneficial owners. Firm Size is the natural logarithm of the firm’s total market value (in $ millions). We control in the regressions for industry and year fixed effects. In the pooled sample regression, presented in the table, we account for the differences between IFRS and US GAAP firms by including IFRS dummy. IFRS dummy is a binary variable that equals 1 if the firm reports in accordance with IFRS, and 0 if the firm reports in accordance with US GAAP. Entries are coefficients; t-statistics appear in parentheses. ***, ** and * indicate significance at the 1%, 5% and 10% level, respectively.
Variable Model 1 Model 2 Model 3 Model 4 Intercept 0.150***
(8.35) 0.324*** (33.24)
0.147*** (9.08)
0.195*** (7.10)
R&D protection 0.251*** (14.88)
0.208*** (13.33)
0.187*** (12.11)
Progress of product
0.125*** (9. 59)
0.103*** (8.60)
0.095*** (8.20)
Venture backing 0.066*** (6.59)
Ownership concentration
-0.001** (-2.68)
Firm Size 0.119*** (9.40)
0.098*** (7.61)
0.088*** (7.55)
0.087*** (7.69)
IFRS dummy 0.096*** (8.29)
0.050*** (5.26)
0.069*** (6.49)
0.075*** (7.16)
Adjusted R2 0.331*** 0.331*** 0.456*** 0.489***
No. of Obs. 798 798 798 798
57

Table 7: Price regressions on firm disclosure scores and control variables
Table 7 shows the regressions results of market value of equity on accounting variables and the scaled disclosure scores. The dependent variable is price per share five months after fiscal year-end; BV is book value of equity per share; E is earnings per share before R&D expense and extraordinary items; RD is annual R&D expense plus the change in capitalized R&D; and DISCLOSURE is the firm’s scaled disclosure index. IFRS is a binary variable that equals 1 if the firm reports in accordance with IFRS, and 0 if the firm reports in accordance with US GAAP. Total (subtotal) Scaled Disclosure Score is calculated by dividing the disclosure index, obtained by the scoring procedure in Table 2, by the overall (category’s) available scores of 68 for life sciences firms and 65 otherwise (Capitalization-related information- 14; R&D activities- 15 for life sciences firms and 12 otherwise; Feasibility of Completion- 10; Future Benefits and Market Information- 9; Product Specifications- 8; Target Uses- 2; Future Plans- 9; Innovation Revenues- 1). Entries are coefficients; t-statistics appear in parentheses. *** and * indicate significance at the 1% and 10% level, respectively.
Total scaled disclosure score
Sub-totals of scaled scores, by disclosure
categories Intercept -0.386***
(-2.96) -0.576***
(-2.18) IFRS -0.471***
(-2.64) -0.666* (-1.95)
BV 0.118*** (4.23)
0.096*** (3.31)
BV*IFRS 0.003 (0.10)
0.006 (0.20)
E 0.342*** (2.04)
0.350*** (2.12)
E*IFRS -0.134 (-0.70)
-0.153 (-0.80)
RD 0.422*** (2.58)
0.458*** (2.74)
RD*IFRS 1.060*** (4.11)
0.818*** (3.10)
DISCLOSURE 0.557*** (2.46)
DISCLOSURE*IFRS 0.859*** (3.31)
Capitalization-RELATED INFORMATION
0.043 (0.12)
Capitalization-RELATED INFORMATION *IFRS
-0.451 (-1.01)
R&D ACTIVITIES 0.911*** (2.16)
R&D ACTIVITIES*IFRS 0.138 (0.27)
FEASIBILITY OF COMPLETION 1.342*** (3.19)
FEASIBILITY OF COMPLETION*IFRS 2.635*** (2.91)
58

Table 7: Continued
Total scaled score of disclosure
Sub-totals of scaled scores, by disclosure
categories FUTURE BENEFITS 0.561***
(1.89) FUTURE BENEFITS*IFRS 0.604***
(2.62) PRODUCT SPECIFICATIONS 0.135
(0.42) PRODUCT SPECIFICATIONS*IFRS 0.446
(1.13) TARGET USES 0.056
(0.24) TARGET USES*IFRS -0.057
(-0.18) FUTURE PLANS 0.121
(0.24) FUTURE PLANS*IFRS -0.235
(-0.53) INNOVATION REVENUES 0.919***
(3.93) INNOVATION REVENUES*IFRS 1.477***
(1.98) Adjusted R2 0.573*** 0.599*** No. of Obs. 696 696
59

Table 8: Future earnings regressions on current earnings and market values
Table 8 shows the regressions results of future earning on market cap and current earnings. as well as on The dependent variable is operating earnings (EBIT) for year t+1, t+2, and t+3, separately, scaled by total assets for year t; Log[MV(t)/TA(t)] is the natural log of the firm’s market value as of the end of March following the firm's fiscal year end scaled by total assets; and EBIT(t)/TA(t) is EBIT scaled by total assets. The regressions include controls for year and industry fixed effects. In panel C we further interact the two independent variables, Log[MV(t)/TA(t)] and EBIT(t)/TA(t), with the year indicator variables (Y2007, Y2008, Y2009, Y2010 and Y2011). I_Life sciences, I_Computers&electronics, I_Software, I_Telecommunications, and I_Other technologies are the industry indicator variables. Entries are coefficients; t-statistics appear in parentheses. *** and * indicate significance at the 1% and 10% level, respectively.
Panel A: IFRS versus US GAAP- Pooled samples
IFRS US GAAP EBIT(t+1)/
TA(t) EBIT(t+2)/
TA(t) EBIT(t+3)/
TA(t) EBIT(t+1)/
TA(t) EBIT(t+2)/
TA(t) EBIT(t+3)/
TA(t) Intercept 0.044***
(T=2.93) 0.023*** (T=3.99)
0.015*** (T=3.19)
0.041*** (T=2.98)
0.013*** (T=3.25)
0.009* (T=1.83)
Log[MV(t)/TA(t)] 0.241*** (T=2.14)
0.472*** (T=2.66)
0.587*** (T=3.20)
0.008* (T=1.77)
0.015** (T=1.89)
0.020** (T=1.99)
EBIT(t)/TA(t) 0.191*** (T=2.80)
0.115*** (T=2.95)
0.114*** (T=2.66)
0.199*** (T=3.07)
0.118*** (T=4.25)
0.117*** (T=4.11)
Adjusted R2 0.428 0.472 0.321 0.223 0.261 0.199 No. of Obs. 497 497 497 301 301 301
Panel B: IFRS capitalizers versus non-capitalizers
Capitalizers Non-capitalizers EBIT(t+1)/
TA(t) EBIT(t+2)/
TA(t) EBIT(t+3)/
TA(t) EBIT(t+1)/
TA(t) EBIT(t+2)/
TA(t) EBIT(t+3)/
TA(t) Intercept 0.069***
(T=3.10) 0.039*** (T=3.29)
0.026*** (T=3.08)
0.040*** (T=2.88)
0.022*** (T=4.41)
0.015*** (T=2.56)
Log[MV(t)/TA(t)] 0.333*** (T=3.66)
0.535*** (T=6.36)
0.651*** (T=6.62)
0.205*** (T=2.64)
0.309*** (T=3.53)
0.419*** (T=3.99)
EBIT(t)/TA(t) 0.136*** (T=8.41)
0.124*** (T=7.02)
0.112*** (T=6.49)
0.125*** (T=2.93)
0.121*** (T=3.59)
0.114*** (T=3.45)
Adjusted R2 0.489 0.494 0.331 0.359 0.457 0.302 No. of Obs. 198 198 198 299 299 299
60

Table 8: Continued
Panel C: IFRS versus US GAAP- Pooled samples including interactions with time
IFRS US GAAP EBIT(t+1)/
TA(t) EBIT(t+2)/
TA(t) EBIT(t+3)/
TA(t) EBIT(t+1)/
TA(t) EBIT(t+2)/
TA(t) EBIT(t+3)/
TA(t) Log[MV(t)/TA(t)]*Y2007 0.120**
0.470*** 0.555*** 0.009*
0.019** 0.026**
Log[MV(t)/TA(t)]*Y2008 0.031*
0.136** 0.297*** 0.008*
0.012** 0.013**
Log[MV(t)/TA(t)]*Y2009 0.150***
0.329*** 0.491*** 0.009*
0.019** 0.024**
Log[MV(t)/TA(t)]*Y2010 0.219***
0.489*** 0.592*** 0.011*
0.020** 0.025**
Log[MV(t)/TA(t)]*Y2011 0.474***
0.888*** 0.947*** 0.006*
0.010* 0.013**
EBIT(t)/TA(t)*Y2007 0.203***
0.310*** 0.180*** 0.118***
0.194*** 0.201***
EBIT(t)/TA(t)*Y2008 0.193***
0.114*** 0.062* 0.260***
0.155*** 0.128***
EBIT(t)/TA(t)*Y2009 0.320***
0.124*** 0.063** 0.059**
0.029** 0.028**
EBIT(t)/TA(t)*Y2010 0.252***
0.132*** 0.116*** 0.060**
0.031** 0.030**
EBIT(t)/TA(t)*Y2011 0.119***
0.088*** 0.114*** 0.299***
0.154*** 0.112***
I_Life sciences 0.039*** 0.020*** 0.017*** 0.039*** 0.012*** 0.037**
I_Computers&electronics 0.011** 0.005 0.008* 0.030*** 0.015*** 0.022**
I_Software 0.055** 0.025** 0.015* 0.051*** 0.016*** 0.006*
I_Telecommunications 0.077*** 0.045*** 0.023*** 0.030*** 0.010** 0.025**
I_Other technologies 0.028** 0.013* 0.019** 0.059*** 0.014*** 0.009*
Adjusted R2 0.593 0.603 0.518 0.454 0.487 0.428 No. of Obs. 497 497 497 301 301 301
61