Embed Size (px)
Citation preview

The Potential Costs and Benefits of Providing
Free Public Transportation Passes to Students
in Los Angeles County

ii

iii
The Potential Costs and Benefits of Providing
Free Public Transportation Passes to Students in Los Angeles County
An Assessment Conducted by the Los Angeles County Department of Public Health
October 2013

iv

v
Principal Authors Lauren N. Gase, MPH Program Manager, Health and Policy Assessment Division of Chronic Disease and Injury Prevention Amelia DeFosset Graduate Student Researcher UCLA Fielding School of Public Health Tony Kuo, MD, MSHS Deputy Director Division of Chronic Disease and Injury Prevention The Health Impact Evaluation Center Steven Teutsch, MD, MPH Chief Science Officer Margaret Shih, MD, MPH Director Office of Health Assessment and Epidemiology Virginia Huang Richman, PhD, MPH Interim Director Office of Planning, Evaluation, and Development Ricardo Basurto-Dávila, PhD, MSc Economist Office of Health Assessment and Epidemiology Eloisa Gonzalez, MD, MPH Director, Cardiovascular Health Division of Chronic Disease and Injury Prevention Janice Casil, MPH Research Analyst Division of Chronic Disease and Injury Prevention Los Angeles County Department of Public Health Jonathan E. Fielding, MD, MPH Director and Health Officer Cynthia A. Harding, MPH Chief Deputy Director

vi
Acknowledgments The Department of Public Health thanks representatives from the Los Angeles County School Attendance Task Force, the Youth Justice Coalition, the Community Rights Campaign, and the Los Angeles County Metropolitan Transportation Authority for their input and feedback on this report. Funding This report is supported in part by funding from The Health Impact Project, a collaboration of the Robert Wood Johnson Foundation and the Pew Charitable Trusts, and The California Endowment. The content and information contained in this report do not necessarily reflect the views of The Health Impact Project or The California Endowment.

vii
EXECUTIVE SUMMARY The Los Angeles County Education Coordinating Council, which comprises representation from the community, the courts, law enforcement, and the education sector, has recommended collaborating with the Los Angeles County Metropolitan Transportation Authority (MTA), school districts, and other organizations to secure free transit passes for all students pre-kindergarten through college, regardless of income. The Los Angeles County Department of Public Health conducted a health impact assessment (HIA) to examine the potential financial and health impacts of such a program. Although it was not possible to directly quantify improvements in school attendance, the program likely will result in significant social and downstream health benefits. Costs accrue primarily to transit agencies, while financial benefits accrue to school districts and families. Major findings from the HIA include: Insufficient data to quantify the impact of free transit passes on school attendance: Many
students in Los Angeles County, especially those in low-income neighborhoods, rely on public transportation to get to school. Although free transit pass programs have recently been initiated in several jurisdictions across the country, no data are currently available to quantify program impact on school attendance.
Evidence in the literature suggests positive health impacts of school attendance and access to public transportation: Educational attainment is one of the most powerful predictors of health. Increases in school attendance can have short- and long-term health effects, including lower rates of teen pregnancy, violence, substance abuse, and chronic disease. Additional benefits include increasing freedom and mobility for students, allowing them to reach jobs and participate in sports and cultural events. Increased use of public transportation could also lead to fewer traffic and violence-related injuries.
Reducing criminalization is a key benefit: Black youth receive a disproportionate number of fare evasion citations in this county. Free transit passes could decrease citations for fare evasion and consequent criminalization of students, a process which can lead to significant social, economic and health impacts.
Costs: The costs of the proposed transit program accrue largely to regional transit agencies, while financial savings accrue primarily to school districts and families. Transit agencies are not expected to derive short-term benefits from this program. The HIA cost analysis suggests that alternative avenues for offsetting transportation costs could be explored.
Other savings: Savings associated with decreased traffic volume and congestion could also benefit communities.
Conclusions A free student transit pass program could potentially increase school attendance and improve health, though the extent of these benefits is uncertain at this time. In the face of this uncertainty, decision-makers may wish to consider a number of additional options including consideration of: Funding options. These could include sharing of revenues gained (e.g., by schools from
increased attendance and decreased costs of providing transportation) or bulk purchasing plans. A meeting of stakeholders including transit agencies could identify practical options.
Alternate scenarios. The program could be restricted by age group (e.g., primary and secondary school students), income level, or distance from school. Expansion of existing discounted fare programs could also partially address student transportation needs.
Pilot or phased-in programs. These could include pilot projects to demonstrate the impact on school attendance or the phased implementation of targeted programs as the impacts of programs in Los Angeles County and elsewhere become known.

viii
Finding common grounds towards a solution Because this HIA is not a feasibility assessment, ways to operationalize a universal free student transit pass program will require further evaluation by key stakeholders and those who will be impacted by such a program, including transit agencies and community stakeholders. Further discussions are needed to help clarify the following:
How a transit pass program can best be tailored and targeted. How a transit pass program might be implemented. Options could include full-scale
implementation, phasing-in of the program, or implementation of a demonstration project with expansion based on evaluation of program impact on school attendance.
How the financial risks can be managed so that costs and benefits are aligned for each of the stakeholders.
1
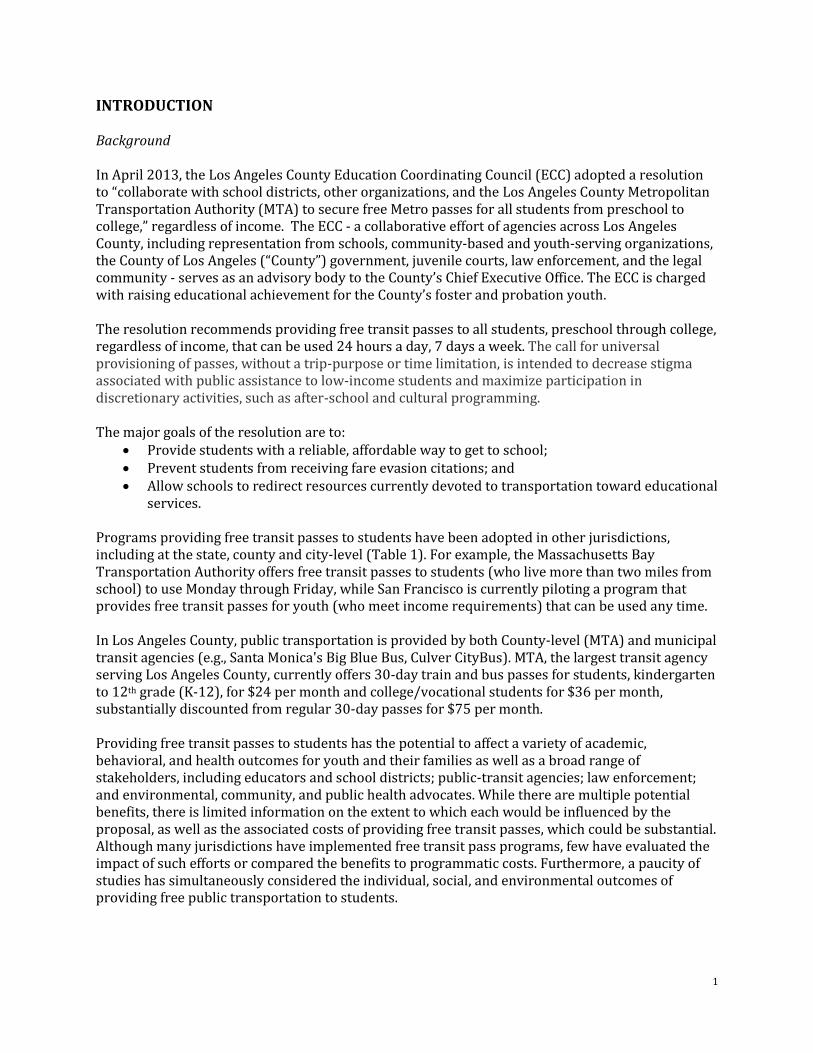
INTRODUCTION Background In April 2013, the Los Angeles County Education Coordinating Council (ECC) adopted a resolution to “collaborate with school districts, other organizations, and the Los Angeles County Metropolitan Transportation Authority (MTA) to secure free Metro passes for all students from preschool to college,” regardless of income. The ECC - a collaborative effort of agencies across Los Angeles County, including representation from schools, community-based and youth-serving organizations, the County of Los Angeles (“County”) government, juvenile courts, law enforcement, and the legal community - serves as an advisory body to the County’s Chief Executive Office. The ECC is charged with raising educational achievement for the County’s foster and probation youth. The resolution recommends providing free transit passes to all students, preschool through college, regardless of income, that can be used 24 hours a day, 7 days a week. The call for universal provisioning of passes, without a trip-purpose or time limitation, is intended to decrease stigma associated with public assistance to low-income students and maximize participation in discretionary activities, such as after-school and cultural programming. The major goals of the resolution are to:
Provide students with a reliable, affordable way to get to school; Prevent students from receiving fare evasion citations; and Allow schools to redirect resources currently devoted to transportation toward educational
services. Programs providing free transit passes to students have been adopted in other jurisdictions, including at the state, county and city-level (Table 1). For example, the Massachusetts Bay Transportation Authority offers free transit passes to students (who live more than two miles from school) to use Monday through Friday, while San Francisco is currently piloting a program that provides free transit passes for youth (who meet income requirements) that can be used any time. In Los Angeles County, public transportation is provided by both County-level (MTA) and municipal transit agencies (e.g., Santa Monica's Big Blue Bus, Culver CityBus). MTA, the largest transit agency serving Los Angeles County, currently offers 30-day train and bus passes for students, kindergarten to 12th grade (K-12), for $24 per month and college/vocational students for $36 per month, substantially discounted from regular 30-day passes for $75 per month. Providing free transit passes to students has the potential to affect a variety of academic, behavioral, and health outcomes for youth and their families as well as a broad range of stakeholders, including educators and school districts; public-transit agencies; law enforcement; and environmental, community, and public health advocates. While there are multiple potential benefits, there is limited information on the extent to which each would be influenced by the proposal, as well as the associated costs of providing free transit passes, which could be substantial. Although many jurisdictions have implemented free transit pass programs, few have evaluated the impact of such efforts or compared the benefits to programmatic costs. Furthermore, a paucity of studies has simultaneously considered the individual, social, and environmental outcomes of providing free public transportation to students.

2
TABLE 1. Jurisdictions Offering Free Transit Passes to Youth.1
Jurisdiction Program Scope Major Goals
Boston, MA
Monthly transit passes are provided free of charge to eligible students at their assigned school. Students are eligible if they live >2 miles from their school (high school) or >1.2 miles (middle school). Passes can only be used Monday-Friday.
Provide
transportation to school.
Save money on student transportation costs (more cost-effective than school-run bussing programs).
New York City, NY New York City provides free or half-fare transit passes to students. Eligibility for either program depends on how far students live from their school. The passes are valid Monday-Friday from 5:30 am-8:30 pm.
Provide transportation to school.
Oakland, CA A two-year pilot program provided free bus passes to low-income high and middle school students. Students obtained passes from their schools. Because of budget shortfalls, the program was cancelled after the first year, 2002.
Provide transportation to school.
Increase freedom and mobility for youth.
Portland, OR The City of Portland provides free transit passes to all public high school students without an income or time-of-day limitation. The passes are only valid during the school year.
Increase freedom and mobility for youth.
Reduce emissions. Encourage the next
generation of transit riders.
San Bernardino County, CA
All students who attend San Bernardino Community College pay a small tuition fee that allows them to access an unlimited any-time travel transit pass, valid on the Omnitrans system in San Bernardino County.
Reduce emissions and reduce demand for parking on campuses.
Encourage next generation of transit users.

3
San Diego, CA The Youth Opportunity Pass program, a one-year pilot, will provide 1,000 passes to students from 4 high schools with high concentrations of public transit dependent students. Use of the passes is not limited to school travel. Students who meet the following criteria can apply for a pass through their school principal:
Use/need transit Families have a difficult time paying for
passes Live far from school Fear for their safety while walking to
school Have previous community and/or
extracurricular involvement Are chronically absent Have siblings who go to other schools Have a part‐time job Have a caregiver/close family member
with a disability
Increase school attendance rates and make it easier for students to stay after school for sports and other activities.
Eliminate the dangers that come with walking through high-crime areas and dangerous intersections.
San Francisco, CA The Free Muni for Youth Pass program, a 16-month pilot program, provides free transit passes to low and moderate income students. All San Francisco youth aged 5 to17 with a gross annual family income at or below 100 percent of the Bay Area Median Income level are eligible. The passes can be used any time.
Increase school attendance.
Decrease criminalization of youth, initiated by fare evasion and other minor offenses.
Encourage a new generation of transit users.
Tempe, AZ The Free Youth Transit Pass Program allows all Tempe youth ages 6 to 18 (children 6 and younger are already free) to ride regional and local bus and metro routes for free. Passes are valid all times, including on weekends, holidays, and during school breaks.
Encourage a new generation of transit riders.
1Not intended to serve as an exhaustive list of all free transit pass programs in the United States (U.S.).

4
One of the primary goals of providing transit passes to students is to increase school attendance and academic achievement, which are strongly related to short- and long-term health outcomes (Robert Wood Johnson, 2013). High school graduation is associated with lower rates of teen pregnancy, violence, substance abuse, and chronic disease (Alameda County Public Health Department, 2013; Freudenberg and Ruglis, 2007; Molla et al., 2004; Belfield et al., 2009). Because of the established connection between educational attainment and health, the Los Angeles County Department of Public Health (DPH) sought to conduct an assessment of the costs and benefits of the proposed free transit pass program. This assessment was carried out on an accelerated timeline to align with the community dialogue and timelines for decision-making. Assessment Scope and Methods While free transit pass programs have been operationalized in different ways across the country (e.g., income requirements, time of day limits), this assessment focuses on the universal provisioning of passes for all students as proposed by the ECC and other stakeholders in the community. Costs and benefits included in this assessment were identified and prioritized based on the potential to be influenced by the program, importance to key stakeholders, and availability of relevant data. Prioritized costs included changes in fare revenues and ridership; the latter can lead to potential overcrowding. Prioritized benefits included changes in school attendance, youth contact with the juvenile justice system, traffic volume and congestion, injuries, opportunities for physical activity, available funds for schools, disposable income for families, and freedom and mobility to youth. While many of these potential benefits may have short- and long-term impacts on health and associated health care costs (Figure 1), DPH focused the assessment on quantifying the short-term benefits. As many of the long-term impacts on health and health care utilization are highly complex and only observable in the long-term, these outcomes were beyond the scope of this assessment. A diverse array of stakeholders was engaged throughout all phases of the project. Three primary methods were utilized to carry out the assessment: 1) a review of published literature, 2) analyses of existing data, including the Southern California Association of Governments Household Travel Survey and the MTA On-Board Survey, and 3) consultation with experts. For details on the methodology, see the Technical Appendix. The findings presented in this report are not intended to serve as a formal recommendation in favor or against program adoption. In making programmatic decisions, this analysis should be considered alongside other factors, such as feasibility and equity.

5
FIGURE 1. Benefits of Providing Free Transit Passes to Students, Potential Pathways.
Increased student attendance
Improved financial stability
Increased student engagement and educational attainment
Increased ability to find quality employment
Decreased student and family stress
Decreased traffic volume and congestion
Decreased citations, arrests and court referrals
Increased available funds for schools
Improved physical and mental health
Improved health knowledge and behaviors
Improved neighborhood conditions
Decreased criminal activity and violence
Decreased substance abuse
Decreased sexually transmitted infections and teen pregnancy
Decreased incarceration Free
transit passes provided to students
Increased freedom and mobility for students
Increased disposable income for families
Increased quality of schools
Reduced greenhouse gases and emissions
Strong, vibrant, resilient communities
Decreased injuries
Note: providing free transit passes to students could lead to increases in some negative outcomes, such as delinquent behavior. See page 17 for a discussion of unintended consequences.

6
POTENTIAL COSTS Decreases in Transit Fare Revenues. If costs are not covered by other funding sources, providing free transit passes to students may result in net revenue losses to public transit agencies. Potential decreases in transit fare revenues were estimated two ways: a) using MTA’s revenue from students (in fiscal year 2013) and b) using average daily rates of use of public transit and fares paid by students in Los Angeles County, as measured by the Southern California Association of Governments Travel Survey (SCAGTS) in 2001. MTA Fiscal Year 2013 Revenues from Student Fares. MTA provided data from fiscal year 2013 (July 1, 2012 – June 30, 2013), which showed students contributed to over $20 million in fare revenues (Table 2). TABLE 2. MTA’s Fiscal Year 2013 Revenues from Student Fares.
Program Name Description FY13 Revenues Passes Sold/ Students Eligible
Cash Fare Discounts
Student Cash Fare With a valid TAP card, student cash fare on local bus service and Metro Rail is $1.00, a discount of $0.50 off the regular local cash fare of $1.50.
$5,200,000 5,270,851
Pass Discounts
Student 30-Day Pass A discounted $24 30-day pass is available to students in grades K-12 with a valid Student TAP Card. The pass is inclusive of zones. Regular pass price is $75, $97 (Zone 1), and $119 (Zone 2).
$10,297,560 429,065
College/Vocational 30-Day Pass
A discounted $36 30-day pass is available to students in grades K-12 with a valid Student TAP Card. The pass is inclusive of zones. Regular pass price is $75, $97 (Zone 1), and $119 (Zone 2).
$3,882,024 107,834
Other Programs
ITAP Programs Colleges and universities subsidize the cost of Metro passes for students. $1,120,619 27,234
Other Discount Programs
County Buydown, Youth on the Move and Rider Relief. No additional
revenues beyond the 30 day passes noted above.
10,742
TOTAL
$20,500,203

7
Fare revenues contribute to just over a quarter of MTA’s total operational budget (MTA, 2013a). In 2013, MTA’s fares covered the lowest percentage of operating costs of any major transit agency in the world (MTA, 2013a). To receive federal funding, MTA is required to meet fare box recovery rates. Decreases in MTA’s operating budget could have negative unintended consequences, such as reduction in services or changes in routes. 2001 SCAG Travel Survey. MTA’s estimates of fare revenues do not include potential revenue losses associated with: a) students who do not take advantage of MTA’s student pricing or discounts, or b) other Los Angeles County transit operators, which represent at least 15% of the total transit market share in Los Angeles County (communication with representative from MTA, September 23, 2013). Consequently, additional estimates of potential revenue losses were calculated using average daily rates of use of public transit and fares paid by students and non-students (age 5 years and older) living in Los Angeles County, based on data from the 2001 SCAG Travel Survey. All trips were considered, regardless of destination, across all bus, rail, and light rail systems that operate in Los Angeles County except for those used primarily for long-distance travel (Metrolink and Amtrak). The calculations indicate that students use public transportation at a higher rate than non-students.
Nearly 5% of students in Los Angeles County used public transportation as their primary mode of transport in 2001, compared to just over 3% of non-students.
While students represented 35% of the population ages 5 years and older, they accounted for 41% of all public transit trips.
Conversely, students paid lower average fares than non-students, with 48% of the trips made by students costing $1 or less, as opposed to 38% for non-students.
Accounting for the average number of trips and paid fares, the assessment estimates that:
Providing free transit passes for K-6 students could lead to a loss of 4% of the total fare revenues for Los Angeles County transit agencies.
Adding free transit passes to students in grades 7-12 could increase the costs an additional 12%, leading to a cumulative loss of 16% of the total fare revenues.
Including trade and technical school and college students as proposed by the ECC could result in an additional loss of 21%, leading to a revised cumulative loss of 37% of the total fare revenues (Table 3).

8
TABLE 3. Estimates of Decreases in Transit Fare Revenues for Los Angeles County Transit Agencies if Free Transit Passes Were Provided to All Students.
Enrollment Status
Population Size1
Use of Public Transit (%)
Average Number of Weekly Trips
Average Weekly Fares Paid2,3 ($)
Weekly Fare Revenues3 ($)
Cumulative Costs of Free Transit Passes3 ($)
Cumulative Costs Relative to Total Fare Revenues (%)
Students 2,868,900 4.5 8.0 7.4 955,344
K – 6 1,113,900 1.2 7.2 7.2 96,241 96,241 4
7 – 12 799,300 6.6 8.0 5.9 311,247 407,488 16
Other Students
894,500 6.9 8.1 8.8 543,140 950,628 37
Unknown 61,200 2.6 * * * - -
Non-students
5,278,300 3.2 8.7 9.5 1,604,603 - -
Total 8,147,2004 3.7 8.4 8.5 2,559,947 - -
1 Only ages 5 years and older; estimated using weighted data from the SCAGTS. 2 All Los Angeles County transit and rail agencies, except for Metrolink and Amtrak (long-distance transit lines). 3 Paid fares reported by SCAGTS participants in 2001 dollars, not adjusted for inflation. 4 The 2001 SCAGTS weighted population for Los Angeles County was listed as 9.01 million. The actual county population in 2001 was approximately 9.5 million. * Sample size too small to estimate cell value.
Currently the ECC resolution does not suggest implementing income requirements for students to receive free passes; however, as other jurisdictions have implemented income eligibility requirements, an analysis of the costs under this scenario was also conducted. Limiting the provision of transit passes to only students from low-income families would significantly decrease the costs of the program. In 2001, 16% of youth in Los Angeles County, ages 5-18, lived in low-income households (below 100% of the federal poverty level). Rates of public transit usage were higher in this population and, thus, average weekly fare estimates were higher in the analysis (SCAGTS, 2001).
Providing a free transit pass for low-income K-12 students could lead to a loss of approximately 7% of the total fare revenues;
Expanding the program to low-income college, graduate, and trade or technical school students could lead to a loss of 11% of the total fare revenues (Table 4).

9
TABLE 4. Estimates of Decreases in Transit Fare Revenues for Los Angeles County Transit Agencies if Free Transit Passes were Limited to Students Living in Low-income Households.1
Enrollment Status
Population Size2
Use of Public Transit3 (%)
Average Number of Weekly Trips
Average Weekly Fares Paid4 ($)
Weekly Fare Revenues4 ($)
Cumulative Costs of Free Transit Passes4 ($)
Cumulative Costs Relative to Total Fare Revenues5 (%)
Students 624,200 6.5% 7.6 7.3 296,183
K – 6 312,200 2.2% 8.4 7.4 50,826 50,826 2
7 – 12 171,800 9.8% 8.0 7.2 121,222 172,048 7
Other Students
131,400 12.4% 6.4 7.4 120,573 292,621 11
Unknown 8,800 6.4% * * * - -
Non-students
689,400 7.5% 9.8 12.0 620,460 - -
Total 1,313,6006 7.0% 8.9 10.0 916,643 - -
1 Households below 2001 federal poverty level (<100% FPL). 2 Only ages 5 years and older; estimated using weighted data from the SCAGTS. 3 All Los Angeles County transit and rail agencies, except for Metrolink and Amtrak (long-distance transit lines). 4 Paid fares reported by SCAGTS participants in 2001 dollars, not adjusted for inflation. 5 Total revenues from all fare payments, taken from Table 3. 6 The 2001 SCAGTS weighted population for Los Angeles County was listed as 9.01 million. The actual county population in 2001 was approximately 9.5 million. * Sample size too small to estimate cell value.
When interpreting the estimates based on SCAGTS data, readers should keep in mind the following limitations. First, SCAGTS contains information on all public transit trips in Los Angeles County by individuals who self-identified as students, regardless of whether they took advantage of the student discounts. Since it is unclear how representative these estimates are of MTA’s student discount programs, it is likely not appropriate to compare estimates of MTA revenue losses to estimates generated using the SCAGTS data. Second, since SCAGTS was collected in 2001, it is unclear how representative the data are of the 2013 student population. Finally, as with any assessment, the quality of the analysis relies on the quality of the survey data. Increases in Transit Ridership. Providing free transit passes to students will likely result in increased transit ridership, which could lead to overcrowding, especially on buses. Overcrowding can result in passenger discomfort and full vehicles passing by waiting riders. Being skipped by the bus extends travel times and disproportionately affects passengers with disabilities (Alameda County Public Health Department, 2013). Experiences of other jurisdictions showed mixed results in the increases of ridership after providing free transit passes to students. Portland public schools, for example, reported having modest increases in ridership, while San Bernardino community colleges reported more significant increases. Both jurisdictions reported minimal added operational (transit) costs as a result of the

10
increase in ridership (communication with representative from San Bernardino Community College District, August 13, 2013; communication with representative from Organizing People, Active Leaders, August 12, 2013). In Los Angeles County, youth (less than age 18 years) ridership tends to be concentrated during peak morning, mid-day, and evening commuting hours. However, in spite of potentially adding to the ridership volume during these peak travel hours, youth represent only less than 7% of the total transit riders during these times (MTA, 2011) (Figure 2). Currently, public transportation in Los Angeles County is among the least crowded in the country, even during peak hours (MTA, 2013a). This underutilization of public transportation is likely the result of a number of interacting factors, including the diffuse nature of regional development in Los Angeles County; the long average trip lengths; perceived safety of public transportation; and increased availability of car travel, as compared to other major metropolitan centers (Lew, 2008).
The current ratio of the number of passengers to available seats is lower in Los Angeles County than for any other major transit agency in the nation (MTA, 2013a).
During the past 20 years, MTA services have outpaced demand by a factor of 3:1 (MTA, 2012).
Estimates of change in ridership in Los Angeles County could vary considerably depending on how the program is operationalized. If free transit passes were provided to all students, short-term ridership could be expected to increase between 9% and 22%, representing an additional 26,000 to 65,000 riders (Table 5). Short-term (<2 years) increases will likely contribute to some overcrowding, as transit agencies lack the time to adjust capacity to meet new demand. Volume of long-term ridership (>10 years) could also increase, by as much as 38%. Costs associated with this increase will likely be attributed to the expanded services that develop over time (Littman, 2004).
Source: MTA, 2011.
FIGURE 2. Youth and Adult MTA Ridership in Los Angeles
County.
0%
10%
20%
30%
40%
50%
60%
70%
80%
90%
100%
AM Peak Mid-day PM Peak OtherTimes
All Other PublicTransit Riders
Youth (<18) PublicTransit Riders
The University of California, Los Angeles’s Experience with the BruinGO Pass
Between October 2000 and June 2001, UCLA piloted an unlimited access pass for students, faculty, and staff
that provided free travel on the Santa Monica Municipal Bus Lines, five of which served the campus area.
During the program’s first year:
Bus ridership for commuting to campus increased by 56%; and
Single-passenger commuting to campus decreased by 20% (Brown et al., 2003).

11
TABLE 5. Estimated Change in Ridership if Free Transit Passes Were Provided to Students in Los Angeles County.1,2
Free Transit Passes Provided to…
Short-Term Long-Term
Lower Bound Upper Bound Lower Bound Upper Bound
All Students K-12 13,300 33,200 39,900 59,800 K-graduate 26,000 65,000 78,000 117,000 Low-Income K-12 4,700 11,800 14,108 21,200 K-graduate 8,100 20,200 24,300 36,400
1 Estimated using the range of transit price elasticities recommended in Littman, 2004. 2 Ridership changes relative to usage reported in the 2001 SCAGTS.
While it is difficult to predict an exact increase in the number of riders, if the volume of passenger traffic increases substantially, additional costs could arise from modifications or expansions to the infrastructure (e.g., additional fleets) or scheduling. The marginal cost of additional riders is likely to vary based on route and time utilization patterns. Potential costs associated with increased ridership, due to increases in bus service and crime, were noted by the MTA in the cost considerations they provided (Table 6).
TABLE 6. MTA Estimated Costs Associated with Increased Transit Ridership.
Analysis from the MTA Scheduling Department in regards to the potential increase in bus services.
Based on an assumed increase of 18% in riders, the proposed free student transit pass program could increase bus services costs by as much as $1,000,000 annually.
Analysis from the Los Angeles County Sheriff’s Department in regards to the potential increase in crime.
In fiscal year 2013, MTA reported 36.9 million boardings for students in K-12 grades. The Transit Services Bureau in the Los Angeles County Sheriff's Department reported that there were 174 crime cases in which children were suspects during the same year. Collectively, these estimates point to a rate of 4.7 crimes per 1,000,000 student boardings. If boardings were to increase by 5.17 to 6.64 million, then crimes involving children as suspects could increase by 24 to 32 cases. Likewise, arrests could increase by 29 to 38 arrests. And non-fare related citations could increase by 114 to 147 citations.

12
POTENTIAL BENEFITS Increase in School Attendance. Transportation is a frequently cited barrier to primary and secondary (K-12) school attendance in Los Angeles County (SATF, 2012; Sapp et al., 2012). While limited data are available on the extent of the problem, a 2009 survey of 1,500 Los Angeles Unified School District (LAUSD) students across 7 campuses revealed lack of affordable transportation as a common reason why students were late or absent from school (Sapp et al., 2012). These findings align with national data which suggest that the inability to afford transportation to and from school is associated with chronic absenteeism (Baker et al., 2001).
Over a quarter (27%) of students (K-12) in Los Angeles County live more than 2 miles from their school (McGuckin, 2012).
Nearly 100,000 students (3%) in Los Angeles County (K-12) regularly use public transportation to get to school (SCAGTS, 2001).
Students from low-income households are more likely than students from higher income households to rely on public transportation to get to school (SCAGTS, 2001) (Figure 3).
Transportation spending can represent an additional burden for college, trade and technical school students already struggling with the high cost of tuition. For low-income college students who are often balancing work with parenting and other responsibilities, lack of affordable transportation could be a reason they fall behind or leave school all together (Graham, 2012). Although increasing student attendance is a goal of many transit pass programs in other jurisdictions, DPH could only locate one evaluation examining the impact of such a program on school attendance (McDonald et al., 2004). Following a pilot program to provide free transit to low-income youth in Oakland, school districts experienced no change in overall school attendance after one year, although participation in after-school programs increased substantially (McDonald et al., 2004). Inability to affect district-wide attendance was not unexpected given the short time frame and limited scope of the pilot program. As students are absent from school for a variety of complex reasons, promoting good attendance requires a comprehensive approach, of which transportation policy is likely to be a key component (McDonald et al., 2004). Students who attend school regularly are more likely to get better grades, perform better on standardized tests, and graduate from high school (Silver et al., 2008;
A 10% decrease in high school dropout rates could result in savings of $113 million a year for Californians through reduction in costs associated with crime, and a more productive and healthier workforce (Belfield et al., 2009).
Source: SCAGTS, 2001.
0% 10% 20% 30% 40% 50%
< $25K
$25K-$50K
$50K-$100K
>$100K
FIGURE 3. Percent of Students Who Regularly Use Public Transportation to Get to School, by Annual Family Income.

13
Allensworth and Easton, 2007; Roby, 2003). In California, 46% of 10th grade dropouts report “missing too many days of school” as their reason for dropping out (Rotermund, 2007). Overall, good school attendance is vital to academic success and on-time course completion, which prevents students from dropping out (Kobrin, 2009). High school graduation is associated with better lifetime behavioral and health outcomes, including less involvement in violence and crime and lower rates of incarceration, teen pregnancy, and substance abuse (Alameda County Public Health Department, 2013). Compared to dropouts, those who graduate from high school live longer and healthier lives (Freudenberg and Ruglis, 2007; Molla et al., 2004; Belfield et al., 2009). Increasing graduation is also good for communities. Greater numbers of high school graduates contribute to lower crime rates, higher tax revenues, and reduced spending on public assistance and health care (Tyler and Lofstrom, 2009; Stuit and Springer, 2010). Annual losses exceed $50 billion in federal and state income taxes for the 23 million U.S. high school dropouts (Levin, 2005). Conversely, each high school graduate contributes $287,000 in tax revenues over his/her lifetime and this number is nearly doubled for those who complete even some college (Woolf et al., 2011). In California alone, each additional student who successfully completes high school results in an additional $187,000 dollars in tax revenues (Woolf et al., 2011). Decrease in Contact with the Juvenile Justice System. Fare evasion is the number one reason why youth (age less than 18 years) are cited by the Los Angeles County Sheriff’s Department (communication with representative from the Sheriff’s Department, June 23, 2013). Fare evasion citations can result in heavy fines (up to $250) or court appearances, which can lead to missed school and work for both the youth themselves and for their parents. As an alternative to citation, MTA currently offers an online educational diversion program to help youth who received a citation reduce fines and avoid court involvement. However, in 2012, less than 500 youth (out of the 9,966 cited for fare evasion) completed the program (MTA, 2013b). In June 2013, MTA began locking the turnstiles on two highly utilized rail lines, which previously had operated on an honor system (Serna, 2013). While this change is predicted to lead to a significant reduction in fare evasion (Serna, 2013), the impact on the number of citations issued to youth is unclear.
High school graduates earn nearly $10,000 more a year (Aud, 2011), and live, on average, 9 years longer than those who drop out (Levin, 2005).
White 2%
Hispanic 44% Black 51%
Other 3%
FIGURE 4. Fare Evasion Citations Issued to Youth (age less than 18 years) by the Los Angeles County Sheriff's Department, 2012.
Total fare evasion citations (in 2012) = 9,966

14
In Los Angeles County, black youth are disproportionally cited for fare evasion (communication with representative from the Sheriff’s Department, June 23, 2013), potentially creating additional stress for black students who use public transportation (Figure 4). Research indicates that perceived discrimination contributes to multiple poor physical and mental health outcomes (Williams et al., 2003). Ticketing and referrals to the juvenile justice system not only create stress for students and families (Sapp et al., 2012), but can set a negative life trajectory for youth. First-time court appearance during high school quadruples a student’s odds of dropping out (Sweeten, 2006; Sapp et al., 2012). Issuing fare evasion tickets also requires use of valuable law enforcement resources. Providing free transit passes to students could free up law enforcement resources to address other important concerns to the community.
Over 92% of the 10,800 citations issued to youth (age less than 18 years) in 2012 by the Los Angeles County Sheriff’s Department were for fare evasion (communication with representative from the Sheriff’s Department, June 23, 2013).
Seven percent of fare evasion citations were issued between 6:00 and 8:00 AM, peak school commuting hours (communication with representative from the Sheriff’s Department, June 23, 2013).
While black youth (age less than 18 years) represent 24% of youth MTA riders, they received 51% of the Sheriff-issued citations for fare evasion in 2012 (MTA, 2011; communication with representative from the Sheriff’s Department, June 23, 2013).
Decrease in Traffic Volume and Congestion. Los Angeles County has some of the worst traffic in the nation (DOT, 2009). In this region and elsewhere, the number one cause of traffic congestion around schools is car transportation of children to or from school (Le Vigne, 2007). Traffic congestion significantly contributes to increased emissions, which negatively impact community and environmental health (Barth, 2009). Increasing the number of students using public transportation to get to school could result in fewer cars on the road, less traffic volume around schools, and reduced greenhouse gases and emissions. Fewer emissions can translate into direct health benefits by reducing the incidence and complications from asthma and other respiratory diseases (Pascal et al., 2013). Increasing student use of public transit can potentially help develop “the next generation of public transit users.” Limited data suggest that young people who grow up using public transportation are more likely to use it as adults, extending immediate environmental impacts into the future (Goodman et al., 2013). Creating future riders was a motivating factor for transit agencies in San Bernardino, San Francisco, Portland, and San Diego to initiate a free student transit program (communications with representatives from San Bernardino Community College District, Aug. 13, 2013; Union Habitat, June 17, 2013; Organizing People, Active Leaders, Aug. 12, 2013; and Mid-City Community Advocacy Network, August 6, 2013). As previously described, providing free transit passes to students can lead to increased transit ridership. While much of this additional ridership may substitute for walking, cycling or rideshare trips, large fare reductions can also attract motorists to use public transportation (Littman, 2004).
Roughly 35% of students drive or are driven to school in a private car in Los Angeles County (SCAGTS, 2001).
Free transit passes would result in thousands fewer youth receiving police-issued fare evasion citations.

15
If 13,000 more students used public transportation (instead of driving or being driven to school), CO2 emissions could be reduced by 20.35 metric tons daily, the equivalent of saving over 2,280 gallons of gasoline.
Decrease in Injuries. Increasing student use of public transportation, thereby decreasing the number of students who walk or drive to school, could result in more students arriving safely to school. Students are more likely to be injured or killed when traveling by car than by any other mode of transportation. Public transportation is a safer alternative to car travel as individuals are 5 times more likely to be injured or killed in a passenger vehicle than while using public transit (National Safety Council, 2011). In Los Angeles County, unsafe neighborhood conditions can limit walking or biking to school and result in students either driving or staying away from school entirely (The Advancement Project, 2013). In San Diego, because the majority of violent crimes perpetrated against students occur around schools, increasing student safety by providing transportation as an alternative to walking through dangerous neighborhood and roadway conditions, is a major goal of the jurisdiction’s free transit pass pilot program (communication with representative from the Mid-City Community Advocacy Network, August 6, 2013).
Over 60% of parents in Los Angeles County and neighboring counties reported being concerned about violence or crime affecting their decision to allow their children to walk or bike to school (NHTS, 2009).
Increase in Physical Activity. Walking to and from public transportation can help physically inactive populations, especially low-income and minority groups, attain the recommended level of daily physical activity (Besser et al., 2005). Some studies suggest that improving access to public transportation has been associated with increased physical activity and reduced obesity. For example, following the expansion of a light rail system in Charlotte, North Carolina, frequent rail users experienced a significant drop in body mass index compared to non-users, probably as a result of longer walk times compared to car travel (McDonald et al., 2010). If a free transit pass program is implemented in Los Angeles County, the majority of those students accessing transit will have already been taking transit, resulting in no net changes in physical activity. While some students will switch from car travel, others may switch from active travel modes (e.g., walking, biking) to public transit. If students take public transit, rather than walking or biking as their primary mode of transportation, their physical activity could decrease. Students for whom neighborhood safety is a concern may be especially likely to reduce walking or biking in favor of public transportation in response to receiving free transit passes.

16
Transportation in Los Angeles Unified School District
As the second largest school district in the nation, the Los Angeles Unified School District (LAUSD) serves the vast majority of students in Los Angeles County. Current district transportation policy is guided by the Board of Education Rule 2376, which mandates that yellow bus service be provided to all special education students and those participating in integration programs who live farther than 2 miles (grades K-5) or 5 miles (grades 6-12) from their school. A limited number of students are also eligible for transportation based on the safety of their potential walk routes, or petitions filed under the No Child Left Behind/Public School Choice legislation. In total, LAUSD provides district bus services to roughly 41,900 students, less than 7% of the student body, at a cost of $145.6 million dollars annually.1
Over $1.4 million dollars is spent subsidizing the purchase of 5,600 student MTA passes per month.2
Over $75 million dollars is spent on providing yellow bus services to students who could potentially take advantage of a free transit pass program.2
1Transportation Services Division, LAUSD, 2013. 2 Communication with representative from LAUSD, September 9, 2013.
A 1% decrease in unexcused absences could
result in an additional $125,000 per year in
funding to schools.
A 5% decrease in unexcused absences could
result in an additional $625,000 per year in
funding for schools.
*Based on LAUSD enrollment data, not representative of all districts (LAUSD, 2010).
Increase in Available Funds for Schools. In the last several years, school districts in Los Angeles County have seen significant decreases in national, state and local funding (communication with representative from LAUSD, September 6, 2013). While shrinking budgets have caused many districts to significantly reduce transportation services, transportation continues to remain a significant source of school district spending. Providing free transit passes for youth could result in school districts being able to redirect funds to enhance educational instruction, extracurricular activities, or services for students and their families. California schools are funded based on the average number of students in attendance each day (Weston, 2010). Across Los Angeles County’s 80 school districts, approximately 57% of the districts’ general fund revenues were attendance driven in 2011-12 (communication with representative from the Los Angeles County Office of Education, August 9, 2013). Thus, getting more students to their desks on a daily basis directly results in more funding for schools.
During the 2012-13 school year, there were 764,540 full-day and 681,319 partial-day unexcused absences in LAUSD. For full-day absences, 369,863 occurred in elementary schools, 135,032 in middle schools, and 191,052 in high schools. For partial-day absences, 185,178 occurred in middle schools and 441,409 occurred in high schools. Most partial day absences occurred during the first period for middle and high school students. Such first period absences may be related to transportation barriers (communication with representative from LAUSD, August 12, 2013).

17
If transportation passes were provided free of charge, Los Angeles County families currently purchasing student MTA passes would save $288 per child each year, enough to buy: 236 pounds of fresh fruits and vegetables (USDA, 2013); 1 youth gym memberships for 1 year (YMCA, 2013); or 3 dental checkups (RSGLA, 2008).*
*See technical appendix for calculations.
Increase in Disposable Income for Families. Families in Los Angeles County spend a significant portion of their income on transportation (Haas et al., 2006). Providing free transit passes for students could reduce overall transportation spending for families, resulting in increased disposable income and increased access to important resources such as healthy food, healthcare services, and opportunities for physical activity and stress reduction. Increases in disposable income have been positively associated with better health and decreases in mortality (Lindahl, 2003).
Transportation expenses (car, public transportation, etc.) represent 53% of total expenses for families making less than $20,000 a year (Haas et al., 2006).
Increase in Freedom and Mobility for Youth. Providing free transit passes to students could allow them to access school as well as other essential destinations, such as after-school programs and extracurricular and cultural events. Other jurisdictions that have expanded youth access to transit, such as Alameda County, have seen subsequent increases in students’ participation in after-school programs and weekend transit ridership (McDonald et al., 2004). Students who participate in after-school programs are more likely to perform better in school and to graduate, compared to students who do not (Mahoney et al., 2005). Increased access to reliable transportation can also expand students’ ability to seek out and retain employment (McDonald et al., 2004). During Oakland’s free transit pass pilot program, discretionary travel - an indicator of students’ ability to access employment and other destinations - increased by 3% (McDonald et al., 2004). Overall, free public transportation increases independent mobility, which empowers youth by increasing the potential for civic participation and strengthening social networks among peers (Goodman et al., 2013). Transit-dependent youth are more likely to live in neighborhoods with fewer resources necessary for healthy, fulfilling lives, and higher rates of violence, crime, and substance abuse (Fauth, 2004). In addition to providing equitable access to employment, healthcare, healthy food, and opportunities for physical activity, providing free transit passes could allow youth to escape neighborhood conditions which have been shown to negatively impact health. While limited data have examined such impacts in the U.S., expansion of accessible public transportation abroad has been associated with decreases in neighborhood violence, increases in collective efficacy, and improved relations with law enforcement (Cedra et al., 2012). While providing free transit passes could potentially result in unintended consequences such as youth using transit to avoid school, research suggesting that student access to public transportation would lead to this and other negative behavioral or health outcomes have not been found in the literature.
13% of students in Los Angeles County live in a household without access to a car (SCAGTS, 2001).
Among MTA riders under age 18 years, 12.7% (~10,000) rely on public transportation to get to and from recreational activities outside of school, 3% use it to get to work and another 2% use it to access civic, religious, or medical destinations (MTA, 2011).

18
Results from a Recent Survey with Youth in Los Angeles County
In the summer and fall of 2013, the Youth Justice Coalition, the Community Rights Campaign, the Children’s Defense Fund, and the Violence Prevention Coalition partnered to develop a survey to gather feedback from students about their experiences getting back and forth to school. A long and short version of the survey were created, which included 21 and 12 closed-ended questions, respectively. Youth were recruited to participate from schools, community meetings, and public places (e.g., transit stops) in low-income areas where transportation was known to be a barrier to school attendance. As of publication of this report, 305 long and 534 short surveys were completed. Survey participants were 47% male. Most self-identified as Hispanic (72%); 12% as African American; and 6% as multi-racial. The mean age was 18 years (standard deviation = 3.8 years, range: 8 to 49 years). Seventy-seven percent reported being current students. Results from the descriptive analysis showed:
44% of students reported taking a public transit bus with another 28% reporting taking the subway to get to school.
31% of students reported being late and 19% reported being absent from school because they could not get reliable transportation.
o 18% of students reported receiving lower grades because they could not get reliable transportation.
o 6% of students reported receiving a truancy ticket or referral because they could not get reliable transportation.
On average, students reported missing 3.7 days of school in the past month (standard deviation = 6.7).
o 75% reported that all or more than half of these absences would not have happened if they had free transportation.
Less than a quarter of students (24%) reported purchasing a discounted monthly student MTA pass.
o The most frequently (46%) reported reason for not purchasing a student pass was that students did not know there was a discounted student pass.
Most frequently, youth reported that if they had a free transit pass, they would use it to go to:
o School (87%); o Job, job search or job training (66%); o Doctor or clinic (62%); o Visit friends or family (61%); o Grocery shopping (53%); o Take brothers and sisters to school or appointments (37%); and o Community centers (37%).
*Additional results from the survey can be obtained from the Youth Justice Coalition.

19
CONCLUSIONS, LIMITATIONS AND RECOMMENDATIONS
Conclusions Base Scenario. Providing free transit passes to all students in Los Angeles County could result in significant costs; for example, the costs to public transit agencies through decreased fare revenues could be significant. Although the present transit system capacity exceeds demand, it is possible that the infrastructure and the anticipated increases in passengers could lead to more crowding on buses and trains. Benefits, if realized, can be significant for a variety of stakeholders. Free transit passes for students could benefit youth and their families through improved school attendance, more freedom and mobility, decreased contact with the juvenile justice system, increased disposable income, and better long-term academic and health outcomes. School districts could receive substantial savings on student transportation and increased revenues due to improved attendance. Law enforcement and juvenile justice agencies could redirect resources currently devoted to youth fare evasion to other priorities. Finally, Los Angeles County as a whole could benefit from decreased traffic congestion and vehicle emissions related to school travel by car. The potential to foster a new generation of transit users has long-term positive implications for many parties as well, including transit agencies. Unfortunately, due to limited data, the magnitude of these potential benefits is difficult to fully quantify. Overall, the identified benefits are distributed broadly to multiple stakeholders, with the costs of providing free transit passes likely to fall disproportionately on transit agencies in Los Angeles County; they are unlikely to benefit directly from the proposed program in the short-term (Table 7).

20
TABLE 7. Summary of the Potential Costs and Benefits of Providing Free Transit Passes to All Students.1
Primary Stakeholder Affected
Potential Short-Term Outcomes
Transit Agencies
Schools Students and Families Communities
Loss of fare revenues
At least $20.5 million in lost fares for the MTA.
Increase public transportation ridership
26,000 to 65,000 additional transit riders
Increase in student attendance
Additional 29,000 hours of school instruction per year for students in LAUSD, for every 1% decrease in unexcused absences.2
Decrease in contact with the juvenile justice system
$750,000 per year less in fare evasion fines issued to youth. Decreased stress and stigma associated with these citations.
Decrease in traffic volume and congestion
13,000 fewer cars on the road each day.
Increase in available funds for schools
$1,344,000 dollars a year saved by LAUSD on subsidized student MTA passes.2 $125,000 in additional revenues for LAUSD, for every 1% decrease in unexcused absences.2
Increase in disposable income for families
$2.5 million per year saved on student transit passes.
Decrease in injuries
Fewer school travel-related injuries.
Increase in freedom and mobility for youth
Increased ability to reach essential destinations, such as cultural activities and work.
1 See Technical Appendix for all calculations. 2 Based on LAUSD data, not representative of Los Angeles County.
21
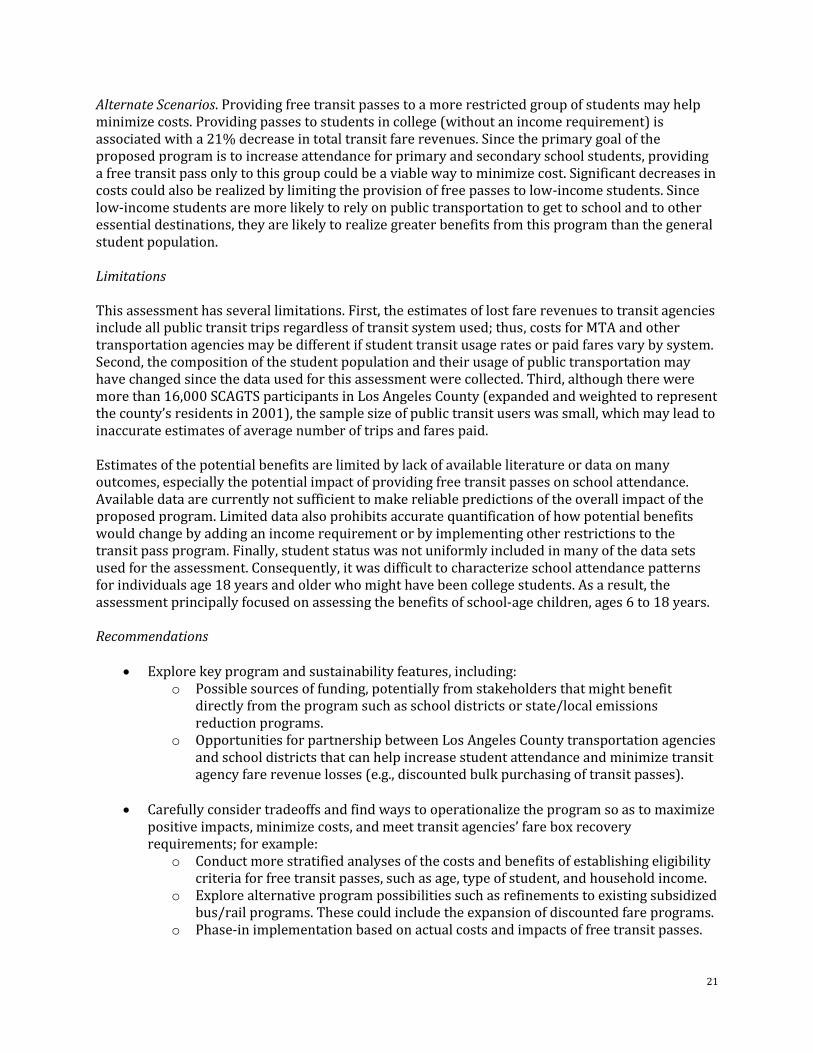
Alternate Scenarios. Providing free transit passes to a more restricted group of students may help minimize costs. Providing passes to students in college (without an income requirement) is associated with a 21% decrease in total transit fare revenues. Since the primary goal of the proposed program is to increase attendance for primary and secondary school students, providing a free transit pass only to this group could be a viable way to minimize cost. Significant decreases in costs could also be realized by limiting the provision of free passes to low-income students. Since low-income students are more likely to rely on public transportation to get to school and to other essential destinations, they are likely to realize greater benefits from this program than the general student population. Limitations This assessment has several limitations. First, the estimates of lost fare revenues to transit agencies include all public transit trips regardless of transit system used; thus, costs for MTA and other transportation agencies may be different if student transit usage rates or paid fares vary by system. Second, the composition of the student population and their usage of public transportation may have changed since the data used for this assessment were collected. Third, although there were more than 16,000 SCAGTS participants in Los Angeles County (expanded and weighted to represent the county’s residents in 2001), the sample size of public transit users was small, which may lead to inaccurate estimates of average number of trips and fares paid. Estimates of the potential benefits are limited by lack of available literature or data on many outcomes, especially the potential impact of providing free transit passes on school attendance. Available data are currently not sufficient to make reliable predictions of the overall impact of the proposed program. Limited data also prohibits accurate quantification of how potential benefits would change by adding an income requirement or by implementing other restrictions to the transit pass program. Finally, student status was not uniformly included in many of the data sets used for the assessment. Consequently, it was difficult to characterize school attendance patterns for individuals age 18 years and older who might have been college students. As a result, the assessment principally focused on assessing the benefits of school-age children, ages 6 to 18 years. Recommendations
Explore key program and sustainability features, including: o Possible sources of funding, potentially from stakeholders that might benefit
directly from the program such as school districts or state/local emissions reduction programs.
o Opportunities for partnership between Los Angeles County transportation agencies and school districts that can help increase student attendance and minimize transit agency fare revenue losses (e.g., discounted bulk purchasing of transit passes).
Carefully consider tradeoffs and find ways to operationalize the program so as to maximize positive impacts, minimize costs, and meet transit agencies’ fare box recovery requirements; for example:
o Conduct more stratified analyses of the costs and benefits of establishing eligibility criteria for free transit passes, such as age, type of student, and household income.
o Explore alternative program possibilities such as refinements to existing subsidized bus/rail programs. These could include the expansion of discounted fare programs.
o Phase-in implementation based on actual costs and impacts of free transit passes.

22
Collect additional program-specific data to more precisely evaluate or forecast the potential impacts of the program; for example:
o Conduct a pilot study with a sub-set of students in Los Angeles County to assess the potential impact of providing free transit passes on student transit use, school attendance, mobility, and health.
o Liaise with other jurisdictions currently developing and implementing free transit pass programs (e.g., San Diego, San Bernardino) to conduct retrospective or prospective analysis of the impacts of providing free transit passes to students.
Ensure participation by relevant transit agencies in discussions about program feasibility
and costs; for example: o Convene a multi-disciplinary workgroup of stakeholders, with representation from
the major transit agencies in the region, to discuss issues related to feasibility, costs, benefits, and programmatic operationalization.

23
REFERENCES Alameda County Public Health Department. Getting on Board for Health: A Health Impact Assessment of Bus Funding and Access Executive Summary. May 2013. Allensworth EM, Easton JQ. What Matters for Staying On-Track and Graduating in Chicago Public High Schools: A Close Look at Course Grades, Failures, and Attendance in the Freshman Year. Consortium on Chicago School Research at the University of Chicago, 2007. Aud S, Hussar W, Kena G, Bianco K, Frohlich L, Kemp J, Tahan K. The Condition of Education, 2011. U.S. Department of Education, National Center for Education Statistics. Washington, DC: U.S. Government Printing Office, 2011. Baker ML, Sigmon JN, Nugent E. Truancy Reduction: Keeping Students in School. Issue brief. Washington D.C.: U.S. Department of Justice, Office of Justice Programs, Office of Juvenile Justice and Delinquency Prevention, 2001. Barth M, Boriboonsomsin K. Traffic congestion and green gases. Access: Transportation Research at the University of California 2009;35:2-9. Belfield CR, Levin HM. High School Dropouts and the Economic Losses from Juvenile Crime in California. California Dropout Research Project Report, Vol. 16. Santa Barbara, CA: Gevirtz Graduate School of Education, University of California, Santa Barbara, 2009. Besser LM, Dannenberg AL. Walking to public transit: steps to help meet physical activity recommendations. Am J Prev Med. 2005 Nov;29(4):273-80. Brown J, Hess DB, Shoup D. BruinGO: An Evaluation. Report. Berkeley, CA: University of California Transportation Center, 2003. Cedra M, Morenoff J, Hansen B, Hicks KT, Duque L. Reducing violence by transforming neighborhoods: A natural experiment in Medellı´n, Colombia. Am J Epidemiol 2012;175(10):1045-053 Department of Transportation (DOT). The City of Los Angeles Transportation Profile. Report. Los Angeles, CA: Los Angeles Department of Transportation, 2009. Fauth RC. The impacts of neighborhood poverty deconcentration efforts on low-income children’s and adolescents’ well-being. Children, Youth Environments 2004;14(1):1-55. Freudenberg N, Ruglis J. Reframing school dropout as a public health issue. Prev Chronic Dis 2007;4(4). http://www.cdc.gov/pcd/issues/2007/oct/07_0063.htm. Accessed July 22, 2013. Goodman A, Jones A, Roberts H, Steinbach R, Green J. ‘We Can All Just Get on a Bus and Go’: Rethinking Independent Mobility in the Context of the Universal Provision of Free Bus Travel to Young Londoners. Mobilities 2013, 1-17. Tandfonline. Web. 24 July 2013. <http://www.tandfonline.com/doi/pdf/10.1080/17450101.2013.782848>.

24
Graham J. New normal: Majority of unemployed attended college. Investor’s Business Daily. Posted 05/17/2012. http://news.investors.com/economy/051712-611887-most-unemployed-are-college-grads-dropouts.htm. Haas PM, Makarewicz C, Benedict A, Sanchez TW, Dawkins CJ. Housing & Transportation Cost Trade-offs and Burdens of Working Households in 28 Metros. Report. Chicago, IL: Center for Neighborhood Technology, 2006. Kobrin M. Truancy Literature Review. Report. Comp. Martha Yeide. Washington D.C.: U.S. Department of Justice, Office of Justice Programs, Office of Juvenile Justice and Delinquency Prevention, 2009. Le Vigne NG. Traffic Congestion Around Schools. Issue brief. Vol. 50. Washington D.C.: Office of Community Oriented Policing Services, U.S. Department of Justice, 2007. Levin, HM, comp. The Social Cost of Inadequate Education: The First Annual Teacher's College Symposium on Educational Equity. Report. New York, NY: Campaign for Educational Equity, 2005. Lew, A. "Los Angeles’ Future in Mobility: Many Goals But Many Obstacles." Wired 9 Apr. 2008: n. pag. Web. Lindahl M. Estimating the effect of income on health and mortality using lottery prizes as an exogenous source of variation in income. J Human Resources 2003;40(1):144-68. Littman, T. Transit price elasticities and cross elasticities. J Public Transportation 2004;7(2):37-58. Los Angeles County Metropolitan Transportation Authority [MTA, 2013a]. Office of Management and Budget. FY14 Proposed Budget. Los Angeles, CA: n.p., 2013. Los Angeles County Metropolitan Transportation Authority [MTA, 2013b]. Systems Safety and Operations Committee: Transit Court Update. Web. 16 May 2013. Los Angeles County Metropolitan Transportation Authority [MTA, 2012]. Office of Management and Budget. FY12 Adopted Budget. Los Angeles, CA: n.p., 2011. Los Angeles County Metropolitan Transportation Authority [MTA, 2011]. The 2011 On-Board Customer Survey. 2011. Raw data. Los Angeles, CA. Los Angeles Unified School District [LAUSD, 2010]. Attendance Policies and Procedures Manual. Report, Vol. 1. Los Angeles, CA: Los Angeles Unified School District Health and Human Services, 2010. Los Angeles Unified School District Transportation Services Division [LAUSD, 2012]. Fact Sheet. Report. Los Angeles, CA: Los Angeles Unified School District, 2012. Mahoney JL, Lord H, Carryl E. An ecological analysis of after-school program participation and the development of academic performance and motivational attributes for disadvantaged children. Child Development 2005;76(4):811-25.

25
McDonald N, Librera S, Deakin E. Free transit for low-income youth experience in San Francisco Bay Area, California. Transportation Research Record: Journal of the Transportation Research Board 2004;1887:153-60. Mcdonald JM, Stokes RJ, Cohen DA, Kofner A, Ridgeway GK. The effect of light rail transit on body mass index and physical activity. Am J Prev Med 2010;39(2):105-12. McGuckin N. Travel to School in Los Angeles County. Issue brief. Los Angeles, CA: Safe Routes to School National Partnership, 2012. Molla MT, Madans JH, Wagener DK. Differentials in adult mortality and activity limitation by years of education in the United States at the end of the 1990s. Pop Development Rev 2004;30(4):625-46. National Safety Council. Transportation Mode Comparisons. Injury Facts. Issue brief. Itasca, IL: National Safety Council, 2011. Pascal M, Corso M, Chanel O, Declercq C, Badaloni C, Cesaroni G, Henschel H, Meister K, Haluza D, Martin-Olmedo P, Medina S. Assessing the public health impacts of urban air pollution in 25 European cities: Results of the Aphekom Project. Sci Total Environment 2013;449:390-400. Ready Set Grow LA (RSGLA). Resources for Low-Cost and Free Dental Services in Los Angeles County. Los Angeles, CA: Ready Set Grow LA, 2008. Robert Wood Johnson Foundation. Why Does Education Matter So Much to Health? March 2103. Available from: http://www.rwjf.org/en/research-publications/find-rwjf-research/2012/12/why-does-education-matter-so-much-to-health-.html Roby DE. Research on school attendance and student achievement: A study of Ohio schools. Educ Res Quarterly 2003;28(1):4-15. Rotermund S. Why Students Drop out of High School: Comparisons from Three National Surveys. California Dropout Research Project Report, Vol. 2. n.p. Santa Barbara, CA: UC Santa Barbara, Gevirtz Graduate School of Education, 2007. Sapp D, Blassi J, Faer L, Criollo M. Counterproductive and Wasteful: Los Angeles’ Daytime Curfew Pushes Students Away From School and Diverts Resources Away From Real Community Safety. Report. Los Angeles, CA: ACLU of Southern California, the Public Counsel, Community Rights Campaign, 2012. School Attendance Task Force [SATF]. A Comprehensive Approach to Improving School Attendance in Los Angeles County: A Report from the School Attendance Task Force. Report. Los Angeles, CA: Los Angeles County Education Coordinating Council, 2012. Serna J. "Have a Ticket to Ride? Metro Starts Locking Subway Turnstiles." Los Angeles Times [Los Angeles] 19 June 2013: n. pag. Silver D, Saunders M, Zarate E. What Factors Predict High School Graduation in the Los Angeles Unified School District. California Dropout Research Project Report, No. 14. Santa Barbara, CA: UC Santa Barbara, Gevirtz Graduate School of Education, 2008.

26
Southern California Association of Governments 2001 Travel Survey. Southern California Association of Governments, n.d. Raw data. 29 July 2013. Stuit DA, Springer JA. California’s high school dropouts: examining the fiscal consequences. Foundation for Educational Choice: Indianapolis, IN. September, 2010. Sweeten G. Who will graduate? Disruption of high school education by arrest and court involvement. Justice Quarterly 2006;23(4):462-80. The Advancement Project. "Belmont School Safe Passage Initiative." Safe Routes to School. n.d. Web. 07 Aug. 2013. Tyler JH, Lofstrom M. Finishing high school: alternative pathways and dropout recovery. The Future of Children. 2009;19(1):77-103. U.S. Department of Agriculture (USDA). National Fruit and Vegetable Retail Report. Report, 30th ed. Vol. VII. Washington D.C.: USDA Agricultural Marketing Service, 2013. U.S. Department of Transportation, Federal Highway Administration, 2009 National Household Travel Survey [NHTS]. Raw data. URL: http://nhts.ornl.gov. Weston M. Funding California Schools: The Revenue Limit System. Report. San Francisco, CA: Public Policy Institute of California, 2010. Williams DR, Neighbors HW, Jackson JS. Racial/ethnic discrimination and health: Findings from community studies. Am J Public Health 2003;93(2):200-08. Woolf S, Zimmerman E, Evans B. Price of a Lost Education: How Education Affects Hunger, Housing, Health and Wealth. VCU Center on Human Needs. Issue Brief. December 2011. YMCA of Metropolitan Los Angeles. YMCA, 2013. Web. 29 July 2013.

27
TECHNICAL APPENDIX
This technical appendix explains the key steps undertaken by the Los Angeles County Department of Public Health (DPH) to conduct a health impact assessment (HIA) examining the potential costs and benefits of providing free transit passes to all students preschool to college, regardless of income. This work was conducted based on the Institute of Medicines’ principles and steps for conducting a HIA. The key steps completed as a part of screening, scoping, assessment, development of recommendations, and stakeholder engagement, are described.
Screening To identify the specific decision to assess for this HIA, the DPH engaged the Los Angeles County School Attendance Task Force (SATF). During town hall meetings hosted by the SATF in 2012, transportation was cited as a major barrier to school attendance by students, who suggested developing a free or subsidized transit pass program (SATF, 2011). When DPH began its preparation to conduct this HIA in 2013, the SATF had already formed a sub-committee (Free Transit Pass SATF subgroup) to identify and assess the relevant opportunities and challenges related to providing free transit passes to students. To assess the potential value, feasibility, and utility of the HIA, DPH independently considered five criteria: 1) project and timing (Is there sufficient time to conduct an analysis before the final decision is made?); 2) health impacts (Does the decision have the potential to affect health downstream?); 3) potential impact of the HIA findings (Can the results be used to help inform decision-making?); 4) potential impact of the HIA process (Will the HIA add value to the decision-making process?); and 5) stakeholder interest and capacity (Do stakeholders have the interest and capacity to participate in the HIA?). The proposal for the free transit pass program for students met all five criteria.
Scoping Specific Decision Alternatives. The decision alternative for this HIA was defined based on the resolution adopted by the Los Angeles County Education Coordinating Council (ECC) in April 2013. The resolution recommended providing free transit (bus and train) passes to all students, regardless of income, and could be used 24 hours a day, 7 days a week (i.e., use not restricted to school travel or weekdays). The universal provisioning of passes is intended to decrease stigma associated with public assistance to low-income students. In addition, removing trip-purpose and time limitations would help maximize ridership and participation in discretionary activities, such as after-school and cultural programming. Although not assessed in this HIA, other options for operationalizing this program do exist (e.g., application of income eligibility requirements, expanding existing subsidized programs). Policy Assessment Questions. In collaboration with the Free Transit Pass SATF subgroup, DPH prioritized three questions: 1) To what extent is transportation a barrier in youth getting to school? 2) What would be the costs of providing free transit passes to students? 3) What would be the short, intermediate, and long-term impacts of providing free transit passes to students?

28
Potential Pathways to Health Impacts. The free transit pass program highlighted by the resolution was expected to have potential impacts on a variety of academic, financial, environmental, and health outcomes. Costs and benefits included in this assessment were identified and prioritized based on the potential to be impacted by the program, importance of the subject matter to key stakeholders, and availability of relevant data. We focused on describing and quantifying (whenever possible) the short-term benefits (i.e., benefits that could be expected within 1-2 years). Because a higher proportion of low-income families rely on public transportation, the program was expected to have the greatest impact on low-income communities (SCAGTS, 2001). The geographical boundary for the assessment was Los Angeles County. Methods and Data Sources. Based on the short timeline available to conduct the assessment, DPH identified three primary methods: 1) review of published literature, 2) analyses of existing data, and 3) consultation with experts. The following existing data sources were deemed useful for inclusion in the assessment: Southern California Association of Government’s 2001 Travel Survey, MTA 2011 On-Board Survey, Los Angeles Unified School District’s data on unexcused absences, and Los Angeles County Sheriff Department data on police-issued citations. Additionally, data form MTA’s own economic analysis of potential program costs and data from a youth survey lead by the Youth Justice Coalition were also considered.
Assessment Methods. DPH used three methods to assess the potential costs and benefits of the free student transit pass program proposal. First, a thorough review of the published literature was conducted through Google Scholar, PubMed and ERIC. Database searches were complemented by gathering information from websites of HIA stakeholders and government agencies, including the Los Angeles County Metropolitan Transportation Authority (MTA), Los Angeles Unified School District (LAUSD), the US Census Bureau, and the Environmental Protection Agency (EPA). Searches were conducted based on each of the cost/benefit categories, for example to assess the connection between transportation and school attendance the following search terms were used: transportation AND student/school attendance OR truancy; transportation AND academic improvement OR delinquency OR dropout OR graduation. To be included in the HIA, sources had to be peer reviewed or published by a credible source. Sources that were published after 1992 (within the last 20 years) and described work conducted within the U.S. were prioritized. Second, DPH consulted with a number of experts in the field of transportation and education. Experts were identified through relationships built with the Free Transit Pass SATF subgroup and through an internet search to identify jurisdictions that had previously implemented a free/reduced cost transit program for youth. In total, nine key informant interviews were conducted with a representative from the following organizations:
Boston Public Schools (Boston, MA) Urban Habitat (San Francisco, CA) Organizing People, Activating Leaders (Portland, OR) People Organizing to Win Employment Rights (San Francisco, CA) San Bernardino Community College District (San Bernardino, CA) Mid-City Community Advocacy Network (San Diego, CA) Los Angeles County Sheriff’s Department (Los Angeles, CA) Los Angeles Unified School District (Los Angeles, CA) Los Angeles County Metropolitan Transportation Authority (Los Angeles, CA)

29
Finally DPH conducted secondary data analysis using data from a variety of sources. The following are the methods used to generate estimates provided in the report. Lost Fare Revenues Data MTA provided data from fiscal year 2013 (July 1, 2012 – June 30, 2013) broken down by type of program (as listed in Table 2). They also provided an estimate of additional costs associated with increased transit ridership in categories that they deemed to potentially create significant costs (listed in Table 6). The Southern California Association of Governments’ 2001 Travel Survey (SCAGTS) was used to estimate potential revenue losses to public transit agencies due to the proposed program. The raw data files for the 2001 SCAGTS are available online at http://www.surveyarchive.org/ (please refer to the Post Census Regional Household Travel Survey Data User’s Manual for description of the dataset and the codebook). The survey collects information on transportation modes and number of trips by members of a random sample of households in Southern California. As the survey was weighted to represent the total population in the SCAG area (15.9 million), and not of individual counties, the total Los Angeles County weighted population used was 9.01 million. As the actual population of Los Angeles County was 9.8 million in 2001, the data excluded roughly 800,000 individuals. We restricted the sample to individuals, ages 5 years and older, living in Los Angeles County and calculated average daily rates of use of public transit and fares paid by students and non-students. Because the ECC proposal is for a free transit pass program that can be used at any time, we included all transit trips, regardless of origin and destination and whether they occurred on school days or not. The potential costs in lost fare revenues of a program covering only students who live in low-income households were also estimated. A low-income household was defined according to the 2001 federal poverty guidelines (below 100%), given their SCAGTS-reported household income and household size (http://aspe.hhs.gov/poverty/01poverty.htm). Increase in Public Transit Riders Potential increases in public transit ridership due to the proposed program were estimated using price elasticities: the relative change in the demand for a good or service given a change in its price. For example, an elasticity of -0.5 implies that a 10% price decrease would result in a 5% increase in demand. A 2004 study that summarized published estimates of price elasticities for public transit use recommended using elasticity values in the interval [-0.2, -0.5] for short-term periods and [-0.6, -0.9] in the long run (Littman, 2004). Our estimates assumed a fare change of -100% for students. Mode of Transportation Data The SCAGTS dataset was also used to obtain summary statistics for transportation mode, household income, and access to a car. As with the lost fare revenue data calculations, we restricted the sample to Los Angeles County residents ages 5 years and older who self-identified as a student. Summary statistics of household and household member characteristics of MTA public transit users were obtained from the Los Angeles County Metropolitan Transportation Authority (MTA) 2011 On-board Survey, which includes trip details and socio-demographic characteristics of riders intercepted during their transit trips in calendar year 2011. Decreased Emissions The average distance driven to school in miles, was taken from the 2009 National Household Travel Survey (McGuckin, 2012). Review of survey data suggest that 13,000 fewer students would drive to school in private vehicles given the calculations of increased transit ridership and based on the

30
assumption that roughly ½ of additional short-term transit riders in this age group would have switched from private car travel. This resulted in 48,126 miles/day in school trips in Los Angeles County. According to the EPA, 423g CO2 are released per mile driven, yielding 20,357,298 (423x48, 126) grams CO2 released daily by car-based school travel, or approximately 20.35 metric tons a day (1 metric ton = 1,000,000 grams). Using the energy conversion tool available on the EPA website, the number of gallons of gasoline that could be saved if all car-based school travel were eliminated was estimated using the following conversion factor: Metric tons to gallons gasoline: .00892 metric tons of CO2 is produced by 1 gallon of gasoline or 1 metric ton of CO2 is produced by burning 112 gallons of gasoline. (http://www.epa.gov/cleanenergy/energy-resources/refs.html#gasoline) Increased Disposable Income: What $288 per Year Could Buy The cost of a single monthly student transit pass ($24) was multiplied by 12 to get the annual cost of $288. To illustrate what $288 per year could purchase the following calculations were conducted:
Fruits and vegetables. The price per pound of all non-organic fruit and vegetables listed in the USDA 2013 Agricultural Report, were averaged and the mean price equaled $1.22 per pound (http://www.ams.usda.gov/mnreports/fvwretail.pdf). The estimated yearly price of a student MTA pass ($288) was divided by the mean price of non-organic US fruits and vegetables in 2013 ($1.22), to find an estimate of the number of pounds of fresh fruits and vegetables that could be purchased.
Youth YMCA passes. Publicly available prices and fees listed on the Los Angeles YMCA website in July 2013 were used to estimate the number of gym memberships a family could buy with annual savings from a student MTA pass. A YMCA youth pass (ages 6-17) cost $24/month, or $288 a year, the exact price per student of one year of a student transit pass.
Dental Checkups. Estimates of costs of dental checkups were based on commonly listed prices at low cost dental clinics in Los Angeles County in July 2013. A dental exam, defined as routine cleaning and x-rays, costs on average $100. Dividing $288 by $100, it was determined one could purchase 2.88 dental exams at this price with savings from a student MTA pass. This figure was rounded up to the closest whole number, 3. (http://www.readysetgrowla.org/campaigns/pdfs/LowCostDentalClinicLACounty.pdf)
Price of Each Full-Day Absence The state of California funds school districts based on student attendance, also known as Average Daily Attendance (ADA). ADA is calculated by dividing the total number of days of full-day student attendance by the number of days of school taught during the same period (Weston, 2010). A student with perfect attendance generates $5,786 each year in revenue for a district. $5,786 divided by 180 days (the number of instructional days in a school year in LAUSD) equals $32.14 per full-day absence. Additional Income to Schools by Increasing Attendance The state of California counts only full-day absences in calculations of Average Daily Attendance (Weston, 2010). In 2012, there were 388,997 full-day unexcused absences in grades 6-12 in LAUSD schools (communication with representative from LAUSD, August 12, 2013). To be conservative, unexcused absences from children K-5 were not included in this analysis because we assumed a free transit pass for students would most likely reduce unexcused absences among older students, who are more likely to rely on public transportation to get to school. A 1% reduction would mean

31
3,889.97 fewer full-day unexcused absences. This number was then multiplied by the dollars lost per full-day absence ($32.14) to obtain the total additional annual funds available if absences were reduced at this level. 1% reductions (3,889.97x$32.14)=$125,040. 5% reduction (19,449.85x$32.14)=$625,118. Increase Instructional Hours In 2012, there were 388,997 full-day unexcused absences in grades 6-12 in LAUSD schools (communication with representative from LAUSD, August 12, 2013). To be conservative, unexcused absences from children K-5 were not included in this analysis because we assumed a free transit pass for students would most likely reduce unexcused absences among older students, who are more likely to rely on public transportation to get to school. As a full school day for students in LAUSD in grades 6-12 is 5.8 hours, this represents 2,256,183 missed instructional hours. During this time there were also 681,319 partial day absences, which were assumed to contribute 1 hour each in missed instructional hours, for a total of 2,626,304 missed instructional hours. A 1% reduction would mean 29,375 additional instructional hours.
Characterization of Potential Benefits and Recommendations As the final step in the assessment, each of the potential benefits was characterized based on its likelihood, magnitude, severity and distribution (Table I). Characterization of each benefit was done by the 6 members of the HIA team, who considered all of the information gathered through the literature review, analysis of existing data, and consultation with experts. After independent review of the data gathered from the assessment, the team met to discuss and reach consensus on the rankings. Based on the characterization of potential benefits, the HIA team worked collaboratively to develop recommendations.
References Please refer to the REFERENCES section in the main report.

32
TABLE I. Characterization of the Potential Benefits of Providing Free Transit Passes to Youth.1
Potential Short-Term Benefits
Associated Intermediate and Long-Term Benefits
Likelihood
How certain is it that the decision will
affect the benefits?2
Magnitude How much will the benefit change as a
result of the decision?3
Severity How important is the benefit
with regard to human function, well-being or
longevity?4
Distribution How will the benefit be
distributed across populations?5
Increase in student attendance
Increased educational attainment Decreased risky sexual behavior Decreased substance abuse Decreased criminal activity and violence Increased ability to find quality work
Possible Limited Medium Restorative equity effects
Decrease in contact with the juvenile justice system
Decreased student and family stress Decreased criminal activity and violence Increased ability to find quality work Decreased incarceration
Very likely Substantial Medium Restorative equity effects
Decrease in traffic and congestion
Reduced greenhouse gases and emissions
Improved neighborhood conditions
Possible Limited Low None
Increase in available funds for schools
Increased quality of schools Increased student engagement and
educational attainment
Likely Moderate Medium Disproportionate benefits
Increase in disposable income for families
Improved financial stability Improved physical and mental health
Very likely Moderate Medium Restorative equity effects
Increase in freedom and mobility for youth
Increased student engagement and educational attainment
Likely Limited Low Restorative equity effects
1 Developed based on “Health Impact Assessment: A guide for practice” by Rajiv Bhatia (2011). 2 Classified possible (logically plausible effect with limited or uncertain supporting evidence), likely (logically plausible effect with substantial and consistent supporting evidence and substantial uncertainties), or very likely (adequate evidence for a causal and generalizable effect). 3 Classified as limited (change of less than one-tenth of 1% of the population based frequency of a health endpoint), moderate A change of between 0.1% and 1% in the population frequency of a health endpoint), or substantial (a change of greater than 1% in the population frequency of a health endpoint). 4 Classified as low (acute, short-term effects with limited and reversible effects), medium (acute, chronic, or permanent effects that substantially affect function, well-being, or livelihood), or high (acute, chronic, or permanent effects that are potentially disabling or life-threatening). 5 Classified as disproportionate harms (the decision will result in disproportionate adverse effects to populations defined by demographics, culture, or geography), disproportionate benefits (the decision will result in disproportionate beneficial effects to populations defined by demographics, culture, or geography), or restorative equity effects (the decision will reverse or undo existing or historical inequitable health-relevant conditions or health disparities).

33
Stakeholder Engagement Stakeholders were engaged and involved throughout each step of the HIA process. Table II lists the contributions of key stakeholders to the HIA. An independent assessment of the potential costs of providing free transit passes to students was conducted by the MTA. In addition, an independent assessment of the potential benefits of providing free transit passes was conducted via surveys with youth by the Free Transit Pass SATF subgroup. The results of both of these assessments are provided as a component of this HIA. TABLE II. Stakeholder Contributions to the Health Impact Assessment.
Stakeholder Key Contributions
The School Attendance Taskforce (SATF) Member organizations Los Angeles County Delinquency and Dependency Courts Los Angeles County District Attorney’s Office City of Los Angeles Attorney Los Angeles Police Department Los Angeles School Police Department Los Angeles County Office of the Public Defender Children’s Law Center Public Counsel ACLU of Southern California County of Los Angeles Chief Executive Office Los Angeles County Department of Children and Family
Services Los Angeles County Probation Department Los Angeles County Office of Education Alhambra Unified School District Long Beach Unified School District Los Angeles Unified School District Lynwood Unified School District Pomona Unified School District New Village Charter School Community Rights Campaign The Children’s Defense Fund Sarges Community Base The Advancement Project Attendance Improvement Management Living Advantage
Identified the HIA subject matter. Identified the decision alternatives. Provided review and feedback on the
issue brief document.
Students in Los Angeles County
Identified the HIA subject matter. Provided input on the highest priority
benefits.
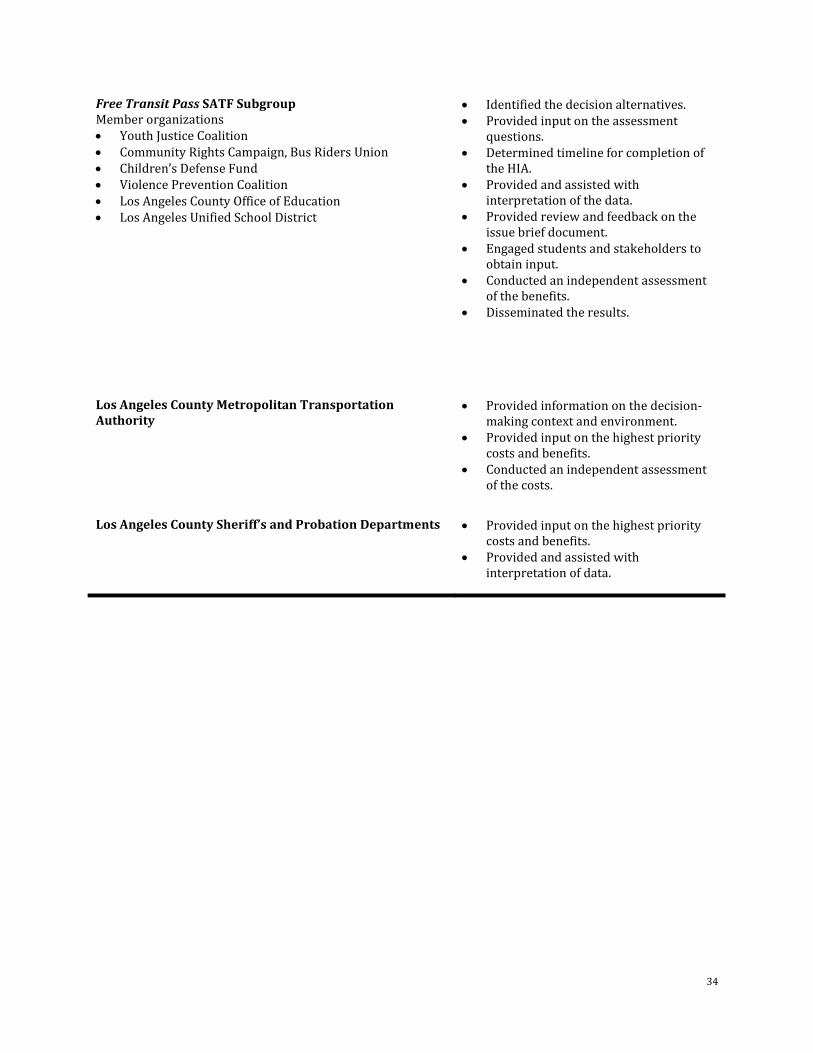
34
Free Transit Pass SATF Subgroup Member organizations Youth Justice Coalition Community Rights Campaign, Bus Riders Union Children’s Defense Fund Violence Prevention Coalition Los Angeles County Office of Education Los Angeles Unified School District
Identified the decision alternatives. Provided input on the assessment
questions. Determined timeline for completion of
the HIA. Provided and assisted with
interpretation of the data. Provided review and feedback on the
issue brief document. Engaged students and stakeholders to
obtain input. Conducted an independent assessment
of the benefits. Disseminated the results.
Los Angeles County Metropolitan Transportation Authority
Provided information on the decision-making context and environment.
Provided input on the highest priority costs and benefits.
Conducted an independent assessment of the costs.
Los Angeles County Sheriff’s and Probation Departments Provided input on the highest priority costs and benefits.
Provided and assisted with interpretation of data.

35

36
Suggested Citation
Los Angeles County Department of Public Health. The Potential Costs and Benefits of Providing Free
Public Transportation Passes to Students in Los Angeles County. Full Report. October 2013.