Embed Size (px)
Citation preview
The Potential Effect of Brexit on the U.S. Insurance Industry Analyzing the U.K.’s Exit from the European Union
February 2019

2
Copyright © 2019 Society of Actuaries
The Potential Effect of Brexit on the U.S. Insurance Industry Analyzing the U.K.’s Exit from the European Union
Caveat and Disclaimer The opinions expressed and conclusions reached by the author are her own and do not represent any official position or opinion of the Society of Actuaries or its members. The Society of Actuaries makes no representation or warranty to the accuracy of the information Copyright © 2019 by the Society of Actuaries. All rights reserved.
AUTHOR
Julie Y. Nye, MBA
International Insurance Consultant
Expat Consulting
SPONSOR Committee on Finance Research
3
Copyright © 2019 Society of Actuaries
CONTENTS
Executive Summary.................................................................................................................................. 5
1 Historical and Political Backdrop of the European Union ...................................................................... 7
1.1 The European Union and Its Predecessors ............................................................................. 8
1.2 Current European Union and European Economic Area Membership by Country ................. 9
1.3 Events Leading to the 2016 Brexit Vote ................................................................................. 9
1.4 Political Ramifications and Progress to Date ....................................................................... 11
2 Economic Backdrop of the European Union and United Kingdom, Compared with the United
States ..................................................................................................................................................... 12
2.1 Insurance Relationships ...................................................................................................... 12
2.2 Leading Macroeconomic Factors in the U.S., U.K. and EU .................................................... 14
2.2.1 Gross Domestic Product ....................................................................................................... 14
2.2.2 Interest Rates: U.S., U.K. and Eurozone ............................................................................... 15
2.2.3 Inflation: U.S., U.K. and Eurozone ........................................................................................ 16
2.2.4 Exchange Rates ..................................................................................................................... 17
2.3 Insurance Industry Performance Measures ......................................................................... 18
2.3.1 Insurance Premium Revenue ............................................................................................... 18
2.3.2 Investments and Asset Allocations ...................................................................................... 19
2.3.3 Effect on Insurance Relative to Other Industries ................................................................ 19
2. Trading Relationships and Treaties ..................................................................................... 20
2.4.1 Current Trading Terms and Treaties .................................................................................... 21
2.4.2 Potential Tax Implications .................................................................................................... 22
3 Forecasting the Economic Impact of Brexit ......................................................................................... 23
3.1 Models of Leading Financial Indicator Changes: Consistent Growth Trend,
Moderate, and Worst-Case Basis ........................................................................................................... 23 3.1.1 Gross Domestic Product ................................................................................................................ 28
Forecast Set 1 .................................................................................................................................................. 28 Forecast Set 3 .................................................................................................................................................. 28
3.1.2 Interest Rates: U.S., U.K. and Eurozone ......................................................................................... 28 Forecast Set 1 .................................................................................................................................................. 29 Forecast Set 3 .................................................................................................................................................. 29
3.1.3 Inflation: U.S., U.K. and Eurozone ................................................................................................. 29 Forecast Set 1 .................................................................................................................................................. 29 Forecast Set 2 .................................................................................................................................................. 31 Forecast Set 3 .................................................................................................................................................. 31
3.1.4 Exchange Rates ............................................................................................................................. 31 Forecast Set 1 .................................................................................................................................................. 31 Forecast Set 3 .................................................................................................................................................. 32
3.1.5 Insurance Premium Revenue ......................................................................................................... 32 Forecast Set 1 .................................................................................................................................................. 33
Conclusion ............................................................................................................................................. 35
Appendix ............................................................................................................................................... 36
About The Society of Actuaries .............................................................................................................. 43

4
Copyright © 2019 Society of Actuaries

5
Copyright © 2019 Society of Actuaries
The Potential Effect of Brexit on the U.S. Insurance Industry Analyzing the U.K.’s Exit from the European Union
Executive Summary
In June 2016, the British people made the historic and groundbreaking decision to leave the European Union. This
vote, the first of its kind by a European Union member, could have wide-ranging effects for the United Kingdom, the
rest of the European Union, the United States, and even the global economy. The U.S. insurance industry, in
particular, could be affected by ensuing changes; insurance in the U.S. owes its heritage to the United Kingdom and
Lloyd’s of London, and the two countries are still very closely related today: U.S. insurers still invest in the U.K. more
than any other country in the world.
Brexit, as the United Kingdom’s exit from the European Union is commonly known, is still evolving as of this writing
(February 2019), even though its currently planned effective date in March of 2019 is approaching. The exact terms
of Brexit, including which benefits and freedoms will continue to apply to the United Kingdom after they leave, will
likely also affect the future economic health of the United Kingdom and the rest of the European Union.
Furthermore, this research paper seeks to address U.S. insurance market impact relating to Brexit and possible
ramifications further afield. For planning purposes, several potential scenarios and economic outcomes are scoped
out, despite the exact terms of the arrangement being undecided as of this writing.
Since a downward trend in the U.K. economy post-Brexit could affect the U.S. insurance market to predict and size
this impact, this paper summarizes the political and economic history of the U.K. and European Union, as well as the
macroeconomic fortunes of the U.S., the U.K. and the rest of the European Union in recent history. From here, three
different forecasts lend insight into a consistent growth trend, a moderate view of the future impact, and a worst-
case scenario. The forecast sets review and predict gross domestic product, interest rates, inflation, exchange rates
and insurance market size in the United States, United Kingdom and European Union. In determining potential
future states, this report collects and summarizes predictions from independent international sources such as the
International Monetary Fund and the relevant central banks; the interrelationships with other factors (such as how
inflation affects exchange rates) are tested or plotted out using basic economic theory. Other predictions take a
more extreme view and look to the history of other European Union countries to model an unfavorable economic
future for the United Kingdom and the European Union post-Brexit and to forecast what this could mean for the U.S.
insurance industry. Factors such as market disruption, loss of profits from European holdings, exchange rate
volatility, and loss of capacity in the reinsurance markets all play a part in the review.
The most interesting conclusions from this research are the apparent extremes: while the U.S. and U.K. markets are
closely linked, projected effects of Brexit range from slight to significant. Disruption to policies as well as trade
relationships, treaties and taxes could affect U.S. insurers and their customers; reinsurance capacity in Europe could
retract, limiting U.S. insurers’ flexibility in writing coverage; and U.K. holdings of U.S. firms could see greater losses if
the worst-case view unfolds in reality. The first projection shows more of the same—a growing U.S. insurance
market, continued contraction in the more mature U.K. and EU regions, with moderately increasing interest rates
and relatively stable inflation. The U.S. insurance market appears mostly unaffected in this scenario: projected
insurance premiums are still 29% greater in 2022 than in 2015. In the middle-ground scenario, U.S. insurance
premiums grow by 25% over the same time period, and inflation and interest rates rise more steeply. Under the
worst-case model, more extreme results ensue, but even with this high-inflation, high-interest-rate, stronger-dollar
environment, even in the most extreme view, the U.S. market is predicted to be only minimally affected. Over the

6
Copyright © 2019 Society of Actuaries
same time period, premiums still increase, but by 20% instead of 29%. While this is a significant difference in dollar
terms —$234 billion in 2022 alone—it still equates to market growth and a positive outlook for the U.S.—not as
different as some might predict. The questions now are to what extent these views predict the future and how
much Brexit will truly make its mark on the U.S. insurance industry.
7
Copyright © 2019 Society of Actuaries
1 Historical and Political Backdrop of the European Union
Following a historic national vote on June 23, 2016, the British public narrowly voted for the United Kingdom to
leave the European Union, and the British government is still working on implementing this move, popularly known
as “Brexit,” in early 2019. Since joining the EU’s predecessor organization, known as the Common Market, in 1973,
the United Kingdom has been a major party to this European economic and political union. The future of the
European Union could well be challenged by this change, as is the British economy. Fees for leaving the European
Union and becoming a third country under EU law are widely speculated and currently being negotiated as of this
writing, but the “divorce bill” could be up to £39 billion (€45 billion or $55 billion). The terms of the exit will likely fall
somewhere between a “hard Brexit” (Britain cutting almost all existing ties to the European Union) or a “soft Brexit”
(Britain becoming a third country outside the European Union but setting up agreements similar to the current
relationship). The result could be a significant financial impact on the economies of the United Kingdom, the rest of
Europe and the United States, including, of course, the insurance and reinsurance sector, with its strong ties
between the regions. This paper will explore other reasons why this change involving a country around the size of
Wyoming could still be felt in the United States insurance industry.
The United Kingdom and the United States are inextricably linked in many ways, including a shared language and
overlapping history. Since the United States’ successful war of independence against Great Britain in the 18th
century, arguably, the ties between the two countries have never been stronger than in the last decades, and this is
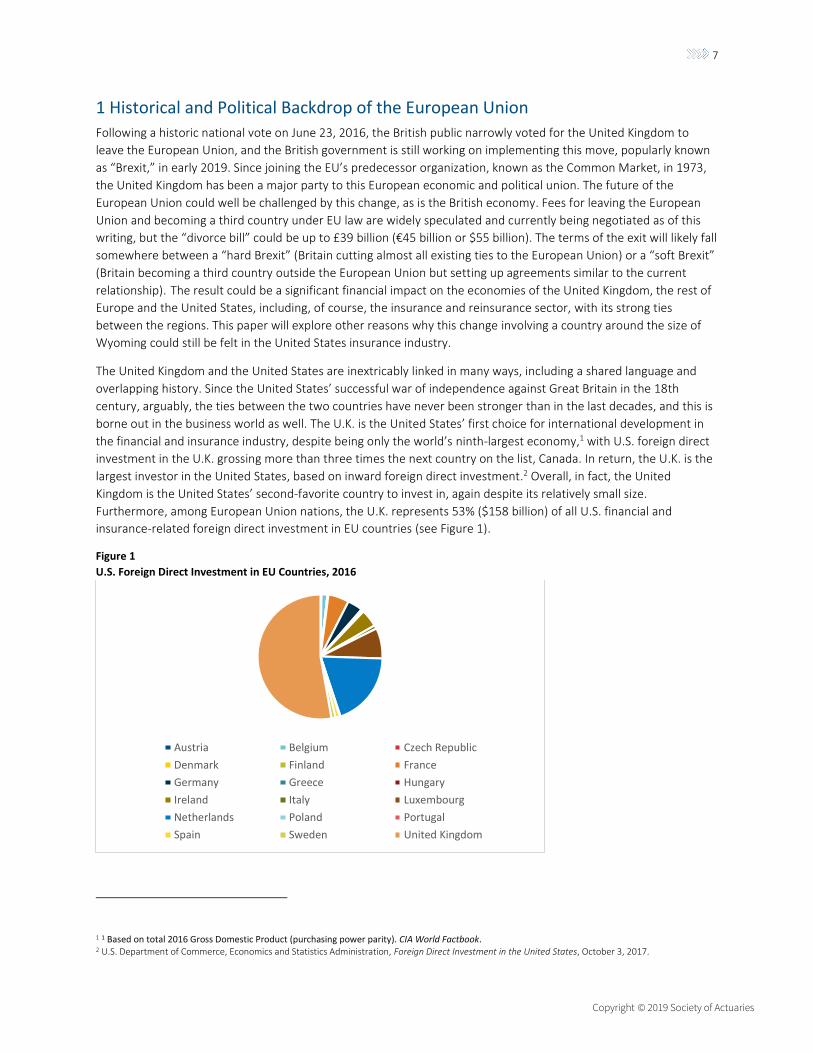
borne out in the business world as well. The U.K. is the United States’ first choice for international development in
the financial and insurance industry, despite being only the world’s ninth-largest economy,1 with U.S. foreign direct
investment in the U.K. grossing more than three times the next country on the list, Canada. In return, the U.K. is the
largest investor in the United States, based on inward foreign direct investment.2 Overall, in fact, the United
Kingdom is the United States’ second-favorite country to invest in, again despite its relatively small size.
Furthermore, among European Union nations, the U.K. represents 53% ($158 billion) of all U.S. financial and
insurance-related foreign direct investment in EU countries (see Figure 1).
Figure 1
U.S. Foreign Direct Investment in EU Countries, 2016
1 1 Based on total 2016 Gross Domestic Product (purchasing power parity). CIA World Factbook. 2 U.S. Department of Commerce, Economics and Statistics Administration, Foreign Direct Investment in the United States, October 3, 2017.
Austria Belgium Czech Republic
Denmark Finland France
Germany Greece Hungary
Ireland Italy Luxembourg
Netherlands Poland Portugal
Spain Sweden United Kingdom
8
Copyright © 2019 Society of Actuaries
Source: Bureau of Economic Analysis, Balance of Payments and Direct Position Data, US Direct Investment Abroad,
Historical-Cost Basis
This paper considers the extent of financial ties between U.S. insurers, reinsurers, and other financial institutions,
and investigates the extent to which the U.S. insurance market is affected by changes in the European Union, and in
particular the U.K. This also includes a thorough review of the macroeconomic trends that occurred before the
Brexit vote, in progress (as of this writing) between 2017 and 2019, and seeks to forecast, in broad terms, the
economic impact after Britain leaves the European Union, in order to determine the magnitude of the impact that
can be expected on the U.S. insurance industry.
1.1 The European Union and Its Predecessors
The European Union, in its current form, draws its official heritage from the Maastricht Treaty of 1993. Unofficially
and culturally, however, the roots of the European Union as we know it today first appeared at the end of World
War II, when neighboring governments sought to create a brighter commercial future following the end of two
divisive and catastrophic wars. As early as 1950, just five years after the end of World War II, the European Coal and
Steel Community was formed between initial members and future European Union stalwarts Belgium, France, West
Germany, Italy, Luxembourg and the Netherlands. In 1957, these founding countries signed the European Economic
Community (EEC) treaty in Rome, establishing the “Common Market,” as it was also known. Further business-
friendly changes such as a reduction in customs duties followed, and other members joined: Denmark, Ireland and
the United Kingdom in 1973; Greece in 1981; and Spain and Portugal in 1986. A complete, current list of European
Union members as of 2018 is found in the Appendix.
The insurance industry was not specifically addressed before 1989,3 and each country continued to maintain its own
often complex and incompatible set of insurance regulations. Even so, the expansion of the Common Market and
more favorable business terms in themselves created greater business prospects among European insurers and
reinsurers and the U.S. insurers that relied on them.
The Maastricht treaty, signed by these 12 original members, promised further economic and monetary union.
Members were required to maintain sound fiscal policies, with debt not to exceed 60% of respective gross domestic
product (GDP) and annual deficits required to be less than 3% of GDP.4 Ultimately, the treaty would go on to create
the single European currency, the euro, which was adopted in 1999. By 1995, Austria, Finland and Sweden had
joined the EU, bringing the number of member countries to 15, but only 12 of the countries adopted the euro. The
United Kingdom, Denmark and Sweden opted to maintain the pound sterling, krone, and krona, respectively,
intentionally remaining outside the “Eurozone.”
This updated European Union also promises its members four freedoms: the free movement of goods, capital,
services and people within the European Union. This further expands on the precursor arrangements that lowered
tariffs and import duties, boosting trade to the point where these additional costs of doing international business
would not normally apply within the European Union. International banking and other financial services, including
insurance, benefit from the free movement of capital, although it should be clarified that insurance statutes still
differ so widely from country to country that it is difficult to write one insurance policy covering multiple countries.
The free movement of people also affects business, for example, in employing individuals on assignment outside
their country of citizenship. Although the United Kingdom is already outside the Schengen Zone, the area that allows
3 European Economic Community, Switzerland. Agreement between the European Economic Community and the Swiss Confederation on direct insurance other than life assurance. https://eur-lex.europa.eu/legal-content/EN/ALL/?uri=CELEX%3A21991A0727%2801%29 (accessed Spring, 2018) 4 Maastricht Treaty protocol: https://eur-lex.europa.eu/summary/glossary/excessive_deficit_procedure.html

9
Copyright © 2019 Society of Actuaries
individuals to travel between European Union countries without a passport as if moving from state to state in the
U.S., EU citizens can still move to the U.K. and live and work there, due to European Union membership.
The potential loss of all four of these freedoms in 2019 would, of course, affect U.K. and European business. Finding
a suitable alternative or middle-ground arrangement for these freedoms is therefore a key element of the Brexit
negotiations. As of this writing, European Union negotiators including Michel Barnier have been very clear that
these agreements will not be replicated wholesale after Brexit, but there is some allowance for a potential ongoing
trade and economic partnership, along with protection of citizens’ rights. As of March 2018, in fact, the U.K. and EU
agreed on a transition period to run through the end of 2020.
1.2 Current European Union and European Economic Area Membership by Country
Figure 2 gives a view of which countries in Europe are members of the European Union and which use the euro,
with and without approval. Figure 16 (in the appendix) provides a country-by-country list of membership, including
EU, European Free Trade Association (EFTA), and Eurozone.
Figure 2 The Eurozone, European Union, and other countries using the euro
Source: Map by Evan Centanni, from blank map by Ssolbergj. License: CC BY-SA.
1.3 Events Leading to the 2016 Brexit Vote
On June 23, 2016, the British public voted to leave the European Union following a referendum called by then-
prime-minister David Cameron. Cameron was in favor of remaining in the European Union but followed through on
a campaign promise to hold a referendum if elected. The vote to leave was a surprising outcome for many, including
those following the polls. The majority was narrow—52% for leaving versus 48% for remaining—and split across
many demographic and regional strata. For example, 56% of voters aged 50–64 and 61% over 65 voted to leave, but
the majority of voters aged 18–49 voted to stay. The majority of Scottish voters elected to remain in the European
Union. However, because Scotland is part of the United Kingdom (a referendum to secede from the union was not
passed in 2014), Scotland will, along with England, Wales and Northern Ireland, leave the European Union in 2019.
10
Copyright © 2019 Society of Actuaries
Those who voted to leave the European Union were swayed by three major factors: sovereignty, immigration, and
money. Sovereignty has long been a concern for the British Isles, since the “splendid isolation” of the late 19th
century5 and the world wars of the 20th century. That concern was magnified in many ways by the United
Kingdom’s geographic formation as an island nation just a few short miles—21 at the narrowest point—from the
European mainland. On a continent where cultures and languages can change dramatically several times over within
a few hundred miles, and where embedded histories are intertwined with older regional conflicts, the unification
into one Europe has always faced challenges. Early on in the history of the European Union, Brits in particular
bristled at much of the related policymaking, which is extensive and can sometimes veer to the absurd. A famous
case involved the “Extra Class 1” classification of straighter bananas as preferable, with curved (or “bendy”) ones
being unacceptable due to “defects of shape.”6 Within the European Union, there are two types of policy:
regulations, which must be adopted by all member states, and directives, which require a local statutory instrument
to adopt into law, thereby allowing each country some freedom of interpretation. This allows some flexibility in
policy, but for those in a centuries-old island state monarchy, membership in the European Union certainly resulted
in less autonomy.
From an immigration perspective, changes in the U.K. since the Maastricht treaty have included a noticeable shift in
demographics, with almost 1 in 10 residents of the U.K. being citizens of other countries, and many more having
moved to the U.K. and gained citizenship there. In fact, with an immigrant population of over 9%, the U.K. holds
greater national diversity than the United States, with 7% non-U.S. citizens.7 Of those in the U.K., most are European
nationals from other member countries, especially Eastern European states. The highest number are from Poland,
with about one million Polish nationals living in the U.K. in 2017.8 The current trend toward populism likely helped
sway the vote to leave, spearheaded by the U.K. Independence Party (UKIP), founded by Nigel Farage, but it would
be too simplistic to state that populism or even nationalistic or racist groups swayed the vote. Despite experiencing
an immense demographic change, the U.K. is still mostly populated by ethnic Europeans.
Economic factors affected the votes as well. As we shall see in the financial-indicator analysis, there have been some
changes in leading financial indicators since the vote to leave the European Union; there have also been major
changes over the last 60 postwar years as Britain’s fortunes have risen or fallen. The question is whether these
changes occurred as a result of or in spite of the closeness of the U.K.’s relationship with the other European Union
countries. In general, based on an assumption that voters will act out of self-interest first and other reasons second,
we can assume that those voting to leave the European Union saw a more favorable financial future as a separate
political entity than as part of the larger whole. Both sides of the economic future were highlighted prominently in
the British pre-referendum campaigns, with David Cameron famously stating in February 2016 that “Britain is
stronger, safer and better off in Europe.” The Leave campaign, by contrast, asserted that the U.K. pays the European
Union £350 million per week, or £20 billion ($28 billion) per year, with little in benefits. The preponderance of
voters—although not the vast majority—apparently agreed with the Leave campaign over which version of the
future would be better for Britain.
5 Burns, William, 2010. A Brief History of Great Britain. New York: Facts on File Inc. The term was coined by a Canadian, George Eulas Foster, speaking of Britain remaining out of European affairs. 6 Commission Regulation (EU) 2257/94 from 1995, subsequently repealed, https://eur-lex.europa.eu/legal-content/EN/ALL/?uri=CELEX:31994R2257 (accessed May, 2018) 7 Office of National Statistics. Population of the UK by Country of Birth and Nationality: 2016, www.ons.gov.uk (accessed autumn, 2017); Grieco, Elizabeth M. How the Census Bureau Measures the Foreign-Born Population and Immigration. https://www.census.gov/newsroom/blogs/random-samplings/2013/09/how-the-census-bureau-measures-the-foreign-born-population-and-immigration.html, foreign born citizens excluding naturalized citizens as a percentage of total US population 8 supra

11
Copyright © 2019 Society of Actuaries
1.4 Political Ramifications and Progress to Date
David Cameron, having advocated strongly for remaining in the European Union, decided to step down as British
prime minister shortly after the Brexit vote, and Theresa May, previously British home secretary, was named his
successor. In an apparent effort to bolster support for the difficult task of negotiating favorable terms for the exit
from the European Union, Theresa May called for a snap election in 2017, where her Conservative Party lost its
majority in parliament. The weakened party then had to continue with the EU negotiations with less apparent
popular support. David Davis, as chief negotiator for the U.K. delegation, sought to negotiate for the U.K., along with
Liam Fox as international trade secretary and Boris Johnson as British foreign secretary, both of whom originally
campaigned for the U.K. to leave the EU. As of this writing, only Liam Fox remains in the same role, with Davis and
Johnson both having resigned their posts. Stephen Barclay and Jeremy Hunt serve as Brexit negotiator and foreign
secretary as of publication date. On the European Commission side, Michel Barnier is chief negotiator, with Donald
Tusk as president of the European Council. These are the main parties deciding the terms of the hard or soft Brexit.
As of this writing, close to the currently planned March, 2019 effective date for Britain to leave the European Union,
the negotiators have seen close to two years of often acrimonious, sometimes collaborative negotiations. Following
agreement with the EU on a proposed Brexit deal, Theresa May then saw it rejected in a vote by the British
parliament. In the face of a potential “no deal” exit for Britain, the Prime Minister continues to seek a solution
acceptable to the European Union, her constituents, her political allies and opponents alike. There is a possibility of
extending the Brexit date by several months past March of 2019 while ongoing negotiations continue. Once the
terms have been approved in parliament, Brexit will go into effect. With the outcome still unclear as of this writing,
alternative possibilities within the U.K. over the next few months include a second referendum on leaving the
European Union; a new election; a full renegotiation; a vote of no confidence in the British government; or Brexit
with no deal.

12
Copyright © 2019 Society of Actuaries
2 Economic Backdrop of the European Union and United Kingdom, Compared
with the United States
2.1 Insurance Relationships
For an assessment of how the United Kingdom’s exit from the European Union is likely to affect the U.S. insurance
industry, it is useful to review the extent to which the United States, European Union and United Kingdom have
existing insurance relationships. The three economies, in aggregate, represent more than half of the world
insurance business, with the U.S. total premium volume (life and nonlife) totaling almost $1.4 trillion, or 28% of the
world total of $4.9 trillion (see Figure 3).9 OECD statistics, which also include state medical programs such as
Medicare, show the U.S. insurance market to be almost twice that size, with $2.6 trillion in annual premiums as of
2015. As shown in Figure 3, however, the U.K. and Eurozone private life and nonlife insurance markets almost equal
those of the U.S. and together represent 26% of world insurance premiums. All three regions are major players in
the insurance industry, so any impacts to these regions resulting from Brexit will, by default, affect the world
insurance market.
Figure 3
Total Insurance Premium Volume, 2017
Premium Volume ($ Millions)
Share of World
Volume
United States 1,377,114 28%
United Kingdom 283,331 6%
Eurozone 972,514 20%
World 4,891,694 100%
Source: Swiss Re Institute, sigma No 3/2018
The U.S. and the U.K. have heavily linked insurance industries, with U.S. insurers making the U.K. their first choice in
international diversification, and strong ties within the supporting reinsurance industry. In fact, of the approximately
$73 billion of U.S. premiums ceded overseas, 8% of these are ceded to U.K. reinsurers, and 9% to other European
Union reinsurers.10 Similarities in regulatory environments lead to familiar policy forms and facilitate entry into each
other’s insurance markets. In fact, of the top 10 U.S. property and casualty insurers, half have U.K. subsidiaries, and
two of the top five U.S. life insurers have U.K. operations.11 Still more invest in global, European and U.K. companies.
The impact of Brexit on U.S. company performance could be felt via investment gains and losses resulting from
Brexit and future sales growth or decline, all tempered or potentially magnified by the future equivalent value of
these results once converted from foreign currencies to U.S. dollars.
9 Swiss Re Institute. sigma No 3/2018. http://media.swissre.com/documents/sigma3_2018_en.pdf (accessed October, 2018) Swiss Re insurance data on premiums exclude statutory and major health insurance premiums. Other statistics included in this section also use OECD data, which include state medical plans. 10 Insurance Information Institute. 2017 Insurance Fact Book. RAA Study 2014. https://www.iii.org/sites/default/files/docs/pdf/insurance_factbook_2017.pdf 11 Bronson, Caitlin. These are the top 25 property/casualty companies in the US. Insurance Business America, May 2016. Of the property and casualty firms, Berkshire Hathaway, Liberty Mutual, Travelers, AIG and USAA (ranked 3, 4, 5, 9 and 10, respectively) all have UK operations. https://www.insurancebusinessmag.com/us/news/breaking-news/these-are-the-top-25-propertycasualty-insurance-companies-in-the-us-32630.aspx; Carpenter, J. William. Biggest Life Insurance Companies in the US (PRU, MET). https://www.investopedia.com/articles/personal-finance/092915/biggest-life-insurance-companies-us.asp Among life insurers, MetLife and Prudential (1 and 4, respectively) have large UK operations.

13
Copyright © 2019 Society of Actuaries
The United Kingdom has a long history in insurance, with Lloyd’s of London, the world-famous reinsurer, operating
as the world’s first known insurance company since the seventeenth century. The service economy is pivotal to the
U.K. economy, more so than in other members of the European Union, with 85% of the British workforce employed
in the services sector.12 Proximity is less of an advantage, or breaking point, in a successful service-based economy
than it is in a more agriculturally based one, for example. It doesn’t cost anything for Lloyd’s to transport its
reinsurance to the U.S., but it does cost more to ship British chocolates to the U.S. than to France.
Approximately 13% of U.S. insurance is reinsured, and as the U.S. life and health industry increasingly relies on
reinsurance, this figure has grown over the years (see Figure 4). While reinsurance can be purchased in any
approved location, the origins of the industry stem from Lloyd’s of London in 1688. Many European reinsurers
continue to be prevalent today in the U.S. insurance industry, including the impact of recent mergers and
acquisitions of U.S. and European reinsurers, such as General & Cologne Re.
Figure 4
U.S. Insurers and Reliance on Reinsurance: Life and Health Plus Property and Casualty ($ Thousands)
Source: SNL Financial, Life and health and property and casualty ceded premiums as a % of total, 2015 (history from 2011–2015),
Sun Life Financial as quoted in “Annual Report on the US Insurance Industry”, Federal Insurance Office, US Department of the
Treasury, September 2016.
According to the Insurance Information Institute, around 83% of the U.S. insurance market is reinsured with
offshore companies. Of these reinsurance premiums, around 8% are placed with British reinsurers including Lloyd’s,
and a further 9% with other EU reinsurers including Germany and Ireland.13
Many insurance companies have already looked to other EU countries to establish new ties with the impending exit
of the United Kingdom from the European Union. Insurers in the U.K. today can underwrite risks in other EU
countries using their U.K. admitted status to passport coverage elsewhere. The extent to which this occurs varies
based on policy type (life; or nonlife,or property and casualty) and insurance regulations. A highly-regulated
insurance market in one EU country would technically allow another EU member to passport coverage, but this
12 How Brexit will affect sectors of the British economy, Financial Times, June 23, 2017, ft.com. https://www.ft.com/content/602f3674-573a-11e7-9fed-c19e2700005f 13 Insurance Information Institute. 2017 Insurance Fact Book. RAA Study 2014. https://www.iii.org/sites/default/files/docs/pdf/insurance_factbook_2017.pdf
$-
$200,000,000
$400,000,000
$600,000,000
$800,000,000
$1,000,000,000
$1,200,000,000
$1,400,000,000
2011 2012 2013 2014 2015
Premiums Ceded Premiums

14
Copyright © 2019 Society of Actuaries
would still not transform the non-local coverage into fully compliant, linguistically appropriate, and market-
competitive coverage in the home country. Nonetheless, passporting certainly occurs today—for example, in cross-
border accident coverage for globally mobile groups. In the future, for a U.K. insurer or reinsurer to issue one
European contract, it will need to establish an entity in an EU country. Otherwise, insurance activities such as
contract issue, payment of direct or ceded premium, and payment of claims outside the U.K. would contravene
insurance regulations. The same applies to brokers and consultants in the U.K., who until now could have acted as
intermediaries on business that spills over to other EU countries.
Despite lobbying to support an exit deal for insurance that would support or mimic the status quo, insurers and
reinsurers have already begun to set up other European Union units to ensure they can continue to passport
coverage into Europe after March 2019. Reinsurers including Everest Re Group have new insurance or reinsurance
operations in Ireland; AIG, a U.S. insurance company, is joining other British-based carriers in setting up European
subsidiaries in Luxembourg; Chubb is moving its European headquarters to France from the U.K.; and even Lloyd’s of
London has announced intentions to establish a new European subsidiary in Belgium.14 These are just a few
examples. These steps to ensure continued market capacity, even if they prove not to be necessary, are a good sign
for continued future health of the insurance industry in the U.S. and European Union after Brexit.
2.2 Leading Macroeconomic Factors in the U.S., U.K. and EU
As an overview of the economic backdrop of the U.S., the U.K. and the rest of the European Union, it is helpful to
review key macroeconomic factors significant to the insurance industry.
2.2.1 Gross Domestic Product
The size and trend of a country’s gross domestic product (GDP) provide a measure of a nation’s relative health via its
total economic output. In the recent past, U.K. and European Union (total) GDP growth percentages have displayed
similar trends and growth—behind the U.S. but with the U.K. growing faster than the rest of the EU. Prior to the U.K.
joining the European Economic Community in 1973, its average annual GDP growth rate of 3.37%, although still
healthy by recent standards, lagged about 1.5 points behind U.S. GDP growth, and more than 1 point behind that of
other European countries.15 Once the U.K. became a member of the EEC, however, it began to see its average GDP
growth improve on a relative basis. After the signing of the Maastricht treaty, the U.K. experienced further
economic growth, coming in at an average of just under 2.25% GDP expansion per annum since 1993, close to U.S.
levels of almost 2.5% and better than the total EU average of just under 1.75% per year over the same time period.
The question for many voters was whether the GDP growth and economic improvements occurred in spite of, or
because of, the alignment with Europe.
Figure 5 shows the average annual GDP growth in U.S. dollars for the European Union countries, the United
Kingdom, and the United States during three periods: before the United Kingdom joined the European Economic
Community in 1973, before the signature of the Maastricht treaty establishing the present-day European Union, and
until the Brexit referendum of 2016.
14 Growing list of re/insurers make decisions on post-Brexit EU headquarters. Insurance Journal, October 3, 2017, https://www.insurancejournal.com/news/international/2017/10/03/466319.htm. 15 World Bank. GDP growth (annual %), https://data.worldbank.org/indicator/NY.GDP.MKTP.KD.ZG, 1961-1972 average cited here

15
Copyright © 2019 Society of Actuaries
Figure 5
Historical GDP Growth: U.S., U.K., EU
Source: World Bank World Development Indicators, GDP Growth (Annual 5), average of years noted,
https://data.worldbank.org/indicator/NY.GDP.MKTP.KD.ZG
2.2.2 Interest Rates: U.S., U.K. and Eurozone
As noted, relative inflation by region affects exchange rates and is a closely watched measure of economic health.
Inflation and interest rates often trend in the same direction within an economy, and governments generally try to
guard against inflationary, high-interest-rate economic environments; these tended to accompany recessions at the
end of the last century. While inflation is less predictable, one factor over which regional banks usually have a great
deal of control is interest rates. The use of low central-bank interest rates to govern the economy is a key tenet of
modern monetary policy. In this study, the central banks in question are the U.S. Federal Reserve, the Bank of
England in the United Kingdom, and the European Central Bank. While central-bank rates do not prescribe every
rate charged in their currency area, rates such as the federal funds rate in the U.S. have a great deal of control over
other interest rates charged across the country.
Since 2001, central-bank rates have ranged from a peak of 5.75% to a low of 0%, which is the current interest rate as
of this writing in the Eurozone. The historical rates used in this analysis are the relevant central-bank quarterly
prevailing interest rates, averaged where these differed during any one year. All three economies have fairly active
central banks which use interest rates as a monetary-policy tool in managing inflation and general economic health.
While the current Bank of England interest rate of 0.75% is closer to the Eurozone rates than the U.S. Federal
Reserve Board rate of 2.25%, the overall curve and trend line of U.K. interest rates more closely follow the U.S.
model, as can be seen in Figure 6. In recent years, the U.K. trend line and values often lie somewhere between the
U.S. and EU data.
-
1.00
2.00
3.00
4.00
5.00
6.00
1961–1972 1973–1992 1993–2016
Average Annual GDP Growth
European Union United Kingdom United States

16
Copyright © 2019 Society of Actuaries
Figure 6
Central-Bank Interest Rates
Source for interest rates: deltastock.com. Where rates changed during a quarter, mean prevailing interest rate of
the quarter is displayed in chart.
The Bank of England completes annual stress testing of potential impacts to the U.K. of a global financial crisis.
Interestingly, the most recent test, in November 2017, showed “the U.K. banking system is resilient” and “no bank
needs to strengthen its capital position”—the first time the latter result has occurred in the last three years and
since testing began.16
2.2.3 Inflation: U.S., U.K. and Eurozone
All three economies have seen relatively low inflation in the historical review period, and their central banks have
used interest rates as a tool to lower inflation, in general keeping interest rates at very low levels over the last 10
years or so. Inflation, similarly, has not exceeded 4.5% in any of the three economies since 2005; it is currently at
1.7% (U.S. and EU) or 2.7% (U.K.) as of the end of 2017. While low inflation tends to suppress natural growth in
insurance premiums—i.e., the tendency for insurance premiums to rise commensurate with an increase in insured
value—this is a minor issue for insurance companies. After all, an increase in premium entirely consistent with an
increase in risk does not, in itself, add a great deal of value to an insurance company, since average losses would
increase at the same rate. Healthy economies correlated with low inflationary environments generally help create
value for insurance companies, however, as they allow the insurance market to expand as more people and
businesses can afford to purchase coverage. Low inflation and relatively healthy economies in the U.K. and EU in
recent years have helped create market capacity among European reinsurers, thereby increasing flexibility for U.S.
insurers that use reinsurance. These conditions have similarly provided good returns, while not extensive growth,
among their European holdings.
16 Bank of England. Stress testing the UK banking system: 2017 results, November 28, 2017, https://www.bankofengland.co.uk/stress-testing/2017/stress-testing-the-uk-banking-system-2017-results.
0.00%
1.00%
2.00%
3.00%
4.00%
5.00%
6.00%
7.00%1
/1/2
00
1
10
/1/2
00
1
7/1
/20
02
4/1
/20
03
1/1
/20
04
10
/1/2
00
4
7/1
/20
05
4/1
/20
06
1/1
/20
07
10
/1/2
00
7
7/1
/20
08
4/1
/20
09
1/1
/20
10
10
/1/2
01
0
7/1
/20
11
4/1
/20
12
1/1
/20
13
10
/1/2
01
3
7/1
/20
14
4/1
/20
15
1/1
/20
16
10
/1/2
01
6
7/1
/20
17
UK US EU

17
Copyright © 2019 Society of Actuaries
2.2.4 Exchange Rates
U.S. companies whose balance sheets include U.K. affiliates and other holdings are heavily affected by changes in
exchange rates. The effect of major gains in the U.K. are muted when the dollar gains strength against the pound.
Likewise, any U.K. losses are amplified under a strong pound. The matrix chart in Figure 7 offers a view of this effect.
Under a weak dollar, international holdings in the U.K. and their profits and losses actually have a greater effect on
the U.S. companies that own them. The opposite is true in a strong-dollar environment. The same effect, of course,
applies to holdings elsewhere in the European Union and denominated in euros. These are some of the risks of
international diversification, of course, and known to multinational companies before they take on such exposures.
However, a decision to invest in a U.K. or other European insurance entity before 2016 was likely made without
considering Brexit as a likelihood. Considering that about half of the top U.S. insurers own companies in the U.K.
and/or the European Union, the future health of these markets could have a considerable effect on the U.S.
insurers’ profits and market capacity as a result, especially if the dollar weakens against the pound and euro.
Figure 7
How Profits and Losses in the U.K. Could Affect the U.S. Market
While the U.K. has always retained its own currency, separate from the rest of Europe, it is, of course, tightly linked
to the European and world currency markets, so as these change, they will affect the value of the pound sterling. In
recent history, at least since 2002, the pound has increasingly followed the fortunes of the euro in macroeconomic
terms. Comparing against the U.S. dollar, for example, a relatively weak euro has often been accompanied by a

18
Copyright © 2019 Society of Actuaries
weak pound, and vice versa; when one gains in strength against the dollar, so does the other. This effect can be seen
in the graph of historical exchange rates in Figure 8.
Figure 8
Historical Exchange Rates: Pound (GBP), Euro (EUR), Dollar (USD)
Source: www.OANDA.com, historic annual exchange rates, average annual mid rates.
It will remain to be seen whether a break from the European Union will also signal a change in how the pound and
dollar interact. So far, as of early 2018, however, the pound has weakened against the U.S. dollar and euro, relative
to a pre–Brexit vote in Britain. In fact, this started before Brexit, with the pound ending 2016 about 12% lower
against the U.S. dollar over the prior year, followed by a continued 5% downward trend as of the end of 2017.
Today, one U.S. dollar purchases around 77 pence, or 77% of one pound sterling. In 2015, the average was only 65
pence. While the turning point for the recent downward trend can be traced to 2014, well before the Brexit
referendum was announced early in 2016, the economic uncertainty created by Brexit seems to be the main cause
for this unusually steep decline of the past 18 months.
Although the U.S. dollar is slightly weaker against the euro in early 2018 than in late 2016, it has made significant
gains against the pound (see Figure 8). The dollar is still stronger against both currencies than it was 10 or so years
ago.
2.3 Insurance Industry Performance Measures
2.3.1 Insurance Premium Revenue
While insurance company premiums have generally been increasing in the U.S. at the rate of around 3% to 4% per
annum, they tend to be on the decline in the more mature markets of the U.K. and the European Union, as shown in
Figure 9. Declining insurance markets can be a sign of market saturation and/or a sign of economic concern, with
insurers unwilling to assume risks at the same level as in the U.S. With the long history of insurance in Europe,
market saturation is one factor for a decline in insurance but can also signal concerns about future risks. U.S.
investors in Europe will be looking for premium growth, so the declining market in current state should be a
concern, regardless of the potential Brexit effect.
-
0.20
0.40
0.60
0.80
1.00
1.20
1.40
1.60
2006 2007 2008 2009 2010 2011 2012 2013 2014 2015 2016 2017
GBP/USD EUR/USD EUR/GBP

19
Copyright © 2019 Society of Actuaries
Figure 9
Gross Insurance Premiums, Life and Nonlife ($ Millions)
*EU 15 = 15 European Union Members of OECD.
Source: OECD Insurance Statistics, 2016.
2.3.2 Investments and Asset Allocations
Shares in firms linked to the U.K. and European companies are being closely watched following the Brexit vote and
during Brexit negotiations. Shares in U.K. companies with a domestic focus have made market gains of 2% between
June 2016 and January 2018, whereas shares in U.K. multinational firms operating globally have made 33% gains.17
As previously noted, the exchange rate effect of a weakened pound helped make overseas profits more lucrative in
terms of the pound.
The asset allocations of firms invested in the U.K. and other European countries will have been designed to meet the
investors’ risk tolerance and growth goals in a pre-Brexit world. Post-Brexit, the same goals might call for some
changes, although a rush from U.K.-based stocks to bonds, for example, could in itself cause more disruption than
some other market changes. Professional Wealth Management reports that respondents to its Global Asset Tracker
survey in the first 12 months following the Brexit vote have reduced exposure to U.K. shares (44% of respondents),
while others have reduced or hedged against currency and property holdings.18 In general, in the year and a half
since the Brexit vote (as of this writing), the relative weakness of the pound sterling has meant the U.K. stock market
has performed better than expected, so U.S. firms linked to U.K.-traded holdings will generally have seen minimal to
slight growth in their market values in terms of the pound. But a weaker pound, as noted previously, will minimize
the scope of these gains when repatriated on the U.S. income statement.
2.3.3 Effect on Insurance Relative to Other Industries
The impacts noted for the insurance industry are several, including the discontinuance of passporting rights and
multinational policies and the establishment of new headquarters operations outside of the U.K. As stated earlier,
17 Bowsher, Ed. The ‘Brexit effect’ on UK domestic stocks, Financial Times, January 17, 2018, https://www.ft.com/content/6814223c-faaf-11e7-9b32-d7d59aace167. 18 Trovato, Elisa. Brexit triggers significant changes in asset allocation, PWM, March 6, 2017, https://www.pwmnet.com/PWM-Research/Brexit-triggers-significant-changes-in-asset-allocation?ct=true.
0
500 000
1 000 000
1 500 000
2 000 000
2 500 000
3 000 000
2008 2009 2010 2011 2012 2013 2014 2015
US UK EU (15) EU without UK

20
Copyright © 2019 Society of Actuaries
the U.K. is largely a service economy, and financial services make up a large portion of GDP. In addition to the
insurance industry, banks and other financial service firms could be similarly affected, with the City of London alone
lobbying (so far unsuccessfully) to replicate the current EU passporting arrangements post-Brexit.
In addition to services, the manufacturing and agriculture industries rely heavily on international trade and access to
labor. The free movement of labor under the current EU freedoms helps the British agriculture industry today, with
over 90% of vegetable and fruit pickers in the U.K. coming from Central and Eastern Europe. EU subsidies and the
removal of tariffs also support the British agriculture industry today. Manufacturing, including automotive,
aerospace and pharmaceuticals, represents about 10% of the British economy and is again heavily dependent on,
and currently benefiting from, the removal of tariffs.
Finally, education is heavily dependent on the European Union today, with 20% of British university staff emanating
from other EU countries. At the same time, a relatively weak pound has helped increase enrollments from students
in countries such as China.19
While other industries are being affected by the decision to leave the European Union, the financial services sector
and, in particular, the insurance industry, could be at risk of disruption if satisfactory post-Brexit terms are not
agreed upon.
2. Trading Relationships and Treaties
We have already explored the special trading relationship between the U.S. and the U.K. where foreign direct
investment is concerned. The U.K. is the United States’ second choice for all foreign direct investment—and first for
financial services, including the insurance industry. Compared with the rest of the European Union, this difference is
even more vivid, as shown in Figure 10. This is all the more surprising when bearing in mind the relative economies:
the U.K. represents 3% of global GDP, versus the rest of the European Union, which represents 18% of global GDP;
the U.S. accounts for 24%.20
19 Financial Times. How Brexit will affect sectors of the UK economy. FT.com, June 23, 2017, https://www.ft.com/content/602f3674-573a-11e7-9fed-c19e2700005f 20 Cia.gov, 2017, The World Factbook (estimated GDP by country) https://www.cia.gov/library/publications/resources/the-world-factbook/

21
Copyright © 2019 Society of Actuaries
Figure 10
U.S. Foreign Direct Investment in the U.K. and in Other EU Countries ($ Millions)
The key here is that the U.S. invests heavily in both the U.K. and the European Union, with just under 2% of total U.S.
GDP invested in the U.K. and European Union in 2016 ($158 billion in the U.K. and $141 billion in the rest of the
European Union).21 To give a view of the relative significance of this relationship, total U.S. investment in the EU is
three times greater than U.S. investment in the continent of Asia. The European Union, in return, including the U.K.,
also invests heavily in the U.S. The combined regions form a powerhouse of world trade. The European Union and
the U.S. economies together constitute about half of global GDP and nearly a third of world trade.22 Any fluctuations
in the dynamics of trade between the three regions as a result of Brexit or otherwise should be felt in the global
economy.
2.4.1 Current Trading Terms and Treaties
Today, the United Kingdom, as a member of the European Union, is a party to several trade arrangements. All
European Union countries, in addition to the European Free Trade Association (EFTA) members Iceland,
Liechtenstein, and Norway, belong to the European Economic Area, allowing for the free movement of people,
goods, capital, and services, such as passporting business services in another EU state without requiring new
licensing or authorization. One route to a softer Brexit would involve the U.K. joining EFTA or setting up its own
bilateral agreement and thereby benefiting from the four freedoms of the European Economic Area. Switzerland,
while not a member of the European Union, also has access to the single market of the European Union through
bilateral treaties, and a Switzerland model has been discussed as a potential option for the U.K. post-Brexit. A
customs union also exists between current European Union members and Turkey. Under this arrangement, a
uniform customs duty is applied to goods (excluding agricultural and services) across the member countries, and no
further tariffs apply until they leave the customs union area.
As of this writing, the future of major trade treaties still seems unclear, despite a breakthrough deal between EU
and U.K. negotiators in December 2017, in which the United Kingdom agreed to ensure an open border between
21 World Bank. GDP growth (annual %), https://data.worldbank.org/indicator/NY.GDP.MKTP.KD.ZG (accessed winter, 2017). US GDP in 2016 was $18.57 trillion. 22 European Commission. Countries and Regions: United States. http://ec.europa.eu/trade/policy/countries-and-regions/countries/united-states/ (winter 2017-2018).
$-
$20,000
$40,000
$60,000
$80,000
$100,000
$120,000
$140,000
$160,000
$180,000
$200,000
UK Only Rest of EU

22
Copyright © 2019 Society of Actuaries
Northern Ireland and Ireland, and to protect the rights of current EU citizens working in the United Kingdom (and
conversely, that the European Union will protect the rights of Brits working in Europe). The fee, also known as a
“divorce bill,” to be paid by the U.K. upon Brexit appears to be in the range of £35 billion to £40 billion ($49 billion to
$55 billion).
A special free-trade agreement between the U.K. and the European Union, as originally proposed by the U.K.
negotiators, could potentially create a similar market structure as in force today. Negotiations over the Northern
Ireland border have further complicated this question, with the “backstop” plan involving a temporary extension of
the customs union for the whole of the UK, and Northern Ireland remaining in the European single market. In
general, though, the ability to use special trade terms within the EU, and in trading with third countries, would be
good news for the European Union and United Kingdom, if this agreement can be reached in a way that is
acceptable to all, including the treatment of the Northern Ireland border.
2.4.2 Potential Tax Implications
With Brexit likely requiring U.K. firms operating elsewhere in Europe to set up their own EU entities rather than
relying on the current right to passport services into the European Union, new legal entities and different tax laws
will likely apply and cause some market disruption. It is unlikely, even with the best of soft Brexit terms, that
continued passporting, i.e. avoiding taxes, customs, and duties when trading with EU countries, will exist in the
future. Many British firms, as noted earlier, have already begun establishing European Union entities. Even Lloyd’s of
London is establishing a unit in Brussels, Belgium, to continue to operate within the EU. Even so, cross-border
policies that exist today and cover U.K. and other EU risks will likely need to be rewritten to ensure continued
compliance and tax-advantaged coverage—and this will apply to U.K. insurers and reinsurers, as well as those based
elsewhere in the European Union. Of course, cross-border coverage exists in many markets, not just Europe, and
Brexit could therefore open up opportunities for U.S. carriers due to market disruption and even out-to-bid
exercises caused by Brexit and the expected changes in regulatory and tax regimes. Still, customers and brokers are
increasingly looking to place coverage with locally licensed and compliant insurers, so it is less likely that overflow
European risks would make their way to the U.S. market.

23
Copyright © 2019 Society of Actuaries
3 Forecasting the Economic Impact of Brexit
3.1 Models of Leading Financial Indicator Changes: Consistent Growth Trend, Moderate, and Worst-Case
Basis
Insurance premiums tend to reflect the health of a national economy due to the nature of insurance pricing
generally being linked to the value of the commodity it protects: as house prices and salaries increase, so do the
insurance premiums that vary with these values, and as a market becomes more mature or saturated, the
opportunity to grow insurance premiums diminishes. In addition, a market in poor economic health will suppress
capacity, as insurers are generally less willing to take on these greater associated risks. All other factors being equal,
and ignoring the impact of diminished capacity and market maturity, an increase of 10% in a country’s total house
prices will result in an approximate 10% increase in property insurance premiums. Therefore, it is helpful to view the
potential macroeconomic changes that are expected after Brexit goes into effect in 2019.
Evaluation of the past, present and expected future trends of these major macroeconomic factors—including
exchange rates, gross domestic product (GDP), inflation and interest rates—in the United States, United Kingdom
and Eurozone or other European Union countries required the construction of simple economic, non-stochastic
models, including data predicted by regulatory or respected entities. Since the eventual Brexit terms are, as of this
writing, still evolving, these non-stochastic models are simple and illustrative in nature. The forecast data are
derived from external sources, historical trends, and researcher judgement, as detailed in the relevant sections over
the next few pages. Historical data available and used through 2005–2017 as of this writing comprise GDP for each
region stated in U.S. dollars; the relevant central-bank interest rates; annual inflation in the U.S., U.K., and EU;
exchange rates between U.S. dollars, British pounds sterling, and euros; and future insurance premiums in each
region. A full view of this historical model and data reviewed can be found in the following pages.
The forecast data, shown in italics in Figures 11, 12, and 13, take all available GDP, interest rate, exchange rate and
inflation data for the three economies through the most current year available as of this writing. Three different
forecast sets are then extrapolated through 2022 on a predictive basis. Forecast set 1 uses the most recent eight or
more years of actual data, as well as forecasts published by reputable institutions such as the World Bank, the
International Monetary Fund (IMF), the Organization for Economic Co-operation and Development (OECD) and the
European Union’s Eurostat service. Their predictions are then modeled in the three regions. Forecast set 3 seeks to
predict a worst-case view through assumptions based on examples from recent history. Forecast set 2 shows a
more moderate view, with inflation and interest rate movement falling somewhere between the two other models.
Both forecast sets 2 and 3 use purchasing power parity (PPP), “the notion that global exchange rates should
eventually adjust to make the price of identical baskets of tradable goods the same in each country.”23 to derive
exchange rates for each scenario.
For the purposes of this research, higher interest rates are assumed to be a worse-case scenario, although by
contrast, the current 0% interest rates in the European Union are also considered by some to have a dampening
effect on some areas of the economy. While there are arguments for inflation helping insurance premium growth,
for the purposes of this study, we also took a view that an inflationary, high-interest-rate, lower-GDP economy
scenario in the U.K. and European Union would be the best way to test the extremes of the potential impact of
Brexit on the U.S. economy and the insurance industry in particular.
Finally, we reviewed the combined forecast results to ensure that even the most extreme examples could occur in
reality—in other words, that the forecast data are reasonably consistent. The worst-case model (3) shows a view of
23 The Big Mac Index. The Economist, January 12, 2017, https://www.economist.com/graphic-detail/2017/01/12/the-big-mac-index

24
Copyright © 2019 Society of Actuaries
spiraling interest rates and inflation accompanied by reduced GDP. While fairly extreme, the differences between
these values do not exceed reasonably expected levels. For example, while the difference between predicted
interest rates and GDP growth in the U.S. in 2022 diverges, the difference was even larger in 2008. The results are
therefore considered to be within the possible range and useful for predicting a worst-case scenario.
While these models reflect forecasts to map out potential scenarios, including a worst-case view, following Brexit,
they of course should not be assumed to represent an aggregate, accurate prediction of future economic trends.

25
Copyright © 2019 Society of Actuaries
Figure 11
Forecast Set 1: History and Predicted/Consistent Trend
Year
GDP
Growth
%
Interest
Rates
(Annual)
Inflation
%
(Annual)
Premium ($
Millions)
U.S. 2008 -0.29 4.69 4.4 £0.55 €0.68 $2,039,111.64
$ 2009 -2.78 2.75 -0.8 £0.64 €0.72 $2,029,504.30
2010 2.53 1.13 2.6 £0.65 €0.75 $2,035,561.54
2011 1.60 0.25 3.9 £0.62 €0.72 $2,154,850.95
2012 2.22 0.25 2.2 £0.63 €0.78 $2,279,817.00
2013 1.68 0.25 1.3 £0.64 €0.75 $2,289,921.00
2014 2.37 0.25 1.3 £0.61 €0.75 $2,431,323.00
2015 2.86 0.31 -0.8 £0.65 €0.90 $2,621,083.00
2016 1.49 0.56 0.5 £0.74 €0.90 $2,718,099.90
2017 2.20 1.25 1.7 £0.78 €0.89 $2,818,707.79
2018 2.30 1.50 2.1 £0.78 €0.88 $2,923,039.59
2019 1.90 2.00 2.6 £0.77 €0.88 $3,031,233.13
2020 1.80 2.80 2.4 £0.77 €0.87 $3,143,431.35
2021 1.70 2.80 2.2 £0.77 €0.87 $3,259,782.49
2022 1.70 2.80 2.3 £0.77 €0.87 $3,380,440.24
U.K. 2008 -0.47 4.31 3.6 $1.83 €1.26 $454,666.15
£ 2009 -4.19 0.50 2.2 $1.56 €1.12 $342,609.17
2010 1.69 0.50 3.3 $1.54 €1.17 $325,141.31
2011 1.45 0.50 4.5 $1.60 €1.15 $339,364.90
2012 1.48 0.50 2.8 $1.58 €1.23 $368,524.79
2013 2.05 0.50 2.6 $1.56 €1.18 $340,384.73
2014 3.05 0.50 1.5 $1.65 €1.24 $365,688.05
2015 2.35 0.50 0 $1.53 €1.38 $336,743.04
2016 1.79 0.38 0.7 $1.35 €1.22 $324,767.14
2017 1.70 0.31 2.7 $1.29 €1.14 $313,217.15
2018 1.50 0.75 2.4 $1.28 €1.13 $302,077.92
2019 1.60 0.80 1.9 $1.29 €1.13 $291,334.85
2020 1.70 1.00 2.0 $1.30 €1.13 $280,973.84
2021 1.70 1.00 2.0 $1.30 €1.13 $270,981.31
2022 1.70 1.00 2.0 $1.31 €1.13 $261,344.16
EU 2008 0.48 3.56 3.7 $1.46 £0.79 $1,162,335.84
€ 2009 -4.36 1.13 1 $1.39 £0.89 $1,038,100.35
2010 2.12 1.00 2.1 $1.32 £0.86 $1,013,418.11
2011 1.69 1.19 3.1 $1.39 £0.87 $1,044,730.86
2012 -0.43 0.88 2.6 $1.29 £0.81 $1,022,609.73
2013 0.26 0.50 1.5 $1.33 £0.85 $1,319,709.64
2014 1.74 0.13 0.5 $1.33 £0.81 $1,219,736.16
2015 2.31 0.05 0 $1.11 £0.73 $1,034,280.71
2016 1.94 0.00 0.3 $1.11 £0.82 $1,025,680.65
2017 2.30 0.00 1.7 $1.13 £0.88 $1,017,152.09
2018 2.10 0.00 1.7 $1.13 £0.88 $1,008,694.45
2019 1.80 0.24 1.9 $1.14 £0.88 $1,000,307.14
2020 1.80 0.65 1.9 $1.15 £0.88 $991,989.56
2021 1.70 0.65 2.0 $1.15 £0.88 $983,741.15
2022 1.70 0.65 2.0 $1.15 £0.88 $975,561.32
Exchange Rate per 1
Unit ($, £, €)

26
Copyright © 2019 Society of Actuaries
Figure 12
Forecast Set 2: History and Moderate Basis
Year
GDP
Growth
%
Interest
Rates
(Annual)
Inflation
%
(Annual)
Premium ($
Millions)
U.S. 2008 -0.29 4.69 4.4 £0.55 €0.68 $2,039,111.64
$ 2009 -2.78 2.75 -0.8 £0.64 €0.72 $2,029,504.30
2010 2.53 1.13 2.6 £0.65 €0.75 $2,035,561.54
2011 1.60 0.25 3.9 £0.62 €0.72 $2,154,850.95
2012 2.22 0.25 2.2 £0.63 €0.78 $2,279,817.00
2013 1.68 0.25 1.3 £0.64 €0.75 $2,289,921.00
2014 2.37 0.25 1.3 £0.61 €0.75 $2,431,323.00
2015 2.86 0.31 -0.8 £0.65 €0.90 $2,621,083.00
2016 1.49 0.56 0.5 £0.74 €0.90 $2,704,268.47
2017 2.20 1.25 1.7 £0.78 €0.89 $2,790,166.99
2018 2.30 1.80 2.1 £0.78 €0.89 $2,878,869.30
2019 1.90 2.48 2.6 £0.79 €0.89 $2,970,469.24
2020 1.80 3.30 2.4 £0.79 €0.90 $3,065,063.85
2021 1.70 3.73 2.2 £0.79 €0.90 $3,162,753.52
2022 1.70 4.15 2.3 £0.80 €0.91 $3,263,642.04
U.K. 2008 -0.47 4.31 3.6 $1.83 €1.26 $454,666.15
£ 2009 -4.19 0.50 2.2 $1.56 €1.12 $342,609.17
2010 1.69 0.50 3.3 $1.54 €1.17 $325,141.31
2011 1.45 0.50 4.5 $1.60 €1.15 $339,364.90
2012 1.48 0.50 2.8 $1.58 €1.23 $368,524.79
2013 2.05 0.50 2.6 $1.56 €1.18 $340,384.73
2014 3.05 0.50 1.5 $1.65 €1.24 $365,688.05
2015 2.35 0.50 0 $1.53 €1.38 $336,743.04
2016 1.79 0.38 0.7 $1.35 €1.22 $315,770.03
2017 1.70 0.31 2.7 $1.29 €1.14 $296,343.64
2018 -0.28 1.05 3.1 $1.30 €1.16 $278,337.60
2019 -0.23 1.59 2.8 $1.27 €1.14 $261,636.49
2020 -0.18 2.21 2.9 $1.27 €1.14 $246,134.74
2021 -0.18 2.73 2.9 $1.26 €1.14 $231,735.82
2022 -0.18 3.25 2.9 $1.25 €1.14 $218,351.42
EU 2008 0.48 3.56 3.7 $1.46 £0.79 $1,162,335.84
€ 2009 -4.36 1.13 1 $1.39 £0.89 $1,038,100.35
2010 2.12 1.00 2.1 $1.32 £0.86 $1,013,418.11
2011 1.69 1.19 3.1 $1.39 £0.87 $1,044,730.86
2012 -0.43 0.88 2.6 $1.29 £0.81 $1,022,609.73
2013 0.26 0.50 1.5 $1.33 £0.85 $1,319,709.64
2014 1.74 0.13 0.5 $1.33 £0.81 $1,219,736.16
2015 2.31 0.05 0 $1.11 £0.73 $1,034,280.71
2016 1.94 0.00 0.3 $1.11 £0.82 $1,004,817.92
2017 2.30 0.00 1.7 $1.13 £0.88 $976,615.24
2018 0.03 0.55 2.7 $1.12 £0.86 $949,612.79
2019 -0.13 1.22 2.8 $1.12 £0.88 $923,753.62
2020 -0.13 1.98 2.8 $1.11 £0.88 $898,983.51
2021 -0.18 2.53 2.9 $1.11 £0.88 $875,250.88
2022 -0.18 3.08 2.9 $1.10 £0.88 $852,506.63
Exchange Rate per 1
Unit ($, £, €)

27
Copyright © 2019 Society of Actuaries
Figure 13
Forecast Set 3: History and Worst-Case Basis
Year
GDP
Growth
%
Interest
Rates
(Annual)
Inflation
%
(Annual)
Premium ($
Millions)
U.S. 2008 -0.29 4.69 4.4 £0.55 €0.68 $2,039,111.64
$ 2009 -2.78 2.75 -0.8 £0.64 €0.72 $2,029,504.30
2010 2.53 1.13 2.6 £0.65 €0.75 $2,035,561.54
2011 1.60 0.25 3.9 £0.62 €0.72 $2,154,850.95
2012 2.22 0.25 2.2 £0.63 €0.78 $2,279,817.00
2013 1.68 0.25 1.3 £0.64 €0.75 $2,289,921.00
2014 2.37 0.25 1.3 £0.61 €0.75 $2,431,323.00
2015 2.86 0.31 -0.8 £0.65 €0.90 $2,621,083.00
2016 1.49 0.56 0.5 £0.74 €0.90 $2,690,437.04
2017 2.20 1.25 1.7 £0.78 €0.89 $2,761,626.19
2018 2.30 2.10 2.1 £0.79 €0.90 $2,834,699.01
2019 1.90 2.95 2.6 £0.80 €0.91 $2,909,705.35
2020 1.80 3.80 2.4 £0.81 €0.92 $2,986,696.36
2021 1.70 4.65 2.2 £0.82 €0.94 $3,065,724.55
2022 1.70 5.50 2.3 £0.83 €0.95 $3,146,843.84
U.K. 2008 -0.47 4.31 3.6 1.83$ €1.26 $454,666.15
£ 2009 -4.19 0.50 2.2 1.56$ €1.12 $342,609.17
2010 1.69 0.50 3.3 1.54$ €1.17 $325,141.31
2011 1.45 0.50 4.5 1.60$ €1.15 $339,364.90
2012 1.48 0.50 2.8 1.58$ €1.23 $368,524.79
2013 2.05 0.50 2.6 1.56$ €1.18 $340,384.73
2014 3.05 0.50 1.5 1.65$ €1.24 $365,688.05
2015 2.35 0.50 0 1.53$ €1.38 $336,743.04
2016 1.79 0.38 0.7 1.35$ €1.22 $306,772.91
2017 -2.05 0.31 2.7 1.29$ €1.14 $279,470.12
2018 -2.05 1.35 3.7 1.27$ €1.14 $254,597.28
2019 -2.05 2.39 3.7 1.25$ €1.14 $231,938.12
2020 -2.05 3.43 3.7 1.24$ €1.14 $211,295.63
2021 -2.05 4.46 3.7 1.22$ €1.14 $192,490.32
2022 -2.05 5.50 3.7 1.20$ €1.14 $175,358.68
EU 2008 0.48 3.56 3.7 1.46$ £0.79 $1,162,335.84
€ 2009 -4.36 1.13 1 1.39$ £0.89 $1,038,100.35
2010 2.12 1.00 2.1 1.32$ £0.86 $1,013,418.11
2011 1.69 1.19 3.1 1.39$ £0.87 $1,044,730.86
2012 -0.43 0.88 2.6 1.29$ £0.81 $1,022,609.73
2013 0.26 0.50 1.5 1.33$ £0.85 $1,319,709.64
2014 1.74 0.13 0.5 1.33$ £0.81 $1,219,736.16
2015 2.31 0.05 0 1.11$ £0.73 $1,034,280.71
2016 1.94 0.00 0.3 1.11$ £0.82 $983,955.19
2017 -2.05 0.00 1.7 1.13$ £0.88 $936,078.38
2018 -2.05 1.10 3.7 1.11$ £0.88 $890,531.14
2019 -2.05 2.20 3.7 1.10$ £0.88 $847,200.11
2020 -2.05 3.30 3.7 1.08$ £0.88 $805,977.46
2021 -2.05 4.40 3.7 1.07$ £0.88 $766,760.60
2022 -2.05 5.50 3.7 1.05$ £0.88 $729,451.94
Exchange Rate per 1
Unit ($, £, €)
28
Copyright © 2019 Society of Actuaries
3.1.1 Gross Domestic Product
The GDP figures shown in the model through 2016, which are from the World Bank databank, indicate that U.S. GDP
growth on an annual basis tends to exceed that of the U.K. and EU. In general, the U.K. has still enjoyed higher
annual GDP growth over this time period than the EU.
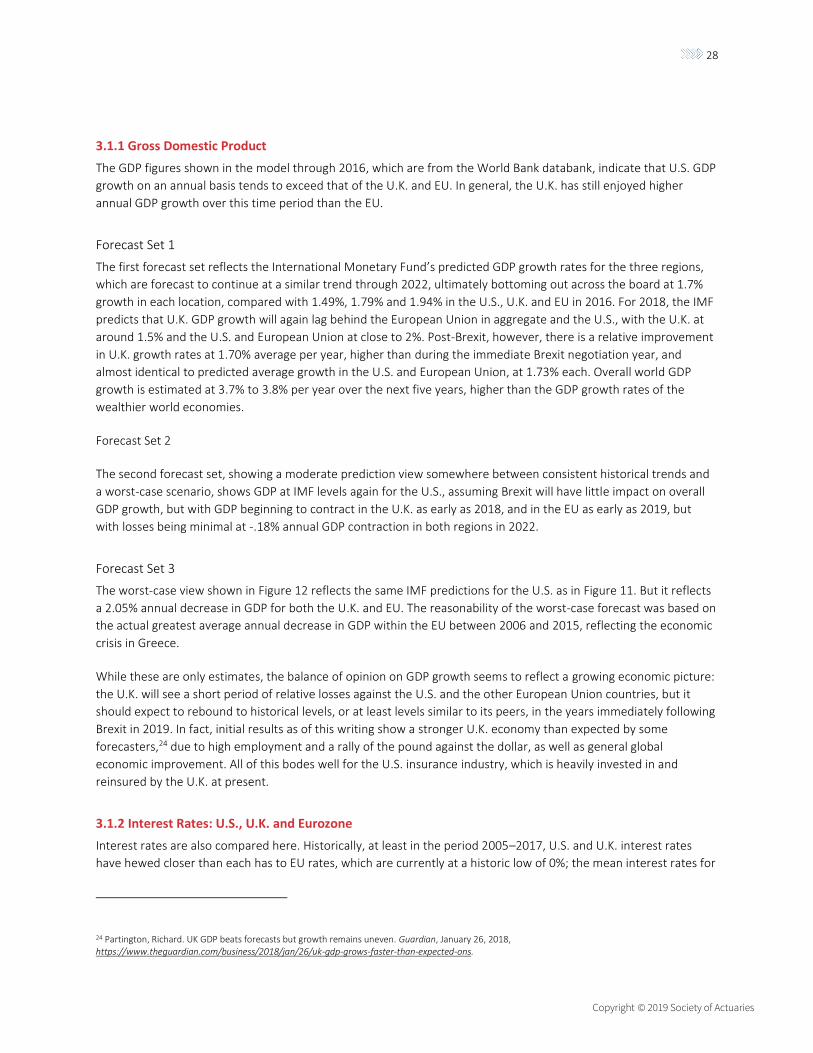
Forecast Set 1
The first forecast set reflects the International Monetary Fund’s predicted GDP growth rates for the three regions,
which are forecast to continue at a similar trend through 2022, ultimately bottoming out across the board at 1.7%
growth in each location, compared with 1.49%, 1.79% and 1.94% in the U.S., U.K. and EU in 2016. For 2018, the IMF
predicts that U.K. GDP growth will again lag behind the European Union in aggregate and the U.S., with the U.K. at
around 1.5% and the U.S. and European Union at close to 2%. Post-Brexit, however, there is a relative improvement
in U.K. growth rates at 1.70% average per year, higher than during the immediate Brexit negotiation year, and
almost identical to predicted average growth in the U.S. and European Union, at 1.73% each. Overall world GDP
growth is estimated at 3.7% to 3.8% per year over the next five years, higher than the GDP growth rates of the
wealthier world economies.
Forecast Set 2
The second forecast set, showing a moderate prediction view somewhere between consistent historical trends and
a worst-case scenario, shows GDP at IMF levels again for the U.S., assuming Brexit will have little impact on overall
GDP growth, but with GDP beginning to contract in the U.K. as early as 2018, and in the EU as early as 2019, but
with losses being minimal at -.18% annual GDP contraction in both regions in 2022.
Forecast Set 3
The worst-case view shown in Figure 12 reflects the same IMF predictions for the U.S. as in Figure 11. But it reflects
a 2.05% annual decrease in GDP for both the U.K. and EU. The reasonability of the worst-case forecast was based on
the actual greatest average annual decrease in GDP within the EU between 2006 and 2015, reflecting the economic
crisis in Greece.
While these are only estimates, the balance of opinion on GDP growth seems to reflect a growing economic picture:
the U.K. will see a short period of relative losses against the U.S. and the other European Union countries, but it
should expect to rebound to historical levels, or at least levels similar to its peers, in the years immediately following
Brexit in 2019. In fact, initial results as of this writing show a stronger U.K. economy than expected by some
forecasters,24 due to high employment and a rally of the pound against the dollar, as well as general global
economic improvement. All of this bodes well for the U.S. insurance industry, which is heavily invested in and
reinsured by the U.K. at present.
3.1.2 Interest Rates: U.S., U.K. and Eurozone
Interest rates are also compared here. Historically, at least in the period 2005–2017, U.S. and U.K. interest rates
have hewed closer than each has to EU rates, which are currently at a historic low of 0%; the mean interest rates for
24 Partington, Richard. UK GDP beats forecasts but growth remains uneven. Guardian, January 26, 2018, https://www.theguardian.com/business/2018/jan/26/uk-gdp-grows-faster-than-expected-ons.

29
Copyright © 2019 Society of Actuaries
this time period are 1.70%, 1.80% and 1.05% in the U.S., U.K. and EU, respectively. While the European Central Bank
is a European Union institution, only monetary union countries are members, so the U.K. maintains independent
monetary policy through the Bank of England.
Forecast Set 1
The consistent-basis view uses predictions from each of the central banks through 2020, which is the furthest
prediction available as of this writing. The central banks all predict increases above the current very low interest rate
environment (0% in the EU as of 2017). The forecast set then holds the 2020 rates (2.80%, 1.00% and 0.65% in the
U.S., U.K. and EU, respectively) through 2022, assuming that future rates will be closer to this level.
Forecast Set 2
The moderate view takes the central bank predictions and worst-case scenario view and averages these out for
what is a still increasing interest rate environment. For example, the U.K. rates, which tend to fall somewhere
between those of the U.S. and EU, move from .31 (actual, 2017) to 3.25% (forecast, 2022) in this model, compared
to 1.00 (forecast, 2022) in the consistent-basis forecast (1).
Forecast Set 3
Rates have varied significantly over the past 12 years, with relative annual average highs of 4.69%, 5.56% and 3.69%
from the Federal Reserve, Bank of England and European Central Bank, respectively. On an absolute (quarterly
prevailing rate) basis, the average high rate over this time period was 5.5%, and the worst-case view assumes all
three economies gradually escalate to this level by 2022.
While the predictions in the model were derived from separate sources, their relationship was also validated. In
economic theory, when GDP increases, interest rates also will increase, all other factors being equal, as the
population applies a greater demand on money due to economic growth. In the consistent trend model (1), this is
generally true, as interest rates and GDP continue to climb in this scenario. In the worst-case scenario (3), the theory
does not hold true in the U.K. and EU, where a shrinking economy is paired with increasing interest rates. This is still,
however, a reasonable scenario based on past results—for example, in the U.S. in 2010, where interest rates
declined while GDP grew.
3.1.3 Inflation: U.S., U.K. and Eurozone
The next parameter in the model, inflation, also is closely tied to interest rates and economic growth. All other
things being equal, higher inflation and higher interest rates tend to go hand in hand, and fear of inflation is one
reason central banks keep tight controls on interest rates through monetary policy. In the past 12 years, all three
economies have experienced a relatively low inflationary environment; they are currently at 2.5% in the U.K., 2.2%
in the U.S., and 1.9% in the EU as of the end of 201825.
Forecast Set 1
The consistent-trend forecast uses IMF predictions of gradual growth in the U.S. and EU and a decrease in the U.K.,
with all three closing 2022 in the range of 2.0%–2.3% inflation. This trend aligns with the increase in GDP and
interest rates under this scenario.
25 Eurostat, February 2019. https://ec.europa.eu/eurostat/tgm/table.do?tab=table&init=1&language=en&pcode=tec00118&plugin=1

30
Copyright © 2019 Society of Actuaries
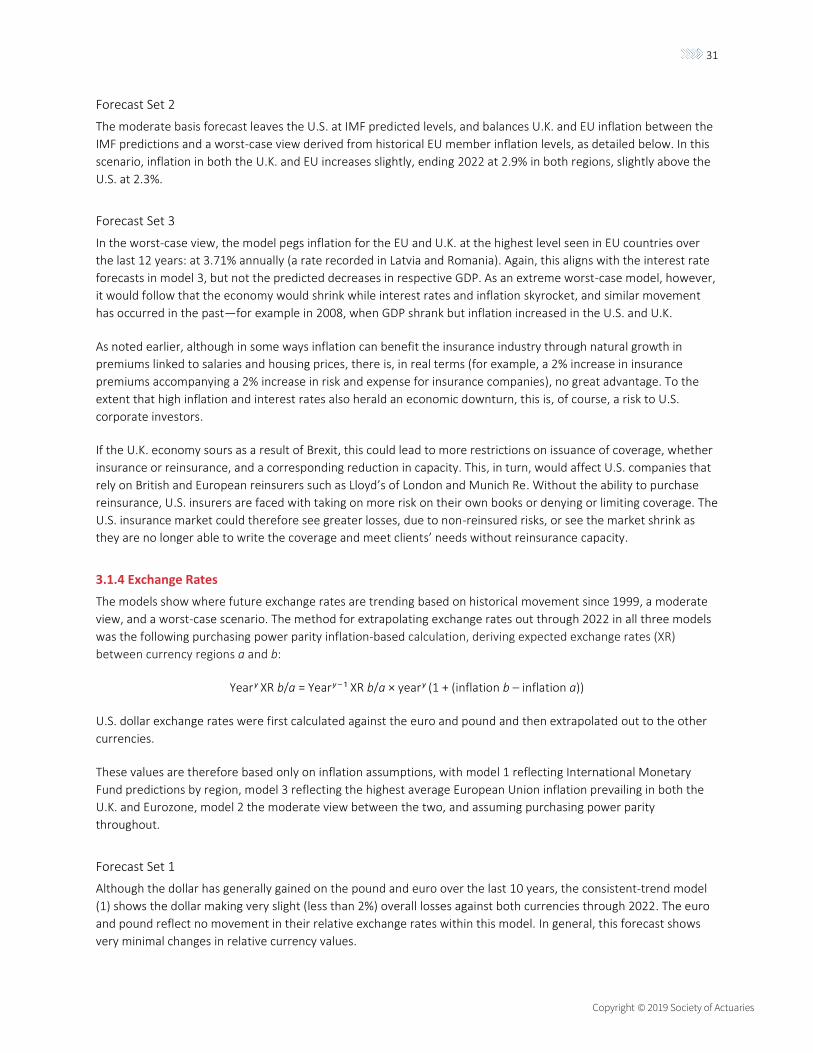
31
Copyright © 2019 Society of Actuaries
Forecast Set 2
The moderate basis forecast leaves the U.S. at IMF predicted levels, and balances U.K. and EU inflation between the
IMF predictions and a worst-case view derived from historical EU member inflation levels, as detailed below. In this
scenario, inflation in both the U.K. and EU increases slightly, ending 2022 at 2.9% in both regions, slightly above the
U.S. at 2.3%.
Forecast Set 3
In the worst-case view, the model pegs inflation for the EU and U.K. at the highest level seen in EU countries over
the last 12 years: at 3.71% annually (a rate recorded in Latvia and Romania). Again, this aligns with the interest rate
forecasts in model 3, but not the predicted decreases in respective GDP. As an extreme worst-case model, however,
it would follow that the economy would shrink while interest rates and inflation skyrocket, and similar movement
has occurred in the past—for example in 2008, when GDP shrank but inflation increased in the U.S. and U.K.
As noted earlier, although in some ways inflation can benefit the insurance industry through natural growth in
premiums linked to salaries and housing prices, there is, in real terms (for example, a 2% increase in insurance
premiums accompanying a 2% increase in risk and expense for insurance companies), no great advantage. To the
extent that high inflation and interest rates also herald an economic downturn, this is, of course, a risk to U.S.
corporate investors.
If the U.K. economy sours as a result of Brexit, this could lead to more restrictions on issuance of coverage, whether
insurance or reinsurance, and a corresponding reduction in capacity. This, in turn, would affect U.S. companies that
rely on British and European reinsurers such as Lloyd’s of London and Munich Re. Without the ability to purchase
reinsurance, U.S. insurers are faced with taking on more risk on their own books or denying or limiting coverage. The
U.S. insurance market could therefore see greater losses, due to non-reinsured risks, or see the market shrink as
they are no longer able to write the coverage and meet clients’ needs without reinsurance capacity.
3.1.4 Exchange Rates
The models show where future exchange rates are trending based on historical movement since 1999, a moderate
view, and a worst-case scenario. The method for extrapolating exchange rates out through 2022 in all three models
was the following purchasing power parity inflation-based calculation, deriving expected exchange rates (XR)
between currency regions a and b:
Yearʸ XR b/a = Yearʸ – ¹ XR b/a × yearʸ (1 + (inflation b – inflation a))
U.S. dollar exchange rates were first calculated against the euro and pound and then extrapolated out to the other
currencies.
These values are therefore based only on inflation assumptions, with model 1 reflecting International Monetary
Fund predictions by region, model 3 reflecting the highest average European Union inflation prevailing in both the
U.K. and Eurozone, model 2 the moderate view between the two, and assuming purchasing power parity
throughout.
Forecast Set 1
Although the dollar has generally gained on the pound and euro over the last 10 years, the consistent-trend model
(1) shows the dollar making very slight (less than 2%) overall losses against both currencies through 2022. The euro
and pound reflect no movement in their relative exchange rates within this model. In general, this forecast shows
very minimal changes in relative currency values.

32
Copyright © 2019 Society of Actuaries
Forecast Set 2
In the moderate scenario, the dollar makes slight gains against both the euro and the pound in the 2-3% range
between 2017 and 2022. The euro and pound again generally maintain their relative exchange rates in this scenario.
Forecast Set 3
The Brexit worst-case forecast shows the dollar making gains (7% on a composite basis) against both the euro and
the pound. The inter-relationship of the euro and pound remains unchanged.
Figure 14
Modeled Future Exchange Rate Trend by 2022
As reviewed earlier, devaluing of the pound and euro would mute the impact of British and Eurozone affiliates’
results on their U.S. headquarters’ income statements—dampening the effect of both strong and weak
performance. In the modeled version shown in Figure 14, a British affiliate of a U.S.-based multinational insurance
company generating the same profits in 2022 as in 2017 will result in a 7% smaller gross contribution to the U.S.
income statement, excluding taxes and other adjustments to income. Conversely, if the impact of Brexit is a
worsening of U.K. insurance results, these losses will also be 7% less when stated in U.S. dollars. The same effect
would, of course, occur if Eurozone, or other European Union currencies devalue as a result of Brexit and its
aftermath. Finally, the same effect would be felt in the general economy, as companies insured by U.S. carriers
would experience similar results and potentially a net reduction in profits from European holdings. As already
shown, U.S. industry is heavily linked to U.K. and European investments, so the overall effect of a reduction in
corporate value would also be one of reducing premium growth in the insurance industry.
3.1.5 Insurance Premium Revenue
The insurance premiums shown here include actual life and nonlife premiums in the countries within the
Organization for Economic Co-operation and Development (OECD) between 2008 and 2015. Future growth is
modeled on a consistent (1), moderate (2), and worst-case (3) basis.
-4%
-2%
0%
2%
4%
6%
8%
GBP/USD EUR/USD EUR/GBP
Modeled Future Exchange Rate Changes: 2022 versus 2017
Consistent Growth Moderate Basis Worst Case

33
Copyright © 2019 Society of Actuaries
Forecast Set 1
The insurance premium revenues shown starting in 2016 are calculated by applying the average growth (or decline,
for the U.K. and EU) from 2008 through 2015, as follows:
• United States, 3.7%
• United Kingdom, –3.6%
• European Union, –0.8%
These therefore result in a reduction in total insurance premiums for the European countries, cumulatively 22% in
the U.K. and 6% in the rest of the EU by 2022, and cumulative growth of 29% in the United States when compared
to 2015.
Forecast Set 2
The moderate forecast set shown here is set at a mid-point between the predicted figures in set (1) and set (3), as
detailed below. These result in a cumulative increase of 25% in the U.S. between 2015 and 2022, and a cumulative
decrease of 35% and 22% in the U.K. and EU over the same time period, respectively.
Forecast Set 3
Future growth in insurance premiums, of course, depends on many factors, but as a model for a U.K. worst-case
assumption, we can look to a European market that has recently experienced a major economic downturn: Greece.
If a post-Brexit U.K. sees its insurance industry revenue growth mimicking Greece, with average revenue falling by
8.9% per year, and the EU experiences a muted Brexit-related effect of –4.9% (the average of –8.9% and the
consistent growth rate, –0.8%),26 the expected impact to the U.S. market is still relatively minimal – a 20% increase
instead of 29% in set 1.
In this scenario, U.S. insurance premiums were assumed to continue to grow at the historical trend less 25% of
projected worst-case U.K. and 20% of EU premium losses; consistent growth of 3.7% is thereby reduced to 2.7%
annual growth. The 25% and 20% figures are a true worst-case scenario view, based on researcher judgement, of
the impact of U.S. and European insurance markets on the U.S. International insurance market integration can be
measured in several ways. One of these is the extent of reinsurance relationships between the countries in
question. Together, the U.K. and other EU reinsurers have a 14% share of total reinsured U.S. premiums, which
represent 13% of the total U.S. market, as noted earlier. From a reinsurance perspective, therefore, less than 2% of
total U.S. insurance premiums are ceded to the European Union. Loss of capacity in the European markets could
hamper U.S. insurers’ sales, and the inability to reinsure one element of a policy can lead to losing the business or
taking on higher levels of risk. Another integration point is the exchange rate calculation, since these premiums are
shown in U.S. dollars. A further 7% fall in pound and euro currency values projected in model 3 over the period to
2022 further serves to reduce the value of European holdings and premiums on U.S. firms’ books. The ensuing lower
dollar value of total insurance premiums will affect U.S. companies’ annual income and potentially their market
value. The value of U.K. and EU affiliates on their U.S. headquarters’ balance sheets is another integration point, as
are macroeconomic factors affecting local economies, wealth and therefore insurance revenues. These are some of
the considerations related to the impact on the U.S. insurance industry of events across the Atlantic and beyond.
While the sum of these integrations falls lower than 20-25%, researcher judgement reduced the U.S. premium
26 OECD. OECD Insurance Statistics 2016. http://www.oecd.org/publications/oecd-insurance-statistics-2307843x.htm (winter 2017); average of 2008 through 2015 insurance premium annual growth, life and nonlife.

34
Copyright © 2019 Society of Actuaries
historical growth rate by 25% of U.K. decline and 20% of EU decline in premium as a worst-case prediction of U.S.
premiums. Nonetheless, in 2022, more than two years after the effective date of the U.K.’s withdrawal from the
European Union, U.S. premiums modeled under a worst-case Brexit scenario are still only 5% lower than standard
modeled assumptions, all other factors being equal (see Figure 15).
As noted earlier, the more mature insurance markets in Europe have already experienced market contraction over
the last few years, and the forecasts continue or even exaggerate this trend due to the assumptions noted here.
Premiums are stated in U.S. dollars and so already reflect the impact of exchange rate changes over time in the
historical view. The combination of a strong dollar (with a devaluing of the pound and euro) and premium decline in
Europe serve to exaggerate the effect, as the dwindling European insurance market seems even slighter in dollar
terms. For the U.S. industry, there would be less focus on British and European holdings but less ability to rely on
their decreasing reinsurance capacity.
Figure 15
U.S. Predicted Life and Nonlife Premium Growth ($ Millions)
$-
$500,000
$1,000,000
$1,500,000
$2,000,000
$2,500,000
$3,000,000
$3,500,000
$4,000,000
2016 2017 2018 2019 2020 2021 2022
U.S. Predicted Life and Non-Life Premium Growth, $ Millions
Consistent Growth Basis Moderate Basis Worst Case Basis

35
Copyright © 2019 Society of Actuaries
Conclusion
The U.S. insurance industry owes its heritage to the United Kingdom and Lloyd’s of London, and there are still visible
traces of this lineage today, from the extent that U.S. insurance companies are invested in the U.K., to similarities in
insurance policy forms. The majority of U.S. insurance companies are invested in or reinsured by U.K. firms to some
extent and will be watching the results of the Brexit negotiations, attempting to scope out the magnitude of the
impact on the U.S. insurance industry.
So what could happen next? We have already reviewed the potential impacts on the macroeconomy and the
insurance industry in the projections, under three scenarios. Additionally, these relationships and potential changes
could be investigated further in several ways, using information in the appendix, which details the three models and
factors. This information lends itself to further updates as the latest annual indicators and data points, such as GDP,
or additional predictions are published. Projections can also be pushed out past 2022, to scope the potential
changes. In addition, researchers could build other scenarios using alternative growth and economic indicators.
The main watch areas in this study are the future of the U.K. and EU economies post-Brexit and their impact on U.S.
insurance companies’ financial health and market capacity. The relatively more mature British and EU insurance
markets are already retracting in size, and this appears not to have had a large effect on U.S. companies. Under the
current strong-dollar economic environment, in fact, losses in Europe will be felt less keenly in the U.S., and a worst-
case scenario in Europe by definition reflects a weakening of European currencies relative to the dollar. All in all,
from an economic point of view, it is surprising to see how little the U.S. market could be affected by Brexit.
Reinsurance capacity is another concern. The U.S. insurance market is 13% reinsured today, and many of these
reinsurance policies are placed in whole or in part in the European reinsurance market. A loss of capacity here could
affect U.S. firms’ ability to take on larger risks. The choice then would be whether to underwrite fully in the U.S., find
alternative reinsurance or refuse to offer coverage. Whether this affects future profits on the bottom-line view or
future premium growth on the top-line view, it could have a limiting effect on U.S. market growth. However, in view
of prior market decreases in Europe and the heaviness of U.S. investment there, it is clear that the U.S. market has
been able to grow in the past even in the face of market retraction overseas.
Market disruption, especially in cross-border policies, is likely to ensue post-Brexit unless the U.K. negotiates the
softest of Brexits, affording all the current freedoms and ability to passport coverage. This future seems unlikely at
this stage of the negotiations, so U.S. firms that are invested in Europe today and have exposure to cross-border
policies could consider planning for the contingency of potential market disruption as these are re-bid and rewritten
post-Brexit. This could have a dampening effect on sales due to the focus on rewriting existing business.
Even in the worst-case scenario, with extreme reductions in European insurance markets and capacity, coupled with
poor economic health, the U.S. maintains a fairly strong economy, and a strong dollar again minimizes the impact of
overseas losses denominated in weaker currencies. Even in a high-interest-rate, high-inflation environment, with
suppressed GDP growth, the U.S. insurance industry may be able to bear the impact of the post-Brexit European
markets, even in the more extreme slump scenario.
All in all, there are potential impacts on the U.S. insurance industry as a result of Brexit, but despite the extent to
which the U.S. is invested in the U.K., these impacts appear to be minimal and readily absorbed by the market. It
remains to be seen what kind of Brexit will ensue, and the resulting impact to the U.K., European and global
economies. This will, in turn, define the ultimate impact on the U.S. insurance industry.

36
Copyright © 2019 Society of Actuaries
Appendix Figure 16
European Countries by Treaty and Monetary Union Membership
CountryEU
Member?
EEA
Member?
EFTA
Member?
Member
of Single
Market?
Eurozone
Country?
Other?
(Specify in
Comments)
Comments
Albania N N N N N Y Stabilization and Association Agreement
Andorra N N N N Y Y Bilateral customs union
Austria Y Y N Y Y N
Belgium Y Y N Y Y N
Bosnia & Herzegovina N N N N N Y Stabilization and Association Agreement
Bulgaria Y Y N Y N N
Croatia Y Y N Y N N
Cyprus Y Y N Y Y N
Czech Republic Y Y N Y N N
Denmark Y Y N Y N N ERM II (pre member, euro)
Estonia Y Y N Y Y N
Finland Y Y N Y Y N
France Y Y N Y Y N
Germany Y Y N Y Y N
Georgia N N N N N Y Deep and Comprehensive Free Trade Area
Greece Y Y N Y Y N
Hungary Y Y N Y N N
Iceland N Y Y Y N N
Ireland Y Y N Y Y N
Italy Y Y N Y Y N
Kosovo N N N N * Y Stabilization and Association Agreement
Latvia Y Y N Y Y N
Liechtenstein N Y Y Y Y N
Lithuania Y Y N Y Y N
Luxembourg Y Y N Y Y N
Macedonia N N N N N Y Stabilization and Association Agreement
Malta Y Y N Y Y N
Moldova N N N N N Y Deep and Comprehensive Free Trade Area
Monaco N N N N Y Y Bilateral customs union with EU
Montenegro N N N N * Y Stabilization and Association Agreement
Netherlands Y Y N Y Y N
Norway N Y Y Y N N
Poland Y Y N Y N N
Portugal Y Y N Y Y N
Romania Y Y N Y N N
Russia N N N N N N
San Marino N N N N Y Y Bilateral customs union with EU
Serbia N N N N N Y Stabilization and Association Agreement
Slovakia Y Y N Y Y N
Slovenia Y Y N Y Y N
Spain Y Y N Y Y N
Sweden Y Y N Y N N
Switzerland N N Y Y N N
Turkey N N N N N Y Bilateral customs union with EU
United Kingdom Y Y N Y N N
Ukraine N N N N N Y Deep and Comprehensive Free Trade Area
Vatican City N N N N Y N
Total 28 31 4 32 24 12
* = without EU approval

37
Copyright © 2019 Society of Actuaries
Figure 17
Model 1 Forecast: GDP, Interest Rates, Inflation
(4.00)
(3.00)
(2.00)
(1.00)
-
1.00
2.00
3.00
4.00
5.00
6.00
2008 2009 2010 2011 2012 2013 2014 2015 2016 2017 2018 2019 2020 2021 2022
US GDP Growth US Interest Rates US Inflation
predicted
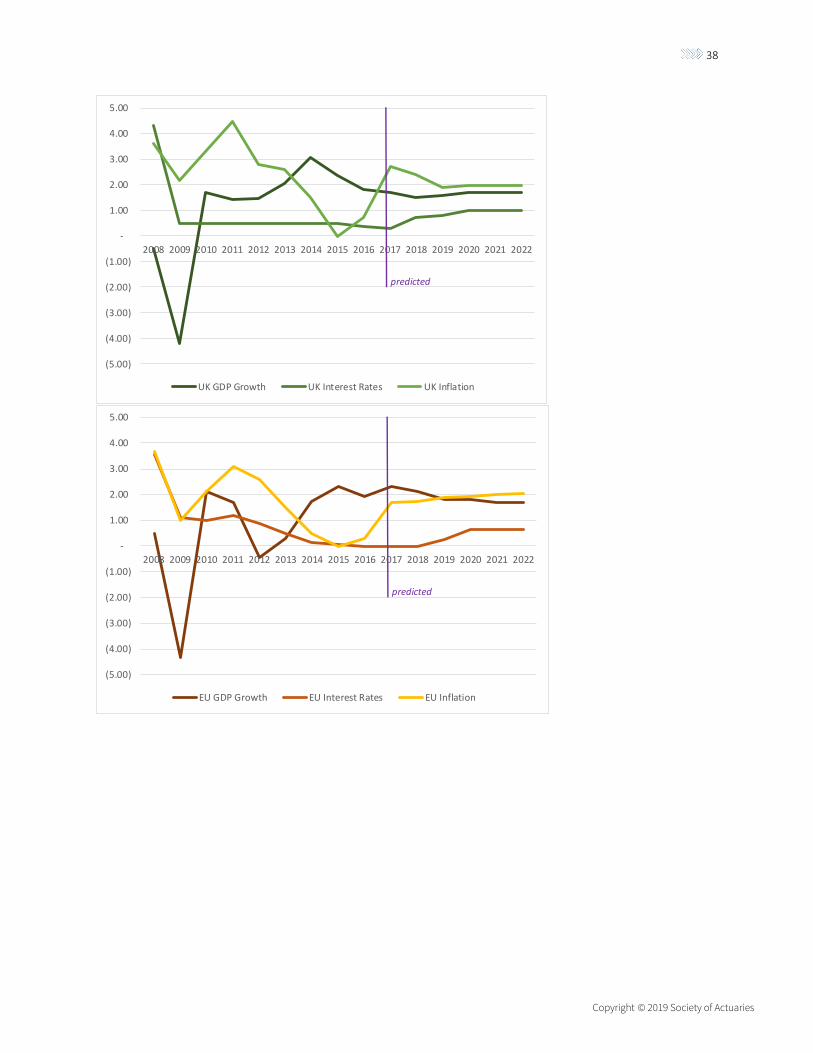
38
Copyright © 2019 Society of Actuaries
(5.00)
(4.00)
(3.00)
(2.00)
(1.00)
-
1.00
2.00
3.00
4.00
5.00
2008 2009 2010 2011 2012 2013 2014 2015 2016 2017 2018 2019 2020 2021 2022
UK GDP Growth UK Interest Rates UK Inflation
predicted
(5.00)
(4.00)
(3.00)
(2.00)
(1.00)
-
1.00
2.00
3.00
4.00
5.00
2008 2009 2010 2011 2012 2013 2014 2015 2016 2017 2018 2019 2020 2021 2022
EU GDP Growth EU Interest Rates EU Inflation
predicted

39
Copyright © 2019 Society of Actuaries
Figure 18
Model 2 Forecast: GDP, Interest Rates, and Inflation

40
Copyright © 2019 Society of Actuaries

41
Copyright © 2019 Society of Actuaries
Figure 19
Model 3 Forecast: GDP, Interest Rates, and Inflation
(4.00)
(3.00)
(2.00)
(1.00)
-
1.00
2.00
3.00
4.00
5.00
6.00
2008 2009 2010 2011 2012 2013 2014 2015 2016 2017 2018 2019 2020 2021 2022
US GDP Growth US Interest Rates US Inflation
predicted
(6.00)
(4.00)
(2.00)
-
2.00
4.00
6.00
2008 2009 2010 2011 2012 2013 2014 2015 2016 2017 2018 2019 2020 2021 2022
UK GDP Growth UK Interest Rates UK Inflation
predicted

42
Copyright © 2019 Society of Actuaries
(6.00)
(4.00)
(2.00)
-
2.00
4.00
6.00
2008 2009 2010 2011 2012 2013 2014 2015 2016 2017 2018 2019 2020 2021 2022
EU GDP Growth EU Interest Rates EU Inflation
predicted
43
Copyright © 2019 Society of Actuaries
About The Society of Actuaries
The Society of Actuaries (SOA), formed in 1949, is one of the largest actuarial professional organizations in the world
dedicated to serving more than 30,000 actuarial members and the public in the United States, Canada and
worldwide. In line with the SOA Vision Statement, actuaries act as business leaders who develop and use
mathematical models to measure and manage risk in support of financial security for individuals, organizations and
the public.
The SOA supports actuaries and advances knowledge through research and education. As part of its work, the SOA
seeks to inform public policy development and public understanding through research. The SOA aspires to be a
trusted source of objective, data-driven research and analysis with an actuarial perspective for its members,
industry, policymakers and the public. This distinct perspective comes from the SOA as an association of actuaries,
who have a rigorous formal education and direct experience as practitioners as they perform applied research. The
SOA also welcomes the opportunity to partner with other organizations in our work where appropriate.
The SOA has a history of working with public policymakers and regulators in developing historical experience studies
and projection techniques as well as individual reports on health care, retirement and other topics. The SOA’s
research is intended to aid the work of policymakers and regulators and follow certain core principles:
Objectivity: The SOA’s research informs and provides analysis that can be relied upon by other individuals or
organizations involved in public policy discussions. The SOA does not take advocacy positions or lobby specific policy
proposals.
Quality: The SOA aspires to the highest ethical and quality standards in all of its research and analysis. Our research
process is overseen by experienced actuaries and nonactuaries from a range of industry sectors and organizations. A
rigorous peer-review process ensures the quality and integrity of our work.
Relevance: The SOA provides timely research on public policy issues. Our research advances actuarial knowledge
while providing critical insights on key policy issues, and thereby provides value to stakeholders and decision
makers.
Quantification: The SOA leverages the diverse skill sets of actuaries to provide research and findings that are driven
by the best available data and methods. Actuaries use detailed modeling to analyze financial risk and provide
distinct insight and quantification. Further, actuarial standards require transparency and the disclosure of the
assumptions and analytic approach underlying the work.
Society of Actuaries 475 N. Martingale Road, Suite 600
Schaumburg, Illinois 60173 www.SOA.org