Embed Size (px)
Citation preview

THE POTENTIAL OF VETIVER GRASS FOR WASTEWATER
TREATMENT
M. Sc. Thesis
ABDULKERIM BEDEWI
October 2010
Haramaya University

THE POTENTIAL OF VETIVER GRASS FOR WASTEWATER
TREATMENT
A Thesis Submitted through School of Natural Resources and
Environmental Engineering (Institute of Technology) to the School of
Graduate Studies
HARAMAYA UNIVERSITY
In Partial Fulfilment of the Requirements for the Degree of
MASTER OF SCIENCE IN SOIL AND WATER CONSERVATION
ENGINEERING
By
Abdulkerim Bedewi
October 2010
Haramaya University

ii
SCHOOL OF GRADUATE STUDIES
HARAMAYA UNIVERSITY
As Thesis research advisors, we hereby certify that we have read and evaluated this thesis
prepared, under our guidance, by Abdulkerim Bedewi, entitled 'The Potential of Vetiver
Grass for Wastewater Treatment'. We recommend that it be submitted as fulfilling the
thesis requirement.
Dr. Tena Alamirew (Ph.D) _________________ _______________
Major Advisor Signature Date
Prof. Shoeb Quraishi (Ph.D) __________________ _______________
Co –Advisor Signature Date
As member of the Board of Examiners of the M. Sc. Thesis Open Defense Examination, we
certify that we have read, evaluated the thesis prepared by Abdulkerim Bedewi and
examined the candidate. We recommended that the thesis be accepted as fulfilling the thesis
requirement for the Degree of Master of Science in Soil and Water Conservation
Engineering.
______________________ _________________ _______________
Chairperson Signature Date
______________________ _________________ _______________
Internal Examiner Signature Date
______________________ _________________ _______________
External Examiner Signature Date

iii
DEDICATION
I dedicate this thesis manuscript to W/t Amy Kedir and a friend of all for their affection and
love.
iv
STATEMENT OF THE AUTHOR
First, I affirm that this thesis is my bonafide work and all sources of materials used for it have
been duly acknowledged. This thesis has been submitted in partial fulfillment of the
requirements for M. Sc. degree at Haramaya University and is deposited at the University
Library to be made available to borrowers under rules of the library. I solemnly declare that
this thesis is not submitted to any other institution anywhere for the award of any academic
degree, diploma, or certificate.
Brief quotations from this thesis are allowable without special permission provided that an
accurate acknowledgement of the source is made. Requests for permission for extended
quotation from or reproduction of this manuscript in whole or in part may be granted by the
Head of the School of Natural Resources and Environmental Engineering or the Dean of the
School of Graduate Studies when the proposed use of material is in the interests of
scholarship. In all other instances, however, permission must be obtained from the author.
Name: Abdulkerim Bedewi Signature: _________________
Place: Haramaya University, Haramaya
Date of Submission: October 2010

v
LIST OF ABBREVIATIONS
ANOVA Analysis of Variance
AOAC Association of Official Analytical Chemist
AWWA American Water Work Association
BOD5 Five Day Biochemical Oxygen Demand
COD Chemical Oxygen Demand
DO Dissolved Oxygen
EC Electrical Conductivity
EEPA Ethiopian Environmental Protection Authority
GOE Government of Ethiopia
g Gram
HU Haramaya University
HRT Hydraulic Retention Time
MPL Maximum Permissible Limit
MfM Menschen für Menschen
μS/cm Micro Siemens Per Centimeter
mg/l Mili Gram Per Liter
NGO Non Governmental Organization
N Normality
PAO Phosphate Accumulating Organisms
pH Potential Hydrogenation
SD Standard Deviation
SAS Statistical Analysis System
TN Total Nitrogen
TP Total Phosphorus
UNEP United Nations Environmental Program
USA United States of America
USEPA United States of Environmental Protection Agency

vi
BIOGRAPHICAL SKETCH
Abdulkerim Bedewi Serur was born in Adama, Ethiopia to his mother, Lubaba Hassen Salia,
and father, Bedewi Serur Barkye, on September 13, 1986. He attended his elementary, junior
and secondary school educations in Mesfin Kelkay Elementary School, Adama Junior
Secondary School and Hawas Technical and Vocational Comprehensive Secondary School,
respectively in Adama. He completed his high school education in 2004 and joined the then
Alemaya University of Agriculture and graduated with B. Sc. Degree in Soil and Water
Engineering and Management in July 2007.
After graduation, he was employed as Graduate Assistant by the Natural Resource
Management Department of Mada-Walabu University through Ministry of Education. He was
involved in assisting class and laboratory sessions for undergraduate students for one year.
Thereafter, he joined Haramaya University for his M. Sc. studies in the Soil and Water
Conservation Engineering in October 2008.

vii
ACKNOWLEDGMENTS
As many people have contributed to this study, it is not possible to mention everyone.
However, all of them deserve my gratitude. I would like to express my deepest gratitude and
appreciation to my advisors Dr. Tena Alamirew (Ph.D) and Prof. Shoeb Quraishi (Ph.D) for
initiating this thesis work, their consistent support, and providing sincere, faithful and
immense advice and guidance from the inception until the completion of the work to bring
this study to this form at the expense of their invaluable time enriched my professional
performance a lot. To put it in a nut shell, this thesis paper would not have been completed
like this without their aforementioned contributions. Thanks for trusting on me. They were
always willing to help me starting from installing the system to the end of lab work in all
aspects and extremely helpful in correcting the technical problems throughout the work.
I further take this opportunity to express my deep feelings and gratitudes to Dr. Solomon
Abera (D. Eng.) for his support throughout the period that I spent in Master program. Thanks
for your help on getting this study into this shape; you have put a great part on it.
I would also like to express my appreciation to Ministry of Education for providing me
financial support for this thesis work and it enabled me to perform the hard tasks related with
this research works in a sound way. I am very grateful to Sustainable Land Use Forum at
Addis Ababa through Menschen für Menschen Foundation (Harar Branch) for providing me
the experimental material (vetiver grass).
I would like to acknowledge the Haramaya University and Harar Brewery Share Company for
providing me their water quality laboratory to carry out the required laboratory analysis
works. Many special thanks to all my friends; they have enriched my life with new, different,
good and bad experiences, all part of life, which made my stay in Haramaya University.
Also, my very special, warm and deep thank to my family for offering me their perpetual
love, support, and encouragement throughout my life and mainly during the last two years.
Lastly, above all, I want to thank God for helping me endure the rigorous of everyday life and
to overcome the challenges of graduate studies. Without Him nothing is happened. So I want
to say ALHAMDULILAH!!

viii
TABLE OF CONTENTS
STATEMENT OF THE AUTHOR iv
LIST OF ABBREVIATIONS v
BIOGRAPHICAL SKETCH vi
ACKNOWLEDGMENTS vii
LIST OF TABLES x
LIST OF FIGURES xi
LIST OF TABLES IN THE APPENDIX xii
LIST OF FIGURES IN THE APPENDIX xiii
ABSTRACT xiv
1. INTRODUCTION 1
2. LITERATURE REVIEW 4
2.1. Characteristics of Wastewater 4
2.2. Environmental Impact of Wastewater 7
2.3. Legislation for the Control of Discharge of Industrial Effluents in Ethiopia 7
2.4. Phyto-remedial Technology 8
2.4.1. Mechanisms of phyto-remedial technology 9
2.4.2. Advantages and disadvantages of phyto-remedial technology 10
2.5. The Vetiver Grass 11
2.6. Characteristics of Vetiver Grass Suitable for Wastewater Treatment 13
2.6.1. Morphological features 13
2.6.2. Physiological features 13
2.7. Purification of Contaminated Water 14
2.7.1. Purification of wastewater 14
2.7.2. Purification of polluted water 16
2.7.3. Purification of eutrophicated water 16
2.8. Hydroponic Technique 17
3. MATERIALS AND METHODS 19

ix
TABLE OF CONTENTS (Continued)
3.1. Experimental Location 19
3.2. Planting Materials and Experimental Set-Up 19
3.3. Sample Collection for Water Quality Analysis 23
3.4. Statistical Data Analysis and Interpretation 25
4. RESULTS AND DISCUSSION 26
4.1. Domestic Wastewater Quality before Application of Vetiver 26
4.2. Effects of Vetiver on the Characteristics of Effluent 29
5. SUMMARY, CONCLUSIONS AND RECOMMENDATIONS 40
5.1. Summary 40
5.2. Conclusions 42
5.3. Recommendations 42
6. REFERENCES 45
7. APPENDICES 49
7.1. Appendix Tables 49
7.2. Appendix Figures 57

x
LIST OF TABLES
Table Page
1. Treatment combination ........................................................................................................ 23
2. Selected parameters and methods of physico-chemical analysis ......................................... 24
3. Domestic wastewater quality before vetiver application in comparison to the maximum
permissible limit values (EEPA, 2003) ............................................................................... 26
4. Effects of vetiver and control treatment on different pollutant parameters ......................... 34
5. The average concentration and removal efficiency of vetiver after eight weeks hydroponic
treatment for selected parameters ........................................................................................ 36

xi
LIST OF FIGURES
Figure Page
1. Bare-rooted vetiver uplifted and transported from Yerer nursery site, Babile to HU .......... 20
2. Tiller preparation and collection along with roots dipped in slurry ..................................... 20
3. Manual bare-rooted vetiver grass planting in HU experimental site ................................... 20
4. Uplifting five months old vetiver for wastewater application in HU experimental site ...... 21
5. The fresh wastewater collection and hydroponic experimental sets at the starting period .. 21
6. Schematic sketch of floating platform ................................................................................. 22
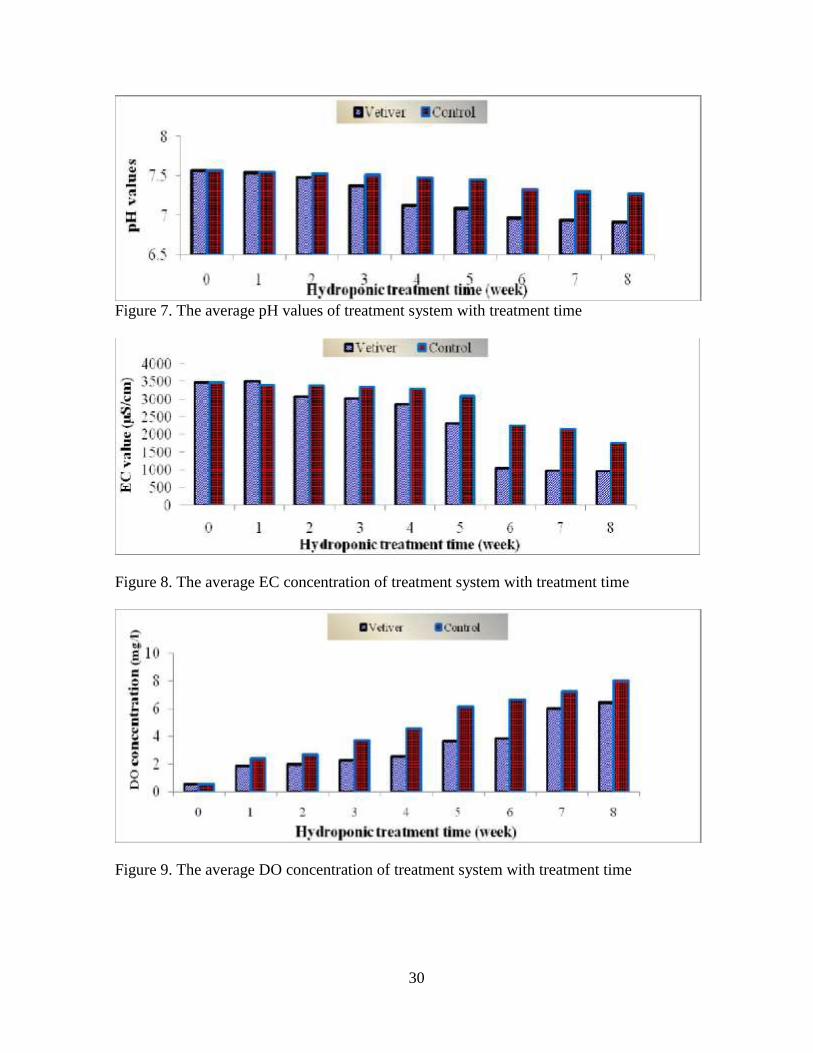
7. The average pH values of treatment system with treatment time ........................................ 30
8. The average EC concentration of treatment system with treatment time ............................ 30
9. The average DO concentration of treatment system with treatment time ............................ 30
10. The average BOD5 concentration of treatment system with treatment time ...................... 31
11. The average COD concentration of treatment system with treatment time ....................... 31
12. The average TN concentration of treatment system with treatment time Error! Bookmark
not defined.
13. The average TP concentration of treatment system with treatment time ........................... 32

xii
LIST OF TABLES IN THE APPENDIX
Appendix Table Page
1. Daily temperature and rainfall during the period of experiment.......................................... 49
2. The average pollutant concentration quality of domestic wastewater after treatment during
the experiment period .......................................................................................................... 51
3. Wastewater quality data arranged for JMP™ analysis for control and vetiver treatment
during the entire experiment period..................................................................................... 52
4. ANOVA for pH on the effects of vetiver and control treatment.......................................... 54
5. ANOVA for EC on the effects of vetiver and control treatment ......................................... 54
6. ANOVA for DO on the effects of vetiver and control treatment ......................................... 54
7. ANOVA for BOD5 on the effects of vetiver and control treatment ..................................... 54
8. ANOVA for COD on the effects of vetiver and control treatment ...................................... 54
9. ANOVA for TN on the effects of vetiver and control treatment ......................................... 55
10. ANOVA for TP on the effects of vetiver and control treatment ........................................ 55
11. ANOVA for EC on the effect of vetiver after eight weeks hydroponic treatment ............ 55
12. ANOVA for BOD5 on the effect of vetiver after eight weeks hydroponic treatment ........ 55
13. ANOVA for COD on the effect of vetiver after eight weeks hydroponic treatment ......... 55
14. ANOVA for TN on the effect of vetiver after eight weeks hydroponic treatment ............ 56
15. ANOVA for TP on the effect of vetiver after eight weeks hydroponic treatment ............. 56

xiii
LIST OF FIGURES IN THE APPENDIX
Appendix Figure Page
1. Five months old vetiver grass ready for experiment ............................................................ 57
2. Instruments used in the measurement of parameters ........................................................... 58
3. Impacts of wastewater on receiving environment at HU main campus ............................... 59
4. Tillers, shoots and roots after the treatment experiment ...................................................... 60
5. Treatment efficiency of vetiver roots ................................................................................... 61
6. Visual comparison between treated and untreated wastewater ............................................ 62

xiv
THE POTENTIAL OF VETIVER GRASS FOR WASTEWATER
TREATMENT
ABSTRACT
An experiment was conducted to assess the effect of vetiver grass growing under hydroponic
with no supporting medium to treat the domestic wastewater released to Haramaya
University farm, which had been primarily treated in septic tank. The field experiment was
assigned in plastic containers of thirty liters which were set-up simultaneously with planted
vetiver hydroponically and no vetiver as a control, which replicated three times in three
containers. Treatments started when vetiver was five months old. Water samples were taken
for analysis at weekly interval for eight weeks and examined for different water quality
parameters during the time of experiment. The physico-chemical parameter results obtained
before application of vetiver for wastewater treatment were 980 20-1026.67 41 mg/l,
1226.40 24-1285.20 51 mg/l, 120.96 3-154.56 1 mg/l, 26.03 0.23-31.02 0.45 mg/l
and 2496.67 235-3470 220 µS/cm respectively for BOD5, COD, TN, TP and EC. However,
sample results of the analysis of variance after eight weeks of hydroponic vetiver treatment
showed that the overall concentration of BOD5, COD, TN, TP and EC were significantly
(p<0.0001) reduced from 1026.67±41 to 80.00±20 mg/l, from 1285.20±51 to 101.40±25 mg/l,
from 154.56±1 to 13.64±0.11 mg/l, from 31.02±0.45 to 4.12±0.11 mg/l and from 3470.00±220
to 966.67±23 µS/cm, respectively. The removal efficiencies were observed to be 92.21%,
92.11%, 91.17%, 86.72% and 72.14%, respectively, for BOD5, COD, TN, TP and EC
parameters. After eight weeks hydroponic vetiver treatment of domestic wastewater, the
contents of pollutants appreciably decreased, and almost all of them were below Ethiopian
Environmental Protection Authority maximum permissible discharge limit values with the
exception of BOD5. Thus, the potential of vetiver after eight weeks hydroponic treatment was
found to be efficient for the removal of chemical oxygen demand, total nitrogen, and total
phosphorous and electrical conductivity from domestic wastewater. However, it was not
observed to be efficient for the treatment of biochemical oxygen demand.

1. INTRODUCTION
Long before the industrial revolution, human activity began to alter the Earth's environment.
However, only in the past century, the scale of such alterations has become global in scope.
Moreover, the rate of these recent changes is enormously high compared with the historical
record. Today, at the beginning of the new millennium, it is clear that humans are inducing
environmental changes in the planet as a whole. In fact, the human fingerprint is abundantly
seen on the global atmosphere, the oceans, and the land of all continents (Miller, 2001).
Clean water is becoming one of the scarcest and valuable resources in the twenty first century
as its supply is finite and its traditional source is easily polluted by industries and population
growth. But the water, available from different surface and groundwater sources, are known
to be clean and free from any contamination since the release of nutrient-rich wastewater into
receiving open surface and subsurface along with river results in environmental and human
health problems such as eutrophication in water bodies, i.e. undesirable growth of aquatic
plants and algae (Morrison et al., 2001).
The wastewater discharged to open land presents health risks, decrease crop yields and
product quality, degrade the soil and contaminate underlying groundwater which might be
extracted for drinking, crop irrigation or stock watering purposes. Mainly, the discharging of
domestic wastewater on a restricted area may result into runoff caused by the presence of
soaps, shampoos, detergents and grease in the wastewater. Powdered detergents, shampoos
and soap contain 80% sodium as filling which makes the wastewater quite alkaline. Sodium
gradually replaces calcium and magnesium on the surfaces of soil particles, making it sodic,
which means that with too much sodium, the soil disperses when water such as rainfalls on it,
clogging soil pores, forming a compacted layer at the surface, and causing erosion (Beavers,
2002).
The production and discharge of domestic wastewater is rapidly increasing in developing
countries due to population growth, urbanization, and economic development. There is,
however, a lack of investment capacity worldwide for construction and operation of adequate

2
treatment facilities (Van Lier and Lettinga, 1999), which threatens the quality of surface
water, soils and groundwater to which wastewater is discharged. Likewise, in Ethiopia, water
quality problem generated by inadequate treatment of domestic waste, population growth,
urbanization, and emerging industries like leather and textile are at large. The treatment of
these wastewater has not been given due attention to date. One of the reasons for the lack of
attention is the capacity and the cost associated with the construction and operation of
wastewater treatment plants. However, this wastewater has serious negative impact not only
on underground, surface water bodies and land in the surrounding area but also on the aquatic
ecological system (Zinabu and Zerihun, 2002).
Truong (2003) explained that domestic wastewater characteristically contains high level of
organic matter content usually measured as biochemical oxygen demand (BOD5) or chemical
oxygen demand (COD) and nutrient contents (notably nitrogen and phosphorus). As these
pollutants are toxic to humans and have impact on the environment, treatment before
discharging to open land or storage water body is essential. Treatment of domestic wastewater
has mainly been done using physical, chemical and biological wastewater treatment systems
such as activated sludge and biological nutrient removal technologies. However, these
technologies are expensive and depend on power source and skilled personnel.
Phyto-remediation is one of the biological wastewater treatment methods which is low cost,
consumes less energy, natural, practicable, effective and simple. Suitable plant species used
for phyto-remediation should have high uptake of both organic and inorganic pollutants, grow
well in polluted water and be easily controlled in quantitatively propagated dispersion.
Vetiver grass (Vetiveria zizanioides (L.) Nash recently reclassified as Chrysopogon
zizanioides (L.) Roberty) belongs to the gramineae family and was first used for soil and
water conservation purpose in all countries including Ethiopia. But in the last six years, due to
its unique morphological and physiological characteristics and tolerance to high levels of
heavy metals and adverse conditions, its role has been successfully extended to environmental
protection, particularly in the field of wastewater treatment (Truong, 2003).

3
Application of the vetiver system for wastewater treatment is a new and innovative phyto-
remedial technology developed in Queensland, Australia by the Department of Natural
Resources and Mines. It is a green and environmental friendly wastewater treatment
technology as well as a natural recycling method (i.e. in the process of ‘treatment’, the vetiver
plant absorbs essential plant nutrients such as N, P and cations, and stores them for other
uses). Its end-product has provided high nutrient material for animal feed, mulch for gardens,
leaves and stalks for room cooling, handicrafts, roof thatching, extracting volatile oils for
making perfume and aromatic ingredients in soaps, raw material for making pulp, paper,
ropes, mats, hats, baskets, manure for organic farming and organic source for composting just
to name a few (Smeal et al., 2003).
Therefore, low cost, less energy, natural, practicable, effective and simple, biological
wastewater treatment method known as phyto-remediation of vetiver grass to treat wastewater
is of a superseding solution. For this reason, this experiment is making the first move to assess
the effect of vetiver grass to treat the domestic wastewater released to Haramaya University
farm with the following specific objectives.
Specific objectives
To evaluate the physico-chemical parameters of Haramaya University main campus
wastewater quality before application of vetiver for wastewater treatment at the
observation period.
To evaluate the possibility of vetiver grass in treating domestic wastewater using
hydroponic technique.

4
2. LITERATURE REVIEW
2.1. Characteristics of Wastewater
The main constituent of domestic wastewater is human excreta with smaller contributions
from food preparations, high level of organic matter and nutrients, personal washings, laundry
and surface drainage. The effluent from domestic and industries especially from tannery are
typically characterized with: turbidity, temperature, foul smelling and high concentration in
EC, pH, organic matter content which is measured by BOD5 and COD, organic nitrogen and
ammonia (Boshoff et al., 2004).
Temperature: Many of the physical, chemical and biological characteristics of wastewater
are directly affected by temperature. Temperature is highly dependent on the depth of the
water, season, time of the day, cloudiness of the sky and the air temperature. Wastewater
discharges can also affect temperature. Changes in temperature alter dissolved oxygen (higher
temperatures mean the water holds less dissolved oxygen). The distribution and number of
aquatic species also changes as temperature varies. A short period of high temperatures each
year can make the water body unsuitable for sensitive species even though during the rest of
the year the temperature is acceptable (Boshoff et al., 2004).
pH: pH is the measure of the acidity or alkalinity of the water on a scale from 1–14 (1 is very
acidic, 7 neutral and 14 very alkaline). The pH of water affects the solubility of many toxic
and nutritive chemicals; therefore, the availability of these substances to aquatic organisms is
affected. As acidity increases, most metals become more water soluble and more toxic.
Ammonia, however, becomes more toxic with only a slight increase in pH. Elevated nutrient
levels are some of the causes to acidity or alkalinity which cause excessive growth of algae
and plants that will lift pH values. If extremely high or extremely low pH values occur, it
would result in the death of all aquatic life (Shu et al., 2005).
Electrical conductivity: The electrical conductivity is the ability of a substance to conduct
electricity. The conductivity of water is a more-or-less linear function of the concentration of

5
dissolved ions (AWWA, 2000). Conductivity itself is not a human or aquatic health concern,
but because it is easily measured, it can serve as an indicator of other water quality problems
(i.e. it is used to give an indication of the amount of inorganic materials in the wastewater
including; calcium, bicarbonate, nitrogen, phosphorus and others). If the conductivity of an
environment (stream) suddenly increases, it indicates that there is a source of dissolved ions in
the vicinity. Therefore, conductivity measurements can be used as a quick way to locate
potential water quality problems. Conductivity is measured in terms of conductivity per unit
length (micro Siemens/cm).
Dissolved oxygen: The dissolved oxygen is amount of dissolved (or free) oxygen present in
water or wastewater. The amount of dissolved oxygen in the environment (streams) is
dependent on: the water temperature, the amount of oxygen taken out of the system by
respiring and decaying organisms, the amount of oxygen put back into the system by
photosynthesizing plants, stream flow and aeration (Metcalf and Eddy, 2003). Dissolved
oxygen is measured in milligrams per liter (mg/l) or parts per million (ppm). The temperature
of stream water influences the amount of dissolved oxygen present; less oxygen dissolves in
warm water than cold water. For this reason, there is cause for concern for streams with warm
water.
Organic matter content: In the biological wastewater treatment method, micro-organisms
are utilized to treat wastewater because they can uptake organic matter and nutrients (nitrogen
and phosphorus) for energy source, metabolism and for building blocks (cell synthesis)
(Wiesmann et al., 2007). Biodegradation of organic matter during wastewater treatments
occur either in the presence of oxygen (aerobically) or in anoxic conditions by denitrification
and bacteria decomposes these organic materials using dissolved oxygen, thus reducing the
dissolved oxygen present for fish and other aquatic species.
Biochemical oxygen demand (BOD), biochemical degradation of biodegradable organic
matter, is a measure of the amount of oxygen that bacteria will consume while decomposing
organic matter under aerobic conditions. Biochemical oxygen demand is determined by
incubating a sample of water for five days and measuring the loss of oxygen from the

6
beginning to the end of the test. Samples often must be diluted prior to incubation or the
bacteria will deplete all of the oxygen in the bottle before the test is complete. The main focus
of wastewater treatment plants is to reduce the BOD in the effluent discharged to the
environment. Chemical oxygen demand (COD) does not differentiate between biologically
available and inert organic matter and it is a measure of the total quantity of oxygen required
to oxidize all organic material into carbon dioxide and water. COD values are always greater
than BOD values, but COD measurements can be made in a few hours while BOD
measurements take five days. If effluent with high BOD levels is discharged into a stream or
river, it will accelerate bacterial growth in the river and consume the oxygen levels in the river
(Ramesh et al., 2007).
Nutrients: Nutrients such as phosphorous and nitrogen are essential for the growth of algae
and other plants. Aquatic life is dependent upon these photo-synthesizers, which usually occur
in low levels in surface water. Excessive concentrations of nutrients, however, can over
stimulate aquatic plant and algae growth. According to Mary (2005), in untreated wastewater,
nitrogen exists in the forms of ammonia, nitrite, nitrate and organic nitrogen. Urea, protein
and amino acids are the major forms of organic nitrogen along with the discharge of these
nitrogen compounds in to the receiving environment would lead to several environmental and
health risks. Nitrogen compounds, therefore, need to be removed from the wastewater. For the
removal of nitrogen, biological nitrogen removal system is superior over other systems with
three successive processes: ammonification, nitrification and denitrification (Mary, 2005).
Phosphorus occurs naturally in low concentrations and is essential for all forms of life. It
comes from processes such as weathering of rocks and the decomposition of organic matter.
Phosphorus indicates nutrient status, organic enrichment and the consequent health of the
environment. Increased levels may result from erosion, discharge of sewage or detergents,
urban runoff and rural runoff containing fertilizers, animal and plant matter. According to
Mary (2005), when concentrations are too high, problems such as algal blooms, foul smelling,
excessive weed growth and the loss of species diversity can occur.

7
2.2. Environmental Impact of Wastewater
In pursuit of a better life, industrialization is growing day by day leaving behind the pollutants
in the environment. According to Kumar (2000), environmental pollution is an inevitable
consequence of economic development and people’s desire to improve their quality of life.
Industries contribute to the pollution of the environment, especially in the absence of
regulations that force manufacturers to reduce their hazardous impact. Moreover, accelerated
water quality change due to industrial pollution is one of the major environmental concerns
throughout the world. Industrial effluents and domestic sewage contribute large quantities of
nutrients and toxic substances that have a number of adverse effects on the water bodies and
the biota that is the animal and plant life of a particular region or habitat. Similarly, industrial
and chemical pollution constitute the third major problem after land degradation and urban
sanitation which are first and second, respectively, in Ethiopia and it is now the great
environmental concerns in the country (Zinabu and Zerihun, 2002).
The effects of industrial activities on the environment in the country are becoming evident
through the pollution of water bodies and human habitat in major cities, rivers and lakes
(Dierig, 1999; Zinabu and Zerihun, 2002). According to Shu et al. (2005), an estimated 90%
of wastewater in developing countries is still discharged directly into rivers and streams
without any waste treatment or after retention period of sometime in stabilization ponds.
Likewise, in Ethiopia, the domestic and industrial effluents have no effluent treatment plants.
Therefore, their wastewaters are directly discharged into the nearby rivers, lakes, and streams.
Most of these effluents have organic and inorganic chemicals, which are much higher than the
allowable limits and extremely harmful to aquatic flora and fauna and through food chains to
human beings.
2.3. Legislation for the Control of Discharge of Industrial Effluents in Ethiopia
According to the EEPA (2003) report, environmental pollution derived from domestic and
industrial activities is the main threat to the surface and groundwater qualities in Ethiopia. It is
reported that the majority of industries in the country discharge their wastewaters into nearby

8
water bodies and open land without any form of treatment. However, the survival of the
ecosystem depends on the ability to manage wastes in an environmentally sound manner. This
can only be achieved through establishment and enforcement of appropriate standards and
guidelines set to ensure that one does not destroy the environment. As suggested by GOE
(2002), this necessitates the formulation of regulations and standards for discharge limits of
the effluents before they are released into the environment.
Baseline information on the characteristics of the wastewater and the receiving environment
is, therefore, the means and the primary point for discharge standards. However, lack of
decisive technical information for various pollutants including priority pollutants renders
compliance and enforcement difficult at all levels. Moreover, the fate and the impact of these
pollutants in the receiving environment need to be determined for the definition of reliable
numerical criteria for safe limits. Ideally, standards are set based on country specific baseline
data and information, which are scanty in the present circumstances in Ethiopia (EEPA,
2003). Like any industry, textiles must adhere to several standards so that the environment
will be preserved. Therefore, environmental quality standards are set with a goal of
safeguarding public health and protecting the environment by indicating pollution limits.
Environmental standards and effluent regulations for industries need to cover all parameters
with adverse effects on the environment specifying numerical limits that are attainable by
available treatment technologies, and involve a compliance monitoring system that is practical
in technical and economical terms (UNEP, 1991). It may be easy to enact environmental
standards with sets of limitation protocols with all conceivable pollutants in Ethiopia at
present, but these rules and regulations will have no real value, at least in the short term,
unless they can be enforced. Therefore compromise is needed for what can be achievable with
resources and technologies available that call for a realistic and effective mechanism.
2.4. Phyto-remedial Technology
According to Mangkoedihardjo (2007), the term phyto-remedial technology describes the
application of science and engineering to examine environmental problems and provide

9
solutions involving plants. This term promotes a broader understanding of the importance of
plants and their beneficial role within both societal and natural systems. A central component
of phyto-technological concept is the use of plants as living technology that provides services
in solving environmental problems. The term phyto-remediation is used to describe the plants
processes in absorption, extraction, conversion and releasing of contaminants from one
medium to another. Phyto-remedial technology has been introduced and developed for the
treatment of urban runoff, domestic and industrial wastewater, and remediation of polluted
soil for the last three decades. Constructed wetlands and phyto-remediation are examples of
the most commonly applied technologies for removal of pollutants in water and soil. Phyto-
remedial technology is not only known as cost effective means for water quality improvement
and storm water control, but also provides aesthetics and wild life habitat (USEPA, 1993).
2.4.1. Mechanisms of phyto-remedial technology
In phyto-remedial technology, the plants act as solar powered pump and treat systems as they
take up water soluble contaminants through their roots, and transport them through various
plant tissues, where they can be metabolized or volatilized (Doty et al., 2007). They have
identified various tolerant plants which are able to significantly reduce organic and inorganic
pollutants in the wastewater and in the polluted soils and surface water.
According to Doty et al. (2007), there are several mechanisms of water and soil environment
improvement using phyto-remedial technology:
Phyto-stabilization: A mechanism which is used more to providing vegetation cover for
heavily contaminated soils, thus preventing wind and water erosion. Plants suitable for phyto-
stabilization develop an extensive root system, provide soil cover, possess tolerance to
contaminants, and ideally immobilize the contaminants in the root system.
Phyto-extraction: A mechanism, where pollutant tolerant plants concentrate and accumulate
soil or water contaminants in their tissues. At the end of the growth period, the contaminant
enriched plants are generally harvested and dumped; or dried and incinerated. Heat from the
incineration is used for energy generation.

10
Phyto-volatilisation: A mechanism, where plants transport soluble pollutants to the above
ground tissues and volatilize it to the atmosphere.
Phyto-degradation: A mechanism where plants, associated with aquatic or soil micro-
organisms, biodegrade organic pollutants.
2.4.2. Advantages and disadvantages of phyto-remedial technology
Phyto-remedial technology is an accepted method for water and soil sanitation and
conservation (Kramer, 2005) for its various advantages, such as:
It is an environmental friendly technology. The lower air, odour, and dust emissions and
other wastes makes phyto-technology a safe treatment.
It is a potential for resource recovery from harvested plants for the generation of energy,
essential oils extraction and fiber for handcrafts.
It is a cost effective technology. As a solar-driven system, phyto-technology takes
advantage of natural processes, and thus lowers labor, equipment, and operational
expenses
It controls runoff and soil erosion.
It can be used in conjunction with other remediation methods and may be more beneficial
than a stand-alone technology.
Based on Doty et al. (2007), however, there are several limitations of this technology, which
includes:
It requires a relatively large area.
The plants require maintenance, such as cutting and harvesting.
The remediation is based on contaminant contact with plant roots and the pollutant clean-
up occurs in the roots zone.

11
It needs a lengthy time for pollutant removal, and the time for plant growth can slow down
the process.
The technology is affected by phyto-toxicity. The plants have particular tolerance levels to
the contaminants.
When land is available, application of phyto-remedial technology is also considered to be
appropriate for treating small scale pollutant sources. For example, domestic wastewater,
where sewage treatment facility does not exist, can be treated using phyto-technology. This
technology is also appropriate for treating industrial wastewater, which contains
biodegradable organics, such as slaughter house, seafood, and sugar manufacturing industries
(Sohsalam and Sirianuntapiboon, 2008). Many phyto-technologies apply fundamental
information gained from agriculture, forestry, and horticulture to environmental problems.
Therefore, the best starting place for someone relatively new or unfamiliar with the phyto-
remedial technology is a simple review of the plant species which have high uptake of both
organic and inorganic pollutants, grow well in polluted water and be easily controlled in
quantitatively propagated dispersion.
2.5. The Vetiver Grass
Few existing plants have the unique attributes of multiple uses, environmental friendly,
effective and simple to use as vetiver grass. Few existing plants that have been known and
used quitely over centuries, have suddenly been promoted and widely used worldwide in the
last 20 years as has vetiver grass. And fewer plants still have been idealized as miracle grass,
wonder grass with capacity to create a living wall, a living filter strip and “live nail”
reinforcement. The vetiver system depends on the use of a very unique tropical plant which
can be grown over a very wide range of climatic and soil conditions, and if planted correctly
can be used virtually anywhere under tropical, semi-tropical, and mediterranean climates. It
has characteristics that in totality are unique to a single species. When vetiver grass is grown
in the form of a narrow self-sustaining hedgerow it exhibits special characteristics that are
essential to many of the different applications that comprise the vetiver system. The south

12
India peninsula is considered as vetiver centre of origin from where it is said to have spread
over the world (Lavania, 2000).
According to Tesfu and Tesfaye (2008), Mr. Fernie, a British agronomist and Mesfin Amha
had traveled to Yamungi, Tanzania in 1971 from Jimma Agricultural Research Centre and on
the way back they brought with them vetiver grass to Jimma Research Station, Ethiopia for
the 1st time. Shortly after introduction of vetiver grass to Jimma Research Station, an
observation trial was conducted and samples were sent to Tropical Institute, England for oil
content analysis.
In 1984/85, vetiver grass was distributed for the first time out of the research station to the
nearby coffee state farms and to Menschen für Menschen (MfM) (German based NGO) with
the intention of utilizing as mulch and as soil and water conservation practices. The first
nursery was established in the early 90's by MfM in southwestern part of Ethiopia. In
subsequent years, vetiver grass was introduced to more areas like different woredas of
Illubabor, Debrezeit, and Holleta Research Centre mainly for erosion control. In 1992, vetiver
grass was distributed throughout the country including Wolayta and Tigray (Tesfu and
Tesfaye, 2008).
Vetiver grass (Vetiveria zizanioides (L.) Nash) recently reclassified as (Chrysopogon
zizanioides (L.) Roberty) is a perennial grass belongs to the gramineae family and was first
used for soil and water conservation purposes. Due to its unique morphological and
physiological characteristics, and tolerance to high levels of heavy metal, nutrients and
adverse climatic and edaphic conditions, vetiver has also been successfully used in the field of
environmental protection. It is excellent for the removal of heavy metals from contaminated
soil (Roongtanakiat and Chairoj, 2001) and rehabilitating landfills (Roongtanakiat et al.,
2003). Even though it is not an aquatic plant, vetiver can be established and survive under
hydroponic conditions. It can purify eutrophic water, garbage leachates and wastewater from
pig farms (Kong et al., 2003). Therefore, vetiver has high potential to be used for wastewater
treatment

13
2.6. Characteristics of Vetiver Grass Suitable for Wastewater Treatment
Vetiver has many special characteristics that lend support for its uses in solving the water
problem. According to Truong (2008), these can be classified into morphological and
physiological characteristics.
2.6.1. Morphological features
Based on Truong (2008), vetiver grass has the following morphological characteristics which
are suitable for wastewater treatment;
It has a massive, deep, fast-growing root system capable of reaching 3.6 m deep in 12
months in good soil.
Its deep roots ensure great tolerance to drought, allow excellent infiltration of soil
moisture, penetrate compacted soil layers (hard pans), thus enhancing deep drainage.
Most of the roots in vetiver’s massive root system are very fine, with average diameter
0.5-1.0 mm. This provides an enormous volume of rhizosphere for bacterial and fungal
growth and multiplication, which are required to absorb contaminants and to break down
processes, such as in nitrification.
Vetiver’s erect, stiff shoots can grow to three meters (nine feet). When planted close
together they form a living porous barrier that retards water flow and acts as an effective
bio-filter, trapping both fine and coarse sediment, and even rocks in runoff water.
2.6.2. Physiological features
According to Truong (2008), vetiver grass has the following physiological features
(attributes) which are suitable for the wastewater treatment;
Highly tolerant to soil high in acidity, alkalinity (pH 3.5-11.5), salinity (electrical
conductivity 17.5 mS/cm), sodicity (exchange sodium percentage 48%) and magnesium

14
Highly tolerant to Al, Mn, and heavy metals such as As, Cd, Cr, Ni, Pb, Hg, Se and Zn in
the soil and water
Highly efficient in absorbing dissolved N and P in polluted water and soil (i.e. highly
tolerant to high levels of N and P nutrients in the soil and water).
Breaks down organic compounds associated with herbicides and pesticides (i.e. highly
tolerant to herbicides and pesticides).
Regenerates rapidly following drought, frost, fire, saline and other adverse conditions,
once those adverse conditions are mitigated.
It is both a xerophyte (drought tolerant due to its deep and extensive root system) and a
hydrophyte (wetland plant due to its well developed sclerenchyma (air cell) network).
Vetiver thrives under hydroponic conditions.
High water use rate under wetland conditions or high water supply, vetiver can use more
water than other common wetland plants such as Typha latifolias (approximately 7.5
times more), Phragmites australis and Schoenoplectus validus.
Data on growth and nitrogen content of mature plants indicate that the deep and extensive
root system of vetiver could reduce or eliminate deep nitrate leaching of groundwater.
2.7. Purification of Contaminated Water
Vetiver system prevents and treats contaminated water through eliminating or reducing the
volume of contaminated water and improving the quality of contaminated water. Vetiver has
been experimentally also shown to be able to absorb elements and nutrients from wastewater,
polluted water, or eutrophicated water (Truong and Hart, 2001).
2.7.1. Purification of wastewater
Wastewater is one that contains the liquid-borne waste products (organics, solids, and
nutrients) of domestic, agricultural, and industrial or manufacturing activities. With the

15
potential of removing very high quantities of N and P with very rapid growth, vetiver planting
can be used both to reduce the volume and to remove nutrients in effluent from sewage
(Smeal et al., 2003). In Australia, five rows of vetiver were subsurface irrigated with effluent
discharge from a septic tank. After five months, total N levels in the seepage collected after
two rows were reduced by 83% and after five rows by 99%. Similarly, total P levels were
reduced by 82% and 85%, respectively (Truong and Hart, 2001).
One trial was set up to determine the treatment time required to retain wastewater in the
vetiver field to reduce nitrate and phosphate concentrations in wastewater to acceptable levels.
Vetiver was grown in the field with 5% slope and inter row spacing was 1 cm, and intra row
spacing was 15 cm. This trial was established on an area of about eight hundred square meters
and with no replication. Treatments started when plants were 7 months old. Water samples
were taken for analysis at 24 hour interval for 3 days. The analysis of water samples showed
that total N content in wastewater was reduced from 4.79 mg/l to 0.57 mg/l and 0.44 mg/l
(equivalent to 88% and 91% of N reduction) after 48 and 72 hours of treatment, respectively.
The total P was reduced from 0.72 mg/l to 0.14 mg/l and 0.13 mg/l after 48 and 72 hours of
treatment (equivalent to 80% and 82% of P reduction). The amount of total N and P removed
in 48 and 72 hour treatments were not significantly different, suggesting that waste water
should be kept in vetiver field for 2 days before discharged into the nearby environment.
Similarly COD was reduced by 27% and BOD5 by 33% after 2 days (Luu et al., 2006).
China is the largest pig raising country in the world (Liao, 2000). In early 1996, China had
450 million pigs, accounting for 57.4% of the total in the world. In recent years pig raising is
changed from small farms to large scale concentrated production. In 1998 Guangdong
Province had more than 1600 pig farms with more than 130 farms producing over 10000
commercial pigs each year. Therefore the disposal of highly polluted wastewater was a major
problem. These large piggeries produced 100 to 150 ton of wastewater each day, which
included pig manure collected from slotted floor, containing high nutrient loads. According to
Liao (2000), vetiver grass was the most efficient means of reducing both the volume and the
high nutrient load from the piggery effluent and results shown that the reduction of COD,

16
BOD5, ammonia and total P from the piggery effluent were 64%, 68%, 20% and 18%,
respectively, after 4 days treatment.
2.7.2. Purification of polluted water
Polluted water is water contaminated with harmful substances resulting from agricultural and
industrial processes. Such substances include (i) heavy metals, e.g. Pb, Hg, Cu, Cd, Cr, As,
(ii) pesticide residues, e.g. insecticides, fungicides, herbicides, (iii) other harmful compounds.
Upon entering into water body, elevated concentrations of these toxic substances pose a
significant risk to human and animal health. Experiments conducted in Thailand on polluted
water indicated that vetiver had the ability to uptake heavy metals and accumulated in the
shoots and roots (Sripen et al., 1996). They found that vetiver can absorb substantial
quantities of Pb, Hg, Cd in polluted water. Vetiver can tolerate very high level of arsenic in
the water, but most of the As absorbed remained in the roots (90-95%). Such an approach is
used in Australia to rehabilitate gold mine tailings, which are very high in As and stock can
safely graze it.
Liao et al. (2003) reported that in China, nutrients and heavy metals from pig farms are key
sources of water pollution. Wastewater from pig farms contains very high levels of N and P
and also Cu and Zn, which are added to feed as growth promoters. Results show that vetiver
has a very strong purifying action. Its ratio of uptake and purification of Cu and Zn is >90%;
As and N>75%; Pb is between 30-71% and P is between 15-58%. Vetiver’s ability to purify
heavy metals and N and P from pig farms is ranked as: Zn>Cu>As>N>Pb>Hg>P.
2.7.3. Purification of eutrophicated water
Eutrophicated water is one which is rich in mineral and organic nutrients that promote a
proliferation of aquatic plants, especially blue green algae consuming nearly all the oxygen
that results in the degradation of water function and the deterioration of water quality due to
increasing population and industrial and agricultural production. As soluble N and particularly
P are usually considered to be key elements responsible for water eutrophication which

17
normally leads to blue green algal growth in rivers and lakes, the removal of these elements
by vetiver is a most cost effective and environmental friendly method of controlling algal
growth (Truong, 2003). Zheng et al. (1997) had been done in China on purification of
eutrophic water with vetiver system, which can be used to remove high soluble N and P
concentrations in eutrophicated river water; it was found that vetiver can reduce soluble N up
to 99% after three weeks and 74% of soluble P after five weeks. They were of the opinion that
the vetiver system has the potential of removing up to 102 tons of N and 54 tons of P/yr/ha.
2.8. Hydroponic Technique
Hydroponics is the production of plants in a soilless medium (nutrient liquid) whereby all of
the nutrients supplied to the crop are dissolved in water. Liquid hydroponic systems employ
the nutrient film technique, floating rafts, and noncirculating water culture. Using a floating
platform, vetiver can be grown hydroponically in the water with its root immersed in water.
Hydroponic system can be used to remove contaminants from leachates or effluents, which
are collected into the container. The advantages of this system using platform method in the
container is that it will provide greater assurance that underlying soil and groundwater are
being protected, provides the opportunity to more reliably quantify vetiver treatment effects
because the effluent is fully controlled and measurable, and soil properties cannot be
confounding variables (Truong and Baker, 1998). Its end-product has provided high nutrient
material for animal feed, mulch for gardens, leaves and stalks for room cooling, handicrafts,
roof thatching, extracting volatile oils for making perfume and aromatic ingredients in soaps,
raw material for making pulp, paper, ropes, mats, hats, baskets, manure for organic farming
and organic source for composting just to name a few (Smeal et al., 2003).
To determine the efficiency of vetiver grass in improving the quality of domestic effluent, a
hydroponic trial was conducted using a mixture of black water (from toilet septic tank) and
grey waters (from kitchen and bathroom) (Truong and Hart, 2001). Results showed that total
N level was reduced by 94% (from 100 mg/l to 6 mg/l), total P by 90% (from 10 mg/l to 1
mg/l), EC by 50% (from 928 µS/cm to 468 µS/cm), pH value between 7.28 to 5.98 and
dissolved oxygen 700% (from 1 mg/l to 8 mg/l) after four day hydroponic treatment. These

18
results reconfirmed earlier findings by Zheng et al. (1997) who showed that vetiver could
remove most soluble N and P in effluent over a very short period of time and thus eliminating
blue green algae in the polluted water.
A series of trials had been conducted in Australia to evaluate the efficiency of hydroponic
vetiver in treating effluent after it has been primary treated in septic tanks. Results indicate
that under a hydroponic flow through system, the best method is for effluent to flow at 20
l/min through vetiver roots; one square meter of long rooted hydroponic vetiver can treat 30 g
of N and 3.575 g of P in eight days. Nutrient reduction was from 52.00 to 6.50 mg/l for total
N (equivalent to 87.5% reduction) and 21.80 to 19.30 mg/l for total P (equivalent to 11.47%
reduction), DO range was from 0.56 to 3.66 mg/l, pH varies from 7.12 to 6.40, EC reduction
was from 677 to 410 µS/cm (equivalent to 39.44% reduction) after fourteen day hydroponic
treatment, this level is much higher than those from other crop and pasture plants such as:
rhodes grass, kikuyu grass, green panic, forage sorghum, rye grass and eucalyptus trees. The
trial was conducted from August to September 2002, when it was late winter to early spring,
and water temperatures were greater than 37ºC (Hart et al., 2003).
Experiments were carried out in Thailand under well ventilated temporary greenhouse to
examine the efficiencies of Vetiveria zizanioides (L.) Nash cultivated with hydroponic
technique to treat domestic wastewater. Results showed that BOD5 value was reduced by
92.17% (from 90.12 mg/l to 7.06 mg/l), total nitrogen (TN) by 63.85% (from 52.81 mg/l to
19.09 mg/l), total phosphorous (TP) by 36.34% (from 6.66 mg/l to 4.24 mg/l) using seven day
hydraulic retention time (the wastewater holding time in the container after which the
wastewater should supplement or replace to the container) after eight week hydroponic
treatment (Boonsong and Chansiri, 2008).

19
3. MATERIALS AND METHODS
3.1. Experimental Location
The field experimental set-up on the hydroponic vetiver treatment of wastewater was situated
at the Haramaya University from August 2009 to February 2010. The University is located at
a distance of 500 km East of Addis Ababa. It is found 20 km and 40 km from the nearby
towns of Harar and Dire Dawa, respectively, at 42º02'24" East longitude and 9
º25'06" North
latitude geographical location with an altitude of 2024 m above sea level.
3.2. Planting Materials and Experimental Set-Up
The one year old, thirty-three clumps on average eighty tiller per clump, bare-rooted vetiver
grass was uplifted and transported (Fig. 1) from Yerer nursery site, Babile, to Haramaya
University (HU) main campus for multiplication purpose. The thirty-three clumps were
divided carefully, to avoid damage, into four tillers by hand. The shoots and roots were
trimmed to remain 20 and 10 cm long, respectively, for bare-rooted multiplication in HU
experimental site. The prepared tillers were gathered together (Fig. 2a) and the roots were
dipped in slurry to initiate fast development of roots before planting in the field for one week
(Fig. 2b).
After layout of the experimental site, the planting plot was prepared and ploughed with
tractor. Thereafter, the four tillers per place was placed at an interval of 40 cm between the
plant and 70 cm between rows when the ground was moist and then moist soil was pressed
firmly around each plant after planting manually in August 2009 (Fig. 3). After the grass was
fully grown in the experimental site with 7% slope, which was approximately three months
old, the shoots were trimmed 30 cm from the ground to accelerate shooting and forming new
thicker clumps. This trial was established on an area of about one hundred eighty square
meters. The application of hydroponic vetiver treatment of wastewater started after vetiver
was five months old.

20
Figure 1. Bare-rooted vetiver uplifted and transported from Yerer nursery site, Babile to HU
(a) Tiller preparation and collection (b) Roots dipped in slurry
Figure 2. Tiller preparation and collection along with roots dipped in slurry
Figure 3. Manual bare-rooted vetiver grass planting in HU experimental site
The five months old, three clumps of vetiver roughly the same size (on average sixty tillers
per clump); bare-rooted propagation vetiver grass was uplifted from HU experimental site for
hydroponic vetiver treatment of domestic wastewater application (Fig. 4). The three clumps
were separated carefully into four tillers and the roots were cleaned carefully to remove any
adhering soil (Appendix Fig. 1). Fresh, one hundred eighty (180) liters of domestic

21
wastewater was collected in six hundred forty (640) liter container for three days of sixty (60)
liters in each day from HU inlet point of oxidation pond (Fig. 5a). The composed wastewater
was reassigned to thirty liters white plastic containers with a dimension of 433222 cm
(height lengthwidth) (Fig. 6). The plastic containers of thirty liters which were set up
simultaneously with planted vetiver hydroponically and no plant as a control, which replicated
three times in three containers (Fig. 5b).
Figure 4. Uplifting five months old vetiver for wastewater application in HU experimental site
(a) Wastewater collection
(a) Hydroponic experimental sets at the starting period in open space
Figure 5. The fresh wastewater collection and hydroponic experimental sets at the starting
period

22
Figure 6. Schematic sketch of floating platform
The floating platform with a dimension of 32226 cm (lengthwidth thickness) was
placed on water surface as the floating vetiver. In each floating platform, the twelve 2.26 cm
diameter holes with 10 x 10 cm intervals were made (Fig. 6). Each hole was covered with
sponge for holding vetiver (Fig. 5b). Similar sized vetiver plants were selected and then
trimmed to 20 cm for the shoots (stems and leaves) to produce more tiller and 12 cm for the
roots. Each vetiver was planted onto a hole in platform. Thus, approximately 10 cm of roots
were submerged under wastewater from January 01, 2010 to February 28, 2010. At the end of
two months experiment period the number of tillers, height of shoots and length of roots of
vetiver were recorded.
The experiment was carried out with 16 treatment combination, replicated three times
resulting in a total of 48 observations. Hence, Table 1 shows the treatment combinations.

23
Table 1.Treatment combination
HTT (week) Treatment system
Vetiver Control
1 V1 C1
2 V2 C2
3 V3 C3
4 V4 C4
5 V5 C5
6 V6 C6
7 V7 C7
8 V8 C8
Where HTT is hydroponic treatment time, V1, 2, 3, 4, 5, 6, 7 and 8 is vetiver treatment system
after 1, 2, 3, 4, 5, 6, 7 and 8 week HTT, C1, 2, 3, 4, 5, 6, 7 and 8 is control treatment system
after 1, 2, 3, 4, 5, 6, 7 and 8 week HTT.
3.3. Sample Collection for Water Quality Analysis
Sampling for wastewater quality analyses was collected before the experiment along with
weekly interval during the period of experiment and were analyzed for water temperature,
potential hydrogenation (pH), electrical conductivity (EC), dissolved oxygen (DO),
biochemical oxygen demand (BOD5), chemical oxygen demand (COD), total nitrogen (TN)
and total phosphorus (TP). Wastewater quality analyses were done in the field at the time of
sampling, in Physico-chemical Laboratory of Harar Brewery Share Company and HU Central
Laboratory.
Samples were collected in 500 ml polyethylene plastic bottles. Wastewater samples from each
six sampling containers were collected at weekly interval by direct immersion of 50 ml
pipette in wastewater sample containers handled by hand thereby avoiding any root
disturbance during its growth. Prior to sampling, the 500 ml polyethylene bottles were cleaned
by incubating them with concentrated nitric acid solution for 48 hours in a hot water bath and

24
then washed and rinsed with distilled water to avoid any contamination. They were
thoroughly rinsed with the wastewater from the sampling sites before sampling. Bottles were
preserved using icebox and some of the samples were preserved in the HU Central Laboratory
under 4ºC until analysis.
Total of 54 composite wastewater samples were collected throughout the study period. Out of
the 54 samples, six samples were collected before the experiment (application of vetiver on
wastewater treatment) directly from inlet point (at which the wastewater enters to the
oxidation pond) and outlet point (at which the wastewater discharges to the open land) of
University oxidation pond. However, the remaining 48 samples were collected at weakly
interval during the experiment for the period of eight weeks from each sampling containers.
Thereafter, the samples were analyzed for different parameters (Table 2).
Table 2. Selected parameters and methods of physico-chemical analysis
S. No. Parameters Analysis method Remarks
1 Temperature (°C) Direct measurement Thermometer
2 pH (units) Direct measurement pH Meter
3 Electrical conductivity
(µS/cm) at 20 °C
Direct measurement EC Meter
4 Dissolved oxygen (mg/l) Direct measurement DO meter
5 Biochemical oxygen
demand (BOD5) (mg/l)
Manometric/respirometric Using WTW MARK 6
OxiTop®
6 Chemical oxygen
demand (COD) (mg/l)
Colorimetric (closed reflux) Using WTW C2/25
COD1500 photometer
7 Total nitrogen (mg/l) Kjeldhal Using 0.02N H2SO4
titration
8 Total phosphorus (mg/l) Colorimetric Using SP75UV/VIS
spectrophotometer
The water quality analyses were conducted according to the standard methods appropriate for
turbid samples (AOAC, 1995).
The temperature of wastewater was measured using a hand-held thermometer. pH, EC and
DO were directly measured in the field. A portable pH meter (Model ELE 3071), calibrated

25
with buffer standards of pH 4, 7 and 10, was used to determine pH. EC meter (Model HI 9635
HANNA), calibrated by using 0.01 N KCl, was used to analyze EC. DO meter (Model HI
9143 HANNA), calibrated automatically, was used to determine DO.
Organic matter analyses, analysis for biochemical oxygen demand (BOD5) and chemical
oxygen demand (COD), were carried out at Physico-chemical Laboratory of Harar Brewery
Share Company. This laboratory is used for much of the regulatory analyses required by the
Ethiopian Environmental Protection Authority, and thus maintains high test standard
protocols. The respirometric (manometric) method using unique and mercury-free instrument
known as OxiTop® (Model MARK-6 (6pcs), WTW order No. 209 013) according to WTW
instructions, was followed to determine BOD5. The COD was analyzed colorimetrically
through the closed reflux (closed reactor) method, with potassium dichromate in sulphuric
acid and silver sulphate as catalyst, by means of photometer (Model C2/C25 COD 1500,
WTW order No. 250 308) following the WTW instructions.
Analysis for total nitrogen (TN) and total phosphorus (TP) were carried out at Haramaya
University Central Laboratory. The TN was analyzed by Kjeldahl titration method in which
0.02 N of H2SO4 was used as a titer. The TP was analyzed by colorimeter method using a
spectrophotometer (Model SP75UV/VIS SANYO, U.K). The analysis was made in triplicate
for each parameter. Removal efficiencies of treatment system (vetiver and control) were
calculated based on the following formula (Boonsong and Chansiri, 2008).
% Removal Efficiency =
inf
inf
C
CC eff 100
Where Cinf is initial parameter concentration, Ceff is final parameter concentration.
3.4. Statistical Data Analysis and Interpretation
26
Statistical analysis was performed with the help of Microsoft Excel program and JMP™
version 8 (SAS Institute Inc., Cary, NC, USA) software. Descriptive data analyses were made
using Microsoft Excel program. Results obtained before experiment were compared with the
EEPA (2003) industrial (textile) discharge limit values.
The time series analysis for the data collected in equal time increment (7 days interval) with
different parameters regarding wastewater treatment during experiment (application of vetiver
for wastewater treatment) was analyzed statistically using one way ANOVA with help of
JMP™ version 8 (SAS Institute Inc., Cary, NC, USA) software to test the potential of vetiver
for domestic wastewater treatment during the study period.
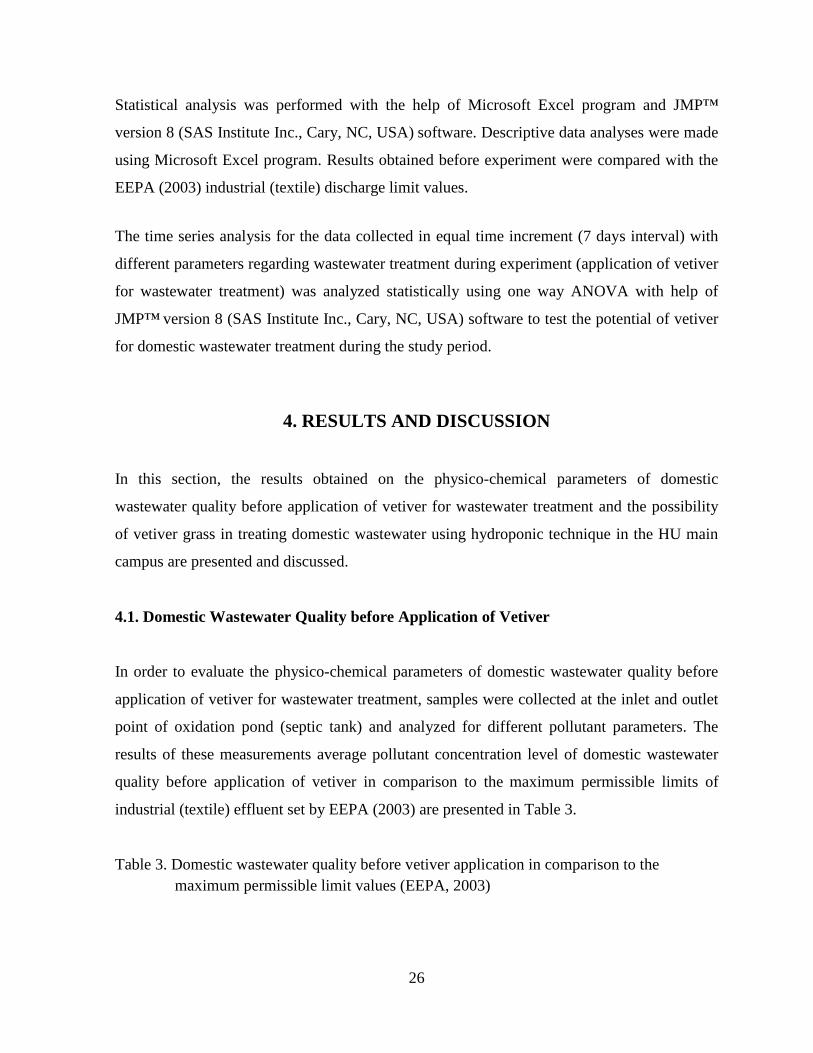
4. RESULTS AND DISCUSSION
In this section, the results obtained on the physico-chemical parameters of domestic
wastewater quality before application of vetiver for wastewater treatment and the possibility
of vetiver grass in treating domestic wastewater using hydroponic technique in the HU main
campus are presented and discussed.
4.1. Domestic Wastewater Quality before Application of Vetiver
In order to evaluate the physico-chemical parameters of domestic wastewater quality before
application of vetiver for wastewater treatment, samples were collected at the inlet and outlet
point of oxidation pond (septic tank) and analyzed for different pollutant parameters. The
results of these measurements average pollutant concentration level of domestic wastewater
quality before application of vetiver in comparison to the maximum permissible limits of
industrial (textile) effluent set by EEPA (2003) are presented in Table 3.
Table 3. Domestic wastewater quality before vetiver application in comparison to the
maximum permissible limit values (EEPA, 2003)

27
Wastewater quality parameters value***
Parameters Inlet Outlet Maximum permissible limit
Temperature ºC 20.69 1** 19.68 0.41** 40
pH units 7.57 0.31** 6.73 0.33** 6-9
EC µS/cm 3470 220 2496.67 235 1000(at 20 ºC)
DO mg/l 0.54 0.02 0.80 0.02 *
BOD5 mg/l 1026.70 41 980 20 50
COD mg/l 1285.20 51 1226.40 24 150
TN mg/l 154.56 1 120.96 3 40
TP mg/l 31.02 0.45 26.03 0.23 10
Note: *** Mean SD with 3 replications; inlet: samples collected at the entry point of oxidation pond; outlet:
samples collected at the point of discharging the wastewater into environment (open land); ** values within
maximum permissible limit; * value not indicated
As shown in Table 3, both inlet and outlet temperature values were within the maximum
permissible limit for effluent discharges into environment. The lowest value recorded may be
due to the shading effect of vegetations around the oxidation pond.
The pH values of HU wastewater vary from neutral to slightly alkaline before entering into
oxidation pond and neutral to slightly acidic at the point of discharging the wastewater into
environment (Table 3). However, the pH values of the domestic wastewater both at the point
of inlet and outlet were within the limits of EEPA (2003) industrial (textile) effluent
standards. Thus, the average pH value of HU wastewater meets the EEPA (2003) industrial
standard maximum discharging limit.
The result obtained for EC before application of the treatment was exceeded EEPA (2003)
maximum discharge limit by 247% at the inlet point and 150% at the outlet. The increase in
the electrical conductivity (i.e. 247-150%) may be due to high anthropogenic and other
activities in the University (toilet, detergents, restaurants, cattle wastes, etc.) and their
discharges to the oxidation pond.

28
The average concentration of dissolved oxygen (DO) before entering into oxidation pond and
at the outlet could not be compared with EEPA (2003) maximum permissible discharge limit
since DO value for textile wastewater was unavailable.
The average concentration levels of BOD5 and COD exceeded EEPA's (2003) maximum
discharge limit by 1953% for BOD5 and 757% for COD before entering into oxidation pond
and by 1860% for BOD5 and 718% for COD at the outlet (Table 3). The high BOD5 and COD
may be due high concentration of organic matter present in the wastewater released from
different units of the University into the oxidation pond. The high level of BOD5 indicates the
pollution strength of the wastewaters and low oxygen availability for living organisms in the
wastewater when utilizing the organic matter present in the wastewater. High COD level
implies the toxic condition and the presence of biologically resistant organic substances. The
COD-BOD ratio is an important indicator of the biodegradability of the pollutants in
wastewater. Accordingly, if the ratio is less than two (<2), the load is considered easily
biodegradable (Rehm et al., 1999). Therefore, in this experiment, since the ratio of COD-
BOD5 at the point of inlet (i.e. 1285/1026=1.25) is < 2, the pollutant load was easily
biodegradable.
The results also revealed that the total nitrogen and total phosphorus in the domestic
wastewater were above EEPA (2003) maximum discharge limit by 286% and 210%,
respectively, before entering into oxidation pond and by 202% and 160%, respectively, at the
outlet point.
The high concentration of TN indicates pollution of the environment (water body) that was
rapidly converted to ammonia and creates odor problem and toxic to aquatic life (EEPA,
2003). Therefore, in this experiment, the high concentration of TN may be due to the
discharge of animal and human wastes with decaying organic matter from different units of
the University. One of the reasons for the obnoxious odor felt nearby the oxidation pond is
perhaps due to the presence of ammonia in the wastewater released.

29
The sources of too much phosphorus, which produce bad odor and undesirable growth of
aquatic plants and algae in the wastewater include: detergents, human and animal wastes,
decomposing plants, runoff from fertilized lawns and cropland (Morrison et al., 2001).
Likewise, the sources of high TP levels in the HU wastewater could possibly be the result of
soaps being used in different units of the University such as washing places, restaurants,
showers and etc which drains into the oxidation pond.
In general, the results of these analyses indicate that high level of contamination of the
wastewater with both organic and inorganic pollutants. The concentration of BOD5, COD,
TN, TP and EC were found to be beyond the maximum level of their respective permissible
values set by EEPA (2003). Thus, this wastewater requires treatment before discharging into
the environment.
4.2. Effects of Vetiver on the Characteristics of Effluent
To evaluate the possibility of vetiver grass to treat domestic wastewater using hydroponic
technique, the samples were collected at weekly interval for eight weeks and examined for
different water quality parameters. The results of average pollutant concentration of the
domestic wastewater during the eight weeks experiment period are presented in Appendix
Table 2 and Figure 7-13. The experimental site received a total rainfall of 2.7 mm and 44.6
mm, with mean monthly maximum and minimum air temperatures of 23.21ºC and 3.71
ºC and
24.34ºC and 8.57
ºC during the experiment period of January and February 2010, respectively
(Appendix Table 1).
30
Figure 7. The average pH values of treatment system with treatment time
Figure 8. The average EC concentration of treatment system with treatment time
Figure 9. The average DO concentration of treatment system with treatment time

31

32
These results revealed that the time series of pH measurements throughout the experiment
period had the minimum value of 6.91±0.01 and a maximum value of 7.55±0.02. The pH
values of vetiver sets were slightly lower than the control set in all treatment time. This might
be due to higher organic decomposition rate and could be observed by the higher BOD5 and
COD removal rate resulting in CO2 and acid production which finally lowered the pH values
of the wastewater under vetiver sets.
The average EC value during 1st week of the treatment increased from 3470±220 µS/cm at the
commencement of experiment to 0.86%. This rise of EC value might be due to sampling
errors. However, it showed substantial reduction after the 2nd
week of the hydroponic
treatment. It was observed to decrease from 3470±220.68 µS/cm to 11.10% in two weeks,
12.68% in three weeks, 17.8% in four weeks, 32.95% in five weeks, 69.84% in six weeks,
71.76% in seven weeks and 72.14% in eight weeks hydroponic treatment, respectively
(Appendix Table 2 and Fig. 8). The EC values of vetiver sets were slightly lower than the
control sets in all hydroponic treatment except the first week. This explains the effect of
vetiver to reduce EC value of the wastewater.
As shown in Appendix Table 2 and Fig. 9 above, the time series measurements performed for
DO throughout the experiment period was considerably increased from 0.54±0.02 mg/l at the
beginning of experiment to 242.59% in one week, 261.11% in two weeks, 311.11% in three

33
weeks, 370.37% in four weeks, 566.67% in five weeks, 605.55% in six weeks, 1007.41% in
seven weeks and 1087.04% in eight weeks hydroponic treatment, respectively. This
increasing of DO might be due to the aeration by wind, algal photosynthesis and translocation
of oxygen through leaves and stems to roots. Throughout the study period, the wastewater DO
of experimental sets planted with vetiver were lower than the control set in all hydroponic
treatment time. This indicates that the main factor influenced the increasing of DO during the
study period was aeration by wind and algal photosynthesis resulting in higher DO in control
set which have no plant to inhibit wind and sunlight to penetrate to water column.
The concentrations of BOD5 (Appendix Table 2 and Fig. 10) were decreased from
1026.67±41 mg/l at the beginning of experiment to 7.79% in one week, 8.44% in two weeks,
12.99% in three weeks, 29.20% in four weeks, 51.95% in five weeks, 81.17% in six weeks,
87.01% in seven weeks and 92.21% in eight weeks hydroponic treatment, respectively. As
revealed in Appendix Table 2 and Fig. 11 above, the COD concentrations were also reduced
from 1285.2±51 mg/l at the establishment of experiment to 7.80% in one week, 8.43% in two
weeks, 12.96% in three weeks, 29.20% in four weeks, 51.89% in five weeks, 81.05% in six
weeks, 86.90% in seven weeks and 92.11% in eight weeks hydroponic treatment,
respectively. Moreover, during the entire time series analysis it could be depicted that the
concentration of BOD5 and COD of experimental sets planted with vetiver were lower than
the control set. This obviously indicates that the beneficial effect of vetiver in treating
domestic wastewater.
As observed in Appendix Table 2 and Fig. 12 above, the concentrations of TN were decreased
from 154.56±1 mg/l at the beginning of experiment to 12.00% in one week, 39.06% in two
weeks, 51.45% in three weeks, 64.36% in four weeks, 82.61% in five weeks, 89.46% in six
weeks, 91.00% in seven weeks and 91.17% in eight weeks hydroponic treatment,
respectively. The TP concentrations were also reduced from 31.02±0.45 mg/l at the
establishment of experiment to 1.75% in one week, 14.54% in two weeks, 50.98% in three
weeks, 62.56% in four weeks, 66.03% in five weeks, 74.47% in six weeks, 84.23% in seven
weeks and 86.73% in eight weeks hydroponic treatment, respectively (Appendix Table 2 and
Fig. 13).
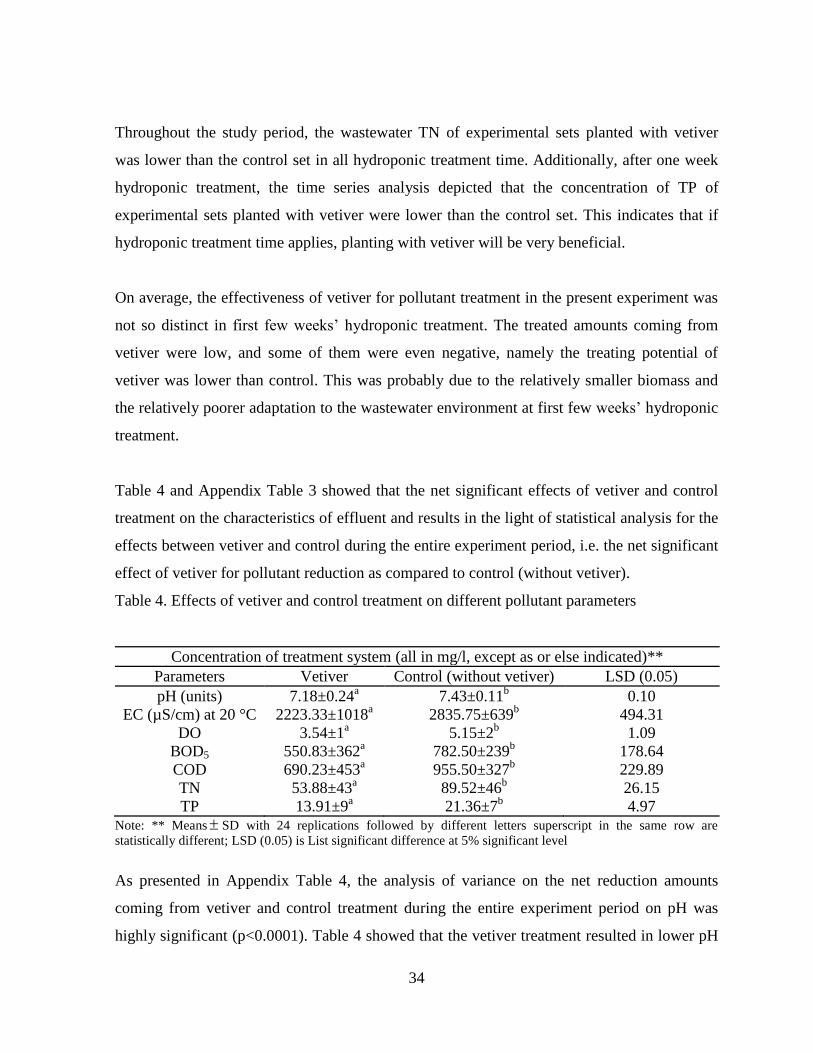
34
Throughout the study period, the wastewater TN of experimental sets planted with vetiver
was lower than the control set in all hydroponic treatment time. Additionally, after one week
hydroponic treatment, the time series analysis depicted that the concentration of TP of
experimental sets planted with vetiver were lower than the control set. This indicates that if
hydroponic treatment time applies, planting with vetiver will be very beneficial.
On average, the effectiveness of vetiver for pollutant treatment in the present experiment was
not so distinct in first few weeks’ hydroponic treatment. The treated amounts coming from
vetiver were low, and some of them were even negative, namely the treating potential of
vetiver was lower than control. This was probably due to the relatively smaller biomass and
the relatively poorer adaptation to the wastewater environment at first few weeks’ hydroponic
treatment.
Table 4 and Appendix Table 3 showed that the net significant effects of vetiver and control
treatment on the characteristics of effluent and results in the light of statistical analysis for the
effects between vetiver and control during the entire experiment period, i.e. the net significant
effect of vetiver for pollutant reduction as compared to control (without vetiver).
Table 4. Effects of vetiver and control treatment on different pollutant parameters
Concentration of treatment system (all in mg/l, except as or else indicated)**
Parameters Vetiver Control (without vetiver) LSD (0.05)
pH (units) 7.18±0.24a 7.43±0.11
b 0.10
EC (µS/cm) at 20 °C 2223.33±1018a 2835.75±639
b 494.31
DO 3.54±1a 5.15±2
b 1.09
BOD5 550.83±362a 782.50±239
b 178.64
COD 690.23±453a 955.50±327
b 229.89
TN 53.88±43a 89.52±46
b 26.15
TP 13.91±9a 21.36±7
b 4.97
Note: ** Means SD with 24 replications followed by different letters superscript in the same row are
statistically different; LSD (0.05) is List significant difference at 5% significant level
As presented in Appendix Table 4, the analysis of variance on the net reduction amounts
coming from vetiver and control treatment during the entire experiment period on pH was
highly significant (p<0.0001). Table 4 showed that the vetiver treatment resulted in lower pH

35
value (7.18) compared to that obtained under the control treatment (7.43). From this finding,
it is clearly evident that higher organic matter decomposition rate resulting in CO2 and acid
production which finally lowered the pH values of the wastewater under vetiver sets.
As depicted in Appendix Table 5, the analysis of variance also showed that the effect of
treatment on EC reduction was statistically significant (p=0.016). It is evident in Table 4
above that treating the wastewater with vetiver resulted in a statistically significant high
reduction in EC (2223.33 µS/cm) concentration than control (2835.75 µS/cm) treatment. This
shows the significant effect of vetiver grass for EC reduction from the domestic wastewater as
compared to control treatment.
The analysis of variance (Appendix Table 6) revealed that the effect of vetiver and control
treatment on DO increment was statistically different (p=0.005). As we can see in Table 4
above, the lower increasing of DO (3.54 mg/l) was observed in vetiver treatment as compared
to control (5.15 mg/l) treatment. From this finding, it is clearly seen that the increasing of DO
was due to the results of aeration by wind and algal photosynthesis rather than the
translocation of oxygen through vetiver leaves and stems to roots, resulting in higher DO in
control treatment.
The analysis of variance showed (Appendix Table 7) that the effect of vetiver and control
treatment on reduction of BOD5 concentration was statistically significant (p=0.012) over
control (without vetiver) treatment. As showed in Table 4 above, the effect of vetiver
treatment on the reduction in BOD5 concentration (550.83 mg/l) was statistically significant
variation over control (782.50 mg/l) treatment. As depicted in Appendix Table 8, the analysis
of variance also showed that the effect of vetiver and control treatment on COD reduction was
statistically significant (p=0.024). This can be revealed in Table 4 above that treating the
wastewater with vetiver resulted in a statistically significant high in COD concentration
(690.23 mg/l) reduction than control (955.50 mg/l) treatment. From this result, it is distinctly
clear that the effectiveness of wastewater treating potential of vetiver in terms of organic
matter removal (measured as BOD5 and COD) as compared to control (without vetiver)
treatment.

36
As shown in Appendix Table 9 and 10, the result of the analysis of variance revealed that the
effect of vetiver and control treatment on reduction of TN and TP influenced significantly at
(P=0.008) and (P=0.004), respectively. As explicated in Table 4 above, treating the
wastewater with vetiver resulted in significantly high in TN concentration (53.88 mg/l)
reduction than control (89.52 mg/l) treatment, and appreciably high in TP concentration
(13.91 mg/l) reduction after treating the wastewater with vetiver treatment than control (21.36
mg/l) treatment. From these results, it is clearly seen that the wastewater treating potential of
vetiver in terms of nutrient removal (measured as TN and TP) was appreciated as compared to
control treatment.
Therefore, it could be inferred that the net potential of vetiver on organic matter and nutrient
removal in the present experiment was significantly higher than the control treatment.
In this study, results obtained after eight weeks growing vetiver hydroponically in domestic
wastewater in terms of average concentrations and removal efficiencies are presented in Table
5 below.
Table 5. The average concentration and removal efficiency of vetiver after eight weeks
hydroponic treatment for selected parameters
Measurements made on concentration and removal efficiency of vetiver treatment system**
Parameters Initial concentration
(mg/l)
Final (after eight weeks)
concentration (mg/l)
LSD
(0.05)
CV
(%)
Efficiencies
(%)
EC (µS/cm)
at 20 °C
3470.00±220a 966.67±23
b 155.66 7.07 72.14
BOD5 1026.70±41a 80.00±20
b 74.04 5.90 92.21
COD 1285.20±51a 101.40±25
b 92.37 5.88 92.11
TN 154.56±1a 13.64±0.11
b 1.80 0.94 91.17
TP 31.02±0.45a 4.12±0.11
b 0.75 1.89 86.72
NoT 4 5±1 (new) * * *
HoVs (cm) 20 18±1 (new) * * *
LoVr (cm) 10 32.33±1 (new) * * *
Note: ** Means SD with 3 replications followed by different letters superscript in the same row are
statistically different (p<0.0001) (Appendix Table 11-15); LSD (0.05) is List significant difference at 5%
significant level; CV is coefficient of variation; NoT is number of tillers; HoVs is height of vetiver shoots; LoVr
is length of vetiver roots; * values not indicated

37
As shown in Table 5 above, the electrical conductivity (EC) concentration after eight weeks
hydroponic vetiver treatment was decreased from 3470.00±220 to 966.67±23 µS/cm. The
observed removal efficiency was 72.14%.
The EC result obtained does was higher than that reported by Truong and Hart (2001) who
had reported 50% reduction (from 928 µS/cm to 468 µS/cm) of EC after four days hydroponic
treatment from domestic wastewater in the field and Hart et al. (2003) who had reported
39.44% reduction (from 677 µS/cm to 410 µS/cm) of EC after fourteen days hydroponic
treatment from domestic wastewater with the water temperatures were greater than 37ºC.
Hence, the higher in the EC reduction in this study as compared with different literatures
might be due to variation in method of vetiver application (soil as a growing medium or
hydroponic with no supporting medium) for wastewater treatment used in their study might be
the main rationale. In addition, the variation of wastewater concentration (source of
wastewater), configuration of hydroponic vetiver set-up (container as growing medium or
lagoon), temperature, treatment time, quantity of vetiver applied and hydraulic retention time
(HRT) used in this study could be another factor.
The value of the provisional EC discharge limit of industrial (textile) effluent to environment
set by EEPA (2003) (Table 3) was 1000 µS/cm. It could be seen (Appendix Table 2) that the
satisfying EC value in the domestic wastewater quality was observed even after seven weeks
hydroponic treatment with an average value of 980.00±26 µS/cm.
The biochemical oxygen demand (BOD5) and chemical oxygen demand (COD) concentration
after eight weeks hydroponic vetiver treatment were decreased from 1026.70±41 to 80.00±20
mg/l and 1285.20±51 to 101.40±25 mg/l, respectively (Table 5). The observed removal
efficiencies were 92.21 and 92.11%, respectively.
The BOD5 removal efficiency obtained after eight weeks hydroponic treatment was almost
similar to Boonsong and Chansiri (2008) who had reported 92.17% removal (from 90.12 mg/l
to 7.06 mg/l) of BOD5 at a HRT of seven days after eight weeks hydroponic treatment from
domestic wastewater. On the other hand, the BOD5 and COD results obtained in the present

38
study was higher than the removal results presented by Liao (2000) who had reported 68%
BOD5 as well as 64% COD removal after four days treatment in the field from piggery
wastewater and Luu et al. (2006) who had reported 33% BOD5 with 27% COD removal after
two days discharging the wastewater in the vetiver field. The efficiency of organic matter
(measured as BOD5 or COD) removal depends on the strength of wastewater and the
treatment time (Ronnachai et al., 2007). Therefore, the pragmatic incongruity in the organic
matter removal efficiency with different literatures might be due to difference in
concentration of wastewater, treatment time and method of vetiver application (soil as a
growing medium or hydroponic with no supporting medium) used in their treatment systems.
The values of the provisional BOD5 and COD discharge limit of industrial (textile) effluent to
environment set by EEPA (2003) were 50 mg/l and 150 mg/l, respectively (Table 3). It could
be seen (Table 5) that disagreeable BOD5 value in the domestic wastewater quality was
observed after eight weeks hydroponic treatment with an average value of 80±20 mg/l.
However, the agreeable COD value was observed after eight weeks hydroponic treatment
with an average value of 101.40±25 mg/l.
As revealed in Table 5 above, the total nitrogen (TN) and total phosphorus (TP) concentration
after eight weeks hydroponic vetiver treatment were decreased from 154.56±1 to
13.64±0.11mg/l and 31.02±0.45 to 4.12±0.11 mg/l, respectively. The observed removal
efficiencies were 91.17 and 86.73%, respectively.
The reduction of nitrogen in the wastewater might have occurred due to the assimilation by
plants or the oxidation of ammonium into nitrite and nitrate by nitrifying bacteria (Metcalf
and Eddy, 2003). The optimum pH and temperature condition for nitrification process is in
the rage of 6.5 to 8.6 and 20 to 30 ºC respectively (Grunditz and Dalhammar, 2001). The pH
and the temperatures of the present study ranged between 6.91±0.01 to 7.55±0.02 pH units
and 18.07±0.64 to 20.60±0.30 ºC, respectively. Accordingly, these were almost in the normal
range mainly for pH units of nitrification processes.

39
The phosphorus in wastewater may be removed through sedimentation and burial, adsorption
and precipitation, absorption, and exchange process between soil and overlying water column
(Boonsong and Chansiri, 2008). The observed phosphorus removal might be due to
absorption by vetiver, sedimentation in the container and the ability of a particular group of
micro-organisms (Acinetobacter) to take up and store excessive amounts of phosphate. These
micro-organisms, collectively known as phosphate accumulating organisms (PAO), store the
phosphate internally as polyphosphate polymers (Dae et al., 2001). However, the hydroponic
technique (without soil) that was used in this experiment yielded unrivaled nitrogen and
phosphorus removal efficiencies compared to other studies used soil as growing medium.
Results obtained for TN and TP are vary with those reported earlier works. Truong and Hart
(2001) who had reported 99% removal of TN and 85% removal of TP after five months
discharging the domestic effluent from a septic tank into five row of vetiver field, and 94%
removal (from 100 mg/l to 6 mg/l) of TN with 90% removal (from 10 mg/l to 1 mg/l) of TP
after four days hydroponic treatment in the field. Luu et al. (2006) who had reported 88%
removal of TN and 80% removal of TP after two days discharging the wastewater in the
vetiver field. Liao (2000) who had reported 20% removal of ammonia nitrogen and 18%
removal of TP after four days discharging the piggery wastewater in the field. Hart et al.
(2003) who had reported 87.50% removal (from 52 mg/l to 6.5 mg/l) of TN and 11.47%
removal (from 21.80 mg/l to 19.30 mg/l) of TP after fourteen days hydroponic treatment from
domestic wastewater with the water temperatures were greater than 37ºC. Furthermore,
Boonsong and Chansiri (2008) reported 63.85% removal (from 52.81 mg/l to 19.09 mg/l) of
TN and 36.34% removal (from 6.66 mg/l to 4.24 mg/l) of TP at a HRT of seven days after
eight weeks hydroponic treatment from domestic wastewater in the green house.
Thus, the observed discrepancy in the TN and TP removal efficiencies with different
literatures might be due to variation in method of vetiver application (soil as a growing
medium and hydroponic with no supporting medium) for wastewater treatment used in their
study might be the main rationale. In addition, the variation of wastewater concentration or
source of wastewater, configuration of hydroponic vetiver set-up (in an open space and/or

40
green house), temperature, treatment time, quantity of vetiver applied and hydraulic retention
time (HRT) used in their study could be another factor.
The values of the provisional TN and TP discharge limit of industrial (textile) effluent to
environment set by EEPA (2003) were 40 mg/l and 10 mg/l, respectively (Table 3). It could
be seen (Appendix Table 2) that acceptable TN and TP values in the domestic wastewater
quality were observed even after five weeks hydroponic treatment with an average value of
26.88±0.56 mg/l for TN and after six weeks hydroponic treatment with an average value of
7.92±0.21 mg/l for TP.
As revealed in Table 5 and Appendix Figure 4, the average new number of tillers, height of
shoots and length of roots production after eight weeks growing vetiver hydroponically in
domestic wastewater were 5±1, 18±1 cm and 32.33±1 cm, respectively. As observed in this
table and figure, based on biomass development, vetiver could develop better root biomass
than shoot biomass this may be due to the more nutrients accumulation in roots system than
shoots system.
As can be seen, after eight weeks hydroponic vetiver treatment of domestic wastewater (Table
5), the contents of pollutants appreciably decreased, and almost all of them were below
maximum permissible discharge limit with the exception of BOD5 (EEPA, 2003). This
indicates that the treatment efficiency of vetiver was outstanding, from the lowest, 72.14% for
EC to the highest, 92.21% for BOD5. However, as compare to other studies which had soils as
media, vetiver showed a good potential to be used in situ to treat domestic wastewater.
5. SUMMARY, CONCLUSIONS AND RECOMMENDATIONS
5.1. Summary
In this study, an attempt was made to evaluate the physico-chemical parameters of domestic
wastewater quality before application of vetiver for wastewater treatment and the possibility

41
of vetiver grass in treating domestic wastewater using hydroponic technique in the HU main
campus.
The physico-chemical parameter results obtained before application of vetiver for wastewater
treatment were 19.68 0.41-20.69 1 ºC, 6.73 0.33-7.57 0.31 units, 2496.67 235-
3470 220 µS/cm, 0.54 0.02-0.80 0.02 mg/l, 980 20-1026.67 41 mg/l, 1226.40 24-
1285.20 51 mg/l, 120.96 3-154.56 1 mg/l and 26.03 0.23-31.02 0.45 mg/l,
respectively, for temperature, pH, EC, DO, BOD5, COD, TN and TP. These results showed
that except temperature and pH all parameters measured were above standard maximum
discharge permissible limit value set out by EEPA. The presence of above limit values of
nutrients (noticeably nitrogen and phosphorus) and organic matter (measured as a BOD5 and
COD) in wastewater discharging can be undesirable because they have ecological impact and
can affect public health. As result, biological wastewater treatment method known as phyto-
remediation of hydroponic vetiver treatment of domestic wastewater was carried out.
An experiment was conducted to assess the effect of vetiver grass growing under hydroponic
with no supporting medium to treat the domestic wastewater released to Haramaya University
farm, which had been primarily treated in septic tank. The field experiment was assigned in
plastic containers of thirty liters which were set-up simultaneously with planted vetiver
hydroponically and no plant as a control, which replicated three times in three containers.
Treatments started when vetiver was five months old. Water samples were taken for analysis
at weekly interval for eight weeks and examined for different water quality parameters during
the time of experiment.
Sample results of the analysis of variance after eight weeks of hydroponic vetiver treatment
showed that the overall concentration of BOD5, COD, TN, TP and EC were significantly
(p<0.0001) decreased from 1026.67±41 to 80.00±20 mg/l, from 1285.20±51 to 101.40±25
mg/l, from 154.56±1 to 13.64±0.11 mg/l, from 31.02±0.45 to 4.12±0.11 mg/l and from
3470.00±220 to 966.67±23 µS/cm, respectively. The removal efficiencies were observed to
be 92.21%, 92.11%, 91.17%, 86.72% and 72.14%, respectively, for BOD5, COD, TN, TP and
EC parameters. After eight weeks hydroponic vetiver treatment of domestic wastewater, the

42
contents of pollutants appreciably decreased, and almost all of them were below maximum
permissible discharge limit values with the exception of BOD5 (EEPA, 2003). This indicates
that the treatment efficiency of vetiver was outstanding, from the lowest, 72.14% for EC to
the highest, 92.21% for BOD5. However, as compare to other studies which had soils as
media, vetiver showed a good potential to be used in situ to treat domestic wastewater.
Generally the hydroponic technique with no supporting medium vetiver treatment of domestic
wastewater was exposed and found that the effect of vetiver treatment system was gradually
increased with treatment time. This was obviously associated with gradual growth and
development of vetiver resulting in a gradual increase of biomass, and also it gradually
adapted itself to the wastewater environment. It is positive, therefore, that the treatment
possibility of vetiver in domestic wastewater became stronger and stronger as vetiver grew.
5.2. Conclusions
Based on the results reported and discussed in the preceding section, the following
conclusions are drawn:
The status of the wastewater disposal at Haramaya University exceeds the allowable limit
set by EEPA (2003) with the exceptions of temperature and pH.
Vetiver grass, growing under hydroponic with no supporting medium, can effectively
remove organic matter and nutrient from domestic wastewater.
The potential of vetiver after eight weeks hydroponic treatment was found to be efficient
for the removal of chemical oxygen demand, total nitrogen, and total phosphorous and
electrical conductivity from domestic wastewater. However, it was not observed to be
efficient for the treatment of biochemical oxygen demand.
5.3. Recommendations

43
From the results obtained and the challenges faced during the experiment period, the
following recommendation and future research direction are forwarded:
The application of vetiver for wastewater treatment is enormous. This study however,
highlights one feature of hydroponic technique which emphasizes it’s potential to
domestic wastewater treatment. Its real potential is still not achieved. Thus, an intensive
research should go to its extraordinary application for wastewater treatment.
The hydroponic vetiver removal efficiency of wastewater is affected by concentration or
sources of wastewater, configuration of hydroponic vetiver set-up (in an open space
and/or green house), HRT, temperature, treatment time, etc. This study showed that the
removal efficiency of open space configuration hydroponic vetiver set-up to treat
domestic wastewater without changing or supplementing the wastewater throughout the
study period. Therefore, further study should be accomplished hydroponically to
investigate its potential for wastewater treatment at green house with different HRT and
evaluate its effectiveness in treating wastewater of different concentration just to name a
few.
In this study the concentration of biodegradable biochemical oxygen demand in the
treated wastewater is above the discharge limits set by Ethiopian Environmental Quality
Standard for textile effluent. Therefore, further studies should be conducted to investigate
how long it will take vetiver to hydroponically treat wastewater at least all pollutants are
in line with permissible limit values, and to note management issues that must be
addressed if hydroponic vetiver treatment wastewater is to be a viable alternative to
discharge the University farm with treated domestic wastewater in an environmental
friendly way.
Based on many studies reported, the nutrient accumulation in the vetiver biomass received
wastewater is different. So, additional research regarding degree of nutrient accumulation
in roots and shoots biomass of vetiver should be done.
The study was conducted within limited observation time of only two months. It may lack
comprehensiveness. Hence, further studies should be conducted in different seasons
considering other wastewater quality parameters including heavy metals.

44
In short, the preliminary results of this experiment showed that the University should retain
its wastewater at least for two months in the oxidation pond before discharging into the
nearby creek daily.
Even though the introduction of vetiver grass in Ethiopia is almost 39 years old, its
various applications including for natural disaster reduction (flood, landslide, road batter
failure, river bank etc.) and environmental protection (treatment of solid and liquid waste
and soil and water conservation etc.) purposes are poorly studied. This is mainly due to
lack of experts for proper technical application in vetiver technology promotion and lack
of proper networking as well as the flow of information among the users of the
technologies. Therefore, a great deal of research should be done in such diverse
environment.

45
6. REFERENCES
AOAC (Association of Official Analytical Chemists), 1995. Wastewater Analysis, 16th
edition, v.1, Washington, DC., pp 69-90.
AWWA (American Water Works Association), 2000. Introduction to Water Quality Analysis,
v.4, Colorado, USA. pp. 23-39, 81-104.
Beavers, P., 2002. On-Site Sewerage Facilities –Guidelines for the Use and Disposal of Grey
Water in Unsewerd Areas. Queensland Government, Department of Natural Resource and
Mines, Brisbane.
Boonsong, K. and M. Chansiri, 2008. Efficiency of vetiver grass (Vetiveria zizanioides (L.)
Nash) cultivated with floating platform technique in domestic wastewater treatment. AU. J. T.
12(2): 73-80.
Boshoff, G., J. Duncan and P. D. Rose, 2004. Tannery effluent as a carbon source for
biological sulphate reduction. Wat. Res., 38(11): 2651-2658.
Dae, S.L., J. Cheok and M.P. Jong, 2001. Biological nitrogen removal with enhanced
phosphate uptake in a sequencing batch reactor using single sludge system. Wat. Res., 35(16):
3968–3976.
Dierig, S., 1999. Urban Environmental Management in Addis Ababa: problems, perspectives,
and the role of NGOs. Original Paper.
Doty, L.S., C.A. James, A.L. More, A. Vajzovic, G.L. Singleton, C. Ma, Z. Khan, G. Xin,
J.W. Kang, J.Y. Park, R. Meilan, S.H. Strauss, J. Wilkerson, F. Farin and S.E. Strand, 2007.
Enhanced phyto-remediation of volatile environmental pollutants with transgenic trees. PNAS,
104(43): 16816-16821.
EEPA (Ethiopian Environmental Protection Authority), 2003. Provisional Standards for
Industrial Pollution Control in Ethiopia. Prepared under the ecologically sustainable industrial
development (ESID) project – US/ETH/99/068/Ethiopia, EPA/UNIDO, Addis Ababa.
GOE (Government of Ethiopia), 2002. Environmental Pollution Control Proclamation.
Nagarit Gazeta of the federal democratic republic of Ethiopia, Proclamation No. 300/2002,
Addis Ababa.
Grunditz, C. and G. Dalhammar, 2001. Development of nitrification inhibition assays using
pure cultures of Nitrosomonas and Nitrobacter. Wat. Res., 35: 433-440.

46
Hart, B., R. Cody and P.Truong, 2003. Efficiency of vetiver grass in the hydroponic treatment
of post septic tank effluent. Proceedings of the Third International Vetiver Conference,
Guangzhou, China. 6-9 October 2003.
JMP, 2005. JMP™ Time Series Analysis Version 8 (SAS Institute Inc., Cary, NC, USA).
Kong, X., L. Weiwen, W. Biqing and L. Fuhe, 2003. Study on vetiver’s purification from pig
farm, pp. 181-185. Proceedings of the Third International Conference on Vetiver and
Exhibition. China. 6-9 October 2003.
Kramer, U., 2005. Phyto-remediation: novel approaches to cleaning up polluted soils. Current
opinion in Biotechnology 16, 133-141.
Kumar, R., 2000. Application of Environmental Biotechnology in Wastewater Monitoring
and Treatment. Institute of Genomics and Integrative Biology .New Delhi.
Lavania, U.C., 2000. Primary and secondary centre of organ of vetiver and its dispersion. Pp.
224 – 427. In: Chomechalow, N. and N. Barang (eds,). Proceedings of the 2nd
International
Conference of vetiver: Vetiver and Environment Office of Royal Development Project Board,
Bangkok, Thailand.
Liao, X., 2000. Studies on Plant Ecology and System Mechanisms of Constructed Wetland for
pig farm in South China. PhD Thesis, South China Agricultural University, Guangzhou,
Guangdong, China.
Liao, X., L. Shiming, W. Yinbao and W. Zhisan, 2003. Studies on the abilities of Vetiveria
zizanioides and Cyperus alternifolius for pig farm wastewater treatment. Proc. Third
International Vetiver Conf. China, October 2003.
Luu, T.D., P. Le Van, D. Le Viet and P. Truong, 2006. Wastewater treatment at a seafood
processing factory in the Mekong Delta, Vietnam. Proceedings of the Fourth International
Vtiver Conference. Venezuela, October 2006.
Mary, S., 2005. Nitrogen Reducing Technologies for Onsite Wastewater Treatment Systems,
Report to the Puget Sound Action Team, Washington State Department of Health, Olympia,
WA.
Mangkoedihardjo, S., 2007. Phyto-technology integrity in environmental sanitation for
sustainable development. Journal of Applied Sciences Research 3(10), 1037-1044.
Metcalf, W. and P. Eddy, 2003. Wastewater Engineering: Treatment and Reuse. 4th
ed.
McGraw-Hill, New York.

47
Morrison, G., O.S. Fatoki, L. Persson and A. Ekberg, 2001. Assessment of the impact of point
source pollution from the Keiskammahoek sewage treatment plant on the Keiskamma River-
pH, EC, COD and Nutrients. Water SA., 27(4): 475-480.
Miller, G.T., 2001. Environmental Science: Working with the Earth. 8th
ed. Pacific Grove,
CA.
Ramesh, B., N.S Bhadrinarayana, S.B Meera and N Anantharaman, 2007. Treatment of
tannery wastewater by electro-coagulation. Chem. Techn. Metallurgy, 42(2): 201-206.
Rehm, H. J. and G. Reed, in Cooperation with A. Puhler and P. Stadler, 1999. Biotechnology:
Environmental Processes I Wastewater Treatment. 2nd
Completely Revised Edition,Vol-IIa,
Wiley- VCH Verlag Gmbh, D- 69469 Weinheim.
Ronnachai, C., B. Piyarat, , P. Poonsuk and C. Sumate, 2007. Effect of wastewater strength on
methane and volatile fatty acids productions from anaerobic treatment of palm oil mill
effluent in UASB and UFAF reactors. J. Sci. Technol. 2: 311-323.
Roongtanakiat, N. and P. Chairoj, 2001. Uptake potential of some heavy metals by vetiver
grass. Kasetsart J. (Nat. Sci.) 35: 46-50.
Roongtanakiat, N., T. Nirunrach, S. Chanyotha and D. Hengchavanich, 2003. Uptake of
heavy metals in landfill leachate by vetiver grass. Kasetsart J. (Nat.Sci.) 37:168-75.
Sohsalam, P. and S. Sirianuntapiboon, 2008. Feasibility of using constructed wetland
treatment for mollases wastewater treatment. Bioresource Technology 99: 5610-5616.
Shu, L., T.D. Wait, P.J. Bliss, A. Fane and V. Jegathessan, 2005. Nanofiltration for the
Possible Reuse of Water and Recovery of Sodium Chloride Salt from Textile Effluent,
Desalination, pp 235-243. (www.elsevier.com/locate/desal/last accessed 22 July, 2007).
Smeal, C., M. Hackett and P. Truong, 2003. Vetiver system for industrial wastewater
treatment in Queensland, Australia. Third International Conference on Vetiver, Guangzhou,
China.
Sripen, S., T. Komkris, S. Techapinyawat, S. Chantawat, S. Masuthon and M. Rungsuk, 1996.
Growth Potential of Vetiver Grass in Relation to Nutrients in Wastewater of Changwat
Phetchburi. Abstracts of Papers Presented At ICV-1, P. 44. ORDPB, Bangkok.
Tesfu Kebede and Tesfaye Yakob, 2008. Research and Development of Vetiver Grass
(Vetiver. Zizanioides, L. Nash) in Ethiopia. Jimma Research Centre, EIAR, Jimma, Ethiopia.
Truong, P. and D. Baker, 1998. Vetiver Grass System for Environmental Protection.
Technical Bulletin N0. 1998/1. Pacific Rim Vetiver Network. Office of the Royal
Development Projects Board, Bangkok, Thailand.

48
Truong, P. and B. Hart, 2001. Vetiver System for Wastewater Treatment. Technical Bulletin
No. 2001/21.Pacific Rim Vetiver Network. Office of the Royal Development Projects Board,
Bangkok, Thailand.
Truong, P., 2003. Clean water shortage, an imminent global crisis. How vetiver system can
reduce its impact. Third International Conference on Vetiver, Guangzhou, China.
Truong, P., 2008. Research and development of vetiver grass for treatment of polluted water
and contaminated land. Proceedings of the First Indian National Vetiver Workshop, Cochi,
Kerala, India, Feb 2008.
UNEP (United Nations Environmental Programme), 1991. Tanneries and the Environment. A
Technical Guide to Reducing the Environmental Impact of Tannery Operations, UNEP/IEO,
UN Publication Series III, Paris.
USEPA (United States Environmental Protection Agency), 1993. Constructed wetlands for
wastewater treatment and wildlife habitat: 17 Case studies, EPA 832-R-93-005.
Van Lier, J.B. and G. Lettinga, 1999. Appropriate technologies for effective management of
industrial and domestic wastewaters: the decentralized approach. Water Science and
Technology 40(7), 171-183.
Wiesmann, U., I.S. Choi and D. Evamaria, 2007. Fundamentals of Biological Wastewater
Treatment. WILEY-VCH Verlag GmbH & Co. KGaA, Weinheim, Romania.
Zheng, C., C. Tu and H. Chen, 1997. Preliminary study on purification of eutrophic water
with vetiver. Proc. International Vetiver Workshop, Fuzhou, China October 1997.
Zinabu Gebre-Mariam and Zerihun Desta, 2002. The chemical compostion of the effluent
from Awassa textile factory and its effects on aquatic biota. SINET:Ethiop.J. Sci. 25(2):263-
274.

49
7. APPENDICES
7.1. Appendix Tables
Appendix Table 1. Daily temperature and rainfall during the period of experiment
January February
Temperature (°C) Rain fall (mm) Temperature (°C) Rain fall (mm)
Date Max Min
Max Min
1 20.5 7.0 0.0 25.2 2.3 0.0
2 21.5 5.5 0.0 26.5 1.0 0.0
3 21.3 5.0 0.0 26.7 1.0 0.0
4 21.2 2.0 0.0 28.0 10.5 0.0
5 23.3 0.5 0.0 26.4 13.0 0.0
6 22.4 1.0 0.0 23.0 12.0 2.0
7 22.5 4.0 0.0 22.0 13.0 0.0
8 21.7 4.5 0.0 23.5 10.5 0.9
9 20.5 1.5 0.0 23.8 13.5 0.0
10 20.0 6.0 0.0 22.5 11.8 0.0
11 20.0 8.0 0.0 24.2 11.5 0.4
12 20.8 -2.0 0.0 25.5 8.5 9.7
13 22.6 -3.5 0.0 23.0 10.0 0.9
14 25.2 2.0 0.0 22.5 9.5 0.0
15 25.0 3.2 0.0 25.0 9.8 0.0
16 24.5 5.5 0.0 25.0 7.0 0.0
17 24.2 6.0 0.0 24.5 11.0 0.0
18 27.4 4.5 0.0 23.5 8.0 0.0
19 23.5 5.5 0.0 24.9 5.5 0.0
20 26.5 8.8 2.7 25.0 5.5 0.0
21 23.0 6.0 0.0 24.5 5.5 0.0
22 23.5 10.0 0.0 25.5 4.5 0.0

50
23 23.5 6.0 0.0 26.2 3.0 0.0
24 22.7 5.5 0.0 27.5 5.0 0.0
25 24.0 0.0 0.0 26.5 8.5 9.6
26 23.0 2.0 0.0 23.5 13.0 14.6
27 24.8 1.5 0.0 20.2 12.5 6.1
28 25.0 1.5 0.0 18.0 13.0 0.4
29 26.0 2.5 0.0
30 25.0 2.5 0.0
31 24.5 2.5 0.0
Average 23.21 3.71 0.09 24.38 8.57 1.59

51
Appendix Table 2. The average pollutant concentration quality of domestic wastewater after treatment during the experiment period
HTT
(week)
Treatment
system
Temperature
ºC
pH
units
EC
µS/cm
DO
mg/l
BOD5
mg/l
COD
mg/l
TN
mg/l
TP
mg/l
Vol.
l
0 20.69±1 7.57±0.31 3470±220 0.54±0.02 1026.67±41 1285.2±51 154.56±1 31.02±0.45 30
1 Vetiver
19.9±0.30
7.54±0.01
3500±55
(-0.86)
1.8±0.06
(-242.59)
946.67±30
(7.79)
1184.99±37
(7.80)
136±0.03
(12.00)
30.47±0.31
(1.75)
Control 19.90±0.02 7.55±0.02 3400±1(2.02) 2.36±0.02(-337.04) 1020±20(0.65) 1260±3(1.96) 151.4±0.4(2.04) 30.20±0.2(2.64)
2 Vetiver
18.07±0.64
7.48±0.02 3083.3±20
(11.1)
1.95±0.04
(-261.11)
940±34
(8.44)
1176.79±43
(8.43)
94.19±0.4
(39.06)
26.51±0.43
(14.54)
Control 18.40±0.40 7.53±0.02 3386±2(2.42) 2.67±0.03(-394.44) 1000±20(2.60) 1257±2(2.19) 142.5±0.5(7.80) 29.99±0.6(3.33)
3 Vetiver
19.6±0.26 7.38±0.02 3030±17.32
(12.68)
2.2±0.08
(-311.11)
893.33±11
(12.99)
1118.62±14
(12.96)
75.04±0.56
(51.45)
15.21±0.21
(50.98)
Control 19.40±0.40 7.51±0.02 3342±1(3.69) 3.66±0.03(-577.78) 980±20(4.55) 1227±3(4.53) 132.4±0.4(14.35) 26.70±0.7(13.92)
4 Vetiver 18.13±0.33
7.12±0.01
2853.3±65
(17.8)
2.54±0.14
(-370.37)
726.67±166
(29.2)
909.9±208
(29.20)
55.09±0.32
(64.36)
11.61±1
(62.56)
Control 18.30±0.20 7.48±0.02 3298±2(4.96) 4.55±0.02(-742.59) 960±40(6.49) 1219±2(5.14) 89.04±0.04(42.39) 24.14±0.5(22.18)
5 Vetiver 20.43±0.06
7.09±0.02
2326.67±41
(32.95)
3.6±0.03
(-566.67)
493.3±64
(51.95)
618.3±80
(51.89)
26.88±0.56
(82.61)
10.54±0.02
(66.03)
Control 20.60±0.30 7.45±0.02 3100±1(10.66) 6.12±0.12(-1033.33) 780±10(24.03) 972±2(24.36) 85.68±0.32(44.57) 20.60±0.6(33.59)
6 Vetiver 20.13±0.06
6.97±0.03
1046±40
(69.84)
3.81±0.16
(-605.55)
193.33±11
(81.17)
243.51±14
(81.05)
16.3±0.48
(89.46)
7.92±0.21
(74.47)
Control 20.10±0.20 7.33±0.02 2249±2(35.19) 6.64±0.02(-1129.63) 620±1(39.61) 740±2(42.41) 54±0.3(65.06) 17.20±0.20(44.55)
7 Vetiver
20.1±0.17
6.94±0.03
980±26.46
(71.76)
5.98±0.23
(-1007.41)
133.3±11
(87.01)
168.33±15
(86.9)
13.91±0.99
(91.00)
4.89±0.22
(84.23)
Control 19.80±0.20 7.30±0.02 2150±1(38.04) 7.23±0.23(-1238.89) 540±3(47.40) 536±3(58.29) 38.10±0.5(75.35) 15.30±0.3(50.67)
8 Vetiver
19.97±0.21
6.91±0.01
966.7±23
(72.14)
6.41±0.02
(-1087.04)
80±20
(92.21)
101.4±25
(92.11)
13.64±0.11)
(91.17
4.12±0.11
(86.73)
14
Control 19.70±0.20 7.28±0.02 1761±2(49.25) 7.98±0.05(-1377.78) 360±1(64.94) 433±2(66.30) 23.07±0.02(85.07) 6.77±0.02(78.18) 21
Note: HTT = Hydroponic treatment time; HTT week 0 = commencement of trial; Vol. = volume of samples; l= liter; Data values in parentheses are removal efficiencies (%) of
treatment system; Negative sign in parentheses indicates an increase of EC and DO after being “treated” by treatment system; entire data values are mean SD with 3 replications

52
Appendix Table 3. Wastewater quality data arranged for JMP™ analysis for control and
vetiver treatment during the entire experiment period
HTT
(week)
Treatment
system
pH
(values)
EC
(µS/cm)
DO
(mg/l)
BOD5
(mg/l)
COD
(mg/l)
TN
(mg/l)
TP
(mg/l)
1 control 7.55 3400 2.38 1000 1260.00 151.00 30.20
1 control 7.57 3399 2.34 1020 1257.00 151.40 30.00
1 control 7.53 3401 2.36 1040 1263.00 151.80 30.40
1 vetiver 7.54 3450 1.82 980 1226.40 136.02 30.71
1 vetiver 7.53 3490 1.91 920 1151.80 135.97 30.58
1 vetiver 7.55 3560 1.81 940 1176.76 136.02 30.12
2 control 7.53 3386 2.64 1000 1255.00 142.50 29.40
2 control 7.51 3388 2.67 980 1257.00 142.00 30.60
2 control 7.55 3384 2.70 1020 1259.00 143.00 29.96
2 vetiver 7.48 3100 1.98 960 1201.90 94.08 26.08
2 vetiver 7.49 3060 1.91 960 1202.00 93.86 26.94
2 vetiver 7.46 3090 1.97 900 1126.48 94.64 26.51
3 control 7.51 3341 3.66 960 1224.00 131.98 26.00
3 control 7.49 3342 3.63 1000 1230.00 132.78 26.70
3 control 7.53 3343 3.69 980 1227.00 132.38 27.40
3 vetiver 7.36 3040 2.30 900 1126.47 75.04 15.20
3 vetiver 7.39 3040 2.14 900 1127.10 75.60 15.00
3 vetiver 7.38 3010 2.22 880 1102.30 74.48 15.41
4 control 7.48 3296 4.53 920 1217.00 89.00 23.64
4 control 7.46 3300 4.57 960 1221.00 89.04 24.64
4 control 7.50 3298 4.55 1000 1219.00 89.08 24.14
4 vetiver 7.12 2790 2.68 780 976.32 54.99 11.61
4 vetiver 7.11 2850 2.54 540 676.29 55.44 10.56
4 vetiver 7.13 2920 2.40 860 1077.10 54.82 12.67
5 control 7.45 3100 6.00 780 970.00 85.36 20.60
5 control 7.43 3099 6.12 770 972.00 86.00 20.00
5 control 7.47 3101 6.24 790 974.00 85.68 21.20

53
Appendix Table 3. “Continued”
5 vetiver 7.11 2340 3.56 540 676.76 26.88 10.54
5 vetiver 7.09 2360 3.61 420 526.15 26.32 10.52
5 vetiver 7.07 2280 3.62 520 652.00 27.44 10.56
6 control 7.33 2247 6.64 619 740.00 54.00 17.00
6 control 7.31 2249 6.62 621 738.00 53.70 17.20
6 control 7.35 2251 6.66 620 742.00 54.30 17.40
6 vetiver 6.97 1040 3.92 180 226.80 16.24 7.92
6 vetiver 6.95 1010 3.87 200 252.01 16.80 7.71
6 vetiver 7.00 1090 3.63 200 251.71 15.85 8.13
7 control 7.30 2149 7.46 540 533.00 37.60 15.00
7 control 7.28 2151 7.00 537 536.00 38.10 15.60
7 control 7.32 2150 7.23 543 539.00 38.60 15.30
7 vetiver 6.94 950 5.98 120 151.00 12.77 4.96
7 vetiver 6.91 1000 6.21 140 176.90 14.50 4.64
7 vetiver 6.97 990 5.76 140 177.10 14.45 5.07
8 control 7.28 1759 7.93 359 433.00 23.05 6.77
8 control 7.26 1761 7.98 361 435.00 23.07 6.75
8 control 7.30 1763 8.03 360 431.00 23.09 6.79
8 vetiver 6.90 940 6.41 100 126.60 13.66 4.12
8 vetiver 6.90 980 6.39 60 76.40 13.61 4.22
8 vetiver 6.92 980 6.42 80 101.20 13.64 4.01
Note: HTT is hydroponic treatment time

54
Appendix Table 4. ANOVA for pH on the effects of vetiver and control treatment
Source Df SS MS F ratio P-value
SSTr 1 0.7550083 0.755008 21.8422* < 0.0001
SSEr 46 1.5900583 0.034566
SST 47 2.3450667 *Significant at 0.01 level of significant
Appendix Table 5. ANOVA for EC on the effects of vetiver and control treatment
Source Df SS MS F ratio P-value
SSTr 1 4500650 4500650 6.2303* 0.0162
SSEr 46 33229258 722375
SST 47 37729908 *Significant at 0.05 level of significant
Appendix Table 6. ANOVA for DO on the effects of vetiver and control treatment
Source Df SS MS F ratio P-value
SSTr 1 30.99260 30.9926 8.7165* 0.0050
SSEr 46 163.55845 3.5556
SST 47 194.55105 *Significant at 0.01 level of significant
Appendix Table 7. ANOVA for BOD5 on the effects of vetiver and control treatment
Source Df SS MS F ratio P-value
SSTr 1 644033.3 644033 6.8267* 0.0121
SSEr 46 4339655.3 94340
SST 47 4983688.7 *Significant at 0.05 level of significant
Appendix Table 8. ANOVA for COD on the effects of vetiver and control treatment
Source Df SS MS F ratio P-value
SSTr 1 844411.2 844411 5.4038* 0.0246
SSEr 46 7188097.1 156263
SST 47 8032508.3 *Significant at 0.05 level of significant

55
Appendix Table 9. ANOVA for TN on the effects of vetiver and control treatment
Source Df SS MS F ratio P-value
SSTr 1 15243.80 15243.8 7.5425* 0.0086
SSEr 46 92968.36 2021.1
SST 47 108212.16 *Significant at 0.01 level of significant
Appendix Table 10. ANOVA for TP on the effects of vetiver and control treatment
Source Df SS MS F ratio P-value
SSTr 1 666.6869 666.687 9.1034* 0.0041
SSEr 46 3368.8181 73.235
SST 47 4035.5050 *Significant at 0.01 level of significant
Appendix Table 11. ANOVA for EC on the effect of vetiver after eight weeks hydroponic
treatment
Source Df SS MS F ratio P-value
SSTr 1 9400016.7 9400017 381.8558* < 0.0001
SSEr 4 98466.7 24617
SST 5 9498483.3 *Significant at 0.01 level of significant
Appendix Table 12. ANOVA for BOD5 on the effect of vetiver after eight weeks hydroponic
treatment
Source Df SS MS F ratio P-value
SSTr 1 1344266.7 1344267 1260.250* < 0.0001
SSEr 4 4266.7 1067
SST 5 1348533.3 *Significant at 0.01 level of significant
Appendix Table 13. ANOVA for COD on the effect of vetiver after eight weeks hydroponic
treatment
Source Df SS MS F ratio P-value
SSTr 1 2101363.4 2101363 1265.104* < 0.0001
SSEr 4 6644.1 1661
SST 5 2108007.5 *Significant at 0.01 level of significant

56
Appendix Table 14. ANOVA for TN on the effect of vetiver after eight weeks hydroponic
treatment
Source Df SS MS F ratio P-value
SSTr 1 29789.079 29789.1 47471.37* < 0.0001
SSEr 4 2.510 0.627517
SST 5 29791.589 *Significant at 0.01 level of significant
Appendix Table 15. ANOVA for TP on the effect of vetiver after eight weeks hydroponic
treatment
Source Df SS MS F ratio P-value
SSTr 1 1085.4423 1085.44 9977.928* < 0.0001
SSEr 4 0.4351 0.11
SST 5 1085.8774 *Significant at 0.01 level of significant

57
7.2. Appendix Figures
Appendix Figure 1. Five months old vetiver grass ready for experiment

58
pH meter TDS/Conductivity meter DO meter
COD Reactor COD photo lab BOD bottles (510 ml)
BOD incubator thermostatic box SP75 UV/Vis spectrophotometer
Steam distillation unit Hot plate
Appendix Figure 2. Instruments used in the measurement of parameters

59
Appendix Figure 3. Impacts of wastewater on receiving environment at HU main campus

60
Appendix Figure 4. Tillers, shoots and roots after the treatment experiment
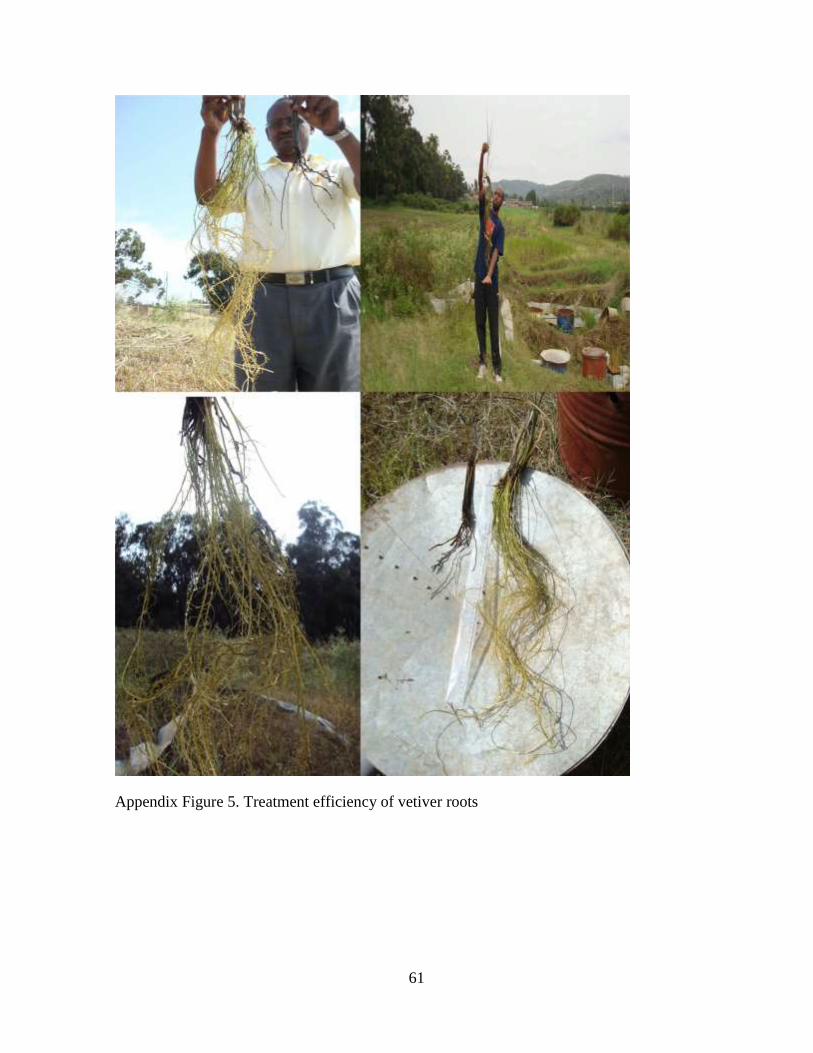
61
Appendix Figure 5. Treatment efficiency of vetiver roots

62
Untreated wastewater Control Vetiver treated Tap water
Appendix Figure 6. Visual comparison between treated and untreated wastewater