Embed Size (px)
Citation preview
The potentially multiferroic Aurivillius phase Bi5FeTi3O15: cation site preference,electric polarization, and magnetic coupling from first-principles
Axiel Yael Birenbaum∗ and Claude Ederer†
Materials Theory, ETH Zurich, Wolfgang-Pauli-Strasse 27, 8093 Zurich, Switzerland(Dated: January 28, 2016)
We study the structural, ferroelectric, and magnetic properties of the potentially multiferroicAurivillius phase material Bi5FeTi3O15 using first principles electronic structure calculations. Cal-culations are performed both with PBE and PBEsol exchange correlation functionals. We concludethat PBE systematically overestimates the lattice constants and the magnitude of the ferroelectricdistortion, whereas PBEsol leads to good agreement with available experimental data. We thenassess a potential site preference of the Fe3+cation by comparing 10 different distributions of theperovskite B-sites. We find a slight preference for the “inner” site, consistent with recent experimen-tal observations. We obtain a large value of ∼55µC/cm2 for the spontaneous electric polarization,which is rather independent of the specific Fe distribution. Finally, we calculate the strength ofthe magnetic coupling constants and find strong antiferromagnetic coupling between Fe3+cationsin nearest neighbor positions, whereas the coupling between further neighbors is rather weak. Thisposes the question whether magnetic long range order can occur in this system in spite of the lowconcentration of magnetic ions.
I. INTRODUCTION
Multiferroic materials, which exhibit simultaneous fer-roelectric and magnetic order, have been attracting con-siderable attention during the last decade.1–5 Much ofthe corresponding research is motivated by the great po-tential of these materials for non-volatile data storage,sensor applications, and many other areas of technology.However, materials that exhibit multiferroic propertiesabove room temperature, and are thus suitable candi-dates for future device applications, are still extremelyscarce. The search for alternative materials with robustmultiferroic properties above room temperature is there-fore of high relevance.
One possible route for the design of novel multiferroicmaterials is to start from a series of well-established fer-roelectrics and create additional functionality by incor-porating magnetic ions into these systems. A promisingclass of materials for this purpose are the so-called Au-rivillius phases. The Aurivillius phases are a family ofcompounds that form in a naturally-layered perovskite-related crystal structure which consists of m perovskitelayers (Am−1BmO3m+1)
2−, stacked along the [001] direc-
tion, and separated by fluorite-like (Bi2O2)2+
layers (seeFig. 1 for an example with m = 4). The overall chemicalcomposition is thus Bi2Am−1BmO3m+3, where many dif-ferent cations can be incorporated on the A and B-siteswithin the perovskite-like layers.7 The Aurivillius phasesare well known for their excellent ferroelectric proper-ties with very low fatigue,8,9 and offer great potential fortailoring specific properties by varying both ionic com-position and number of layers.
A number of Aurivillius compounds exhibiting multi-ferroic properties have been reported recently. For ex-ample, room temperature ferromagnetism together withferroelectric polarization has been reported for materialsbased on the 4-layer compound Bi5FeTi3O15, but withhalf of the Fe cations substituted by either Co or Ni.10,11
Furthermore, magnetic field-induced ferroelectric domainswitching has recently been observed in a 5-layer systemwith composition Bi6Ti2.8Fe1.52Mn0.68O18.12 However, itshould be noted that in many cases the observed polar-ization and magnetization depend strongly on the syn-thesis method and annealing conditions,13,14 and it hasbeen pointed out that the weak magnetic signals foundin these samples can indeed be caused by tiny inclusionsof other phases, which are extremely hard to detect usingstandard characterization methods.15
Even in the case of Bi5FeTi3O15, the “parent com-pound” for many of the compositions that have beenexplored as potential multiferroics, the ferroelectric andmagnetic properties are not well established. An an-tiferromagnetic Neel temperature of 80 K has beenreported.16 However, several more recent studies showparamagnetic behavior with no magnetic long-range or-der even at very low temperatures.13,17–19 Fits of mag-netic susceptibility data have found conflicting signs ofthe Curie-Weiss temperature in different samples, indi-cating either ferromagnetic13 or antiferromagnetic17,19
interactions between the Fe cations. Similarly, no well-established value exists for the spontaneous electric po-larization in Bi5FeTi3O15, due to difficulties in obtain-ing fully saturated ferroelectric hysteresis loops. Re-ported values for the remanent polarization vary from3.5 µC/cm2 to ∼ 30 µC/cm2.13,14
It is therefore desirable to establish the intrinsic prop-erties of Bi5FeTi3O15 and other potentially multiferroicAurivillius phases using modern first-principles electronicstructure calculations. Such calculations provide a usefulreference for experimental observations and can also beused as guideline for future studies.
Here we present results of such first-principles calcu-lations for the 4-layer Aurivillius phase Bi5FeTi3O15.We show that the structural properties of this mate-rial can be obtained in good agreement with availableexperimental data using the PBEsol functional for the
arX
iv:1
407.
3973
v2 [
cond
-mat
.mtr
l-sc
i] 2
7 Ja
n 20
16

2
FIG. 1. (Color online). High symmetry tetragonal crys-tal structure of Bi5FeTi3O15 (space group I4/mmm), corre-sponding to m = 4 in the Aurivillius series. Four perovskite-like layers are stacked along [001] and separated by fluorite-like (Bi2O2)2− layers. Bi and O atoms are shown as largeand small (purple and red) spheres, respectively, whereas theFe/Ti atoms are located inside the gray octahedra. Note thateach perovskite block is offset relative to the next one by(a02, a0
2, c0
2
)where a0 and c0 are the lattice parameters of
the conventional tetragonal unit cell. This picture has beengenerated using VESTA.6
exchange-correlation energy. We also show that thereis a preference for the Fe3+ cation to occupy the “in-ner” sites within the perovskite-like layers, and we sug-gest the possibility to reverse this preference using epi-taxial strain. Furthermore, we calculate a large spon-taneous ferroelectric polarization of ∼55µC/cm2, whichis similar in magnitude to the related 3-layer systemBi4Ti3O12. This shows that the presence of the magneticFe3+ cations is not detrimental to the ferroelectric prop-erties of Bi5FeTi3O15. Finally, we calculate the strengthof the magnetic coupling and find a very strong and an-tiferromagnetic coupling between Fe in nearest-neighborpositions. However, the coupling becomes nearly negli-gible beyond second neighbors, consistent with the shortrange character of the underlying superexchange mech-anism. This leaves the question of whether long-rangemagnetic order can be expected in Bi5FeTi3O15 openfor future studies.
This paper is organized as follows. In the next sec-tion we present the method we use in our first-principlescalculations, and discuss in particular how we treat thequasi-random distribution of Fe3+ and Ti4+ cations overthe available sites within the perovskite-like layers. In
Sections III A and III B we then present our results forthe structural properties and the energetics of the differ-ent cation distributions. Sec. III C focuses on the cal-culation of the electric polarization, and in Sec. III Dwe give a brief discussion of the electronic structure inBi5FeTi3O15. Finally, in Sec. III E we present our analy-sis of the calculated magnetic coupling constants and dis-cuss the possibility of long-range magnetic order. A sum-mary and some further conclusions are given in Sec. IV.
II. METHODS
A. Aurivillius crystal structure and differentdistributions of Fe/Ti cations
Most members of the homologous series of Aurivil-lius compounds exhibit a tetragonal structure with spacegroup symmetry I4/mmm at high temperatures (seeFig. 1 for the case of m = 4). On cooling, this structuretransforms into a polar structure corresponding to a sub-group symmetry of I4/mmm. Even-layered Aurivilliusphases such as Bi5FeTi3O15 (i.e., m = 2, 4, . . .) transformto orthorhombic symmetry A21am (space group no. 36),whereas odd-layered members (m = 1, 3, . . .) transforminto B2cb symmetry (space group no. 41) or an evenlower symmetry corresponding to a subgroup of B2cb.7,20
The symmetry lowering from I4/mmm to A21am leadsto a doubling of the primitive unit cell, with 2 formulaunits (48 atoms) per unit cell in the A21am structure.
There are two inequivalent B-sites in the 4-layer struc-ture: the inner sites within the perovskite layers, and theouter sites adjacent to the Bi2O2 layers. In Bi5FeTi3O15
these octahedrally coordinated B-sites are shared be-tween the Fe3+ and Ti4+ cations, and a quasi-randomcation distribution is observed in experiments.21 How-ever, recent Mossbauer experiments have reported aslight preference of Fe3+ to occupy the inner sites withinthe perovskite layers, whereas the outer sites are prefer-entially occupied by Ti4+ cations.22
In our calculations for Bi5FeTi3O15 we use the 48atom unit cell corresponding to the primitive unit cellof the low-symmetry A21am structure, which contains8 octahedrally-coordinated B sites (4 inner and 4 outersites). There are 10 symmetrically inequivalent ways todistribute 2 Fe and 6 Ti atoms over these 8 B sites, all ofwhich are depicted in Table I. In this work we explicitlyconsider each of the 10 individual configurations listed inTable I. This allows us to evaluate the impact of a specificcation distribution on the physical properties and also toaddress a potential site preference of the Fe3+ and Ti4+
cations in Bi5FeTi3O15. We note that the specific dis-tribution of cations breaks further symmetries comparedto the experimental A21am structure. One could thinkof the latter as a weighted average over all the possibleconfigurations.
To allow for all distortions observed in the experimen-tal A21am symmetry, we use lattice vectors that resem-

3
TABLE I. (Color online). The 10 symmetrically inequivalent configurations considered in this work, corresponding to differentdistributions of Fe and Ti over the octahedral B-sites. Fe and Ti sites are indicated by dark (brown) and light (blue) octahedra,respectively. The configurations are grouped into “outer”, “mixed”, and “inner”, depending on whether two, one, or none ofthe two Fe cations in the unit cell are situated in the perovskite layers adjacent to the Bi2O2 layers. The notation defined inthe second line is used throughout this article to denote the various configurations.
“outer” “mixed” “inner”
O1 O2 O3 M1 M2 M3 M4 I1 I2 I3
ble the corresponding base-centered orthorhombic lattice
vectors. In other words, ~a ≈ (√
2a0, 0, 0),~b ≈ (0,√
2a0, 0)
and ~c ≈ (√
2a0/2, 0, c0/2), where a0 and c0 correspondto the in-plane and out-of-plane lattice constants of thehigh-symmetry I4/mmm structure.23 Due to the lowersymmetry of the individual cation configurations listed inTable I, we obtain small deviations from the ideal base-centered orthorhombic lattice after relaxation. Specif-ically, the angles between the lattice vectors deviateslightly from the angles within perfect orthorhombic sym-metry. However, in all cases these deviations are smallerthan 0.7.
B. Computational details
We perform first-principles calculations using densityfunctional theory (DFT) and the projector augmentedwave (PAW) method as implemented in the Vienna abinitio simulation package (VASP).24,25 We use the gen-eralized gradient approximation according to Perdew,Burke, and Ernzerhof (PBE) and its version optimizedfor solids (PBEsol).26,27 We use PAW potentials whichinclude 15 valence electrons for Bi (6s25d106p3), 14 for Fe(3p64s23d6), 10 for Ti (3p64s23d2), and 6 for O (2s22p4).To correctly treat the strong interactions between the Fed electrons, the Hubbard “+U” correction was appliedwith UFe = 3.0 eV and the Hund’s coupling parameterJH set to zero.28 This value for UFe lies in the typicalrange that has been used successfully to describe var-ious properties of BiFeO3.29–32 Some calculations withUFe = 5 eV are also performed to assess the sensitivity ofelectronic structure and magnetic coupling constants onthe magnitude of UFe.
We perform full structural relaxations of all degrees offreedom (lattice parameters and internal positions) forall 10 configurations listed in Table I, both with paral-lel and antiparallel orientation of the magnetic momentsof the two Fe3+ cations within the unit cell. Lattice pa-
rameters and ionic positions are relaxed until the residualforces are smaller than 10−3 eV/A and the total energychanges less than 10−8 eV. Calculations are convergedusing a Γ-centered k-point mesh with 4× 4× 2 divisionsalong the three reciprocal lattice vectors and a plane wavecutoff energy of Ecut = 550 eV. For the calculation of theelectronic density of states a denser (and more uniform)12× 12× 3 k-point mesh is used.
III. RESULTS AND DISCUSSION
A. Lattice parameters and energetics
In this section we present the energies and lattice pa-rameters obtained by full structural relaxation of all 10symmetrically inequivalent configurations with differentdistributions of Fe3+ and Ti4+ cations listed in Table I.All presented results are obtained for antiparallel align-ment of the Fe magnetic moments. As will be shownin Sec. III E this corresponds to the preferred magneticstate in all cases.
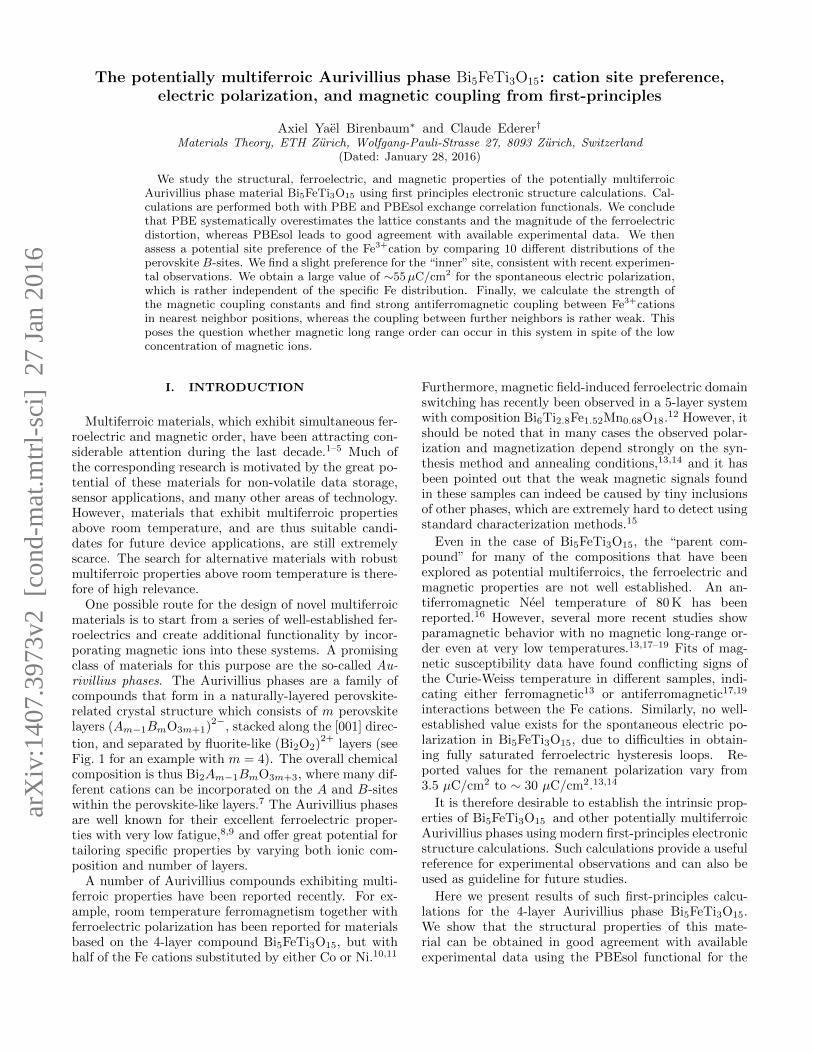
Fig. 2 shows the lengths of the three lattice vectorsobtained after full structural relaxation for each configu-ration, in comparison with experimental data taken fromRef. 21. One can see that for both PBE and PBEsol thereis a clear correlation between the lattice constants andthe distribution of Fe3+ and Ti4+ cations over the avail-able B sites. The three inner configurations have longerin-plane lattice constants, a and b, and shorter out-of-plane constants, c, compared to the three outer configu-rations. Mixed configurations are in between these twocases. Differences between configurations of the same“type” (i.e. inner, outer, or mixed) are rather small.
The larger tetragonality (larger c/a) of the crystallo-graphic unit cell for the outer configurations is related toa consistently large local tetragonality of the Fe sites inthe outer perovskite layer. For the following we definethe local tetragonality of the perovskite sites as the ra-
4
O1 O2 O3 M1 M2 M3 M4 I1 I2 I3
5.4
5.45
5.5
5.55
latti
ce c
onst
ant (
Å)
a b
20.620.8
2121.221.421.621.8
22 c
FIG. 2. (Color online). Lengths of the three lattice vectors
a = |~a| (bottom, circles), b = |~b| (bottom, squares), and c =|~c| (top, triangles) for the 10 different configurations listed inTable I, computed using the PBEsol (filled symbols) and thePBE (open symbols) functionals. The horizontal dashed linescorrespond to experimental data from Ref. 21.
tio between the out-of-plane and in-plane O-O distances,d⊥/d‖, of the surrounding oxygen octahedron. For theouter Fe sites, averaged over the three outer configura-tions (O1-O3), we obtain d⊥/d‖ = 1.21 within PBE andd⊥/d‖ = 1.16 within PBEsol. In contrast, the averageouter site tetragonality with all Fe occupying the innersite (I1-I3) is only d⊥/d‖ = 1.04 with either exchange cor-relation functional. Furthermore, in all outer and mixedconfigurations the local tetragonality of the outer Fe sitesis consistently larger than that of the outer Ti sites. Thelocal tetragonality of the inner perovskite sites is alwaysclose to 1 (average d⊥/d‖ = 1.01 within PBEsol).
It is interesting to note that the large tetragonal distor-tion of the oxygen octahedron together with the large off-center displacement of the Fe3+ cation on the outer siteleads to a quasi five-fold square-pyramid coordination ofFe3+ that closely resembles the “super-tetragonal” phasefound in thin films of BiFeO3 under strong compressivestrain.31,33,34
While both PBE and PBEsol exhibit the same quali-tative trends, the level of agreement with the experimen-tal lattice parameters is different for the two functionals.Generally, PBEsol leads to slightly smaller lattice pa-rameters compared to PBE, and overall seems to providebetter agreement with the experimental data. The bestagreement is observed for the inner and mixed configura-tions using PBEsol. On average (over all configurations),PBE overestimates a, b, and c by 0.05 A (0.8 %), 0.08 A(1.4 %), and 0.63 A (3.1 %), respectively, whereas PBEsolunderestimates both a and b by 0.02 A (0.4 %), and over-estimates c by 0.18 A (0.8 %).
We also verified that the specific value of the Hub-bard U does not have a noticeable effect on the structuralproperties. Within PBEsol, an increase of the Hubbard
00.10.20.30.4
Ener
gy w
rt Lo
wes
t Con
fig. (
eV /
2 f.u
.) fully relaxed PBEsol
00.10.20.30.4 fully relaxed PBE
O1 O2 O3 M1 M2 M3 M4 I1 I2 I30
0.10.20.30.4 PBE with exp. lattice constants
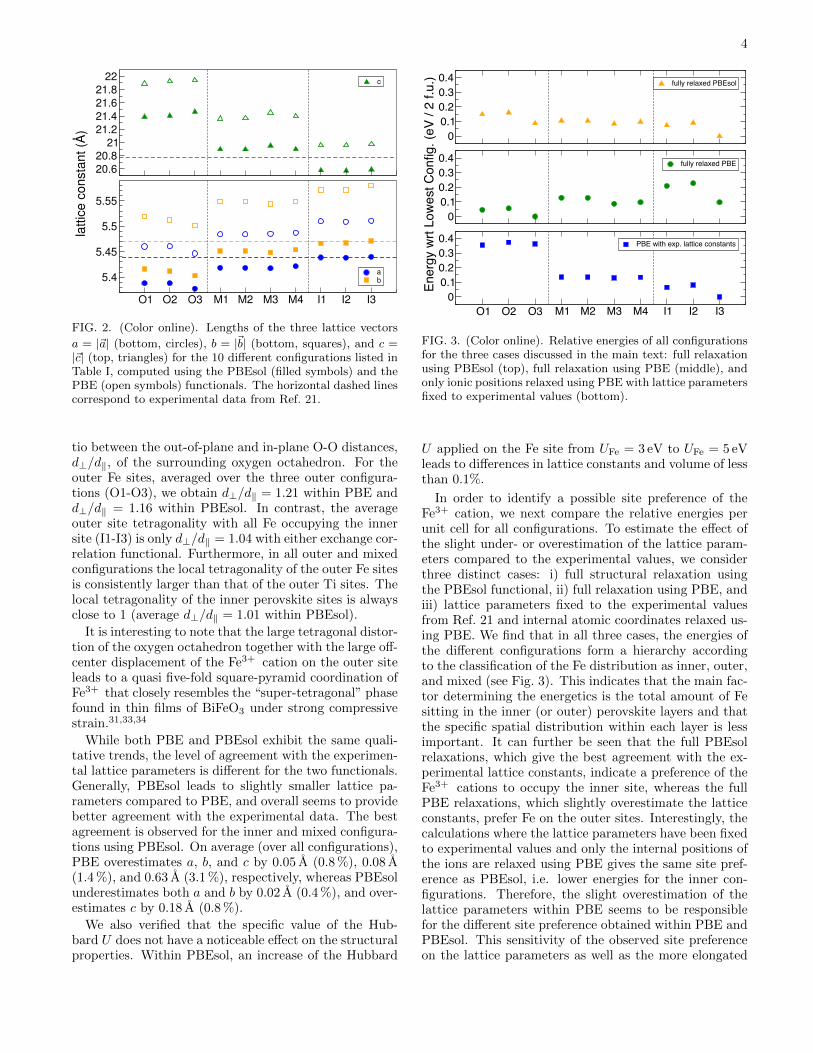
FIG. 3. (Color online). Relative energies of all configurationsfor the three cases discussed in the main text: full relaxationusing PBEsol (top), full relaxation using PBE (middle), andonly ionic positions relaxed using PBE with lattice parametersfixed to experimental values (bottom).
U applied on the Fe site from UFe = 3 eV to UFe = 5 eVleads to differences in lattice constants and volume of lessthan 0.1%.
In order to identify a possible site preference of theFe3+ cation, we next compare the relative energies perunit cell for all configurations. To estimate the effect ofthe slight under- or overestimation of the lattice param-eters compared to the experimental values, we considerthree distinct cases: i) full structural relaxation usingthe PBEsol functional, ii) full relaxation using PBE, andiii) lattice parameters fixed to the experimental valuesfrom Ref. 21 and internal atomic coordinates relaxed us-ing PBE. We find that in all three cases, the energies ofthe different configurations form a hierarchy accordingto the classification of the Fe distribution as inner, outer,and mixed (see Fig. 3). This indicates that the main fac-tor determining the energetics is the total amount of Fesitting in the inner (or outer) perovskite layers and thatthe specific spatial distribution within each layer is lessimportant. It can further be seen that the full PBEsolrelaxations, which give the best agreement with the ex-perimental lattice constants, indicate a preference of theFe3+ cations to occupy the inner site, whereas the fullPBE relaxations, which slightly overestimate the latticeconstants, prefer Fe on the outer sites. Interestingly, thecalculations where the lattice parameters have been fixedto experimental values and only the internal positions ofthe ions are relaxed using PBE gives the same site pref-erence as PBEsol, i.e. lower energies for the inner con-figurations. Therefore, the slight overestimation of thelattice parameters within PBE seems to be responsiblefor the different site preference obtained within PBE andPBEsol. This sensitivity of the observed site preferenceon the lattice parameters as well as the more elongated

5
hc(o
ut)
Fe
i
0 200 400 600 800 1000 1200 1400Temperature (K)
0
0.1
0.2
0.3
0.4
0.5<o
utFe
>fully relaxed PBEfully relaxed PBEsolPBE with exp. lattice constants
FIG. 4. (Color online) Thermal average of the Fe occupationon the outer site for the three different cases discussed inthe text. The vertical dotted line indicates a typical growthtemperature of 1000 K. The horizontal dashed line indicatesthe value of 0.25 corresponding to a completely random cationdistribution.
unit cell (larger c/a ratio) obtained for the outer config-urations (see Fig. 2) suggest a potential way of tailor-ing the cation distribution using epitaxial strain, i.e. bygrowing thin films of Bi5FeTi3O15 on different substrateswith either positive or negative lattice mismatch.
As can be seen from Fig. 3, the energy differences be-tween different cation configurations are of the order of∼100 meV per unit cell. To obtain a rough estimate ofwhether these energy differences can lead to noticeabledeviations from a random distribution of Fe3+ and Ti4+
cations over the octahedral sites, we calculate the Fe oc-cupation of the outer site as a thermal average,
〈c(out)Fe 〉(T ) =
1
Z
∑i
c(out)Fe,i e
−Ei/kBT , (1)
where Ei and c(out)Fe,i are the energy and outer site occu-
pation of configuration i, and Z =∑
i e−Ei/kBT .
We note that this is a simplified model that considersonly the 10 configurations that correspond to our choiceof periodic unit cell and does not take into account anykinetic effects during growth. We therefore do not ex-pect it to accurately predict the outer site occupation inrealistic samples. Nevertheless, this model gives a roughidea of the temperature range in which a preferential siteoccupation can be expected based on simple energetics.
Fig. 4 shows the resulting temperature dependence of
〈c(out)Fe 〉, i.e. the average Fe occupation of the outer site.
At zero temperature the value of 〈c(out)Fe 〉 is determined
by the lowest energy configuration in each case (com-pare with Fig. 3), i.e. zero Fe occupation of the outersite within PBEsol and within PBE using experimental
lattice parameters, while 〈c(out)Fe 〉 = 0.5 for the fully re-
laxed PBE case, corresponding to all Fe cations sitting
on an outer site. Furthermore, for T → ∞ all threecases converge to a value of 0.25, which corresponds toa completely random distribution of Fe3+ cations overouter and inner sites. However, it can be seen thatwithin the given approximations a fully random site oc-cupancy is not reached even at temperatures significantlyabove 1000 K. Indeed, at a typical synthesis temperatureof 1000 K (see e.g. Refs. 21, 13, or 35) less than 20 %of outer sites are occupied by Fe3+ within PBEsol andwhen using experimental lattice parameters. This meansthat more than 60 % of all Fe3+ cations can be found onthe inner sites. Thus, our results suggest that it is pos-sible to alter the occupation of outer and inner sites byvarying growth or sintering temperatures, cooling rates,and annealing times during synthesis.
Experimentally, while no indications for a deviationfrom the random distribution of Fe3+ and Ti4+ cationshave been found in Rietveld refinements of neutrondiffraction data,21 recent Mossbauer spectroscopy indi-cates a small preference of the Fe3+ cations for the in-ner perovskite sites,22 consistent with our PBEsol results.Lomanova et al. also found that this preferential occupa-tion of inner (outer) sites with Fe3+ (Ti4+) strengthensas the number of perovskite-like layers increases (m > 5)within the series Bin+1Fen−3Ti3O3n+3,22 consistent withan earlier extended x-ray absorption fine structure (EX-AFS) analysis of the 5-layer system Bi6Fe2Ti3O18.36
A preferential occupation of the outer site with Ti4+
cations, has also been reported for the related systemBi5CrTi3O15.37
It has been argued that the Ti4+ cation prefers themore distorted outer site because of its d0 electron con-figuration, which exhibits a strong tendency for off-center displacement due to the second-order Jahn-Tellereffect.38 Interestingly, our relaxations show that, whileit is indeed energetically more favorable that Fe occu-pies the inner site (at least within PBEsol and at theexperimental volume), the presence of Fe3+ on the outersite in fact creates a significantly more distorted coordi-nation octahedra compared to the Ti4+ cation (see theabove discussion on local tetragonality). This strong lo-cal tetragonality, which resembles the local coordinationfound in BiFeO3 films under strong compressive epitaxialstrain,31,33,34 suggests that the Fe3+ cation also plays anactive role in determining the site preference. The changein site preference with lattice constants seems to point to-wards competing tendencies between the individual sitepreferences of Fe3+ and Ti4+ cations.
Another possible explanation for the outer site prefer-ence of Ti4+, suggested in Ref. 37, is that it is electro-statically more favorable to have the higher charged Ti4+
cation located closer to the negatively charged oxygen inthe fluorite layer. Even though the importance of electro-static effects cannot be strictly ruled out by our results,we point out that the pronounced dependence on latticeparameters and volume seems to indicate that changesin chemical bonding and coordination are more relevantthan electro-static effects.
6
Further insight in the underlying mechanism could beobtained by a systematic study of site preference as func-tion of volume and strain, and also by investigating dif-ferent compositions where Fe3+ is replaced by other mag-netic TM cations, such as e.g. Cr3+ or Mn3+.
B. Internal structural parameters and modedecomposition
Next, we analyze the differences in the internal atomiccoordinates of the various configurations listed in Table I.Due to the numerous internal degrees of freedom and dif-ferent symmetries for the different configurations, we donot compare the individual atomic coordinates directly.Instead, we perform a symmetry mode decompositionof all relaxed structures, as well as of the experimen-tally observed structure, using the same high symmetryI4/mmm reference structure in all cases (with equiva-lent atoms on all octahedrally coordinated sites). Thisallows for a more systematic quantitative comparison ofthe most relevant degrees of freedom.39
The position of each atom ~ri in the unit cell, can bewritten as the sum of its position in the high-symmetryreference structure ~r0
i (here taken to be the paraelectricI4/mmm structure) and a displacement vector ~ui:
~ri = ~r0i + ~ui . (2)
The set of displacement vectors can then be expressed aslinear combinations of mode vectors ~εi,m with amplitudesAm:
~ui =∑m
Am~εi,m . (3)
Thereby, each mode vector can be chosen such that ittransforms according to a single irreducible representa-tion, characterized by the index m, of the symmetrygroup of the reference structure. In general, these modevectors consist of several components — the symmetry-adapted modes basis for that irreducible representation,which correspond for example to displacements of cationson different Wyckoff positions. It is important not to con-fuse these displacement modes, which correspond to thedistortion in the relaxed structure, with specific phononeigenmodes.
In the following, we only discuss the total mode am-plitude for each irreducible representation, which is cal-culated from the vectorial sum of all the individual com-ponents. For more details please refer to Ref. 39. In thepresent work, the mode decomposition is performed us-ing the tool AMPLIMODES available from the BilbaoCrystallographic Server.40
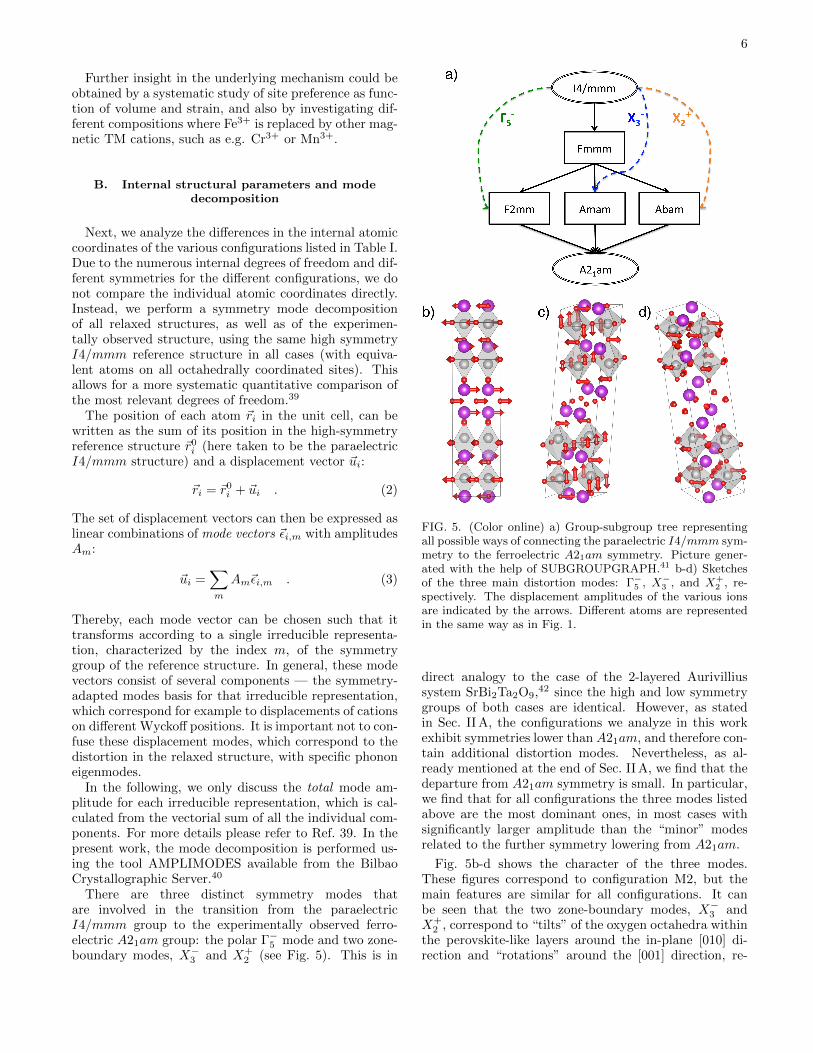
There are three distinct symmetry modes thatare involved in the transition from the paraelectricI4/mmm group to the experimentally observed ferro-electric A21am group: the polar Γ−5 mode and two zone-boundary modes, X−3 and X+
2 (see Fig. 5). This is in
FIG. 5. (Color online) a) Group-subgroup tree representingall possible ways of connecting the paraelectric I4/mmm sym-metry to the ferroelectric A21am symmetry. Picture gener-ated with the help of SUBGROUPGRAPH.41 b-d) Sketchesof the three main distortion modes: Γ−5 , X−3 , and X+
2 , re-spectively. The displacement amplitudes of the various ionsare indicated by the arrows. Different atoms are representedin the same way as in Fig. 1.
direct analogy to the case of the 2-layered Aurivilliussystem SrBi2Ta2O9,42 since the high and low symmetrygroups of both cases are identical. However, as statedin Sec. II A, the configurations we analyze in this workexhibit symmetries lower than A21am, and therefore con-tain additional distortion modes. Nevertheless, as al-ready mentioned at the end of Sec. II A, we find that thedeparture from A21am symmetry is small. In particular,we find that for all configurations the three modes listedabove are the most dominant ones, in most cases withsignificantly larger amplitude than the “minor” modesrelated to the further symmetry lowering from A21am.
Fig. 5b-d shows the character of the three modes.These figures correspond to configuration M2, but themain features are similar for all configurations. It canbe seen that the two zone-boundary modes, X−3 andX+
2 , correspond to “tilts” of the oxygen octahedra withinthe perovskite-like layers around the in-plane [010] di-rection and “rotations” around the [001] direction, re-
7
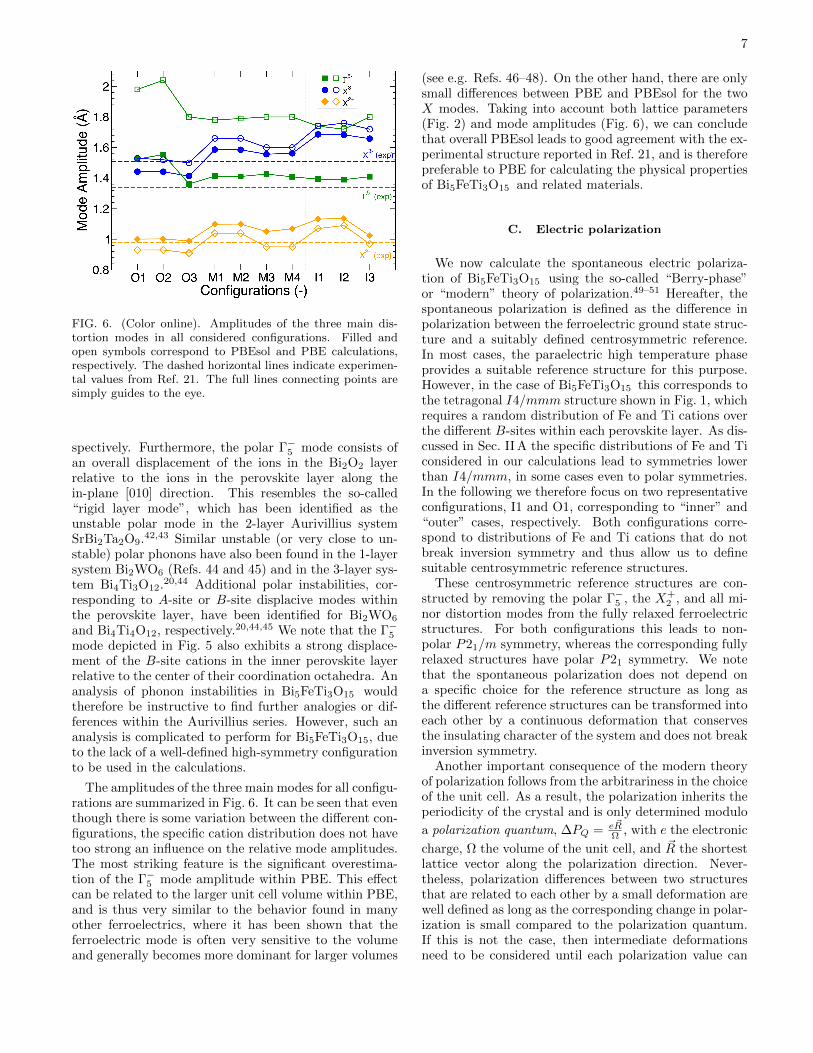
FIG. 6. (Color online). Amplitudes of the three main dis-tortion modes in all considered configurations. Filled andopen symbols correspond to PBEsol and PBE calculations,respectively. The dashed horizontal lines indicate experimen-tal values from Ref. 21. The full lines connecting points aresimply guides to the eye.
spectively. Furthermore, the polar Γ−5 mode consists ofan overall displacement of the ions in the Bi2O2 layerrelative to the ions in the perovskite layer along thein-plane [010] direction. This resembles the so-called“rigid layer mode”, which has been identified as theunstable polar mode in the 2-layer Aurivillius systemSrBi2Ta2O9.42,43 Similar unstable (or very close to un-stable) polar phonons have also been found in the 1-layersystem Bi2WO6 (Refs. 44 and 45) and in the 3-layer sys-tem Bi4Ti3O12.20,44 Additional polar instabilities, cor-responding to A-site or B-site displacive modes withinthe perovskite layer, have been identified for Bi2WO6
and Bi4Ti4O12, respectively.20,44,45 We note that the Γ−5mode depicted in Fig. 5 also exhibits a strong displace-ment of the B-site cations in the inner perovskite layerrelative to the center of their coordination octahedra. Ananalysis of phonon instabilities in Bi5FeTi3O15 wouldtherefore be instructive to find further analogies or dif-ferences within the Aurivillius series. However, such ananalysis is complicated to perform for Bi5FeTi3O15, dueto the lack of a well-defined high-symmetry configurationto be used in the calculations.
The amplitudes of the three main modes for all configu-rations are summarized in Fig. 6. It can be seen that eventhough there is some variation between the different con-figurations, the specific cation distribution does not havetoo strong an influence on the relative mode amplitudes.The most striking feature is the significant overestima-tion of the Γ−5 mode amplitude within PBE. This effectcan be related to the larger unit cell volume within PBE,and is thus very similar to the behavior found in manyother ferroelectrics, where it has been shown that theferroelectric mode is often very sensitive to the volumeand generally becomes more dominant for larger volumes
(see e.g. Refs. 46–48). On the other hand, there are onlysmall differences between PBE and PBEsol for the twoX modes. Taking into account both lattice parameters(Fig. 2) and mode amplitudes (Fig. 6), we can concludethat overall PBEsol leads to good agreement with the ex-perimental structure reported in Ref. 21, and is thereforepreferable to PBE for calculating the physical propertiesof Bi5FeTi3O15 and related materials.
C. Electric polarization
We now calculate the spontaneous electric polariza-tion of Bi5FeTi3O15 using the so-called “Berry-phase”or “modern” theory of polarization.49–51 Hereafter, thespontaneous polarization is defined as the difference inpolarization between the ferroelectric ground state struc-ture and a suitably defined centrosymmetric reference.In most cases, the paraelectric high temperature phaseprovides a suitable reference structure for this purpose.However, in the case of Bi5FeTi3O15 this corresponds tothe tetragonal I4/mmm structure shown in Fig. 1, whichrequires a random distribution of Fe and Ti cations overthe different B-sites within each perovskite layer. As dis-cussed in Sec. II A the specific distributions of Fe and Ticonsidered in our calculations lead to symmetries lowerthan I4/mmm, in some cases even to polar symmetries.In the following we therefore focus on two representativeconfigurations, I1 and O1, corresponding to “inner” and“outer” cases, respectively. Both configurations corre-spond to distributions of Fe and Ti cations that do notbreak inversion symmetry and thus allow us to definesuitable centrosymmetric reference structures.
These centrosymmetric reference structures are con-structed by removing the polar Γ−5 , the X+
2 , and all mi-nor distortion modes from the fully relaxed ferroelectricstructures. For both configurations this leads to non-polar P21/m symmetry, whereas the corresponding fullyrelaxed structures have polar P21 symmetry. We notethat the spontaneous polarization does not depend ona specific choice for the reference structure as long asthe different reference structures can be transformed intoeach other by a continuous deformation that conservesthe insulating character of the system and does not breakinversion symmetry.
Another important consequence of the modern theoryof polarization follows from the arbitrariness in the choiceof the unit cell. As a result, the polarization inherits theperiodicity of the crystal and is only determined modulo
a polarization quantum, ∆PQ = e~RΩ , with e the electronic
charge, Ω the volume of the unit cell, and ~R the shortestlattice vector along the polarization direction. Never-theless, polarization differences between two structuresthat are related to each other by a small deformation arewell defined as long as the corresponding change in polar-ization is small compared to the polarization quantum.If this is not the case, then intermediate deformationsneed to be considered until each polarization value can
8
0 10 20 30 40 50 60 70 80 90 100Distortion amplitude [%]
0
10
20
30
40
50
60
70Po
laris
atio
n al
ong
(010
) [µC
.cm
-2]
0 10 20 30 40 50 60 70 80 90 100Distortion amplitude [%]
0
10
20
30
40
50
60
70
Pola
risat
ion
alon
g (0
10) [µC
.cm
-2]
a)!
b)!
PS!
PS!
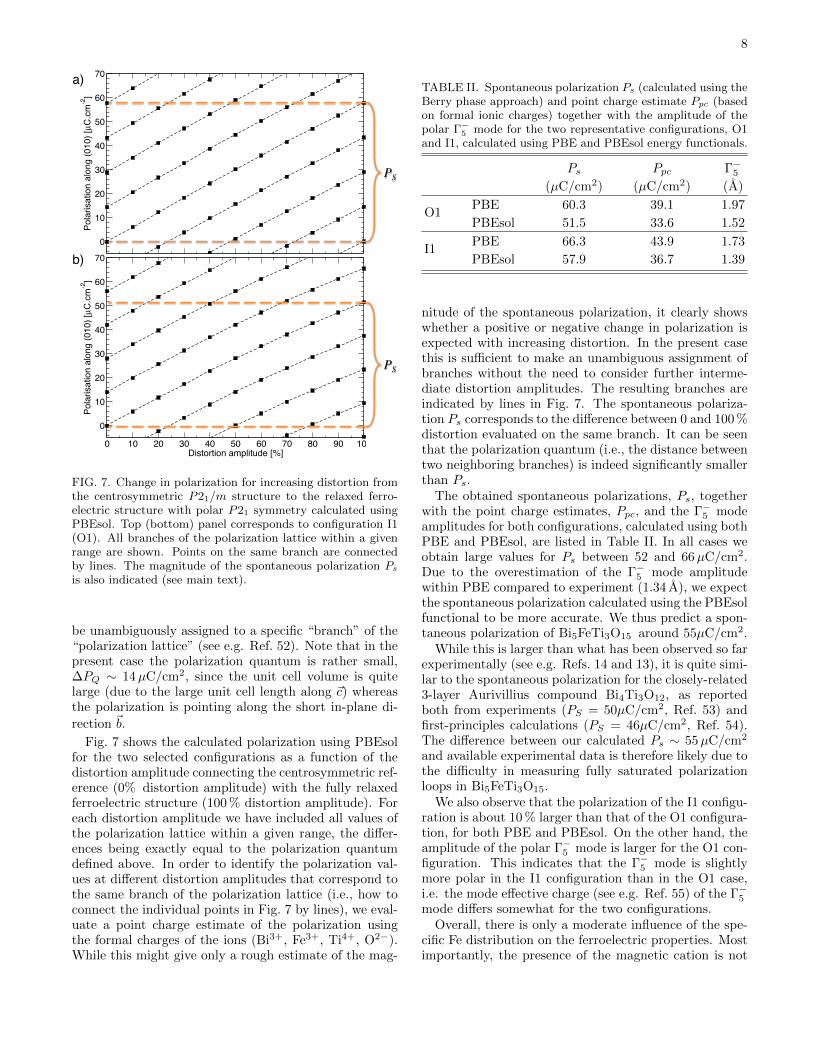
FIG. 7. Change in polarization for increasing distortion fromthe centrosymmetric P21/m structure to the relaxed ferro-electric structure with polar P21 symmetry calculated usingPBEsol. Top (bottom) panel corresponds to configuration I1(O1). All branches of the polarization lattice within a givenrange are shown. Points on the same branch are connectedby lines. The magnitude of the spontaneous polarization Ps
is also indicated (see main text).
be unambiguously assigned to a specific “branch” of the“polarization lattice” (see e.g. Ref. 52). Note that in thepresent case the polarization quantum is rather small,∆PQ ∼ 14µC/cm2, since the unit cell volume is quitelarge (due to the large unit cell length along ~c) whereasthe polarization is pointing along the short in-plane di-
rection ~b.
Fig. 7 shows the calculated polarization using PBEsolfor the two selected configurations as a function of thedistortion amplitude connecting the centrosymmetric ref-erence (0% distortion amplitude) with the fully relaxedferroelectric structure (100 % distortion amplitude). Foreach distortion amplitude we have included all values ofthe polarization lattice within a given range, the differ-ences being exactly equal to the polarization quantumdefined above. In order to identify the polarization val-ues at different distortion amplitudes that correspond tothe same branch of the polarization lattice (i.e., how toconnect the individual points in Fig. 7 by lines), we eval-uate a point charge estimate of the polarization usingthe formal charges of the ions (Bi3+, Fe3+, Ti4+, O2−).While this might give only a rough estimate of the mag-
TABLE II. Spontaneous polarization Ps (calculated using theBerry phase approach) and point charge estimate Ppc (basedon formal ionic charges) together with the amplitude of thepolar Γ−5 mode for the two representative configurations, O1and I1, calculated using PBE and PBEsol energy functionals.
Ps Ppc Γ−5(µC/cm2) (µC/cm2) (A)
O1PBE 60.3 39.1 1.97
PBEsol 51.5 33.6 1.52
I1PBE 66.3 43.9 1.73
PBEsol 57.9 36.7 1.39
nitude of the spontaneous polarization, it clearly showswhether a positive or negative change in polarization isexpected with increasing distortion. In the present casethis is sufficient to make an unambiguous assignment ofbranches without the need to consider further interme-diate distortion amplitudes. The resulting branches areindicated by lines in Fig. 7. The spontaneous polariza-tion Ps corresponds to the difference between 0 and 100 %distortion evaluated on the same branch. It can be seenthat the polarization quantum (i.e., the distance betweentwo neighboring branches) is indeed significantly smallerthan Ps.
The obtained spontaneous polarizations, Ps, togetherwith the point charge estimates, Ppc, and the Γ−5 modeamplitudes for both configurations, calculated using bothPBE and PBEsol, are listed in Table II. In all cases weobtain large values for Ps between 52 and 66µC/cm2.Due to the overestimation of the Γ−5 mode amplitudewithin PBE compared to experiment (1.34 A), we expectthe spontaneous polarization calculated using the PBEsolfunctional to be more accurate. We thus predict a spon-taneous polarization of Bi5FeTi3O15 around 55µC/cm2.
While this is larger than what has been observed so farexperimentally (see e.g. Refs. 14 and 13), it is quite simi-lar to the spontaneous polarization for the closely-related3-layer Aurivillius compound Bi4Ti3O12, as reportedboth from experiments (PS = 50µC/cm2, Ref. 53) andfirst-principles calculations (PS = 46µC/cm2, Ref. 54).The difference between our calculated Ps ∼ 55µC/cm2
and available experimental data is therefore likely due tothe difficulty in measuring fully saturated polarizationloops in Bi5FeTi3O15.
We also observe that the polarization of the I1 configu-ration is about 10 % larger than that of the O1 configura-tion, for both PBE and PBEsol. On the other hand, theamplitude of the polar Γ−5 mode is larger for the O1 con-figuration. This indicates that the Γ−5 mode is slightlymore polar in the I1 configuration than in the O1 case,i.e. the mode effective charge (see e.g. Ref. 55) of the Γ−5mode differs somewhat for the two configurations.
Overall, there is only a moderate influence of the spe-cific Fe distribution on the ferroelectric properties. Mostimportantly, the presence of the magnetic cation is not

9
0
10
20
30
40
50Bi p
Ti dO p
Fe d
Bi5FeTi
3O
15
[1.4] AFM -- k: 12 x 12 x 3, ISMEAR = -5 -- U = 3.0 eV (top) 5.0 eV (bottom)
-8 -6 -4 -2 0 2 4 6E-E
F (eV)
0
10
20
30
40DO
S (
eV
-1)
0
10
20
30
40
50Bi p
Ti dO p
Fe d
Bi5FeTi
3O
15
[2.3] AFM -- k: 12 x 12 x 3, ISMEAR = -5 -- U = 3.0 eV (top) 5.0 eV (bottom)
-8 -6 -4 -2 0 2 4 6E-E
F (eV)
0
10
20
30
40DO
S (
eV
-1)
b)!
a)!
FIG. 8. (Color online). Total (gray shaded) and projected(lines) densities of states (DOS) for configurations O1 (a) andI1 (b) using different values of the Hubbard U parameter:UFe = 3.0 eV (top panel in each subfigure) and UFe = 5.0 eV(bottom panels).
detrimental to the ferroelectric polarization, which re-mains large compared to other nonmagnetic Aurivilliuscompounds.
Finally, we note that the large difference between thepolarization calculated using the Berry phase approachand the point charge estimate based on formal chargesindicates a highly anomalous value of the mode effectivecharge, which is enhanced by about 50-60 % compared toits formal value. Such enhanced effective charges are in-dicative of ferroelectricity that is driven by hybridizationeffects.55
D. Electronic structure
Fig. 8 shows the electronic densities of states (DOS),total and projected on selected atomic and orbital char-acters, calculated using PBEsol for the two representa-tive outer and inner configurations, O1 and I1. It canbe seen that while there are some differences, the over-all features of the densities of states are the same for thetwo cases. This indicates that the specific Fe/Ti distribu-tion has only a marginal impact on the global electronicstructure.
O1 O2 O3 M1 M2 M3 M4 I1 I2 I30
0.05
0.1
0.15
0.2
0.25
0.3
0.35
0.4
0.45
Ener
gy (e
V / 2
f.u.
)
FMAFM
FIG. 9. (Color online) Energies of all configurations for FM(blue squares) and AFM (red circles) orientation of the Femagnetic moments, within PBEsol.
For both configurations we obtain a large bandgap of1.7 eV (for UFe = 3 eV). The valence band is formedby states with predominant O-p character and the con-duction band by states with predominant Ti/Fe-d char-acter (and some Bi-p character at slightly higher ener-gies). There is a strong splitting (∼ 7.5 eV) between theFe-d states with different local spin projection, consis-tent with a high spin d5 electron configuration of Fe3+.On the other hand, the Ti-d states are essentially empty(apart from small admixtures in the valence band due tohybridization with the O-p states), consistent with a d0
configuration of the Ti4+ cation.
In order to test the impact of the Hubbard U param-eter on the electronic structure, we compare the DOSobtained with UFe = 3.0 eV (the value used throughoutthis paper) with that obtained for a somewhat highervalue of UFe = 5.0 eV. The larger UFe increases the spinsplitting of the Fe d states and pushes the unoccupiedlocal minority spin Fe d states to higher energies, so thatthe lower conduction band edge becomes more dominatedby the Ti d states and the band gap increases to 2.1 eV.Note that an even larger value for UFe will not lead toa further increase of the bandgap, which is then fixedby the energy difference between the occupied O p andunoccupied Ti d states.
Unfortunately, to the best of our knowledge, no spec-troscopic data is available for Bi5FeTi3O15, that wouldallow to identify the orbital character of the lower con-duction band edge. Such data would be desirable to ver-ify the correct description of the electronic structure ofthis material within the DFT+U approach, and to nar-row down the specific value for UFe to be used in suchcalculations.
10
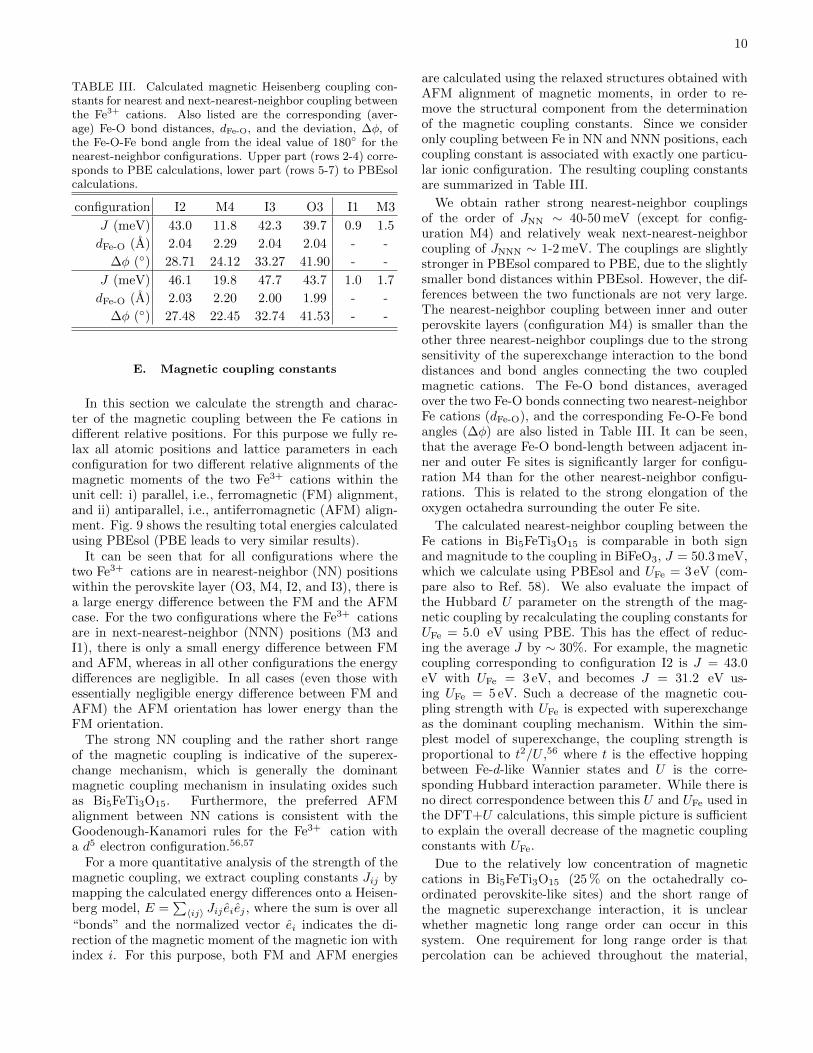
TABLE III. Calculated magnetic Heisenberg coupling con-stants for nearest and next-nearest-neighbor coupling betweenthe Fe3+ cations. Also listed are the corresponding (aver-age) Fe-O bond distances, dFe-O, and the deviation, ∆φ, ofthe Fe-O-Fe bond angle from the ideal value of 180 for thenearest-neighbor configurations. Upper part (rows 2-4) corre-sponds to PBE calculations, lower part (rows 5-7) to PBEsolcalculations.
configuration I2 M4 I3 O3 I1 M3
J (meV) 43.0 11.8 42.3 39.7 0.9 1.5
dFe-O (A) 2.04 2.29 2.04 2.04 - -
∆φ () 28.71 24.12 33.27 41.90 - -
J (meV) 46.1 19.8 47.7 43.7 1.0 1.7
dFe-O (A) 2.03 2.20 2.00 1.99 - -
∆φ () 27.48 22.45 32.74 41.53 - -
E. Magnetic coupling constants
In this section we calculate the strength and charac-ter of the magnetic coupling between the Fe cations indifferent relative positions. For this purpose we fully re-lax all atomic positions and lattice parameters in eachconfiguration for two different relative alignments of themagnetic moments of the two Fe3+ cations within theunit cell: i) parallel, i.e., ferromagnetic (FM) alignment,and ii) antiparallel, i.e., antiferromagnetic (AFM) align-ment. Fig. 9 shows the resulting total energies calculatedusing PBEsol (PBE leads to very similar results).
It can be seen that for all configurations where thetwo Fe3+ cations are in nearest-neighbor (NN) positionswithin the perovskite layer (O3, M4, I2, and I3), there isa large energy difference between the FM and the AFMcase. For the two configurations where the Fe3+ cationsare in next-nearest-neighbor (NNN) positions (M3 andI1), there is only a small energy difference between FMand AFM, whereas in all other configurations the energydifferences are negligible. In all cases (even those withessentially negligible energy difference between FM andAFM) the AFM orientation has lower energy than theFM orientation.
The strong NN coupling and the rather short rangeof the magnetic coupling is indicative of the superex-change mechanism, which is generally the dominantmagnetic coupling mechanism in insulating oxides suchas Bi5FeTi3O15. Furthermore, the preferred AFMalignment between NN cations is consistent with theGoodenough-Kanamori rules for the Fe3+ cation witha d5 electron configuration.56,57
For a more quantitative analysis of the strength of themagnetic coupling, we extract coupling constants Jij bymapping the calculated energy differences onto a Heisen-berg model, E =
∑〈ij〉 Jij eiej , where the sum is over all
“bonds” and the normalized vector ei indicates the di-rection of the magnetic moment of the magnetic ion withindex i. For this purpose, both FM and AFM energies
are calculated using the relaxed structures obtained withAFM alignment of magnetic moments, in order to re-move the structural component from the determinationof the magnetic coupling constants. Since we consideronly coupling between Fe in NN and NNN positions, eachcoupling constant is associated with exactly one particu-lar ionic configuration. The resulting coupling constantsare summarized in Table III.
We obtain rather strong nearest-neighbor couplingsof the order of JNN ∼ 40-50 meV (except for config-uration M4) and relatively weak next-nearest-neighborcoupling of JNNN ∼ 1-2 meV. The couplings are slightlystronger in PBEsol compared to PBE, due to the slightlysmaller bond distances within PBEsol. However, the dif-ferences between the two functionals are not very large.The nearest-neighbor coupling between inner and outerperovskite layers (configuration M4) is smaller than theother three nearest-neighbor couplings due to the strongsensitivity of the superexchange interaction to the bonddistances and bond angles connecting the two coupledmagnetic cations. The Fe-O bond distances, averagedover the two Fe-O bonds connecting two nearest-neighborFe cations (dFe-O), and the corresponding Fe-O-Fe bondangles (∆φ) are also listed in Table III. It can be seen,that the average Fe-O bond-length between adjacent in-ner and outer Fe sites is significantly larger for configu-ration M4 than for the other nearest-neighbor configu-rations. This is related to the strong elongation of theoxygen octahedra surrounding the outer Fe site.
The calculated nearest-neighbor coupling between theFe cations in Bi5FeTi3O15 is comparable in both signand magnitude to the coupling in BiFeO3, J = 50.3 meV,which we calculate using PBEsol and UFe = 3 eV (com-pare also to Ref. 58). We also evaluate the impact ofthe Hubbard U parameter on the strength of the mag-netic coupling by recalculating the coupling constants forUFe = 5.0 eV using PBE. This has the effect of reduc-ing the average J by ∼ 30%. For example, the magneticcoupling corresponding to configuration I2 is J = 43.0eV with UFe = 3 eV, and becomes J = 31.2 eV us-ing UFe = 5 eV. Such a decrease of the magnetic cou-pling strength with UFe is expected with superexchangeas the dominant coupling mechanism. Within the sim-plest model of superexchange, the coupling strength isproportional to t2/U ,56 where t is the effective hoppingbetween Fe-d-like Wannier states and U is the corre-sponding Hubbard interaction parameter. While there isno direct correspondence between this U and UFe used inthe DFT+U calculations, this simple picture is sufficientto explain the overall decrease of the magnetic couplingconstants with UFe.
Due to the relatively low concentration of magneticcations in Bi5FeTi3O15 (25 % on the octahedrally co-ordinated perovskite-like sites) and the short range ofthe magnetic superexchange interaction, it is unclearwhether magnetic long range order can occur in thissystem. One requirement for long range order is thatpercolation can be achieved throughout the material,
11
i.e. the majority of Fe cations need to be connectedwith each other through continuous links between cou-pled neighbors. In a three-dimensional simple cubic lat-tice, to which the 4-perovskite thick layers can be re-lated, the threshold for percolation is 31% of magneticsites when considering only NN couplings, and 14% withboth NN and NNN couplings.59 Thus, with 25 % of mag-netic sites as in Bi5FeTi3O15, percolation is dependent onthe rather weak NNN coupling, which will probably giverise to magnetic order only at rather low temperatures.Furthermore, the perovskite-like layers are separated byBi2O2 layers that do not contain any magnetically activeions. The shortest superexchange path connecting twoFe cations on opposite sides of the Bi2O2 layer is of theform Fe-O-O-O-Fe, containing two O-O links, which willonly give rise to a very weak coupling.
We can obtain a first estimate of the strength ofthis coupling from the energy difference between FMand AFM orientations for configuration O1. This en-ergy difference is directly related to the interlayer cou-pling if one assumes that the coupling of the two Fe3+
cations through the perovskite layer is negligible. Thisseems reasonable, since the corresponding superexchangepath involves a total of 8 TM-O bonds. We obtainJinterlayer = 0.6 eV, which is small but comparable withthe weak next-nearest-neighbor coupling. However, wenote that further calculations with a doubled unit cellcontaining 96 atoms are necessary to double-check thisresult and obtain a more accurate estimate of the inter-layer coupling.
IV. SUMMARY AND CONCLUSIONS
In summary, we have calculated from first-principlesthe basic stuctural, ferroelectric, and magnetic proper-ties of the Aurivillius phase Bi5FeTi3O15. We have alsoaddressed a potential site preference of the Fe3+ and Ti4+
cations within the perovskite-like layers and discussed thepossibility for magnetic long-range order within this ma-terial.
After systematically comparing our results obtainedwithin PBE and PBEsol with available experimentaldata, we conclude that the PBEsol exchange-correlationfunctional provides an excellent description of the struc-tural degrees of freedom in Bi5FeTi3O15, superior toPBE, and we suggest to use PBEsol for further DFTstudies of related members of the Aurivillius family.
Our results show that there is a preference for the Fe3+
cations to occupy the inner sites within the perovskite-like layers, consistent with recent Mossbauer data.22 Wehave also shown that this site preference depends stronglyon the lattice constants and reverses to an outer site pref-erence for the slightly more extended lattice parameterswithin PBE. In addition, the c/a ratio of the crystallo-graphic unit cell is systematically larger for configura-tions where Fe3+ occupies the outer sites. This suggeststhe possibility to control the site occupancies via epitax-
ial strain in thin films of Bi5FeTi3O15.
Moreover, we calculate a large value of 55µC/cm2 forthe spontaneous electric polarization, which shows thatthe presence of the nominally non-ferroelectric magneticFe3+ cation does not impede the ferroelectricity in thisAurivillius system.
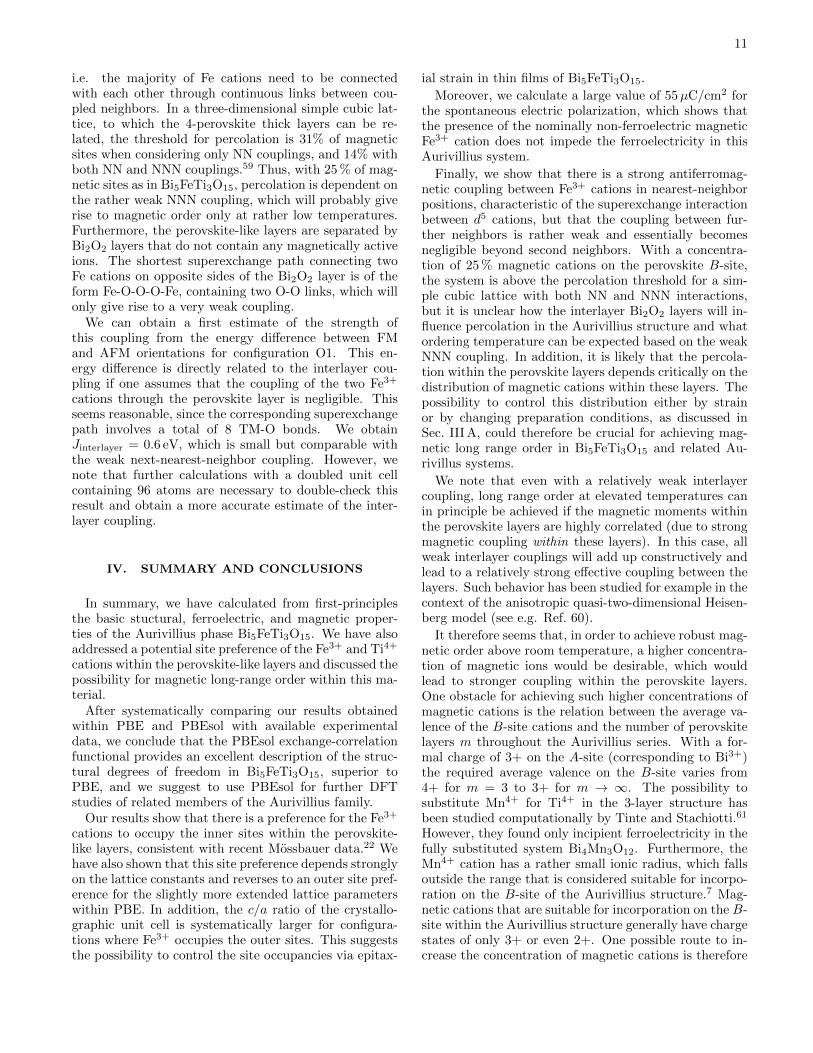
Finally, we show that there is a strong antiferromag-netic coupling between Fe3+ cations in nearest-neighborpositions, characteristic of the superexchange interactionbetween d5 cations, but that the coupling between fur-ther neighbors is rather weak and essentially becomesnegligible beyond second neighbors. With a concentra-tion of 25 % magnetic cations on the perovskite B-site,the system is above the percolation threshold for a sim-ple cubic lattice with both NN and NNN interactions,but it is unclear how the interlayer Bi2O2 layers will in-fluence percolation in the Aurivillius structure and whatordering temperature can be expected based on the weakNNN coupling. In addition, it is likely that the percola-tion within the perovskite layers depends critically on thedistribution of magnetic cations within these layers. Thepossibility to control this distribution either by strainor by changing preparation conditions, as discussed inSec. III A, could therefore be crucial for achieving mag-netic long range order in Bi5FeTi3O15 and related Au-rivillus systems.
We note that even with a relatively weak interlayercoupling, long range order at elevated temperatures canin principle be achieved if the magnetic moments withinthe perovskite layers are highly correlated (due to strongmagnetic coupling within these layers). In this case, allweak interlayer couplings will add up constructively andlead to a relatively strong effective coupling between thelayers. Such behavior has been studied for example in thecontext of the anisotropic quasi-two-dimensional Heisen-berg model (see e.g. Ref. 60).
It therefore seems that, in order to achieve robust mag-netic order above room temperature, a higher concentra-tion of magnetic ions would be desirable, which wouldlead to stronger coupling within the perovskite layers.One obstacle for achieving such higher concentrations ofmagnetic cations is the relation between the average va-lence of the B-site cations and the number of perovskitelayers m throughout the Aurivillius series. With a for-mal charge of 3+ on the A-site (corresponding to Bi3+)the required average valence on the B-site varies from4+ for m = 3 to 3+ for m → ∞. The possibility tosubstitute Mn4+ for Ti4+ in the 3-layer structure hasbeen studied computationally by Tinte and Stachiotti.61
However, they found only incipient ferroelectricity in thefully substituted system Bi4Mn3O12. Furthermore, theMn4+ cation has a rather small ionic radius, which fallsoutside the range that is considered suitable for incorpo-ration on the B-site of the Aurivillius structure.7 Mag-netic cations that are suitable for incorporation on the B-site within the Aurivillius structure generally have chargestates of only 3+ or even 2+. One possible route to in-crease the concentration of magnetic cations is therefore
12
to focus on compositions with a higher number of per-ovskite layers, i.e. m > 4. Indeed, magnetic long rangeorder has been reported for several m = 5 systems.12,18
Another possibility to increasing the Fe3+ content (ormore generally the content of magnetic 3+ cations) inthe m = 4 layer system would be to simultaneously re-place Ti4+ by other B-site cations with higher valence,such as Ta5+, Nb5+, or W6+, leading to compositionssuch as Bi5Fe1+xTi3−2xNbxO15.
We conclude, that the Aurivillius family is a promisingclass of compounds to search for new multiferroics withgood ferroelectric and magnetic properties. The mainchallenge is to increase the content of magnetic cations,in order to obtain robust magnetic long range order atelevated temperatures. The Aurivillius family providesenough chemical flexibility to explore new compositionsthat are promising in that respect. Our results indicate
that it is conceivable to have ferroelectricity coexist withlong-range magnetic order, and we hope that our workwill stimulate further research on Aurivillius compoundsas potential room-temperature multiferroics.
ACKNOWLEDGMENTS
This work was supported by the Swiss National Sci-ence Foundation under project no. 200021 141357, byETH Zurich, and by Science Foundation Ireland throughthe FORME project. We thank Lynette Keeney, RogerWhatmore, and Martyn Pemble from the Tyndall Na-tional Institute in Cork, Ireland, for many important dis-cussions and for pointing our attention to the Aurivilliusphases as potential multiferroics. We also thank EricBousquet for many useful discussions.
∗ [email protected]† [email protected] N. A. Spaldin and M. Fiebig, Science 309, 391 (2005).2 W. Eerenstein, N. D. Mathur, and J. F. Scott, Nature
442, 759 (2006).3 S.-W. Cheong and M. Mostovoy, Nature Materials 6, 13
(2007).4 R. Ramesh and N. A. Spaldin, Nature Materials 6, 21
(2007).5 N. A. Spaldin, S.-W. Cheong, and R. Ramesh, Physics
Today 63, 38 (2010).6 K. Momma and F. Izumi, Journal of Applied Crystallog-
raphy 44, 1272 (2011).7 R. E. Newnham, R. W. Wolfe, and J. F. Dorrian, Mat.
Res. Bull. 6, 1029 (1971).8 C. A. Paz de Araujo, J. D. Cuchiaro, L. D. McMillan, M. C.
Scott, and J. F. Scott, Nature 374, 627 (1995).9 B. H. Park, B. S. Kang, S. D. Bu, T. W. Noh, J. Lee, and
W. Jo, Nature 401, 692 (1999).10 X. Mao, W. Wang, X. Chen, and Y. Lu, Appl. Phys. Lett.
95, 082901 (2009).11 X. Chen, J. Xiao, Y. Xue, X. Zeng, F. Yang, and P. Su,
Ceramics International 40, 2635 (2014).12 L. Keeney, T. Maity, M. Schmidt, A. Amann, N. Deepak,
N. Petkov, S. Roy, M. E. Pemble, and R. W. Whatmore,J. Am. Ceram. Soc. 96, 2339 (2013).
13 W. Bai, J. Zhu, J. Wang, T. Lin, J. Yang, X. Meng,X. Tang, Z. Zhu, and J. Chu, Journal of Magnetism andMagnetic Materials 324, 2265 (2012).
14 X. Mao, W. Wang, H. Sun, Y. Lu, and X. Chen, J MaterSci 47, 2960 (2012).
15 L. Keeney, S. Kulkarni, N. Deepak, M. Schmidt, N. Petkov,P. F. Zhang, S. Cavill, S. Roy, M. E. Pemble, and R. W.Whatmore, Journal of Applied Physics 112, 052010 (2012).
16 A. Srinivas, S. V. Suryanarayana, G. S. Kumar, and M. M.Kumar, J. Phys.: Condens. Matter 11, 3335 (2011).
17 X. W. Dong, K. F. Wang, J. G. Wan, J. S. Zhu, and J.-M.Liu, Journal of Applied Physics 103, 094101 (2008).
18 E. Jartych, T. Pikula, M. Mazurek, A. Lisinska-Czekaj,D. Czekaj, K. Gaska, J. Przewoznik, C. Kapusta, andZ. Surowiec, Journal of Magnetism and Magnetic Materials
342, 27 (2013).19 G. Chen, W. Bai, L. Sun, J. Wu, Q. Ren, W. Xu, J. Yang,
X. Meng, X. Tang, C.-G. Duan, and et al., Journal ofApplied Physics 113, 034901 (2013).
20 J. M. Perez-Mato, P. Blaha, K. Schwarz, M. Aroyo,D. Orobengoa, I. Etxebarria, and A. Garcia, Phys. Rev.B 77, 184104 (2008).
21 C. H. Hervoches, A. Snedden, R. Riggs, S. H. Kilcoyne,P. Manuel, and P. Lightfoot, J. Solid State Chem. 164,280 (2002).
22 N. Lomanova, V. Semenov, V. Panchuk, and V. Gusarov,Journal of Alloys and Compounds 528, 103 (2012).
23 Note that strictly speaking the space group notationA21am implies a setting where the polar screw axis 21
is along the ~a direction, whereas in our calculations we use
a setting with the polar axis along ~b. For consistency withthe literature we nevertheless use A21am to denote spacegroup no. 36 within this article.
24 G. Kresse and J. Furthmuller, Comput. Mat. Sci. 6, 15(1996).
25 G. Kresse and D. Joubert, Phys. Rev. B 59, 1758 (1999).26 J. P. Perdew, K. Burke, and M. Ernzerhof, Phys. Rev.
Lett. 77, 3865 (1996).27 J. Perdew, A. Ruzsinszky, G. Csonka, O. Vydrov, G. Scuse-
ria, L. Constantin, X. Zhou, and K. Burke, Physical Re-view Letters 100, 136406 (2008).
28 V. I. Anisimov, F. Aryasetiawan, and A. I. Liechtenstein,J. Phys.: Condens. Matter 9, 767 (1997).
29 J. B. Neaton, C. Ederer, U. V. Waghmare, N. A. Spaldin,and K. M. Rabe, Phys. Rev. B 71, 014113 (2005).
30 I. Kornev, S. Lisenkov, R. Haumont, B. Dkhil, and L. Bel-laiche, Physical Review Letters 99, 227602 (2007).
31 A. J. Hatt, N. A. Spaldin, and C. Ederer, Phys. Rev. B81, 054109 (2010).
32 O. Dieguez, O. E. Gonzalez-Vazquez, J. C. Wojde l, andJ. Iniguez, Phys. Rev. B 83, 094105 (2011).
33 R. J. Zeches, M. D. Rossell, J. X. Zhang, A. J. Hatt,Q. He, C.-H. Yang, A. Kumar, C. H. Wang, A. Melville,C. Adamo, G. Sheng, Y.-H. Chu, J. F. Ihlefeld, R. Erni,C. Ederer, V. Gopalan, L. Q. Chen, D. G. Schlom, N. A.Spaldin, L. W. Martin, and R. Ramesh, Science 326, 977
13
(2009).34 H. Bea, B. Dupe, S. Fusil, R. Mattana, E. Jacquet,
B. Warot-Fonrose, F. Wilhelm, A. Rogalev, S. Petit,V. Cros, A. Anane, F. Petroff, K. Bouzehouane, G. Gen-este, B. Dkhil, S. Lisenkov, I. Ponomareva, L. Bellaiche,M. Bibes, and A. Barthelemy, Physical Review Letters102, 217603 (2009).
35 S. Nakashima, H. Fujisawa, S. Ichikawa, J. M. Park,T. Kanashima, M. Okuyama, and M. Shimizu, Journalof Applied Physics 108, 074106 (2010).
36 M. E. Montero-Cabrera, M. Garcia-Guaderrama,A. Mehta, S. Webb, L. Fuentes-Montero, J. A.Duarte Moller, and L. Fuentes-Cobas, Revista Mex-icana De Fısica S 54, 42 (2008).
37 A. T. Giddings, M. C. Stennett, D. P. Reid, E. E. McCabe,C. Greaves, and N. C. Hyatt, J. Solid State Chem. 184,252 (2011).
38 I. B. Bersuker, Electronic Structure and Properties of Tran-sition Metal Compounds (John Wiley & Sons, Inc., 2010).
39 J. M. Perez-Mato, D. Orobengoa, and M. I. Aroyo, ActaCryst A 66, 558590 (2010).
40 D. Orobengoa, C. Capillas, M. I. Aroyo, and J. M. Perez-Mato, J Appl Cryst 42, 820833 (2009).
41 S. Ivantchev, E. Kroumova, G. Madariaga, J. M. Perez-Mato, and M. Aroyo, Journal of Applied Crystallography33, 1190 (2000).
42 J. Perez-Mato, M. Aroyo, A. Garca, P. Blaha, K. Schwarz,J. Schweifer, and K. Parlinski, Phys. Rev. B 70, 214111(2004).
43 M. Stachiotti, C. Rodriguez, C. Ambrosch-Draxl, andN. Christensen, Phys. Rev. B 61, 1443414439 (2000).
44 R. Machado, M. G. Stachiotti, R. L. Migoni, and A. H.Tera, Phys. Rev. B 70, 214112 (2004).
45 H. Djani, E. Bousquet, A. Kellou, and P. Ghosez, Phys.
Rev. B 86, 054107 (2012).46 P. Ghosez, X. Gonze, and J.-P. Michenaud, Europhys.
Lett. 33, 713 (1996).47 S. Bhattacharjee, E. Bousquet, and P. Ghosez, Phys. Rev.
Lett. 102, 117602 (2009).48 C. Ederer, T. Harris, and R. Kovacik, Phys. Rev. B 83,
054110 (2011).49 R. D. King-Smith and D. Vanderbilt, Phys. Rev. B 47,
1651 (1993).50 D. Vanderbilt and R. D. King-Smith, Phys. Rev. B 48,
4442 (1993).51 R. Resta, Rev. Mod. Phys. 66, 899 (1994).52 N. A. Spaldin, Journal of Solid State Chemistry 195, 210
(2012).53 S. E. Cummins, Journal of Applied Physics 39, 2268
(1968).54 S. H. Shah and P. D. Bristowe, Journal of Physics-
Condensed Matter 22, 385902 (2010).55 P. Ghosez, J. P. Michenaud, and X. Gonze, Phys. Rev. B
58, 6224 (1998).56 P. W. Anderson, in Magnetism, Vol. 1, edited by G. T.
Rado and H. Suhl (Academic Press, 1963) Chap. 2, pp.25–83.
57 J. B. Goodenough, Magnetism and the Chemical Bond (In-terscience Publishers, New York, 1963).
58 P. Baettig, C. Ederer, and N. A. Spaldin, Phys. Rev. B72, 214105 (2005).
59 L. Kurzawski and K. Malarz, Reports on MathematicalPhysics 70, 163 (2012).
60 C. Yasuda, S. Todo, K. Hukushima, F. Alet, M. Keller,M. Troyer, and H. Takayama, Physical Review Letters94, 217201 (2005).
61 S. Tinte and M. G. Stachiotti, Physical Review B 85(2012).