Embed Size (px)
Citation preview
The Power of Financial Mgt. Process Improvement
APQC’s Process Conference Workshop Presentation Mary Driscoll, Senior Research Fellow October 25, 2012
3 ©2012 APQC. ALL RIGHTS RESERVED.
Today’s Agenda
Trends in FM process improvement (PI) Ways to assess investments in change Large investments must align with strategic objectives and decision-support needs of the business Cases and best practices
4 ©2012 APQC. ALL RIGHTS RESERVED.
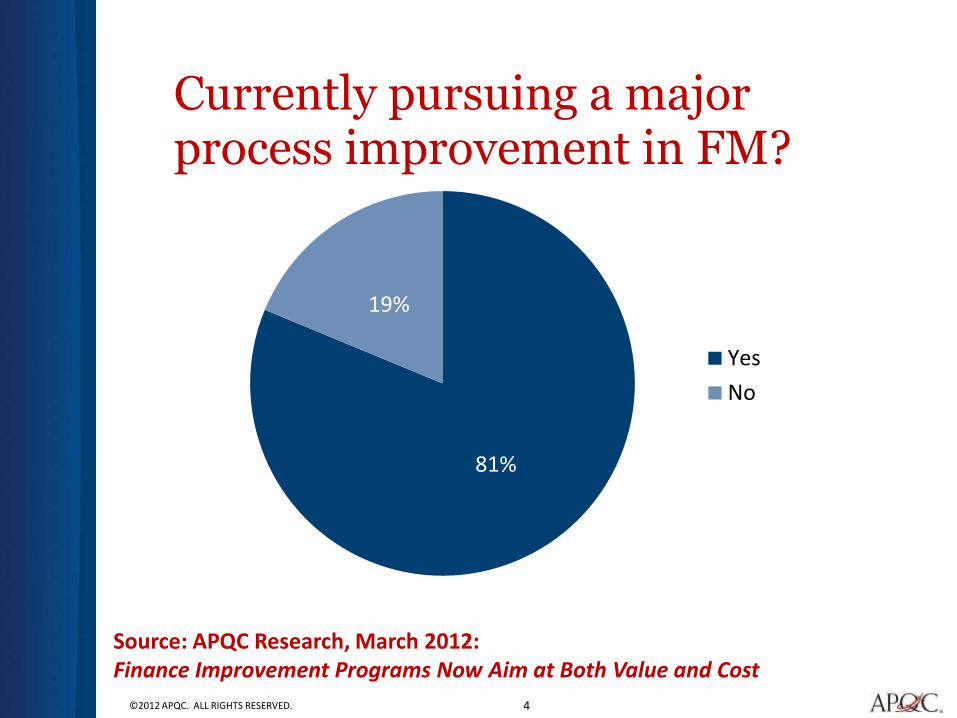
81%
19%
Currently pursuing a major process improvement in FM?
Yes
No
Source: APQC Research, March 2012: Finance Improvement Programs Now Aim at Both Value and Cost

5 ©2012 APQC. ALL RIGHTS RESERVED.
72%
16%
11%
1%
Both efficiency and effectiveness
Efficiency (improve financecost/productivity profile, acceleratecycle speed, reduce error rates)
Effectiveness (deliver moreeffective analytical support to thebusiness)
Don’t know
Top Priority?
Source: APQC Research, March 2012: Finance Improvement Programs Now Aim at Both Value and Cost
6 ©2012 APQC. ALL RIGHTS RESERVED.
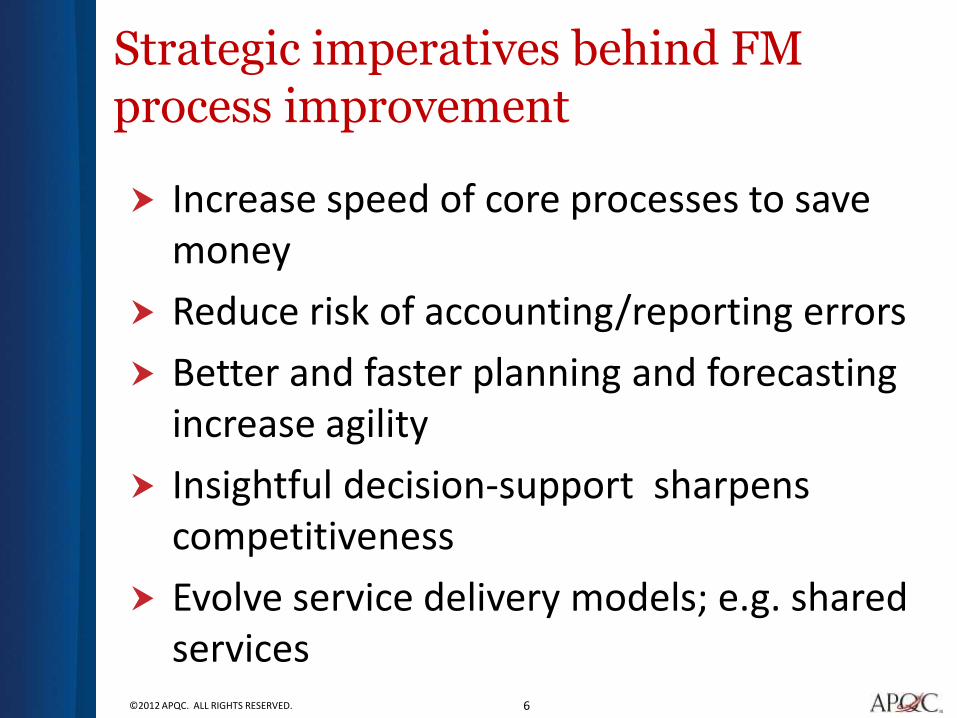
Strategic imperatives behind FM process improvement
Increase speed of core processes to save money
Reduce risk of accounting/reporting errors
Better and faster planning and forecasting increase agility
Insightful decision-support sharpens competitiveness
Evolve service delivery models; e.g. shared services

7 ©2012 APQC. ALL RIGHTS RESERVED.
3 Goals of FM Process Improvement
1. Classic efficiency gains:
Can you do more with less?
Can you go faster?
Can you avoid error?
2. Business partner effectiveness:
Guidance on pricing, ABC, M&A, etc.
3. Create value for shareholders
8 ©2012 APQC. ALL RIGHTS RESERVED.
Classic Efficiency Gains: Finance Gets the Direct Benefit
Faster
Better
Cheaper
Do more with less people

9 ©2012 APQC. ALL RIGHTS RESERVED.
Total Cost of Finance as a Percentage of Revenue - All Participants
2.18%
1.17%
0.62%
0.0%
0.5%
1.0%
1.5%
2.0%
2.5%
Bottom Performers Median Top Performers
N = 524
10 ©2012 APQC. ALL RIGHTS RESERVED.
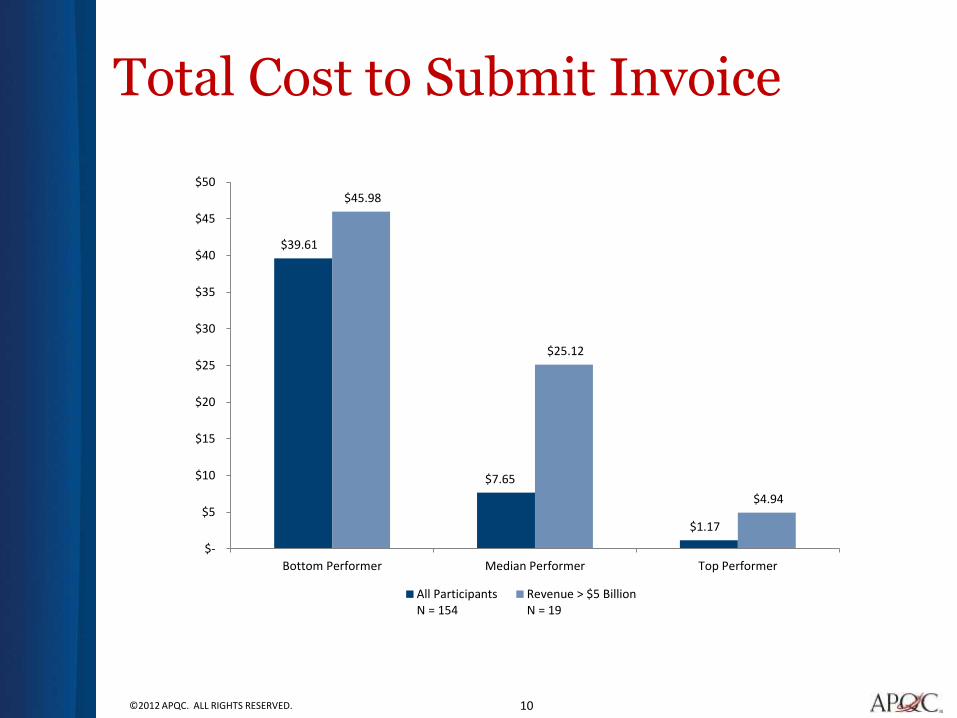
Total Cost to Submit Invoice
$39.61
$7.65
$1.17
$45.98
$25.12
$4.94
$-
$5
$10
$15
$20
$25
$30
$35
$40
$45
$50
Bottom Performer Median Performer Top Performer
All ParticipantsN = 154
Revenue > $5 BillionN = 19
11 ©2012 APQC. ALL RIGHTS RESERVED.
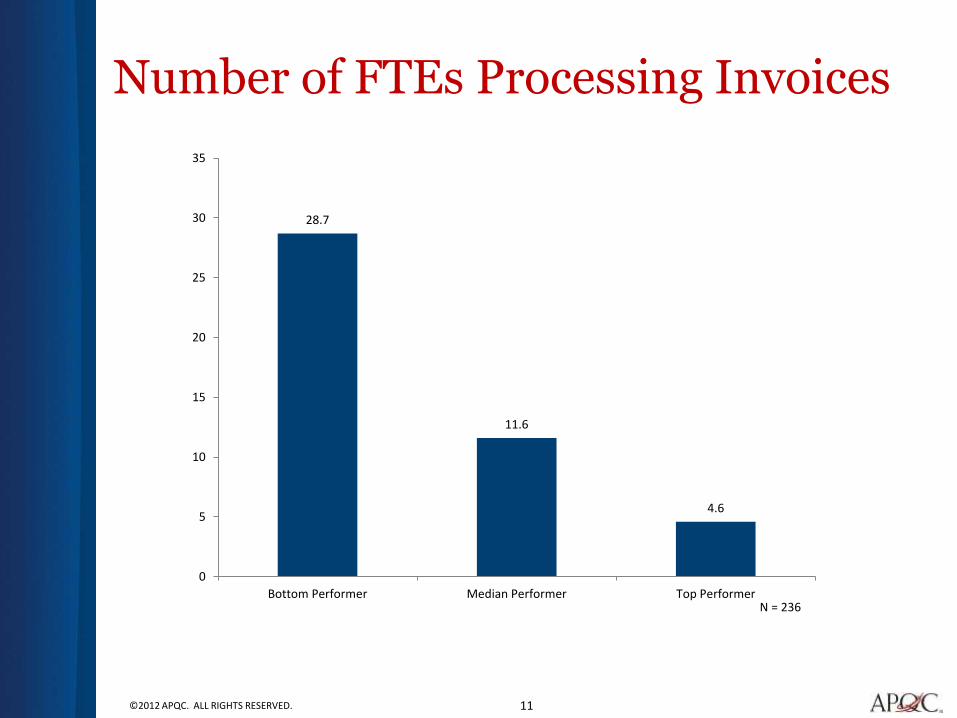
Number of FTEs Processing Invoices
28.7
11.6
4.6
0
5
10
15
20
25
30
35
Bottom Performer Median Performer Top PerformerN = 236
12 ©2012 APQC. ALL RIGHTS RESERVED.
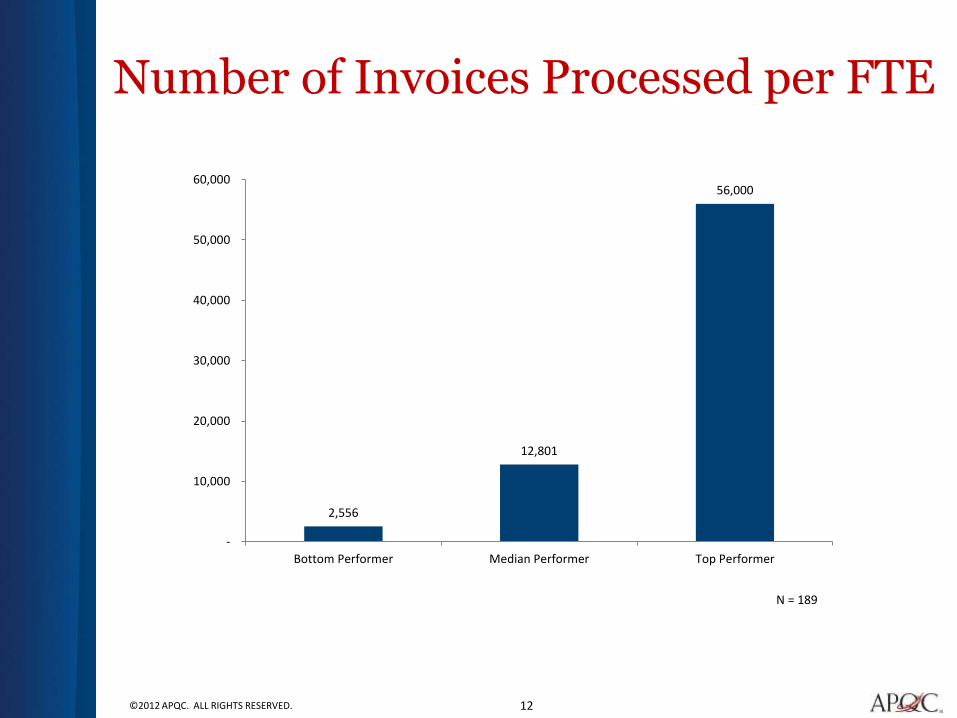
Number of Invoices Processed per FTE
2,556
12,801
56,000
-
10,000
20,000
30,000
40,000
50,000
60,000
Bottom Performer Median Performer Top Performer
N = 189
13 ©2012 APQC. ALL RIGHTS RESERVED.
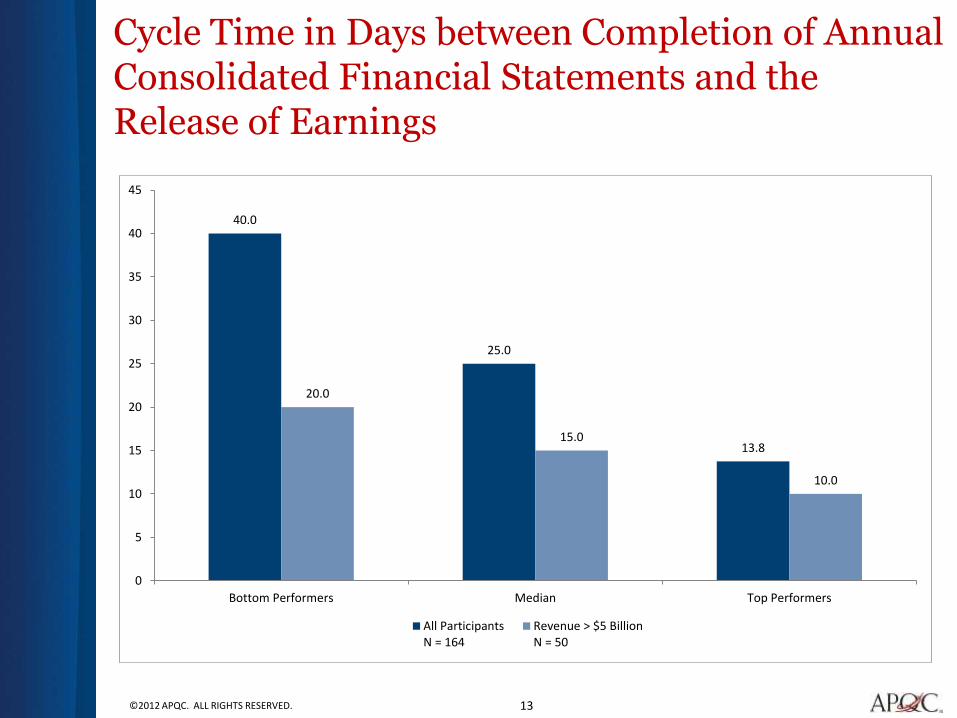
Cycle Time in Days between Completion of Annual Consolidated Financial Statements and the Release of Earnings
40.0
25.0
13.8
20.0
15.0
10.0
0
5
10
15
20
25
30
35
40
45
Bottom Performers Median Top Performers
All ParticipantsN = 164
Revenue > $5 BillionN = 50
14 ©2012 APQC. ALL RIGHTS RESERVED.
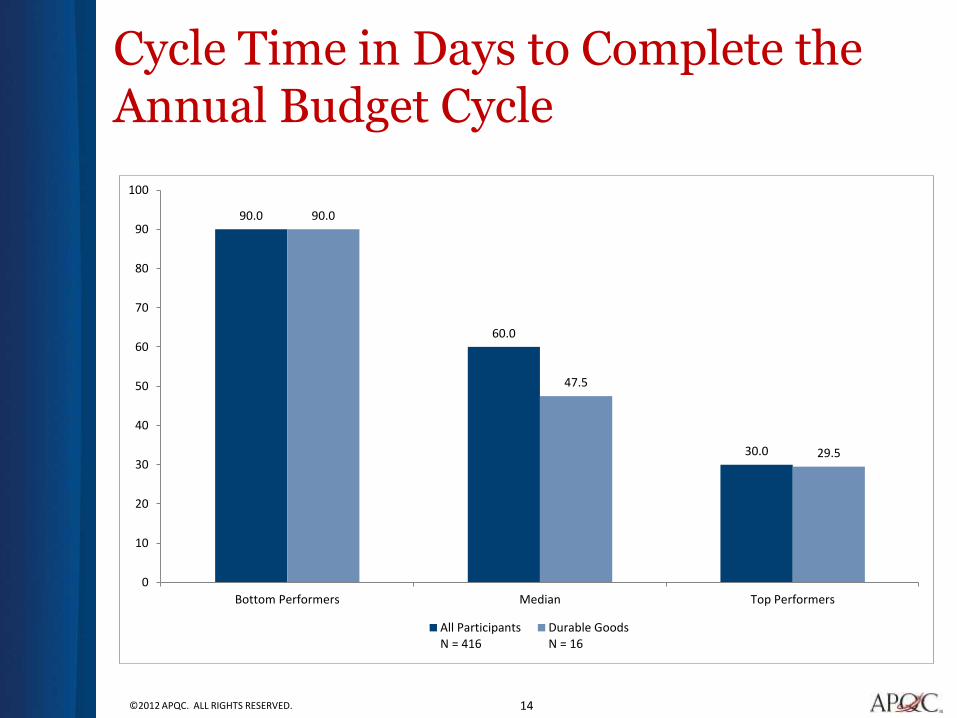
Cycle Time in Days to Complete the Annual Budget Cycle
90.0
60.0
30.0
90.0
47.5
29.5
0
10
20
30
40
50
60
70
80
90
100
Bottom Performers Median Top Performers
All ParticipantsN = 416
Durable GoodsN = 16
15 ©2012 APQC. ALL RIGHTS RESERVED.
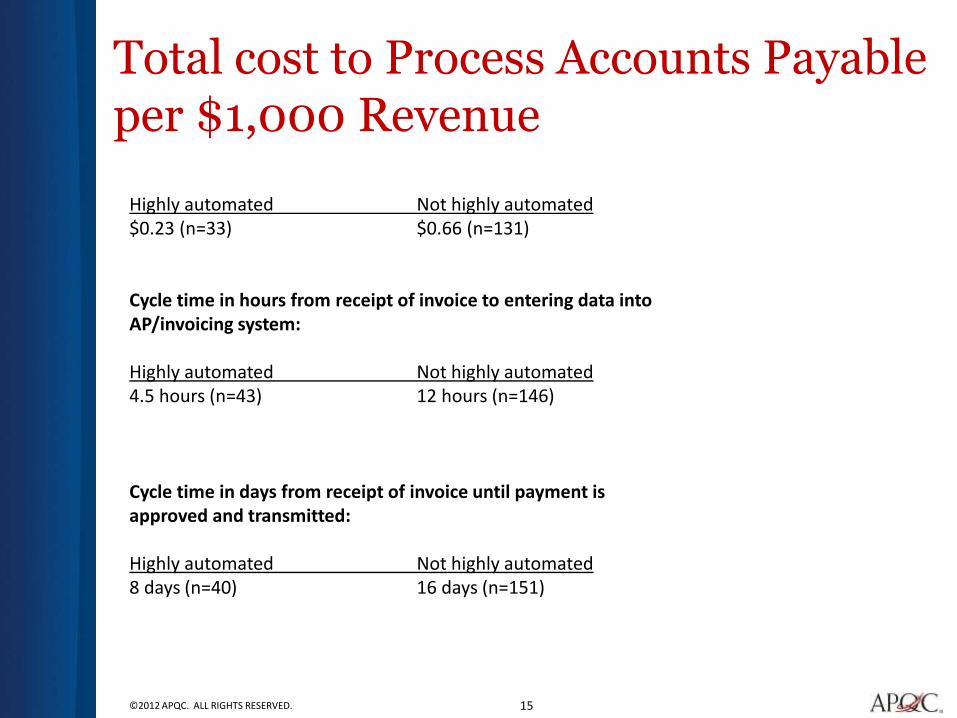
Total cost to Process Accounts Payable per $1,000 Revenue
Highly automated Not highly automated $0.23 (n=33) $0.66 (n=131)
Cycle time in hours from receipt of invoice to entering data into AP/invoicing system:
Highly automated Not highly automated 4.5 hours (n=43) 12 hours (n=146)
Cycle time in days from receipt of invoice until payment is approved and transmitted:
Highly automated Not highly automated 8 days (n=40) 16 days (n=151)
16 ©2012 APQC. ALL RIGHTS RESERVED.
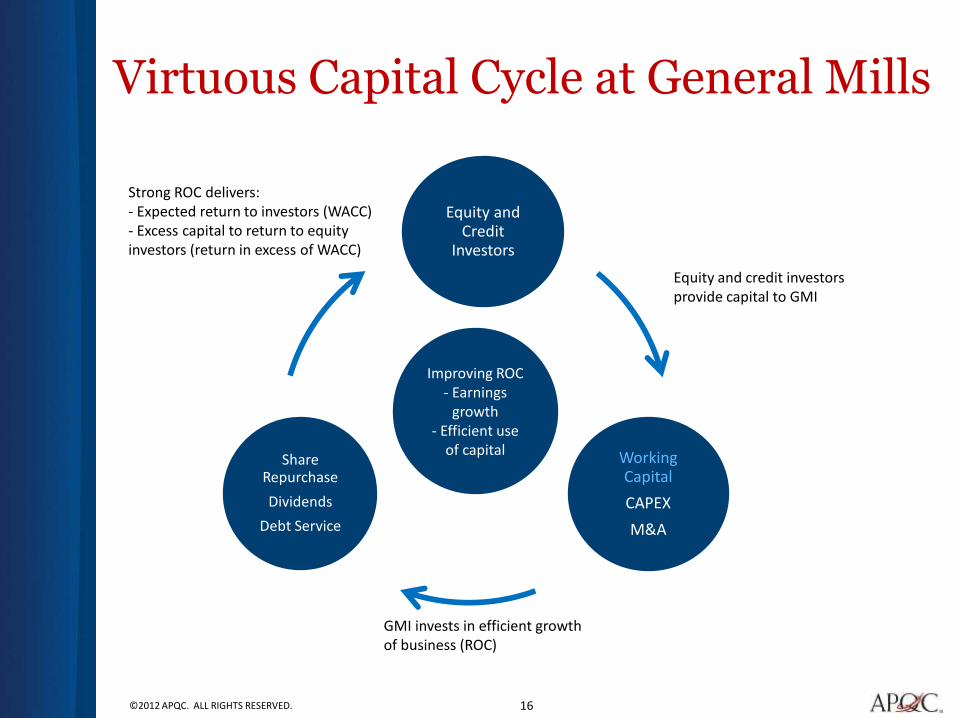
Virtuous Capital Cycle at General Mills
Equity and Credit
Investors
Working Capital
CAPEX
M&A
Share Repurchase
Dividends
Debt Service
GMI invests in efficient growth of business (ROC)
Strong ROC delivers: - Expected return to investors (WACC) - Excess capital to return to equity investors (return in excess of WACC)
Improving ROC - Earnings
growth - Efficient use
of capital
Equity and credit investors provide capital to GMI
17 ©2012 APQC. ALL RIGHTS RESERVED.
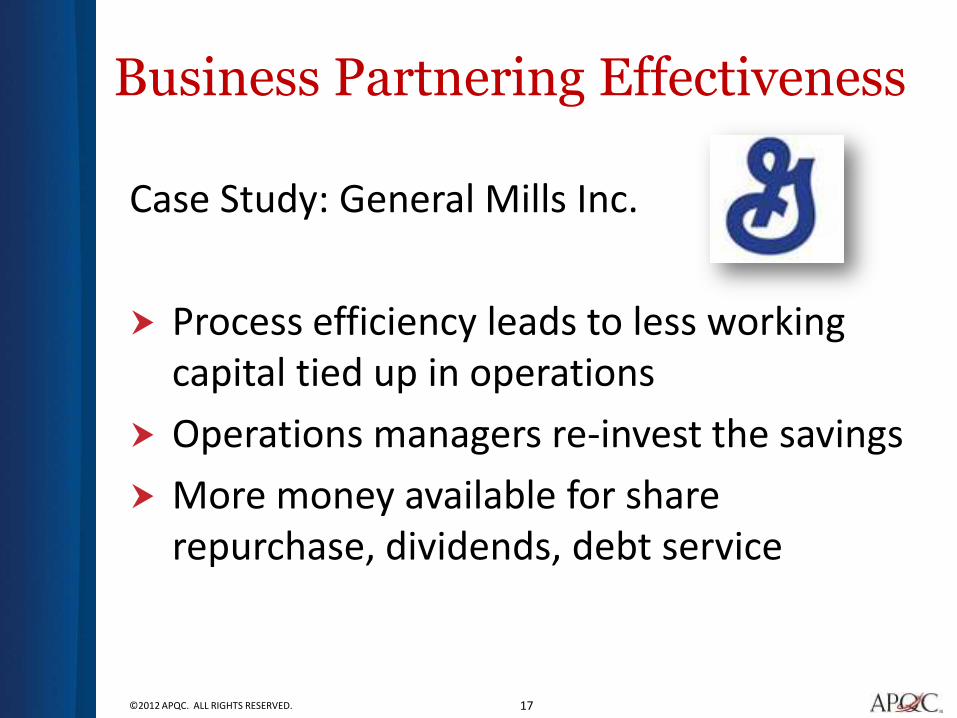
Business Partnering Effectiveness
Case Study: General Mills Inc.
Process efficiency leads to less working capital tied up in operations
Operations managers re-invest the savings
More money available for share repurchase, dividends, debt service
18 ©2012 APQC. ALL RIGHTS RESERVED.
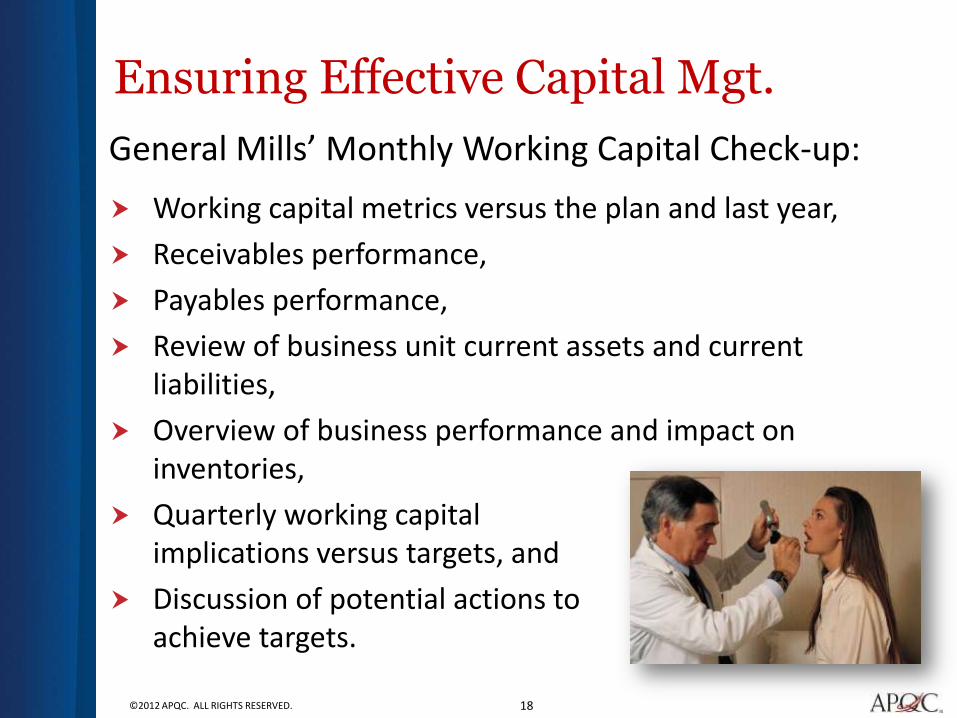
Ensuring Effective Capital Mgt.
Working capital metrics versus the plan and last year,
Receivables performance,
Payables performance,
Review of business unit current assets and current liabilities,
Overview of business performance and impact on inventories,
Quarterly working capital implications versus targets, and
Discussion of potential actions to achieve targets.
General Mills’ Monthly Working Capital Check-up:
19 ©2012 APQC. ALL RIGHTS RESERVED.
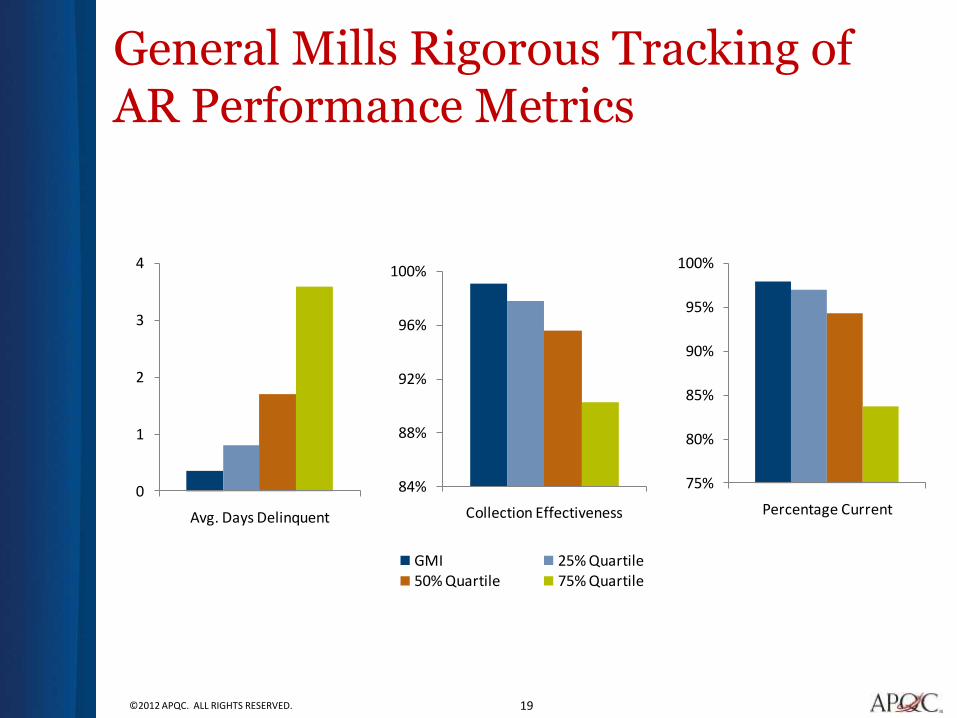
General Mills Rigorous Tracking of AR Performance Metrics
0
1
2
3
4
Avg. Days Delinquent
84%
88%
92%
96%
100%
Collection Effectiveness
GMI 25% Quartile50% Quartile 75% Quartile
75%
80%
85%
90%
95%
100%
Percentage Current

20 ©2012 APQC. ALL RIGHTS RESERVED.
General Mills AP Best Practices
Hybrid service delivery model puts the right people in the right jobs
Leverage IT to drive efficiencies
P-card for indirect spending
Win-win terms and discount options
21 ©2012 APQC. ALL RIGHTS RESERVED.
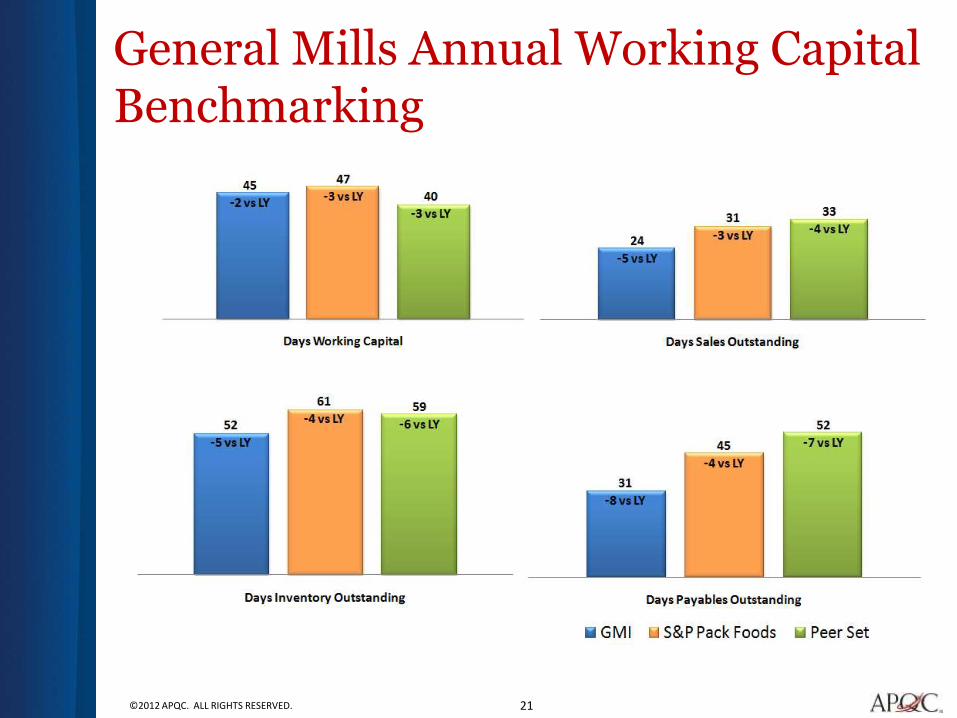
General Mills Annual Working Capital Benchmarking
22 ©2012 APQC. ALL RIGHTS RESERVED.
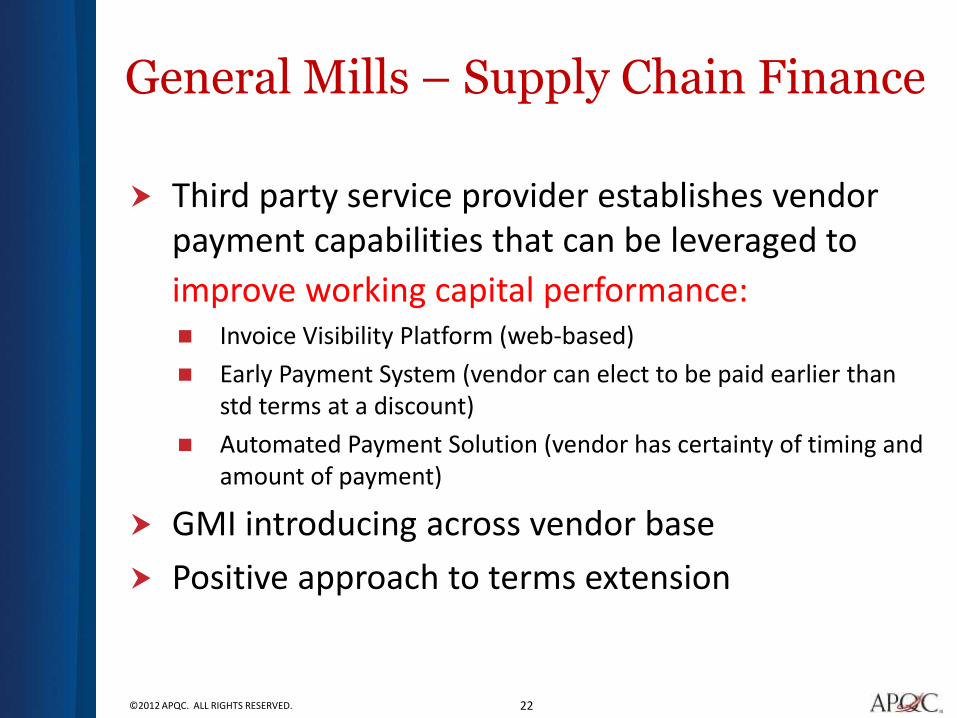
General Mills – Supply Chain Finance
Third party service provider establishes vendor payment capabilities that can be leveraged to
improve working capital performance: Invoice Visibility Platform (web-based)
Early Payment System (vendor can elect to be paid earlier than std terms at a discount)
Automated Payment Solution (vendor has certainty of timing and amount of payment)
GMI introducing across vendor base
Positive approach to terms extension
23 ©2012 APQC. ALL RIGHTS RESERVED.
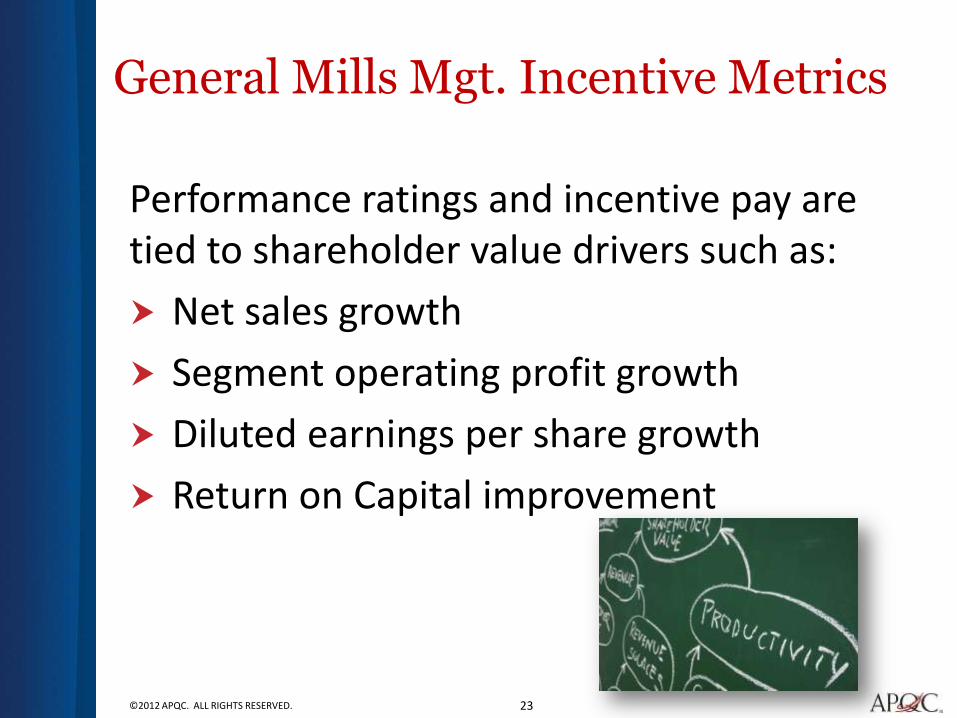
General Mills Mgt. Incentive Metrics
Performance ratings and incentive pay are tied to shareholder value drivers such as:
Net sales growth
Segment operating profit growth
Diluted earnings per share growth
Return on Capital improvement
24 ©2012 APQC. ALL RIGHTS RESERVED.
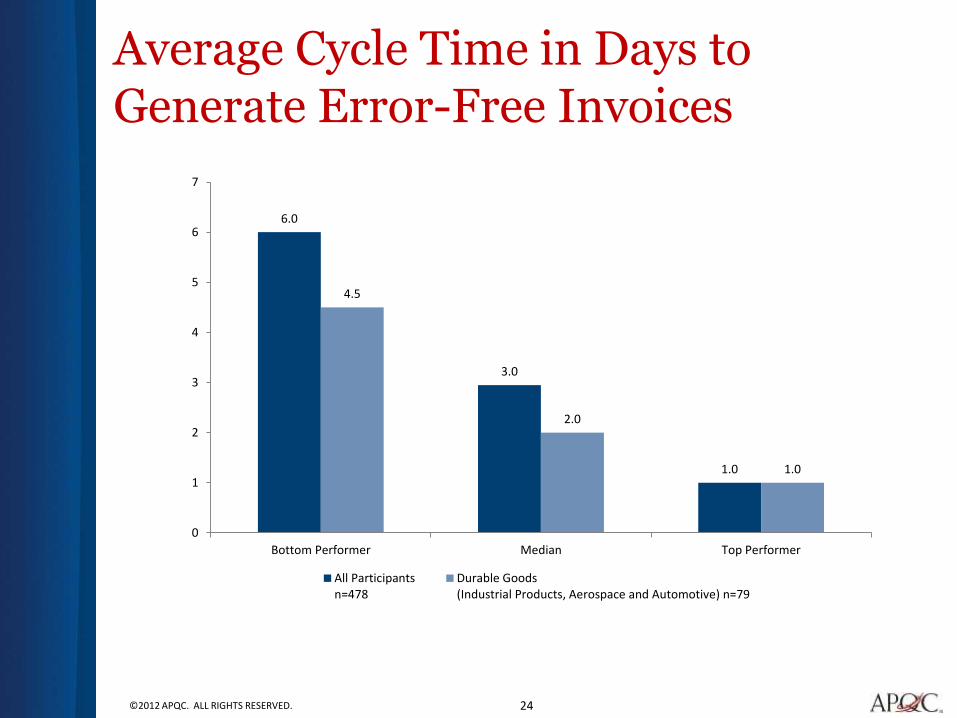
6.0
3.0
1.0
4.5
2.0
1.0
0
1
2
3
4
5
6
7
Bottom Performer Median Top Performer
All Participantsn=478
Durable Goods(Industrial Products, Aerospace and Automotive) n=79
Average Cycle Time in Days to Generate Error-Free Invoices
25 ©2012 APQC. ALL RIGHTS RESERVED.
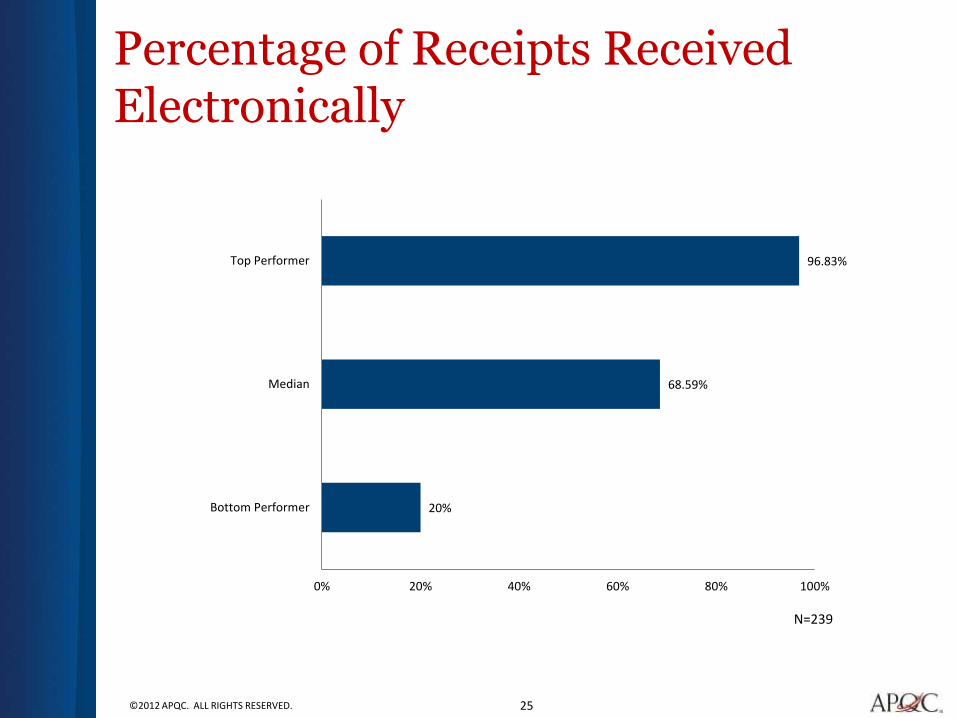
20%
68.59%
96.83%
0% 20% 40% 60% 80% 100%
Bottom Performer
Median
Top Performer
N=239
Percentage of Receipts Received Electronically
26 ©2012 APQC. ALL RIGHTS RESERVED.
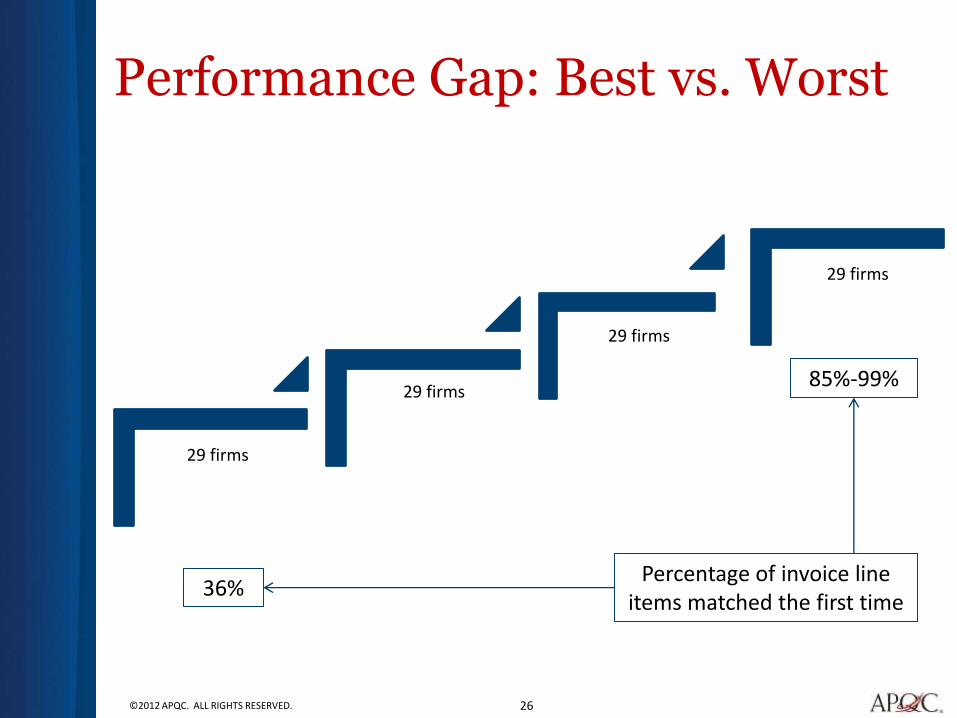
Performance Gap: Best vs. Worst
29 firms
29 firms
29 firms
29 firms
36% Percentage of invoice line
items matched the first time
85%-99%
27 ©2012 APQC. ALL RIGHTS RESERVED.
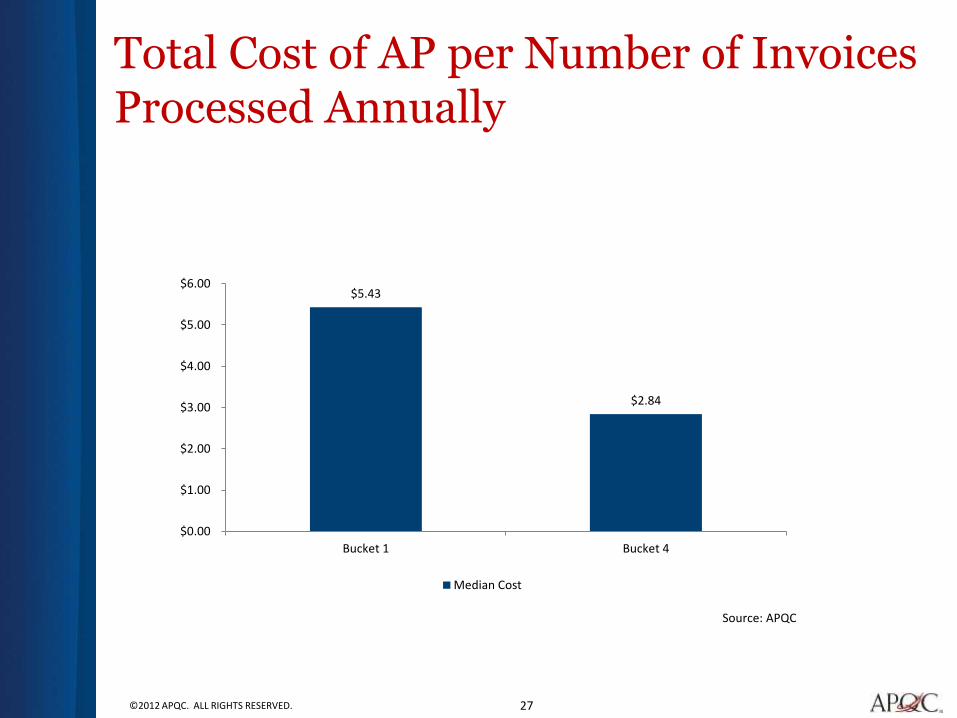
Total Cost of AP per Number of Invoices Processed Annually
$5.43
$2.84
$0.00
$1.00
$2.00
$3.00
$4.00
$5.00
$6.00
Bucket 1 Bucket 4
Median Cost
Source: APQC

28 ©2012 APQC. ALL RIGHTS RESERVED.
Key Takeaways!
Low-growth requires more precision in performance and value management
Business needs advanced analyses; e.g. cost/service model or risk co-relations
CFOs use savings from FM PI to fund the move up the analytics maturity curve
Various ways to assess value of PI
Best practices in FM transformation
Question & Answer
If you think of others, just contact us.

30 ©2012 APQC. ALL RIGHTS RESERVED.
Mary Driscoll
Senior Research Fellow
APQC
713-685-7255
For follow-up: