Embed Size (px)
Citation preview
The Power of Optimal Control in Biological Systems Suzanne Lenhart
The Power of Optimal Control in Biological
Systems
Suzanne Lenhart
August 13, 2012
The Power of Optimal Control in Biological Systems Suzanne Lenhart
Outline
Background, some about UT and some about me
Viewpoint on Models
Cardiopulmonary Resuscitation
Rabies in Raccoons
More current work

The Power of Optimal Control in Biological Systems Suzanne Lenhart
How our Math Biology program got started
Started with one faculty member (Tom Hallam) in late 1970sand added more over 20 years
Developed 100-level math for biology courses
Developed 2-year grad sequence and degree concentration
Organized interdisciplinary seminar every semester for 30 yearswith faculty from many different disciplines
Built interdisciplinary institute (The Institute forEnvironmental Modeling) with links to ORNL
Used TIEM to foster collaborations and attract external funds(no UT funds involved)
Moved-in projects from other units as appropriate
Won the NIMBioS award! summer 2008

The Power of Optimal Control in Biological Systems Suzanne Lenhart
Fellowship Grants!
In the same summer, Cynthia Peterson was awarded the SCALE-ITand PEER grants.
Mentoring Team for PEER students - Lenhart leading the team
The Power of Optimal Control in Biological Systems Suzanne Lenhart
teachers, mentors make a big impact
born to be a teacher
attended Bellarmine College, graduate work at U of Kentucky
went to UT straight from graduate school, spouse support
found great collaborator, Vladimir Protopopescu, at OakRidge National Lab
comfortable with a service role
interested in outreach and REUs for many years
found another great collaborator, Lou Gross, math ecologistat UT
new phase of my life, NIMBioS
work hard, be flexible, willing to work on many things
The Power of Optimal Control in Biological Systems Suzanne Lenhart
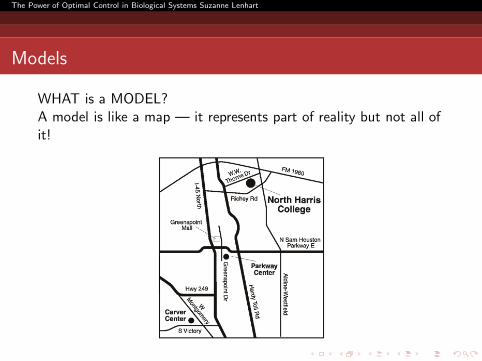
Models
WHAT is a MODEL?A model is like a map — it represents part of reality but not all ofit!
The Power of Optimal Control in Biological Systems Suzanne Lenhart
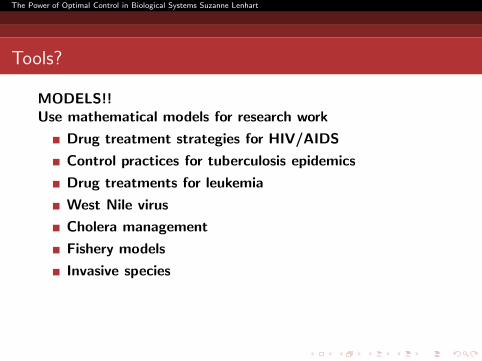
Tools?
MODELS!!Use mathematical models for research work
Drug treatment strategies for HIV/AIDS
Control practices for tuberculosis epidemics
Drug treatments for leukemia
West Nile virus
Cholera management
Fishery models
Invasive species
The Power of Optimal Control in Biological Systems Suzanne Lenhart
Mathematical Models
Inputs to a system of equations are adjusted until the desired goaloutput is obtained.
Optimal control theory is a tool to choose optimal inputs.
Equations involve rates of change and interaction and movementterms among the components of the system.
The Power of Optimal Control in Biological Systems Suzanne Lenhart
Improving Cardiopulmonary Resuscitation
Each year, more than 250,000 people die from cardiac arrest in theUSA alone.
Despite widespread use of cardiopulmonary resuscitation, thesurvival of patients recovering from cardiac arrest remains poor.
The rate of survival for CPR performed out of the hospital is 3%,while for patients who have cardiac arrest in the hospital, the rateof survival is 10-15%.
The Power of Optimal Control in Biological Systems Suzanne Lenhart
Goal
The goal is to improve traditional CPR technique by using optimalcontrol methods.
The standard and various alternative CPR techniques such asinterposed abdominal compression IAC, and Lifestick CPR havebeen represented in various models.
We consider a model for CPR allowing chest and abdomencompression and decompression.
Design optimal PATTERN of compression/decompression!
The Power of Optimal Control in Biological Systems Suzanne Lenhart
Model by Babbs
We apply the optimal control strategy for improving resuscitationrates to a circulation model developed by Babbs. (model -discretein time, with seven compartments)
In his model, heart and blood vessels are represented asresistance-capacitive networks, pressures in the chest and in thevascular components as voltages, blood flow as electric current,and valves .
Reference: Babbs, Circulation 1999.
The Power of Optimal Control in Biological Systems Suzanne Lenhart
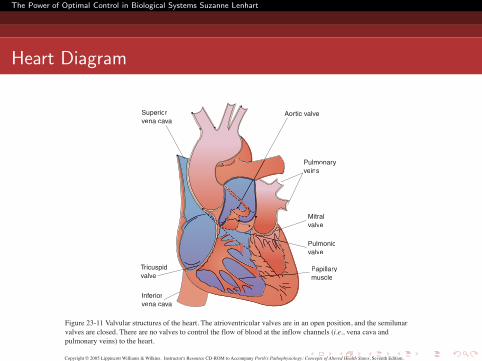
Heart Diagram
Figure 23-11 Valvular structures of the heart. The atrioventricular valves are in an open position, and the semilunar
valves are closed. There are no valves to control the flow of blood at the inflow channels (i.e., vena cava and
pulmonary veins) to the heart.
Copyright © 2005 Lippincott Williams & Wilkins. Instructor's Resource CD-ROM to Accompany Porth's Pathophysiology: Concepts of Altered Health States, Seventh Edition.
Superior
vena cavaAortic valve
Pulmonary
veins
Inferior
vena cava
Mitral
valve
Pulmonic
valve
Tricuspid
valvePapillary
muscle
The Power of Optimal Control in Biological Systems Suzanne Lenhart
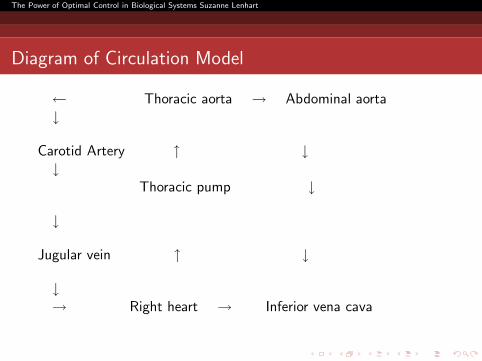
Diagram of Circulation Model
← Thoracic aorta → Abdominal aorta↓
Carotid Artery ↑ ↓↓
Thoracic pump ↓
↓
Jugular vein ↑ ↓
↓→ Right heart → Inferior vena cava
The Power of Optimal Control in Biological Systems Suzanne Lenhart
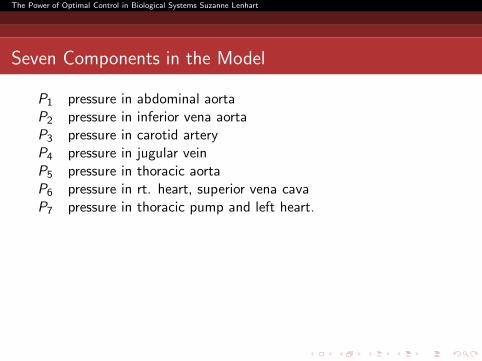
Seven Components in the Model
P1 pressure in abdominal aortaP2 pressure in inferior vena aortaP3 pressure in carotid arteryP4 pressure in jugular veinP5 pressure in thoracic aortaP6 pressure in rt. heart, superior vena cavaP7 pressure in thoracic pump and left heart.
The Power of Optimal Control in Biological Systems Suzanne Lenhart
Goal for this model
Design compression/depression patterns for chest and abdomenpressures
To increase pressure differences across thoracic aorta and rightheart
SPP - Systemic Prefussion Pressure
The Power of Optimal Control in Biological Systems Suzanne Lenhart
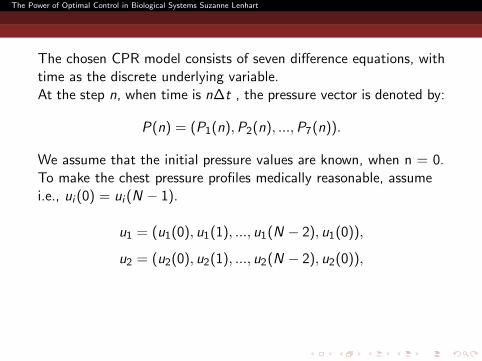
The chosen CPR model consists of seven difference equations, withtime as the discrete underlying variable.At the step n, when time is n∆t , the pressure vector is denoted by:
P(n) = (P1(n),P2(n), ...,P7(n)).
We assume that the initial pressure values are known, when n = 0.To make the chest pressure profiles medically reasonable, assumei.e., ui (0) = ui (N − 1).
u1 = (u1(0), u1(1), ..., u1(N − 2), u1(0)),
u2 = (u2(0), u2(1), ..., u2(N − 2), u2(0)),
The Power of Optimal Control in Biological Systems Suzanne Lenhart
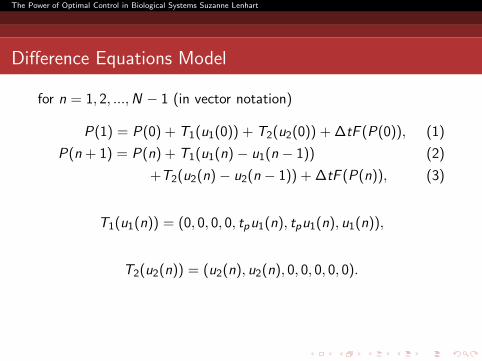
Difference Equations Model
for n = 1, 2, ...,N − 1 (in vector notation)
P(1) = P(0) + T1(u1(0)) + T2(u2(0)) + ∆tF (P(0)), (1)
P(n + 1) = P(n) + T1(u1(n)− u1(n − 1)) (2)
+T2(u2(n)− u2(n − 1)) + ∆tF (P(n)), (3)
T1(u1(n)) = (0, 0, 0, 0, tpu1(n), tpu1(n), u1(n)),
T2(u2(n)) = (u2(n), u2(n), 0, 0, 0, 0, 0).

The Power of Optimal Control in Biological Systems Suzanne Lenhart
Note that the pressure vector depends on the control, P = P(u),and the calculation of the pressures at the next time step requiresthe values of the controls at the current and previous time steps.We use extension of the discrete version of Pontryagin’s MaximumPrinciple.
The Power of Optimal Control in Biological Systems Suzanne Lenhart
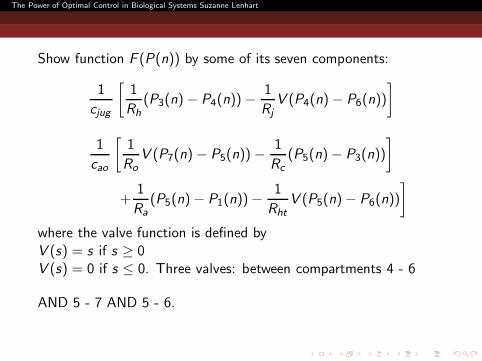
Show function F (P(n)) by some of its seven components:
1
cjug
[
1
Rh
(P3(n)− P4(n))−1
Rj
V (P4(n)− P6(n))
]
1
cao
[
1
Ro
V (P7(n)− P5(n))−1
Rc
(P5(n)− P3(n))
]
+1
Ra
(P5(n)− P1(n))−1
Rht
V (P5(n)− P6(n))
]
where the valve function is defined byV (s) = s if s ≥ 0V (s) = 0 if s ≤ 0. Three valves: between compartments 4 - 6
AND 5 - 7 AND 5 - 6.
The Power of Optimal Control in Biological Systems Suzanne Lenhart
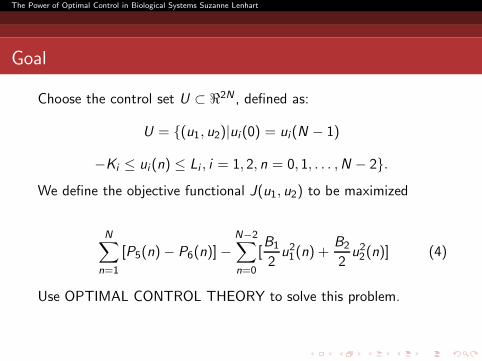
Goal
Choose the control set U ⊂ ℜ2N , defined as:
U = (u1, u2)|ui (0) = ui(N − 1)
−Ki ≤ ui (n) ≤ Li , i = 1, 2, n = 0, 1, . . . ,N − 2.
We define the objective functional J(u1, u2) to be maximized
N∑
n=1
[P5(n)− P6(n)]−
N−2∑
n=0
[B1
2u21(n) +
B2
2u22(n)] (4)
Use OPTIMAL CONTROL THEORY to solve this problem.
The Power of Optimal Control in Biological Systems Suzanne Lenhart
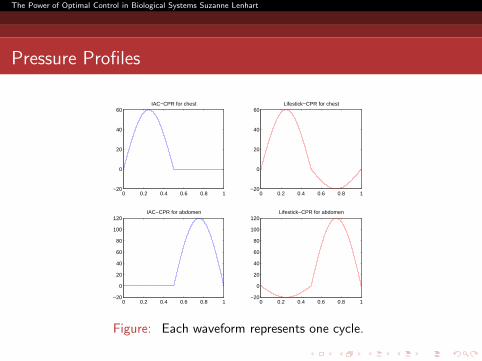
Pressure Profiles
0 0.2 0.4 0.6 0.8 1−20
0
20
40
60IAC−CPR for chest
0 0.2 0.4 0.6 0.8 1−20
0
20
40
60
80
100
120IAC−CPR for abdomen
0 0.2 0.4 0.6 0.8 1−20
0
20
40
60Lifestick−CPR for chest
0 0.2 0.4 0.6 0.8 1−20
0
20
40
60
80
100
120Lifestick−CPR for abdomen
Figure: Each waveform represents one cycle.
The Power of Optimal Control in Biological Systems Suzanne Lenhart
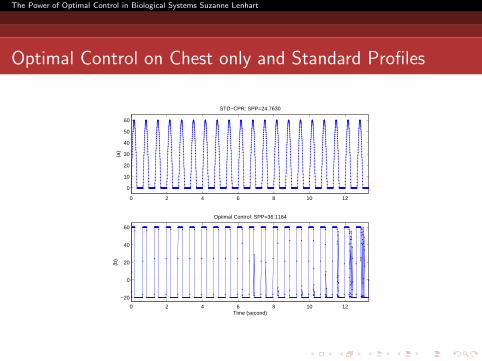
Optimal Control on Chest only and Standard Profiles
0 2 4 6 8 10 12
0
10
20
30
40
50
60(a
)
STD−CPR: SPP=24.7630
0 2 4 6 8 10 12
−20
0
20
40
60
Time (second)
(b)
Optimal Control: SPP=36.1164
The Power of Optimal Control in Biological Systems Suzanne Lenhart
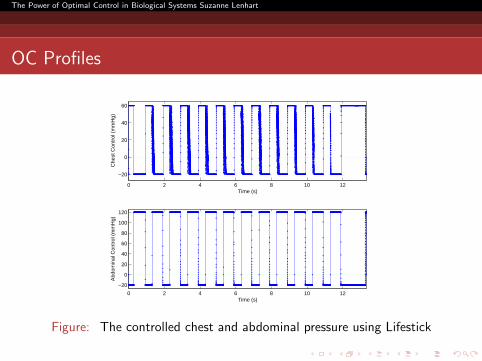
OC Profiles
0 2 4 6 8 10 12
−20
0
20
40
60
Time (s)
Che
st C
ontr
ol (
mm
Hg)
0 2 4 6 8 10 12
−20
0
20
40
60
80
100
120
Time (s)
Abd
omin
al C
ontr
ol (
mm
Hg)
Figure: The controlled chest and abdominal pressure using Lifestick

The Power of Optimal Control in Biological Systems Suzanne Lenhart
Concluding Remarks about CPR
This procedure with RAPID compression and decompression cycleshas recently been recommended by several medical groups.
We can increase the pressure difference across the thoracic aortaand the right heart by about 25 percent.
We received a US patent for this idea!through Oak Ridge National Labwith Protopopescu and Jung
The Power of Optimal Control in Biological Systems Suzanne Lenhart
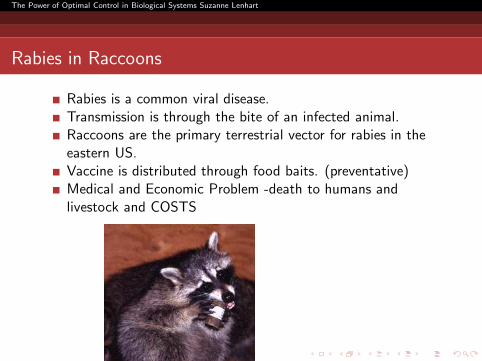
Rabies in Raccoons
Rabies is a common viral disease.Transmission is through the bite of an infected animal.Raccoons are the primary terrestrial vector for rabies in theeastern US.Vaccine is distributed through food baits. (preventative)Medical and Economic Problem -death to humans andlivestock and COSTS
The Power of Optimal Control in Biological Systems Suzanne Lenhart
Costs and Treatment associated with Rabies in USA
30,000 persons/year given rabies post exposure prophylaxis at acost of $30 million
Treatment - one dose of rabies immune globulin (injected near thesite of the bite)
and- five doses of vaccine over 28 days (injected into upper arm)
Symptoms - flu-like at first, about 10-60 days after exposure, laterdelirium, disruption of nervous system
The Power of Optimal Control in Biological Systems Suzanne Lenhart
Goal
Develop models and numerical results to investigate otherdistribution patterns for vaccine baits, as it impacts the spread ofrabies among raccoons.
Reduce the chance of rabies spread while keeping the costs ofvaccine distribution as low as possible.
More Precise GoalMinimize the number of infected raccoons while taking intoaccount limited amount of funding for the distribution of vaccinebaits.
The Power of Optimal Control in Biological Systems Suzanne Lenhart
Variables
Model with (k,l) denoting spatial location, t time
susceptibles = S(k,l,t)
infecteds = I(k,l,t)
immune = R(k,l,t)
vaccine = v(k,l,t)
control c(k, l, t), input of vaccine baits
The Power of Optimal Control in Biological Systems Suzanne Lenhart
Movement
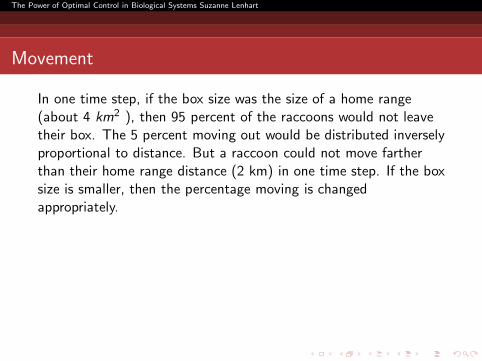
In one time step, if the box size was the size of a home range(about 4 km2 ), then 95 percent of the raccoons would not leavetheir box. The 5 percent moving out would be distributed inverselyproportional to distance. But a raccoon could not move fartherthan their home range distance (2 km) in one time step. If the boxsize is smaller, then the percentage moving is changedappropriately.
The Power of Optimal Control in Biological Systems Suzanne Lenhart
Order of events
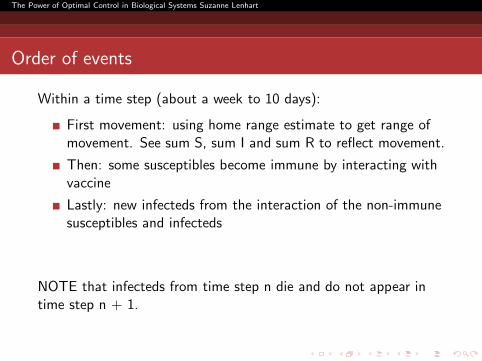
Within a time step (about a week to 10 days):
First movement: using home range estimate to get range ofmovement. See sum S, sum I and sum R to reflect movement.
Then: some susceptibles become immune by interacting withvaccine
Lastly: new infecteds from the interaction of the non-immunesusceptibles and infecteds
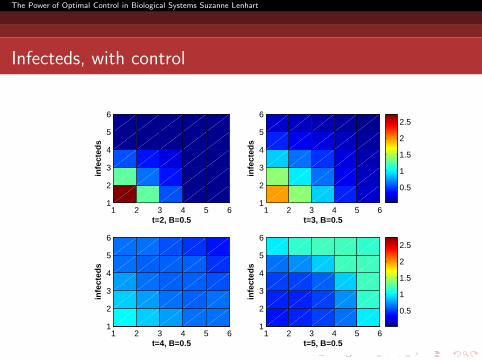
NOTE that infecteds from time step n die and do not appear intime step n + 1.
The Power of Optimal Control in Biological Systems Suzanne Lenhart
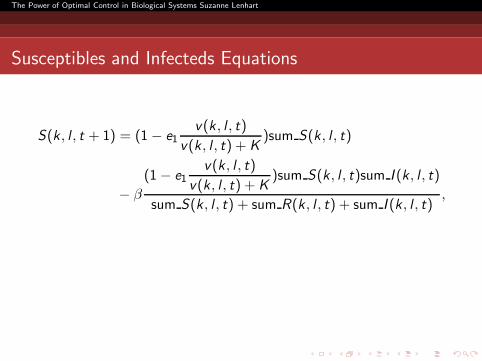
Susceptibles and Infecteds Equations
S(k, l , t + 1) = (1− e1v(k, l , t)
v(k, l , t) + K)sum S(k, l , t)
− β
(1− e1v(k, l , t)
v(k, l , t) + K)sum S(k, l , t)sum I (k, l , t)
sum S(k, l , t) + sum R(k, l , t) + sum I (k, l , t),
The Power of Optimal Control in Biological Systems Suzanne Lenhart
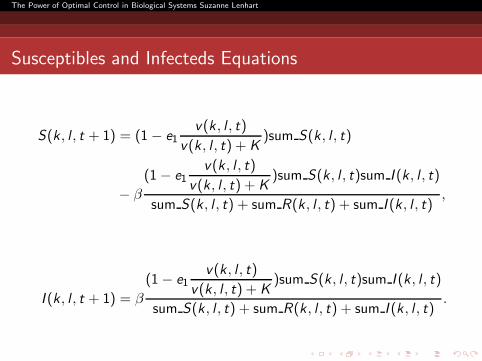
Susceptibles and Infecteds Equations
S(k, l , t + 1) = (1− e1v(k, l , t)
v(k, l , t) + K)sum S(k, l , t)
− β
(1− e1v(k, l , t)
v(k, l , t) + K)sum S(k, l , t)sum I (k, l , t)
sum S(k, l , t) + sum R(k, l , t) + sum I (k, l , t),
I (k, l , t + 1) = β
(1− e1v(k, l , t)
v(k, l , t) + K)sum S(k, l , t)sum I (k, l , t)
sum S(k, l , t) + sum R(k, l , t) + sum I (k, l , t).
The Power of Optimal Control in Biological Systems Suzanne Lenhart
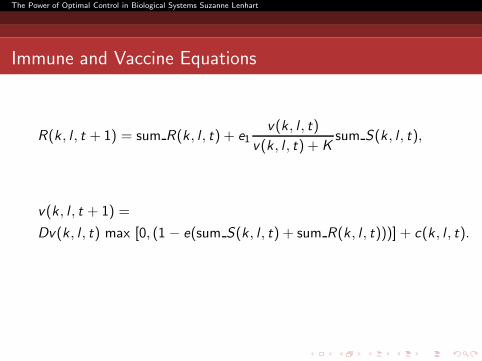
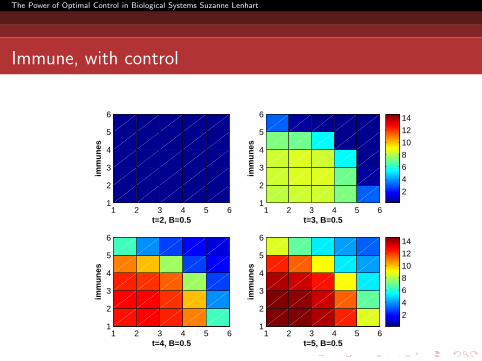
Immune and Vaccine Equations
R(k, l , t + 1) = sum R(k, l , t) + e1v(k, l , t)
v(k, l , t) + Ksum S(k, l , t),
v(k, l , t + 1) =
Dv(k, l , t) max [0, (1 − e(sum S(k, l , t) + sum R(k, l , t)))] + c(k, l , t).
The Power of Optimal Control in Biological Systems Suzanne Lenhart
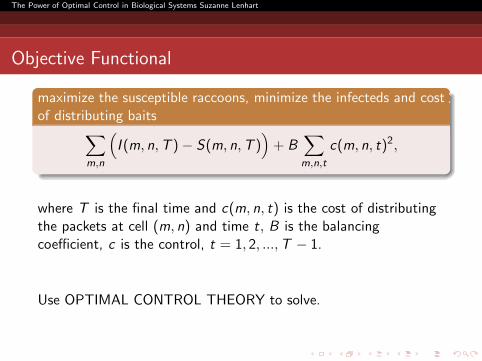
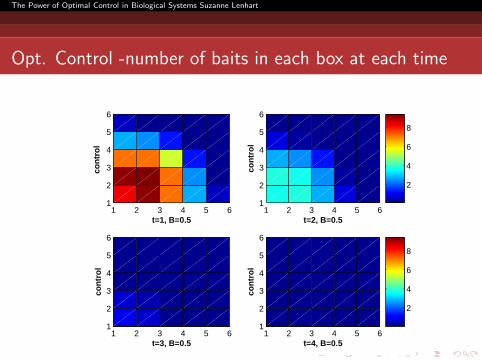
Objective Functional
maximize the susceptible raccoons, minimize the infecteds and costof distributing baits
∑
m,n
(
I (m, n,T )− S(m, n,T ))
+ B∑
m,n,t
c(m, n, t)2,
where T is the final time and c(m, n, t) is the cost of distributingthe packets at cell (m, n) and time t, B is the balancingcoefficient, c is the control, t = 1, 2, ...,T − 1.
Use OPTIMAL CONTROL THEORY to solve.

The Power of Optimal Control in Biological Systems Suzanne Lenhart
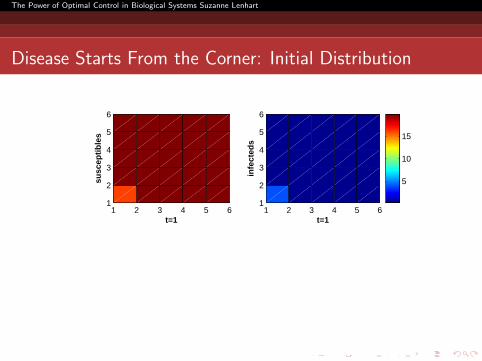
Numerical Example
Using a square grid with 25 boxes, we do the math analysisfollowed by the numerical solution.
In each box, 8 equations are solved at each time step. Fourequations for S, I, R, and V and four equations for the optimizingprocedure.
To get convergence to optimal bait distribution, about 100iterations are completed.
The Power of Optimal Control in Biological Systems Suzanne Lenhart
Disease Starts From the Corner: Initial Distribution
1 2 3 4 5 61
2
3
4
5
6
t=1
susc
epti
ble
s
1 2 3 4 5 61
2
3
4
5
6
t=1
infe
cted
s
5
10
15
The Power of Optimal Control in Biological Systems Suzanne Lenhart
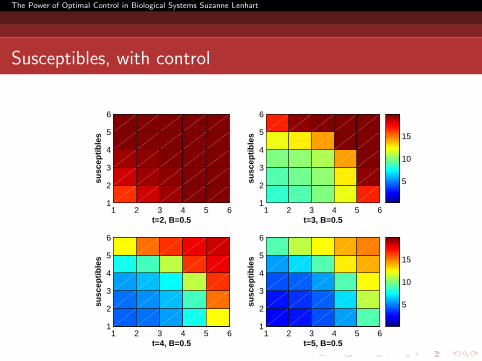
Susceptibles, with control
1 2 3 4 5 61
2
3
4
5
6
t=2, B=0.5
susc
epti
ble
s
1 2 3 4 5 61
2
3
4
5
6
t=3, B=0.5
susc
epti
ble
s
1 2 3 4 5 61
2
3
4
5
6
t=4, B=0.5
susc
epti
ble
s
1 2 3 4 5 61
2
3
4
5
6
t=5, B=0.5
susc
epti
ble
s
5
10
15
5
10
15
The Power of Optimal Control in Biological Systems Suzanne Lenhart
Infecteds, with control
1 2 3 4 5 61
2
3
4
5
6
t=2, B=0.5
infe
cted
s
1 2 3 4 5 61
2
3
4
5
6
t=3, B=0.5
infe
cted
s
1 2 3 4 5 61
2
3
4
5
6
t=4, B=0.5
infe
cted
s
1 2 3 4 5 61
2
3
4
5
6
t=5, B=0.5
infe
cted
s
0.5
1
1.5
2
2.5
0.5
1
1.5
2
2.5
The Power of Optimal Control in Biological Systems Suzanne Lenhart
Immune, with control
1 2 3 4 5 61
2
3
4
5
6
t=2, B=0.5
imm
un
es
1 2 3 4 5 61
2
3
4
5
6
t=3, B=0.5
imm
un
es
1 2 3 4 5 61
2
3
4
5
6
t=4, B=0.5
imm
un
es
1 2 3 4 5 61
2
3
4
5
6
t=5, B=0.5
imm
un
es
2
4
6
8
10
12
14
2
4
6
8
10
12
14
The Power of Optimal Control in Biological Systems Suzanne Lenhart
Opt. Control -number of baits in each box at each time
1 2 3 4 5 61
2
3
4
5
6
t=1, B=0.5
con
tro
l
1 2 3 4 5 61
2
3
4
5
6
t=2, B=0.5
con
tro
l
2
4
6
8
1 2 3 4 5 61
2
3
4
5
6
t=3, B=0.5
con
tro
l
1 2 3 4 5 61
2
3
4
5
6
t=4, B=0.5
con
tro
l
2
4
6
8
The Power of Optimal Control in Biological Systems Suzanne Lenhart
Fishery Problem: Motivation
No-take marine reserves may be a part of optimal harveststrategy designed to maximize yield.
Marine reserves can protect habitat and defend endangeredstock from overexploitation.
Marine reserves as a part of fishery management plan arecontroversial.
The Power of Optimal Control in Biological Systems Suzanne Lenhart
Work -parabolic case
Can we show that when considering the maximization of revenueonly, the marine reserves occur in the optimal harvesting strategy?
MODEL
includes both time and space
multi-dimensional spatial domain
Investigate the presence of marine reserves in optimal harvestingstrategy.
We have completed the analysis for general semilinear parabolicPDE in a multidimensional domain but here we present a simplercase.
The Power of Optimal Control in Biological Systems Suzanne Lenhart
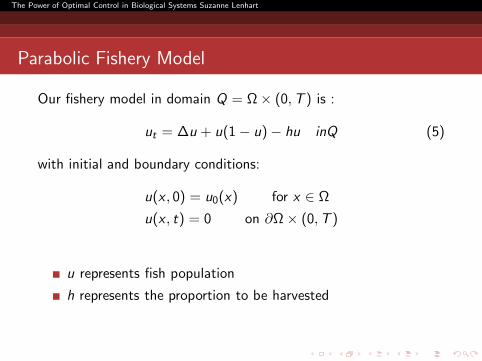
Parabolic Fishery Model
Our fishery model in domain Q = Ω× (0,T ) is :
ut = ∆u + u(1− u)− hu inQ (5)
with initial and boundary conditions:
u(x , 0) = u0(x) for x ∈ Ω
u(x , t) = 0 on ∂Ω× (0,T )
u represents fish population
h represents the proportion to be harvested
The Power of Optimal Control in Biological Systems Suzanne Lenhart
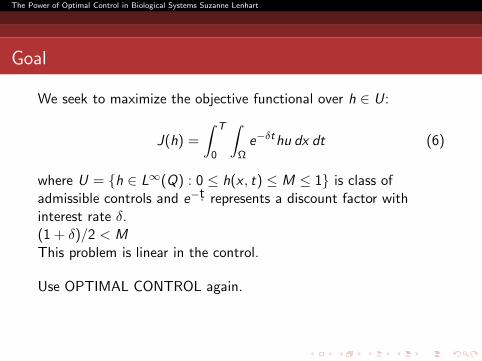
Goal
We seek to maximize the objective functional over h ∈ U:
J(h) =
∫ T
0
∫
Ω
e−δthu dx dt (6)
where U = h ∈ L∞(Q) : 0 ≤ h(x , t) ≤ M ≤ 1 is class ofadmissible controls and e−t. represents a discount factor withinterest rate δ.(1 + δ)/2 < M
This problem is linear in the control.
Use OPTIMAL CONTROL again.
The Power of Optimal Control in Biological Systems Suzanne Lenhart
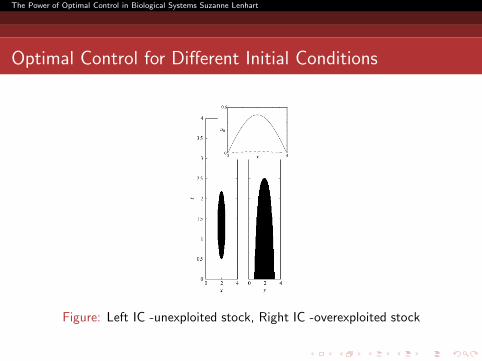
Optimal Control for Different Initial Conditions
Figure: Left IC -unexploited stock, Right IC -overexploited stock
The Power of Optimal Control in Biological Systems Suzanne Lenhart
Conclusions about Fishery Models
Spatial optimal control for harvesting problems are relevant astechnology enables the enforcement of spatially structured harvestconstraints.
In the future, investigate more spatial heterogeneities in thedynamics and in the domain, and and more realistic boundaryconditions
Ding and Lenhart are investigating a fishery problem for a specificspecies with age structure and discrete time.
The Power of Optimal Control in Biological Systems Suzanne Lenhart
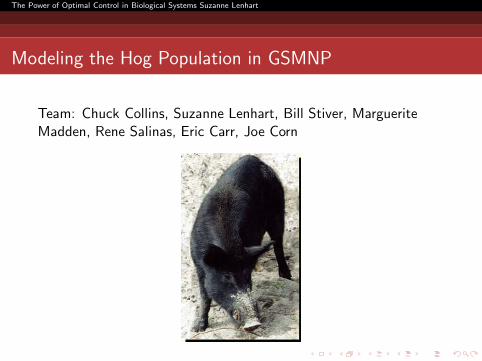
Modeling the Hog Population in GSMNP
Team: Chuck Collins, Suzanne Lenhart, Bill Stiver, MargueriteMadden, Rene Salinas, Eric Carr, Joe Corn
The Power of Optimal Control in Biological Systems Suzanne Lenhart
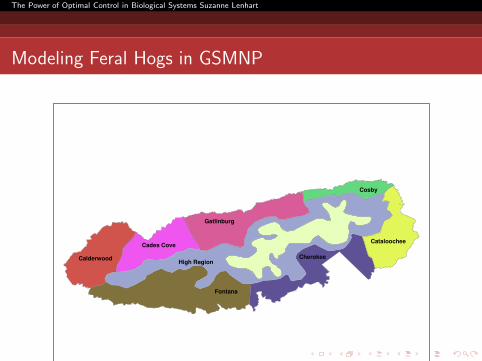
Modeling Feral Hogs in GSMNP
High Region
Fontana
Gatlinburg
CherokeeCalderwood
CataloocheeCades Cove
Cosby
The Power of Optimal Control in Biological Systems Suzanne Lenhart
Big Picture by Month
MODEL - discrete space and timeUSE database with 10,000 entries of harvesting hogs in the park
SUMMARY description of actions in monthsJanuary: hogs in low regions, survival, births, low-to-low movement
February: hogs in low regions, survival, low-to-low movement
March, April, May, June, July:hogs may be in low and high regions, survival, low-to-lowmovement, possible low-to-high movement
August: all hogs in high region, survival, proportional movement tolow regions
September, October, November, December: all hogs in lowregions, survival, movement low-to-low

The Power of Optimal Control in Biological Systems Suzanne Lenhart
Collaborators
Vladimir Protopopescu, Eunok Jung and Charles Babbs
Lou Gross, Wandi Ding, Keith Langston
Mike Neubert, Ta Herrera, H. R. Joshi