Embed Size (px)
Citation preview

The practice of HRM in relation to employee motivation
and job performance by HR managers in the hospitality
industry in Lao PDR
NALINH DOUANGPHICHIT
A thesis submitted in partial fulfilment of the requirements for the degree of Master of
Business
Unitec Institute of Technology, New Zealand
2015

DECLARATION
Name of candidate: Nalinh Douangphichit
This Thesis entitled:
“The practice of HRM in relation to employee motivation and job performance by HR
managers in the hospitality industry in Lao PDR”
is submitted in partial fulfilment for the requirements for the Unitec degree of Master of
Business.
Candidate’s declaration
I confirm that:
This Dissertation/Research study represents my own work;
The contribution of supervisors and others to this work was consistent with the Unitec
Regulations and Policies
Research for this work has been conducted in accordance with the Unitec Research
Ethics Committee Policy and Procedures, and has fulfilled any requirements set for
this project by the Unitec Research Ethics Committee.
Research Ethics Committee Approval Number: 2014-1049
Candidate signature:............................................................... Date:..................................
Student number: 1417636
10 April 2015

i
ACKNOWLEDGEMENTS
This research paper is made possible through the support and help from everybody, namely
NZaid scholarship, teachers, parents, family, and friends, and especially, I would like to
dedicate my acknowledgement of gratitude toward the following significant supervisors and
contributors:
First and foremost, I would like to gratefully and sincerely thank my principal supervisor, Dr
Andries du Plessis, for his full support and active encouragement. He kindly read my paper
and provided valuable advice and recommended clear guidelines on contents, structure, and
the theme of the paper. Without his recommendations and motivation this research study
would not have been completed.
Second, I would like to express the deepest appreciation to Dr Asoka Gunaratne, for his
valuable comments, kind support, and great contribution. Dr Asoka Gunaratne was willing to
help me whenever I experienced any problems in my study with the methodology. In
addition, I would like to express my sincere thanks to my secondary supervisor, Dr Helen
Mitchell, who kindly proofread my research paper and provided valuable comments on
grammatical errors and corrected any mistakes.
Third, I would like to thank the NZaid scholarship for providing financial support and
funding. The NZaid scholarship allowed me to have a great opportunity to further my study at
Unitec. Furthermore, I would like to thank the lecturers in the Master of Business courses
what helped me to expand my knowledge and broaden my skills during my study at Unitec. I
also would like to thank every teacher who educated me prior to studying in New Zealand.
Finally, I would like to sincerely thank my parents and family for their encouragement,
boundless love and unconditional support. Their love and support has given me great
motivation to complete my study. Besides, I would like express my warm thanks to all my
friends who always loved and helped me during my study in New Zealand.

ii
ABSTRACT
In a hotel, which is a service business, it is crucial to identify the factors that increase
business performance, profit and productivity. The study of HRM practices is one of a
hotel’s crucial management functions that allow the hotel business to maintain its competitive
advantage and improve both employee performance and organizational effectiveness. In
order to guarantee that the hotel organization has good quality management, it is vital to have
effective HRM practices that result in a high level of productivity, a high level of service
quality, effective and efficient resource exploitation, and improvement of employee
performance.
Recently, the Lao government considered the tourism and hospitality industry as one of the
top priority development sectors because the tourism industry has earned revenue from
foreign countries and has greatly contributed to social and economic development in Lao
PDR. Due to an increase in the importance of tourism and the support from the government,
the hospitality business such as the hotels and restaurants grew significantly in 1995 and has
increased dramatically compared to the other main sectors in the Lao economy. However, it
seems that these businesses in Laos still underperform in HR development and training.
Therefore they do not have the capability to operate effectively and efficiently. As a result,
this can hinder a hospitality business and the tourism industry in Laos which is planned to
grow considerably over coming years.
Therefore, in this research paper, the main research aim is to discover the approaches that the
hotel industry should implement to improve employee job performance and help the hotel
industry maintain its competitive advantage and sustain profitability in the increasingly
competitive business environment in Laos. This research project will mainly focus on overall
HRM functions such as (1) recruitment and selection, (2) employee training and
development, (3) employee motivation and satisfaction, and (4) employee retention which are
practised by HR managers in hotels in Laos.
With regard to methodology, this research applies mixed methods in order to better explore
and experience the research problem. Findings from the research demonstrate that there are
some weaknesses in relation to the current HRM practices in Lao hotels.

iii
In the area of employee selection, most HR managers are not likely to recognize the
importance of employee selection. In the area of employee training, even if most HR
managers acknowledge the importance of training activities, half of the employees did not
receive training and most of them still need more training. In the area of motivation and
satisfaction factors, results from the questionnaire survey show that money, opportunity for
growth and fairness are the most influential factors that motivate employees to work and
satisfy them at workplace.

iv
TABLE OF CONTENTS
Chapter One: Introduction ...................................................................................................................... 1
1.1 Human resource as a key business competitiveness .................................................................. 1
1.2 Human resource as a driving force of business success, business sustainability and ongoing
profitability ................................................................................................................................ 1
1.3 Employees’ job satisfaction ....................................................................................................... 2
1.4 Work motivation ........................................................................................................................ 3
1.5 Human resource management in the hospitality industry .......................................................... 3
1.6 The importance of employee selection in the organization. ...................................................... 4
1.7 The importance of employee training in the organization ......................................................... 4
1.8 Background of the main research problem and the primary study area ..................................... 5
1.9 The research aim and objectives ................................................................................................ 6
1.10 Research question ...................................................................................................................... 6
1.11 Hypothesis ................................................................................................................................. 7
1.12 Research methodology ............................................................................................................... 7
1.13 Limitations of the study ............................................................................................................. 8
1.14 Thesis overview ......................................................................................................................... 8
1.15 Conclusion ................................................................................................................................. 9
1.16 Chapter summary ....................................................................................................................... 9
Chapter Two: Literature review ............................................................................................................ 10
2.1 Introduction: The background and development of HRM in business organizations .............. 10
2.2 The role of HR managers in employee work performance ...................................................... 11
2.3 Human resource management .................................................................................................. 12
2.4 Human resource planning ........................................................................................................ 13
2.5 Employee selection .................................................................................................................. 15
2.5.1 Screening applications and resumes.............................................................................. 16
2.5.2 Interviewing .................................................................................................................. 17
2.5.3 Undertaking testing of the candidates ........................................................................... 18
2.5.4 Conducting background investigations ......................................................................... 19
2.5.5 Making a decision whether to hire or not ...................................................................... 20
2.6 Training improving employee performance ............................................................................ 21
2.7 Employee motivation increasing employee performance ........................................................ 24
2.7.1 Maslow’s Need Hierarchy. ........................................................................................... 26

v
2.7.2 Herzberg’s two-factor motivation theory ...................................................................... 28
2.7.3 McGregor’s theory X, theory Y .................................................................................... 29
2.7.4 Alderfer’s ERG Theory ................................................................................................. 30
2.7.5 McClelland’s three-need theory (achievement motivation theory) ............................... 31
2.7.6 Equity theory and Expectancy Theory .......................................................................... 32
2.7.7 Intrinsic and extrinsic motivation.................................................................................. 33
2.7.8 Employee motivation in hospitality industry ................................................................ 34
2.7.9 Employee empowerment as motivators in hotel organization ...................................... 35
2.8 Job satisfaction influencing employee turnover rate, employee performance and
organizational citizenship behaviour ....................................................................................... 36
2.8.1 Consequence of job satisfaction .................................................................................... 36
2.8.2 Factors influencing job satisfaction in the workplace ................................................... 38
2.9 Conclusion ............................................................................................................................... 39
2.10 Chapter summary ..................................................................................................................... 39
Chapter Three: Research methodology ................................................................................................. 40
3.1 Introduction .............................................................................................................................. 40
3.2 Research methodology ............................................................................................................. 40
3.3 Business research method ........................................................................................................ 41
3.3.1 Quantitative research methods ...................................................................................... 42
3.3.2 Qualitative research methods ........................................................................................ 45
3.4 Method of data collection ........................................................................................................ 47
3.4.1 Primary data .................................................................................................................. 47
3.4.2 Secondary data .............................................................................................................. 48
3.4.3 Data collection .............................................................................................................. 48
3.5 Sampling .................................................................................................................................. 53
3.6 Data analysis methods.............................................................................................................. 56
3.6.1 Quantitative data analysis ............................................................................................. 57
3.6.2 Qualitative data analysis ............................................................................................... 60
3.7 Ethical concerns ....................................................................................................................... 63
3.8 Conclusion ............................................................................................................................... 65
3.9 Chapter summary ..................................................................................................................... 65
Chapter Four: Findings ......................................................................................................................... 66
4.1 Introduction .............................................................................................................................. 66
4.2 Demographic information ........................................................................................................ 66
4.3 Questionnaire findings ............................................................................................................. 70

vi
4.3.1 Employee satisfaction ................................................................................................... 70
4.3.2 Employee motivation .................................................................................................... 79
4.3.3 Employee training ......................................................................................................... 87
4.4 Interview finding ...................................................................................................................... 92
4.4.1 Employee selection ....................................................................................................... 93
4.4.2 Employee training ......................................................................................................... 97
4.4.3 Summary of the key findings from the interviews ...................................................... 101
4.5 Hypotheses ............................................................................................................................. 103
4.5.1 Hypothesis 1 ................................................................................................................ 103
4.5.2 Hypothesis 2 ................................................................................................................ 107
4.5.3 Hypothesis 3 ................................................................................................................ 108
4.6 Conclusion ............................................................................................................................. 110
4.7 Chapter summary ................................................................................................................... 110
Chapter Five: Discussion of findings .................................................................................................. 112
5.1 Introduction ............................................................................................................................ 112
5.2 Employee selection process in hotels in Laos. ....................................................................... 112
5.3 Employee training in hotels in Laos ...................................................................................... 114
5.4 Employee motivation level in hotels in Laos ......................................................................... 115
5.5 Employee satisfaction level in hotels in Laos ........................................................................ 117
5.6 The influence of employee training on employee performance ............................................. 120
5.7 The impact of the motivational program implemented by the organization on employee
performance ........................................................................................................................... 121
5.8 The relationship between satisfaction of employee and the pay offered by the organization 122
5.9 Conclusion ............................................................................................................................. 123
5.10 Chapter summary ................................................................................................................... 123
Chapter Six: Conclusion of Findings and Recommendations ............................................................. 124
6.1 Introduction ............................................................................................................................ 124
6.2 Research conclusion............................................................................................................... 124
6.3 Recommendations for hotels in Laos ..................................................................................... 127
6.4 Limitations ............................................................................................................................. 132
6.5 Further research ..................................................................................................................... 133
6.6 Closing statement ................................................................................................................... 134
References ........................................................................................................................................... 135
APPENDICES .................................................................................................................................... 146
Appendix 1: Survey questions ........................................................................................................ 146

vii
Appendix 2: Interview questions .................................................................................................... 154
Appendix 3: Information sheet for participants .............................................................................. 156
Appendix 4: Participant consent form ............................................................................................ 157
Appendix 5: Organisational consent letter ...................................................................................... 158
LIST OF TABLES
Table 1: Participant age (Q.2) ............................................................................................................... 68
Table 2: Work experience (Q3) ............................................................................................................ 68
Table 3: Number of years working in the hotel (Q5) ............................................................................ 70
Table 4: participant’s satisfaction with their current job (Q6) .............................................................. 70
Table 5: opinions about staff satisfaction in their current organization (Q7) ....................................... 71
Table 6: opinions about staff positive experience in their current organization (Q11) ......................... 75
Table 7: Opinions of work conditions created by the organization (Q17) ............................................ 80
Table 8: the motivational experience that employees have in their organization (Q18) ....................... 81
Table 9: Importance of training in relation to improving employee performance (Q22) ..................... 87
Table 10: Opinions about training provided by the organization (Q23) ............................................... 88
Table 11: A number of employees receiving training (Q24) ................................................................ 88
Table 12: The importance of training * the improvement of work performance in the organization . 104
Table 13: Test of Homogeneity of Variances ..................................................................................... 104
Table 14: ANOVA – The importance of training in relation to employee work performance ........... 105
Table 15: Post Hoc Tests – Multiple Comparisons ............................................................................. 105
Table 16: Independent Samples Test .................................................................................................. 106
Table 17: Correlation between Q16 and Q18 (number 2) ................................................................... 107
Table 18: The organization pays me well for the work * I am satisfied with my job Cross-tabulation
............................................................................................................................................................ 109
Table 19: Chi-Square Tests of Q6 and Q7 .......................................................................................... 110

viii
LIST OF FIGURES
Figure 1: The Steps in the selection process ......................................................................................... 16
Figure 2: Maslow’s hierarchy of needs ................................................................................................. 27
Figure 3: Herzberg’s two-factor motivation theory .............................................................................. 28
Figure 4: Comparing Maslow (Hierarchy of Needs) and Herzberg (Motivation-Hygiene) .................. 29
Figure 5: Relationship of three models ................................................................................................. 31
Figure 6: The relationship between job satisfaction and employee turnover ........................................ 37
Figure 7 Gender ratio of participants (Q1) ............................................................................................ 67
Figure 8: Education level (Q4) ............................................................................................................. 69
Figure 9: Working culture satisfaction (Q8) ......................................................................................... 72
Figure 10: Working environment (Q9) ................................................................................................. 73
Figure 11: The likelihood of employee looking for another job outside the organization (Q10) ......... 74
Figure 12: Opinions of rewards on the job performance recognition (Q12) ......................................... 76
Figure 13: Level of stress at work in a week (Q13) .............................................................................. 77
Figure 14: The reasons that employees stay at their present job (Q14) ................................................ 78
Figure 15: Opinions about amount of the current workload (Q15) ...................................................... 78
Figure 16: Opinions about the importance of work motivation (Q16) ................................................. 79
Figure 17: The factors motivating employees (Q19) ............................................................................ 85
Figure 18: the influence of the incentives provided by the company ................................................... 85
Figure 19: Work motivation provided by the organization (Q21) ........................................................ 86
Figure 20: The hotel training that employees have obtained (Q25) ...................................................... 89
Figure 21: The influence of training on work perform (Q26) ............................................................... 90
Figure 22: Opinions of whether more training should be provided (Q27) ............................................ 90
Figure 23: the kinds of training that their organizations should provide (Q28) .................................... 91
Figure 24: The relationship between the training course and work performance (Q29) ...................... 92
Figure 25: Selection process in hotels in Laos .................................................................................... 113
Figure 26: Employee motivation and job performance....................................................................... 116
Figure 27: the relationship between employee satisfaction and profit ............................................... 118
Figure 28: Factors affecting job/employee satisfaction ...................................................................... 119
Figure 29: Steps in the employee selection process ........................................................................... 128
Figure 30: Candidate fit ...................................................................................................................... 129
Figure 31: Assessing training and development needs ....................................................................... 129
Figure 32: Employee satisfaction factors ........................................................................................... 130
Figure 33: compensation components ................................................................................................ 131
Figure 34: Employee motivation and employee performance ............................................................ 132

ix
LIST OF ABBREVIATIONS
HR: Human Resource
HRM: Human Resource Management
KSA: Knowledge, Skills, Ability
LAO PDR: Lao People's Democratic Republic
OCB: Organizational Citizenship Behaviour
P: Participant
SHRM: Strategic Human Resource Management
SMEs: Small and Medium-sized Enterprises
UREC: Unitec Research Ethics Committee

1 of 159 | P a g e
Chapter One: Introduction
1.1 Human resource as a key business competitiveness
Competitiveness of the organization increasingly and heavily relies on the knowledge, skills
and abilities of its employees. Deb (2006) and Rao (2008) strongly assert that HR helps the
organization establish a set of core competencies. This means employees are the main
resources that help the organization perform its activities better than its rivals. In addition,
employees help to distinguish the organization from its rivals by adding value to the
organizational products and services; for example, delivering low cost for services, and
providing high-quality products.
It is asserted by Rao (2008), Muncherji and Dhar (2009), and Snell and Bohlander (2012) that
talents of employees, which are valuable, unique, rare, and difficult to imitate, can support
the organization to achieve sustained competitive advantage over its competitors. Therefore,
it is vital for the organization to have an effective HR management that can enable ordinary
employees to deliver extraordinary and outstanding performance, and to take care of
employees’ ever-changing expectations. It is suggested by Rao (2008) and Nel et al. (2012)
that in today’s highly competitive markets, the organization should manage key resources
such as employees, technology, and work processes efficiently in order to achieve cost
effectiveness and deliver high quality goods and services.
1.2 Human resource as a driving force of business success,
business sustainability and ongoing profitability
Organizations do not exist if there are no people or employees. The organizations employ all
resources such as human, physical and financial resources to produce expected results (Rao,
2008). To have success, and maintain the success, every organisation demands extraordinary
abilities and sustained efforts from its employees and people. Rao (2008) claims that when
employees work to the best of their abilities and do their work with passion, enthusiasm and
high commitment, the business will grow significantly and continuously. Rao (2008) also
maintains that in general, every organisation has pretty much the same kind of resources such
as land, buildings, materials, equipment, and finance to work with, but the only element that
differentiates between business organizations is the HR factor.

2 of 159 | P a g e
If the business organization can use and exploit its human resource to the best potential
advantage, there is nothing that can stop the organization achieving its goals and objectives.
As Thomas J. Watson, the founder of IBM states, “you can get capital and erect buildings,
but it takes people to build a business” (as cited in Snell & Bohlander, 2012, p. 1). Jack
Welch, the former director of General Electric also believes that human resources are the
backbone of the organization due to the fact that they develop and use technology, they
contribute great ideas for product development and deliver superior customer services, they
collect, analyse and distribute information, and they create and execute strategy (as cited in
Rao, 2008). Rao (2008) concludes that when employees are motivated and inspired, they will
be fully involved in organizational activities and work to their maximum potential. This can
assist a company to achieve its goals and attain results rapidly, efficiently and effectively.
1.3 Employees’ job satisfaction
Employee satisfaction refers to “a pleasurable or positive emotional state resulting from the
appraisal of one’s job or job experiences” (as cited in Grigoroudis & Siskos, 2010, p. 72).
Grigoroudis and Siskos (2010) claim that employee satisfaction is one of the important
drivers for organizational success. According to the study of Vroom (1964) and Bernhardt et
al. (2000), there is a relationship between employee satisfaction and employee/organizational
performance (as cited in Grigoroudis & Siskos, 2010). In addition, based on the research of
Smith et al. (1983) and Organ (1988), there is a link between job satisfaction and
organizational citizenship behaviour in which employees go beyond the requirements of their
Job (as cited in Grigoroudis & Siskos, 2010).
Research has also revealed that a high level of employee satisfaction can result in the
reduction of employee turnover rate and has a positive influence on organizational
commitment (Nel et al., 2015; Nelson & Quick, 2012). Studies of Tornow and Wiley (1991),
Tompkins (1992), and Schlesinger and Zomitsky (1991) have demonstrated that there is a
relationship between employee satisfaction and customer satisfaction that is likely to result in
customer loyalty and higher profitability (as cited in Grigoroudis & Siskos, 2010). Therefore,
it is crucial for the organization to determine and identify the factors that increase and
improve employee satisfaction at work in order to improve employee performance, increase
employee commitment, reduce the turnover rate of employees, and increase the level of
customer satisfaction (Nel et al., 2012).

3 of 159 | P a g e
1.4 Work motivation
Mackay (2006) and Nel et al. (2014) assert that identifying the key factors that motivate
employees at work is necessary for the organization to recognize and understand the key
motivational factors that influence their employees’ behaviour and action can be taken to help
the organization create appropriate and suitable strategies to motivate their employees to
perform work at a high level. In addition, Stone (2013) claims that knowing how to motivate
employees can help the organization to increase productivity and improve customer service
and is one factor that creates a competitive advantage over competitors. Ahlstrom and Bruton
(2010), and Nel et al. (2012) also emphasize that having the right motivation tool is crucial as
it can increase employees’ efforts to perform their task. The level of employees’ effort has a
great influence on the level of organizational performance and customer satisfaction. Adeniyi
(2010) and Nel et al. (2015) conclude that there is a strong relationship between employee
motivation and the level of their performance. Therefore, conducting research about the
factors that motivate employees at work is necessary because knowing what employees need
and desire at work helps organizations to develop the strategy that allows employees to
satisfy their needs and increase their performance at the same time.
1.5 Human resource management in the hospitality industry
The hospitality industry refers to organizations that provide accommodation and food
services for people when they travel away from their homes (Hayes & Ninemeier, 2009). The
hospitality industry is also known as a “people business”. The people in this context refer to
both employees who deliver the products and services, and to customers who consume them.
Like any other business, hospitality organizations need employees with different kinds of
knowledge, skills, and experience to provide a high quality of products and services that are
needed by customers. In other words, hospitality business operations depend on a capable and
service-oriented labour force (Nickson, 2013).
Hence, it is necessary for the hospitality industry to have effective HR functions such as job
analysis, employee selection, training and development, compensation management and
motivational schemes that are integrated or linked with its strategic plans or goals in order to
improve organizational performance standards, deliver quality service to customers, and
maintain its competitiveness in the pursuit of organizational success (Darwish, 2013;
Holbeche, 2012).

4 of 159 | P a g e
1.6 The importance of employee selection in the organization.
The success of every organization depends on the ability and efficiency of employees in its
organization. Thus, it is important for the organization to have a well-organized and effective
selection process (Gupta, 2007). If the organization has a poor selection procedure, unsuitable
applicants are hired and appointed. As a result, the efficiency of the organization will
decrease because such persons might not be able to operate their work. In addition, they
might leave their jobs. This can result in a waste of time and money that organization spent
on their selection and training (Gupta, 2007). Gupta (2007) also claims that effective
selection and placement of employees is vital for the organization because it helps it to
improve the efficiency of its work operations.
According to the study by Gupta (2007), the effective and proper selection process helps the
organization to select and hire the right people for the job which can bring about the
improvement of the quality of organizational performance. Therefore, it is essential for the
hotel business to put in extra effort and emphasis on improving the employee selection
procedure in order to ensure that the organization hires the best qualified people who are able
to help to achieve the organizational goals and attain high productivity in the organization.
1.7 The importance of employee training in the organization
Employee training is essential for the organization. Training and development of employees
allows the organization to improve the ability and capacity of its employees to implement its
business plan and strategy (Jackson, Schuler, & Werner, 2012). According to the study of
Jackson et al. (2012), training helps new staff to learn the organizational values, and allows
experienced staff to continually improve the quality of the product and services of the
organization.“ Improving the competence of the workforce is one way that training and
development can create a competitive advantage” (Jackson et al., 2012, p. 270).
This means training activities help the employees perform their work at a higher level that
can result in the success of the organization (Miller & Gordon, 2014; Nel et al., 2012).
Besides, it is believed that training and development activities can bring about increased
workforce productivity, and ultimately contribute to the improvement of organizational
performance (Cassidy & Kreitner, 2010; Nel et al., 2012). Hence, it is vital for the hotel
business to have training and development activities in place in order to improve capacity and
the capability of employees and increase employee productivity, to ultimately sustain its
competitive advantage.

5 of 159 | P a g e
1.8 Background of the main research problem and the primary
study area
Since Lao People’ Democratic Republic opened its country to foreign tourists in 1989, the
tourism and hospitality industry has grown and developed quickly and has become one of the
largest industries in Laos. In 1995, the Lao government considered the tourism and
hospitality industry as one of the top priority development sectors because the tourism
industry has earned revenue from foreign countries and has greatly contributed to social and
economic development in Lao PDR (Yamauchi & Lee, 1999). Due to an increase in the
importance of tourism and the support from the government, the hospitality business such as
the hotels and restaurants grew significantly in 1995 and has increased dramatically
comparing to other main sectors in the Lao economy.
The growth rate of hotels more than tripled between 1992 and 1997, and the amount of
foreign investment in the hospitality industry has grown continuously (Yamauchi & Lee,
1999). However, when compared with regional and international competitors, the hospitality
businesses, especially hotels and restaurants in Laos are still considered as small and medium
sized enterprises (SMEs). Furthermore, it seems that these businesses in Laos still
underperform in relation to HR development and training. They do not have the capability to
operate effectively and efficiently. As a result, this might hinder the hospitality business and
tourism industry in Laos that is planned to grow considerably over coming years
(Sustainable Tourism Development Project In Lao PDR, 2009).
According to the information above, the number of hotels and restaurants is increasing
considerably and the foreign investment rates are rising substantially. This contributes
towards a higher level of competition in the hotel and service business in Laos. In addition to
the pressure of an increasingly competitive market, it looks as if the hotels and catering
organizations underperform, still deliver inadequate services, and provide limited facilities
compared to the same business in the same region. This can have a negative impact on the
tourism industry in Laos.
Therefore, the main research problem is: what approaches should the hotel industry take to
improve employee job performance and help the industry maintain competitiveness and
sustain profitability in the increasingly competitive business environment in Laos?

6 of 159 | P a g e
This research project will mainly focus on overall HRM functions such as (1) recruitment and
selection, (2) employee training and development, (3) employee motivation and satisfaction,
and (4) employee retention which are practised by HR managers in hotels in Laos.
1.9 The research aim and objectives
The major aim of this research project is to identify and determine practical and suitable
HRM for employee selection, employee training, job performance, employee motivation, and
employee satisfaction to support the hotel industry in Laos, and enabling it to have a
competitive advantage, attain goals and sustain business. However, in order to achieve the
aforementioned aim, the key objectives of this research project are as follows:
1. To explore procedures that HR managers have employed to select the right
employee to the right position in Laos.
2. To find out training programs that employees have received in order to develop
their capacity on their work performance in hotels in Laos.
3. To identify factors that motivate hotel employees to perform at a high standard.
4. To determine factors that bring about a high level of job satisfaction among
employees in order to engage employees to achieve organizational goals and
reduce the rate of employee turnover in hotels in Laos.
5. To examine the influence of training on an employee’s work performance in the
Lao hotel industry.
6. To identify the impact of the financial incentives implemented by the
organization on employee performance.
7. To determine the relationship between satisfaction of employees and the salary
paid by the organization.
1.10 Research question
In order to address the research problem and fulfil the aim, the main research question of this
project is: What are the practical and suitable HRM practices that would increase employee
motivation and satisfaction and job performance in the hotel industry in Laos?
In addition, in order to achieve the aforementioned objectives and address the main research
question, the sub-questions are formulated as follows:

7 of 159 | P a g e
1. What selection process should be applied in order to have the right employee for
the right job?
2. What kind of training should the hotel industry in Laos provide in order to
improve employee performance and their capacity with the job?
3. What are the key factors that the hotel industry in Laos should consider in order
to motivate employees to higher levels of performance?
4. What are the main factors that affect job satisfaction in the workplace?
5. What is the influence of training on the employee’s work performed in the
organization?
6. What is the impact of the financial incentives implemented by the organization
on employee performance?
7. Is there a positive relationship between satisfaction of employee and the
organization’s salary structure?
1.11 Hypothesis
This research project proposes three hypotheses as follows:
Ho1 - There is no difference in the views of employees towards the importance of
training in relation to work performance in the organization.
Ho2 - The financial incentives provided by the organizations have no effect on
employee performance.
Ho3 - There is no relationship between employee satisfaction and the pay offered by the
organization.
1.12 Research methodology
This study applies mixed methods (a combination of quantitative and qualitative methods) for
obtaining data. In a quantitative method, a questionnaire has been developed to collect data
from employees in the six hotels in order to seek to understand their opinion and experience
about work satisfaction, motivation and training in the hotels in Laos. In a qualitative method,
six HR managers from the six hotels have been interviewed in order to understand viewpoints
of HR Managers in relation to the employee section and employee training in their
organizations. Prior to the interview questions and survey questionnaires being used in this
study, a pilot project was implemented in order to ensure that the questions were clear and

8 of 159 | P a g e
understandable. With regard to data analysis, text coding, content analysis, thematic analysis,
narrative analysis, comparative analysis has been used to analyse qualitative data whereas
SPSS software has been used to analyse quantitative data.
1.13 Limitations of the study
There are some limitations in relation to the research procedures in this study. With regard to
the qualitative method, due to time constraints, the sample size seems to be too small; but it is
still representative of the hotel industry in the capital city. A future study could include hotels
in other parts of Laos as well. In total six participants were selected for this research which
complies with the requirements for a 90 credit thesis at Unitec. The six participants were HR
managers from 6 hotels, namely City Inn, Rashmi’s Plaza Hotel, Best Western Vientiane
Hotel, Lane Xang Hotel, Settha Palace Hotel, and Vientiane Golden Hotel. With regard to the
quantitative method, the questionnaire survey included employees at all levels in the hotels.
All the hotels that participated in this research study are located in the capital city of Laos.
Furthermore, the sample size for a questionnaire survey is relatively small, which might
reduce the accuracy, reliability and validity of the findings in this research. Thus, this
research study might not represent the overall HRM practices in the hotel industry nationwide
but is representative for the capital city of Laos.
1.14 Thesis overview
There are six chapters contained in this thesis. Chapter one introduces the importance of
HRM practices in every organization. It also illustrates the influence of HR functions on the
improvement of employee performance, employee satisfaction and motivation, and the
success of the organization. Finally, it presents aims, objectives and the research questions of
this thesis.
Chapter two covers the literature review associated with the effective HRM practices and its
functions that contribute to the development of work performance, job satisfaction, and
workplace motivation. It also presents various theories about employee selection procedure,
training and development, job satisfaction and employee motivation that can be used as a
guideline for the analysis of this research study.
Chapter three covers the methods and techniques applied to collect the data for this research
study. It especially discusses some particular methods used in sample selection, data
collection, and data analysis.

9 of 159 | P a g e
Chapter four reflects the data obtained from both the interviews and questionnaire survey. It
also presents the findings generated by using many different approaches of data analysis.
Chapter five discusses the findings from data collection and analysis. It also shows the
findings are supported by relevant literature which leads to the answer to the research
objectives, research questions and hypotheses.
Chapter six presents the summary of this research study, and provides some significant
recommendations about effective HRM practices to the Lao hotel industry. Limitations of
this research and further research areas are also addressed in this chapter.
1.15 Conclusion
In this chapter, suitable HRM practices that could contribute to the effectiveness and
efficiency of every organization including hotel industry, was introduced. In addition, it was
illustrated that the hotel industry in Laos doesn’t have an effective HR management which
could hinder their business performances in the future. The aims and objectives as well as the
main research question and hypotheses were offered. Therefore, this research points out how
vital it is for the Lao hotel industry to seek suitable HRM practices in order to deliver
effective HRM.
1.16 Chapter summary
Chapter one provides the correlation between HRM practices, organizational performance,
job satisfaction, and employee motivation in the Lao hotel industry. Chapter one also presents
the aim, objectives, and the research questions of this research study. The following chapter
discusses the literature review in order to provide basic knowledge about effective HRM
practices and have the right direction for the critical analysis in this thesis.

10 of 159 | P a g e
Chapter Two: Literature review
2.1 Introduction: The background and development of HRM in
business organizations
Chapter One is the introductory chapter and covers the introduction and also gives an outline
of the chapters in this thesis. In this chapter the literature review will cover all the research
questions and aims of this study.
Looking back to the development of HR practices, in the early 1970s, there was only a
department called personnel department which involved the workforce in the organization
(Darwish, 2013). In the late 70s, the world economy changed steadily and organizations
began to consider the labour force as an important resource for their business activities and
operations. The concept of human resource management (HRM) began in the 1980s and
this concept grew and developed over the next decade (McGuire & Jorgensen, 2010).
Over the last 30 years, HRM has attracted attention across many fields, due to its
contribution to the effectiveness and efficiency of employee management (Nickson, 2013;
Stredwick, 2005). It has been said that human resource (HR) is the crucial element in most
organizations as it is a key driving factor in every business activity. Therefore an effective
and efficient HR management plays a vital role in the success of every organization
(Stredwick, 2005). However, in recent years, many scholars and researchers have developed a
sophisticated and modern discipline of HRM which was called strategic human resource
management (SHRM).
Delery and Shaw (2001) and Becker and Huselid (2006) point out the difference between
traditional HRM and SHRM in two dimensions. SHRM has focused on the influence of all
HR practices on organizational performance whereas traditional HRM has emphasized only
the influence of individual practices on employee performance standards (Darwish, 2013).
In today's global economy, organizations are operating in a dynamic and fast changing
environment. In order to maintain competitive advantage, achieve organizational strategic
goals, and adapt and change to respond quickly to market needs and demands, it is vital for
contemporary organizations to have HR professionals or HR managers who have
sophisticated and advanced HRM skills and knowledge (Nel, Werner, Poisat, Du Plessis, &
Sono, 2011). Ulrich (1997) also emphasizes that in order to add value to business

11 of 159 | P a g e
organizations, the HR professionals or HR managers should play roles as: (as cited in Nel et
al., 2011).
1. Strategic partner: HR managers have to execute strategic HRM that is linked and
aligned with the organizational strategies.
2. The administrative expert: HR managers have to ensure that every day HR
activities are effective and add value to the core business of organizations.
3. Employee champion: An HR manager should have soft skills, should be able to
approach HR, and can be a representative of the employee’s voice in the
management level.
4. Change agent: it is important for an HR manager to proactively participate in any
actions and activities in order to be able to help the organization to replace the
resistance of change with resolve, create plans with the result, and identify the
main success factors for change.
2.2 The role of HR managers in employee work performance
Boxall and Purcell (2011) assert that HRM potentially contributes to employee work
performance in the organization. Boxall and Purcell (2011) also state that the quality of
employee work performance is reliant on a function of ability, motivation and opportunity.
This means HR managers intervene to develop employee ability, motivation and opportunity
in order to maximize work performance in the organization. The following is how HR
managers contribute to the development of employee ability, motivation and opportunity in
order to increase the level of employee performance (Wilton, 2011).
Ability refers to each employee’s attributes or competencies such as knowledge,
skill, attitude, and behaviour that influence a person’s capacity to perform a
particular job role. In order to ensure that employees who are recruited or selected
into the organizations are competent to perform the required jobs or are able to
respond to the further development opportunities presented, HR managers should
have an effective recruitment and selection procedure, and have learning and
development programs in place (Wilton, 2011).
Motivation refers to external and internal factors that influence employees to
perform a particular task or job well. One of the roles of HR managers is to
maximize the level of employee motivation. Wilton (2011) points out that it is
necessary for HR managers to design jobs, implement practices, conduct

12 of 159 | P a g e
procedures, and create a work environment to stimulate and encourage employees
to perform to their full potential in the way desired by the organization.
Furthermore, HR managers should understand intrinsic and extrinsic factors such
as the financial incentive, recognition, job satisfaction and achievement that
motivate workers and unlock the power of discretionary effort in them. Besides,
HR managers should pay attention to reconcile the mutual interests or mixed
motives of companies and workers, and make sure both employers and employees
have sufficient levels of the mutual relationship in order to maintain and sustain
stability of work performance (Wilton, 2011).
Opportunity refers to a chance to perform tasks and jobs well. This means the
opportunity to perform effectively and efficiently is provided by the workplace
environment which gives the necessary support for workers to reach their full
potential (Wilton, 2011). Wilkinson, Bacon, Redman, and Snell (2009) assert that
in addition to a supportive working environment, HR managers play key roles in
providing employees greater opportunity (through empowerment, more
autonomy, greater involvement and high commitment) to contribute to
organisational decision-making. Pravin (2010), Wilton (2011), and Wilkinson et
al. (2009) also claim that opportunity under empowerment and high-commitment
can lead to organizational citizenship behaviour (OCB) in which employees go
beyond normal job requirements. This can result in outstanding work
performance and effective functioning of the organization.
In conclusion, in order to have high work performance in the organization, HR managers
should ensure that the organization has an effective HRM system that aims to hire people
with the right skills and knowledge for the right positions, and develop employee skills and
knowledge required by the organization. Moreover, as satisfaction and commitment can
result in excellent firm performance, HR managers should implement and enact HR activities
and practices that bring about job satisfaction and employee commitment to the organizations
and its goals (Wilton, 2011).
2.3 Human resource management
HRM refers to all those activities including recruiting, designing work for, training and
developing, appraising and rewarding, guiding, and motivating employees in the
organization. In other words, HRM is the framework of strategies, policies, procedures and

13 of 159 | P a g e
practices for managing the relationship between employers and employees (Wilton, 2011).
Ian Beardwell and Len Hoden (1997) assert that HR management is the same as strategic
managerial functions. This is because it focuses on the management of employees in order to
reach and attain the business’s organizational goals (as cited in Boella & Goss-Turner, 2012).
Dowling, Festing, and Engle (2008) and Storey (2007) also point out that in order to reach the
business goals and objectives, as well as to provide employee satisfaction, human resource
management and HR policies should link with the organizational strategies (as cited in Boella
& Goss-Turner, 2012). In addition, Storey (2007) states that it is important for the
organization to utilize a multidisciplinary approach in HR management in order to gain a
sustained competitive advantage through effective deployment of a fully committed and
capable labour force (as cited in Boella & Goss-Turner, 2012).
Storey (2007) points out that there are two approaches (‘hard’ and ‘soft’ in characteristic) to
HRM in the organization. The hard approach to HRM, which is also known as the ‘Michigan’
style, focuses on a business-oriented style. This means the hard approach only emphasizes the
attainment of organizational objectives and goals through productivity and efficiency in the
exploitation of human resources. On the other hand, the soft approach to HRM, also called as
‘Harvard’ style, focuses much more on the attainment of goals of mutual advantage to both
employees and business organizations. This means the soft approach mainly focuses on
motivation and commitment of employees, shared values and employee involvement (as cited
in Boella & Goss-Turner, 2012). Thus, it is clear that either or both of those approaches to
HRM are practised widely by different organizations. However, employers or the
organization in different business sectors significantly vary their people-management
strategies (Nickson, 2013).
2.4 Human resource planning Professor John Genward (2004) defines human resource planning as “a strategy for the
acquisition (recruitment/selection), utilization (deployment), improvement (training and
development) and preservation (pay and rewards) of an organization’s human resources” (as
cited in Armstrong, 2006, p. 76). According to the aforementioned definition, Armstrong
(2006) concludes that human resource (HR) planning is about having the right people with
the right numbers in the right place at the right time. Furthermore, Armstrong (2006) claims
that HR planning is a method of selecting, developing, motivating, paying, retaining
employees in the organization, so poor human resource planning can hinder a company

14 of 159 | P a g e
operations thus placing them in a position where they are unable to compete effectively
against competitors in the market (Deb, 2006).
Besides, Randhawa (2007) claims that accurate and effective HR planning can help the
company to reduce its operational cost. Buhler (2002) also asserts that the company might not
be able to afford to be overstaffed or understaffed as this will drive up extra costs to the
company. For example, if the company has more employees than are needed, this will incur
extra cost because the company is paying for employees who are not being challenged to
their full capacity and capability. On the contrary, if the company is understaffed, this will
reduce the level of productivity and quality standards as there are insufficient numbers of
workers available to undertake some work or perform the work effectively (Erasmus,
Swanepoel, & Schenk, 2005).
Human resource (HR) planning is known as organizational process used to identify how
labour will be employed in the company (Buhler, 2002; Deb, 2006). In addition, Buhler
(2002) and Deb (2006) define human resource planning as the process that forecasts the
supply and demand of suitable human resources for the company. Human resource (HR)
planning includes all dimensions of the employment function such as employee selection,
employee training, employee compensation, employee advancement, and job design. In turn,
these functions can help to support the organization to increase its performance in the future
(Armstrong, 2006; Buhler, 2002; Deb, 2006). Buhler (2002), Bhattacharyya (2009), and
Armstrong (2006) further emphasize that by projecting the company’s human resource needs,
the company can identify suitable people and they can be hired, promoted, or trained.
Consequently, the right workers will be in the right job at the right time. This will help the
company in achieving its objectives in the future.
Therefore, in terms of the hotel industry, it is necessary to have effective and accurate human
resource planning by implementing an effective employee selection process, and providing
adequate necessary training for employees in order to increase organizational performance
and meet business objectives which results in gaining a competitive advantage over
competitors in the marketplace (Rees & Smith, 2014; Tesone & Pizam, 2008).

15 of 159 | P a g e
2.5 Employee selection
In this section of the literature review, the researcher covers selection of employees as this is
the first research objective of this study. Selection is the activity of gathering and evaluating
information about a candidate in order to offer employment. The employment can be either a
first position for a new worker or a different position for a current worker (Gatewood, Feild,
& Barrick, 2010). Employee selection is vital to every company. As asserted by Gatewood et
al. (2010), a company is only as good as the workers it selects or hires. Tesone (2008) also
states that if a hotel organization has an effective employee selection process, its quality of
service might be improved. Moreover, Azanza (2004) and Brown (2011) point out that if the
company cannot attract or hire talented and skilled workers, the company might fail to meet
its strategic goals and objectives. Brown (2011) and Gatewood et al. (2010) conclude that this
means the level of the organizational performance relies on its ability to select a qualified
labour force through an effective selection process.
Besides, Brown (2011) points out that the quality of employees makes a difference in how a
company competes with competitors in the market, so the quality of the selection process is
one of the critical factors of the company’s success. Du Plessis, Sumphonphakdy, Oldfield,
and Botha (2013) also point out that if the company has an ineffective hiring or selecting
process, the company is taking two risks. The first one is the risk of selecting and hiring
workers who are not qualified or up to the job. This can lead to a low level of work
performance. The second one is the risk of losing good candidates or applicants. Missing out
on talented and skilled workers can result in losing competitive advantage in the market.
Thus, it is important for the organization to spend time ensuring that the right decisions are
made in selecting and hiring the new employees rather than dealing with the problems after
poor hires. In order to have an effective selection process, There are four steps in the
selection process that organization should consider, namely (1) screening applications and
resumes, (2) interviewing, (3) undertaking testing of the candidates, (4) conducting
background investigations, and (5) making a decision whether to hire or not (Armstrong,
2010; Buhler, 2002; Hayes & Ninemeier, 2009; Nel et al., 2011).

16 of 159 | P a g e
Figure 1: The Steps in the selection process
Adapted from: Nel, Du Plessis, Werner, Poisat & Sono (2011)
2.5.1 Screening applications and resumes
The employment application form is typically used as a selection tool. This form can
help the company to identify basic selection criteria, which includes education and
experience of candidates (Nel et al., 2011). Even if applicants have their own resumes,
most companies still want applicants to complete a company application form. This is
because this form can provide exact information that the company wants and the format
that the company prefers (Buhler, 2002; Hayes & Ninemeier, 2009). In addition, it is a
good idea to have applicants take their information from their resumes and rewrite their
information on the application forms again because resumes usually include
exaggerated information (Hayes & Ninemeier, 2009)
In the screening process, the information obtained from the application form and
resume such as qualifications, competencies, and experiences of candidates will be
reviewed, evaluated and checked in order to determine which candidates are
appropriated or suitable for the position (Gatewood et al., 2010; Nel et al., 2011). More
importantly, it is essential for an HR manager or recruiter to fully understand the job

17 of 159 | P a g e
description and the job specification. This is because a job description which includes
responsibilities and duties expected to be fulfilled, and job specification which details
knowledge, skills, competencies and abilities can help the HR manager, or recruiter, to
maximize the probability that the screening procedure will remain job-related
(Gatewood et al., 2010).
2.5.2 Interviewing
The interview is one of the most important in the selection procedure in most
organizations. It is a process of finding the applicant who matches with the
requirements of the job. However, the interview is often ineffective. This is because it
is conducted by the interviewer who is untrained, makes many errors and has no
objectivity. Therefore, in order to improve the validity of the interview, the interviewers
should be trained regarding questions to ask, how to structure the interview, and where
to undertake the meeting (Armstrong, 2009; Wilton, 2011).
The validity of the interview can be improved by using a structured method in which
questions are organized and prepared in advance and used to question all candidates for
the same job. By using the same range of questions, the interviewer can compare or
judge answers across similar measures (Mukherjee, 2012). Apart from that, in order to
have an effective interview, the objective elements should be prepared beforehand. For
example, the interview room should be selected carefully to provide necessary privacy
and to avoid unnecessary interruption (Armstrong, 2009; Wilton, 2011). Furthermore,
before the interview day, the interviewer has to review and reread the applicant’s
resume, application, interview questions, the job description, and job specifications.
This can help the interviewer understand and remember skills and competencies
required for the job, as well as the candidates’ skills and competencies, when the actual
meeting begins (Armstrong, 2009; Mukherjee, 2012; Wilton, 2011).
In some organizations, a realistic job preview is also included in the interview process
such as the overall objective of the position and its responsibilities. This is because the
organization realizes that presenting only positive aspects of the job can lead to rapid
turnover in the position, so giving a realistic job preview, which includes the negative
and positive aspects, can make sure that the appropriate applicant is selected and hired
(Hayes & Ninemeier, 2009; Wilton, 2011).

18 of 159 | P a g e
The interviewer also needs to be aware of any errors that might cloud his or her
objective in the selection process such as personal biases and first impressions. Personal
biases can lead to an unfavourable reaction to a candidate, whereas first impressions
might result in a wrong judgment. Finally, the interviewers should avoid asking any
illegal questions such as age, race, religion, and sex. Otherwise, this may result in
discrimination (Armstrong & Taylor, 2014; Wilton, 2011).
2.5.3 Undertaking testing of the candidates
Employment testing is being utilized to help the selection process. As the cost of
making hiring mistakes is high, many companies invest in testing candidates in order
to minimize the cost and improve the selection process (Arthur, 2012). However, the
company has to ensure that the candidates’ testing in the selection process reflects
criteria that are necessary for successful performance of the job. This means all tests
that are employed in the selection activity must be job-related. For instance, a typing
test should not be administered to screen out candidates for a job driving a van if there
is no typing performed on the job. There are many types of applicant testing processes
such as ability tests, honesty tests, personality tests, and medical examinations
(Armstrong, 2009; Banfield & Kay, 2008; Nel et al., 2011; Wilton, 2011).
Firstly, ability tests indicate what the candidates are able to do and what they have the
potential to do, so it is important for hotels to have ability tests in order to have
insightful information about what knowledge the candidate currently possesses. Ability
tests also measure the applicant’s capacity required in the new job. In addition, ability
tests will help the hotels to determine how the applicant does the actual work that is
performed on the job. Besides, ability tests allow the hotels to identify whether a
candidate has the ability to learn a given job quickly or not (Rao, 2008).
Secondly, honesty tests are popularly used in sensitive jobs in industries including
security, pharmaceuticals, and the government. The hotels should have this test as it
helps hotels to measure the honesty of the candidates and prevent hiring dishonest
people. Hiring dishonest people can result in theft and illegal acts that destroy the
reputation of the organization (Shivarudrappa, Ramachandra, & Gopalakrishna, 2010).
Thirdly, personality tests are typically used by many organizations. This is because
personality can be a predictor of job performance, and the organization also has to

19 of 159 | P a g e
recognize the importance of the individual-job-organization fit (Arthur, 2012;
Shivarudrappa et al., 2010). Most organizations realize that matching the individual
with the job is not enough. In terms of hospitality industry, the fit with the
organizational culture is vital because selecting the participant who is the best fit to the
organizational culture can result in an increase in organizational productivity and the
improvement of organizational performance (Rao, 2008). If the hotel industry doesn’t
hire people who fit well with the cultural and structural characteristics of its
organization, those people will likely be unhappy working in the organization and are
likely to leave their job as soon as they have another opportunity that matches their
desires for a particular work environment (Lussier & Hendon, 2013). However, Rao
(2008) also suggests that in order to have effective personality tests, the organization
should have a validated instrument, and it must be a job-related test.
Finally, some jobs require a medical test to guarantee that the candidates can meet the
physical requirements of the position. However, the organization has to make sure that
medical tests are job-related and do not unfairly discriminate. In terms of the hotel
industry, this medical test should take place at the end of the selection process in order
to make sure that the candidate is healthy and is able to perform a job on a regular
basis. In addition, medical tests help the hotel industry to prevent hiring alcoholics,
drug addicts, or people who have a mental illness, which can easily result in criminal
behaviour (Andrews, 2009; Shivarudrappa et al., 2010).
2.5.4 Conducting background investigations
Background investigations are also an important component in finalizing the
candidate’s overall picture for an employee to work in the hospitality industry because
a child molester will not be suitable to employ. The main purpose of background
investigations is to prove the accuracy of factual information provided by a candidate or
to have more additional information in relation to behaviour, character, integrity,
criminal records, or legal pending cases, by contacting the previous employers or
people who are known to a candidate (Armstrong, 2009; Banfield & Kay, 2008; Hayes
& Ninemeier, 2009; Nel et al., 2011; Wilton, 2011). Background investigations are
typically made by confidential email or by telephone call. Even if background
investigations are critical in the employee selection process, they should be undertaken
carefully to avoid legal issues as background investigations have various legal

20 of 159 | P a g e
sensitivities (Armstrong, 2009; Hayes & Ninemeier, 2009; Wilton, 2011). Thus, it is
important to obtain a letter from the candidate giving permission to conduct
background investigations. Effective background investigations help the hotel
organization to guard against negligent hiring which might harm the organization in the
future (Hayes & Ninemeier, 2009).
2.5.5 Making a decision whether to hire or not
The hiring decision is the final step in the selection procedure. Depending on the hotel
organization and its procedure, a single person or a committee can make the hiring
decision. In this step, all information that has been collected during all the selection
process should be compared such as the qualification required for the position, the
qualification possessed by the candidate, candidate’s personal character, candidate’s
physical health, and pre-work references. In addition, the hiring decision should include
the salary level decision. For example, should they be hired at the highest level for their
qualification? Is an overqualified candidate going to be hired? (Armstrong, 2009;
Wilton, 2011)
In the final hiring decision, either a clinical or a statistical method might be used. The
clinical approach considers an overall view of all the information collected and then the
decision-makers make their choices. Different decision-makers might likely choose
different applicants because personal biases might influence the decision in this
method. On the other hand, the statistical method is more objective in the decision-
making procedure by measuring and comparing the applicant’s score on each selection
tool used, and then summing up the total scores from each applicant. Employing the
statistical method can result in more agreement among different decision-makers
(Armstrong, 2009; Wilton, 2011).
The hotels should ensure that the decision process be as fair as possible in order to
avoid complaints of discrimination and ensure that the decision process is carefully and
legally conducted. The documentation is vital throughout the selection procedure as the
hotels should be able to give reasons why an applicant was or was not selected. The
hiring decision is an important step in the selection procedure. This is because it is time
to ensure that the best suitable applicants are selected, or hired, for the job and this
applicant can contribute to organizational competitive advantage (Armstrong, 2009;
Wilton, 2011).

21 of 159 | P a g e
The job offer might be performed by a telephone call, or sending an email. In addition,
it is vital to communicate the decision with honesty and respect to those candidates who
are not successful. It is good public relations (Armstrong, 2009).
2.6 Training improving employee performance
Training is defined as “the process of developing a staff member’s knowledge, skills, and
attitudes necessary to perform tasks required for a position” (Hayes & Ninemeier, 2009, p.
172). Training and development can influence organizational performance. This means
training can improve employee performance, which directly improves organizational
performance in the hospitality industry (Aksu, 2005; Boella & Goss-Turner, 2012). The
second aim of this study is to look at relevant training programs that employees should
receive in order to develop their capacity of their work performance. If the organization does
not have an effective training and development program, the organization will fall behind in
terms of the skill sets and knowledge required for competitive advantage. In order to have an
ability to compete in a highly competitive market, the organization requires many talented
workers (Hayes & Ninemeier, 2009).
In addition, Hayes and Ninemeier (2009) point out that only by continually upgrading the
skills of employees it can help the organization to achieve and maintain its competitive
advantage. Training and development is a big challenge that every organization should
address. Besides, Loedolff, Erasmus, Van, Mda, and Nel (2013) claim that the rapid changes
in advanced technology in today’s workplace alter the way in which work is performed. In
order to keep up with advanced skills employees need to perform jobs successfully and
effectively, the organizations need to retrain their employees Nel et al. (2012).
Training is an investment in the labour force which helps to position itself for achievement in
the future in any hospitality organisation. The main purpose of the training is to provide the
workforce with the necessary skills and knowledge required to perform a job effectively and
successfully (Nel et al., 2012). When job responsibilities are changed and jobs are
restructured, skills and abilities needed to perform them will change as well. The organization
should pay more attention to these changes and provide the necessary training and retraining
of its workers. Job training is an ongoing process that prevents obsolescent human resource in
the organization and increase organizational productivity (Noe, Hollenbeck, Gerhart, &
Wright, 2014).

22 of 159 | P a g e
Different organizations have different reasons why they provide training to their employees
such as (1) improving productivity (training can help employees increase their level of
performance on their present assignment), (2) improving quality (training can help to reduce
operational mistakes), (3) helping an organization fulfil its future personnel needs, (4)
improving health and safety (proper training can help to prevent work accidents), (5)
obsolescence prevention (training can help employees to adapt themselves to technological
changes), and (5) personal growth (Hayes & Ninemeier, 2009; Noe et al., 2014; Randhawa,
2007). However, no matter what their reasons, training can benefit the company if it is linked
to the company’s needs and if it motivates workers. Thus, in order to ensure that the training
benefits the company and before considering available training options, a needs
analysis/assessment should be performed. There are three elements of the needs assessment,
namely (1) organizational analysis, (2) employee analysis, and (3) task analysis (Buhler,
2002; Nel et al., 2011; Noe et al., 2014).
Organizational analysis is known as a process for identifying the appropriateness of training
by analysing the characteristics of the organization. Organization analysis looks at the
training the organization needs, resources available for training, and management support for
training (Hayes & Ninemeier, 2009; Noe et al., 2014). Training needs may vary depending on
the organizational strategy. For example, the company may focus on growing or shrinking its
personnel. It may seek to serve a broad customer base or only focus on specific needs of a
particular group of customers. A company that focuses on serving a niche market may need
to continuously update its labour force on a specialized skill set (Hayes & Ninemeier, 2009;
Noe et al., 2014).
Apart from training needs in the organization, a person who plans a training activity should
consider whether the company has the budget and time for training. Furthermore, a person
who plans a training program should check whether the company support training or not.
Even if the training fits an organizational strategy and budget, the training cannot be available
if the company is not willing to support the investment in training activities (Hayes &
Ninemeier, 2009; Noe et al., 2014). However, most managers are likely to accept the training
if the training shows that it can solve current problems or lead to substantial improvement,
relative to its cost. Thus, a person who plans training should submit training proposals with
specific goals, budgets, timetables, and approaches for measuring success (Noe et al., 2014).

23 of 159 | P a g e
Employee analysis refers to a process of identifying individuals’ needs and readiness for
training. In an employee analysis process, there are three things that a person who plans the
training activity must determine. Firstly, determine whether performances result from lack of
skill, ability, or knowledge. If yes, training is appropriate; if no, any other resolutions are
more relevant. Secondly, identify an employee who needs training. Finally, determine
whether these employees are ready for training (Du Plessis, Frederick, & Maritz, 2013). In
short, only skill and ability can be influenced by training. Thus, before planning and
implementing training activities, it is vital to be sure that any performance problems result
from lack of knowledge and skills. Otherwise, the training budget will be wasted as the
training provided by the organization is unlikely to have much influence on work
performance. Besides, the employee who is selected for training should not only require
additional skills and knowledge, but also should be willing and able to learn when the
organizations provide training (Du Plessis, Frederick, et al., 2013).
Task analysis is known as a process of determining and evaluating tasks, skills, and
knowledge that training should focus on. Typically, task analysis is performed along with the
person analysis because understanding performance problems normally require knowledge
about the tasks and work environment as well as the employee (Noe et al., 2014). Before
conducting a task analysis, conditions in which tasks are performed should be identified first.
The conditions consist of the equipment and environment of the job, deadlines, safety
concerns, and performance standards. These observations can create the foundation for a
description of work activities or the tasks needed by the jobs.
For example, a person who performs task analysis should interview employees and their
supervisors in order to prepare and organize a list of tasks performed in his/her job. Then, the
analyst should show the list of tasks to employees, supervisors, other subject-matter
professionals and ask them to rate the importance, frequency, and difficulty of the list of the
tasks in questionnaires (Noe et al., 2014). For example, 0 = the least importance to 5 = the
most importance. The information obtained from these questionnaires is the foundation for
determining which tasks should be focused on in the training. Normally, training is really
needed for tasks that are frequency, important, and difficult. In addition, the analyst should
determine skills, knowledge, and abilities needed to perform each task successfully (Noe et
al., 2014).

24 of 159 | P a g e
These three pieces of the needs assessment (organization analysis, employee analysis, and
task analysis) represent a whole picture of the training needed. By linking the organization
needs, what the job itself requires, and the employee needs, the final training can be
determined and identified. After the needs assessment is performed, the objectives of training
should be established. The expected outcomes from the training programme should be clearly
identified and presented (Nel et al., 2011; Noe et al., 2014).
2.7 Employee motivation increasing employee performance
Factors that motivate hotel employees to perform at high standard levels are discussed in the
literature in this section and is the third aim of this study. Employee motivation is not a new
topic in HRM. Employee motivation has been defined by prominent scholars in various fields
and many of them give different definitions to employee motivation. However, many of these
definitions have similar ideas and notions. From the studies of the economy, psychology, and
human resources, motivation refers to reasons or factors that encourage, or make people
behave in a particular way (Armstrong, 2009; Bratton & Gold, 2012; Nelson & Quick, 2012).
From this viewpoint, an individual can be affected by many different drivers such as a desire
for an object, or basic needs like food and water. In addition, state of being may be one of
those reasons that motivates an individual to a certain way or do a certain thing. Besides,
motivation also refers to the intrinsic and extrinsic elements that influence an individual to act
in certain ways or take certain actions (Adair, 2009; Nahavandi, Denhardt, Denhardt, &
Aristigueta, 2014; Nel et al., 2011; Pinder, 2014). Motivation is a force (either intrinsic or
extrinsic) that makes people do what they do. This means individual motivation is influenced
by both internal factors (including personal needs and expectations) and external factors
(organizational reward and compensation) (Nel et al., 2011; Nelson & Quick, 2012).
In the context of HRM, motivation is critical to the organizational performance as asserted by
Bjerke, Ind, and De Paoli (2007) and Nel et al. (2011) that the organization can motivate their
employees to work harder and be involved in achieving organizational goals. Motivating
employees is about using different significant factors to influence them in the manner that
makes them feel motivated to perform their tasks with their best effort, boost their
productivity levels, or carry out their tasks at a high standard (Goncharuk & Monat, 2009). In
order to effectively motivate employees, the organization should first help their employees to
identify their interests with the organization (Goncharuk & Monat, 2009). This means after
the organization helps their staff to identify factors that make them work with the

25 of 159 | P a g e
organization, the organization uses those factors to make their employees feel motivated to
work harder and undertake their tasks with their best effort (Antikainen, Mäkipää, & Ahonen,
2010; Goncharuk & Monat, 2009).
Nel et al. (2011) also suggest that in order to have motivated employees who perform work
with his/her best effort, managers or HR managers should select and employ an individual
whose values fit with the job and the organizational culture. In addition, Ghuman (2010)
claims that organizations should develop alignment and congruence between its objectives
and employee needs in order to ensure that employees are committed to or are voluntarily
involved in achieving organizational strategic objectives and goals.
Prominent scholars in different fields have developed many motivation models, and all of
those motivation models aim to identify and explain forces and drives that can also be
employed to motivate people in the hospitality industry (Beardwell & Claydon, 2007). There
are many reasons why organizations continually focus on motivating employees. The first
reason is motivated employees tend to work with their best effort and do more than is
required of them. This can help the organization to increase its productivity (Beardwell &
Claydon, 2007).
The second reason is motivated employees are likely to work effectively, get work done on
time to a high quality and within budget. This can help the organization minimize its
operational cost and its labour cost and in turn increase its profitability (Ghuman, 2010;
Pinder, 2014). The third reason is that the level of staff turnover may to some extent be
reduced if the staff is motivated to perform their tasks. Another reason why the organization
puts more effort into motivating employees is that an organization with a motivated
workforce introduces change earlier than the organization where its employees are
demotivated (Ghuman, 2010; Nahavandi et al., 2014)
From a general perspective, each individual can be motivated. However, each individual is
not motivated or influenced by “the same things, at the same time, for the same reasons, or
with the same intensity” (Nel et al., 2011, p. 290). Thus, it is important for every HR manager
or hotel management to learn and understand the various motivational theories and know how
to apply them in different situations and conditions (Nel et al., 2011). Furthermore, in human
resource management terms, there are many different motivation models that the hospitality
industry and HR managers who work in the hotel industry should know, understand and
apply, namely Maslow’s Need Hierarchy theory, Herzberg’s two-factor theory, Theory X and

26 of 159 | P a g e
Theory Y, Alderfer’s ERG theory, McClelland’s three-need theory, and intrinsic and extrinsic
of motivation in order to able to motivate hotel employees to do their jobs and enjoy their
work (Armstrong & Taylor, 2014; Nahavandi et al., 2014; Nel et al., 2011; Nelson & Quick,
2012; Podmoroff, 2005). Besides, a better understanding of all forms of employee motivation
can help hotel managements enhance and implement motivation of employees more
effectively and then effective employee motivation will help to boost employee performance
and improve service quality directly and indirectly (Øgaard, Marnburg, & Larsen, 2008).
2.7.1 Maslow’s Need Hierarchy.
Psychologist, Abraham Maslow, is a developer of Maslow’s hierarchy of needs. A
Maslow theory of motivation does not only put emphasis on physical needs and
economic necessity, but also focuses on interpersonal and psychological needs and thus
is also relevant in the hospitality industry (Armstrong & Taylor, 2014; Nelson & Quick,
2012). The principal of Maslow’s theory of motivation is an hierarchy of five level
needs in relation to importance for survival (Nel et al., 2011). Maslow mainly focuses
on internal needs which are “physiological needs, safety and security needs, love
(social) needs, esteem needs, and self-actualization needs” (see Figure 2) (Nel et al.,
2011 pp. 290-291). Maslow believes that the lowest level, which is the most basic
needs should be met and satisfied first before the next higher needs happen and become
motivated factors of behaviour and action (as cited in Nel et al., 2011).
Physiological needs refer to the needs for survival or the basic needs (For instance, the
need for food, water, shelter, clothing, warmth, and sleep). If these needs are not met or
satisfied, human nature will be driven and guided to satisfying them (Ghuman, 2010;
Nel et al., 2011). Once the physiological needs are met, people begin to look for safety
needs in order to ensure that they are secure from any dangers. This means when people
have enough source of food and water, they will need a safe place to live, a job
security, a means of earning income. These needs can be satisfied by insurance, fixed
assets, stable job and salary (Ghuman, 2010; Nelson & Quick, 2012). Then, when
people begin feeling secure or safe in the present and the future, social needs which
include friendship, love, affection, and acceptance, emerge. These needs can be
satisfied by acceptance, recognition and love by other people (Nel et al., 2011).
The next level of needs in Maslow’s Hierarchy of Needs is esteem. Once the need of
being accepted and loved by others is satisfied, people desire to be respected and held

27 of 159 | P a g e
in high esteem by themselves and others. These needs are satisfied by achieving a high
position, achieving prestige in a workplace and society, achieving something important,
or using premium name-brand products (Ghuman, 2010). The highest level of needs in
Maslow’s Hierarchy of Needs is self-actualisation. These needs are about freedom.
After all four aforementioned needs are satisfied, people need to be free to do what they
wish to do in their lives, or become what they desire to be (Armstrong & Taylor, 2014;
Ghuman, 2010). Maslow describes self-actualization needs as the desire of a person to
increase his/her capacity, achieve what he/she thinks it is important and fulfil his/her
dream (Nel et al., 2011).
Figure 2: Maslow’s hierarchy of needs
Adapted from: Nel, Werner, Poisat, Du Plessis & Sono (2011).

28 of 159 | P a g e
2.7.2 Herzberg’s two-factor motivation theory
Herzberg’s two-factor motivation is developed by a well-known management theorist,
Frederick Herzberg. The model of Herzberg’s two-factor motivation focuses on
differentiating hygiene factors and motivation factors in the work environment (see
Figure 3) (Nelson & Quick, 2012). Herzberg believes that both hygiene factors and
motivation factors contribute to the behaviour of staff in the workplace. Hygiene factors
consist of organizational regulation and policy, working conditions, job security, status,
salary and particular types of employee benefits, interpersonal relationships with co-
workers and supervisors, quality of supervision (Nel et al., 2011). According to
Herzberg’s study, if hygiene factors are not adequate, employees will feel dissatisfied
with work; however, even if the hygiene factors are adequate, the employees are just
simply not dissatisfied. They just only feel neutral about their work (as cited in Nel et
al., 2011).
Motivation factors which consist of the sense of achievement, opportunity for getting
recognition/promotion, opportunity for growth (learning and developing), challenging
and meaningful job (for example, job enrichment), and taking over new responsibilities
can influence job satisfaction (Nel et al., 2011). Based on Herzberg’s study, the
presence of motivation factors gives employee satisfaction, but the absence of them
does not result in dissatisfaction. On the other hand, the absence of hygiene factors
results in dissatisfaction, but their presence does not satisfy employees (Ghuman,
2010).
Figure 3: Herzberg’s two-factor motivation theory
Adapted from: Nel, Werner, Poisat, Du Plessis & Sono (2011).
Hygiene Factors
Company policy
Supervision and relationships
Working conditions
Salary
Security
Motivators
Achievement
Recognition
Interesting work
Increased responsibility
Advancement and growth

29 of 159 | P a g e
Herzberg also points out that being not dissatisfied is not the same as being satisfied,
and being not satisfied is not the same being dissatisfied (as cited in Nel et al., 2011).
Nel et al. (2011) and asserts that a dissatisfied worker cannot be motivated and inspired.
Thus it is necessary for organisations to focus on hygiene factors prior to introducing
and implementing motivators into the jobs. Therefore, it can be concluded that the
combination of both hygiene factors and motivation factors in the workplace can
influence employee motivation (Chaudhuri, 2010).
When comparing Maslow’s hierarchy of needs theory and Herzberg’s two-factor
theory, there are similarities between the two theories. The hygiene factors are
equivalent to the lower level needs (the physiological, safety, and social needs)
whereas motivation factors are equivalent of higher order needs (esteem needs and self-
actualization) of Maslow’s hierarchy of needs model (see Figure 4) (Nel et al., 2011).
Figure 4: Comparing Maslow (Hierarchy of Needs) and Herzberg (Motivation-Hygiene)
Maslow (Hierarchy of Needs Herzberg (Motivation – Hygiene)
Self-Actualization
Motivators Esteem
Social, Safety, Physiological Hygiene
Adapted from: Nel, Werner, Poisat, Du Plessis & Sono (2011).
2.7.3 McGregor’s theory X, theory Y
Theory X and Theory Y have been developed by Professor Douglas McGregor. There
are two opposite perceptions about how people think about employee’s behaviour at
work (Singh, 2010). In theory X, workers are viewed as (1) lazy people, (2) people who
lack of ambition and are resistant to change, and (3) people who are self-centered and
prefer to be directed and controlled, so that the role of managers is to command and
control them (Jain, 2005). In addition, Theory X assumes the key factors of employee
motivation are monetary and job security (Lauby, 2005).
On the contrary, in theory Y, workers are viewed as (1) people who are dedicated and
want to be successful, (2) people who seek responsibility, and (3) people who are self-

30 of 159 | P a g e
directed and are committed to organizational objectives, so the role of managers is to
create a working environment in order to develop the potential in workers and help
them to be able to release that potential towards common objectives (Jain, 2005).
Moreover, theory Y assumes that primary factors of employee motivation are high
esteem and self-actualization (Lauby, 2005).
Mills, Helms Mills, Forshaw, and Bratton (2007) state that theory X supports the lower
level needs of Maslow’s theory in which employees prefer only money for their living.
On the other hand theory Y supports the higher level needs which include self-esteem
and self-actualization. Under theory X and theory Y, in order to motivate employees,
management should focus on employment benefit, delegate authority, promote
employee empowerment, and maximize job responsibilities (Elkin, Jackson, & Inkson,
2008).
2.7.4 Alderfer’s ERG Theory
Existence-Relatedness-Growth (ERG) model has been developed by theorist, Clyton
Alderfer (Jain, 2005). The ERG model focuses on three categories of primary needs
which are (1) existence, (2) relatedness, and (3) growth (Nelson & Quick, 2012).
Existence needs pay attention to the basic needs for material existence which are
physiological needs and safety needs. These needs can be satisfied by financial
incentives or money earned from work so that they can purchase food, clothing, and
shelter (Jain, 2005). Relatedness needs focus on social needs in which people desire to
create and maintain interpersonal relationships. This need can be satisfied by
acceptance and affection from co-workers and superiors (Jain, 2005; Pattanayak, 2005).
The third group is growth needs. These needs centre upon the high level of needs which
are self-esteem and self- actualisation. These needs can be satisfied by personal
development (Singh, 2010).
There are relationships between Alderfer ERG theory, Maslow hierarchal needs theory,
and Herzberg’s two-factor motivation theory (see Figure 5). However, unlike Maslow
and Herzberg theory, Alderfer has not seen existence, relatedness, and growth needs as
being a hierarchy (Singh, 2010). In Alderfer’s ERG theory, the more one needs can
occur at the same time (Nelson & Quick, 2012). In addition, the ERG theory contents
that it is not necessary that a lower level of needs must be fulfilled before a higher level
of needs are activated (Farmer, Smith, & Yellowley, 2013; Jain, 2005).

31 of 159 | P a g e
Figure 5: Relationship of three models
Comparison of Motivation Theories
Adapted from: Farmer et al. (2013), Perkins and Arvinen-Muondo (2013), and Champoux (2010)
2.7.5 McClelland’s three-need theory (achievement motivation
theory)
The achievement motivation has been developed by David McClelland and his
associates at Harvard University. McClelland asserts that human needs are not
hierarchical. People might change their needs even though one of their needs is not yet
met or satisfied (as cited in Vecchio, 2006). McClelland believes that people will feel
motivated if they have three needs namely: achievement need, power need, and
affiliation need (as cited in Singh, 2010). McClelland points out that people who are
achievement-motivated seem to concentrate on personal achievement and value
challenging work and that they have the potential to be successful. McClelland suggests
that managers who would like to motivate achievement-oriented workers should
establish challenging, realistic, achievable objectives and give immediate
recommendations about their work performance (as cited in Singh, 2010).
People who are power-motivated have a compelling desire to have authority to
influence over others, and see almost every situation as a chance to control others or
nominate others (Jain, 2005; Singh, 2010). There are two kinds of power need which
are personal power need and institutional power need. A worker with personal power
need is not good to be a manager as he/she uses the efforts of employees for his/her
Herzberg Maslow
Alderfer
Higher
Order Needs
Motivation
Self-Actualization Growth
Intrinsic
Motivation
Esteem
Relatedness
Lower
Order Needs
Social
Extrinsic
Motivation
Hygiene Safety
Existence Physiological

32 of 159 | P a g e
own advantages and benefits whereas a worker with institutional power need becomes a
great manager as s/he can organize or coordinate the efforts of other workers to
accomplish company’s long-term goals (Jain, 2005; Singh, 2010).
People who are affiliation-motivated have a need for good relationships and friendships
with others, and like a cooperative working environment rather than a competitive one
(Jain, 2005; Singh, 2010). McClelland suggests that managers who would like to
motivate affiliation-oriented workers should create a friendly, harmonious, and
supportive workplace for them in order to support them to achieve organizational goals,
and at the same time meet their affiliation needs by working with other workers (as
cited in Singh, 2010). The McClelland’s three-need theory highlights that employees
who do not have the appropriate needs can develop and increase needs through training
and learning (as cited in Mills et al., 2007).
2.7.6 Equity theory and Expectancy Theory
In equity theory, people are motivated to work by a sense of fair relationships. There
are two assumptions in equity theory. The first assumption is that employees compare
their contributions (inputs) with outcomes (rewards). Inputs consist of employee’s
previous training and experience, employee’s knowledge and skills, employee’s
qualifications, and level of workload (Jain, 2005; Singh, 2010). Outcomes consist of
employment benefits, pay, status, recognition and promotion. The second assumption is
employees will compare their inputs and outputs, and then decide if a certain exchange
is satisfactory or not. Equity will occur if they feel that their inputs are equal to those
of other individuals (Jain, 2005; Singh, 2010). Elkin et al. (2008) claim that in order to
ensure fairness in a workplace, it is important for management to regularly monitor the
difference in rewards both inside and outside the organization. Vecchio (2006) further
suggests that top management should speak with employees in order to evaluate their
reactions or feelings of fairness in the organization.
Expectancy theory is one of the most popular theories that focuses on how people think
and why they behave in a certain way in their workplace (Duke, 2010). In addition, the
expectancy theory centres upon understanding the relation between effort, performance,
and outcomes (rewards) which means that if individuals work hard, they will achieve
improved performance which results in good rewards. In the expectancy theory model,
there are three important components to be focused on which are expectancy (factors
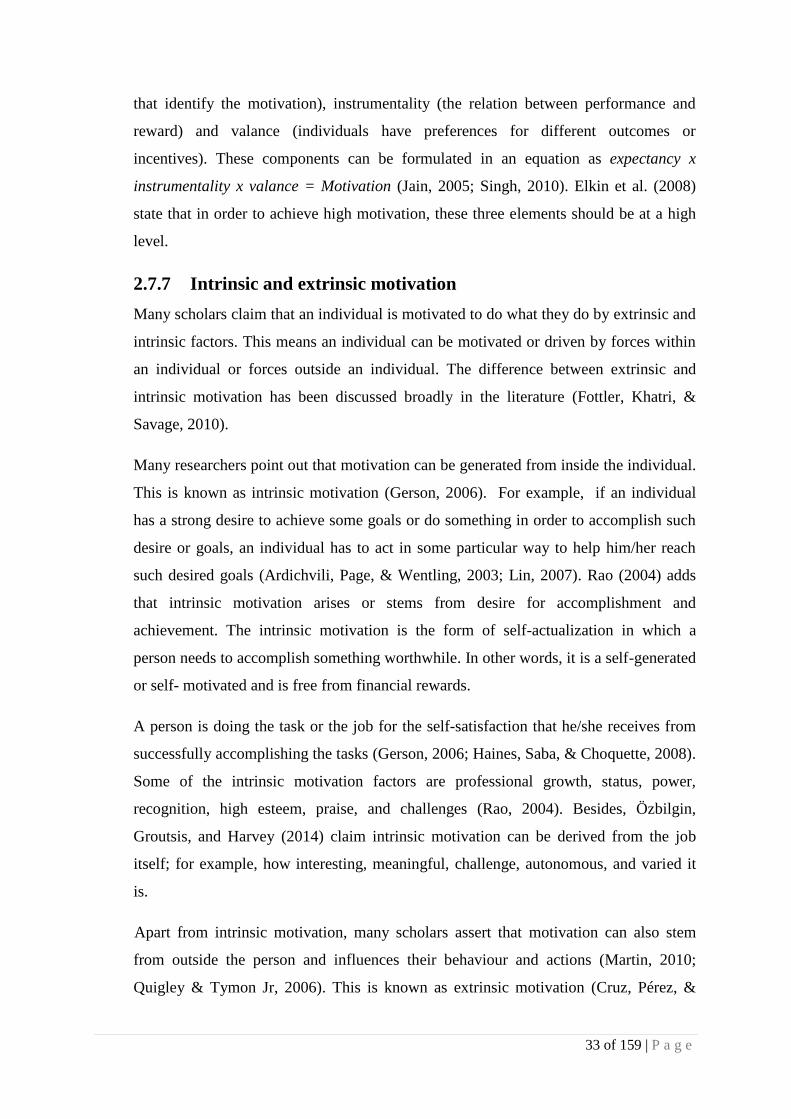
33 of 159 | P a g e
that identify the motivation), instrumentality (the relation between performance and
reward) and valance (individuals have preferences for different outcomes or
incentives). These components can be formulated in an equation as expectancy x
instrumentality x valance = Motivation (Jain, 2005; Singh, 2010). Elkin et al. (2008)
state that in order to achieve high motivation, these three elements should be at a high
level.
2.7.7 Intrinsic and extrinsic motivation
Many scholars claim that an individual is motivated to do what they do by extrinsic and
intrinsic factors. This means an individual can be motivated or driven by forces within
an individual or forces outside an individual. The difference between extrinsic and
intrinsic motivation has been discussed broadly in the literature (Fottler, Khatri, &
Savage, 2010).
Many researchers point out that motivation can be generated from inside the individual.
This is known as intrinsic motivation (Gerson, 2006). For example, if an individual
has a strong desire to achieve some goals or do something in order to accomplish such
desire or goals, an individual has to act in some particular way to help him/her reach
such desired goals (Ardichvili, Page, & Wentling, 2003; Lin, 2007). Rao (2004) adds
that intrinsic motivation arises or stems from desire for accomplishment and
achievement. The intrinsic motivation is the form of self-actualization in which a
person needs to accomplish something worthwhile. In other words, it is a self-generated
or self- motivated and is free from financial rewards.
A person is doing the task or the job for the self-satisfaction that he/she receives from
successfully accomplishing the tasks (Gerson, 2006; Haines, Saba, & Choquette, 2008).
Some of the intrinsic motivation factors are professional growth, status, power,
recognition, high esteem, praise, and challenges (Rao, 2004). Besides, Özbilgin,
Groutsis, and Harvey (2014) claim intrinsic motivation can be derived from the job
itself; for example, how interesting, meaningful, challenge, autonomous, and varied it
is.
Apart from intrinsic motivation, many scholars assert that motivation can also stem
from outside the person and influences their behaviour and actions (Martin, 2010;
Quigley & Tymon Jr, 2006). This is known as extrinsic motivation (Cruz, Pérez, &

34 of 159 | P a g e
Cantero, 2009; Gerson, 2006). When applying the idea of extrinsic motivators to a
working context, it is clearly seen that this kind of factor influences most employees to
come to work as the employees think that their work as the main source of income
(Neely, 2007; Pullins, Haugtvedt, Dickson, Fine, & Lewicki, 2000). Haines et al.
(2008) add that if there is not any incentive or not any financial reward, employees are
likely to feel that the jobs are not worth doing. Besides, Armstrong (2009), Rao (2004),
and Wilton (2010) point out that extrinsic motivation can be derived from any kind of
financial rewards such as higher pay, promotions, bonuses, retirement pay, paid
vacation, health and medical insurance.
Frey and Osterloh (2002) and Matsumura, Kijima, Nakano, and Takahashi (2003)
suggest that the organization should try to create a link between intrinsic and extrinsic
motivation. This is because only providing employee rewards and standard employment
benefit packages cannot motivate employees to devote their best effort and produce a
good performance in the long run. This notion is also supported by Iyer and Ravindran
(2009) that employees will work with their best effort only if financial incentive,
rewards, professional growth, and recognition are presented and offered, but when the
organization decides to cut those offers, the employees are likely to stop performing at
the high level. Kominis and Emmanuel (2005) and James (2005) conclude that if the
organizations would like to increase and maintain the level of employee performance in
the long run, intrinsic and extrinsic factors have to be combined. Kominis and
Emmanuel (2005) and James (2005) also claim that if the organization is able to
identify the interests and welfare of employees and employ them to motivate the
employees to work with their best effort, the organization will see a higher level of
employee performance and greater productivity.
2.7.8 Employee motivation in hospitality industry
There are numerous scholars and researchers have been interested in employee
motivation in the hospitality industry such as restaurants, nightclubs, hotels, and travel
businesses for many years (Paswan, Pelton, & True, 2005). The performance of
employees in hotel organizations can be judged or measured by their attentiveness, their
friendliness, their appearances, their attitudes, and the way they carry out and perform
their assigned tasks. St-Onge, Morin, Bellehumeur, and Dupuis (2009) add that the
good performance in hotel organizations should create a high level of customer

35 of 159 | P a g e
satisfaction. As a result, customer will go back and use the hotel goods and services
again. Watson (2008) states that the success of the hotel organizations relies on how
well they manage and motivate their employees who conduct tasks on their behalf.
However, Pegg (2009) points out that there are many factors that make it difficult to
motivate employees in hotel organizations. The first factor is that the pay in hotel
organizations is the minimum wage rate or the hotel organizations only pay what is
required by the labour law to employees. This may not meet or satisfy the basic needs
of many front-line employees (Schyns, van Veldhoven, & Wood, 2009). The second
factor is many hotel organizations, particularly small and medium sized hotels seem to
hire employees of a certain age. Some of the hotels prefer to hire younger employees
over the older one, while some of them prefer to hire older staff over the younger ones.
This can make the employees who are in an unfavourable age group not perform at
their best efforts because they think that they are not being fairly and equally treated
(Josten & Schalk, 2010).
2.7.9 Employee empowerment as motivators in hotel organization
Employee empowerment can result in employee motivation. In other words, employee
motivation is the outcome of employee empowerment (Speegle, 2009). This is because
employee empowerment provides employees job autonomy, allows employees to make
autonomous decisions, and give staff intrinsic satisfaction which in turn, motivates
them to work harder in the job and put all of their efforts into organizational goal
achievement (Pravin, 2010).
According to the study of Casas-Arce and Martínez-Jerez (2009), employee motivation
is usually used as the key strategy to motivate employees in hotel organizations and it
appears that employee empowerment is normally employed to motivate employees in
hotel organizations. For example, employees, especially front-line staff spend the
greatest amount of their time dealing and contacting directly with customers. The level
of customer satisfaction can be improved by empowering employees to deal with client
requests and solve client problems promptly without relying on supervision, help and
support from supervisors or managers all the time (Boudrias, Gaudreau, Savoie, &
Morin, 2009). Allowing employees to make independent decisions in some situations
can help employees feel involved in the organizational tasks (Bryman et al., 2005). In
addition, Özbilgin et al. (2014) state that it is vital for staff to have authority and

36 of 159 | P a g e
autonomy that enable them to be involved in decision-making as this will improve their
motivation to continue to work for the company, fulfil responsibilities and complete
tasks in the workplace.
2.8 Job satisfaction influencing employee turnover rate, employee
performance and organizational citizenship behaviour
This section covers literature with regard to the fourth objective of this study, factors that
bring about a high level of job satisfaction in order to engage employees in organizational
goals and reduce the rate of employee turnover in hotels in Laos. Job satisfaction is defined
as “the attitudes and feelings people have about their work. Positive and favourable attitudes
towards the job indicate job satisfaction. Negative and unfavourable attitudes towards the job
indicate job dissatisfaction” (Armstrong, 2006, p. 264). Typically, morale is also known as
job satisfaction. Morale occurs when employees feel their needs are satisfied or when they
feel they achieve something that have importance and value recognition in the workplace
(Armstrong, 2009). Morale or job satisfaction declines when there is more demanding and
stressful work, fewer relationships with top management, and insufficient compensation and
other rewards (Mathis & Jackson, 2011). Wicker (2011) also points out that job satisfaction
brings pleasant feelings that normally results in a positive work attitude and a greater level of
performance. Based on the study of Wicker (2011) and Ekerman (2006), a satisfied employee
seems to be more flexible, innovative, creative, and loyal.
2.8.1 Consequence of job satisfaction
There are relationships among job satisfaction, employee turnover rate, the level of
work performance, employee absenteeism and organizational citizenship behaviour
(Chandan, 2009; Mishra, 2009; Robbins, Odendaal, & Roodt, 2007; Saiyadain, 2003).
Phillips (2005) claims that there is a relationship between job satisfaction and
organizational commitment. Organizational commitment refers to the level in which
workers believe in and accept organizational strategic goals and would like to stay with
the organization. Mathis and Jackson (2011) add that “employee job satisfaction
influences organizational commitment, which in turn affects employee retention and
employee turnover” (p. 54). For workers to stay with the company, they need to feel
satisfied with their work and committed to the company (Özbilgin et al., 2014). The

37 of 159 | P a g e
figure 6 illustrates the relationship between job satisfaction and employee turnover
(Phillips, 2005).
Figure 6: The relationship between job satisfaction and employee turnover
Source: Phillips, J. J. (2005). Investing in your company's human capital. New York, NY: AMACOM
Apart from the employee satisfaction-turnover association, there is a relationship
between job satisfaction and employee performance. Saiyadain (2003) and Robbins et
al. (2007) assert that it is clear that satisfied or happy employees are more motivated
and productive than dissatisfied employees. It appears that satisfaction results in
devoting more effort by workers and consequently contributes to higher levels of work
performance. In addition, based on the study of Robbins et al. (2007), it appears that
companies with more satisfied workforces seem to be more effective than companies
with less satisfied or unhappy workforces.
Besides, Dutt (2008) and Robbins et al. (2007) claim that there is link between
employee satisfaction and employee absenteeism. Workers who are dissatisfied seem to
be absent from work, but workers who are happy with work and think their work is
important tend to be less absent. Another study by Saiyadain (2003) and Robbins et al.
(2007) shows that there is an association between job satisfaction and employee’s
organisational citizenship behaviour (OCB). It is logical to say that happy or satisfied
workers are likely to talk positively about the company, protect the company’s
resources, help and support other employees when needed, and go beyond the
expectations from the their job requirements (Nelson & Quick, 2012).

38 of 159 | P a g e
2.8.2 Factors influencing job satisfaction in the workplace There are several factors that affect job satisfaction in the workplace. The first factor
that influences job satisfaction is the reward system. Du Plessis, Toh, and Chen (2013)
and Armstrong (2009) claim that there is a relation between job satisfaction and the
organisational reward system. Du Plessis (as cited in Nel et al., 2015) and Macky and
Wilson (2013) also emphasize that reward schemes such as pay, benefits, promotions
and other financial benefits greatly contribute to job satisfaction in the workplace.
Moreover, job satisfaction improves when pay and promotion are seen as fair and
reasonable. This means equal pay for equal work and fairness in promotion are
satisfying forces (Mishra, 2009). Besides, Macky and Wilson (2013) and Mishra (2009)
state that if workers are allowed to select the type of benefits they prefer within a total
benefit plan package, both benefit satisfaction and job satisfaction will greatly increase.
The second factor that influences job satisfaction is the work itself. The nature of work
leads to the feeling of satisfaction. Autonomy, flexibility, and discretion of job can
heavily contribute to job satisfaction (Chandan, 2009). On the contrary, role and task
ambiguity, confusing guidelines, and limited and unclear understanding of the job can
result in job dissatisfaction (Mishra, 2009). The next factor that affects job satisfaction
is supervisory behaviour. Job satisfaction appears to be higher if workers believe and
feel that their immediate supervisors or their bosses are competent, treat them with
respect, dignity, and courtesy (Macky & Wilson, 2013). Mishra (2009) also believes
employees feel satisfied when their supervisors or bosses provide constructive advice to
them, interest in their welfare, listen to their opinions, are friendly, and are willing to
help and support them.
Another factor that influences satisfaction is working conditions (Mishra, 2009).
Mishra (2009) points out that good working conditions are necessary as they can result
in physical comfort. Mishra (2009) and Chandan (2009) also emphasize that the factors
that contribute to the degree of job satisfaction are a clean and tidy workplace, safety in
the workplace, air conditioning, heating system, lighting, level of noise, tools and
equipment for work performance. On the other hand, Mishra (2009) and Chandan
(2009) believe that a dark, noisy, and overcrowded workplace, high temperature and
poor air quality, long working hours and insecurity in the workplace can significantly
increase the level of job dissatisfaction.

39 of 159 | P a g e
In conclusion, Job satisfaction can derive from job autonomy, opportunities for
personal and professional growth through training and promotion, clear responsibility
for tasks, good pay and benefits, performance recognition, working conditions,
supervision, and good relationship with managers and co-workers (Mathis & Jackson,
2011; Özbilgin et al., 2014).
2.9 Conclusion
It is concluded that the components of HRM such as employee selection, employee training,
employee motivation, and employee satisfaction practices could lead to effectiveness of
organizational performance including hotel business. Thus, it is important that the Lao hotel
industry has effective employee selection practices in place, conducts employee training
periodically, uses suitable tools in order to motivate employees, and creates terms and
conditions that satisfy employees in order to keep skilful and experienced employees in their
organizations.
2.10 Chapter summary
This chapter covers literature and theories that directly relate to the research. The first section
of the chapter gives an overview of HRM theories to clarify the definition of HRM and its
important role in an organization. The second section of the chapter presents the theory of the
importance of employee selection in an organization and illustrates the process of employee
selection that an organization should consider. The third section of the chapter discusses the
great contribution of employee training to the improvement of employee performance in the
workplace. The fourth section presents the theory of work motivation and some of the factors
that increase work motivation. This selection also discusses the importance of motivation in
the workplace in relation to employee productivity and employee performance in the
organization. The final section in the chapter presents the employee satisfaction theory and
discusses the importance of employee satisfaction in the organization. Furthermore, some
factors that lead to high satisfaction of employees at work are also discussed in this section.
The next chapter is all about the different research methods and the reason why the specific
research methodology was used by the researcher.

40 of 159 | P a g e
Chapter Three: Research methodology
3.1 Introduction
The previous chapter covers the literature review in support of the aims and research
questions of this study. This chapter outlines the methods used to collect and analyse the raw
data, and discusses the reasons why the researcher uses only particular methods. This
research study adopts mixed methods for data collection and analysis. Thus, in the first
section of the chapter, the research paradigms which are basic knowledge and philosophy
behind all research methods are presented and explored. Then, the chapter underlines
difference between quantitative and qualitative research methods as well as pinpoints the
reason why both methods are applied in this research study.
Next, the chapter presents some different sources of data collection, and underlines some
crucial methods used in the data collection process, which include questionnaires, interview,
sample selection, and a pilot study. The chapter also outlines and describes some useful
approaches, or tools, to analyze and examine the raw data that are derived from the
questionnaires and interviews. In the final section, ethical issues and considerations in this
research study are explored and discussed.
3.2 Research methodology
Methodology is not just a matter of research design, but it is also the sense of using
suitable/appropriate techniques or approaches such as interviews, focus groups, surveys,
questionnaires, observations, and other techniques in the correct way. A methodology is
much more to do with how well a researcher argues from analyses of their data to draw and
defend their conclusions (Bellamy & Perri, 2012).
Crouch and Pearce (2012) point out that in order to avoid the research methodology that is
characterized by false starts, dead ends, and new directions, it is vital for the researcher to
start with a sense of purpose. For example, when the researcher knows where to go, the
decisions about how to go there - which in research are known as methodological decisions -
will come about naturally. Crouch and Pearce (2012) also describe methodology as a map for
the research journey. Besides, Crouch and Pearce (2012) suggest that it seems highly useful
to start thinking about methodology early in a research project. This is because good
methodological choices can result in a successful research project. Based on the study of
Saunders, Lewis, and Thornhill (2009), the selection of a methodology for a research

41 of 159 | P a g e
primarily relies on the type of research questions and the research objectives. In addition, in
order to choose a suitable methodology for a research project, the researcher has to
understand two main research paradigms that are (1) positivism/epistemology and (2)
constructivism/ontology (Du Plessis & Frederick, 2010; Wahyuni, 2012).
Two paradigms provide different viewpoints about how research should be conducted.
Traditionally, the positivists assume that the existence of a set of universal laws is out there
to be discovered and found (Unitec, 2014a). This position is sometimes known as the
scientific method, positivist research, or quantitative research. Positivists mainly pay
attention to the involvement of large samples, and directly focus on observation and
measurement of the objective reality that exists ‘out there’. In addition, positivists actively
seek associations and causality, formulate the theory, and then collect data to test the theory.
Besides, positivists break phenomena into the simplest parts and measure them objectively
and empirically (Creswell, 2013b; Unitec, 2014a).
On the contrary, the constructivists focus on taking a holistic notion and seeking to gain a
deep understanding of the lived experiences of the people (Unitec, 2014a). Constructivists
believe that people experience the physical and social world in different ways, so there is no
disputed answer (Unitec, 2014a). This position is sometimes known as qualitative research.
Constructivists also claim that external reality that exists outside is independent of their
interpretations, and individual interpretations are deeply embedded in a multiple contextual
web which is not able to be readily generalized to fixed settings. In addition, they posit that
there is not only one objective reality, but there are multiple realities that are socially
formulated by people from within their own contextual interpretations. Besides,
Constructivists observe phenomena by active interaction in order to minimize the distance
between the researcher and participants (Unitec, 2014a).
Thus, the research methods in this study will be influenced by these two research paradigms
(positivism and constructivism) as Briggs, Coleman, and Morrison (2012) and Adams, Khan,
Raeside, and White (2007) assert that positivism (Ontology) and constructivism
(epistemology) are the basic knowledge and philosophy behind all research methods.
3.3 Business research method “Business research is the application of the scientific method in searching for the truth
about business phenomena. These activities include defining business opportunities and
problems, gathering and evaluating alternative courses of action, and monitoring

42 of 159 | P a g e
employee and organizational performance” (Zikmund, Babin, Carr, & Griffin, 2012, p.
5).
This means the research is the process of collecting, analysing and interpreting information
and data in order to seek to understand a particular issue or phenomena. Furthermore, the
business research is a vital tool for providing grounded information for good decision-making
(Collis & Hussey, 2014; Williams, 2007). Without information or data, decision-making
involving both business tactics and strategies will not produce good results as asserted by
Zikmund et al. (2012) that the main goal of business research is to provide accurate and
precise information that minimizes the uncertainty in managerial decision-making. Zikmund
et al. (2012) also believe that before developing innovation in the form of new products,
making improvements in existing products and services, or enhancing development in
employee relationships, business has to conduct research to collect relevant information
which is used in strategic decision-making. Besides, Zikmund et al. (2012) point out that
business research is a process that consists of developing ideas and theory, defining
problems, finding and collecting information, analysing data, and corroborating and
communicating the findings and their implications.
Therefore, this research project is mainly designed to investigate and identify how HRM and
its components help hotels in Laos to have a competitive advantage, attain their goals and
sustain their business, and maintain their ongoing profitability.
In order to have effective and accurate data, the researcher will evaluate and weigh which
research methods are highly suitable for data collection depending on the business problem
and its objectives (Ghauri & Grønhaug, 2005; Zikmund et al., 2012). Typically, there are two
methods for collecting data. The first method is a quantitative data collection and the second
method is a qualitative data collection. However, this research project adopts both methods
which are also known as the mixed method.
3.3.1 Quantitative research methods
The quantitative research approach is “explaining phenomena by collecting numerical
data that are analysed using mathematically based methods (in particular statistics)”
(Muijs, 2010, p. 1). This means a quantitative research approach is usually used to
gather numerical data from physical and social activities such as actions and
conversations, and then employs statistical measurements, mathematical models, and
computational techniques to analyse those numerical data directly relating to the

43 of 159 | P a g e
phenomena (Given, 2008; Grinnell, 2012; Muijs, 2010). Furthermore, Bryman (2012)
asserts that quantitative research methods are grounded on a deductive theory in which
the researcher tests and measures hypotheses against the existing theories. Frangos
(2009), Grinnell (2012), Given (2008), and Cooper and Schindler (2014) also
emphasize that the main objective of quantitative research methods is to utilize
theories, hypotheses and mathematical models to systematically investigate, understand
and explain complex phenomena. In the deductive paradigm, the researcher conducts
the research from a general to a specific context (Unitec, 2014b). From this it can be
concluded that the quantitative research approach is designed to be used in research in
which the research objectives and the research questions are clearly identified
(Venkatesh, Brown, & Bala, 2013).
A conclusive research approach is usually employed in quantitative research methods.
The conclusive research approach involves the use of statistical tests, large sample sizes
and highly structured techniques. The conclusive research approach usually employs
questionnaires with closed-ended questions for data collection and uses SPSS software
for data analysis (Nargundkar, 2008). Furthermore, the conclusive research approach
mainly focuses on the results of findings which are conclusive, and not tentative.
There are two research models in the conclusive research which are descriptive
research and causal research (Unitec, 2014b). Descriptive research aims at seeking to
fully understand a particular phenomenon (Anastas, 2012; Sheppard, 2004). Kuhn
(1970) also states that descriptive research primarily focuses on increasing the accuracy
and the scope in which the facts are clearly known (as cited in Anastas, 2012).
However, there is a limitation of the descriptive research approach. As the results of
this kind of this research approach are based on a particular point of view, there is a
lack of rigorous experiment or lack of causal argument.
In contrast to descriptive research approach that places emphasis on describing who,
where, what, when, and how, a causal research approach highly focuses on answering
the question “why”. Causal research is formulated to examine or determine the cause
and effect relationship of an event as Neuman (2011) and VanderStoep and Johnson
(2009) point out that causal research which is also known as experimental research is
designed to determine and test cause and effect relationships through observing the
influence of the independent variables on the dependent variables.

44 of 159 | P a g e
Hence, Kemp and Lewis (2007) summarize that quantitative research methods are used
to address the objectives of both descriptive and causal research via numerical data
collection and statistical data analysis. Furthermore, Taylor (2005) and Teddlie and
Tashakkori (2009) emphasize that the primary purpose of utilizing quantitative
research methods is to prevent invalid and unstructured descriptions in gathering data.
Besides, Marshall, Moncrief, Rudd, and Lee (2012) add that as under quantitative
research approaches the data are collected or analyzed from a big targeted group or
sample that are representative of a population, the results are valid and reliable.
The advantage of using quantitative research methods is that the data or the findings
from the sample under the research area are accurate and precise. This is because the
data is collected from a large sample that reflects the overall population. Another
benefit of quantitative research methods is the statistical programs and mathematical
software are employed to analyse data. This results in more statistical reliability and
validity (Bennett & Elman, 2006; VanderStoep & Johnson, 2009). Besides, quantitative
research is a low-cost method as it uses questionnaires to collect or gather data and
information (Mukherji & Albon, 2009).
However, in spite of many advantages, there are some drawbacks to using quantitative
research methods. Firstly, the findings from quantitative research methods seem to be
fairly superficial because the study includes too many participants or the researchers
might be overwhelmed by too much information that cannot be analysed correctly
(VanderStoep & Johnson, 2009). Furthermore, this type of research approach is limited
to provide in-depth data relating to participants feelings and thoughts, and this method
fails to examine and understand participants’ interaction (Covington, 2008;
VanderStoep & Johnson, 2009). Besides, there are some criticisms of using quantitative
research approaches for collecting and analyzing the data as stated by Bryman (2012)
that there is less precision and accuracy in measuring and preceding the data, and the
methods in this research are rigid and static.
After exploring the advantages and disadvantages of quantitative research methods, the
researcher decides to use this research approach in this study. This is because this
research method allows large samples to be involved or engaged. In addition, the
objectives of this research are to identify the factors that motivate and satisfy
employees and find out the reward system that is suitable for hospitality organizations

45 of 159 | P a g e
in Laos. Therefore, conducting a survey questionnaire method for collecting data from
a large number of workers in hospitality organizations in Laos is necessary. It is stated
by Zikmund et al. (2012) that having vast amounts of data and information from many
participants and employing a scientific and statistical programme to measure and
analyse the research data can lead to valid and reliable results that can answer the
research problem and the research question.
3.3.2 Qualitative research methods
Qualitative research methods are clearly different from quantitative research methods.
This is because qualitative research methods mostly focus on collecting words, pictures,
and objects rather than numbers. Cohen, Manion, and Morrison (2013) and Cho and
Trent (2006) point out that unstructured or semi-structured techniques such as in-depth
individual interviews, media analysis, focus groups, and observations are typical data
collection methods in qualitative research. In addition, the data from qualitative
research such as words, pictures, and objects are frequently analysed without the use of
statistics.
Unlike quantitative research methods that heavily rely on statistical measurement,
qualitative research methods are employed to explore and discover ideas of
participants. Also, this kind of research method allows the researcher to get deep
insights into the interpretation of a particular situation (Unitec, 2014b). Walsham
(2006) and Johnson and Christensen (2010) emphasize that unlike quantitative research
methods, which are applied when the research objectives are clearly identified, the
qualitative research approach is mostly conducted when the research topic is little
known, when the research objectives are unclear and ambiguous, or when the
researcher wants to explore or study more about the phenomena. This means rather than
testing and measuring the hypothesis and specific research questions, a qualitative
research approach is commonly employed to obtain a new theory by giving great
insights into a particular phenomenon.
The qualitative research approach is also known as exploratory research because it is
employed to obtain an understanding of fundamental reasons, motivations, intensions,
attitudes, and behaviours (Babbie & Rubin, 2012; Cohen et al., 2013). In exploratory
research projects, the researcher usually applies a qualitative research approach for data
collection. This is because exploratory research mostly puts emphasis on obtaining in-

46 of 159 | P a g e
depth knowledge of a certain situation, developing testable hypotheses, producing
effective solutions for the complex problems, and formulating new concepts for further
study (Unitec, 2014b). Neuman (2011) adds that the researcher can evaluate and
examine the larger content of the creation, distribution and reception of qualitative
research as the outputs from qualitative research consist of the interaction and
interpretation of the participants. Under this kind of research approach, the data are
collected through in-depth and extensive interviews and observation in a small target
group or focus groups (Bryman, 2012; Sutherland & Canwell, 2008).
Besides, Neuman (2011) asserts that a qualitative research approach formulates and
develops the coherent theory which can be causal, non-causal, and mostly inductive.
Zikmund et al. (2012) also emphasize that even if a qualitative research approach is less
structured than a quantitative research approach, it can provide deeper and greater
understandings about phenomena than quantitative research approaches do. This kind
of research approach also helps the researcher to clarify the research problems which
can be transferred to the clear and precise research objectives.
One of the advantages of a qualitative research approach is a dynamic and flexible
research design. The qualitative research methods allow the researcher to modify the
research design or research procedures at any time when more observations are
collected (Babbie & Rubin, 2012). Another advantage is this research method allows
the researcher to obtain insights into underlying problems which helps to generate and
develop ideas and hypotheses for further potential quantitative research (Babbie &
Rubin, 2012; Neergaard & Ulhøi, 2007). In spite of some great strengths, there are
some weaknesses of using the qualitative research approach. Firstly, it lacks
generalizability and reliability as its great depth and details usually obtain from small
numbers of participants or a small sample that cannot be considered as representative
(Elo & Kyngäs, 2008; Shi, 2008). Shi (2008) also states that another weakness of the
qualitative research approach is that it requires the researcher to have a basic
knowledge of the research topic or subject in order to conduct extensive interviews and
detailed observations.
In addition to the quantitative research methods, the qualitative research methods are
also employed in this research project. This is because this research study also
determines the in-depth information on current systems that HR managers have

47 of 159 | P a g e
implemented in order to select the right employees for the right positions, improve
employee capacity and engagement, motivate employees to work, and retain employees
in hospitality organizations. Moreover, it is important for the researcher to explore an
HR manager’s understandings about HRM practices and to discover the HRM problems
and issues that are confronted by them.
3.4 Method of data collection
The task of data collection starts after a research problem has been identified and the research
design has been planned (Aggarwal & Jain, 2008; Mooi & Sarstedt, 2011). While choosing
which data collection method to be used in the research study, the researcher should
understand two types of data which are primary and secondary. In addition, the researcher has
to decide which kind of data he/she is going use for his/her study because the methods of
collecting and obtaining primary and secondary data are different (Aggarwal & Jain, 2008;
Mooi & Sarstedt, 2011).
3.4.1 Primary data
Primary data are those that are collected afresh, for the first time, and from the
beginning to end. Primary data are also known as original data collected from the
source of origin and in the process of investigation. There are several ways to obtain
this kind of data such as observation method, interview method, through questionnaires,
and through schedules (Kothari, 2011; Mooi & Sarstedt, 2011). However, according to
the aim and the objectives of this research, the researcher uses only survey
questionnaires and semi-structured interview for collecting primary data.
Babbie and Rubin (2011) point out that survey questionnaires allow the researcher to
generate accurate findings and deliver concrete results such as through questionnaires,
the data are collected from large samples and are analysed by using a statistical analysis
program. In addition to questionnaires, Mitchell and Jolley (2012) claim that the semi-
structure interview helps the researcher to know how respondents answer a series of
standard questions and also allows the researcher to expand on or ask additional
questions in order to have more answers in greater depth. Besides, Cargan (2007)
believes that the semi-structured interview helps the researcher to avoid
misinterpretation as the researcher is able to clarify the meanings of the answers from
respondents.

48 of 159 | P a g e
3.4.2 Secondary data
Secondary data are defined as the data that have already been gathered and analysed by
some other scholars or researchers (Bajpai, 2011). In other words, secondary data are
those that already have been collected by other researchers or scholars and that already
have been processed through the statistical analysis (Aggarwal & Jain, 2008; Kothari,
2011; Mooi & Sarstedt, 2011). Secondary data usually comes in a wide range of forms,
including research articles, various publications, journals, books, annual reports,
magazines, and newspapers (Teddlie & Tashakkori, 2009). Zikmund et al. (2012) point
out that secondary data is vital for the researcher when the primary data (data that the
researchers have collected by themselves through their own questionnaires, interviews,
and so on) cannot be obtained. Besides, Zikmund et al. (2012) assert that the secondary
data collection does not only provide background information about the research area
but sometimes also provides actual data to answer the research questions.
Therefore, according to the aim and objectives of this research project, secondary data
relating to HRM in hospitality will be collected widely as suggested by Smith (2008)
and Sreejesh, Mohapatra, and Anusree (2013) that the researcher should collect and
analyse secondary data in order to have basic knowledge about the research area,
identify and clarify research problems, and be able to obtain answers to the research
questions.
3.4.3 Data collection
The main data for this research project is gathered in Lao PDR which is the home
country of the researcher. As the majority of Lao people speak Lao as an official
language and not many people speak English, the research instruments such as the
questionnaire and the interview transcripts are prepared in both English and Lao.
Both quantitative and qualitative research methods (also known as the mixed research
methods) are employed for data collection in this research study. Mixed research
methods are the approaches that integrate both quantitative methods (designed to
collect numerical information) and qualitative methods (designed to collect words or
narrative information) for collecting and analysing data, combining the findings, and
drawing conclusions in one single research study (Borrego, Douglas, & Amelink,
2009; Teddlie & Tashakkori, 2009). The main reason why mixed research methods are

49 of 159 | P a g e
employed and applied in this research project is the researcher wants to gain a deep and
better understanding of HRM practices and its roles in relation to employee motivation,
retention, and performance in hospitality organizations in Laos as stated Borrego et al.
(2009) and Creswell and Clark (2011) that mixed methods allow the researcher to
achieve in-depth understanding of phenomena and have breadth and depth of
corroboration.
There are several approaches of collecting data in mixed research methods such as (1)
indirect and direct observation methods, (2) structured, semi-structured, and
unstructured interview methods, (3) through questionnaires, (5) through schedules, and
other methods (Kothari, 2011; Kumar, 2014). However, in order to have sufficient
evidence and detailed information to support the main objectives in this research
project, the researcher utilizes only both self-administered questionnaires and semi-
structured interview methods for data collection.
3.4.3.1 Self-administered questionnaire
The first method of data collection is employing self-administered or self-
completion questionnaires (see Appendix 1) to explore opinion and experience
about employee training, work satisfaction and motivation of employees in the six
selected hotels in Laos. In the self-completion questionnaire, many of the questions
are designed and developed for employees in hospitality organizations. Participants
are randomly selected. They can be any employees from any level, such as chef,
room service staff, housekeepers, front desk staff, bellhops, van drivers, pool
attendants, and so on in the selected hotels, and who are willing to answer a series of
questions. The interested questionnaire participants may come from any level from
selected hotels because this is a strictly voluntary participation. As long as they work
in selected hotels and they are also interested in participating in this research project,
they can complete the questionnaire. It is important to note that HR managers and
hotel managers will not be allowed to be involved in the questionnaire, they can
fully participate in the interviews only.
The researcher employs the self-completion questionnaire in this research study
because it can help the researcher to have sufficient and accurate data that are
required in the data analysis process. Self-completed questionnaires also help the
researcher to save time as participants answer questions or complete the

50 of 159 | P a g e
questionnaire by themselves (Bell & Bryman, 2011). Brace (2013) also emphasizes
that one of the most popular tools for data collection is a self-completion
questionnaire which can help researchers to reach a large number of participants.
In this researh project, the researcher carefully designs and develops the questions in
self-completion questionnaires as suggested by Fowler (2009) and Brace (2013) that
the questions in the questionnaire should be relevant to the research objectives,
clear-cut, and unambiguous in order to get accurate and relevant information to
answer the research question, and ensure that the respondents answer the questions
correctly and do not accidentally omit or skip the questions.
Besides, the researcher formulates questions by using simple, direct and percise
words as recommended by Azzara (2010) that in order to avoid bias and reduce
complication in the questionnaire, it is necessary for the researcher to use an
appropriate wording in each question in the questionnaire. Moreover, the researcher
does not use jargon or technical words or phrases that are not familiar to respondents
or participants. It is recommended by Kothari (2011) and Brace (2013) that a
questionnaire should be well-constructed and be easy for the respondents to
understand in order to prevent misunderstanding and misinterpretion. Kothari (2011)
also emphasizes that every question in the questionnaire should directly link to the
research aims, and cover all of the research objectives in order to ensure that the
researcher has accurate and sufficient data for the analysis.
Therefore, to guarantee that the questionnaire addresses the objectives of this
research project, the researcher has formulated 29 questions and all of them are
closed-ended questions. Closed-ended question refer to the question that give the
respondents with options or choices from which to select or choose a response (Reid
& Bojanic, 2009). The reason why the researcher employs closed-ended questions is
that it is easy for participants or respondents to understand and it does not take much
time to complete questions that have optional answers. In addition, Lewin (2005)
claims that closed-ended questions help a researcher to analyse data easily and
correctly. Reid and Bojanic (2009) add that the data which is in the form of closed-
ended questions is easy and simple to record.
In terms of the structure of the questionnaire in this study, it begins with a brief
summary of the main purposes of the research. There are three types of questions in

51 of 159 | P a g e
the questionnaire namely, multiple choice, rating scale, and yes/no questions. The
questions move from general to the specific aspect of the research project.
3.4.3.2 Interview
“Interview is a process in which a researcher and participant engage in a
conversation focused on questions related to a research study” (Merriam, 2009, p.
87). Interviews are generally divided into three types such as structured, semi-
structured, and unstructured (Bell & Bryman, 2011). A structured interview refers to
the interview that the researcher asks a set of questions and the researcher can not
change those questions, and ask all participants the same questions (Lodico,
Spaulding, & Voegtle, 2010). In contrast to a structured interview, a semi-structured
interview is an interview that the researcher asks a series of standard questions and
the researcher can also ask any additional questions in order to have in-depth
answers to the standard questions (Mitchell & Jolley, 2012).
Another type of the interview is an unstructured interview. This type of interview is
like a conversation and allows for the most flexibility. The researchers might have
some opened-ended questions and a list of topics that they would like to ask and
cover in the interview. In addition, in this type of interview, the interviewee directs
the interview, and the researcher just listens and responds in a conversational style.
Besides, the researcher is allowed to ask additional or further questions to get more
detail or to redirect the interview to areas that have not been discussed yet (Lodico et
al., 2010).
In this research study, the researcher employs only semi-structured interviews as a
second method of data collection. In the semi-structured interview approach, open-
ended questions are formed (see Appendix 2) and the researcher only chooses
people who are in positions such as HR managers in selected hotels in Laos. As they
are HR managers who work or get involved directly with the job that relates to or
identifies with the research topic, they can supply in-depth, accurate and precise
information.
The first reason why the researcher applies the interview is the researcher whould
like to know more about an HR manager’s experience in an hotel organizations. It is
asserted by Bailey, Hutter, and Hennink (2010) that the interview is employed when

52 of 159 | P a g e
the researcher seeks information on personal experiences, perception, beliefs,
feelings and emotions from respondents about some particular topics.
The second reason that the researcher uses this approach is the researcher would like
to seek to understand the perspective of HR Managers in relation to employee
selection and employee training in their organizations. It is asserted by Merriam
(2009) that the semi-structured interview assists the researcher with a deeper
understanding of the issues and this method can support the research objective when
comparing to employing only questionnaires.
Another reason why the researcher employs the semi-structured interview is this
approach allows participants to discuss the problems freely. This can help the
researcher to get extensive and detailed data that can be used in answering the
research questions and an analysis process (Sutherland & Canwell, 2008). Moreover,
Hesse-Biber and Leavy (2010) claim that the semi-structured interview allows the
researcher to have more detailed and in-depth information from respondents via
direct or face-to-face communication. Hesse-Biber and Leavy (2010) also emphasize
that the researcher gains deep, broad, and expert knowledge from different
perspectives of participants when the researcher and the participants are fully
engaged in conversation, especially asking, answering and listening.
However, there are some issues that the researcher has to consider when conducting
an interview as stated by Polonsky and Waller (2010) that as the researcher allows
respondents to freely provide and share information, the participants might use
different terms to describe the same thing which may cause difficulties for the
researcher to compare responses in the interview. Therefore, Polonsky and Waller
(2010) recommend that the researcher should create and design a proper plan and
adopt the most effective approach that helps to prevent difficulty in creating coding
and transcribing. Moreover, Polonsky and Waller (2010) advise that prior to
conducting an interview, the researcher should be trained in order to have interview
skills. Besides, Polonsky and Waller (2010) emphasize that the researcher should be
flexible, observant, open-minded, and responsive, and should listen actively in order
to be a good interviewer.

53 of 159 | P a g e
3.4.3.3 Pilot study
A pilot study acts as a small-scale study that researchers carry out before the real
survey (Blessing & Chakrabarti, 2009; Wilson, 2010). Beri (2013) states that pre-
testing of a questionnaire should be performed before a real research. Blessing and
Chakrabarti (2009) and Wilson (2010) also emphasize that undertaking a pilot study
can help the researcher to get information to improve and revise the questionnaire’s
content, format and sequence. Thus, in this research study, the researcher has carried
out a small scale pilot survey in order to test the questionnaire and to make sure that
(1) the questionnaire is clear and understandable, (2) the answers obtained from the
questionnaire addresses the research objectives, and (3) language use in the
questionnaire is clear and correct. As a result, there may be some changes that have
to be made in order to make the questionnaire more precise and clearer.
In relation to the interview, prior to the official interviews with the participants at the
selected hotels, the researcher has conducted a pilot study in order to examine
grammar and wording, check translating of interview questions, and check the
understanding of participants relating to the interview questions. Two HR managers
and three other employees who work for hotels were invited to participate in the
pilot study and they have been asked to give feedback on the interview questions
such as the terms and concept, and some ideas on how the interview questions could
be improved. After finishing the pilot and based on feedback, changes were made in
order to avoid biased answers and unclear questions.
3.5 Sampling
Dawson (2009) and (Kothari, 2011) assert that if the researcher does not have a huge fund
and unlimited timescale, it will be difficult for the researcher to obtain information from all
people within his/her research population. Martyn (2010) adds that in order to overcome this
problem, the researcher has to choose a smaller and more manageable number of people to
participate in his/her research study. This is known as sampling (Dawson, 2009). Dawson
(2009), Kothari (2011), and Martyn (2010) believe that if this sample is selected carefully by
employing the correct procedure, it is possible that the sample can be used to generalise the
results overall of the research population. Kumar (2014) agrees and adds that the selection of
an appropriate sample can be the significant part of any research. Kumar (2014) also
emphasizes that a sufficient sample size can lead to the accuracy of the research study and
findings.

54 of 159 | P a g e
In addtion, Cargan (2007) points out that identifying population size for the research study is
crucial. This is because the characteristics of the population influence the need of the sample
size. Blaikie (2009) emphasizes that a common mistake in determining samples is that the
researcher thinks that a sample is only some proportion of a research population, so Blaikie
(2009) recommends that prior to choosing sampling methods, there are some factors that the
researcher has to take into account, such as the amount of variation in the target population, a
scale of measurement that is being performed, and analysis methods that can be applied.
Bergman (2008) also asserts that there are different sizes of sample that are being used in
mixed methods designs. This is because data that are from qualitative and quantitative
approaches are collected for different purpose. Bergman (2008) further explains that the main
purpose of sampling in a qualitative research study is to obtain detailed and specific
information about an event and situation, and seeks to understand more about different
perspectives and views of each individual, whereas data that are from a quantitative research
study is to draw inferences about the a particular group from a selected sample. Kumar
(2014) points out that there are two views about identifying sample size in quantitative and
qualitative research. In quantitative research, the sample size is predetermined based on the
available resource and some other considerations, whereas in qualitative research, the
researcher does not predetermine the sample size but the researcher will determine when the
sufficient information has been received during the data collection process.
Besides, Martyn (2010), Dawson (2009) and Kumar (2014) further point out that in
quantitative research, the researcher attempts to choose a representative sample which relates
to the overall survey and the data collected from the representative sample can help the
researcher to generalize his/her work to the overall research population’ Whereas in
qualitative research, the researcher tries to select a sample which is small-scale and the data
which is obtained from this small-scale sample allows the researcher to understand more
about different opinions and to obtain in-depth information from participants. Martyn (2010),
Dawson (2009) and Kumar (2014) also emphasize that there are two methods of selecting
samples in research study which are probability sampling and non-probability sampling. In a
probability sampling methods, every individual within the study population has a specifiable
and equal chance of being selected. On the other hand, the researcher uses a non-probability
sampling method (also known as a purposive sampling method) when his/her goal is a
description rather than generalization, when it is difficult for the researcher to specify the

55 of 159 | P a g e
possibility of one individual being included in the sample, and when there is insufficient
information about the target population.
In relation to sampling selection in this research project, the researcher applies a probability
sampling method in which every unit in the study population has an equal opportunity of
being selected. By weighting sampled units according to their probability of selection can
help the researcher to accurately determine samples. The researcher has sent request letters to
most of the three to five star hotels in Vientiane, Laos. This means most three to five star
hotels have equal opportunities to participate in this research project if they are interested.
In relation to sample size, these six hotels are able to represent the whole hotel industry in
Laos in relation to HRM practices. This is because the six participated hotels are amongst the
biggest hotels in Laos and there is not much variance in this kind of business. In addition, due
to a limited time and budget constraint, the researcher cannot use a large sample of all three
to five star hotels in Laos. However, Zikmund et al. (2012) and Neuman (2012) suggests that
a small sample might be more accurate than the total study population, and a small sample
can be used to generalize to the study population. Zikmund et al. (2012) also claim that a
poorly identified population can lead to less reliable information than a carefully obtained
sample. Thus, six hotels are selected to participate in this research project, and each HR
manager from each hotel is considered as a sample for the interview. In addition, the
respondents for the questionnaire are between 15 to 20 % of the total number of employees in
each hotel (the proportion of respondents is according to the total number of employees in
each hotel).
In the qualitative data collection process, each HR manager from each targeted hotel is
interviewed in order to seek to understand their HRM skills and their HRM practices. This
can help the researcher to obtain sufficient and detailed information to support the research
objectives which relate to employee selection and training. In addition to qualitative data
collection, quantitative data collection is applied to collect numeric data, and 100 employees
from six hotels will be sufficient as group representatives. 100 respondents can provide
sufficient information relating to employee motivation and satisfaction in the hotel industry.
In addition, 100 respondents are sufficient for statistical analysis in SPSS software.
Besides, the researcher estimates that the total number of employees in the six hotels should
not exceed 10,000 which is considered a small population sizes (Rea & Parker, 2005). In
addition, the researcher does not need to have a sample size over of 50 percent of the total
selected population (Rea & Parker, 2005). Therefore, the researcher selects 100 samples from

56 of 159 | P a g e
the six hotels, which is 95% level of confidence (Rea & Parker, 2005). This means that this
sample size allows for valid and reliable data analysis. The following table shows minimum
sample sizes for selected small populations.
Population Size (N)
Sample Sizes
95% Level of Confidence 99% Level of Confidence
±3% ±5% ±10% ±3% ±5% ±10%
500 250a 218 81 250 250 125
1,000 500a 278 88 500 399 143
1,500 624 306 91 750 460 150
2,000 696 323 92 959 498 154
3,000 788 341 94 1142 544 158
5,000 880 357 95 1347 586 161
10,000 965 370 96 1556 622 164
20,000 1014 377 96 1687 642 165
50,000 1045 382 96 1777 655 166
100,000 1058 383 96 1809 659 166
Note: The choice of ±3 percent, ±5 percent, and ±10 percent for confidence intervals is based on
the tendency of researchers to use these intervals or a similar range of intervals in the design of
their surveys. a Population sizes for which the assumption of normality does not apply; in such
cases, the appropriate sample size is 50 percent of the population size.
Source: Rea & Parker (2005). ‘Designing and conducting survey research: A comprehensive guide (3rd ed.)’
3.6 Data analysis methods
After raw data has been collected, the data analysis task is undertaken. Data analysis is the
practice of evaluating data employing analytical and logical reasoning to examine and
interpret each piece of raw data (Business Dictionary, 2014). Merriam (2009) adds that data
analysis is the translating and interpreting process used to answer the research question(s).
Merriam (2009) and Krishnaswami and Satyaprasad (2010) claim that the data analysis is the
most demanding and skilled task in the research process as it requires the researcher’s own
judgement and skill. Thus, in this research study, the researcher classifies data into two
categories which are (1) quantitative data collected through questionnaires and (2) qualitative

57 of 159 | P a g e
data collected from interviews. Then, the researchers use many different tools and approaches
to analyse the data.
3.6.1 Quantitative data analysis
This research employs the Statistical Package for the Social Science (SPSS) to analyse
the data that derive from the questionnaires. SPSS is an analytical computer program
which has been developed for the analysis of social sciences data (Ho, 2006). SPSS
helps researchers examine and extract meaning from the data and reduce or eliminate
errors in data analysis (Oliver, 2010). Oliver (2010) also emphasizes that SPSS helps
the researchers to manage data effectively and is suitable for managing and analysing
complex samples and data. In addition, SPSS can help the researcher to calculate the
mean scores of the questionnaires and formulates the nature of relationships that occur
in the data, and then the raw data will be interpreted or transformed into information
which answers each research question and hypothesis (Hinton, McMurray, &
Brownlow, 2014). Saunders et al. (2009) also emphasize that SPSS helps the researcher
to interpret, examine, describe, and show data in many significant ways such as graphs,
chart, and statistics. These visual presentations help the researcher to describe the data,
compare trends, and explore relationship within the data easily.
Besides, SPSS offers the researchers a large number of statistical analyses in social
sciences or on research data (Hinton et al., 2014). Hinton et al. (2014) and Ho (2006)
also contend that in SPSS, there are three modules of data analysis which are: (1)
univariate, (2) bivariate, and (3) multivariate analysis. Univariate analysis is used to test
hypotheses involving a single variable. This test is known as Frequency test which
explores only one variable in a data set (Unitec, 2014d). Bivariate analysis is used to
test hypotheses involving two variables. This test includes Correlation analysis, T-test
analysis, and Cross-tabulation analysis (Unitec, 2014d). Multivariate analysis which
consists of Regression, ANOVA is carried out to analyse three or more variables or sets
of variables (Unitec, 2014d).
Even if there are many useful tools for analysing quantitative data in SPSS software,
the researcher selects only some of them as suggested by Sekaran and Bougie (2010)
and Niedrich, Weathers, Carter, and David (2009) that the choice of selecting tools for
analysing data in SPSS software depends on the type of data collected and the objective

58 of 159 | P a g e
that the researcher would like to emphasize and illustrate. Therefore, the first analysis
tool that the researcher employs is the frequency test.
3.6.1.1 Frequency analysis
The frequency test is one part of descriptive statistics. In statistics, frequency refers
to the number of times an event occurs. Frequency test is a significant area of
statistics that deals with the number of occurrences, and then analyses measures of
central tendency, dispersion, and percentiles for interval level data (Greasley, 2007;
Hinton et al., 2014). Frequency analysis provides the researcher with an initial
overview of the selected sample or study population. It also shows the different ways
respondents answered a question (Unitec, 2014c). However, frequency analysis can
test only be one variable, and it is unable to test the relationship between variables
(Unitec, 2014c). For example, the frequency test will illustrate: how many people or
cases in each category, how many male/female expatriates are there, or how many
respondents have experienced culture shock.
3.6.1.2 Correlation analysis
The second analysis tool that is applied for data analysis is correlation analysis.
Correlation analysis is used to test relationships or associations between two
continuous numeric variables or two interval variables (Greasley, 2007; Norusis,
2011; Unitec, 2014c) . In other words, correlation measures how variables are
related or linked. Only interval variables can be tested in correlation analysis
(Unitec, 2014d). There are two types of Correlation analysis which are: (1) bivariate
correlation and (2) partial correlation.
Bivariate correlation is used to determine if two variables are directly related or
linked to each other. For example, bivariate correlation is used to test if there is a
relationship between husband’s contribution to housework (a dependent variable)
and a number of children (an independent variable) (Healey, 2012). On the other
hand, partial correlation is used to determine if two variables arise because both are
correlated or linked with a third variable (Sharma, 2007). In other words, partial
correlation is used to test how the bivariate relationship changes when a third
variable (a control variable) is introduced. For example, partial correlation test if
well-educated husbands respond differently to an additional child than uneducated
husbands (Healey, 2012).

59 of 159 | P a g e
3.6.1.3 Cross tabulation
The third analysis tool that the researcher uses for data analysis is cross-tabulation.
Cross-tabulation which is also known as Crosstabs is a contingency table that
summarizes categorical data. Cross-tabulation is mostly used in business surveys
and scientific research. The cross-tabulation can illustrate the basic picture or visual
of the interrelation between two variables (Rubin, 2012). Frankfort-Nachmias and
Leon-Guerrero (2014) point out that only nominal and ordinal variables are able to
be tested in the cross-tabulation analysis.
A cross-tabulation table illustrates how two or more nominal variables are connected
or related. A cross-tabulation table also shows the frequencies or percentages of the
groups of one variable cross-tabulated with the frequencies or percentages of other
variables (Rubin, 2012). Typically, in cross-tabulation, Chi-square test is used to
examine null hypothesis (Unitec, 2014d). In the Chi-square test process, if the P-
value is larger than 0.05, then alternative hypotheses are accepted and null
hypotheses are rejected. If the null hypothesis is accepted, this means there is no
relationship between two variables. On the contrary, if an alternative hypothesis is
accepted, this means there is a relationship between two variables (Norusis, 2011;
Rubin, 2012).
3.6.1.4 T-Test
The fourth analysis tool that the researcher uses for data analysis is T-test. T-test is a
basic statistical test that measures group differences. Typically, T-test analysis is
used to test hypotheses by comparing the means of two groups to determine whether
there is a significant difference between them (Andrew, Pedersen, & McEvoy,
2011). If the results of t-test illustrates that the two means are equal then null
hypothesis is accepted and an alternative hypothesis is rejected, but if the two means
are not equal then an alternative hypothesis is accepted and null hypothesis is
rejected (Unitec, 2014d).
There are three basic types of t-test which are: (1) One-Sample T-test, Independent-
Samples T-test, and Paired-Samples T-test. The one-sample t-test tests if the mean of
one variable differs from a value identified or specified by the researcher whereas
the paired-samples t-test is used to compare the scores of two interval variables
drawn from studied populations (Andrew et al., 2011; Zikmund & Babin, 2012).

60 of 159 | P a g e
However, the independent-samples t-test is used to compare the means of two
independently sampled groups; for example, males and females. In other words, the
independent-samples t-test is used to determine if the mean scores of groups can be
considered markedly different (Andrew et al., 2011). This research study has used
only the independent-samples t-test as a tool to test the hypotheses.
3.6.1.5 ANOVA (Analysis of variance)
The fifth analysis tool that the researcher applies for data analysis is ANOVA.
ANOVA is a useful technique concerning economics, education, sociology,
psychology, and business researches (Kothari, 2011). ANOVA analysis is used
when many or multiple sample cases are involved. Unlike, t-test that can examine
only the 2 different sample means, ANOVA can test the significance of the
difference among more than two means at the same time. In other words, the
principle of ANOVA is to examine differences among the means of the populations
by determining the amount of variation with each of these samples (Kothari, 2011;
Reddy, 2011).
There are two types of ANOVA analysis. If the researcher takes only one factor and
examines the differences amongst its several categories that have many possible
values, this means the researcher uses one-way ANOVA analysis. On the other
hand, if the researcher investigates two or more factors at the same time, then this
means the researcher uses factorial ANOVA (Reddy, 2011). Most researchers use
ANOVA to test null hypothesis (all of the means are equal) and alternative
hypothesis (not all of the means are equal). Like any other analyses, the ANOVA
has its own test statistic which is called F statistic or F-Test (Reddy, 2011; Shankar,
2009). In F-Test process, if P-value is lower than 0.05, null hypothesis is rejected
and alternative hypothesis is accepted (Shankar, 2009).
3.6.2 Qualitative data analysis
The raw (qualitative) data or transcript that has been collected or derived from the
interview was checked and translated into written English. Then, some suitable
approaches were deployed for qualitative data analysis. The main purpose of qualitative
data analysis is to consolidate, reduce, interpret what participants said and what the
researcher saw and read (Merriam, 2009). However, many qualitative researchers may
feel that there is quite a challenge in terms of how to reduce a huge amount of data

61 of 159 | P a g e
collected from in-depth observations, written documentation, interviews, and so on
(Merriam, 2009).
Besides, Creswell (2013a) adds that text analysis is a challenging activity for qualitative
researchers as there is no fixed set of approaches or techniques for analysing qualitative
data (Saunders et al., 2009). Merriam (2009) also points out that all qualitative data is
mainly inductive and comparative, so most researchers use the comparative method of
data analysis as a tool to develop grounded theory. Merriam (2009) and Lyons and
Coyle (2007) assert that there are a number of methods that help the researcher to
analysing qualitative data which includes text coding, content analysis, comparative
analysis, thematic analysis, conversation analysis, protocol analysis, analytic induction,
grounded theory, interpretative phenomenological analysis, the voice relational method,
narrative analysis and discourse analysis. However, in this research study, the
researcher employs, applies and mixes only 5 approaches to analyse qualitative data
which includes (1) text coding, (2) content analysis, (3) thematic analysis, (4) narrative
analysis and (5) comparative analysis.
3.6.2.1 Text coding
Coding is one of the approaches for analysing a set of data in qualitative research
(Flick, 2014). Boeije (2009) asserts that coding is the process of categorizing,
assigning, or labelling segments of data with a word, a short phrase or a short name.
This means in the coding process, the researcher creates categories in the research
data and name them by attributing a code, and then the researcher will try to find
descriptions for theories that go beyond the insightful observation in a particular
sample. Myers (2009) also maintains that the purpose of coding is to help
researchers draw meaningful conclusions about the data. In addition, Corbin and
Strauss (2007) emphasize that coding helps the researcher to extract and develop
concepts from raw data in relation to their dimensions and characteristics. Besides,
Corbin and Strauss (2007) believe that data coding helps the researcher to explain
and represent phenomena, and reduce and combine data. Polonsky and Waller
(2013), and Myers (2009) also agree that data coding assists the researcher in
familiarizing with the data, recognizing the meaning of the data, and exploring the
connection of the data.

62 of 159 | P a g e
3.6.2.2 Content analysis
The researcher uses content analysis approach to find out or identify the key words,
paragraphs, or recurring patterns of meaning (Hennink, 2014; Merriam, 2009).
Content analysis approach mainly focuses on counting the frequency of words or the
numbers of a certain phrase is said by participants (Bernard & Ryan, 2010;
Merriam, 2009). This means the communication or message of meaning is the main
focus in the content analysis approach. In the content analysis process, the researcher
continuously conducts coding of raw data and construct categories that can draw out
relevant characteristics of the interview content (Denzin & Lincoln, 2008; Merriam,
2009).
In addition, Dawson (2009) contends that in the content analysis process, the
researcher chooses a concept for examination and records the number of
occurrences. Next, the researcher determines and examines the relationship between
concepts. Guest and MacQueen (2008) conclude that content analysis is an
efficiency and reliability approach. However, Guest and MacQueen (2008) suggest
that the researcher should be careful when using content analysis approaches for
qualitative data analysis as the main disadvantage of content analysis is that context
is cut out or is completely omitted. In addition, in the content analysis, the richness
or variety of the summary data generated is limited. This means the descriptive
context of how participants describe or discuss issues are not included (Hennink,
2014).
3.6.2.3 Thematic analysis
Thematic analysis which is also known as categorization is one of the popular
approaches used in qualitative data analysis (Creswell, 2013a; Dawson, 2009). The
researcher employs this approach to identify specific themes or to set the related
categories that carry similar meanings based on the specific question being answered
in the interview (Creswell, 2013a; Dawson, 2009). In order to move beyond coding
which only labels segments of data or counts the recurring patterns of explicit words
or phrases, the researcher uses thematic analysis which centres on determining and
describing implicit and explicit ideas from context (Guest & MacQueen, 2008).
Guest and MacQueen (2008) and Creswell (2013a) also claim that throughout
thematic analysis, the researcher clusters broad units of information that include
several codes that construct a common idea. Besides, this approach allows the
63 of 159 | P a g e
researcher to be able to analyse the connection between issues identified, and fully
understand the research issues from the perspective of selected participants (Denzin
& Lincoln, 2008; Hennink, 2014).
3.6.2.4 Narrative analysis
Punch (2009) states that qualitative data is mostly collected in narrative form
through unstructured or semi-structured interviews, observation, and focus groups,
so it is vital to examines the content, context, and structure in a narrative way as a
whole (as cited in O'Hara, Wainwright, Carter, Kay, & Dewis, 2011). Narrative
analysis does not involve classifying data through coding or labelling to set
particular themes or concepts (O'Hara et al., 2011; Wells, 2011). In narrative
analysis, the researcher primarily pays attention to reporting the whole description of
the story that was told by the participants in the interviews (O'Hara et al., 2011).
Furthermore, in the narrative analysis, the researcher does not only put value on the
content of the interview, but also on the context in which the interview takes place.
This is because the what, where, and how factors are critical to each interview
section (O'Hara et al., 2011).
3.6.2.5 Comparative analysis
Comparative analysis approach is also applied in qualitative data analysis. In the
comparative analysis process, the researcher identifies, examines, and explains
similarities among study participants, groups, or cases in a dataset (Dawson, 2009).
Glaser and Strauss (1967) state that comparative analysis is a part of a grounded
theory method, but Barbour (2008) claims that comparative analysis is the most
important part of all qualitative data analysis because all qualitative data analysis
heavily and continually relies on contrasting and comparing (as cited in Harding,
2013). Harding (2013) points out that comparative analysis allows the researcher to
compare and contrast statements within the same interview, and compare and
contrast statements in different interviews. Besides, Harding (2013) emphasizes that
this approach allows the researcher to produce insights by recognizing and
explaining patterns of difference or similarity within the data.
3.7 Ethical concerns
The researcher considers ethics is an important part of this research study as recommended by
Bryman (2012) and Oliver (2010). The researcher should carefully address all factors related

64 of 159 | P a g e
to ethical issues in order to protect all participants from emotional, mental and physical harm
or financial loss which may occur during the study. In addition, in order to avoid all possible
ethical issues, this research project has followed UREC rules and guidelines (UREC, 2009).
As this research project is carried out in the researcher’s own country where there are many
ethnic minority groups, the researcher recognizes and is aware of the some possible effects of
the ethnic minority group. In order to avoid ethical issues and problems, this research project
does not pay more attention to any particular ethnic minority group, but only focuses on all
aspects of human resource management practices, and only seeks to understand overall HRM
performance issues in the hospitality industry. Finally, the researcher undertakes to protect all
participants’ rights and privacy based on the provision of confidentiality law and privacy
policy to make sure that all of the participants are not suffered or harmed by this research
project.
With regards to voluntary consent in the research project, the researcher has asked for
permission and authorization before carrying out the research project in the hotels. The
researcher has written official request letters based on the UREC guidelines and directions,
and those letters have then been sent to the key contact persons of the six hotels in order to
gain authorization and approval for conducting my research project. In addition, to ensure
that the procedure in this research study allows for entirely voluntary consent, all participants
are informed that it is a voluntary participation. They can participate in this research project if
they are interested.
In relation to rights and confidentiality of participants, their identities are not revealed in the
thesis or in public or any kinds of conference presentations or publication. Moreover, all the
information collected from participants is kept completely confidential and is used for the
thesis purpose only. Besides, in order to avoid practising any deceptive activities in this
research study, the true purpose and aim of this research has been stated to every participant
in the initial contact.
In terms of intellectual and cultural property ownership, the interviews are recorded upon the
approval from the interviewees. The name of the interviewees and the hotels are recorded and
kept for the purposes of analysis only, and are not reported in the thesis. In addition, the hard-
copy of the questionnaires are stored and locked in a cupboard in the researcher’s house, and
the interview audio records are kept in the researcher’s laptop which is password protected.
Only the researcher is able to access the data and information.

65 of 159 | P a g e
3.8 Conclusion
In this chapter, the process of the data collection and data analysis were clearly explained. In
conclusion the interviews and questionnaires are the main tools for data collection. In relation
to testing the structure and the clarity of the questionnaire and the interview questions,
conducting a pilot project is vital. In the data analysis process, SPSS software was utilized to
analyse the data obtained from the questionnaires whereas text coding, thematic analysis,
narrative analysis and comparative analysis were employed for analysing the data obtained
from interviews. Secondary data collection was useful for this research.
3.9 Chapter summary
The chapter contains all key points in research methodology. This research study adopts
mixed methods (a combination of quantitative and qualitative methods) because it helps the
researcher to better understand the research problems in all aspects. In a quantitative
approach, a questionnaire has been employed to collect data from employees in the six hotels
in order to explore their opinion and experience about training, work satisfaction and
motivation in the hotels in Laos.
In a qualitative approach, six HR managers from the six hotels have been interviewed in
order to seek to understand the perspective of HR Managers in relation to the employee
section and employee training in their organizations. Prior to both the interview questions and
survey questionnaires being used in this study, a pilot project was carried out in order to
ensure make sure that the questions are clear and understandable. In terms of data sources, in
addition to the primary data, some secondary data from relevant organizations was also
collected in order to have background information about a hotel industry in Laos. Finally, in
relation to data analysis, text coding, content analysis, thematic analysis, narrative analysis,
comparative analysis have been used to analyse qualitative data whereas SPSS software has
been used to analyse quantitative data.
In the next chapter, the findings from the questionnaires and interviews are presented and
discussed.

66 of 159 | P a g e
Chapter Four: Findings
4.1 Introduction The previous chapter covers the research methods used for data collection and data analysis
and discusses the reasons why the researcher employs those research methods in this study.
This chapter provides the findings from the questionnaires and interviews. Firstly, the chapter
illustrates the findings of questionnaires based on SPSS data analysis. In this section, four
main points, including (1) demographic information, (2) employee satisfaction, (3) employee
motivation, and (4) employee training are covered. These four components are regarded as
crucial information as they are used for analysis and answering the research questions.
Secondly, the chapter illustrates the interview results. In the interview, six HR managers from
six hotels in Laos have been interviewed in order to seek to understand about the current
practice of employee selection and training process in their hotels. Finally, the chapter shows
a data analysis method that has been used to test each hypothesis and presents the result of
the three hypothesis study.
4.2 Demographic information
This section presents the information on population characteristics and dynamics in order to
help readers understand the overall picture of the participants involved in a questionnaire
survey in the study. In this section, the participants provide their gender, age, work
experience, and education level.
Question 1
In question one, participants are asked to provide their gender. The result of this
question showed that more males than females participated in the survey. The total
number of respondents is 105, and there are 46 female and 59 male respondents. This
means, of 105 respondents, female respondents occupy 55%, whereas male respondents
account for 45% (see Figure 7).

67 of 159 | P a g e
Figure 7 Gender ratio of participants (Q1)
Note: The result is representative of actual hotel employees who participate in survey questionnaires
(exclude HR managers who participate in the interview).
Question 2
In question two, participants are asked to provide information about their age range.
The participants can choose one in the three age brackets which are ‘18-28 years’, ‘29-
39 years’, and ‘more than 40 years’. The result demonstrated that the majority of
participants are in the age between 18-28 years, which occupies 47.6% of the
percentage of total participants. The second highest number of participants is in the age
of between 29-39 years, which accounts for 35.2%. In addition, the lowest number of
participants is in the age of more than 40 years, which is only 17.2% (see Table 1).
43.8%
56.2%
Gender ratio of participants
female male
Frequency
Female: 46
Male: 59
Total: 105

68 of 159 | P a g e
Table 1: Participant age (Q.2)
Age bracket Frequency Percent
18-28 50 47.6%
29-39 37 35.2%
40 and more 18 17.2%
Total 105 100%
Note: The result is representative of actual age of hotel employees who participate in survey
questionnaires (exclude HR managers who participate in the interview).
Question 3
In question three, participants were asked to state the number of years of their work
experience. There are five options of the number of years of work experience, namely
(1) less than 1 year, (2) 2-5 years, (3) 6-10 years, (4)11-15 years, and (5) more than 15
years that participants can choose. The result illustrated that the majority of respondents
have work experience between 2-5 years, which occupy 37.1% of the percentage of
total participation, followed by the participants who have work experience of less than
one year, 21%. Among them, the employees who have work experience in between 6-
10 years and in between 11-15 years are 15.2% and 18.2% respectively. It is interesting
to note that the lowest numbers of participants are people who have experienced more
than 15 years, which covers only 8.6% of the total participation rate (see Table 2).
Table 2: Work experience (Q3)
Work experience Frequency Percent
Less than 1 year 22 21.0%
2-5 years 39 37.1%
6-10 years 16 15.2%
11-15 years 19 18.2%
More than 15 years 9 8.6%
Total 105 100.0%
Note: The result is representative of actual work experience of hotel employees who participate in survey
questionnaires (exclude HR managers who participate in the interview).

69 of 159 | P a g e
Question 4
In question four, participants were asked to state their level of education. There are 6
choices which are (1) high school certificate, (2) vocational school diploma, (3) college
diploma, (4) bachelor degree, (5) master degree, and (6) doctoral degree that
participants can choose. The result of the survey demonstrated that the majority of
participants, which covers 50.5% of total participant rate have High school certificate
for the highest education level, followed by the participants who achieve Vocational
school diploma, College diploma and Bachelor degree which cover 20%, 10.5%, and
18% respectively. It is interesting that only 1% of participants have a Master degree and
no participant has a Doctoral degree (see Figure 8).
Figure 8: Education level (Q4)
Note: The result is representative of the actual education level of hotel employees who participate in
survey questionnaires (exclude HR managers who participate in the interview).
Question 5
Question five is the last question in the section of participants’ general information. In
this question, participants were asked to state the number of years they have worked for
the organization. There are three options, namely 0-5 years, 6-10 years, and more than
10 years from which participants can choose. The result of the survey illustrated that
the majority of participants (77 people) have been working in the organization in
between 0-5 years, which account for 73.3% of the total participation rate, followed by
50.5%
20%10.5%
18%
1% 0%0
20
40
60
80
100
High schoolcertificate
Vocationalschool
diploma
Collegediploma
Bachelordegree
Masterdegree
Doctoraldegree
Education level

70 of 159 | P a g e
the participants who have been working in the organization in between 6-10 years
which cover 16.2%. The lowest numbers of participants in this survey are people who
have been working in the organization more than 10 years which is 10.5% (see Table
3).
Table 3: Number of years working in the hotel (Q5)
Number of years Frequency Percent
0-5 years 77 73.3
6-10 years 17 16.2
More than 10 years 11 10.5
Total 105 100
4.3 Questionnaire findings This section presents the findings from the questionnaire survey. This section covers three
main topics which are employee satisfaction, employee motivation, and employee training.
4.3.1 Employee satisfaction
The following findings show the level of employee satisfaction with their current job,
and present some significant factors that influence their satisfaction in their workplace.
Question 6
In question six, participants were asked about their overall satisfaction in their current
job. The participants were offered a choice of one of two options which are ‘yes’ and
‘no’. The result demonstrated in Table 4 shows that 63 people feel that they are
satisfied with their current job, which occupy 60% of the total response rate, whereas
42 participants feel that they are not satisfied with their current job, which account for
40% (see Table 4).
Table 4: participant’s satisfaction with their current job (Q6)
Frequency Percent
Valid
Percent
Cumulative
Percent
Valid Yes 63 60.0 60.0 60.0
No 42 40.0 40.0 100.0
Total 105 100.0 100.0

71 of 159 | P a g e
Question 7
In question 7, participants were asked to give their opinions about their satisfaction in
their current organizations by using a scale from 1 to 5 (1 = strongly disagree, 2 =
disagree, 3 = neither agree nor disagree, 4 = agree, and 5 = strongly agree. The findings
are shown in Table 5.
Table 5: opinions about staff satisfaction in their current organization (Q7)
Disagree
strongly
Disagree Neither
agree
nor
disagree
Agree Agree
strongly
(1) (2) (3) (4) (5)
1) I am satisfied
with the
organizational
working culture
3.8% 8.6% 13.3% 55.2% 19.1% 100%
2) I feel my work is
meaningful to me 0% 1.9% 13.3% 54.3% 30.5% 100%
3) I am satisfied
with the
supervision of my
immediate
supervisor
2.9% 8.6% 18.1% 36.2% 34.3% 100%
4) My organization
pays me well for
the work.
5.7% 21.9% 18.1% 41.9% 12.4% 100%
5) I am satisfied
with my
employment
benefits
4.8% 24.8% 21.9% 39% 9.5% 100%
6) I am happy with
my job overall 2.9% 6.7% 18.1% 40% 32.3% 100%

72 of 159 | P a g e
According to the information in Table 5, In the first statement, 55.2% of respondents
agree that they are satisfied with the organizational working culture. In the second
statement, 54.3% and 30.5% of respondents agree and strongly agree that they feel their
work is meaningful to them. In the third statement, 36.2% and 34.3% agree and
strongly agree that they are satisfied with the supervision of their immediate supervisors. In
the fourth statement, 41.9% of respondents agree that their organizations pay them well
for the work, and in fifth statement 39% of respondents agree that they are satisfied
with their employment benefits. In the last statement, 40% and 32% of respondents
agree and strongly agree that they are happy with their overall job.
Question 8
In question eight, participants were asked to indicate how satisfied they are with the
working culture in their organization, and the findings are presented in Figure 9.
Figure 9: Working culture satisfaction (Q8)
The result presented in Figure 9 indicates that 35.2% of respondents are satisfied with
the working culture in their organization, and 10.5% of them are very satisfied with the
working culture of their organization. However, among them, 32.4% of employees are
dissatisfied, and 1.9% of them are very dissatisfied with the working culture in their
1.9%
32.4%
20.0%
35.2%
10.5%
0%
5%
10%
15%
20%
25%
30%
35%
40%
45%
50%
Very
dissatisfied
Dissatisfied Neither
satisfied nor
dissatified
Satisfied Very satisfied
How satisfied are you with the working culture in your
organization?

73 of 159 | P a g e
organization. The remaining 20% are those who have a neutral opinion about the
working culture in their organization.
Question 9
In question eight, participants were asked to state the working culture they prefer in
their organization, and the findings are presented in Figure 10
The information displayed in the Figure 10 presents that most of respondents prefer a
teamwork working environment, which accounts for 32%, and another 32% of
respondents prefer a friendly working environment. Those who prefer a no
discrimination working environment cover 22%, and the remaining 17% are those
respondents who prefer a supportive working environment.
Figure 10: Working environment (Q9)
Question 10
In question 10, participants were asked to state the likelihood of looking for another job
outside the organization, and the findings are presented in Figure 11.
32%
22%
29%
17%
Working environment prefered by employees
Teamwork working
environment
No discrimination
working environment
Friendly working
environment
Supportive working
environment

74 of 159 | P a g e
In Figure 11, the result indicates that the majority of respondents are moderately likely
to look for another job outside the organization, which covers 31.4%, followed by
those who very likely and slightly likely look for a new job outside their organization at
the rate of 28.6% and 19% respectively. It is interesting to note that 13.4% of
respondents are extremely likely to look for a new job outside their organization, while
only 7.6% of them do not look for another job outside their organization.
Figure 11: The likelihood of employee looking for another job outside the organization
(Q10)
Question 11
In question 11, participants were asked to rate the statements about the positive
experiences they have in their organizations, and the findings are shown in Table 6.
According to the information in Table 12, it clearly indicates that the majority of
respondents have positive experiences in their current organizations, followed by those
who have a neutral opinion about positive experiences in their current organization. In
the first statement, 55.2% and 29.2% of respondents agree and strongly agree that they
experience personal growth in their organization. In the second statement, 44.8% of
respondents have a neutral opinion about how ‘management looks to me for
suggestions and leadership’ statement, and 32.4% of the respondents agree with this
statement.
13.4%
28.6%31.4%
19.0%
7.6%
0%
10%
20%
30%
40%
50%
60%
Extremely
likely
Very likely Moderately
likely
Slightly
likely
Not at all
likely
The likelihood of employee looking for another job outside
the organization

75 of 159 | P a g e
In the third statement, 45.7% of respondents have neutral opinion about the great
opportunities they have in their organization, and 28.6% of the respondents agree with
this statement. In the fourth statement, 31.4% of respondents agree that the medical
benefits provided in the organization are satisfactory, and 28.6% of the respondents
have a neutral opinion about medical benefits in their organization. In the fifth
statement, 49.5% of respondents agree that their Supervisors encourage them to be their
best.
Table 6: opinions about staff positive experience in their current organization (Q11)
Disagree
strongly
Disagree Neither
agree
nor
disagree
Agree Agree
strongly
(1) (2) (3) (4) (5)
1) I experience personal growth,
such as updating skills, and
learning different jobs
0% 5.8% 9.5% 55.2% 29.2%
2) Management looks to me for
suggestions and leadership
1% 15.2% 44.8% 32.4% 5.7
3) I have great opportunities to
get promoted where I work
6.7% 12.4% 45.7% 28.6% 6.7%
4) The medical benefits
provided in the organization
are satisfactory
7.6% 21.9% 27.6% 31.4% 11.4
5) Supervisors encourage me to
be my best
6.7% 16.2% 16.2% 49.5% 11.4%
6) I am rewarded for the quality
of my efforts
6.7% 12.4% 28.6% 43.8% 8.5%
7) I receive an additional bonus
if I do additional work
9.5% 12.4% 33.3% 38.1% 6.7%
8) The organization clearly
communicates its goals and
strategies to me
5.7% 10.5% 39% 35.3% 9.5%

76 of 159 | P a g e
In the sixth statement, 43.8% of the respondents agree that they are rewarded for the
quality of their efforts. In the seventh statement, 38.1% of respondents agree that they
receive an extra bonus if they do additional work, while 33.3% of respondents have a
neutral opinion about this statement. In the last statement which is ‘the organization
clearly communicates its goals and strategies to me’, 39% of respondents have a nuetral
opinion with this statement and 35.3% of them agree with this statement.
Question 12
In question 12, participants were asked to state to what extent they have received
appropriate rewards on the job for performance recognition, and the findings are
presented in Figure 12.
Figure 12: Opinions of rewards on the job performance recognition (Q12)
The result in Figure 12 indicates that 72.4% of respondents sometimes feel that they
receive appropriate rewards on the job for performance recognition, followed by those
who always feel that they receive appropriate rewards on their job performance, which
accounts for 11.4%. It is interesting to note that 3.8% of respondents seldom, or never
Always, 11.4%
Sometimes,
72.4%
Seldom, 3.8% Never, 3.8% Not sure, 8.6%
Do you feel that you receive appropriate rewards on the job
performance recognition?

77 of 159 | P a g e
feel that they receive appropriate rewards for their performance, while 8.6% of them are
not sure about whether they receive appropriate rewards on their job performance or
not.
Question 13
In question 13, participants were asked to state how often they feel stressed at work in a
week, the findings are illustrated in Figure 13.
Figure 13: Level of stress at work in a week (Q13)
The graph presented in Figure 13 indicates that 72.4% of respondents sometimes feel
stressed at work, while 11.4% of them are always stressed at work during a week. Only
3.8% of respondents seldom and never feel stressed at work during a week. The
remaining 8.6% are those who are not sure about their stress at work.
Question 14
In question 14, participants were asked to give their opinion about the factors that
contribute to their job satisfaction. The findings are shown in Figure 14 and
demonstrate that the majority of respondents view salary as the main factor that makes
them satisfied with their job, which covers 26% of the total response rate. Moreover,
18.4%, 16.6%, and 12% of respondents think that job security, friendly working
environment, and varied work assignments are the other influential factors that make
them satisfied with their job, while 8.3%, 7.8%, and 6.9% of them perceive that training
11.4%
72.4%
3.8% 3.8%8.6%
0%
10%
20%
30%
40%
50%
60%
70%
80%
90%
100%
Always Sometimes Seldom Never Not sure
How often do you feel stressed at work in a week?

78 of 159 | P a g e
opportunities, interesting jobs, and retirement benefits as the influential factors that
make them satisfied with their job. Only 3.2% of the respondents see promotional
opportunities as the factor that influences their job satisfaction.
Figure 14: The reasons that employees stay at their present job (Q14)
Question 15
In question 15, participants were asked to indicate the amount of their current
workload, and the findings are presented in Figure 15
Figure 15: Opinions about amount of the current workload (Q15)
26.8%
18.4%
16.6%
12.0%
8.3%
7.8%
6.9%
3.2%
0.0% 5.0% 10.0% 15.0% 20.0% 25.0% 30.0%
Salary
Job security
Friendly working enivonment
Work assignments vary
Training opportunities
Interesting Job
Retirement benefit
Promotional pportunities
What are the reasons that you stay at your present job?
Inadequate
4%
Adequate
67%
Excessive
16%
Not sure
13%
How is your current workload?

79 of 159 | P a g e
In Figure 15, the result demonstrates that the majority of respondents think that their
current workload is adequate, which covers 67% of the total response rate, while 13%
of respondents feel that their work load is excessive. Only 13% of them are not sure
about their current workload, and the remaining 4% are those who think that their work
load is inadequate.
4.3.2 Employee motivation
In this section, The level of motivation employees have with their current organization
are determined, and some significant factors that motivate employees to work harder in
their workplace are also presented.
Question 16
In this question, respondents were asked to give their opinion about the importance of
employee motivation in their organizations, and the findings are presented in Figure 16.
Figure 16: Opinions about the importance of work motivation (Q16)
The result shown in Figure 16 demonstrates that 70.5% of respondents are of the
opinion that employee motivation is important in their organizations. Among them,
1.0%
20.0%
8.5%
50.5%
20.0%
0%
10%
20%
30%
40%
50%
60%
Very
unimportant
Unimportant Neutral Important Very important
How important to you is the work motivation in relation to
your performance in your organisation?

80 of 159 | P a g e
8.5% of employees have neutral opinion about the importance of employee motivation,
while 21% of them think that employee motivation is not important in their
organizations.
Question 17
In question 17, participants were asked to give their opinions about whether their
organizations create the conditions whereby they are motivated to work harder, and the
findings are presented in Table 7.
Table 7: Opinions of work conditions created by the organization (Q17)
Frequency Percent Valid Percent
Cumulative
Percent
Valid Yes 69 65.7 65.7 65.7
No 36 34.3 34.3 100.0
Total 105 100.0 100.0
The result in Table 7 illustrates that 65.7% of respondents believe that their
organizations create the conditions whereby they are motivated to work harder, while
36% of them do not think that their organizations impose any conditions whereby they
are motivated to work harder.
Question 18
In question 18, participants were asked to rate the 15 statements in the scale from 1 to
5. 1 = strongly disagree, 2 = disagree, 3 = neither agree nor disagree, 4 = agree, 5 =
strongly agree. This question aims to understand motivational experiences the
participants have in their organizations, and the findings are shown in Table 8.

81 of 159 | P a g e
Table 8: the motivational experience that employees have in their organization (Q18)
Disagree
strongly
Disagree Neither
agree nor
disagree
Agree Agree
strongly
(1) (2) (3) (4) (5)
1) The top
management is
interested in
motivating
employees
3.8% 15.2% 21% 48.6% 11.4
2) I am motivated by
the financial
incentives
provided by the
organization
0% 23.8% 3.8% 65.7% 6.7%
3) I receive rewards
for hard work
0% 33.3% 12.4% 44.8% 9.5%
4) I have a good
salary
7.6% 36.2% 12.4% 38.1% 5.7%
5) My job security is
high
7.6% 12.4% 44.8% 31.4% 3.8%
6) I have
opportunities for
advancement and
development
6.7% 20% 43.7% 22.9% 6.7%
7) My organization
increases salary
reasonably and
periodically
7.6% 18.1% 30.5% 40% 3.8%

82 of 159 | P a g e
8) The organization
has an effective
performance
reward system
that motivates
them to work
harder
6.7% 26.7% 27.6% 33.3% 5.7%
9) I feel the
organization
provides effective
promotional
opportunities
system
3.8% 27.6% 40% 24.8% 3.8%
10) The organization
has performance
appraisal
activities that are
helpful to get
motivated
7.6% 26.7% 28.6% 33.3% 3.8%
11) The retirement
benefits available
are sufficient
9.5% 28.6 36.2% 20% 5.7%
12) The
organizational
policies motivate
you to achieve its
aims and
objectives
7.6% 24.8% 34.3% 29.5% 3.8%
According to the information in Table 8, it is clearly seen that the majority of
respondents agree that they have motivational experiences in their current
organizations, followed by those who have a neutral opinion about motivational
experiences in their current organization.
In the first statement, most respondents agree that the top management in their
organization is interested in motivating them, which covers 48.6% of the total response

83 of 159 | P a g e
rate, while 21% of them have a neutral opinion about this statement. In the second
statement, 72.4% of respondents agree that they are motivated by the financial
incentives provided by their organization while 32.4% of respondents feel that they are
not motivated by the incentives provided by the organization. The remaining 3.8% are
those who have a neutral opinion about the financial incentives provided by the
organization.
In the third statement, 54.3% of respondents agree that they receive rewards for hard
work in their organizations while 33.3% of respondents disagree that they receive
rewards for hard work. Besides, among them, 12.4% of employees are neutral about
receiving rewards for hard work. In the fourth statement, 43.8% of respondents agree
that they have a good salary, while 43.8% of them do not think that they have a good
salary. Among them, 12.4% of employees have a neutral opinion about their salary in
the organization
In the fifth statement which is about their job security. 44.8% of respondents have a
neutral opinion about this statement, while 35.2% feel that their job security is high. In
the sixth statement, it is interesting that 43.7% of respondents have no opinion about
opportunities for advancement and development in their organizations, while 29.6% of
them agree that they have opportunities for advancement and development in their
organizations. Besides, among them, 26.7% of employees disagree that they have
opportunities for advancement and development.
In the seventh statement, 43.8% of respondents feel that their organizations increase
salary reasonably and periodically, while 30.5% of them have neutral opinion about this
statement. In the eighth statement, 39% of respondents agree that their organizations
have an effective performance reward system that motivates them to work harder,
while 27.6% of them have a neutral opinion about a rewards system in their
organization. However, among them, 26.7% of employees disagree that their
organizations have an effective performance rewards system that motivates them to
work harder.
In the ninth statement, most respondents have neutral opinion about promotional
opportunities system in their organizations, which accounts for 40%. Among them,
31.4% of employees disagree that their organization provides an effective promotional

84 of 159 | P a g e
opportunity system, while 28.6% of respondents feel that their organizations have
effective promotional opportunities systems.
In the tenth statement, 37.1% of respondents agree that their organizations have
performance appraisal activities that are helpful to get motivated, while 34.3% of them
do not feel that their organizations have performance appraisal activities that are helpful
to motivate them. Among them, 28.6% of employees have no opinion about
performance appraisal activities in their organization.
In the eleventh statement, 68.1% of respondents do not think that the retirement
benefits available are sufficient for them, while 25.7% of them feel that retirement
benefits available are sufficient. Among them, 36.2% of employees have a neutral
opinion about retirement benefits in their organization. In the twelfth statement, 34.3%
of respondents have no opinion about organizational policies, while 32.4% of them
disagree that their organizational policies motivate them to achieve the aims and
objective of the organizations. However, among them, 33.3% of employees agree that
their organizational policies motivate them to achieve the aim of the organizations.
Question 19
In question 19, participants were asked to indicate the factors that motivate them most
or motivate them to do extra work. This question aims to understand the main factors
that motivate employees to work, and the findings are presented in Figure 17.
The result shown in Figure 17 reveals that the majority of respondents acknowledge
that salary increases can motivate them most, and this covers 36.7% of the total
response rate, followed by 13.4% for those who feel that motivational talks can
motivate them to do extra work. Among them, 12% of employees think that giving
financial rewards and recognition of their work can motivate them most, while only
12.3% of them view that it is job security that can drive them to do extra work. The
remaining 4% are respondents who think that opportunity to perform work with
freedom can influence them to do extra work.

85 of 159 | P a g e
Figure 17: The factors motivating employees (Q19)
Question 20
In question 20, participants were asked to give their opinion whether the incentives and
other benefits that they ticked on question 19 influence their performance or not, the
findings are shown in Figure 18.
Figure 18: the influence of the incentives provided by the company
36.7%
9.6%
13.4%
12.0%
12.3%
12.0%
4.0%
0% 5% 10% 15% 20% 25% 30% 35% 40%
Salary increase
Promotion
Motivational talks
Recognition
Job security
Financial wards
Opportunity to perform work with
freedom
Which of the following factors motivate you most?
91.4%
0.0%
9.0%
0%
10%
20%
30%
40%
50%
60%
70%
80%
90%
100%
Yes No Not sure
Do you think the incentives and other benefits that you
ticked above will influence your performance?

86 of 159 | P a g e
The result shown in Figure 18 indicates most of the respondents think that the
incentives and other benefits that they selected in question 19 will influence their
performance, while only 8.6% of them are not sure that the incentives and other
benefits that they chose in question 19 will boost their performance.
Question 21
In question 21, participants were asked to give their overall opinion about whether they
get motivated by their organizations to work harder, and the findings are illustrated in
Figure 19.
Figure 19: Work motivation provided by the organization (Q21)
The result shown in Figure 19 demonstrates that most of the respondents are not sure
that they are getting motivated by their organizations to do extra work, which accounts
for 39% of the total response rate. However, among them, 32% of employees feel that
they get motivated by their organizations to work harder whereas 29% of them do not
think that they get motivated by their organizations.
Yes
32%
No
29%
Not sure
39%
Overall, do you get motivated by your organization to work harder?

87 of 159 | P a g e
4.3.3 Employee training
This section includes the employees’ opinion about the training provided by their
organizations. In addition, this section seeks to know whether the training they
obtained helps them to perform better in their jobs. Besides, this selection contains the
employees’ opinion about whether the training provided by the organization are
adequate for them or not.
Question 22
In question 22, participants were asked to give their opinion about the importance of
training to their performance in the organizations, and the findings are presented in
Table 9
Table 9: Importance of training in relation to improving employee performance (Q22)
How important to you is the training in relation to your performance in your
organization?
Frequency Percent Valid Percent
Cumulative
Percent
Valid Unimportant 7 6.7 6.7 6.7
Neutral 17 16.2 16.2 22.9
Important 56 53.3 53.3 76.2
Very important 25 23.8 23.8 100.0
Total 105 100.0 100.0
In Table 9, the result demonstrates that 81 respondents agree that training assists them
in performing their job better, which covers 77.1%. 17 (19%) respondents are those
who have neutral opinion about the importance of training, and Only 7 (6.7%)
respondents feel that training does not help them to perform better.
Question 23
In question 23, the participants were further asked to give their opinion about whether
their organizations provided adequate training for employees, and the findings are
shown in Table 10.

88 of 159 | P a g e
Table 10: Opinions about training provided by the organization (Q23)
Do you think your organization provides adequate training for employees?
Frequency Percent Valid Percent
Cumulative
Percent
Valid Yes 37 35.2 35.2 35.2
No 41 39.1 39.1 74.3
Not sure 27 25.7 25.7 100.0
Total 105 100.0 100.0
The result appeared in Table 10 points out that 27 respondents not sure whether their
organizations provide adequate training for them, which covers 25.7% of the total
response rate. Among them, 37 employees feel that their organizations give adequate
training which accounts for 35.2%, while 41 respondents feel that their organizations
provide inadequate training for them, which covers 39.1%
Question 24
In question 24, participants were asked to state whether the organization has provided
them some particular training or not, the finding is presented in Table 4.11.
Table 11: A number of employees receiving training (Q24)
Frequency Percent
Yes, answer only question 25 and 26 52 49.5
No, answer only question 27, 28, and 29 53 50.5
Total 105 100
The result presented in Table 11 illustrates that of 105 people, 52 respondents have
attended the training, which covers 49%, and 53 respondents are those who did not
receive the training, accounting for 53%.
Question 25
In question 25, the fifty-two respondents who answered ‘yes’ to question 24 were
further asked to identify the hotel training they have obtained in their organization, and
the findings are shown Figure 20.

89 of 159 | P a g e
Figure 20: The hotel training that employees have obtained (Q25)
The resulted shown in Figure 20 demonstrates that 30.9% of respondents have attended
customer service training, and followed by 27.7% of those who have had On-the job
training. 19.1% of respondents have had English language training while 14% of them
have attended Safety concerned training. The remaining 7.4% are those who have
received food and beverage service training.
Question 26
In question 26, the fifty-two respondents who answered ‘yes’ to question 24 were
further asked to state whether the training they have obtained helped them perform
work better or not, and the findings are presented in Figure 21.
The result demonstrated in Figure 21 indicates that 98.1% of respondents agree that the
training they have received helped them to perform work better, while only 1.9% of
them are not sure that the training they have obtained assists them in performing work
better.
30.9%
7.4%
14.9%
19.1%
27.7%
0%
5%
10%
15%
20%
25%
30%
35%
40%
45%
50%
Customer
service
Food and
beverage
service
Safety concerns English
language
"On the job"
training
What hotel training have you obtained?

90 of 159 | P a g e
Figure 21: The influence of training on work perform (Q26)
Question 27
In question 27, the fifty-three respondents who answered ‘no’ to question 24 were
asked to give an opinion about whether their organization should provide training or
not, and the findings are presented in Figure 22.
The result appeared in Figure 22 indicates that the majority of respondents feel that
their organization should provide more training, this accounts for 84.9%. The
remaining 15.1% are those who are not sure whether their organizations should give
training or not.
Figure 22: Opinions of whether more training should be provided (Q27)
98.1%
0.0% 1.9%
0%
20%
40%
60%
80%
100%
Yes No Not sure
Do you agree that the training you have obtained help you
perform work better
0%
10%
20%
30%
40%
50%
60%
70%
80%
90%
100%
Yes No Not sure
84.9%
0.0%
15.1%
Do you think your organization should provide training?

91 of 159 | P a g e
Question 28
In question 28, the fifty-three respondents who answered ‘no’ to question 24 were
further asked to state the kind of training that their organizations should provide in
order to improve their work performance, and the findings are shown in Figure 23
Figure 23: the kinds of training that their organizations should provide (Q28)
The information appeared in Figure 23 demonstrates that the majority of respondents
feel that their organizations should provide more ‘English language’ training and
‘customer service training in order to help them to work better, and this covers 28% and
23.1% respectively. Among them, 21.6% of employees think that their organization
should provide more on-the job training for them, while 14.7% are those who feel that
more food and beverage service training should be provided. The remaining 12.6% are
those who are of the opinion that safety concerns training should be provided in order
to improve their work performance.
Question 29
Question 29 is the final question in the employee training selection. In this question, the
fifty-three respondents who answered ‘no’ in question 24 were further asked to state
Customer
service,
23.1%
Food and
beverage
service,
14.7%
Safety
concerns,
12.6%
English
language,
28.0%
"On the Job"
training,
21.6%
What kind of training should your organization provide in order to
improve your work performance?

92 of 159 | P a g e
whether the training course they selected in question 28 will help them to perform their
work better, and the findings are presented in Figure 24.
Figure 24: The relationship between the training course and work performance (Q29)
The result shown in Figure 24 indicates that the majority of respondents feel that the
training course they selected in question 28 will help them to perform their work
better, which accounts for 90.6% of the total response rate, while only 9.4% of them
are not sure that the training they have selected in question 28 will help them to work
better.
4.4 Interview finding
This section provides the findings from the interviews of HR managers in the HR
departments of the hotels. This section is divided into two sub-sections which are employee
selection and employee training. The interviews were summarized and executed by
identifying key words, phrases, sentences, themes, and drawing a conclusion about the
information obtained from the participants. The participants in the interview are labelled by
letters with a number which are P1, P2, P3, P4, P5, and P6 in order to protect their identity.
90.6%
0.0%
9.4%
0%
10%
20%
30%
40%
50%
60%
70%
80%
90%
100%
Yes No Not sure
The training course you selected in question 28 will help
you to perform your work better?

93 of 159 | P a g e
4.4.1 Employee selection
In this section, the overall process of the current practice of employee selection is
identified. The HR managers describe and explain the process of employee selection in
their organization.
Question 1: What is the employee selection process in your organization?
All six respondents have similar processes in selecting new employees. They have 5
steps in employee selection, namely (1) application form screening, (2) job interviews,
(3) background check (if the applicants have work experience for another organization),
(4) hiring decision, and (5) job offer.
All respondents said that after applicants submit their own CVs with the necessary
documents required by the organization, the application screening began. All
respondents stated that the common documents they need to attach to CVs are a copy of
their ID card, a photo, a copy of their residential certificate, a copy of their family book,
references of work experience or training, and educational qualifications. Two of the
respondents (P1 and P3) pointed out further that before submitting CVs, the
organization needed the applicants to fill out the form provided by the organization in
order to have information that the organization wanted.
However, four other respondents (P2, P4, P5, P6) said they did not need applicants to
fill out any forms before submitting their CVs as the organization could get their
information from their CVs and attached documents such as qualification and work
experiences. Furthermore, four of the respondents (P2, P4, P5, P6) were of the opinion
that application screening should be done properly and carefully in order to have the
full potential candidates for the interview. Two more respondents (P1 and P3) agreed
that in order to have qualified candidates for the interview, screening applications and
resumes should be scrutinized carefully and intensely.
All respondents stated that job interviews were conducted in both Lao and English in
order to test the candidate’s communication skill. All respondents emphasized that the
job interview process played a critical role in pinpointing whether the organization and
the candidate made an effective match. Four of the respondents (P2, P3, P4, P5) further
pointed out that even though the applicant’s resume, cover letter, references of work
experience, and educational qualification gave the interviewer(s) an overview of the

94 of 159 | P a g e
applicant’s skills and background, job interviews were great for the interviewer(s) or
examiner(s) to see the applicant’s physical appearance and ability to handle
himself/herself during questioning. Besides, other two respondents (P1&P6) said that
the job interview was the process that examined and assessed the applicant’s
personality and determined if he/she would be suitable for the job and the organization.
The next step is the hiring decision. All respondents agreed that the interviewer or the
group of interviewers made the hiring decision. Four of the respondents (P1, P2, P4,
P5) said that after job interviews, the interviewer selected applicants who were well-
matched to the organization through comparing all applicants’ qualifications, skills,
personality, and ability. However, two other respondents (P3 and P6) pointed out that
after job interviews, the interviewer and the head of the department had a meeting and
discussed selecting the best qualified applicant for the position by scoring the
qualification, skills, ability, and experience of all applicants during the job interviews
based on the requirements of the position. The two respondents (P3 and P6) further
asserted that the organization offered the job to the applicant who got the highest score.
The final step is job offer, all respondents stated that they contacted the most qualified
candidate and offered the job. All respondents further pointed out that they gave an
employment contract to the selected candidate to read before the selected candidate
made a decision to accept the job offer. All respondents further explained that the
contract included terms and conditions the new employee should follow, the job
responsibility, salary and health care benefits. Besides, all respondents said that they
had a 3 month probation period.
During the probation period, the supervisor would follow up and evaluate the new
employee’s work. All respondents also added that if the new employee could work well
and could adapt to the organizational environment, the organization would extend the
contract for the new employee. If the new employee could not adapt or could not work
in the new environment in the first two months, the organization would inform the new
employee about his/her below standard of work performance and asked him/her to
improve his/her performance. In the last month of the probation period. If the new
employee still could not improve his/her performance, the organization would stop
his/her contract, re-advertise the job vacancy, and begin the employee process again.

95 of 159 | P a g e
Question 2: Do you think the employee selection process in your organization is
effective? Why or why not?
All respondents have similar feelings that the employee selection process in their
organization is effective. Two of the respondents (P1&P2) said that there was not much
of a problem with the selection process as they just screened the application,
interviewed the qualified candidates, and offered the job to the most qualified candidate
who matched with the requirement of the job such as associated educational degree and
work experience. The other four respondents (P3, P4, P5 and P6) further stated that
their selection processes were practical because they did not expect much from the
candidates. They (P3, P4, P5, and P6) said they knew that people who got a high
education degree such as Bachelor degree or Master degree did not apply or like to
work in the hotel industry. They (P3, P4, P5, and P6) acknowledged that most labour
in the market did not directly study about hospitality, so they did not place attention on
the candidates’ education degree. They only selected the new employees who seemed
to be honest and would work hard – this is because they could train and teach them to
do the work later.
Question 3: What do you expect the personal characteristics of candidates to be
that are suitable for working in your organization? Why or why not?
Four of the respondents (P3, P4, P5, and P6) have common answers. They said that
they normally selected the candidates who are active, friendly, hard-working, patient,
honest, speak politely, and enthusiastic about doing their work. Furthermore, four of the
respondents (P3, P4, P5 and P6) stressed that they selected employees who have
particular personal characteristics based on the type of position. They (P3, P4, P5 and
P6) gave the example that if they needed a new staff to work as a front desk
receptionist, that person should be friendly, active, and not afraid to interact with
customers. However, two respondents (P1& P2) do not put emphasis on personal
characteristic of candidates. They (P1& P2) stated that they did not look for a particular
characteristic of people who would work with them. They (P1&P2) primarily select the
candidates based on their education, background, and experience.

96 of 159 | P a g e
Question 4: In the employee selection process, do you think skills and experience
of candidates are more important than their qualifications? Why or why not?
Three of the respondents (P1, P2, P5) agreed that in the employee selection process,
skills and experience were more important than their qualifications. The respondents
(P1, P2, P5) also stated that they usually selected new staff based on their work
experience and skills that are relevant to the position for which they applied. Besides,
the respondents (P1, P2, P5) believed that previous work experience and skills that the
new employee has could help him/her to learn and adapt themselves to the new
environment and learn the new job quickly. The respondents (P1, P2, P5) further
explained that the reason they did not put much emphasis on the qualifications of
candidates in the employee selection process was because the education system in Laos
did not seem to be in high standard and the study courses in the school were not quite
practical. After finishing school, new graduates did not know how to use or apply their
skills they had learnt in school in the real job.
However, other three respondents (P3, P4, P6) said that the skills and experience of
candidates and their qualifications were equally important. They (P3, P4, P6) pointed
out that when they screened the application form, they looked at the associated
qualification of the candidates in the first place, and then the skills and abilities of the
candidates could be tested in the interview session. The respondents (P3, P4, P6)
further claimed that previous work experience was not the main factor that influenced
the hiring decision. They (P3, P4, P6) said that they had to check both the qualifications
and previous work experience of the candidates before the hiring decision and job offer
were made.
Question 5: Do you address any problems in the employee selection process? If
yes, what are they?
Two of the respondents (P2, P3) said that they encountered some problems during the
employee selection process. The respondent (P2) pointed out that when they offered the
job to the most qualified candidate, that candidate required a high salary which the
organization could not pay, so they sometimes did not get the most qualified candidate
for the position. The respondent (P3) also stated that there were high competition in the
hospitality labour market, so it was hard to get qualified people to work in the
organization unless the organization offered a competitive salary to them.

97 of 159 | P a g e
In contrast, four of the respondents (P1, P4, P5, P6) said that they did not encounter any
difficulties in the employee selection process, but they stated that they encountered
problems after the employee selection process. The respondents (P1, P4) pointed that a
new employee who came to work just for a few weeks then left the organization was an
example. This made them (P1, P4) spend more time re-advertising a job vacancy and
selecting a new employee. Besides, other two respondents (P5, P6) stated that after a
new employee had worked for a couple of months, he/she stole the property of the
organization. This made them (P5, P6) fire that new staff member from his/her job and
had to spend more time selecting a new employee.
4.4.2 Employee training
In this section, the overall process of the current practice of employee training is
identified. The HR managers describe and explain the process of employee training in
their organization.
Question 1: Does your organization provide training to employees?
During the interview, all six respondents accepted that training activities were vital for
their organizations as training helped their employees to work efficiently and
effectively. However, only five of the respondents answered ‘yes’ and one respondent
answered ‘no’ to the question above. The five respondents (P1, P3, P4, P5, P6) stated
that their organization has seen the importance of employee training, and have recently
sent their employees for training. The (P1) respondent pointed out that the organization
has sent employees for training, but his organization sometimes had a problem about
matching employee time schedules with the training course time.
The respondents (P3, P4, P5, P6) also said that their organizations has always sent
employees who did not take the training courses yet for training, or provided a training
to those who needed more training to improve their work performance. Five
respondents (P1, P3, P4, P5, P6) said that most of the hotel training courses in Laos
were held by the Ministry of Information, Culture and Tourism. Besides, the
respondents (P3 & P5) said that their organizations had their own training in the
organizations. The (P3) respondents further said that each year, his organization has
sent each head of its department abroad to have training one to two times per year. In
contrast with answers from five respondents (P1, P3, P4, P5, P6), the (P2) respondent

98 of 159 | P a g e
stated that his organization did not send employees outside for training as the
organization did not budget for training activities.
Question 2: Could you tell me about particular training provided by your
organization? Note: this question is only for those respondents who answered ‘Yes’ in
question 1
Five respondents (P1, P3, P4, P5, P6) said their organizations usually have sent
employees such as front desk staff, waiters, waitresses, bartenders, and room maids to
the training courses that were related to room service, housekeeping, customer service,
and table arrangement. Mostly, the hotel training courses were held by Ministry of
Information, Culture and Tourism (MICT) and some non-profit organizations (NGOs)
one to two times per year. The respondents (P3, P4, P5, P6) further explained there was
not many hotel training courses in Lao. Only MICT and some NGOs provided the hotel
training.
(P3) respondent stated that her hotel also provided a workshop which was mostly about
the importance of teamwork, the importance of customer service, and the importance of
employee and customer satisfaction on its own site each year. The (P4) respondent
further pointed out that his hotel provided English training 2 hours per week on its own
site to employees who were not good at speaking English. The (P4) respondents also
stated that his hotel has sent its employees who were at management level to learn or
explore the hotel management from a big five star hotel in other countries each year. In
contrast to the answers from the five respondents (P1, P3, P4, P5, P6), the (P2)
respondent said that his organization did not provide any kind of training to its staff.
The (P2) respondents explained that his organization expected that people who came to
work with his hotel should know how to work and its employees could learn and
practise their skills in the real job or in the real situation.
Question 3: Should your organization provide training to employees? Why or why
not? Note: this question is only for respondents who answered ‘No’ in question 1
The (P2) respondent pointed out that training should be provided to employees.
However, the (P2) respondent further explained that his hotel was small; it was not
possible to provide training to employees as there was no budget for training activities.

99 of 159 | P a g e
The (P2) said that whenever they needed new employees, they first looked for people
who had previous work experience.
Question 4: Does your organization provide training to employees before
performing new jobs? Why or why not?
In relation to on-job training, all respondents (P1, P2, P3, P4, P5, P6) had the same
answers which were that the organizations provide ‘on-job training to all of their new
employees who just started working in their organizations. All respondents pointed out
that in order to make sure that every new employee understood their roles and
responsibilities, and knew how to do their job correctly and effectively, it was vital for
their organization to provide on-job training in which every employee can learn from
the actual work activities and from the real situations. Furthermore, all respondents
stated that their organization provided on-the job training to an employee who was
promoted to a new position in order to make sure that he/she knew how to do a job
correctly and effectively.
Question 5: In your opinion, does employee training have a positive influence on
employee performance? Why or why not?
All respondents (P1, P2, P3, P4, P5, P6) agreed that training had a positive influence on
employee performance. One of the respondents (P1) said that after training, the
employees know more about their tasks and know how to do their job effectively. This
could lead to an increase in the profits of the organization. The (P2) respondent stated
that it was good to provide training to employees, so they could work more effectively
as this resulted in the satisfaction of customers. However, the (P2) respondent said that
when people applied for a particular position, the hotel expected that they would know
or had experience about the work they had applied for.
The (P2) respondent further pointed out that his hotel could not afford the employee
training cost because his hotel was small, as this hotel did not have the budget for staff
training.
Four of the respondents (P3, P4, P5, P6) said that after training, the employees seemed
to be more enthusiastic about doing their work. The respondents (P3, P4, P5, P6) also
stated that after training, the employees did not only apply the skills obtained from
training, but also brought new knowledge into the workplace. This did not only help

100 of 159 | P a g e
their business operations to be more effective and efficient, but also made their
customers happy about their services. The respondents (P4, P5, P6) further emphasized
that when customers were happy, they would go back for their service again. Besides,
the (P4, P5, P6) respondents believed that employee training could improve employee
retention rates. However, the respondents (P4, P5, P6) said that after employee training,
they encountered a problem which is that the employees their organizations have sent
for training resigned or left the hotel to work in other hotels.

101 of 159 | P a g e
4.4.3 Summary of the key findings from the interviews
What is the employee
selection process in
your organization?
All 6 HR managers have
similar methods for
selecting a new
employee to work in
their organizations
which are (1) application
form screening, (2) job
interviews, (3)
background check (if the
applicants have work
experience from another
organization), (4) hiring
decision, and (5) Job
offer.
Do you think the employee
selection process in your
organization is effective?
Why or why not?
2 HR managers feel that
employee section methods in
their organizations are
effective because they have
followed the employee
selection criteria of their
organizations strictly.
4 HR managers also think
that employee selection
process employed in their
organizations is effective,
but there are not many
qualified people applying to
work in the Hotel industry.
Thus, after offering a job to a
new employee, a new
employee would receive on-
the job training during their
work probation period in
order to ensure they can
work effectively in a new
work environment.
What do you expect the
personal characteristics of
candidates to be that are
suitable for working in your
organization? Why or why
not?
4 HR managers select a
candidate who has a
particular personal
characteristic based on a
particular position, but
normally they select the
candidate who is:
Active
Friendly
Hard-working
Patient,
Honest
Polite
Enthusiastic
2 HR managers do not
look for any particular
personal characteristics.
They only look for a
candidate’s experience and
qualification that matches
with the job requirement.

102 of 159 | P a g e
Do you think the skills
and experience of
candidates are more
important than their
qualifications? Why or
why not?
3 HR managers point
out that the skills and
experience of
candidates are more
important than their
qualifications because
Skill and experience
from previous relevant
work helps them to
work effectively and
adapt quickly in the
new workplace.
Other 3 HR Managers
state that the skills,
experiences and
qualifications of
candidates are equally
important because
before the candidates
are granted for the
interview, they should
have the associated
qualifications first.
Then, their abilities
and skills can be tested
during the interview.
Do you address any
problems in the employee
selection process? If yes,
what are they?
2 HR managers accept that
they have problems in the
employee selection process
in their organization which
are:
1. It is hard to find a
qualified candidate in
the market.
2. The qualified candidate
requires a high salary
which cannot be met by
the organization
Other 4 HR managers do not
encounter any problems
during the employee
selection process, but They
have problems after the
employee selection process
which are:
1. A new employee
leaves his/her job
after a few weeks
without his/her
notification.
2. A new employee is
not honest. He/she
steal the assets of the
organization.
Does your organization
provide training to
employees?
All 6 HR managers
acknowledge the importance
of employee training in
relation to employee work
performance. However, 1 of 6
HR managers points out that
his organization does not
provide training to the staff
because the organization is
small and does not have a
budget for staff training.

103 of 159 | P a g e
What kind of training
does your organization
provide to employees?
Customer service
training
Room service training
Bartender training
Housekeeping training
English training
Some particular
Training for
employees who work
at management level
Does your organization
provide training to
employees before
performing new jobs? Why
or why not?
The organization provides
on-the job training to a new
employee who performs a
new job in order to ensure a
new employee understands
his/her responsibility.
The organization also
provides on-the job training
to an employee who is
promoted to a new position
in order to make sure that
he/she know how to do a job
correctly and effectively
In your opinion, does
employee training have a
positive influence on
employee performance? Why
or why not?
All HR managers agree that
employee training has a
positive influence on
employee and organizational
performance.
1. Increasing productivity
and profits
2. Employee training can
increase employee
satisfaction which results
in customer satisfaction as
well
3. Employees seem to be
more enthusiastic and
work harder after training.
4. Improving employee
retention rates
4.5 Hypotheses
This section discusses the hypotheses that are relevant to some objectives of this research
study. The hypotheses mainly focus on 3 objectives in relation to the influence of employee
training, employee satisfaction, and employee motivation on the organizational work
performance. The hypotheses are verified and tested by employing quantitative analysing
techniques that are available in ‘SPSS’ software.
4.5.1 Hypothesis 1
According to objective 5: To understand the perspective of employees in the Lao
hotel industry about the importance of training, the researcher tests whether all
employees acknowledge the importance of training in relation to their work performed
in their organizations. Thus, the researcher has developed the following hypothesis:

104 of 159 | P a g e
H1o - There is no difference in the views of employees towards the importance of
training in relation to work performance in the organization.
H1a - There is a difference in the views of employees towards the importance of
training in relation to work performance in the organization.
One-Way ANOVA is used to analyse the difference in three groups (Q23)
towards the views that training is important in relation to their work performed in the
organization (Q22). The result is shown as follows:
Table 12: The importance of training * the improvement of work performance in the
organization
Descriptives
How important to you is the training in relation to your performance in your
organization?
N Mean
Std.
Deviation
Std.
Error
95% Confidence
Interval for Mean
Minimum Maximum
Lower
Bound
Upper
Bound
Yes 37 3.81 .877 .144 3.52 4.10 2 5
No 41 4.02 .758 .118 3.79 4.26 2 5
Not sure 27 4.00 .832 .160 3.67 4.33 2 5
Total 105 3.94 .818 .080 3.78 4.10 2 5
The result shown in Table 12 illustrates that the three groups of people categorized by
their answers to question 22: ‘Do you think your organization provides adequate
training for employees?’ The three groups are classified as ‘yes’, ‘no’, and ‘not sure’.
The mean values for the groups are 3.81, 4.02, and 4.00 respectively.
Table 13: Test of Homogeneity of Variances
Test of Homogeneity of Variances
How important to you is the training in relation to your performance in your
organization?
Levene Statistic df1 df2 Sig.
.960 2 102 .386

105 of 159 | P a g e
In the Test of Homogeneity of Variances table, the significance value of Levene
statistic is 0.386 which is higher than 0.05. This means the variances of the 3 groups are
similar.
Table 14: ANOVA – The importance of training in relation to employee work
performance
ANOVA
How important to you is the training in relation to your performance in your
organization?
Sum of Squares Df Mean Square F Sig.
Between Groups 1.006 2 .503 .747 .476
Within Groups 68.651 102 .673
Total 69.657 104
It can be seen that the significance value in the ANOVA table is 0.476 which is greater
than 0.05. Thus, the null hypothesis (H1o) is accepted. In other words, there is no
difference in the attitude of three groups towards the importance of training in relation
to employee performance in the organization.
Table 15: Post Hoc Tests – Multiple Comparisons
Multiple Comparisons Dependent Variable: How important to you is the training in relation to your
performance in your organization?
Tukey HSD
(I) Do you think
your organization
provides
adequate training
for employees?
(J) Do you think
your organization
provides adequate
training for
employees?
Mean
Difference
(I-J)
Std.
Error Sig.
95% Confidence
Interval
Lower
Bound
Upper
Bound
Yes No -.214 .186 .487 -.66 .23
Not sure -.189 .208 .635 -.68 .30
No Yes .214 .186 .487 -.23 .66
Not sure .024 .203 .992 -.46 .51
Not sure Yes .189 .208 .635 -.30 .68
No -.024 .203 .992 -.51 .46
The Post Hoc Tests table indicates that the significance values (Sig.) of three groups are greater than
0.05. Thus, the null hypothesis is supported.

106 of 159 | P a g e
In addition to ANOVA test, t-test is employed to analyse the difference
between male and female (Q1) towards their levels of agreement that training is
important in relation to their work performed in the organization (Q22), and the result is
shown as follows:
Table 16: Independent Samples Test
Levene's
Test for
Equality
of
Variances t-test for Equality of Means
F Sig. t df
Sig.
(2-
tailed)
Mean
Difference
Std. Error
Difference
95%
Confidence
Interval of
the
Difference
Lower Upper
How
important to
you is the
training in
relation to
your
performance
in your
organization?
Equal
variances
assumed
1.935 .167 .390 103 .697 .063 .162 -.258 .384
Equal
variances
not
assumed .395 100.715 .694 .063 .160 -.254 .380
Table 16 shows the results of the independent samples t-test. The Levene’s results had
an F-statistic of 1.935 with a significance value of 0.167. This indicates that the P-
value is higher than 0.05; in other words, the two variables had no statistically different
variance distributions. Therefore, the null hypothesis is accepted and the alternative
hypothesis is rejected. As a result, there is no difference between male and female
opinion on the level of importance of training in relation to their work performed in the
organization.
The significance (2-tailed) value in the T-test for Equality of Means column is 0.697.
This means there is no different occurrence between the two variables. Furthermore,
the value of 95% Confidence Interval of the Difference begins from -0.258 to +0.384
which indicates that there is at least one sample that has gone through 0 (zero) point.

107 of 159 | P a g e
Therefore, it can be said that there is no difference between male and female in relation
to the opinion on the level of importance of training in relation to their work performed
in the organization.
After testing the above hypothesis by using One-Way ANOVA and t-test in SPSS
software, it can be concluded that all employees recognize the importance of training in
relation to their work performed in the organization.
4.5.2 Hypothesis 2
According to objective 6: To identify the impact of the financial incentives provided
by the organization on employee performance, the researcher has established the
following hypothesis:
H2o - The financial incentives provided by the organizations have no effect on
employee performance
H2a - The financial incentives provided by the organizations have a positive effect on
employee performance.
Correlation analysis is used to examine the relationship between Question 16
and Question 18 (number 2). The result is shown as follows:
Table 17: Correlation between Q16 and Q18 (number 2)
Correlations
How important to
you is the work
motivation in relation
to your performance
in your organisation?
I am motivated
by the financial
incentives
provided by the
organization
How important to
you is the work
motivation in
relation to your
performance in
your organisation?
Pearson Correlation
Sig. (2-tailed)
Sum of Squares and
Cross-products
Covariance
N
1 .747**
.000
112.629 75.229
1.083 .723
105 105
I am motivated by
the financial
incentives provided
by the
organization.
Pearson Correlation
Sig. (2-tailed)
Sum of Squares and
Cross-products
Covariance
N
.747** 1
.000
75.229 89.962
.723 .865
105 105
**. Correlation is significant at the 0.01 level (2-tailed).

108 of 159 | P a g e
The information shown in Table 17 demonstrates that two variables are linearly related
to each other. The correlation between the two variables is 0.747 which is equivalent to
74.7% of the correlation coefficient.
In Table 17, the significant value (P-value) is 0.000 which is less than 0.05. This means
the financial incentives provided by the organization have a positive effect on employee
performance. As a result, the null hypothesis is rejected and the alternative hypothesis
is accepted
4.5.3 Hypothesis 3
According to objective 7: To determine the relationship between satisfaction of
employee and the pay offered by the organization, the researcher has developed the
following hypothesis:
H3o - There is no relationship between employee satisfaction and the salary paid by the
organization.
H3a: -There is a relationship between employee satisfaction and the salary paid by the
organization.
Cross-tabulation is employed to analyse the relationship between Question 6
and Question7 (number 4 in the table). The result is displayed as follows:
According to Table 18, of the total 105 employees, 60% of them say ‘yes’ they are
satisfied with their current jobs, while 40 of them say ‘no’, they are not satisfied with
their current job.
Based on Table 18, of 105 employees, 57 (52.3%) employees agree and strongly agree
that their organizations pay them well for work, while 29 (27.6%) employees disagree
and strongly disagree that their organizations pay them well for the work. 19 (18.1%) of
employees have neutral opinion about the pay in their organizations.

109 of 159 | P a g e
Table 18: The organization pays me well for the work * I am satisfied with my job Cross-
tabulation
Overall, are you
satisfied with
your job? Total
Yes No
My
organization
pays me
well for the
work
Disagree
strongly
Count 1 5 6
% within Statement: My organization
pays me well for the work 16.7% 83.3% 100.0%
% within Question: Overall, are you
satisfied with your job? 1.6% 11.9% 5.7%
Disagree Count 16 7 23
% within Statement: My organization
pays me well for the work 69.6% 30.4% 100.0%
% within Question: Overall, are you
satisfied with your job? 25.4% 16.7% 21.9%
Neither
agree nor
disagree
Count 10 9 19
% within Statement: My organization
pays me well for the work 52.6% 47.4% 100.0%
% within Question: Overall, are you
satisfied with your job? 15.9% 21.4% 18.1%
Agree Count 24 20 44
% within My organization pays me
well for the work 54.5% 45.5% 100.0%
% within Overall, are you satisfied
with your job? 38.1% 47.6% 41.9%
Agree
strongly
Count 12 1 13
% within Statement: My organization
pays me well for the work 92.3% 7.7% 100.0%
% within Question: Overall, are you
satisfied with your job? 19.0% 2.4% 12.4%
Total Count 63 42 105
% within Statement: My organization
pays me well for the work 60.0% 40.0% 100.0%
% within Question: Overall, are you
satisfied with your job? 100.0% 100.0% 100.0%

110 of 159 | P a g e
Table 19: Chi-Square Tests of Q6 and Q7
Value df Asymp. Sig. (2-sided)
Pearson Chi-Square 12.200a 4 .016
Likelihood Ratio 13.688 4 .008
Linear-by-Linear Association 2.545 1 .111
N of Valid Cases 105
a. 2 cells (20.0%) have expected count less than 5. The minimum expected count is 2.40.
The Chi-Square test illustrates that the Asymptotic significance value is 0.016 which is
less than 0.05. This, therefore, means the null hypothesis is rejected and the alternative
hypothesis is supported. Consequently, There is a relationship between employee
satisfaction and the pay offered by the organization.
4.6 Conclusion
In conclusion the Lao hotel employees felt comfortable to work in (1) Teamwork working
environment, (2) Friendly working environment and (3) No discrimination working
environment. Thus, the Lao hotels should deliver those working environments in order to
retain skilful and experienced employees. In the hotel industry in Laos, employees are
motivated by money more than other factors. Therefore, it is important for the Lao hotel
industry to increase salaries for their employees in order to enhance their performance and
involve themselves to the goals of the organizations.
4.7 Chapter summary
This chapter presents the results and findings of the data collected from both the interview
and the questionnaire survey.
In the questionnaire survey, there are 105 respondents in total participating in this survey.
The first section presents the demographic statistics including gender, age group, level of
education and work experience. In the second section, the overall level of employee
satisfaction in the hotels in Laos is demonstrated, and in the third section, the level of
employee motivation, which includes the factors that motivate employees the most, are
presented. The final section of the questionnaire survey presents the training that the Laos
hotels have provided to their employees in order to improve their employees’ work
performance.

111 of 159 | P a g e
In the interview, the answers from 6 respondents to each interview question have been
presented by linking the same ideas to produce a meaningful conclusion in order to have the
main idea which was talked about and discussed in the interview. The results of the interview
lead to better understanding of how HR managers in the Hotels in Laos select their new
employees and what training they provide to their employees.
The final section of the chapter focuses on testing hypotheses, which aims at achieving the
objectives of the research. The three hypotheses are tested by applying relevant quantitative
analysis tools which are One-ANOVA, T-Test, Correlations and Cross-tabulation.
The next chapter discusses and interprets the findings, which are essential for answering main
research question and sub-questions in this research study.
112 of 159 | P a g e
Chapter Five: Discussion of findings
5.1 Introduction
In the previous chapter, the results of data collection and data analysis which are related to
the research objectives in this study are presented. This chapter discusses employee selection,
employee training, employee satisfaction, and employee motivation in the hotel industry in
Laos based on the findings from the previous chapter. It explains in detail about what
employee selection process the Lao hotels use in order to have the right employee for the
right position, and what training the Lao hotels have provided to their employees in order to
help their employees to perform better. In addition, the researcher investigates the level of
employee satisfaction and discusses the factors that influence satisfaction of employees in
hotels in Laos. Finally, the researcher discusses the factors that motivate hotel employees to
do extra work.
5.2 Employee selection process in hotels in Laos.
The purpose of this research is to identify and determine the practical HRM that supports the
hotel industry in Laos to have competitive advantage, attain their goals and sustain their
business. HRM is strongly related to the success of a business and the improvement of
employee work performance (Phillips & Gully, 2014; Prasad, 2013). One of HRM functions
is employee selection. As the success of any organizations, large or small, mainly relies on
the ability and efficiency of the people in their various roles, it is important for the
organization to have good employee selection methods to select people who do not only have
the ability and competence to achieve duties and responsibilities successfully, but also have
the potential to grow with the organization.
In other words, in order to have competitiveness and maintain its leadership in the market, the
organization should select and hire the right people who can contribute to its business
(Jackson et al., 2012). As jobs differ, the organization requires wide ranges of knowledge,
skills, and ability. People also differ from one another in many significant ways, so the
organization has to select the right type of people to the right position. If a worker is selected
and assigned to do a job in which his/her character, ability, and knowledge are not suited, it is
likely that he/she will fail and cause a problem for the organizational management. Providing
the organization with the right workers with the right skills in the right place can result in the

113 of 159 | P a g e
improvement of organizational productivity and a high quality of service (Lussier & Hendon,
2013). In order to select and hire the right candidate who is the best qualified to fill the job
position the organization should have an effective employee selection process (Jackson et al.,
2012).
Therefore, in order to achieve the first objective of this study, the researcher has interviewed
HR managers in the six hotels in Laos about the methods of employee selection they have
employed in order to find the right person for a job in their hotel. The main question in this
interview section is: “What is the employee selection process in your organization?”
The result of the study indicates that all respondents have similar methods in selecting new
employees. After advertising a job opening in newspapers, trade journals and on websites,
they (P1, P2, P3, P4, P5, P6) said that they had five stages in employee selection. First one
was screening application form. The second one was conducting the job interviews. The third
one was checking the background of the candidates (if the applicants have work experience
for another organization. The fourth one was hiring decision, and the last one was Job offer.
(See Figure 25)
Figure 25: Selection process in hotels in Laos
Source: Developed by the researcher
In addition, all respondents are of the opinion that the employee selection process in their
hotels was effective. Two of the respondents pointed out that there was no problem in
selecting a new employee for the job because they just hired a person who had educational

114 of 159 | P a g e
qualifications and work experience that matched with the job. Other four respondents said
that their selection process was practical because they did not expect much from the
candidates who applied for a job opening in the hotel industry. They knew that the most of
the labour in the market did not have previous hotel training, and a person who had high
educational qualification did not apply for work in the service hotel industry. Therefore, they
were likely to select a candidate who seemed to work hard and be honest. Afterwards, the
hotels could train them how to work in the new environment.
5.3 Employee training in hotels in Laos
In order to help employees to improve their performance which results in productivity and
high quality of service in the organization, it is necessary for the organization to develop and
improve employee knowledge, skills, and ability (KSA) periodically (Barling & Cooper,
2008). Another function of HRM is personnel training and development. The training
activities can help to increase skill and ability of employees, and improve employee retention
rates (Hashim, 2013). The success of the organization is likely to depend on how well its
employees perform their work, so employee training and development which brings about
high performance of employees is essential to the success of the organization (Jackson,
Schuler, & Werner, 2009). In today’s age of competition, every organization considers
training and development (T&D) activities as an investment in the employees, not as
expenditure. The organization wants their employees to have the best skills and full
knowledge. In turn, their employees can perform better in their job, boost high level of
productivity, and maintain high quality of service (Jackson et al., 2009).
Thus, in order to achieve the second objective: To find out whether Lao hotels have provided
training to their employees and what training Lao hotel employees have received in order to
help them to perform their job better, the second section of the interview is about employee
training. The two main questions in this section are “does your organization provide training
to employees?” And “could you tell me about some particular training provided by your
organization?”
According to the result in the interview of HR managers in Lao Hotels, all six respondents
acknowledged that training activities were important for their employees as training practices
could help their employees to work to a high standard. However, not all six of the
respondents have sent their employees for training activities. Only five respondents (P1, P3,
P4, P5, P6) said that their organizations have provided training to their staff, but one (P2) of

115 of 159 | P a g e
the respondents said that his organization did not send employees to training activities
because his organization was small and did not have the budget for employee training
activities.
In addition to the interview of HR managers in Lao hotels, the researcher is interested in the
opinion of hotel employees about training activities provided by their organizations. Hence,
the researcher has conducted a questionnaire survey to ask hotel employees’ opinions about
the training in their organizations. The result shown in section 4.3.3 Employee training
(Question 23) indicates that from the total number of questionnaire respondents which is 105
people, 52 respondents have attended training activities and 53 respondents did not yet have
training. This can imply that 50% of respondents in the hotels did not receive any particular
training to help them to perform their work better.
The researcher is further keen to know what training they have received, and the result
presented in section 4.3.3 Employee training (Question 24) demonstrates that the majority of
respondents has received ‘customer service’ and ‘on-the job’ training, which covers 30.9%
and 27.7% respectively. Among them, the employees who have attended ‘English language’,
‘safety concerns’ and ‘food and beverage service’ training are 19.1%, 14.9%, and 7.4%
respectively. Besides, the result shown in section 4.3.3 Employee training (Question 28)
indicates that the majority of respondents feel that their organizations should provide more
‘English language’ training and ‘Customer service’ training in order to help them to work
better.
5.4 Employee motivation level in hotels in Laos
In addition to the improvement of knowledge, skill, and ability (KSA) of employees, the
organization should also be aware of employees’ motivational factors in order to ensure that
employees have a high standard of work performance in the organization. Motivation is “an
employee’s desire or drive to achieve”. Employee motivation is one of the crucial factors that
contributes to organizational success as employee motivation is related to job performance
(Cassidy & Kreitner, 2010).
Motivated workers are necessary for all businesses because motivated workers are productive
workers, and productive workers are more profitable and professional than unmotivated
workers. Unmotivated workers seem to be less productive and creative in the organization, so
the organization needs motivated workers rather than unmotivated workers (Waldman, 2014).

116 of 159 | P a g e
Motivated employees tend to engage and be fully involved in the organizational activities,
and they seem to be excited about their work and are willing to act and provide better job
performance for their organizations (Waldman, 2014).
Besides, many researchers and psychologists generally agree that apart from improving KSA
of employees, the organization has to increase employee motivation as well in order to
increase job performance in the organization (Aamodt, 2010). There are 4 factors that
motivate employees in the organization, namely needs, satisfaction, expectations, and goals.
This means the organizational policy has a direct influence on employees because these 4
factors are influenced by the organizational policy such as challenging work, rewards, and
participation (Cassidy & Kreitner, 2010). (See Figure 26)
Figure 26: Employee motivation and job performance (figure adapted and modified from
Cassidy and Kreitner, 2010, p. 211)
Source: Cassidy and Kreitner (2010, p.211)
Cassidy and Kreitner (2010) also point out that the motivators of each employee vary, so it is
important for the organization to study, examine, explore and understand what factor
motivates each employee in their own organization in order to enhance performance of
employees.

117 of 159 | P a g e
Thus, in order to achieve the third objective of this study: To identify factors that motivate
hotel employees to perform at a high standard, the researcher has conducted a questionnaire
survey to ask hotel employees for their opinion about their motivation in their workplaces.
The results appear in Table 8 (Q18) in chapter 4 and illustrates that the majority of
respondents agree that they have motivational experience in their organization. However, to
some extent, there is a high rate of employees who disagree that they have a motivational
experience in their organizations.
Besides, the result that appeared in Figure 17 (Q19) in section 4.3.2 Employee motivation
in chapter 4, demonstrates that the first most influential factor that motivates the respondents
is increasing salary, followed by the other four top factors that motivate them to work harder.
Those factors are motivational talks, job security, financial awards, and recognition
respectively. From the perspective of the respondents the opportunity to work with freedom
and promotion are the least influential factors.
Again, the researcher asked the overall opinion of employees about whether they are
motivated by their organizations to work harder or not, and the result shown in Figure 19
(Q21) in section 4.3.2 Employee motivation in chapter 4, reveals that the response rate
between ‘yes’, ‘no’ and ‘not sure’ answers is not much different. However, most respondents
are not sure whether they get motivated by their organizations to work harder or not.
5.5 Employee satisfaction level in hotels in Laos
Many organizations spend a lot of money, effort, and time to try to maintain a reasonable
standard of job satisfaction among their staff in the belief that job satisfaction is connected to
many positive consequences for individuals, their colleagues, and their organizations.
Dissatisfaction with a job can result in many negative impacts on the organization (Bernstein,
2011). The studies of Fisher (2003), Judge et al. (2001), Harrison, Newman, & Roth (2006),
and Jacobs & Solomon (1977) reveal that employees who are satisfied with their work seem
to be more motivated, perform better, and work harder than dissatisfied employees (as cited
in Bernstein, 2011). Furthermore, the studies of Borman et al. (2001), Ilies, Scott, & Judge
(2006), Moorman & Byrne (2005), and Organ, Podsakoff, & MacKenzie (2006) demonstrate
that job satisfaction can bring about organizational citizenship behaviour (OCB) in which
employees go beyond, or work more than the work requirements, in their organizations (as
cited in Bernstein, 2011).

118 of 159 | P a g e
The result of many studies demonstrates that employees’ job satisfaction is necessary for the
organization because it influences employees’ performance and organizational performance
(Chanda & Shen, 2009). Employee satisfaction is also positively linked to organizational
commitment and is relatively connected to organizational productivity (Nel et al., 2011;
Paauwe, 2004). Moreover, it is interesting that some studies point out that the high level of
job satisfaction can reduce employees’ absenteeism and prevent turnover of skilled
employees in the organization (Bernstein, 2011; Chanda & Shen, 2009; Nel et al., 2011).
Another study by Hessket et al. (1997) shows that there is a relationship between employees’
job satisfaction and organizational success (as cited in Egger & Maurer, 2014). (See Figure
27)
Figure 27: the relationship between employee satisfaction and profit (figure adapted and
modified from Rai (2013, p. 321))
Source: Rai (2013, p. 321)
The graph indicates that employee satisfaction can bring about greater productivity and
higher rate of employee retention. According to positive employee thinking and feeling, the
external service value or customer service is improved with better outcomes for the customer.
This increases customer satisfaction by meeting or going beyond the customer’s expectations.
As a result, the customers turn into loyal customers. When customers become loyal, they will
return again and again to use goods or services from a business which leads to revenue
growth and profitability (Egger & Maurer, 2014).
Furthermore, there are some studies that indicate there are some important factors that
contribute to job satisfaction in the organization (Nelson & Quick, 2012). According to
Herzberg’s Motivation-Hygiene theory, there are 7 critical factors that lead to job satisfaction
which are (1) the organizational policy and administration, (2) interpersonal relations, (3)

119 of 159 | P a g e
supervision, (4) working conditions, (5) salary, (6) status, and (7) job security (see Figure
28).
Figure 28: Factors affecting job/employee satisfaction (Figure adapted and modified from
Mathis and Jackson (2010, p. 158))
Source: Mathis and Jackson (2010, p. 158)
However, different people have different expectations and needs to be satisfied in their
workplace (Nelson & Quick, 2012).
Hence, in order to achieve the forth objective of this research study: To determine factors that
bring about a high level of job satisfaction among employees in order to engage them in
organizational goals and reduce the rate of employee turnover in hotels in Laos, the
researcher has further conducted a questionnaire survey to ask the opinion of hotel employees
about their job satisfaction in their organizations.
The information appearing in Figure 10 (Q9) in chapter 4 shows that most employees prefer
to work in a teamwork working environment and friendly working environment, This is
followed by respondents who prefer to work in a no discrimination working environment and
a supportive working environment in their organizations. The information presented in
Table 6 (Q11) in chapter 4 demonstrates that the majority of respondents agree that they
have had a positive experience and this is followed by respondents who have a neutral
opinion about their positive experience in their current organizations.
Besides, the information shown in the Figure 12 (Q12) illustrates that the majority of
respondents feel that they sometimes receive appropriate rewards for the job performance

120 of 159 | P a g e
recognition. This is followed by respondents who feel that they always receive appropriate
rewards for job performance. The information presented in the Figure 14 (Q14) in chapter 4
reveals that the three top factors that make the respondents satisfied with their present job, or
still work in their current organization, are (1) salary, (2) job security, and (3) friendly
working environment.
5.6 The influence of employee training on employee performance
From the analysis in Table 9 (Q22) in Chapter 4, the result showed that the majority of
respondents acknowledge the importance of training in which they feel it can help improve
their work performance in their organizations. More than 70% of respondents agree that
training assists them in performing their job better. Besides, the researcher is also interested
in the opinion of hotel employees about whether the training activities provided by their
organizations are adequate or not. The result shown in Table 10 (Q23) in Chapter 4
illustrates that the majority of respondents are not sure whether their organizations provide
adequate training for them or not. This covers 65% of the total responds rate, and among
them, 19.2% of employees do not think that they have adequate training. The remaining 15%
are those who feel that they have adequate training that helps them to perform their job better.
The findings can imply that most employees working in the Lao hotels recognize the
importance of training, but there is not sufficient training provided by their organizations. It
can be concluded that training activities have positive influences on the employee’s work
performance in the Lao hotel organization.
In addition, two studies were carried out to examine the difference in employees’ views
towards the importance of training activities. The findings support the hypothesis H1o: There
is no difference in the views of employees towards the importance of training in relation to
work performance in the organization. The results are presented as follows:
First, the study of the difference between three groups (Q23) towards their levels of
agreement that training is important for the quality of their work performance (Q22). The
three groups are categorized by their answers to the question 23: ‘Do you think your
organization provides adequate training for employees?’ The three groups are classified
as ‘yes’, ‘no’, and ‘not sure’. These findings show that there is no difference in the variances
between the 3 groups towards their agreement about the importance of training (refer to Table
13). This means employees recognize the significance of training activities and its positive
contribution to the quality of their work performance.

121 of 159 | P a g e
Second, the study of the difference between male and female (Q1) towards their levels of
agreement that training is important in relation to their work performed in the organization
(Q22) shows that there was no difference in the variances between male and female towards
their agreement about the importance of training (refer Table 16). These findings indicate that
there is no difference between male and female in relation to the opinion on the level of
importance of training in relation to their work performed in the organization and it can be
implied that all employees regardless of their gender in the Lao hotel organization recognize
the importance of training activities in relation to the improvement of their performance.
The analyses above aim at achieving the objective 5: To examine the influence of training on
the employee’s work as performed in the Lao hotel industry. The results illustrate that the
majority of employees recognize the importance of training in relation to their work
performed in the organization. Therefore, the Lao hotels should provide more training for
their employees in order to help them to increase their knowledge, abilities, and skills which
will result in the improvement of their work performance and the increase in the quality of
the service in the organization.
5.7 The impact of the motivational program implemented by the
organization on employee performance
From the analysis in Figure 16 (Q16) in section 4.3.2 Employee motivation in chapter 4,
the result revealed that the majority of respondents feel that employee motivation in their
organizations is important and very important, which covered more than 80% of the total
response rate. Furthermore, the information shown in Table 8 (number 2) in chapter 4
presents that most respondents agree that their organizations offer financial incentives to
employees to motivate them to work harder, and this accounts for 65.7% of the total response
rates. The findings indicate that the motivational programme implemented by the
organization has a positive influence on employee performance.
Besides, another study was conducted to examine the impact of the motivational programme
implemented by the organization on employee performance. The findings supports
hypothesis H2o: The financial incentives provided by the organization have a positive effect
on employee performance. There are two groups that have been tested. The two groups are
categorized by their answers to the question 17: ‘Does your organization offer financial
incentive to employees to motivate them to work harder?’ The two groups are classified

122 of 159 | P a g e
as ‘yes’, and ‘no’. These results are obtained from the analyses of question 17 and question
18 (number 2 in the Table) in section 4.3.2: Employee motivation, which are as follows:
The study of the difference between the two groups (Q17) towards their levels of agreement
that the financial incentives provided by the organization have a positive effect on employee
performance (Q18 number 2 in the table) showed that there was no difference in the
variances between the 2 groups towards their agreement about the financial incentives
provided by the organization (refer to Table 17). These findings demonstrate that the
financial incentives provided by the organization have a positive effect on employee
performance.
The analyses above aim at achieving the objective 6: To identify the impact of the financial
incentives implemented by the organization on employee performance. The results
demonstrate that most of the employees agree that the financial incentives provided by the
organization have a positive effect on their performance. Therefore, the Lao hotels should put
emphasis on improving the financial incentive programme in order to increase employee
motivation which can lead to employee engagement, higher employee productivity and a
higher level of efficiency of employees in the workplace.
5.8 The relationship between satisfaction of employee and the
pay offered by the organization
The result shown in section 4.3.1 Employee satisfaction (Question 6) in chapter 4 reveals
that the majority of respondents are satisfied with their current job. 60% of respondents feel
that they are satisfied with their current job while 40% are those who are not satisfied with
their current job. In addition, the information shown in Table 5 (Q7) and in Figure 9 (Q8)
in chapter 4 demonstrates that the majority of respondents are satisfied with the pay and
employment benefits. The findings suggest that the employment benefits and the pay offered
by the organization have an influence on the satisfaction of employees.
Besides, another analysis was conducted to figure out whether there is a relationship between
employee satisfaction and the pay offered by the organization or not. The findings support
the hypothesis H3a: There is a relationship between employee satisfaction and the salary paid
by the organization.
123 of 159 | P a g e
From the study of the relationship between Question 6 and Question 7 (number 4 in the table)
using cross-tabulation, it showed that there were 63 employees who were satisfied with their
current job, and, among them, 36 employees agree and strongly agree that their organization
pay them well for the work (refer to Table 18). The findings imply that the salary/pay offered
by the organization has an influence on the satisfaction of employees in the organization.
The above analyses aim at achieving the objective 7: To determine the relationship between
satisfaction of employees and the salary paid by the organization. The results reveal that there
is a positive relationship between employee satisfaction and the salary paid by the
organization. Therefore, the Lao hotels should focus on improving their salary structure and
policies in order to increase employee satisfaction which brings about the reduction of the
employee turnover rate, organizational commitment among employees, and organizational
citizenship behaviour.
5.9 Conclusion
To conclude, it was found that the hotel industry in Laos seems not to pay much attention to
HRM in their organizations. Thus, in order to improve their current HRM practices, it is vital
for the hotel business in Laos to check and review their HRM including employee selection
process and criteria, employee training programmes and staff retreat workshops, employee
motivation and employee satisfaction schemes, and rewards and pay points system.
5.10 Chapter summary
Chapter Five elaborates and discusses the findings of chapter four, and the chapter five
answers all aspects covered in the research objectives and sub-research questions. These
findings are supported by relevant literature in order to draw the conclusions of the research.
In addition, all relevant hypotheses are statistically analysed and critically tested which bring
out the fulfilment of the research objectives and the achievement of the aim of this research.
Chapter Six is about conclusions, recommendations, and further areas of research.

124 of 159 | P a g e
Chapter Six: Conclusion of Findings and
Recommendations
6.1 Introduction
In the previous chapter, the findings, which are obtained from data analysis, are examined
and fully discussed. This chapter begins with the research conclusion where the researcher
summarizes the results of research objectives. This is followed by recommendations for the
hotel industry in Laos to improve their HRM practices. Some of the limitations of this
research study are displayed and presented. Finally, possible further research is suggested.
6.2 Research conclusion
The aim of this research study was to identify and determine the practical and suitable HRM
approaches in relation to employee selection, employee training, employee satisfaction, and
employee motivation that supported the hotel industry in Laos to have a competitive
advantage, attain their goals and sustain their business. As HRM plays a key role in
developing an organization and has direct influence on employee performance, employee
satisfaction and work motivation, it is important to know the effective HRM practices that
support employees to perform at their best. In recent times, it was claimed that the growth
rate of hotels in Laos was more than triple and the number of foreign investments in the
hospitality industry has grown continuously. However, when compared to regional and
international competitors, the hotel business in Laos still underperforms in relation to quality
of customer service.
According to the literature, the main reason for the low quality of customer service is from
ineffective HR management and HR development in the hotel business in Laos. Thus, in
order to identify and determine the practical and optimal HRM that can boost employee and
organizational performance in the hotel business, it is vital to know the current HRM
practices in the existing hotels. Studying and understanding the current HRM practices in the
existing hotels helps to identify the strengths and weaknesses of the current HRM practices in
relation to employee selection process, employee training, employee motivation and
employee satisfaction, and then, work towards optimal solutions

125 of 159 | P a g e
The primary data of this research study were mainly collected in six hotels in Laos, namely
City Inn, Rashmi’s Plaza Hotel, Best Western Vientiane Hotel, Lane Xang Hotel, Settha
Palace Hotel, and Vientiane Golden Hotel. These hotels were used as sources of data
collection. This research study also adopts and applies mixed methods (both qualitative and
quantitative approaches) in order to ensure that the research problems are fully answered and
successfully addressed. In the qualitative method, 6 HR managers, one from each selected
hotel, were interviewed in order to explore and understand their current practise of HRM in
relation to employee selection and employee training in their organizations.
In the quantitative approach, a questionnaire survey was conducted in the 6 selected hotels in
order to seek to understand the perspective of all employees on HRM in relation to employee
training, job satisfaction, and work motivation in their workplace. 120 questionnaires were
distributed in the 6 hotels, with 105 questionnaires returned resulting in an 87.4% response
rate. In terms of data analysis, firstly, the data collected from the interviews were analysed by
applying and mixing 5 approaches together, including text coding, content analysis, thematic
analysis, narrative analysis and comparative analysis. Secondly, the data collected from the
questionnaire survey were analysed by using statistical analysis software ‘SPSS’. The results
of findings help to answer the sub-research questions and are clearly explained as follows:
The first sub-research question is to explore procedures that HR managers have employed in
order to select the right employee to the right position in the Lao hotel industry. The findings
demonstrate that the majority of HR managers at Lao hotels have similar methods and
process in selecting a new employee to work in their organizations which are (1) screening
application form, (2) conducting the job interviews. (3) checking the background of the
candidates (if the applicants have work experience for another organization), (4) hiring
decision, and (5) Job offer.
The second sub-question is to find out training programmes that employees have received in
order to develop their capacity of their work performance in hotels in Laos. The result
illustrates that all HR managers admit that training activities are essential for their employees,
so their organizations have recently sent their employees to have training. However, in
addition to the interview of HR managers in Lao hotels, the researcher conducted a
questionnaire survey to ask the opinion of hotel employees at all levels about training
activities provided by their organizations. It appears that of the 105 employees who
participated in the survey, 52 respondents have attended training activities and 53

126 of 159 | P a g e
respondents did not have training yet. Furthermore, the majority of the respondents feel that
they need more training. Most of the respondents need to attend training courses, namely
‘English language’ training and ‘Customer service’ training in order to perform better at their
work.
The third sub-research question is to identify factors that motivate hotel employees to
perform at high standard levels. The result of the study demonstrates that most of the
respondents feel that their organizations create the conditions whereby they are motivated to
work harder. In addition, the result indicates that the most influential factor that motivates the
respondents to work harder is increasing salary.
The fourth sub-research question is to determine factors that bring about a high level of job
satisfaction among employees in order to reduce the rate of employee turnover and engage
them in organizational goals. The result of the study reveals that the majority of respondents
are satisfied and happy with their current work and organizational work conditions. Besides,
the majority of the respondents point out that the main factor that brings about the high level
of their job satisfaction is salary. The other two most influential factors that lead to employee
satisfaction in the Lao hotel industry are job security and friendly working environment.
The fifth sub-research question is to examine the influence of training on the employee’s
work performed in the organization. In order to answer this sub-question, the researcher has
created a hypothesis H1o: There is no difference in the views of employees towards the
importance of training in relation to work performance in the organization. The result of
testing this hypothesis shows that the majority of employees in the hotel industry recognize
the importance of training in relation to their work performed in the organization. Most of
them feel that training has a positive influence on their work performed in the organization
(refer to 4.6.1 Hypothesis 1 in Chapter 4).
The sixth sub-research question is to identify the impact of the financial incentives
implemented by the organization on employee performance. In order to answer this sub-
research question, the researcher has developed the hypothesis H2o: The financial incentives
provided by the organization have no effect on employee performance. The result of testing
this hypothesis reveals that the financial incentives provided by the organization have a
positive impact on employee performance (refer to 4.6.2 Hypothesis 2 in Chapter 4). This
means the majority of hotel employees have no different opinion that financial incentives
provided by their organization motivate them to work harder.

127 of 159 | P a g e
Finally, the seventh sub-question is to determine the relationship between satisfaction of
employees and the salary paid by the organization. In order to answer this sub-research
question, the researcher has developed H3o: There is no relationship between employee
satisfaction and the pay/salary offered by the organization. The result of testing this
hypothesis indicates that there is a positive relationship between employee satisfaction and
high pay/salary offered by the organization (refer to 46.3 Hypotheis 3 in chapter 4).
6.3 Recommendations for hotels in Laos
According to the results and the findings of the study, the researcher has produced some
recommendations that help to improve HRM in the hotel industry in Laos.
The hotels should reconsider the process of employee selection because the proper
selection and placement of personnel seems to build up a suitable workforce and improve
the efficiency of organizational operations and the morale of employees. Besides, the
selection of the right person for every job is more likely to help to reduce the rate of
labour turnover and absenteeism and increase the quality and quantity of performance. It
appears that when the right people are selected for the right jobs, job satisfaction and
work efficiency will be increased. However, there is no ideal employee selection
procedure that is appropriate for all cases or situations. Thus, in the case of the hotels in
Laos, the researcher suggests that the Lao hotels should follow the steps in the selection
process below (see Figure 29) in order to improve the effectiveness of the employee
selection procedure in the Lao hotels.

128 of 159 | P a g e
Figure 29: Steps in the employee selection process (Figure is modified and adapted from:
Nel, Werner, Botha, Du Plessis, Mey, Ngalo, Poisat, & Van Hoek (2015))
Source: Nel, Werner, Botha, Du Plessis, Mey, Ngalo, Poisat, & Van Hoek (2015, p. 91)
In the employee selection criteria, apart from considering qualifications, experience,
knowledge, skills, and abilities of the candidates, the hotels should consider the
candidates’ attitudes, values, personality. This is because person-organization fit can lead
to organisational commitment and intention to stay (Stone, 2013). Furthermore,
motivational and cultural fit can bring about high job performance (Stone, 2013). Hence,
in the selection of employees, the hotels should ensure that they select and hire the
candidate who has the right personality, attitude and values to match the values and
culture of their work environment (see Figure 30).

129 of 159 | P a g e
Figure 30: Candidate fit (Figure is modified and adapted from: Stone (2013, p.253))
Source: Stone (2013, p. 253)
The hotel should provide more training that is necessary for employees, especially a
Customer service course and English language course in order to improve and increase
their ability and better their performance at work (refer to Figure 23 in chapter 4).
Besides, the hotels should reconsider their training needs analysis program in order to
ensure that the training increases productivity in the organization. The researcher
recommends that the hotels should adopt and apply a training needs analysis model
below in order to guarantee that the training benefits the organization (see Figure 31).
Figure 31: Assessing training and development needs (Figure is modified and adapted
from: DeNisi and Griffin (2008, p. 328))
Source: DeNisi and Griffin (2008, p. 328)
*Note: full explanation of this graph is in section 2.6: Training improving employee performance
in chapter 2.

130 of 159 | P a g e
The hotels should understand that apart from self-actualization needs, self-esteems
needs, money is the most important factor that drives hotel employees to work harder
(see Figure 17 in section 4.3.2 Employee motivation in chapter 4). In addition, the
hotels should consider the factors that are illustrated in Figure 32 shown below in order
to be able to increase employees’ job satisfaction which brings about an increase in
employee commitment to the organization and results in their organizational citizenship
behaviours.
Figure 32: Employee satisfaction factors (Figure is modified and adapted from: Nel,
Werner, Botha, Du Plessis, Mey, Ngalo, Poisat, & Van Hoek (2015))
Source: Nel, Werner, Botha, Du Plessis, Mey, Ngalo, Poisat, & Van Hoek (2015, pp. 270-280)
The hotels should reconsider and develop the fair compensation policies for all
employees as it is more likely to result in employee satisfaction which leads to the
increase of employees’ work performance, higher level of employee commitment and
higher retention levels. Before creating fair compensation policies for all employees,
the hotels should understand the components of compensation (see Figure 33).
Besides, the hotels should periodically carry out employee attitude surveys as they can
help to determine the rewards that are most needed or sought by their employees.

131 of 159 | P a g e
Figure 33: compensation components (Figure modified and adapted from: Nel, Werner,
Botha, Du Plessis, Mey, Ngalo, Poisat, & Van Hoek (2015) and Snell and Bohlander
(2013))
Source: Nel, Werner, Botha, Du Plessis, Mey, Ngalo, Poisat, & Van Hoek (2015, pp. 136-154) and Snell
and Bohlander (2013, p. 395)
The hotels should reconsider their organizational working environment, organizational
rewards, flexible work arrangements, and their organizational promotion systems in
order to ensure that there is a high level of employee motivation which results in an
increase of employee work performance, an improvement of organizational productivity,
and high level of employee commitment and engagement (see Figure 34).

132 of 159 | P a g e
Figure 34: Employee motivation and employee performance (Figure modified and
adapted from Griffin and Moorhead (2014, p. 126) and Nel, Werner, Botha, Du Plessis, Mey,
Ngalo, Poisat, & Van Hoek (2015, pp. 270-280))
Source: Griffin and Moorhead (2014, p. 126), and Nel, Werner, Botha, Du Plessis, Mey, Ngalo, Poisat, &
Van Hoek (2015, pp. 270-280)
6.4 Limitations
It has been claimed that all pieces of research work have limitations and without exception,
this research study has a limitation as well. Even if this research has adopted and applied
mixed methods for data collection and data analysis, it still has some limitations in relation to
the research procedures. With regard to the qualitative method, due to time constraint, the
sample size seems to be small. Only 6 participants were selected for this research. The 6
participants were HR managers from 6 hotels, namely City Inn, Rashmi’s Plaza Hotel, Best
Western Vientiane Hotel, Lane Xang Hotel, Settha Palace Hotel, and Vientiane Golden
Hotel. Even if the sample size appears to be sufficient for this study, it would be more useful
and beneficial if the researcher could carry out interviews with more HR managers in other
Lao hotels in order to experience and explore more HRM practices in the Lao hotel industry.
133 of 159 | P a g e
With regard to the quantitative method, the questionnaire survey was carried out by
employees at all levels in the hotels, but all of the hotels that participated in this research
study are only located in the capital city of Laos. Thus, this research study might not
represent the overall HRM practices in the hotel industry nationwide. Furthermore, the
sample size for a questionnaire survey is relatively small, which might reduce the accuracy,
reliability and validity of the findings in this research.
6.5 Further research
This research study has sought the practical and suitable HRM processes that Lao hotel
business should employ and apply in order to improve their staff performance, increase their
employee satisfaction and motivation, gain a competitive advantage, attain their goals and
sustain their business. However, this research study was conducted based on a small sample
size. Thus, the researcher recommends that further research could be carried out as follows:
Further research could be conducted with a larger sample from more hotels across the
country in order to ensure that there is a better understanding of the current HRM
practices. Moreover, a large sample size helps a researcher to have more precise,
reliable and valid information about current HRM practices in the Lao hotel industry.
Besides, it is claimed that the larger number of participants allows the researcher to
generalize to the study population more precisely.
Further research could be carried out to evaluate the effectiveness of HRM practices
in relation to the improvement of employee motivation and performance in the Lao
hotel industry.
Further research could be conducted by comparing before and after application of
some particular methods of employee satisfaction and motivation that are suggested in
this research in order to identify and evaluate the effectiveness of different employee
motivation and satisfaction practices in the Lao hotels.
Further research could be conducted to identify the levels of satisfaction among
employees in the Lao hotels, and how their satisfaction influences the quality of
customer service in the Lao hotels.
Further research could be carried on how employee engagement has an influence on
the organizational performance in the Lao hotels and what factors contribute to
employee engagement in the hotel industry in Laos.

134 of 159 | P a g e
6.6 Closing statement
This research study provides guidance and direction for the hotel industry in Laos to improve
their performance and to have a competitive edge over their rivals in the market. Even if there
are many factors that influence the organizational performance and the success of the
organization, the effectiveness of HRM practices is one of the major components that indicate
and determine the success of the hotel business. If the hotels carefully analyse and evaluate
employee needs and align those needs with organizational goals, the hotels will get the
desired results that might help them grow continuously and beneficially.
Apart from the effectiveness of HRM practices, the Lao hotels should consider other
important components that lead to the success of their businesses and results in sustainable
competitive advantage. For example the effectiveness of financial management, the quality of
customer service, the leadership style of the managers, cutting-edge technology, the design of
the hotel and the effectiveness of a marketing strategy.
Finally, the researcher hopes that this research study can help the hotel industry in Laos to
improve their current HRM practices to increase employee performance, job satisfaction and
work motivation in their organizations, and help to sustain their business in the future.

135 of 159 | P a g e
References
Aamodt, M. G. (2010). Industrial/organizational psychology: an applied approach.
California, CA: Cengage Learning.
Adair, J. (2009). Leadership and motivation : The fifty-fifty rule and the eight key principles
of motivating others. London, UK: Kogan Page.
Adams, J., Khan, H. T. A., Raeside, R., & White, D. (2007). Research methods for graduate
business and social sience students. London, UK: Sage Publications Ltd.
Adeniyi, M. A. (2010). Effective leadership management: An integration of styles, skills and
character for today's CEOs. Bloomington, IN: AuthorHouse.
Aggarwal, S. C., & Jain, T. R. (2008). Quantitative methods for MBA. New Delhi, India: FK
Publications.
Ahlstrom, D., & Bruton, G. D. (2010). International management: strategy and culture in the
emerging world. Mason,OH: South-western cengage learning.
Aksu, A. A. (2005). Defining training needs of five-star hotel personnel: an application in the
antalya region of Turkey. Managerial auditing journal, 20(9), 945-953.
Anastas, J. W. (2012). Research design for social work and the human services. Retrieved
from http://unitec.eblib.com.au/patron/FullRecord.aspx?p=949030
Andrew, D. P. S., Pedersen, P. M., & McEvoy, C. D. (2011). Research methods and design in
sport management. Illinois, IL: Human Kinetics.
Andrews, S. (2009). Human resource management:textbook for the hospitality industry. New
Delhi, India: McGraw-Hill Education (India) Pvt Limited.
Antikainen, M., Mäkipää, M., & Ahonen, M. (2010). Motivating and supporting
collaboration in open innovation. European Journal of Innovation Management,
13(1), 100-119.
Ardichvili, A., Page, V., & Wentling, T. (2003). Motivation and barriers to participation in
virtual knowledge-sharing communities of practice. Journal of knowledge
management, 7(1), 64-77.
Armstrong, M. (2006). A handbook of human resource management practice (10th ed.).
Pennsylvania, PA: Kogan Page Limited.
Armstrong, M. (2009). A handbook of human resource management practice (11th ed.).
Pennsylvania, PA: Kogan Page Limited.
Armstrong, M. (2010). Armstrong's essential human resource management practice: A guide
to people management. London, UK: Kogan Page.
Armstrong, M., & Taylor, S. (2014). Armstrong's handbook of human resource management
practice (13th ed.). London, UK: Kogan Page.
Arthur, D. (2012). Recruiting, interviewing, selecting & orienting new employees (5th ed.).
New York, NY: AMACOM.
Azanza, P. A. (2004). Human resources management. Manila, Philippines: JMC PRESS,
INC.
Azzara, C. V. (2010). Questionnaire design for business research: Beyond linear thinking-an
interactive approach. Oklahoma, OK: Tate Publishing & Enterprises.
Babbie, E., & Rubin, A. (2011). Research methods for social work (7th ed.). Belmont, CA:
Cengage Learning.
Babbie, E., & Rubin, A. (2012). Essential research methods for social work (3rd ed.).
Belmont, CA: Cengage Learning.
Bailey, A., Hutter, I., & Hennink, M. (2010). Qualitative research methods. London, UK:
SAGE Publications.

136 of 159 | P a g e
Bajpai, N. (2011). Business research methods. New Delhi, India: Pearson Education India.
Banfield, P., & Kay, R. (2008). Introduction to human resource management. New York,
NY: Oxford University Press.
Barling, J., & Cooper, C. L. (2008). Organizational Behavior. London, UK: SAGE
Publications.
Beardwell, J., & Claydon, T. (2007). Human resource management: A contemporary
approach (5th ed.). New York, NY: Prentice Hall/Financial Times.
Becker, B. E., & Huselid, M. A. (2006). Strategic human resources management: where do
we go from here? Journal of Management, 32(6), 898-925.
Bell, E., & Bryman, A. (2011). Business research methods (3rd ed.). New York, NY: Oxford
University Press.
Bellamy, C., & Perri, s. (2012). Principles of Methodology: Research Design in Social
Science. London, UK: SAGE Publications.
Bennett, A., & Elman, C. (2006). Qualitative research: Recent developments in case study
methods. Annu. Rev. Polit. Sci., 9, 455-476.
Bergman, M. M. (2008). Advances in mixed methods research: Theories and applications.
London, England: SAGE.
Beri, G. C. (2013). Marketing research (5th ed.). New Delhi, India: McGraw Hill Education
(India) Private Limited.
Bernard, H. R., & Ryan, G. W. (2010). Analyzing qualitative data: Systematic approaches.
London, UK: SAGE Publications.
Bernstein, D. A. (2011). Essentials of psychology (5th ed.). CA: Cengage Learning.
Bhattacharyya, D. K. (2009). Human resource planning (2nd ed.). New Delhi, India: Excel
Books.
Bjerke, R., Ind, N., & De Paoli, D. (2007). The impact of aesthetics on employee satisfaction
and motivation. EuroMed Journal of Business, 2(1), 57-73.
Blaikie, N. (2009). Designing social research. Malden, MA: Polity Press.
Blessing, L. T. M., & Chakrabarti, A. (2009). DRM, a design research methodology. London,
UK: Springer-Verlag London Limited.
Boeije, H. R. (2009). Analysis in qualitative research. London, UK: SAGE Publications.
Boella, M., & Goss-Turner, S. (2012). Human resource management in the hospitality
industry. Retrieved from
http://unitec.eblib.com.au/patron/FullRecord.aspx?p=270111
Borrego, M., Douglas, E. P., & Amelink, C. T. (2009). Quantitative, qualitative, and mixed
research methods in engineering education. Journal of Engineering Education, 98(1),
53-66.
Boudrias, J.-S., Gaudreau, P., Savoie, A., & Morin, A. J. (2009). Employee empowerment:
From managerial practices to employees' behavioral empowerment. Leadership &
Organization Development Journal, 30(7), 625-638.
Boxall, P., & Purcell, J. (2011). Strategy and human resource management (3rd ed.). London,
UK: Palgrave Macmillan.
Brace, I. (2013). Questionnaire design: How to plan, structure and write survey material for
effective market research. London, England: Kogan Page Publishers.
Bratton, J., & Gold, J. (2012). Human resource management: Theory and practice (5th ed.).
London, UK: Palgrave Macmillan.
Briggs, A. R. J., Coleman, M., & Morrison, M. (2012). Understanding methodology. In M.
Morrison (Ed.), Research methods in educational leadership & management (3rd ed.,
pp. 14-28). London, England: Sage.
Brown, J. N. (2011). The complete guide to recruitment: A step-by-step approach to
selecting, assessing and hiring the right people. London, UK: Kogan Page Limited.

137 of 159 | P a g e
Bryman, A. (2012). Social research methods (4th ed.). New York, NY: Oxford university
press.
Bryman, A., Dainty, A., Greasley, K., Price, A., Soetanto, R., & King, N. (2005). Employee
perceptions of empowerment. Employee relations, 27(4), 354-368.
Buhler, P. (2002). Human resources management: All the information you need to manage
your staff and meet your business objectives. Avon, MA: F+W Publications, Inc.
Business Dictionary. (2014). Data Analysis. Retrieved from
http://www.businessdictionary.com/definition/data-analysis.html
Cargan, L. (2007). Doing social research. Plymouth, England: Rowman & Littlefield.
Casas-Arce, P., & Martínez-Jerez, F. A. (2009). Relative performance compensation,
contests, and dynamic incentives. Management Science, 55(8), 1306-1320.
Cassidy, C., & Kreitner, B. (2010). Supervision: setting people up for success. Ohio, OH:
Cengage Learning.
Champoux, J. E. (2010). Organizational behavior : integrating individuals, groups, and
organizations (4th ed.). New York, NY: Taylor and Francis
Chanda, A., & Shen, J. (2009). HRM strategic integration and organizational performance.
London, UK: SAGE Publications.
Chandan, J. S. (2009). Organizational behaviour (3rd ed.). New Delhi, India: Vikas
Publishing House Pvt Limited.
Chaudhuri, K. K. (2010). Human resource management: principles and practices. Mumbai,
India: HIMALAYA BUBLISHING HOUSE PVT. LTD.,.
Cho, J., & Trent, A. (2006). Validity in qualitative research revisited. Qualitative research,
6(3), 319-340.
Cohen, L., Manion, L., & Morrison, K. (2013). Research methods in education (7th ed.).
New York, NY: Taylor & Francis.
Collis, J., & Hussey, R. (2014). Business research: A practical guide for undergraduate and
postgraduate students (4th ed.). London, UK: Palgrave Macmillan.
Cooper, D. R., & Schindler, P. S. (2014). Business research methods. New York, NY:
McGraw-Hill/Irwin.
Corbin, J., & Strauss, A. (2007). Basics of qualitative research: Techniques and procedures
for developing grounded theory. London, UK: SAGE Publications.
Covington, P. (2008). Success in sociology. Buckinghamshire, England: Folens Publishers.
Creswell, J. W. (2013a). Qualitative inquiry and research design: Choosing among five
approaches (3rd ed.). London, UK: SAGE Publications.
Creswell, J. W. (2013b). Research design: Qualitative, quantitative, and mixed methods
approaches. London, UK: SAGE Publications.
Creswell, J. W., & Clark, V. L. P. (2011). Designing and conducting mixed methods research
(2nd ed.). London, UK: SAGE Publications.
Crouch, C., & Pearce, J. (2012). Doing research in design. London, UK: Bloomsbury
Academic.
Cruz, N. M., Pérez, V. M., & Cantero, C. T. (2009). The influence of employee motivation on
knowledge transfer. Journal of knowledge management, 13(6), 478-490.
Darwish, T. K. (2013). Strategic HRM and performance : Theory and practice. Retrieved
from http://unitec.eblib.com.au/patron/FullRecord.aspx?p=1220971
Dawson, C. (2009). Introduction to research methods: A practical guide for anyone
undertaking a research project (4th ed.). London, UK: Constable & Robinson Ltd.
Deb, T. (2006). Strategic approach to human resource management: concept, tools &
application. New Delhi, India: Atlantic Publishers & Distributors.

138 of 159 | P a g e
Delery, J. E., & Shaw, J. D. (2001). The strategic management of people in work
organizations: Review, synthesis, and extension. Research in personnel and human
resources management, 20, 165-197.
DeNisi, A. S., & Griffin, R. W. (2008). Human resource management (3rd ed.). Boston, MA:
Houghton Mifflin.
Denzin, N. K., & Lincoln, Y. S. (2008). Strategies of qualitative inquiry (3rd ed.). London,
UK: Sage Publications.
Dowling, P., Festing, M., & Engle, A. D. (2008). International human resource management:
Managing people in a multinational context (5th ed.). Melbourne, Australia:
Thomson.
Du Plessis, A., & Frederick, H. (2010). Local ontologies and epistemologies of leadership in
the Rosebank business precinct of Auckland, New Zealand. Interdisciplinary Journal
of Contemporary Research in Business, 2(7), 10-22.
Du Plessis, A., Frederick, H., & Maritz, A. (2013). Education and training deficits in
industrial clusters: empirical evidence that managers can use to rectify the skills gap
in Auckland precinct. Actual problems of economics, 2(3), 12-20.
Du Plessis, A., Sumphonphakdy, S., Oldfield, J., & Botha, C. (2013). Competitive advantage:
recruitment and retention of senior managers in financial sectors in Laos. Jouranal of
Community Positive Practices 13(2), 41-52.
Du Plessis, A., Toh, W., & Chen, J. (2013). Integrating leadership development, talent
retention and knowledge management: HRM’s role. International Journal of
Contemporary Business Studies, 4(8), August: 43-55.
Duke, J. (2010). Practical Challenges of the expectancy theory of motivation in
organizational settings. Makerere business journal, 10(1), 100-112. Retrieved from
http://www.mbj.mubs.ac.ug/docs/MBJ%202010%20page%20100-113.pdf
Dutt, R. (2008). Principles of management. Meerut, India: Krishna Prakashan Media (P) Ltd.
Egger, R., & Maurer, C. (2014). Tourism research perspectives: proceedings of the
International student conference in tourism research. Krems, Austria: Books on
Demand.
Ekerman, G. (2006). X-kit undergraduate human resource management. Cape Town, South
Africa: Maskew Miller Longman.
Elkin, G., Jackson, B., & Inkson, K. (2008). Organisational behaviour in New Zealand :
theory and practice (3rd ed.). Auckland, New Zealand: Pearson Prentice Hall.
Elo, S., & Kyngäs, H. (2008). The qualitative content analysis process. Journal of advanced
nursing, 62(1), 107-115.
Erasmus, B., Swanepoel, B., & Schenk, H. (2005). South African human resource
management for the public sector. Cape Town, South Africa: Juta Academic.
Farmer, M., Smith, P., & Yellowley, W. (2013). Organizational behaviour. London, UK:
Taylor and Francis
Flick, U. (2014). An introduction to qualitative research (5th ed.). London, UK: SAGE
Publications.
Fottler, M. D., Khatri, N., & Savage, G. T. (2010). Strategic human resource management in
health care. Bingley, UK: Emerald Group Publishing Limited.
Fowler, F. J. (2009). Survey research methods (4th ed.). London, England: SAGE.
Frangos, C. (2009). Proceedings of the 2nd international conference: Quantitative and
qualitative methodologies in the economic and administrative sciences. Athens,
Greece: Technological Educational Institute of Athens.
Frankfort-Nachmias, C., & Leon-Guerrero, A. (2014). Social statistics for a diverse society.
London, UK: SAGE Publications.

139 of 159 | P a g e
Frey, B. S., & Osterloh, M. (2002). Successful management by motivation: Balancing
intrinsic and extrinsic incentives. Berlin, Germany: Springer.
Gatewood, R., Feild, H., & Barrick, M. (2010). Human resource selection (7th ed.). Mason,
OH: Cengage Learning.
Gerson, R. F. (2006). Achieving high performance: A research-based practical approach.
Amherst, MA: HRD Press, Inc.
Ghauri, P. N., & Grønhaug, K. (2005). Research methods in business studies : a practical
guide. Financial Times Prentice Hall: New York, NY.
Ghuman, K. (2010). Management: Concepts, practice & cases. New Delhi, India: McGraw-
Hill Education (India) Pvt Limited.
Given, L. M. (2008). The Sage encyclopedia of qualitative research methods. Los Angeles,
LA: SAGE Publication.
Goncharuk, A. G., & Monat, J. P. (2009). A synergistic performance management model
conjoining benchmarking and motivation. Benchmarking: An International Journal,
16(6), 767-784.
Greasley, P. (2007). Quantitative data analysis using spss: An introduction for health and
social sciences. New York, NY: McGraw-Hill Education.
Griffin, R., & Moorhead, G. (2014). Organizational behavior: managing people and
organizations (11th ed.). Mason, OH: Cengage Learning.
Grigoroudis, E., & Siskos, Y. (2010). Customer satisfaction evaluation: methods for
measuring and implementing service quality. New York, NY: Springer.
Grinnell, R. (2012). E-study guide for social work research and evaluation (8th ed.).
California, CA: Content Technologies, Inc.
Guest, G., & MacQueen, K. M. (2008). Handbook for team-based qualitative research. New
York, NY: Rowman & Littlefield Publishing Group, Inc.
Gupta, C., B. (2007). Business studies (4th ed.). New Delhi, India: McGraw-Hill Education
(India) Pvt Limited.
Haines, V. Y., Saba, T., & Choquette, E. (2008). Intrinsic motivation for an international
assignment. International Journal of Manpower, 29(5), 443-461.
Harding, J. (2013). Qualitative data analysis from start to finish. London, UK: SAGE
Publications.
Hashim, M. (2013). A guide to human resource management: basic concepts. Miami, MI:
Academic Press Corporation.
Hayes, D. K., & Ninemeier, J. D. (2009). Human resources management in the hospitality
industry. New Jersey, NJ: John Wiley & Sones, Inc.
Healey, J. (2012). The essentials of statistics: A tool for social research. Belmont, CA:
Cengage Learning.
Hennink, M. M. (2014). Focus group discussions: Understanding qualitative research. New
York, NY: Oxford University Press.
Hesse-Biber, S. N., & Leavy, P. (2010). The practice of qualitative research (2nd ed.).
Thousand Oaks, CA: SAGE.
Hinton, P. R., McMurray, I., & Brownlow, C. (2014). SPSS explained (2nd ed.). New York,
NY: Taylor & Francis.
Ho, R. (2006). Handbook of univariate and multivariate data analysis and interpretation with
SPSS. New York, NY: Taylor & Francis.
Holbeche, L. (2012). Aligning human resources and business strategy. Oxford, UK: Taylor &
Francis.
Iyer, G. S., & Ravindran, S. (2009). Usefulness, incentives and knowledge management.
Journal of Knowledge Management, 13(6), 410-430.

140 of 159 | P a g e
Jackson, S., Schuler, R., & Werner, S. (2009). Managing human resources. Ohio, OH:
Cengage Learning.
Jackson, S., Schuler, R., & Werner, S. (2012). Managing human resources (11th ed.). Ohio,
OH: Cengage Learning.
Jain, N. K. (2005). Organisational behaviour. New Delhi, India: Atlantic Publishers &
Distributors (P) Limited.
James, H. S. (2005). Why did you do that? An economic examination of the effect of
extrinsic compensation on intrinsic motivation and performance. Journal of Economic
Psychology, 26(4), 549-566.
Johnson, B., & Christensen, L. (2010). Educational research: Quantitative, Qualitative, and
mixed approaches (4th ed.). London, United Kingdom: SAGE Publications.
Josten, E., & Schalk, R. (2010). The effects of demotion on older and younger employees.
Personnel Review, 39(2), 195-209.
Kemp, D., & Lewis, J. R. (2007). Handbook of new age. Danvers, MA: Brill.
Kominis, G., & Emmanuel, C. R. (2005). Exploring the reward preferences for middle level
managers. Qualitative Research in Accounting & Management, 2(1), 54-76.
Kothari, C. R. (2011). Research methodology: Methods and techniques (2nd ed.). New Delhi,
India: New Age International (P) Limited.
Krishnaswami, O. R., & Satyaprasad, B. G. (2010). Business research methods. Mumbai,
India: Himalaya Publishing House.
Kumar, R. (2014). Research methodology: A step-by step guide for beginners (4th ed.).
London, UK: SAGE Publications.
Lauby, S. J. (2005). Motivating employees. Virginia, VA: American Society for Training &
Development.
Lewin, C. (2005). Elementary quantitative methods. In B. Somekh & C. Lewin (Eds.),
Research methods in the social sciences (pp. 215-225). London: Sage.
Lin, H.-F. (2007). Effects of extrinsic and intrinsic motivation on employee knowledge
sharing intentions. Journal of information science.
Lodico, M. G., Spaulding, D. T., & Voegtle, K. H. (2010). Methods in educational research:
From theory to practice (2nd ed.). California, CA: John Wiley & Sons, Inc.
Loedolff, P., Erasmus, B. J., Van, Z., Mda, M., & Nel, P. S. (2013). Managing training and
development in South Africa (6th ed.). Cape Town, South Africa: Oxford University
Press.
Lussier, R. N., & Hendon, J. R. (2013). Human resource management: functions,
applications, skill development. New York, NY: SAGE Publications.
Lyons, E., & Coyle, A. (2007). Analysing qualitative data in psychology. London, UK:
SAGE Publications Inc.
Mackay, A. (2006). Motivation, ability and confidence building in people. Burlington, MA:
Routledge.
Macky, K., & Wilson, M. (2013). Rewards, Remuneration and Performance: A Strategic
Approach. Auckland, New Zealand: CCH New Zealand Limited.
Marshall, G. W., Moncrief, W. C., Rudd, J. M., & Lee, N. (2012). Revolution in sales: the
impact of social media and related technology on the selling environment. Journal of
Personal Selling and Sales Management, 32(3), 349-363.
Martin, J. (2010). Key concepts in human resource management. London, UK: SAGE
Publications Ltd.
Martyn, D. (2010). The good research guide: For small-scale social research projects (4th
ed.). Berkshire, England: McGraw-Hill International.
Mathis, R. L., & Jackson, J. (2010). Human resource management (13th ed.). Mason, OH:
Cengage Learning.

141 of 159 | P a g e
Mathis, R. L., & Jackson, J. (2011). Human resource management: Essential perspectives
(6th ed.). Mason, OH: Cengage Learning.
Matsumura, R., Kijima, K., Nakano, B., & Takahashi, S. (2003). An analysis of an incentive
problem considering non-monetary utility. Kybernetes, 32(4), 511-522.
McGuire, D., & Jorgensen, K. M. (2010). Human resource development : Theory and
practice. Retrieved from
http://unitec.eblib.com.au/patron/FullRecord.aspx?p=743572
Merriam, S. B. (2009). Qualitative research: A guide to design and implementation. San
Francisco, CA: John Wiley & Sons.
Miller, V. D., & Gordon, M. E. (2014). Meeting the challenges of human resource
management: a communications perspective. New York, NY: Taylor & Francis.
Mills, A. J., Helms Mills, J. C., Forshaw, C., & Bratton, J. (2007). Organizational behaviour
in a global context. Orchard Park, N.Y: Broadview Press
Mishra, M. N. (2009). Organisational behaviour. New Delhi, India: Vikas Publishing House.
Mitchell, M., & Jolley, J. (2012). Research design explained (8th ed.). Belmont, CA:
Cengage Learning.
Mooi, E., & Sarstedt, M. (2011). A concise guide to market research: The process, data, and
methods using IBM SPSS Statistics. New York, NY: Springer.
Muijs, D. (2010). Doing quantitative research in education with SPSS (2nd ed.). London,
UK: SAGE Publications.
Mukherjee, J. (2012). Designing human resource management systems: A leader's guide.
California, CA: SAGE Publications.
Mukherji, P., & Albon, D. (2009). Research methods in early childhood: An introductory
guide. London, United Kingdom: SAGE Publications.
Muncherji, E. N., & Dhar, U. (2009). Creating health through strategic HR and
entrepreneurship. New Delhi, India: Excel Books Press.
Myers, M. D. (2009). Qualitative research in business & management. London, England:
SAGE.
Nahavandi, A., Denhardt, R. B., Denhardt, J. V., & Aristigueta, M. P. (2014). Organizational
behavior. London, UK: SAGE Publications.
Nargundkar, R. (2008). Marketing research :text and cases (3rd ed.). New Delhi, India:
McGraw-Hill Education (India) Pvt Limited.
Neely, A. (2007). Business performance measurement: Unifying theory and integrating
practice (2nd ed.). London, UK: Cambridge University Press.
Neergaard, H., & Ulhøi, J. P. (2007). Handbook of qualitative research methods in
entrepreneurship. Massachusetts, MA: Edward Elgar.
Nel, P. S., Du Plessis, A., Fazey, M., Erwee, R., Pillay, S., Hearn Mackinnon, B., & Millet,
B. (2012). Human resource management in Australia and New Zealand. South
Melbourne, Australia: Oxford University Press.
Nel, P. S., Werner, A., Botha, C. J., Du Plessis, A. J., Mey, M., Ngalo, O., Poiat, P., Van
Hoek, L. (2015). Human Resources Management (9th ed.). Cape Town, South Africa:
Oxford University Press.
Nel, P. S., Werner, A., Poisat, P., Du Plessis, A., & Sono, T. (2011). Human resources
management (8th ed.). Cape Town, South Africa: Oxford University Press.
Nelson, D., & Quick, J. (2012). Organizational behavior: science, the real world, and you
(8th ed.). Ohio, OH: Cengage Learning.
Neuman, W. L. (2011). Social research methods: Qualitative and quantitative approaches
(7th ed.). Boston: Allyn & Bacon, Inc.
Neuman, W. L. (2012). Basics of social research: Qualitative and quantitative approaches
(3rd ed.). New Jersey, NJ: Pearson Education, Inc.

142 of 159 | P a g e
Nickson, D. (2013). Human resource management for hospitality and tourism industries (2nd
ed.). New York, NY: Taylor & Francis.
Niedrich, R. W., Weathers, D., Carter, H., & David, B. (2009). Specifying price judgments
with range frequency theory in models of brand choice. Journal of marketing
research, 46(5), 695-702. doi: 10.1509/jmkr.46.5.693
Noe, R. A., Hollenbeck, J. R., Gerhart, B., & Wright, M. P. (2014). Fundamentals of human
resource management (5th ed.). New York, NY: The McGraw-Hill Companies, Inc.
Norusis, M. (2011). SPSS statistics nineteen statistical procedures companion. New Jersey,
NJ: Prentice Hall Inc.
O'Hara, M., Wainwright, J., Carter, C., Kay, J., & Dewis, P. (2011). Successful dissertations:
The complete guide for education, childhood and early childhood studies students.
New York, NY: Bloomsbury Academic.
Øgaard, T., Marnburg, E., & Larsen, S. (2008). Perceptions of organizational structure in the
hospitality industry: Consequences for commitment, job satisfaction and perceived
performance. Tourism Management, 29(4), 661-671.
Oliver, P. (2010). The student's guide to research ethics (2nd ed.). New York, NY: McGraw-
Hill International.
Özbilgin, M., Groutsis, D., & Harvey, W. (2014). International human resource
management. New York, NY: Cambridge University Press.
Paauwe, J. (2004). HRM and performance: Achieving long-term viability. New York, NY:
Oxford University Press.
Paswan, A. K., Pelton, L. E., & True, S. L. (2005). Perceived managerial sincerity, feedback-
seeking orientation and motivation among front-line employees of a service
organization. Journal of Services Marketing, 19(1), 3-12.
Pattanayak, B. (2005). Human resource management. New Delhi, India: PHI Learning.
Pegg, T. (2009). Creating engagement through employee benefits. Strategic HR Review, 8(2),
5-12.
Perkins, S., & Arvinen-Muondo, R. (2013). Organizational behaviour. London, UK: Kogan
Page.
Phillips, J. (2005). Investing in your company's human capital. New York, NY: AMACOM.
Phillips, J., & Gully, S. (2014). Human resource management. Ohio, OH: Cengage Learning.
Pinder, C. C. (2014). Work motivation in organizational behavior (2nd ed.). New York, NY:
Taylor & Francis.
Podmoroff, D. (2005). 365 ways to motivate and reward your employees every day--with
little or no Money. Florida, FL: Atlantic Publishing Group.
Polonsky, M. J., & Waller, D. S. (2010). Designing and managing a research project: A
business student's guide. Thousand Oaks, CA: SAGE.
Polonsky, M. J., & Waller, D. S. (2013). Designing and managing a research project : A
business student's guide (2nd ed.). Thousand Oaks, CA: Sage Publications
Prasad, K. (2013). Strategic human resource development : Concepts and practices. New
Delhi, India: PHI Learning.
Pravin, D. (2010). Human resource management. New Delhi, India: Pearson Education India.
Pullins, E. B., Haugtvedt, C. P., Dickson, P. R., Fine, L. M., & Lewicki, R. J. (2000).
Individual differences in intrinsic motivation and the use of cooperative negotiation
tactics. Journal of Business & Industrial Marketing, 15(7), 466-478.
Quigley, N. R., & Tymon Jr, W. G. (2006). Toward an integrated model of intrinsic
motivation and career self-management. Career development international, 11(6),
522-543.
Rai, A. K. (2013). Customer relationship management: concepts and cases (2nd ed.). New
Delhi, India: PHI Learning.

143 of 159 | P a g e
Randhawa, G. (2007). Human resource management. New Delhi, India: Atlantic Publishers
& Distributors.
Rao, S. V. (2004). Comprehensive human resource management. New Delhi, India: Excel
Books India.
Rao, S. V. (2008). Human resources management: text and cases (2nd ed.). New Delhi,
India: Excel Books Press.
Rea, L. M., & Parker, R. A. (2005). Designing and conducting survey research: A
comprehensive guide (3rd ed.). New York, NY: Wiley.
Reddy, T. A. (2011). Applied data analysis and modeling for energy engineers and scientists.
New York, NY: Springer.
Rees, G., & Smith, P. (2014). Strategic uman resource management: An international
perspective. London, UK: SAGE Publications.
Reid, R. D., & Bojanic, D. C. (2009). Hospitality marketing management (5th ed.). New
Jersey, NJ: John Wiley & Sons.
Robbins, S. P., Odendaal, A., & Roodt, G. (2007). Organisational behaviour: global and
Southern African perspectives. Cape Town, South Africa: Maskew Miller Longman.
Rubin, A. (2012). Statistics for evidence-based practice and evaluation. Belmont, CA:
Cengage Learning.
Saiyadain, M. S. (2003). Organizational behaviour. New Delhi, India: Tata McGraw-Hill
Education.
Saunders, M., Lewis, P., & Thornhill, A. (2009). Research methods for business students (5th
ed.). New York, NY: Financial Times Prentice Hall.
Schyns, B., van Veldhoven, M., & Wood, S. (2009). Organizational climate, relative
psychological climate and job satisfaction: The example of supportive leadership
climate. Leadership & Organization Development Journal, 30(7), 649-663.
Sekaran, U., & Bougie, R. (2010). Research methods for business : a skill building approach
(5th ed.). Hoboken, NJ: Wiley.
Shankar, R. (2009). Process improvement using six sigma: a DMAIC guide. Milwaukee, WI:
ASQ Quality Press.
Sharma, J. K. (2007). Business statistics (2nd ed.). New Delhi, India: Dorling Kindersley
(India) Pvt. Limited.
Sheppard, M. (2004). Appraising and using social research in the human services : An
introduction for social work and health professionals. Retrieved from
http://unitec.eblib.com.au/patron/FullRecord.aspx?p=290618
Shi, L. (2008). Health services research methods (2nd ed.). New York, NY: Cengage
Learning.
Shivarudrappa, D., Ramachandra, K., & Gopalakrishna, K. S. (2010). Human resource
management (2 ed.). New Delhi, India: Himalaya Publishing House.
Singh, H. (2010). Organisational behavior. New Delhi, India: FK Publications.
Smith, E. (2008). Using secondary data in educational and social research. New York, NY:
McGraw Hill.
Snell, S., & Bohlander, G. (2012). Managing human resources (16th ed.). New York, NY:
Cengage Learning.
Snell, S., & Bohlander, G. (2013). Managing human resources (17th ed.). New York, NY:
Cengage Learning.
Speegle, M. (2009). Quality concepts for the process idustry (2nd ed.). New York, NY:
Cengage Learning.
Sreejesh, S., Mohapatra, S., & Anusree, M. R. (2013). Business research methods : An
applied orientation. Retrieved from
http://unitec.eblib.com.au/patron/FullRecord.aspx?p=1398578

144 of 159 | P a g e
St-Onge, S., Morin, D., Bellehumeur, M., & Dupuis, F. (2009). Managers' motivation to
evaluate subordinate performance. Qualitative Research in Organizations and
Management: An International Journal, 4(3), 273-293.
Stone, R. J. (2013). Managing human resources ( 4th ed.). Milton, Qld: John Wiley and Sons.
Storey, J. (2007). Human resource management: a critical text. London, UK: Thomson
Learning.
Stredwick, J. (2005). An introduction to human resource management. Oxford, UK: Elsevier
Ltd.
Sustainable Tourism Development Project In Lao PDR. (2009). Development of the project's
human resource development action plan (2009-2014):Contract packages to support
implementation of the plan (2004-2009) and contract packages to support
implementation of the plan. Vientiane, Laos. Retrieved from
http://www.stdplaos.com/downloads/technical_reports/part4/GMS-
STDP%20in%20Lao%20PDR_%20Project%27s%20HRD%20Action%20Plan.pdf.
Sutherland, J., & Canwell, D. (2008). Essential business studies a Level: As student book for
AQA. London, England: Folens Limited.
Taylor, G. R. (2005). Integrating quantitative and qualitative methods in research (2nd ed.).
Oxford, UK: University Press of America.
Teddlie, C., & Tashakkori, A. (2009). Foundations of mixed methods research: Integrating
quantitative and qualitative approaches in the social and behavioral sciences.
London, UK: SAGE Publications.
Tesone, D. V. (2008). Handbook of hospitality human resources management. New York,
NY: Taylor & Francis.
Tesone, D. V., & Pizam, A. (2008). Handbook of hospitality human resources management.
New York, NY: Taylor & Francis.
Unitec. (2014a). Session 2: Research paradigms, methodology and literature review.
[PowerPoint Presentation]. Retrieved from
http://moodle.unitec.ac.nz/course/view.php?id=1679.
Unitec. (2014b). Session 4: Research designs and qualitative/quantitative research.
[PowerPoint Presentation]. Retrieved from
http://moodle.unitec.ac.nz/pluginfile.php/337600/mod_resource/content/1/MBus%20
Session%204%20S1%202014%20-
%20Research%20Designs%2C%20Qualitative%20and%20Quantitative%20Research
.ppt.
Unitec. (2014c). Session 7: Univariate and bivariate and statistical analysis. [PowerPoint
Presentation]. Retrieved from http://moodle.unitec.ac.nz/course/view.php?id=1679.
Unitec. (2014d). Session 9: Basic data analysis (univariate and bivariate). [PowerPoint
Presentation]. Retrieved from http://moodle.unitec.ac.nz/course/view.php?id=1679.
UREC. (2009). Ethics policy and procedures. Auckland: Unitec.
VanderStoep, S. W., & Johnson, D. D. (2009). Research methods for everyday life: Blending
qualitative and quantitative approaches. New York, NY: Wiley.
Vecchio, R. P. (2006). Organizational behavior : core concepts (6th ed.). Mason, OH:
Thomson/South-Western.
Venkatesh, V., Brown, S. A., & Bala, H. (2013). Bridging the qualitative-quantitative divide:
Guidelines for conducting mixed methods research in information systems. MIS
Quarterly, 37(1), 21-54.
Wahyuni, D. (2012). The research design maze: Understanding paradigms, cases, methods
and methodologies. Journal of Applied Management Accounting Research, 10(1), 69-
80.

145 of 159 | P a g e
Waldman, M. F. (2014). People empowerment secrets: how to motivate your employees and
people around you to work towards a greater goal. New York, NY: CreateSpace
Independent Publishing.
Walsham, G. (2006). Doing interpretive research. European journal of information systems,
15(3), 320-330.
Watson, S. (2008). Where are we now? A review of management development issues in the
hospitality and tourism sector: implications for talent management. International
Journal of Contemporary Hospitality Management, 20(7), 758-780.
Wells, K. (2011). Narrative inquiry. New York: Oxford University Press.
Wicker, D. (2011). Job satisfaction: Fact or fiction. Bloomington, IN: AuthorHouse.
Wilkinson, A., Bacon, N., Redman, T., & Snell, S. (2009). Human resource management.
London, UK: SAGE Publications.
Williams, C. (2007). Research method. Journal of Business & Economic Research, 5(3), 65-
71. Retrieved from
http://journals.cluteonline.com/index.php/JBER/article/view/2532/2578
Wilson, J. (2010). Essentials of business research: A guide to doing your research project.
London, UK: SAGE Publications.
Wilton, N. (2010). An introduction to human resource management. London, UK: SAGE
Publications.
Wilton, N. (2011). An introduction to human resource management. UK: SAGE Publications.
Yamauchi, S., & Lee, D. (1999). Tourism development in the Lao People’s Democratic
Republic. Retrieved from http://www.un.org/esa/desa/papers/1999/esa99dp9.pdf
Zikmund, W., & Babin, B. (2012). Essentials of marketing research (5th ed.). Mason, OH:
Cengage Learning.
Zikmund, W., Babin, B., Carr, J., & Griffin, M. (2012). Business research methods (9th ed.).
Mason, OH: Cengage Learning.
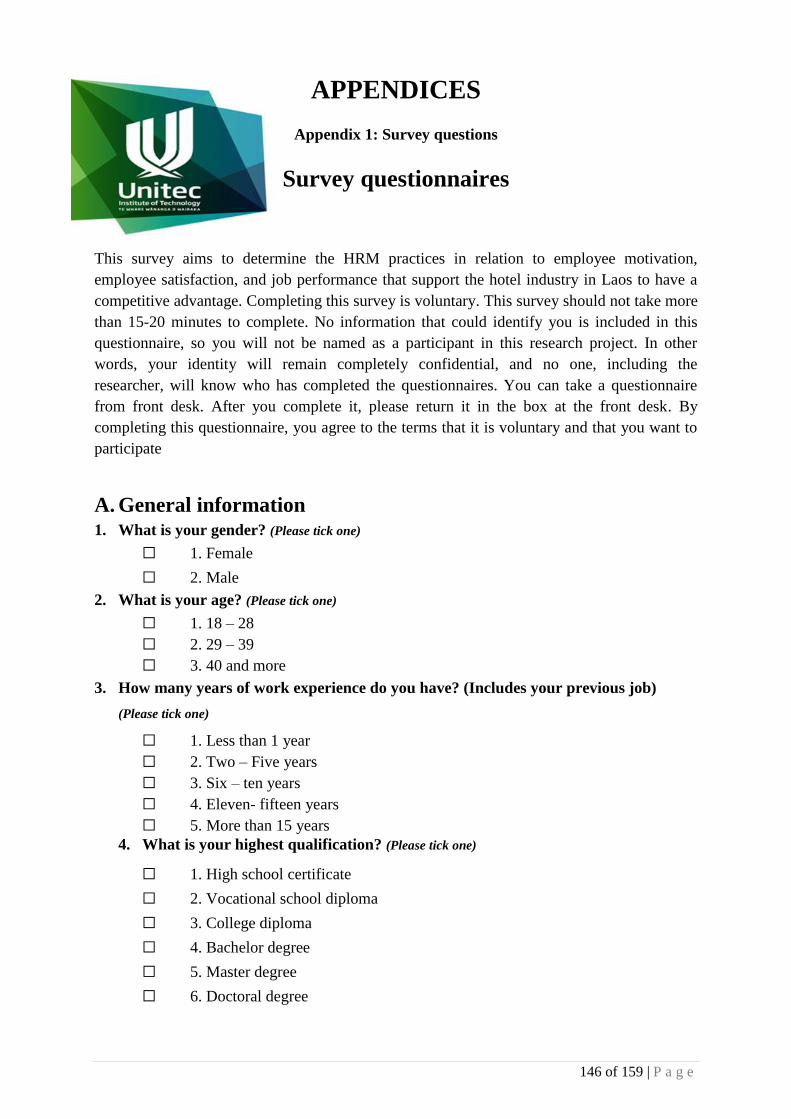
146 of 159 | P a g e
APPENDICES
Appendix 1: Survey questions
Survey questionnaires
This survey aims to determine the HRM practices in relation to employee motivation,
employee satisfaction, and job performance that support the hotel industry in Laos to have a
competitive advantage. Completing this survey is voluntary. This survey should not take more
than 15-20 minutes to complete. No information that could identify you is included in this
questionnaire, so you will not be named as a participant in this research project. In other
words, your identity will remain completely confidential, and no one, including the
researcher, will know who has completed the questionnaires. You can take a questionnaire
from front desk. After you complete it, please return it in the box at the front desk. By
completing this questionnaire, you agree to the terms that it is voluntary and that you want to
participate
A. General information 1. What is your gender? (Please tick one)
☐ 1. Female
☐ 2. Male
2. What is your age? (Please tick one)
☐ 1. 18 – 28
☐ 2. 29 – 39
☐ 3. 40 and more
3. How many years of work experience do you have? (Includes your previous job)
(Please tick one)
☐ 1. Less than 1 year
☐ 2. Two – Five years
☐ 3. Six – ten years
☐ 4. Eleven- fifteen years
☐ 5. More than 15 years
4. What is your highest qualification? (Please tick one)
☐ 1. High school certificate
☐ 2. Vocational school diploma
☐ 3. College diploma
☐ 4. Bachelor degree
☐ 5. Master degree
☐ 6. Doctoral degree

147 of 159 | P a g e
5. How many years have you been working in this organization? (Please tick one)
☐ 1. 0-5 years
☐ 2. 6-10 years
☐ 3. More than 10 years
B. Employee satisfaction 6. Overall, are you satisfied with your job? (Please tick one)
☐ 1. Yes
☐ 2. No
7. I am interested in your opinions about your satisfaction in your current
organization. Please state your level of agreement with the following statement.
1= Disagree strongly, 5= Agree strongly.
Disagree
strongly
Disagree Neither
agree nor disagree
Agree Agree
strongly
(1) (2) (3) (4) (5)
1) I am satisfied with the
organizational working culture
2) I feel my work is meaningful to
me
3) I have a good relationship with
my immediate supervisor
4) My organization pays me well
for the work
5) I am satisfied with my
employment benefits
6) I am happy with my job overall
8. How satisfied are you with the working culture in your organization?
1 Very 2 Dissatisfied 3 Neither satisfied 4 Satisfied 5 Very
dissatisfied nor dissatisfied satisfied
☐ ☐ ☐ ☐ ☐

148 of 159 | P a g e
9. What kind of working culture of the organization do you prefer? (Please select all
applicable)
☐ 1. Teamwork working environment
☐ 2. No discrimination working environment
☐ 3. Friendly working environment
☐ 4. Supportive working environment
☐ 5. Others (Please specify)……………………………………………
10. How likely is it that you would look for another job outside the organization?
(Please tick one)
☐ 1. Extremely likely
☐ 2. Very likely
☐ 3. Moderately likely
☐ 4. Slightly likely
☐ 5. Not at all likely
11. What kinds of positive experiences do you have in your organization?
Please state your level of agreement with the following statement. 1= Disagree strongly,
5= Agree strongly.
Disagree
strongly
Disagree Neither
agree nor disagree
Agree Agree
strongly
(1) (2) (3) (4) (5)
1) I experience personal growth, such as
updating skills, and learning different jobs
2) Management looks to me for
suggestions and leadership
3) I have great opportunities to get
promoted where I work
4) The medical benefits provided in the
organization are satisfactory
5) Supervisors encourage me to be my best
6) I am rewarded for the quality of my
efforts
7) I receive an additional bonus if I do
additional work
8) The organization clearly communicates
its goals and strategies to me

149 of 159 | P a g e
12. Do you feel that you receive appropriate rewards on the job performance
recognition? (Please tick one)
☐ 1. Always
☐ 2. Sometimes
☐ 3. Seldom
☐ 4. Never
☐ 5. Not sure
13. How often do you feel stressed at work in a week? (Please tick one)
☐ 1. Always
☐ 2. Sometimes
☐ 3. Seldom
☐ 4. Never
☐ 5. Not sure
14. What are the factors that contribute to your job satisfaction? (Please select all applicable)
☐ 1. Salary
☐ 2. Retirement Benefit
☐ 3. Job security
☐ 4. Interesting Work
☐ 5. Work assignments vary
☐ 6. Convenient Location
☐ 7. Training opportunities
☐ 8. Promotional opportunities
☐ 9. Others (Please specify)…………………………………………
15. How is your current workload? (Please tick one)
☐ 1. Inadequate
☐ 2. Adequate
☐ 3. Excessive
☐ 4. Not sure

150 of 159 | P a g e
C. Employee motivation
16. How important to you is the work motivation in relation to your performance in
your organisation? (Please tick one)
1 Very 2 Unimportant 3 Neutral 4 Important 5 Very
important
unimportant
☐ ☐ ☐ ☐ ☐
17. Does your organization offer financial incentive to employees to motivate them to
work harder? (Please tick one)
☐ 1. Yes
☐ 2. No
18. To what extent do you agree with the following statements?
Please state your level of agreement with the following statement. 1= Disagree strongly,
5= Agree strongly.
Disagree
strongly
Disagree Neither
agree nor disagree
Agree Agree
strongly
(1) (2) (3) (4) (5)
1) The top management is interested in
motivating employees
2) I am motivated by the financial
incentives provided by the organization to work harder
3) I receive rewards for hard work
4) I have a good salary
5) My job security is high
6) I have opportunities for
advancement and development

151 of 159 | P a g e
To what extent do you agree with the following statements? (Continue)
Disagree
strongly
Disagree Neither
agree nor
disagree
Agree Agree
strongly
(1) (2) (3) (4) (5)
7) My organization increases salary
reasonably and periodically
8) The organization has an effective
performance reward system that motivate employees to work harder
9) I feel the organization provides
effective promotional opportunities
system
10) The organization has performance
appraisal activities that are helpful to get motivated
11) The retirement benefits available
are sufficient
12) The organizational policies
motivate you to achieve its aims and objectives
19. Which of the following factors motivate you most? In other words, what do you
think will motivate you to do extra work? (Please select all applicable)
☐ 1. Salary increase
☐ 2. Promotion
☐ 3. Motivational talks
☐ 4. Recognition
☐ 5. Job security
☐ 6. Financial wards
☐ 7. Opportunity to perform work with freedom
☐ 8. Others (please specify)……………………………………

152 of 159 | P a g e
20. Do you think the incentives and other benefits that you ticked above will influence
your performance? (Please tick one)
☐ 1. Yes
☐ 2. No
☐ 3. Not sure
21. Overall, do you get motivated by your organization to work harder? (Please tick one)
☐ 1. Yes
☐ 2. No
☐ 3. Not sure
D. Training
22. How important to you is the training in relation to your performance in your
organization?
1 Very 2 Unimportant 3 Neutral 4 Important 5 Very
important
unimportant
☐ ☐ ☐ ☐ ☐
23. Do you think your organization provides adequate training for employees?
(Please tick one)
☐ 1. Yes
☐ 2. No
☐ 3. Not sure
24. Does the hotel provide you particular training to do your job to a high standard?
(Please tick one)
☐ 1. Yes, please answer question 25, and 26.
☐ 2. No, please answer question 27, 28, and 29.
25. What hotel training have you obtained? (Please select all applicable)
☐ 1. Customer service
☐ 2. Food and beverage Service
☐ 3. Safety concerns
☐ 4. English language
☐ 5. “On the job” training
☐ 6. Others (Please specify)…………………………………………

153 of 159 | P a g e
26. Do you agree that the training you have obtained help you perform work better?
(Please tick one)
☐ 1. Yes
☐ 2. No
☐ 3. Not sure
27. Do you think your organization should provide training? (Please tick one)
☐ 1. Yes
☐ 2. No
☐ 2. Not sure
28. What kind of training should your organization provide in order to improve your
work performance? (Please select all applicable)
☐ 1. Customer service
☐ 2. Food and beverage Service
☐ 3. Safety concerns
☐ 4. English language
☐ 5. “On the job” training
☐ 6. Others (Please specify)…………………………………………
29. Do you agree that the training course you selected in question 28 will help you to
perform your work better? (Please tick one)
☐ 1. Yes
☐ 2. No
☐ 2. Not sure

154 of 159 | P a g e
Appendix 2: Interview questions
Interview questions
A. Employee selection
1. What is the employee selection process in your organization?
........................................................................................................................................
........................................................................................................................................
........................................................................................................................................
........................................................................................................................................
2. Do you think the employee selection process in your organization is effective? Why or
why not?
........................................................................................................................................
........................................................................................................................................
........................................................................................................................................
........................................................................................................................................
3. What do you expect the personal characteristics of candidates to be that are suitable
for working in your organization? Why or why not?
........................................................................................................................................
........................................................................................................................................
........................................................................................................................................
........................................................................................................................................
4. In the employee selection process, do you think skills and experience of candidates are
more important than their qualifications? Why or why not?
........................................................................................................................................
........................................................................................................................................
........................................................................................................................................
........................................................................................................................................
5. Do you address any problems in the employee selection process? If yes, what are
they?
........................................................................................................................................
........................................................................................................................................
........................................................................................................................................
B. Employee training
1. Does your organization provide training to employees? Yes, go to question 2.
No, go to question 3. 2. Could you tell me about particular training provided by your organization?
........................................................................................................................................
........................................................................................................................................
2.1 What kind of training does your organization provide to employees?
..................................................................................................................................
..................................................................................................................................
2.2 How often does your organization provide training to employees?
..................................................................................................................................
..................................................................................................................................

155 of 159 | P a g e
3. Should your organization provide training to employees? Why or why not?
........................................................................................................................................
........................................................................................................................................
3.1 Should your organization provide training to employees quarterly, ½ annually, or
annually? Why?
..................................................................................................................................
..................................................................................................................................
3.2 What kind of training should your organization provide?
..................................................................................................................................
..................................................................................................................................
3.3 Do you know why your organization does not provide training to employees?
..................................................................................................................................
..................................................................................................................................
4. Does your organization provide training to employees before performing new jobs?
Why or why not?
........................................................................................................................................
........................................................................................................................................
5. In your opinion, does employee training have a positive influence on employee
performance? Why or why not?
........................................................................................................................................
........................................................................................................................................

156 of 159 | P a g e
Appendix 3: Information sheet for participants
INFORMATION FOR PARTICIPANTS
My name is Nalinh Douangphichit. I am currently enrolled in the Master of Business degree
in the School of Management and Marketing at Unitec New Zealand and seek your help in
meeting the requirements of research for a Thesis course which forms a substantial part of this
degree.
The major aim of this research project is to identify and determine the factors that motivate
employees to work and improve their performance in order to support the hotels in Laos to
have competitive advantage, attain their goals, and sustain their business.
The findings or results from this project will be made available to hotel managers, without
any participant or hotel names used.
I (the researcher) would like to interview you (HR manager) and ask some questions in
relation to the current HRM practice in your organization. I would like to interview you for
about 30 to 60 minutes to discuss about the aforementioned topic. I will interview you at your
office at a convenient time as pre-arranged between us.
The interview will be voice recorded and then transcribed by the researcher. In order to ensure
the confidentiality, I will send a copy of the transcription both in Lao and English to you to
check for accuracy or adjust as you see fit. You have the right to withdraw within 2 weeks
after receiving a transcript.
Neither you nor your organisation will be identified in the Thesis. The results of the research
activity will not be seen by any other person in your organisation without the prior agreement
of everyone involved. You are free to ask me not to use any of the information you have
given but it must be within 2 weeks after receiving a transcript, and you can, if you wish, ask
to see the Thesis before it is submitted for examination.
The data will be stored in a secured place, and unauthorised persons cannot access those data.
Only the researcher, the supervisor, and you can access the data.
If you find this research study interesting, you can take part or participate. If you have any
queries about the research, you may contact my supervisors at Unitec New Zealand.
Dr. Andries Du Plessis, telephone is +64-9- 815 4321 ext. 8923 or email
[email protected]. Dr. Helen Mitchell, +64-9-815-4321 ext. 5171 or email

157 of 159 | P a g e
Appendix 4: Participant consent form
Participant Consent Form
Research Project Title: The practice of HRM in relation to employee motivation and job
performance by HR managers in the hospitality industry in Lao PDR
I have had the research project explained to me and I have read and understand the
information for participants given to me.
I understand that I don't have to be part of this research project should I chose not to
participate and may withdraw within two weeks after receiving a transcript.
I understand that the findings or results from this project will be made available to hotel
managers, without any participant or hotel names used.
I understand that everything I say is confidential and none of the information I give will
identify me and that the only persons who will know what I have said will be the researchers
and their supervisor. I also understand that all the information that I give will be stored
securely on a computer at Unitec for a period of 5 years.
I understand that my discussion with the researcher will be taped and transcribed.
I understand that I can see the finished research document.
I have had time to consider everything and I give my consent to be a part of this project.
Participant Name: …………………………………………………………………….....
Participant Signature: ………………………….. Date: ……………………………
Project Researcher: ……………………………. Date: ……………………………
UREC REGISTRATION NUMBER: 2014-1049
This study has been approved by the UNITEC Research Ethics Committee from
2 July 2014 to 2 July 2015. If you have any complaints or reservations about the
ethical conduct of this research, you may contact the Committee through the
UREC Secretary (ph: 09 815-4321 ext 8551). Any issues you raise will be treated
in confidence and investigated fully, and you will be informed of the outcome.

158 of 159 | P a g e
Appendix 5: Organisational consent letter
Organisational Consent
I (name) (position in organisation) of (organisational name) give consent for Nalinh
Douangphichit to undertake research in this organisation as discussed with the researcher.
The consent is subject to approval of research ethics application no 2014-1049 by the Unitec
Research Ethics Committee and a copy of the approval letter being forwarded to the
organisation as soon as possible.
Signature:
Date: