Embed Size (px)
Citation preview
The Practice of StatisticsThird Edition
Chapter 11:Inference for Distributions
Copyright © 2008 by W. H. Freeman & Company
Daniel S. Yates
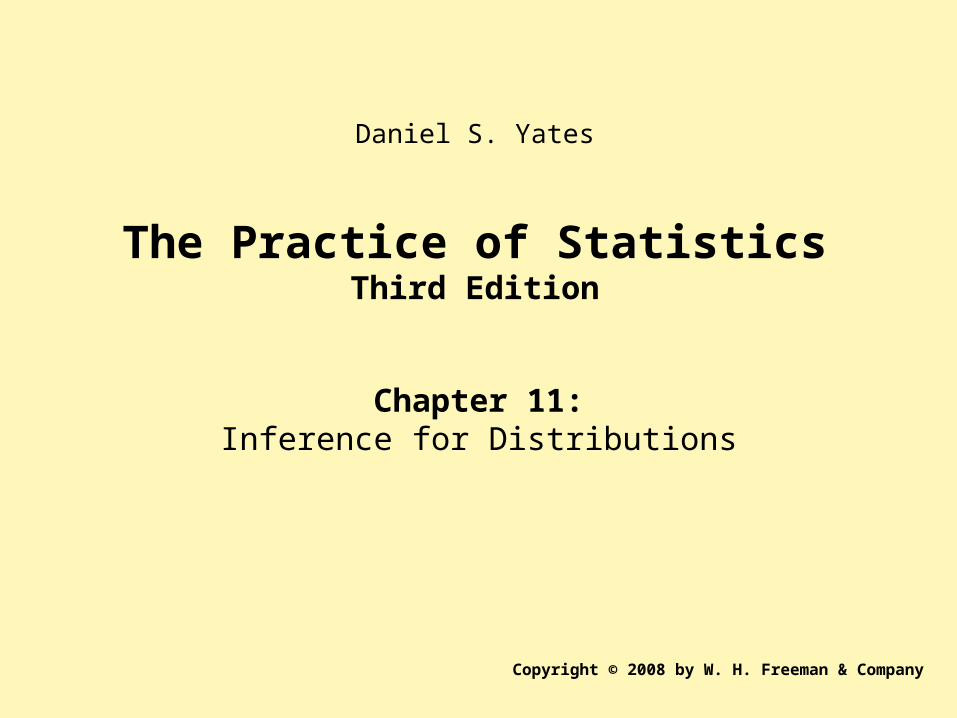
• Same as chapter 10 for inference for a mean of a population , except more realistic.
• Both population parameters and are unknown.
• is estimated by the sample standard deviation s.
• The standard deviation of the sampling mean is estimated by .
• is called the standard error of the sample mean, n
s
n
sx
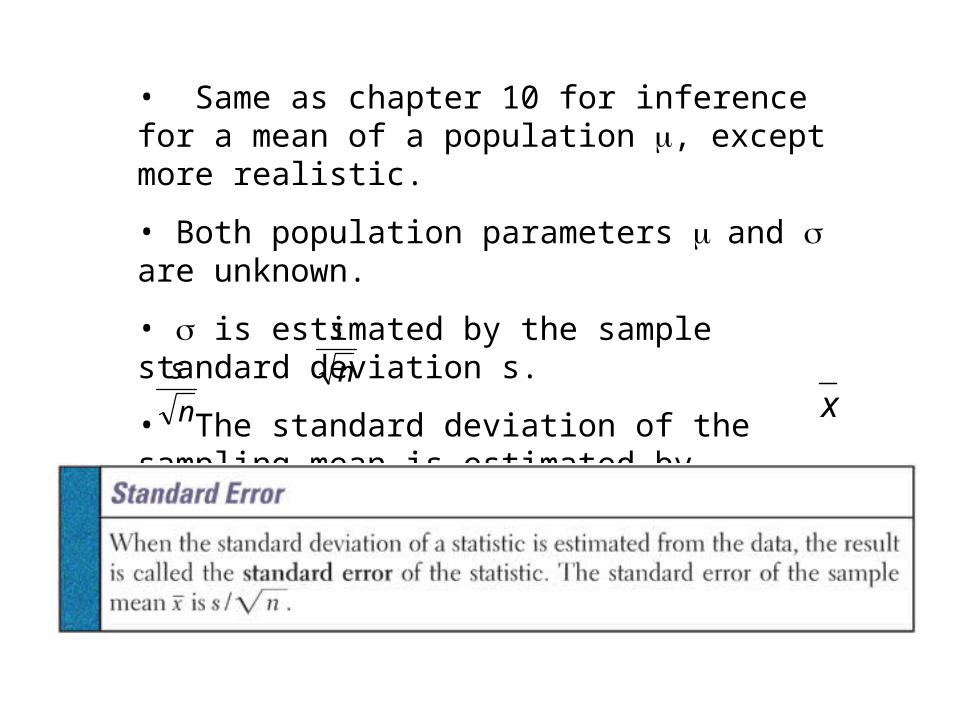
The t distribution
• When is used the statistic that results is called the t statistic. Very similar to z statistic we have been using.
n
s
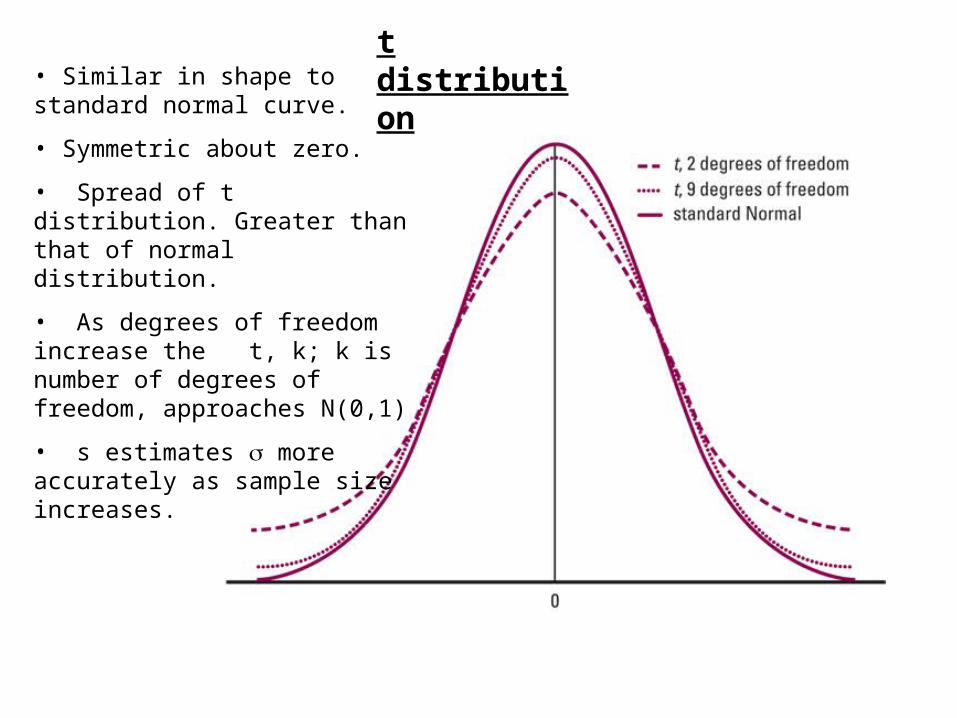
t distribution• Similar in shape to standard normal curve.
• Symmetric about zero.
• Spread of t distribution. Greater than that of normal distribution.
• As degrees of freedom increase the t, k; k is number of degrees of freedom, approaches N(0,1)
• s estimates more accurately as sample size increases.

t distribution
Upper-tail probability
t statistic
Upper – Tail Probability
df .05 .025 .02 .01
1 6.314 12.71 15.89 31.82
10 1.812 2.228 2.359 2.764
20 1.725 2.086 2.197 2.528
30 1.697 2.042 2.147 2.457
: : : : :
100 1.660 1.984 2.081 2.364
1000 1.646 1.962 2.056 2.330
z* ( 1.645 1.96 2.054 2.326
90% 95% 96% 98%
Confidence level C
Table B – AP Stats. Formula sheet
Table C – AP Stat.s Book
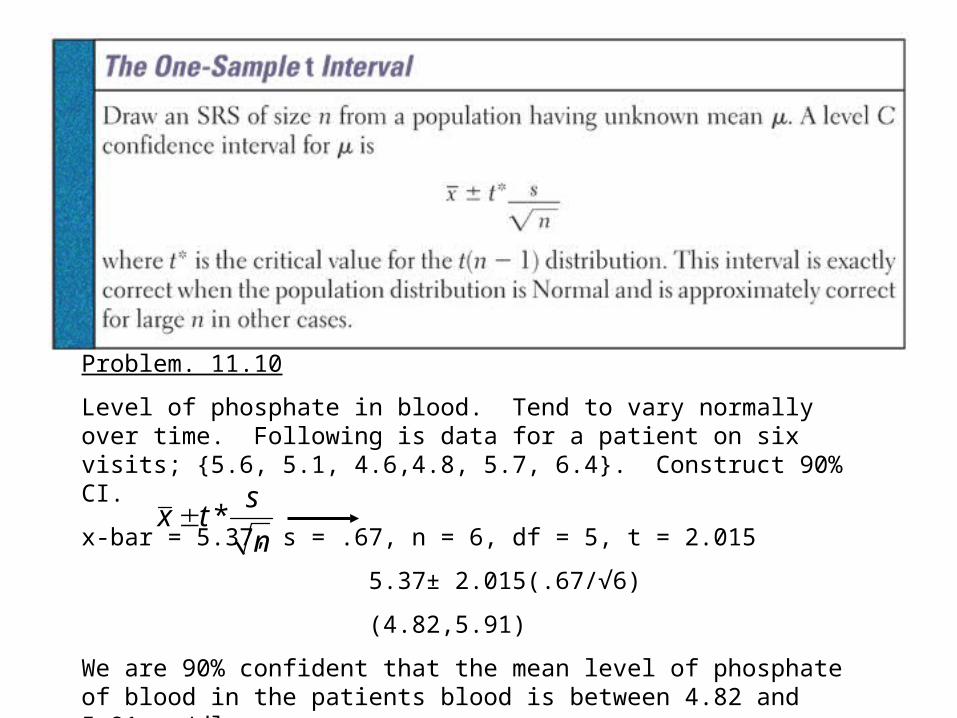
Problem. 11.10
Level of phosphate in blood. Tend to vary normally over time. Following is data for a patient on six visits; {5.6, 5.1, 4.6,4.8, 5.7, 6.4}. Construct 90% CI.
x-bar = 5.37, s = .67, n = 6, df = 5, t = 2.015
5.37± 2.015(.67/√6)
(4.82,5.91)
We are 90% confident that the mean level of phosphate of blood in the patients blood is between 4.82 and 5.91 mg/dl
n
stx *
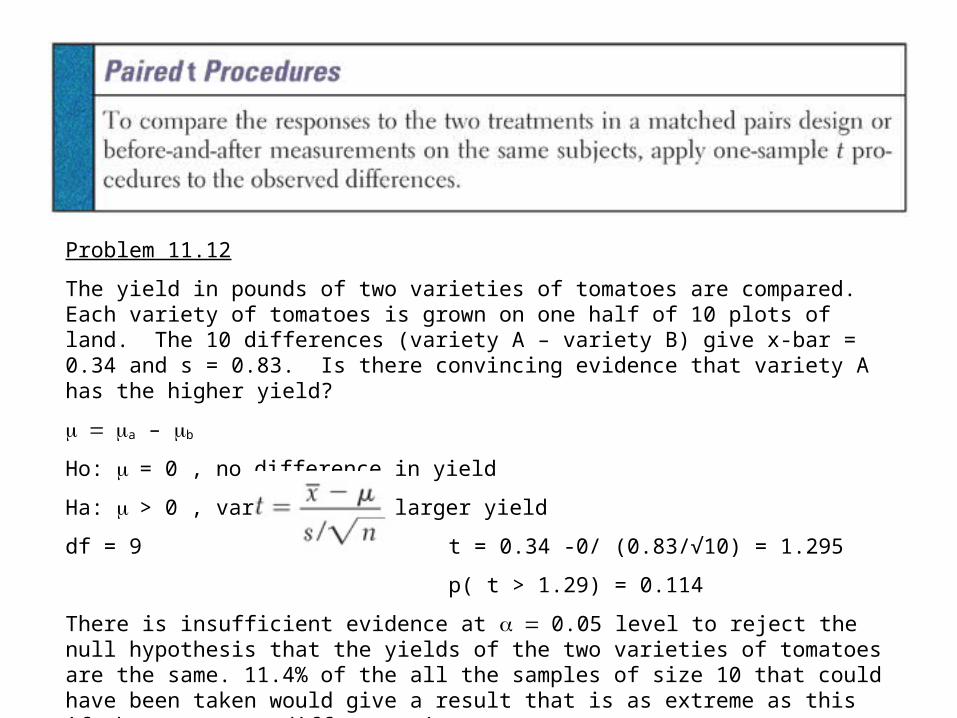
Problem 11.12
The yield in pounds of two varieties of tomatoes are compared. Each variety of tomatoes is grown on one half of 10 plots of land. The 10 differences (variety A – variety B) give x-bar = 0.34 and s = 0.83. Is there convincing evidence that variety A has the higher yield?
a – b
Ho: = 0 , no difference in yield
Ha: > 0 , variety A has larger yield
df = 9 t = 0.34 -0/ (0.83/√10) = 1.295
p( t > 1.29) = 0.114
There is insufficient evidence at 0.05 level to reject the null hypothesis that the yields of the two varieties of tomatoes are the same. 11.4% of the all the samples of size 10 that could have been taken would give a result that is as extreme as this if the true mean difference is zero.


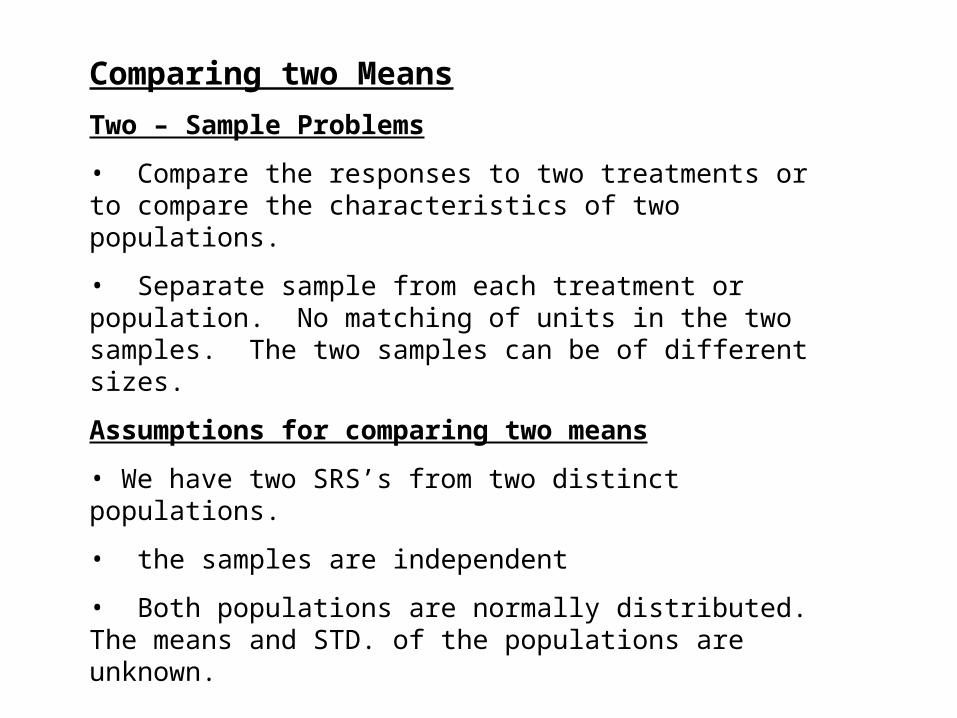
Comparing two Means
Two – Sample Problems
• Compare the responses to two treatments or to compare the characteristics of two populations.
• Separate sample from each treatment or population. No matching of units in the two samples. The two samples can be of different sizes.
Assumptions for comparing two means
• We have two SRS’s from two distinct populations.
• the samples are independent
• Both populations are normally distributed. The means and STD. of the populations are unknown.
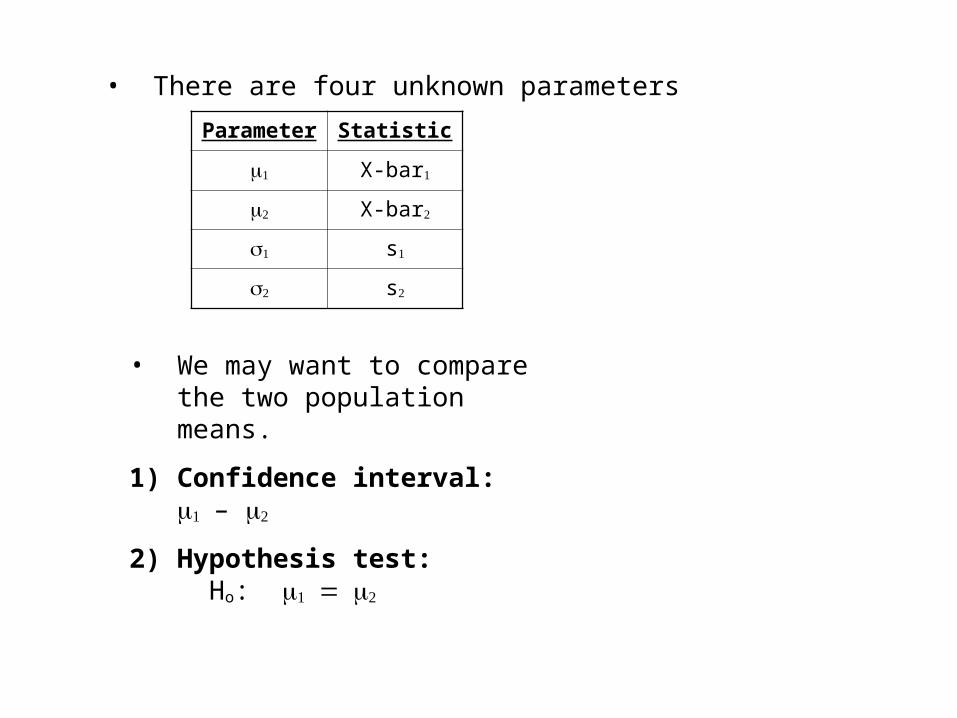
• There are four unknown parameters
Parameter Statistic
X-bar
X-bar
s
s
• We may want to compare the two population means.
1) Confidence interval: –
2) Hypothesis test: Ho:
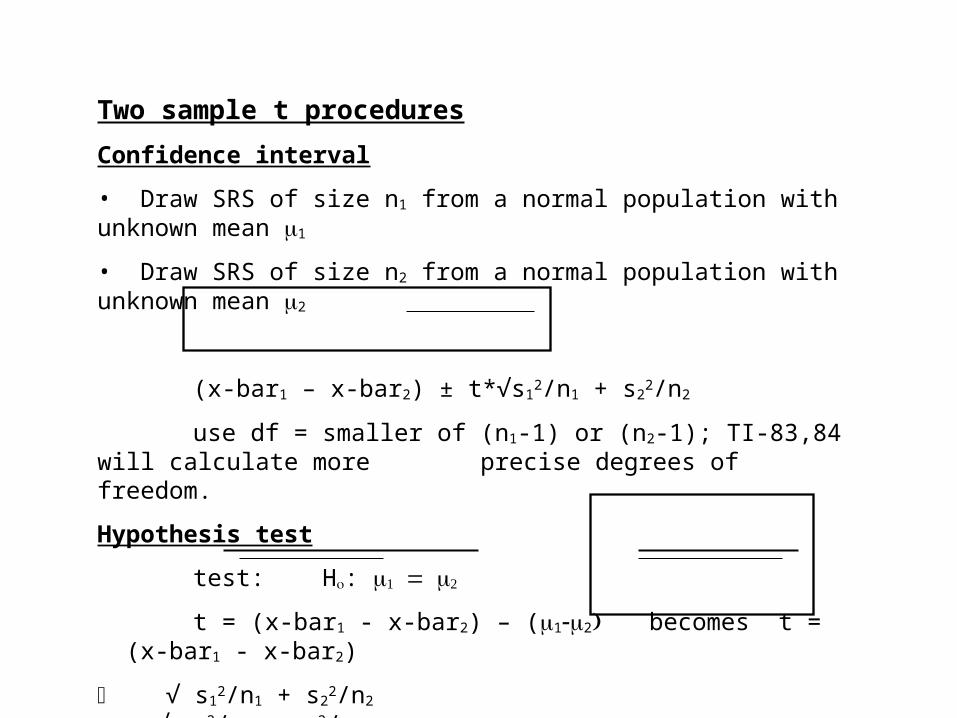
Two sample t procedures
Confidence interval
• Draw SRS of size n1 from a normal population with unknown mean 1
• Draw SRS of size n2 from a normal population with unknown mean 2
(x-bar1 – x-bar2) ± t*√s12/n1 + s2
2/n2
use df = smaller of (n1-1) or (n2-1); TI-83,84 will calculate more precise degrees of freedom.
Hypothesis test
test: H:
t = (x-bar1 - x-bar2) – (12becomes t = (x-bar1 - x-bar2)
√ s12/n1 + s2
2/n2 √ s12/n1 + s2
2/n2
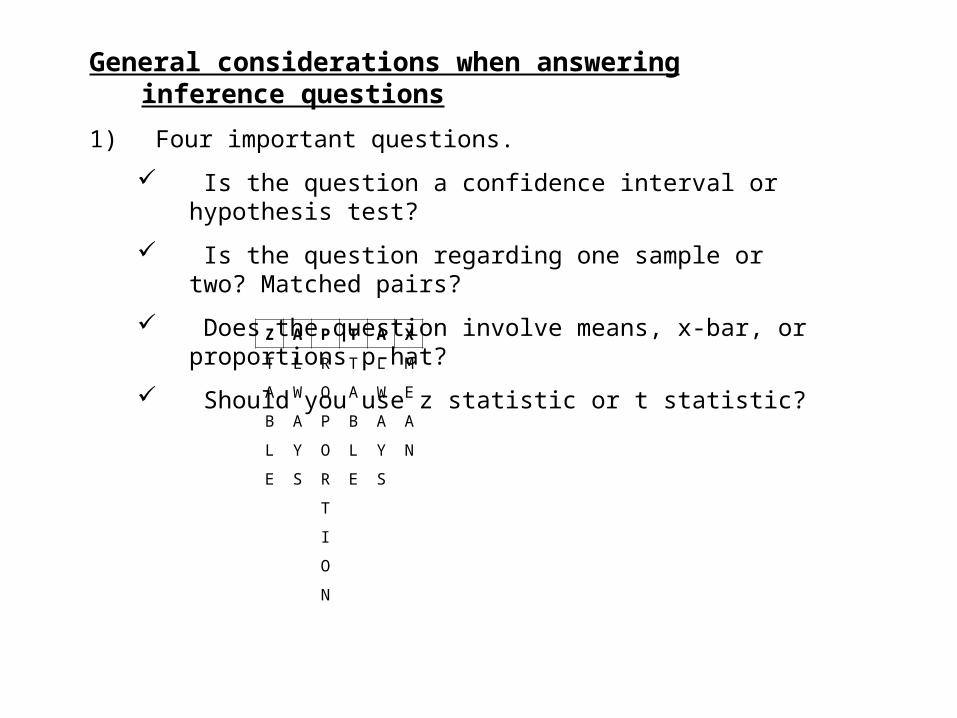
General considerations when answering inference questions
1) Four important questions.
Is the question a confidence interval or hypothesis test?
Is the question regarding one sample or two? Matched pairs?
Does the question involve means, x-bar, or proportions p-hat?
Should you use z statistic or t statistic?
Z A P T A X
T L R T L M
A W O A W E
B A P B A A
L Y O L Y N
E S R E S
T
I
O
N

2) Follow four step procedure for Hypothesis test or Confidence interval..
• H A M C State the hypothesis – null and alternate.
Identify type of test and assumptions.
Do the math; show formula and calculation.
State the conclusion in context.
I Independence of samples
R Random selection; SRS
O Check outliers
N Is data normally distributed
S Sample size; np>10, n(1-p)>10
10n<pop. Size, large sample
Must do these
three for a
confidence
interval