Embed Size (px)
Citation preview

The Pre-Great-Recession Slowdown in
Productivity Growth*
September 8, 2016
John G. Fernald
Federal Reserve Bank of San Francisco
Gilbert Cette and Benoit Mojon
Banque de France
* The views expressed here are our own and do not necessarily reflect the views of the Federal
Reserve Bank of San Francisco, the Banque de France, or anyone else associated with these
institutions

Diverging TFP performance 1995-2007
Source: Bergeaud, Cette, and Lecat 2015

Diverging TFP performance 1995-2007
Source: Bergeaud, Cette, and Lecat 2015

Diverging TFP performance 1995-2007
Source: Bergeaud, Cette, and Lecat 2015

Diverging TFP performance 1995-2007
• TOP DOWN/INDUSTRY
PERSPECTIVE
• U.S. Exceptional IT-fueled
1995-2004
• France/Germany Structural
rigidities
• Italy, Spain Rising
misallocation from capital
inflows
Source: Bergeaud, Cette, and Lecat 2015
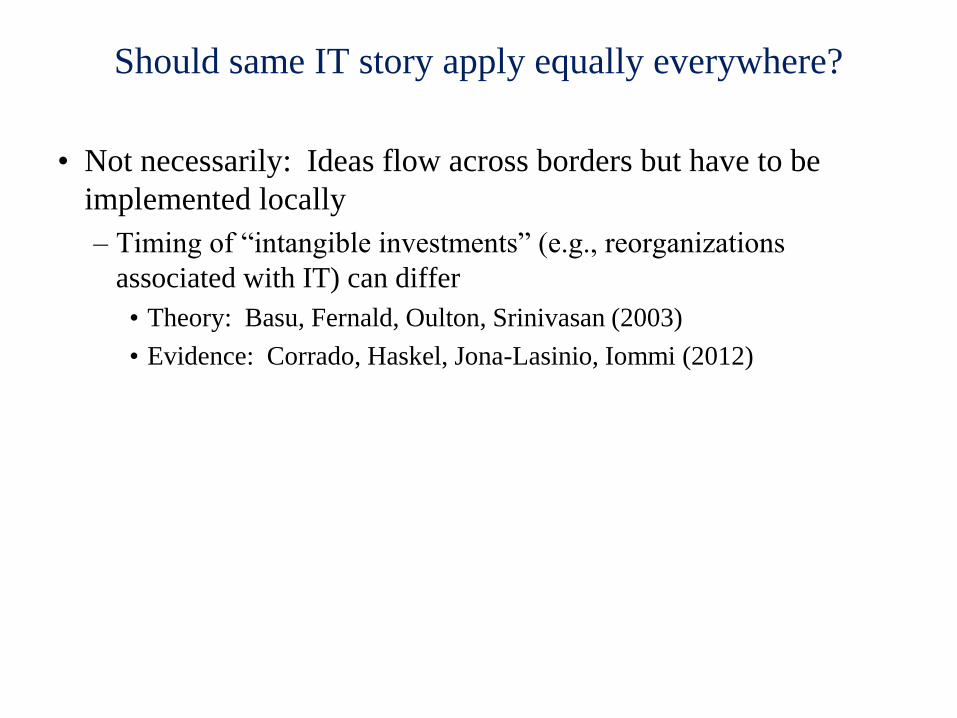
Should same IT story apply equally everywhere?
• Not necessarily: Ideas flow across borders but have to be
implemented locally
– Timing of “intangible investments” (e.g., reorganizations
associated with IT) can differ
• Theory: Basu, Fernald, Oulton, Srinivasan (2003)
• Evidence: Corrado, Haskel, Jona-Lasinio, Iommi (2012)
• Industry data from EU-KLEMS
-1
-0.5
0
0.5
1
1.5
2
2.5
3
1987-95 1995-00 2000-04 2004-07 2007-10
IT producing
Bubble sector
Other
Market services
Contribution by industry subgroup, annual percentage points
TFP growth, France%
-1
-0.5
0
0.5
1
1.5
2
2.5
1987-95 1995-00 2000-04 2004-07 2007-10
IT producing
Bubble sectors
Other
Market services
Contribution by industry subgroup, annual percentage points
TFP growth, Germany%
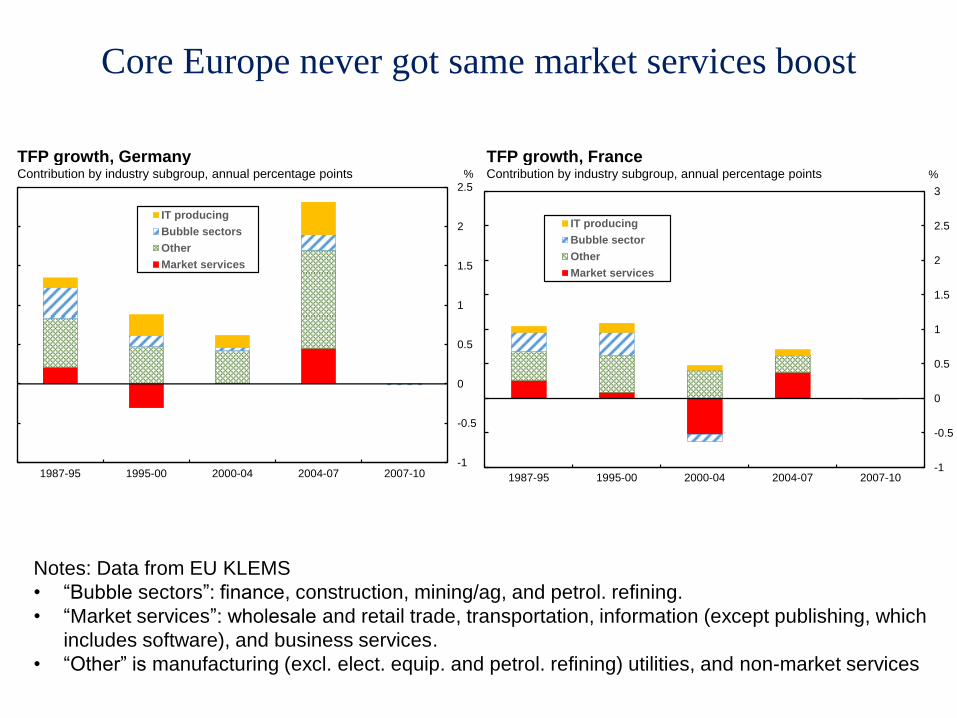
Core Europe never got same market services boost
Notes: Data from EU KLEMS
• “Bubble sectors”: finance, construction, mining/ag, and petrol. refining.
• “Market services”: wholesale and retail trade, transportation, information (except publishing, which
includes software), and business services.
• “Other” is manufacturing (excl. elect. equip. and petrol. refining) utilities, and non-market services

Institutional barriers hold back continental Europe
• “Reallocations” and reorganizations that didn’t happen because
of labor and product market rigidities
• E.g., Van Reenen et al (2010), Bourlès, Cette, Lopez, Mairesse, and
Nicoletti (2013), Cette, Lopez, and Mairesse (2013)…

Diverging TFP performance 1995-2007
Source: Bergeaud, Cette, and Lecat 2015

-2.0
-1.5
-1.0
-0.5
0.0
0.5
1.0
1.5
2.0
1987-95 1995-00 2000-04 2004-07 2007-10
IT producing
Bubble sectors
Other
Market services
Contribution by industry subgroup, annual percentage points
TFP growth, Italy%
-2
-1.5
-1
-0.5
0
0.5
1
1.5
2
1987-95 1995-00 2000-04 2004-07 2007-10
IT producing
Bubble sectors
Other
Market services
Contribution by industry subgroup, annual percentage points
TFP growth, Spain%
“Great unlearning” in Spain and Italy
Notes: Data from EU KLEMS
• “Bubble sectors”: finance, construction, mining/ag, and petrol. refining.
• “Market services”: wholesale and retail trade, transportation, information (except publishing, which
includes software), and business services.
• “Other” is manufacturing (excl. elect. equip. and petrol. refining) utilities, and non-market services

Rising misallocation in peripheral Europe
E.g., Gopinath et al. (2015), Calligaris (2015), Garcia-Santana et. al. (2015)
Why did TFP in Southern Europe collapse?

Convergence of Euro nominal interest rates
0
2
4
6
8
10
12
14
16
18
20
1984 1987 1990 1993 1996 1999 2002 2005 2008 2011 2014
France
Germany
Italy
Spain
UK
10-year government bonds
Nominal interest ratesPercent

Convergence of Euro real interest rates
-4
-2
0
2
4
6
8
10
12
1984 1987 1990 1993 1996 1999 2002 2005 2008 2011 2014
France
Germany
Italy
Spain
UK
10-year gov. bond rate less 4-quarter percent change in GDP deflator
Real interest ratesPercent
16

-4
-2
0
2
4
6
8
10
12
1984 1987 1990 1993 1996 1999 2002 2005 2008 2011 2014
France
Germany
Italy
Spain
UK
10-year gov. bond rate less 4-quarter percent change in GDP deflator
Real interest ratesPercent
Real interest rates fell more in periphery
17

Real interest rates fell more in southern Europe
-4
-2
0
2
4
6
8
10
12
1984 1987 1990 1993 1996 1999 2002 2005 2008 2011 2014
France
Germany
Italy
Spain
UK
10-year gov. bond rate less 4-quarter percent change in GDP deflator
Real interest ratesPercent
18

Non-fin. corporate debt rose rapidly in Spain and Italy
30
40
50
60
70
80
90
100
110
120
1999 2000 2001 2002 2003 2004 2005 2006 2007 2008 2009 2010 2011 2012 2013 2014
United States
United Kingdom
Euro Area
Germany
France
Italy
Spain
Source:
Annual data
Non-Financial Companies' Debt as a Share of GDP%

Rising misallocation in peripheral Europe
E.g., Gopinath et al. (2015), Calligaris (2015), Garcia-Santana et. al. (2015)
Why did TFP in Southern Europe collapse?

Rising misallocation in peripheral Europe
E.g., Gopinath et al. (2015), Calligaris (2015), Garcia-Santana et. al. (2015)
Reis (2013), Gopinath et al. (2015), model capital inflows interacting
with financial frictions
Funds flow to less productive projects
E.g., large borrowers rather than productive ones
Increasing misallocation
Macro implication: Exogenous decline in real interest rates leads to low
productivity growth
Channel: Low-productivity firms get financed. Average productivity of firms falls.
=>VAR with labor productivity (or TFP growth) and real interest rates
Choleski identification with real interest rate last
Why did TFP in Southern Europe collapse?

Real interest rate “shock” raises labor productivity (Euro area)

Historical decomposition:
“Explains” some low periphery lab. prod. growth

Takeaways
• TFP growth in many advanced economies slowed prior to
Global Financial Crisis
– Negative TFP growth in periphery
• Factors: Technology, structural rigidities, and capital flows
– Challenge: Reforms work with long, uncertain lags
• Future is highly uncertain.
– Flexibility needed to advance/keep up with frontier
– Strong safety net needed to deal with individual risks

28
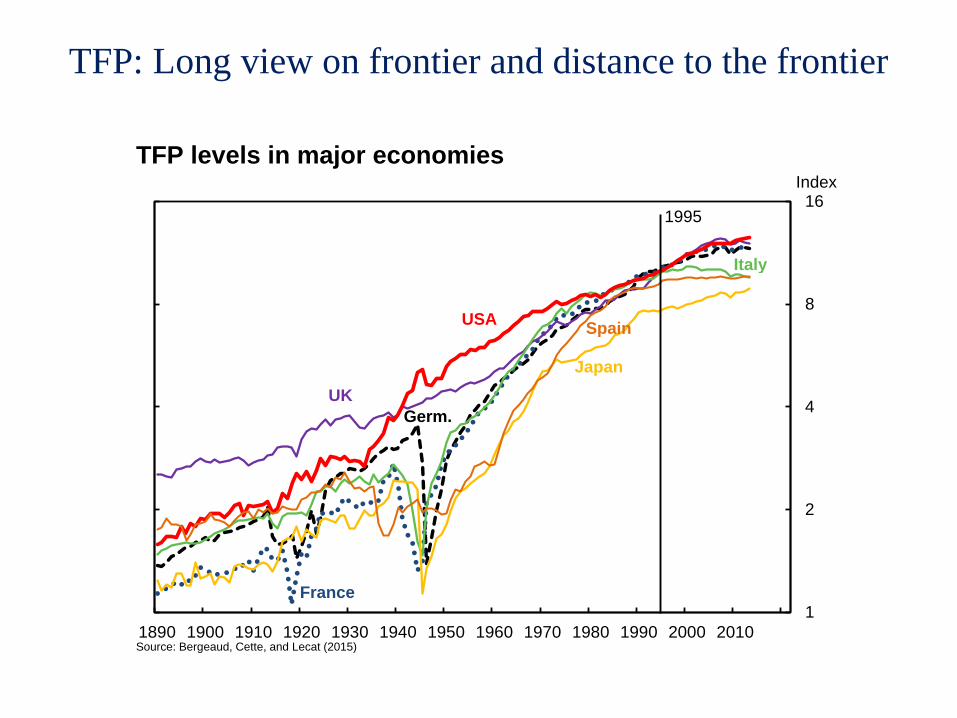
TFP: Long view on frontier and distance to the frontier
1
2
4
8
16
1890 1900 1910 1920 1930 1940 1950 1960 1970 1980 1990 2000 2010Source: Bergeaud, Cette, and Lecat (2015)
TFP levels in major economiesIndex
Germ.
France
UK
Italy
Japan
USASpain
1995

United States: The exceptional 1995-03 period

Rise and fall of TFP growth in IT-intensive market services
-0.5
0
0.5
1
1.5
2
2.5
1987-95 1995-00 2000-04 2004-07 2007-13
Contribution by industry subgroup, annual percentage points
Business-sector TFP growth, United StatesPercentage points
IT producing
Bubble sectors
Other
Market services
Notes: Data from BLS
• “Bubble sectors”: finance, construction, mining/ag, and petrol. refining.
• “Market services”: wholesale and retail trade, transportation, information (except publishing,
which includes software), and business services.
• “Other” is manufacturing (excl. elect. equip. and petrol. refining) utilities, and non-mkt. services

-0.5
0
0.5
1
1.5
2
2.5
1987-95 1995-00 2000-04 2004-07 2007-13
Contribution by industry subgroup, annual percentage points
Business-sector TFP growth, United StatesPercentage points
IT producing
Bubble sectors
Other
Market services
Rise and fall of TFP growth in IT-intensive market services
IT production had
late 1990s bulge
Notes: Data from BLS
• “Bubble sectors”: finance, construction, mining/ag, and petrol. refining.
• “Market services”: wholesale and retail trade, transportation, information (except publishing,
which includes software), and business services.
• “Other” is manufacturing (excl. elect. equip. and petrol. refining) utilities, and non-mkt. services

-0.5
0
0.5
1
1.5
2
2.5
1987-95 1995-00 2000-04 2004-07 2007-13
Contribution by industry subgroup, annual percentage points
Business-sector TFP growth, United StatesPercentage points
IT producing
Bubble sectors
Other
Market services
Rise and fall of TFP growth in IT-intensive market services
Market services had
2000-04 burst
(wholesale/retail trade,
info services, business
services)
Notes: Data from BLS
• “Bubble sectors”: finance, construction, mining/ag, and petrol. refining.
• “Market services”: wholesale and retail trade, transportation, information (except publishing,
which includes software), and business services.
• “Other” is manufacturing (excl. elect. equip. and petrol. refining) utilities, and non-mkt. services

Rise and fall of TFP growth in IT-intensive market services
-0.5
0
0.5
1
1.5
2
2.5
1987-95 1995-00 2000-04 2004-07 2007-13
Contribution by industry subgroup, annual percentage points
Business-sector TFP growth, United StatesPercentage points
IT producing
Bubble sectors
Other
Market services
Notes: Data from BLS
• “Bubble sectors”: finance, construction, mining/ag, and petrol. refining.
• “Market services”: wholesale and retail trade, transportation, information (except publishing,
which includes software), and business services.
• “Other” is manufacturing (excl. elect. equip. and petrol. refining) utilities, and non-mkt. services
Post-2004 slowdown
fairly broadbased

Rise and fall of TFP growth in IT-intensive market services
-0.5
0
0.5
1
1.5
2
2.5
1987-95 1995-00 2000-04 2004-07 2007-13
Contribution by industry subgroup, annual percentage points
Business-sector TFP growth, United StatesPercentage points
IT producing
Bubble sectors
Other
Market services
Notes: Data from BLS
• “Bubble sectors”: finance, construction, mining/ag, and petrol. refining.
• “Market services”: wholesale and retail trade, transportation, information (except publishing,
which includes software), and business services.
• “Other” is manufacturing (excl. elect. equip. and petrol. refining) utilities, and non-mkt. services

Why did continental Europe diverge?
Source: Bergeaud, Cette, and Lecat 2015