Embed Size (px)
Citation preview
ARTICLE IN PRESS
0168-9002/$ - se
doi:10.1016/j.ni
�CorrespondiE-mail addre
Nuclear Instruments and Methods in Physics Research A 545 (2005) 493–502
www.elsevier.com/locate/nima
The preparation of uranium-adsorbed silica particles as areference material for the fission track analysis
Y.J. Park�, M.H. Lee, H.Y. Pyo, H.A. Kim, S.C. Sohn, K.Y. Jee, W.H. Kim
Nuclear Chemistry Research Division, Korea Atomic Energy Research Institute, P.O. Box 150 Deokjin-dong, Yusung, Daejeon 305-353,
Republic of Korea
Received 29 October 2004; accepted 16 January 2005
Available online 8 March 2005
Abstract
Uranium-adsorbed silica particles were prepared as a reference material for the fission track analysis (FTA) of swipe
samples. A modified instrumental setup for particle generation, based on a commercial vibrating orifice aerosol
generator to produce various sizes of droplets from a SiO2 solution, is described. The droplets were transferred into a
weak acidic solution bath to produce spherical solid silica particles. The classification of the silica particles in the range
from 5 to 20mm was carried out by the gravitational sedimentation method. The size distribution and morphology of
the classified silica particles were investigated by scanning electron microscopy. The physicochemical properties of the
classified silica particles such as the surface area, pore size and pore volume were measured. After an adsorption of 5%235U on the silica particles in a solution adjusted to pH 4.5, the uranium-adsorbed silica particles were calcined up to
950 1C in a furnace to fix the uranium strongly onto the silica particles. The various sizes of uranium-adsorbed silica
particles were applied to the FTA for use as a reference material.
r 2005 Elsevier B.V. All rights reserved.
1. Introduction
Radioactive particles which originate fromnuclear facilities can be transported and adsorbedonto dust or aerosol particles which are presentaround the facilities. The radioactive particles aregenerally detected by mass spectroscopic techni-ques such as a thermal ionization mass spectro-metry (TIMS) [1–3] and a secondary ion mass
e front matter r 2005 Elsevier B.V. All rights reserve
ma.2005.01.312
ng author.
ss: [email protected] (Y.J. Park).
spectrometry (SIMS) [4–6] or track techniquessuch as a fission track analysis (FTA) [7–10] andan alpha track analysis (ATA) [11,12]. While themass spectroscopic method provides reliable andhighly precise information of the isotopic compo-sitions of the uranium- and plutonium-containingparticles, it takes significant amounts of time forscanning the whole area of the sample. Thus, ascreening technology is necessary prior to the massspectroscopic method especially for a large num-ber of samples. The fission track method can beused for screening the fissile particles in thousands
d.
ARTICLE IN PRESS
Y.J. Park et al. / Nuclear Instruments and Methods in Physics Research A 545 (2005) 493–502494
of swipe samples before performing the TIMS orSIMS, though it is not quantitative like the massspectroscopic techniques.Since 1993, the FTA and ATA have been applied
to the determination of uranium distribution in theore samples as well as the isotopic ratio of enricheduranium particles in the swipe sample in the KoreaAtomic Energy Research Institute (KAERI) [13].The properties of a fission track image recorded onthe track detector, such as size, dense area, anddepth vary with the particle size as well as the 235Uenrichment of the particles. In order to extract the235U enrichment of the particles from the trackimage, it is necessary to determine the correlation ofvarious track properties with the particle size andthe 235U enrichment using a reference particle.Therefore, it is very important to produce referenceparticles with a known size and 235U enrichment forthe FTA of unknown swipe samples. Since the hotparticles originated from a nuclear fuel cycle can beeasily adsorbed onto dust aerosol particles aroundthe facility, a spherical silica particle can be used forthe replacement of dust aerosols as a referencematerial for FTA.There are several methods available for produ-
cing particles with a micro size such as themicrowave heating technique [14], the fusion andpulverization technique [15], the chemical reactiontechnique [16], laser ablation [17], and the aerosolmethod [18] with a concentric nebulizer. Amongthese methods, it has been reported that micro-wave heating, fusion and pulverization and laserablation did not produce spherical shape particles[13]. Also, the aluminite particles and Na–Zn–ur-anyl acetate particles prepared by the chemicalreaction technique showed a limitation in their sizedistribution [13]. Erdmann et al. made uraniumoxide particles with a 1 mm diameter using acommercial vibrating orifice aerosol generator forusing them as a reference particle [19]. Thoughthese particles can be used for quality control ofthe SIMS, the commercial vibrating orifice aerosolgenerator showed a possibility of contaminationfrom the uranium oxide particles around theequipment. Also, these uranium particles are notsuitable for screening unknown samples, especiallywith various particle sizes in the FTA, because thesize was fixed with a 1 mm diameter.
In this study, various sizes of silica particles inthe range from 5 to 20 mm were produced in aspherical shape using a modified vibrating orificeaerosol generator. Various sizes of the silicaparticles produced were adsorbed with uraniumof various 235U enrichments to be utilized asreference materials for the FTA.
2. Experimental
2.1. Reagents
A sodium silicate solution (SHOWA, analyticalgrade, composition in wt%: SiO2 27, Na2O 10.9)was used. A certified reference uranium solution(NIST CRM U-050) obtained from NIST wasused for adsorbing onto the silica particle.Analytical grade of reagent solution was used forsulfuric acid, ammonia solution and Collodionsolution.
2.2. Preparation and characterization of the silica
particles
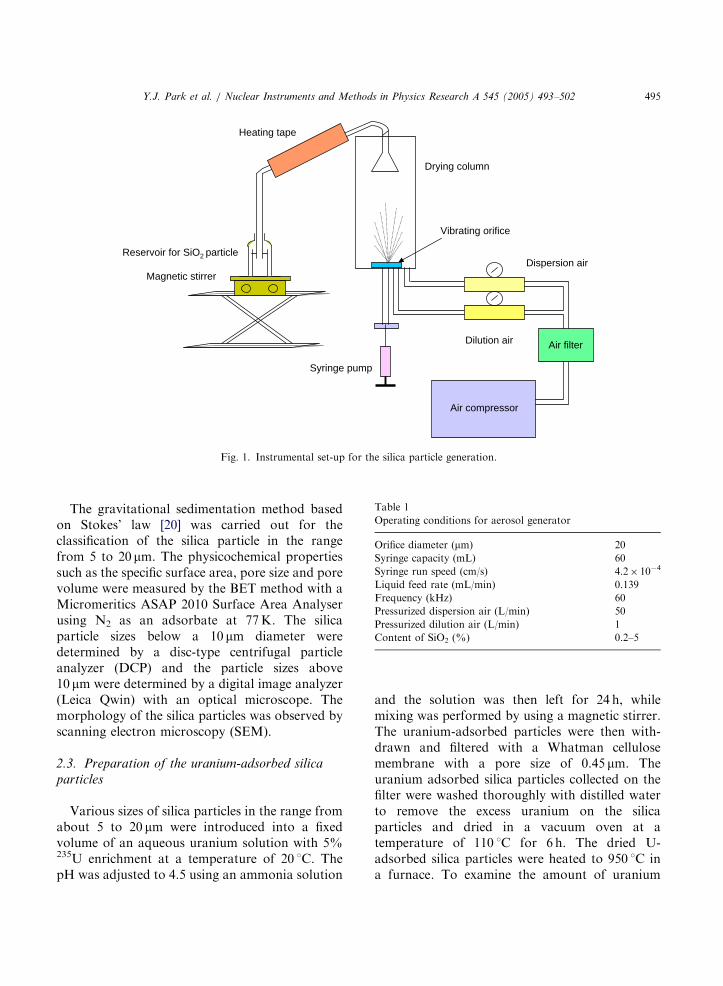
A modified instrumental setup with a commer-cially available vibrating-orifice aerosol generator(Model 3450, TSI, USA) system was used forproducing the silica particles, as shown in Fig. 1.In order to form a monodisperse aerosol and toprevent a coagulation of the aerosol, the dropletsproduced from the aerosol generator should bedispersed and diluted with two different pressur-ized air streams, dispersion air and dilution air,passing through the drying column. The dryingcolumn made of acryl, through which the streamof pressurized air is passed, was installed betweenthe orifice and the 0.5M H2SO4 solution bath. Afunnel was hung on the top of the drying columnin order to enhance the collection of the aerosol. Aquartz tube was covered with a heating tape to drythe surface of the aerosols. The silica aerosol(SiO2) passing through the quartz tube was thentransferred into an acidic solution bath withstirring to produce spherical solid silica particles.The operating conditions for the aerosol generatorare listed in Table 1.
ARTICLE IN PRESS
Air compressor
Air filterDilution air
Dispersion air
Vibrating orifice
Drying column
Heating tape
Syringe pump
Reservoir for SiO2 particle
Magnetic stirrer
Fig. 1. Instrumental set-up for the silica particle generation.
Table 1
Operating conditions for aerosol generator
Orifice diameter (mm) 20
Syringe capacity (mL) 60
Syringe run speed (cm/s) 4.2� 10�4
Liquid feed rate (mL/min) 0.139
Frequency (kHz) 60
Pressurized dispersion air (L/min) 50
Pressurized dilution air (L/min) 1
Content of SiO2 (%) 0.2–5
Y.J. Park et al. / Nuclear Instruments and Methods in Physics Research A 545 (2005) 493–502 495
The gravitational sedimentation method basedon Stokes’ law [20] was carried out for theclassification of the silica particle in the rangefrom 5 to 20 mm. The physicochemical propertiessuch as the specific surface area, pore size and porevolume were measured by the BET method with aMicromeritics ASAP 2010 Surface Area Analyserusing N2 as an adsorbate at 77K. The silicaparticle sizes below a 10 mm diameter weredetermined by a disc-type centrifugal particleanalyzer (DCP) and the particle sizes above10 mm were determined by a digital image analyzer(Leica Qwin) with an optical microscope. Themorphology of the silica particles was observed byscanning electron microscopy (SEM).
2.3. Preparation of the uranium-adsorbed silica
particles
Various sizes of silica particles in the range fromabout 5 to 20 mm were introduced into a fixedvolume of an aqueous uranium solution with 5%235U enrichment at a temperature of 20 1C. ThepH was adjusted to 4.5 using an ammonia solution
and the solution was then left for 24 h, whilemixing was performed by using a magnetic stirrer.The uranium-adsorbed particles were then with-drawn and filtered with a Whatman cellulosemembrane with a pore size of 0.45 mm. Theuranium adsorbed silica particles collected on thefilter were washed thoroughly with distilled waterto remove the excess uranium on the silicaparticles and dried in a vacuum oven at atemperature of 110 1C for 6 h. The dried U-adsorbed silica particles were heated to 950 1C ina furnace. To examine the amount of uranium
ARTICLE IN PRESS
Y.J. Park et al. / Nuclear Instruments and Methods in Physics Research A 545 (2005) 493–502496
adsorbed onto the silica particles, the uranium-adsorbed silica particles were back-extracted witha 4M HNO3 solution and the uranium content ofthe solution was determined by ICP-AES.
2.4. Fission track analysis
The silica particles associated with uraniumwere dispersed onto a polycarbonate plate with adilute Collodion solution which is used to fix theparticles simply by drying in air. The preparedplates were then placed in close contact with apiece of Lexan detector cut to the size of the plateand fixed with tape. The sample was transferredinto a polyethylene capsule for irradiation with athermal neutron flux of 1.3� 1013 cm�2 s�1 usingthe HANARO 25MW reactor located in theKAERI. After an irradiation of the sample, theLexan detector was removed from the polycarbo-nate plate and then etched in a bath of sodiumhydroxide solution (25%) at 60 1C for 10min todevelop fission tracks. After chemical etching, theLexan detector was rinsed with distilled water andallowed to dry. For the unknown particles in swipesample, the Lexan detector was directly placed onthe swipe and then proceed with the irradiationand etching process. The fission tracks formed onthe detector were observed with a digital micro-scope system. The size of the fission track recordedon the detector was measured by a digital imageanalyzer.
Table 2
Comparison of particle sizes between theoretical and measured
values for the production of silica particles with various
contents of the SiO2
Contents of SiO2
(weight %)
Theoretical
particle
diameter (mm)
Measured
particle
diameter (mm)
0.20% SiO2 solution 5.28 6.2571.52
1.25% SiO2 solution 9.73 9.5771.71
5% SiO2 solution 15.45 15.8372.71
10% SiO2 solution 19.47 19.2473.32
3. Results and discussion
3.1. Production of the silica particles
To obtain the micro size particles, the concen-tration (Dw) of the feed SiO2 solution can beadjusted from the following equation [21].
Dp ¼ ðDw þ IÞ1=3Dd (1)
where Dp is the nominal diameter of the finalparticle, I is the volumetric concentration of thenonvolatile impurity in the solvent, and Dd is thediameter of the droplet. Since one droplet isproduced per cycle of disturbance, Dd can beprecisely calculated from the liquid feed rate (Q)
and the disturbance frequency (F) according to
Dd ¼ ð6Q=pF Þ1=3. (2)
The ratio of the optimum liquid feed rate to thefrequency of the disturbance (Q/F) depends on thediameter of the liquid jet, which is determined bythe inner diameter of the orifice. If Eq. (2) issubstituted into Eq. (1) and I is negligible for thecase of high purity chemicals, Eq. (1) can betransformed into the following Eq. (3):
Dp ¼ ½6QDw=pF Þ�1=3. (3)
Therefore, before producing the silica particlesexperimentally, an approximate amount of themicro size silica particle can be estimated fromEq. (3). In this study, the variation of the particlesize (Dp) can be obtained by changing theconcentration of the SiO2 solution (Dw) in therange from 0.2% to 10% SiO2. In the case of the0.2% SiO2 solution which is injected into theaerosol generator with the conditions listed inTable 1, silica particles with about a 5 mm diameterare theoretically produced. With the 5% SiO2
solution, silica particles with about a 15 mmdiameter are estimated to be produced from theaerosol generator.It is interesting to compare the theoretical values
calculated from Eq. (3) with the measured valuesof the silica particles determined by the SEM.As can be seen in Table 2, the experimentallymeasured values for the silica particles generatedfrom the various concentrations of the SiO2
solution are close to the theoretical valuescalculated from Eq. (3). Therefore, it canbe concluded that silica particles with various
ARTICLE IN PRESS
Y.J. Park et al. / Nuclear Instruments and Methods in Physics Research A 545 (2005) 493–502 497
well-defined particle sizes can be obtained bysimply changing the concentration of the SiO2
solution.
3.2. Characteristics of silica particles
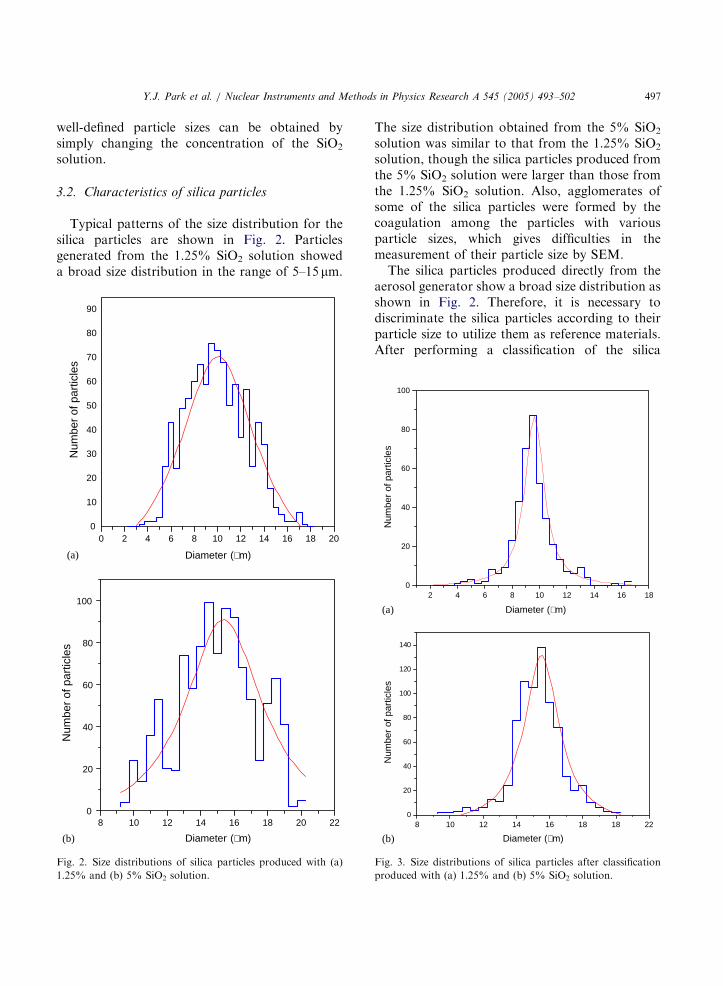
Typical patterns of the size distribution for thesilica particles are shown in Fig. 2. Particlesgenerated from the 1.25% SiO2 solution showeda broad size distribution in the range of 5–15 mm.
0 2 4 6 8 10 12 14 16 18 20
8 10 12 14 16 18 20 22
0
10
20
30
40
50
60
70
80
90
Num
ber
of p
artic
les
Diameter (µm)
Diameter (µm)
0
20
40
60
80
100
Num
ber
of p
artic
les
(a)
(b)
Fig. 2. Size distributions of silica particles produced with (a)
1.25% and (b) 5% SiO2 solution.
The size distribution obtained from the 5% SiO2
solution was similar to that from the 1.25% SiO2
solution, though the silica particles produced fromthe 5% SiO2 solution were larger than those fromthe 1.25% SiO2 solution. Also, agglomerates ofsome of the silica particles were formed by thecoagulation among the particles with variousparticle sizes, which gives difficulties in themeasurement of their particle size by SEM.The silica particles produced directly from the
aerosol generator show a broad size distribution asshown in Fig. 2. Therefore, it is necessary todiscriminate the silica particles according to theirparticle size to utilize them as reference materials.After performing a classification of the silica
2 4 6 8 10 12 14 16 180
20
40
60
80
100N
umbe
r of
par
ticle
sN
umbe
r of
par
ticle
s
Diameter (µm)
8 10 12 14 16 18 18 22
Diameter (µm)
0
20
40
60
80
100
120
140
(a)
(b)
Fig. 3. Size distributions of silica particles after classification
produced with (a) 1.25% and (b) 5% SiO2 solution.
ARTICLE IN PRESS
Y.J. Park et al. / Nuclear Instruments and Methods in Physics Research A 545 (2005) 493–502498
particles with the gravitational sedimentationmethod, the classified silica particles with a narrowsize distribution were obtained as shown in Fig. 3.From the 1.25% SiO2 solution, a narrow distribu-tion with a maximum centered at approximately10 mm was obtained. A size distribution with amaximum centered at about 15 mm was obtained inthe 5% SiO2 solution.
Table 3
Physicochemical properties of the classified silica particles
Range of
particle size
(mm)
Surface area
(m2/g)
Pore size
(nm)
Pore volume
(cm3/g)
4–6 537 2.77 0.13
9–11 456 2.06 0.23
14–16 335 1.96 0.16
19–21 287 2.02 0.15
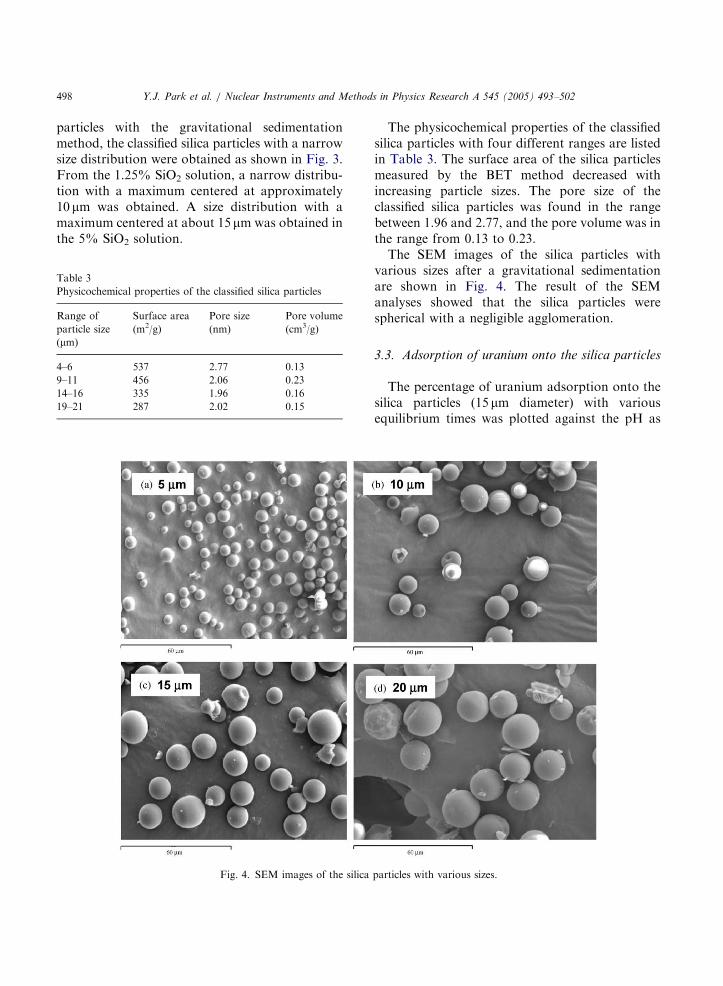
Fig. 4. SEM images of the silica
The physicochemical properties of the classifiedsilica particles with four different ranges are listedin Table 3. The surface area of the silica particlesmeasured by the BET method decreased withincreasing particle sizes. The pore size of theclassified silica particles was found in the rangebetween 1.96 and 2.77, and the pore volume was inthe range from 0.13 to 0.23.The SEM images of the silica particles with
various sizes after a gravitational sedimentationare shown in Fig. 4. The result of the SEManalyses showed that the silica particles werespherical with a negligible agglomeration.
3.3. Adsorption of uranium onto the silica particles
The percentage of uranium adsorption onto thesilica particles (15 mm diameter) with variousequilibrium times was plotted against the pH as
particles with various sizes.
ARTICLE IN PRESS
Y.J. Park et al. / Nuclear Instruments and Methods in Physics Research A 545 (2005) 493–502 499
shown in Fig. 5. The amount of uranium adsorp-tion onto the silica particles was increased withincreasing pH, although there was almost noadsorption of uranium below pH 3. At pH 4.5,approximately 20% of uranium was adsorbedonto the silica particles, while more than 30% ofuranium was adsorbed onto the silica particles atpH higher than 5. However, a hydrolysis reactioncould occur in competition with the adsorptionreaction above pH 5 [22,23]. It was found thatthere was no significant change of the uranium
1 32 4 5 6
0
10
20
30
40
50
60
Ads
orbe
d ur
aniu
m, %
pH
24 hr 48 hr 72 hr 96 hr
Fig. 5. Variation of uranium adsorption on the silica particles
with various pH and equilibrium time.
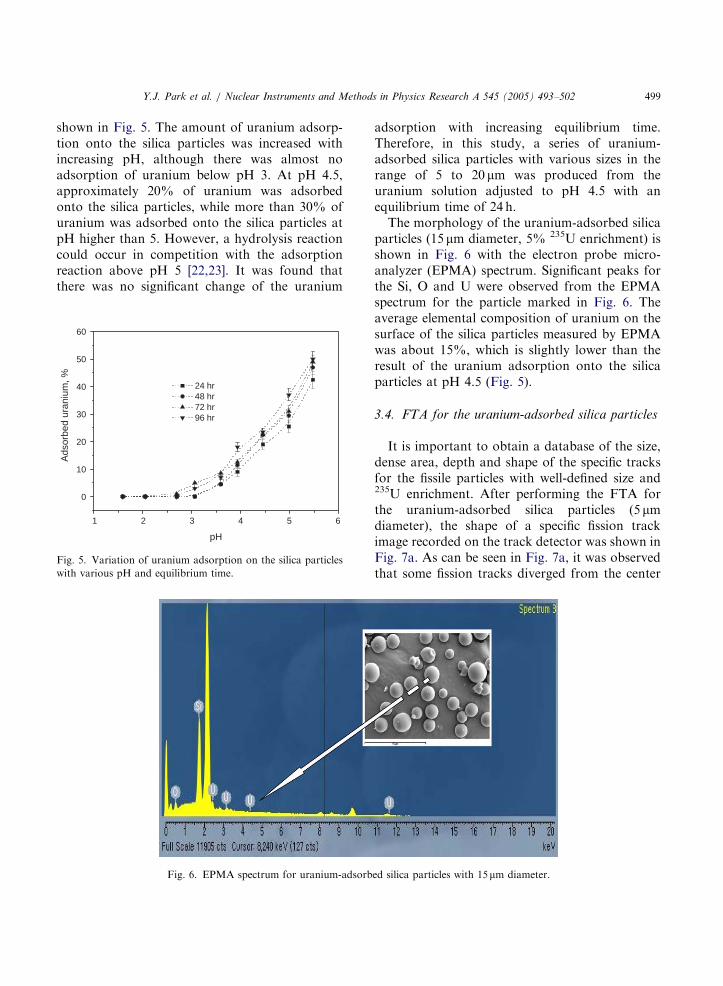
Fig. 6. EPMA spectrum for uranium-adsorb
adsorption with increasing equilibrium time.Therefore, in this study, a series of uranium-adsorbed silica particles with various sizes in therange of 5 to 20 mm was produced from theuranium solution adjusted to pH 4.5 with anequilibrium time of 24 h.The morphology of the uranium-adsorbed silica
particles (15 mm diameter, 5% 235U enrichment) isshown in Fig. 6 with the electron probe micro-analyzer (EPMA) spectrum. Significant peaks forthe Si, O and U were observed from the EPMAspectrum for the particle marked in Fig. 6. Theaverage elemental composition of uranium on thesurface of the silica particles measured by EPMAwas about 15%, which is slightly lower than theresult of the uranium adsorption onto the silicaparticles at pH 4.5 (Fig. 5).
3.4. FTA for the uranium-adsorbed silica particles
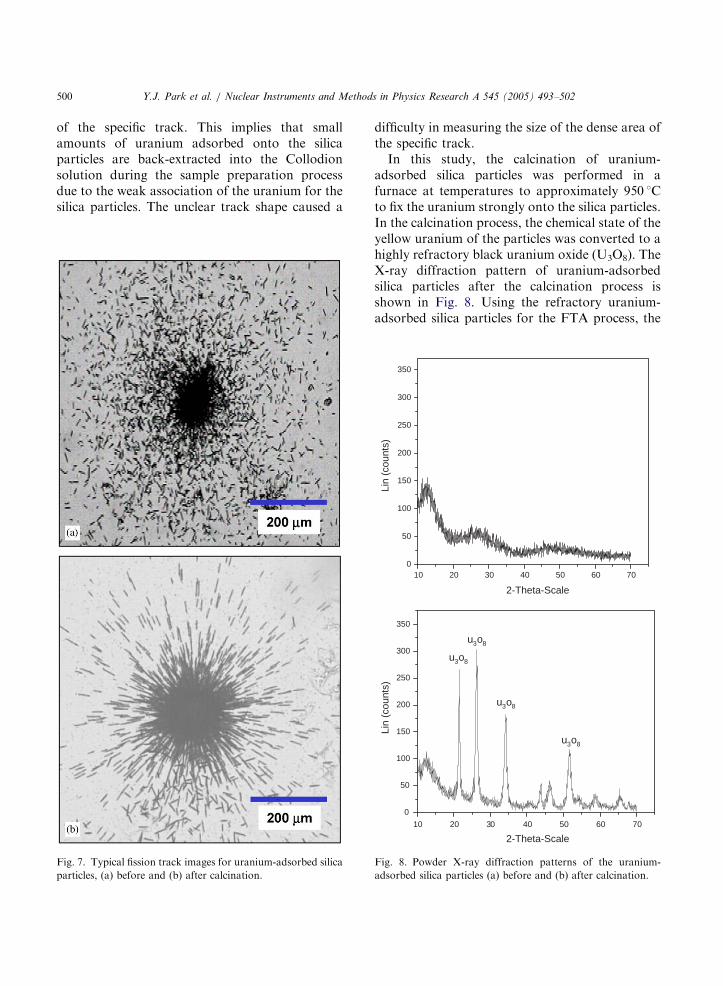
It is important to obtain a database of the size,dense area, depth and shape of the specific tracksfor the fissile particles with well-defined size and235U enrichment. After performing the FTA forthe uranium-adsorbed silica particles (5 mmdiameter), the shape of a specific fission trackimage recorded on the track detector was shown inFig. 7a. As can be seen in Fig. 7a, it was observedthat some fission tracks diverged from the center
ed silica particles with 15mm diameter.
ARTICLE IN PRESS
Y.J. Park et al. / Nuclear Instruments and Methods in Physics Research A 545 (2005) 493–502500
of the specific track. This implies that smallamounts of uranium adsorbed onto the silicaparticles are back-extracted into the Collodionsolution during the sample preparation processdue to the weak association of the uranium for thesilica particles. The unclear track shape caused a
Fig. 7. Typical fission track images for uranium-adsorbed silica
particles, (a) before and (b) after calcination.
difficulty in measuring the size of the dense area ofthe specific track.In this study, the calcination of uranium-
adsorbed silica particles was performed in afurnace at temperatures to approximately 950 1Cto fix the uranium strongly onto the silica particles.In the calcination process, the chemical state of theyellow uranium of the particles was converted to ahighly refractory black uranium oxide (U3O8). TheX-ray diffraction pattern of uranium-adsorbedsilica particles after the calcination process isshown in Fig. 8. Using the refractory uranium-adsorbed silica particles for the FTA process, the
10 20 30 40 50 60 70
0
50
100
150
200
250
300
350
u3o8
u3o8
u3o8
u3o8
10 20 30 40 50 60 700
50
100
150
200
250
300
350
Lin
(cou
nts)
Lin
(cou
nts)
2-Theta-Scale
2-Theta-Scale
Fig. 8. Powder X-ray diffraction patterns of the uranium-
adsorbed silica particles (a) before and (b) after calcination.
ARTICLE IN PRESS
0 5 10 15 20 25 30
100
200
300
400
500
600
700
Tra
ck d
iam
eter
(µm
)
Particle diameter (µm)
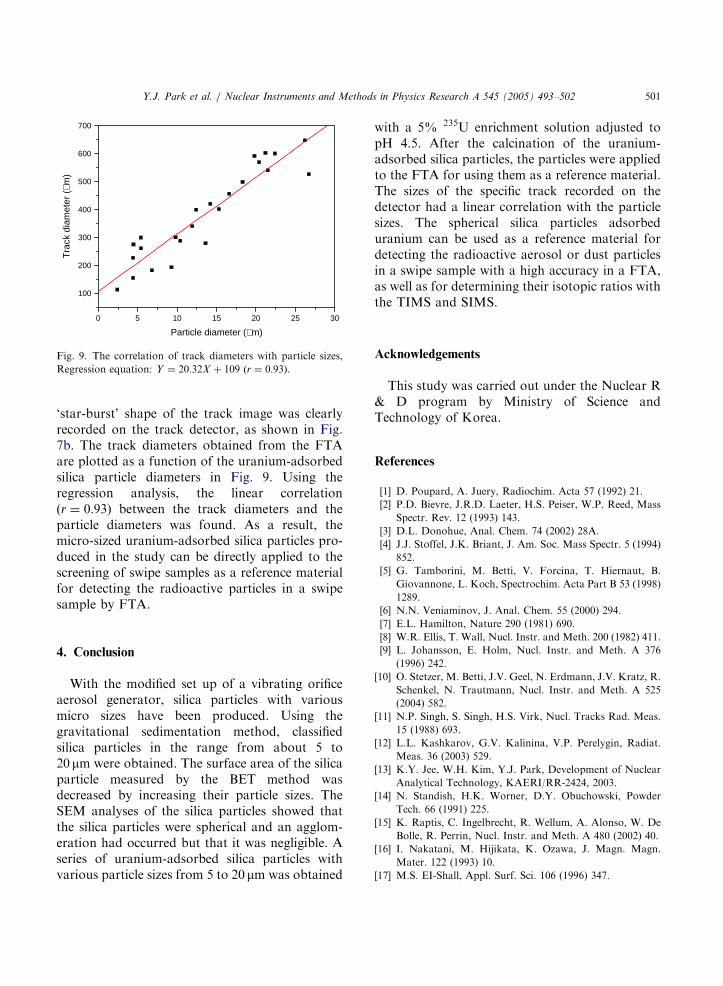
Fig. 9. The correlation of track diameters with particle sizes,
Regression equation: Y ¼ 20:32X þ 109 (r ¼ 0:93).
Y.J. Park et al. / Nuclear Instruments and Methods in Physics Research A 545 (2005) 493–502 501
‘star-burst’ shape of the track image was clearlyrecorded on the track detector, as shown in Fig.7b. The track diameters obtained from the FTAare plotted as a function of the uranium-adsorbedsilica particle diameters in Fig. 9. Using theregression analysis, the linear correlation(r ¼ 0:93) between the track diameters and theparticle diameters was found. As a result, themicro-sized uranium-adsorbed silica particles pro-duced in the study can be directly applied to thescreening of swipe samples as a reference materialfor detecting the radioactive particles in a swipesample by FTA.
4. Conclusion
With the modified set up of a vibrating orificeaerosol generator, silica particles with variousmicro sizes have been produced. Using thegravitational sedimentation method, classifiedsilica particles in the range from about 5 to20 mm were obtained. The surface area of the silicaparticle measured by the BET method wasdecreased by increasing their particle sizes. TheSEM analyses of the silica particles showed thatthe silica particles were spherical and an agglom-eration had occurred but that it was negligible. Aseries of uranium-adsorbed silica particles withvarious particle sizes from 5 to 20 mm was obtained
with a 5% 235U enrichment solution adjusted topH 4.5. After the calcination of the uranium-adsorbed silica particles, the particles were appliedto the FTA for using them as a reference material.The sizes of the specific track recorded on thedetector had a linear correlation with the particlesizes. The spherical silica particles adsorbeduranium can be used as a reference material fordetecting the radioactive aerosol or dust particlesin a swipe sample with a high accuracy in a FTA,as well as for determining their isotopic ratios withthe TIMS and SIMS.
Acknowledgements
This study was carried out under the Nuclear R& D program by Ministry of Science andTechnology of Korea.
References
[1] D. Poupard, A. Juery, Radiochim. Acta 57 (1992) 21.
[2] P.D. Bievre, J.R.D. Laeter, H.S. Peiser, W.P. Reed, Mass
Spectr. Rev. 12 (1993) 143.
[3] D.L. Donohue, Anal. Chem. 74 (2002) 28A.
[4] J.J. Stoffel, J.K. Briant, J. Am. Soc. Mass Spectr. 5 (1994)
852.
[5] G. Tamborini, M. Betti, V. Forcina, T. Hiernaut, B.
Giovannone, L. Koch, Spectrochim. Acta Part B 53 (1998)
1289.
[6] N.N. Veniaminov, J. Anal. Chem. 55 (2000) 294.
[7] E.L. Hamilton, Nature 290 (1981) 690.
[8] W.R. Ellis, T. Wall, Nucl. Instr. and Meth. 200 (1982) 411.
[9] L. Johansson, E. Holm, Nucl. Instr. and Meth. A 376
(1996) 242.
[10] O. Stetzer, M. Betti, J.V. Geel, N. Erdmann, J.V. Kratz, R.
Schenkel, N. Trautmann, Nucl. Instr. and Meth. A 525
(2004) 582.
[11] N.P. Singh, S. Singh, H.S. Virk, Nucl. Tracks Rad. Meas.
15 (1988) 693.
[12] L.L. Kashkarov, G.V. Kalinina, V.P. Perelygin, Radiat.
Meas. 36 (2003) 529.
[13] K.Y. Jee, W.H. Kim, Y.J. Park, Development of Nuclear
Analytical Technology, KAERI/RR-2424, 2003.
[14] N. Standish, H.K. Worner, D.Y. Obuchowski, Powder
Tech. 66 (1991) 225.
[15] K. Raptis, C. Ingelbrecht, R. Wellum, A. Alonso, W. De
Bolle, R. Perrin, Nucl. Instr. and Meth. A 480 (2002) 40.
[16] I. Nakatani, M. Hijikata, K. Ozawa, J. Magn. Magn.
Mater. 122 (1993) 10.
[17] M.S. EI-Shall, Appl. Surf. Sci. 106 (1996) 347.

ARTICLE IN PRESS
Y.J. Park et al. / Nuclear Instruments and Methods in Physics Research A 545 (2005) 493–502502
[18] J.J. Stoffel, J.K. Briant, J. Am. Soc. Mass Spectr. 5 (1994)
852.
[19] N. Erdmann, M. Betti, O. Stetzer, G. Tamborini, J.V.
Kratz, N. Trautmann, J.V. Geel, Spectrochim. Acta Part B
55 (2000) 1565.
[20] T. Allen, Particle Size Measurement, 3rd ed, Chapman and
Hall Ltd, New York, 1981, p. 215.
[21] TSI Instruction Manual, Model 3450 Vibrating Orifice
Aerosol Generator, 2000.
[22] P. Michard, E. Guibal, T. Vincent, P. Le Cloirec,
Microporous Mater. 5 (1996) 309.
[23] H.H. Tran, F.A. Roddick, J.A. O’Donnell, Water Res. 13
(1999) 2992.