Embed Size (px)
Citation preview
The Prevalence and Cost of Asthma in New York State
April 2014
Thomas P. DiNapoli New York State Comptroller
Additional copies of this report may be obtained from:
Office of the State Comptroller Public Information Office 110 State Street Albany, New York 12236 (518) 474-4015
Or through the Comptroller’s website at: www.osc.state.ny.us
Please notify the Office of Budget and Policy Analysis at (518) 473-4333 if you would like your name to be deleted from the mailing list.
Table of Contents EXECUTIVE SUMMARY ......................................................................................................... 1
ASTHMA IN NEW YORK STATE ............................................................................................ 3
Prevalence of Asthma in New York ...................................................................................... 3 Asthma Death Rates in New York State ............................................................................... 3 Asthma Hospitalizations in New York State .......................................................................... 5 Prevalence of Asthma Among New York’s Medicaid Recipients ........................................... 6 Costs of Asthma in New York ............................................................................................. 12 Costs of Asthma Among New York’s Medicaid Recipients ................................................. 12 Asthma Risk Factors .......................................................................................................... 13
NEW YORK STATE’S RESPONSE TO ASTHMA ................................................................. 14
APPENDICES........................................................................................................................ 16
Appendix A – New York State Medicaid Asthma Prevalence Rates by County .................. 16 Appendix B – New York City Medicaid Asthma Prevalence Rates by Selected Zip Codes . 17

Executive Summary Asthma is a major public health problem in New York State and nationally. Data collected for the federal Centers for Disease Control and Prevention (CDC) show a steady increase in the prevalence of the chronic lung disease nationally in recent years. In New York, however, while the numbers of overall deaths from asthma and asthma-related hospitalizations have declined, the public health and financial consequences of asthma in the State remain significant. The CDC describes asthma as “common, deadly, disruptive, and expensive.” The disease places thousands of adults and children at higher risk of missing work or school, as well as of emergency room visits, hospitalizations and even death. New York’s $55 billion Medicaid program, which enrolls approximately one in four New Yorkers, is responsible for a major portion of the State’s annual asthma costs. An analysis by the Office of the State Comptroller (OSC) of Medicaid expenditure data found that asthma-related Medicaid costs for recipients diagnosed with the disease exceeded $532 million in State Fiscal Year (SFY) 2012-13, an increase of more than 26 percent from five years earlier. Prescription drugs made up more than half of that total, at nearly $307 million. The cost of asthma goes well beyond the direct expense that taxpayers bear through the Medicaid program. The disease also drives higher insurance premiums for New Yorkers with privately paid health coverage. Including Medicaid costs, the State Department of Health (DOH) recently estimated the annual overall cost of asthma in New York at $1.3 billion in direct medical costs and lost productivity. Hospitalizations account for $660 million of these costs, a 61 percent increase since 2002. As of 2012, an estimated 1.4 million adult New Yorkers suffered from asthma, according to CDC data. Some 315,000 children had asthma in 2010, the latest year for which figures are available, CDC estimates. The number of New York Medicaid recipients with an asthma diagnosis rose by more than 30 percent over the five years ending in State Fiscal Year 2012-13. Much of this increase – but not all – reflects a sharp increase in the State’s Medicaid population over the period. The prevalence of asthma among Medicaid recipients rose by 8.6 percent over the five years. Increases in asthma prevalence were especially significant among Medicaid recipients older than 55, while the rate of prevalence among children dropped by 12 percent. Among the State’s Medicaid recipients diagnosed with asthma in SFY 2012-13, the highest prevalence rates were in the Bronx and four upstate counties:
• Schenectady, with 131.3 people with asthma per thousand enrollees; • The Bronx, with 130.2 people with asthma per thousand enrollees; • Clinton and Fulton, each with 129.9 people with asthma per thousand
enrollees; and
2
• Rensselaer, with 123.2 people with asthma per one thousand enrollees. Among New York City’s five boroughs, asthma prevalence rates among Medicaid recipients were especially high in certain neighborhoods: Hunts Point and Longwood-Morrisania in the Bronx; East Harlem in Manhattan; Carroll Gardens-Red Hook in Brooklyn; and Arverne in Queens. Asthma death rates in New York have fallen significantly in recent years. According to DOH figures, the average annual death toll from the disease fell by 18.1 percent for the three years ending in 2011, compared to the similar period ending in 2004. The highest numbers of asthma deaths in 2011 occurred in the Bronx and Brooklyn. For the three years ending in 2011, average annual hospitalizations in New York due to asthma were 8.3 percent lower than during the analogous period ending in 2004. Over the past 10 to 15 years, initiatives by CDC, DOH and the broader health community have expanded epidemiological, educational and treatment programs to address asthma. DOH’s efforts to reduce the State’s asthma burden include Medicaid coverage of prescription drugs and self-management education, in-home assessments and interventions for the disease, promotion of evidence-based care to reduce asthma emergency room visits and hospitalizations, and increased dispensing of appropriate asthma control medications for persons with persistent asthma. DOH included two asthma-specific initiatives in the State’s recently approved application for a federal Medicaid waiver amendment. These initiatives are designed to expand the State’s Medicaid home-based asthma assessment and education program, and enlist providers and health plans in referring at-risk children to home evaluation services offered by public health authorities. Academics and health professionals have not reached consensus on the reasons for current trends in asthma prevalence, and research continues. The recent declines in overall asthma deaths, hospitalizations and asthma prevalence among children in the Medicaid program in New York demonstrate that progress against the disease is possible. Yet further progress remains essential. In addition, the dramatic variation in asthma rates across communities points to the need for further analysis to determine whether initiatives to attack the disease are working more effectively in some locations than in others. While the Department of Health has undertaken a variety of initiatives to address asthma in recent years, and plans additional steps, efforts to analyze and report on potential causes of recent trends in the prevalence of the disease have been more limited. DOH needs to work with academic experts, health-care providers and others to gain a better understanding of trends in asthma prevalence for adults and children, and within varied communities, to ensure that publicly funded initiatives to address the disease are targeted as effectively as possible.
3
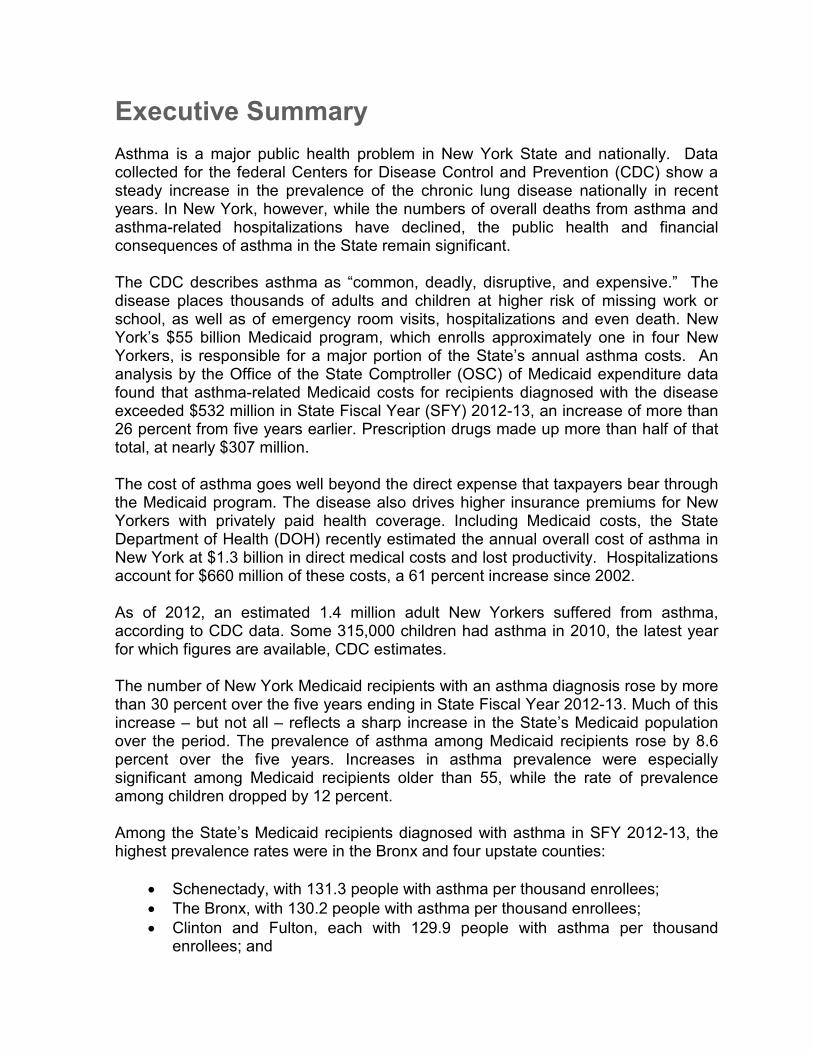
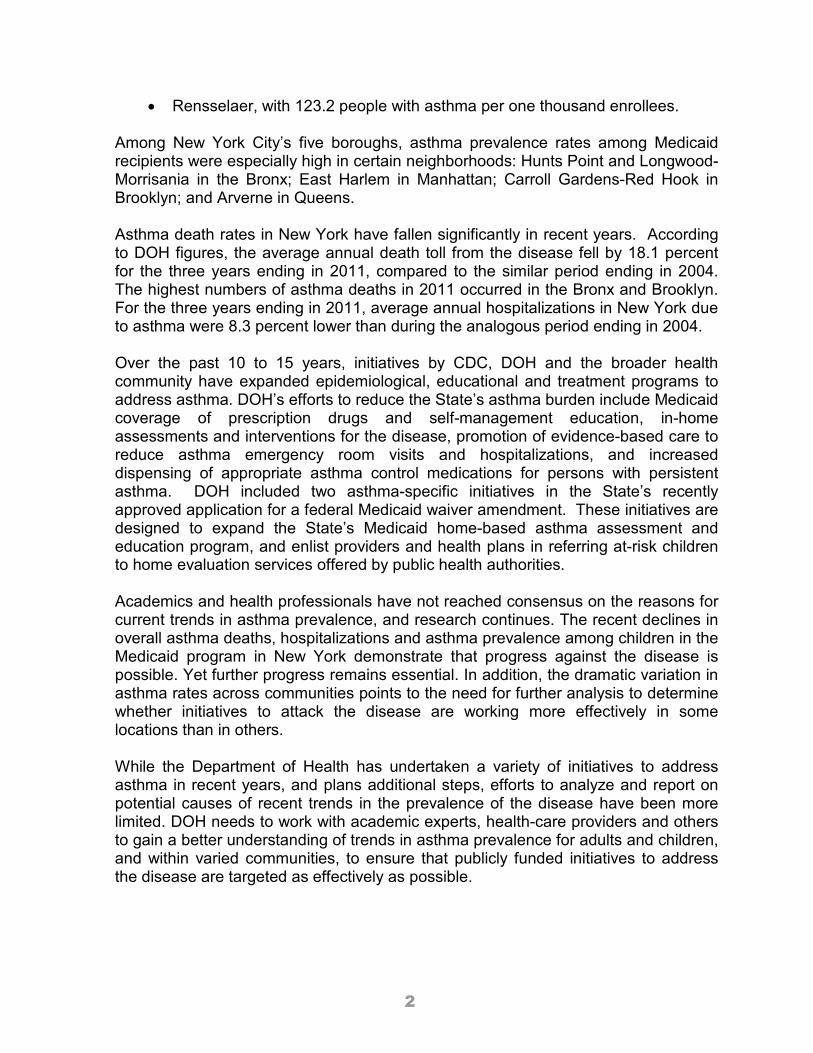
Asthma in New York State Prevalence of Asthma in New York This report presents two primary measures of asthma prevalence in New York. First, CDC’s Behavioral Risk Factor Surveillance System (BRFSS) monitors and reports on major health-related risks among adults and children – including asthma – based on landline and cellphone surveys.1 (While BRFSS reports only national and state-level data, DOH has produced some limited regional figures on asthma prevalence using CDC data, as cited later in this report.) Second, to assess the variation of asthma prevalence rates across New York State, the Office of the State Comptroller analyzed data on Medicaid payments for individuals diagnosed with the disease. BRFSS data indicate that 9.3 percent of adult New Yorkers, or about 1.4 million individuals, had self-reported asthma in 2012.2 In 2010, the most recent year for which BRFSS data on childhood asthma in New York is available, CDC estimates that 7.4 percent of New Yorkers under 18 years of age, or about 315,000 children, had asthma.3 Asthma Death Rates in New York State Over the most recent ten years for which data are available, annual deaths due to asthma in the State have decreased by 22.7 percent, from 330 in 2002 to 255 in 2011.4 However, the number of such deaths fluctuates from year to year, as shown in Figure 1. For the three years ending in 2011, average annual asthma deaths of 258 per year reflect a decrease of 57 deaths, or 18.1 percent, from the level of average annual asthma deaths for the three years ending in 2004.5 In New York State, the rate of asthma deaths per million residents (including New York City) declined by 23.8 percent from 17.2 deaths per million in 2002 to 13.1 deaths per million in 2011.6 The rate of asthma deaths is higher in New York City than statewide, at 20.9 per million residents in 2011, as compared to 13.1 deaths per million, as shown in Figure 2.
1 See www.cdc.gov/asthma/brfss/2012/brfsstechinfo.htm. Due to the nature of the survey, the BRFSS numbers are somewhat imprecise, suggesting a range of likely prevalence numbers and rates rather than definitive counts and percentages. The 2012 BRFSS data continues to reflect changes initially made in 2011 in weighting methodology and the addition of cellphone only respondents. For data analysis, the CDC indicates that the 2011 BRFSS data should be considered a baseline year and, along with the 2012 data, not directly comparable to previous years of data. 2 See www.cdc.gov/asthma/brfss/2012/tableC1.htm. In 2012, the true number of adult New Yorkers self-reporting asthma, as well as the prevalence rate associated with this number, is likely to fall within a 95 percent confidence interval ranging from 1.2 million to 1.5 million New Yorkers and 8.3 percent to 10.3 percent, respectively. 3 See www.cdc.gov/asthma/brfss/2010/child/current/tableC1.htm. In 2010, the true number of New Yorkers under age 18 reported to have asthma, as well as the prevalence rate associated with this number, is likely to fall within a 95 percent confidence interval ranging from 205,000 children to nearly 426,000 children and 5.2 percent to 10.3 percent, respectively. 4 See www.health.ny.gov/statistics/ny_asthma/index.htm and Draft NYS Asthma Surveillance Report 2013, Chapter 8. 5 See www.health.ny.gov/statistics/ny_asthma/ for DOH Asthma Surveillance Summary Reports for 2005, 2007 and 2009; and Department of Health, Draft New York State Asthma Surveillance Report 2013, Chapter 8. 6 Department of Health, Draft New York State Asthma Surveillance Report 2013, Chapter 8.
4
Figure 1 Asthma Deaths in New York State by Year
Sources: DOH Asthma Surveillance Summary Reports for 2005, 2007 and 2009, and the draft DOH Asthma Surveillance Summary Report for 2013.
While the asthma death rate in the City fell over the decade ending in 2011, the decline of 17.1 percent was more modest than the statewide decline of 23.8 percent.7 In areas of the State outside of New York City, the rate of deaths due to asthma dropped sharply – by 35.1 percent from 11.4 deaths per million residents in 2002 to 7.4 per million in 2011.8 Figure 2
Asthma Death Rates by Year (per one million residents)
Sources: DOH Asthma Surveillance Summary Reports for 2005, 2007 and 2009, and the draft DOH Asthma Surveillance Summary Report for 2013
While such decreases are positive, the number of deaths due to asthma and the death rate relative to the population remain comparatively high in certain areas. Such 7 See Department of Health Draft NYS Asthma Surveillance Report 2013 Chapter 8. 8 Ibid.
0
50
100
150
200
250
300
350
2002 2003 2004 2005 2006 2007 2008 2009 2010 2011
0
5
10
15
20
25
30
2002 2003 2004 2005 2006 2007 2008 2009 2010 2011
New York City New York State
5
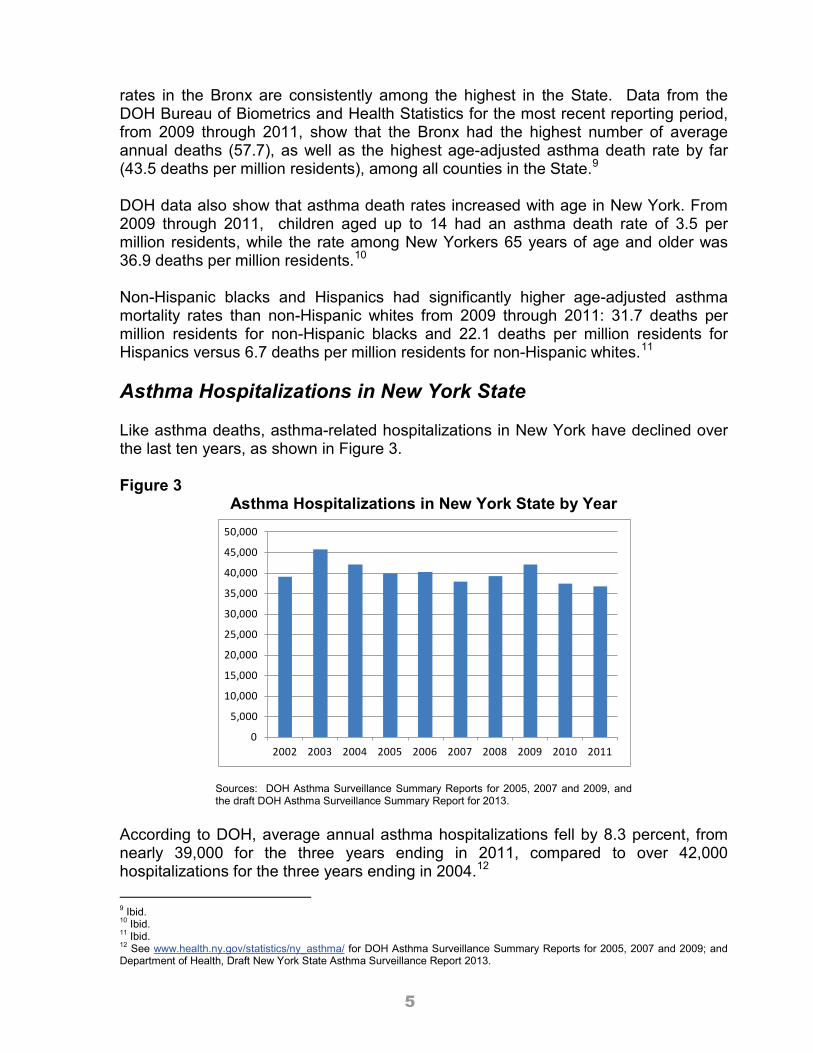
rates in the Bronx are consistently among the highest in the State. Data from the DOH Bureau of Biometrics and Health Statistics for the most recent reporting period, from 2009 through 2011, show that the Bronx had the highest number of average annual deaths (57.7), as well as the highest age-adjusted asthma death rate by far (43.5 deaths per million residents), among all counties in the State.9 DOH data also show that asthma death rates increased with age in New York. From 2009 through 2011, children aged up to 14 had an asthma death rate of 3.5 per million residents, while the rate among New Yorkers 65 years of age and older was 36.9 deaths per million residents.10 Non-Hispanic blacks and Hispanics had significantly higher age-adjusted asthma mortality rates than non-Hispanic whites from 2009 through 2011: 31.7 deaths per million residents for non-Hispanic blacks and 22.1 deaths per million residents for Hispanics versus 6.7 deaths per million residents for non-Hispanic whites.11 Asthma Hospitalizations in New York State Like asthma deaths, asthma-related hospitalizations in New York have declined over the last ten years, as shown in Figure 3. Figure 3
Asthma Hospitalizations in New York State by Year
Sources: DOH Asthma Surveillance Summary Reports for 2005, 2007 and 2009, and the draft DOH Asthma Surveillance Summary Report for 2013.
According to DOH, average annual asthma hospitalizations fell by 8.3 percent, from nearly 39,000 for the three years ending in 2011, compared to over 42,000 hospitalizations for the three years ending in 2004.12 9 Ibid. 10 Ibid. 11 Ibid. 12 See www.health.ny.gov/statistics/ny_asthma/ for DOH Asthma Surveillance Summary Reports for 2005, 2007 and 2009; and Department of Health, Draft New York State Asthma Surveillance Report 2013.
0
5,000
10,000
15,000
20,000
25,000
30,000
35,000
40,000
45,000
50,000
2002 2003 2004 2005 2006 2007 2008 2009 2010 2011
6
Asthma Prevalence in New York Adults In 2012, CDC data indicate that about 9.3 percent of adult New Yorkers suffered from asthma, while the 2011 estimate was 9.7 percent. (It is unclear whether this change is statistically significant.) DOH analysis of 2011 CDC surveillance data indicates that adults living in New York City had a higher asthma prevalence rate (10.2 percent) than adults living in other areas of the State (9.3 percent).13 DOH also found that adults aged 18–24 years had the highest adult asthma prevalence in the State (11.2 percent), with adults aged 35–44 and above 65 years having the lowest prevalence (8.9 and 8.7 percent, respectively). In addition, DOH found that asthma prevalence among adult women in the State (12.3 percent) was higher than among men (6.9 percent) in 2011.14
Asthma Prevalence in New York Children In 2010, the most recent year for which data are available, the number of children with asthma in New York was 315,000, or one in fourteen children, according to CDC.15 New York’s asthma prevalence rate for children was 7.4 percent in 2010.16 The national asthma prevalence rate for children in 2010 was 8.4 percent, or one in eleven children.17 Prevalence of Asthma Among New York’s Medicaid Recipients Both the number of New York Medicaid recipients with an asthma diagnosis, and the costs for their asthma-related care, rose faster than the overall Medicaid population and total Medicaid expenditures during the five years ending in SFY 2012-13. Analysis of five years of Medicaid fee-for-service claims and managed care encounter data through SFY 2012-13 by the Office of the State Comptroller shows that the number of Medicaid recipients with an asthma diagnosis grew by more than 130,000, or 30.4 percent, to nearly 559,000 recipients in SFY 2012-13.18 Asthma-related expenditures increased by $111.7 million, or 26.5 percent, to $532.7 million from SFY 2008-09 to SFY 2012-13. Overall enrollment in New York’s Medicaid program increased by about 20.1 percent to nearly 5.7 million New Yorkers over the five-year period, while total New York Medicaid spending (including federal, State and local expenditures) grew by about $9 billion, or 20 percent, from $45 billion in SFY 2008-09 to $54 billion in SFY 2012-13. The overall prevalence of asthma among Medicaid recipients also increased over the
13 Department of Health, Draft New York State Asthma Surveillance Report 2013, Chapter 5. 14 Ibid. 15 See www.cdc.gov/asthma/brfss/archive.htm and www.health.ny.gov/statistics/ny_asthma/asthmaprevchild10.htm. 16 See www.cdc.gov/asthma/brfss/archive.htm. 17 Ibid and see www.cdc.gov/asthma/impacts_nation/asthmafactsheet.pdf and www.cdc.gov/asthma/brfss/archive.htm. 18 The Office of the State Comptroller extracted and analyzed Medicaid data used for this report from the DOH Medicaid data warehouse. For the purposes of this report, the population of Medicaid asthma recipients for SFY 2008-09 and SFY 2012-13 includes members who have a fee-for-service claim or managed care encounter at any time during the year and whose files contained a diagnosis code indicating asthma in diagnosis codes 1 through 10. All asthma diagnosis codes beginning with 493 (representing asthma) were considered, except for diagnosis code 49381 (representing exercise-induced bronchospasm). The overall population of Medicaid recipients includes members who have a claim or encounter at any time during the year.
7
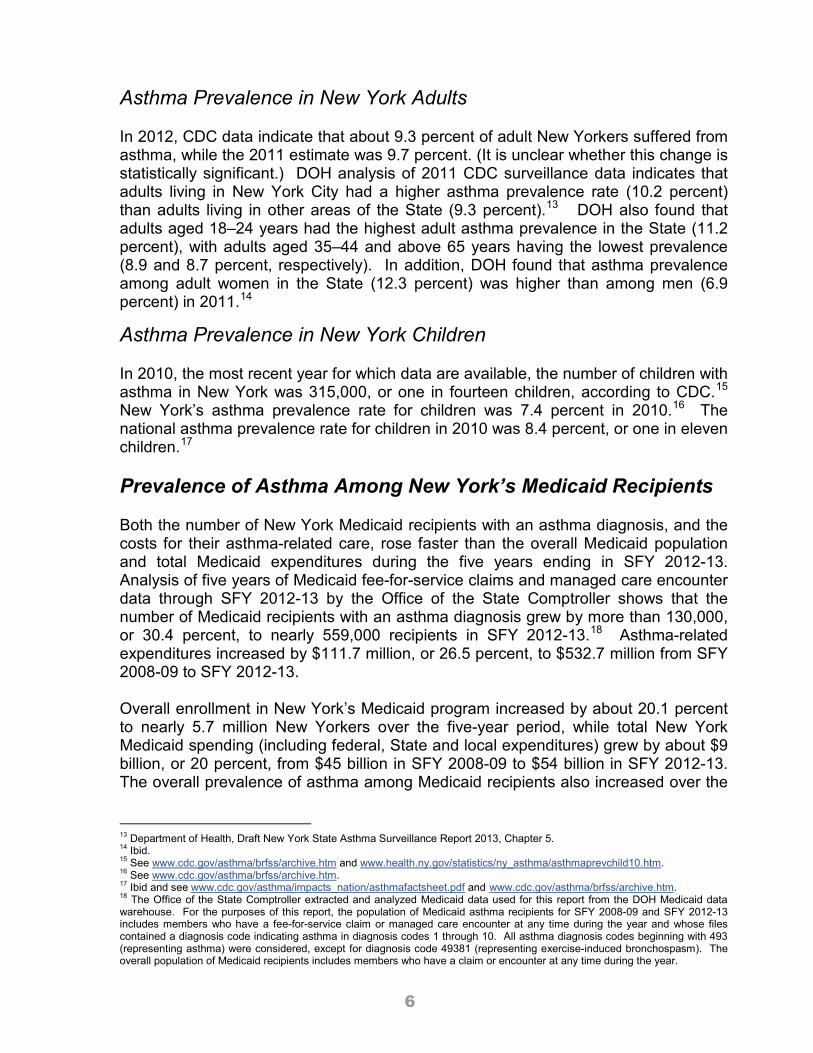
five-year period. The prevalence rate grew by 7.8 recipients, or 8.6 percent, to 98.7 people with asthma per thousand Medicaid enrollees in SFY 2012-13. Statewide in SFY 2012-13, the asthma prevalence rate among Medicaid recipients was highest in Schenectady County, which had 131.3 people diagnosed with the disease per thousand Medicaid enrollees, as shown in Figure 4. While other counties with the highest prevalence rates were mostly in upstate regions, the second-highest asthma rate was in the Bronx, at 130.2 people with asthma per thousand Medicaid recipients. Figure 4
Top Ten Asthma Prevalence Rates Among Medicaid Recipients by County (per thousand Medicaid enrollees)
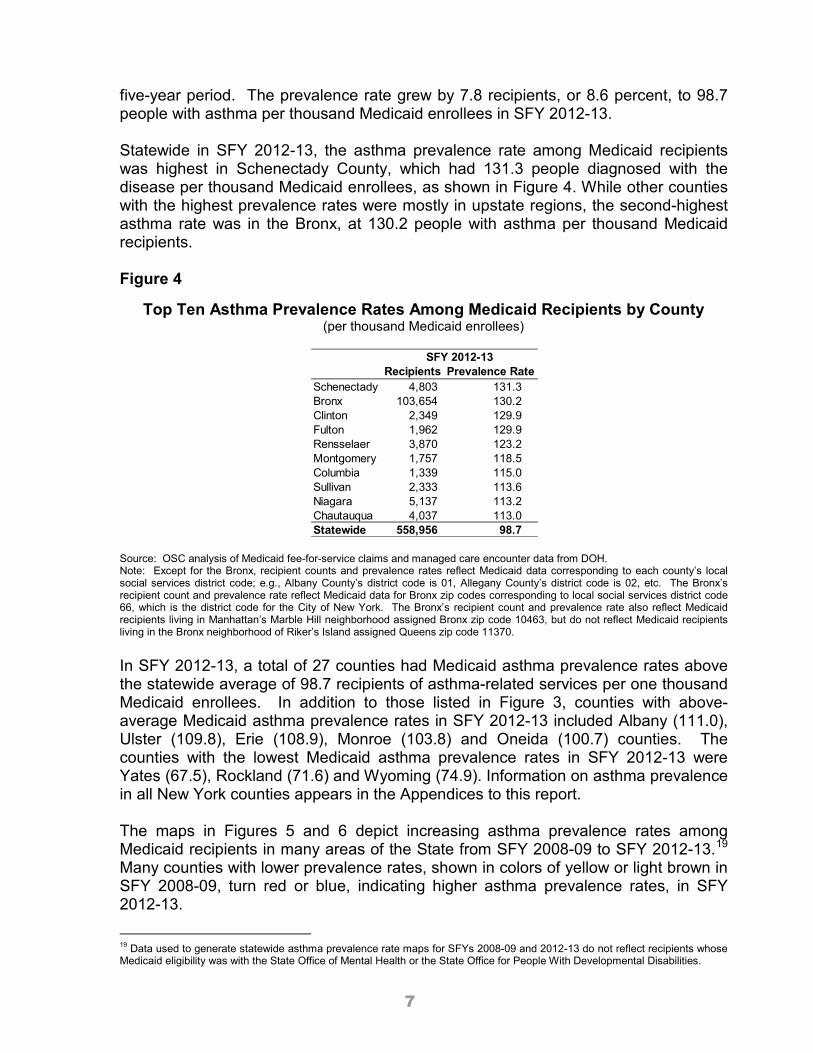
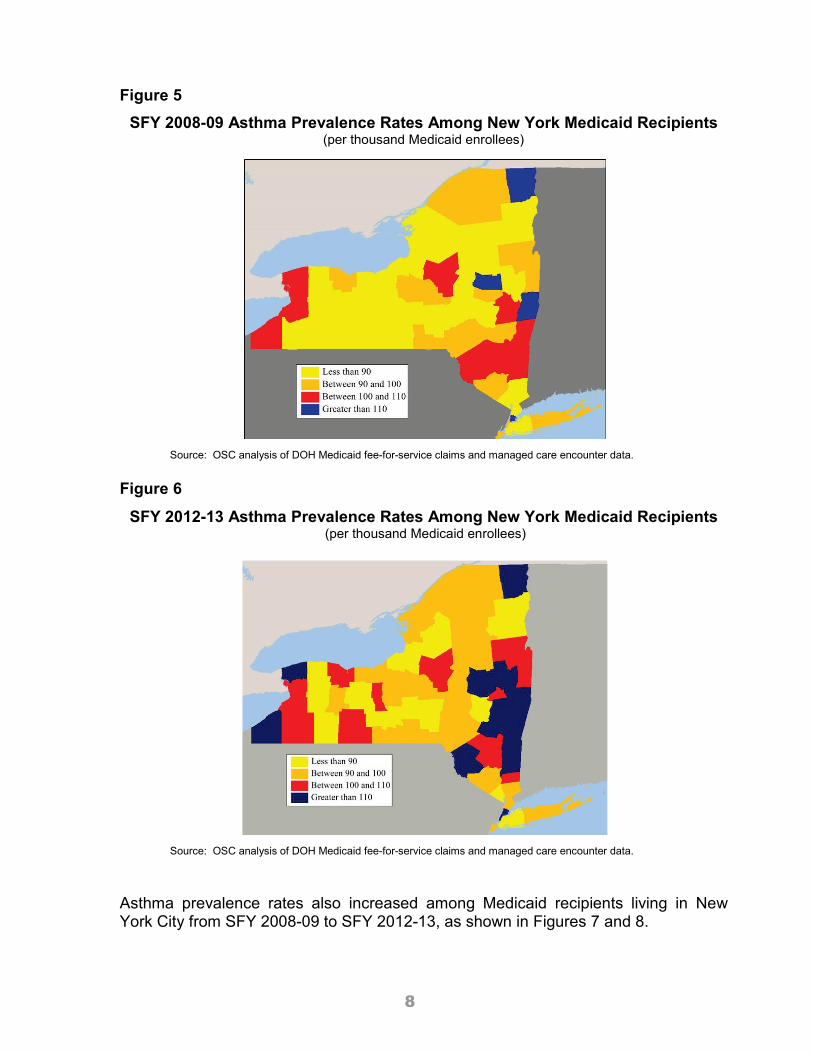
Source: OSC analysis of Medicaid fee-for-service claims and managed care encounter data from DOH. Note: Except for the Bronx, recipient counts and prevalence rates reflect Medicaid data corresponding to each county’s local social services district code; e.g., Albany County’s district code is 01, Allegany County’s district code is 02, etc. The Bronx’s recipient count and prevalence rate reflect Medicaid data for Bronx zip codes corresponding to local social services district code 66, which is the district code for the City of New York. The Bronx’s recipient count and prevalence rate also reflect Medicaid recipients living in Manhattan’s Marble Hill neighborhood assigned Bronx zip code 10463, but do not reflect Medicaid recipients living in the Bronx neighborhood of Riker’s Island assigned Queens zip code 11370. In SFY 2012-13, a total of 27 counties had Medicaid asthma prevalence rates above the statewide average of 98.7 recipients of asthma-related services per one thousand Medicaid enrollees. In addition to those listed in Figure 3, counties with above-average Medicaid asthma prevalence rates in SFY 2012-13 included Albany (111.0), Ulster (109.8), Erie (108.9), Monroe (103.8) and Oneida (100.7) counties. The counties with the lowest Medicaid asthma prevalence rates in SFY 2012-13 were Yates (67.5), Rockland (71.6) and Wyoming (74.9). Information on asthma prevalence in all New York counties appears in the Appendices to this report. The maps in Figures 5 and 6 depict increasing asthma prevalence rates among Medicaid recipients in many areas of the State from SFY 2008-09 to SFY 2012-13.19 Many counties with lower prevalence rates, shown in colors of yellow or light brown in SFY 2008-09, turn red or blue, indicating higher asthma prevalence rates, in SFY 2012-13.
19 Data used to generate statewide asthma prevalence rate maps for SFYs 2008-09 and 2012-13 do not reflect recipients whose Medicaid eligibility was with the State Office of Mental Health or the State Office for People With Developmental Disabilities.
Recipients Prevalence RateSchenectady 4,803 131.3Bronx 103,654 130.2Clinton 2,349 129.9Fulton 1,962 129.9Rensselaer 3,870 123.2Montgomery 1,757 118.5Columbia 1,339 115.0Sullivan 2,333 113.6Niagara 5,137 113.2Chautauqua 4,037 113.0Statewide 558,956 98.7
SFY 2012-13
8
Figure 5
SFY 2008-09 Asthma Prevalence Rates Among New York Medicaid Recipients (per thousand Medicaid enrollees)
Source: OSC analysis of DOH Medicaid fee-for-service claims and managed care encounter data. Figure 6
SFY 2012-13 Asthma Prevalence Rates Among New York Medicaid Recipients (per thousand Medicaid enrollees)
Source: OSC analysis of DOH Medicaid fee-for-service claims and managed care encounter data. Asthma prevalence rates also increased among Medicaid recipients living in New York City from SFY 2008-09 to SFY 2012-13, as shown in Figures 7 and 8.
9
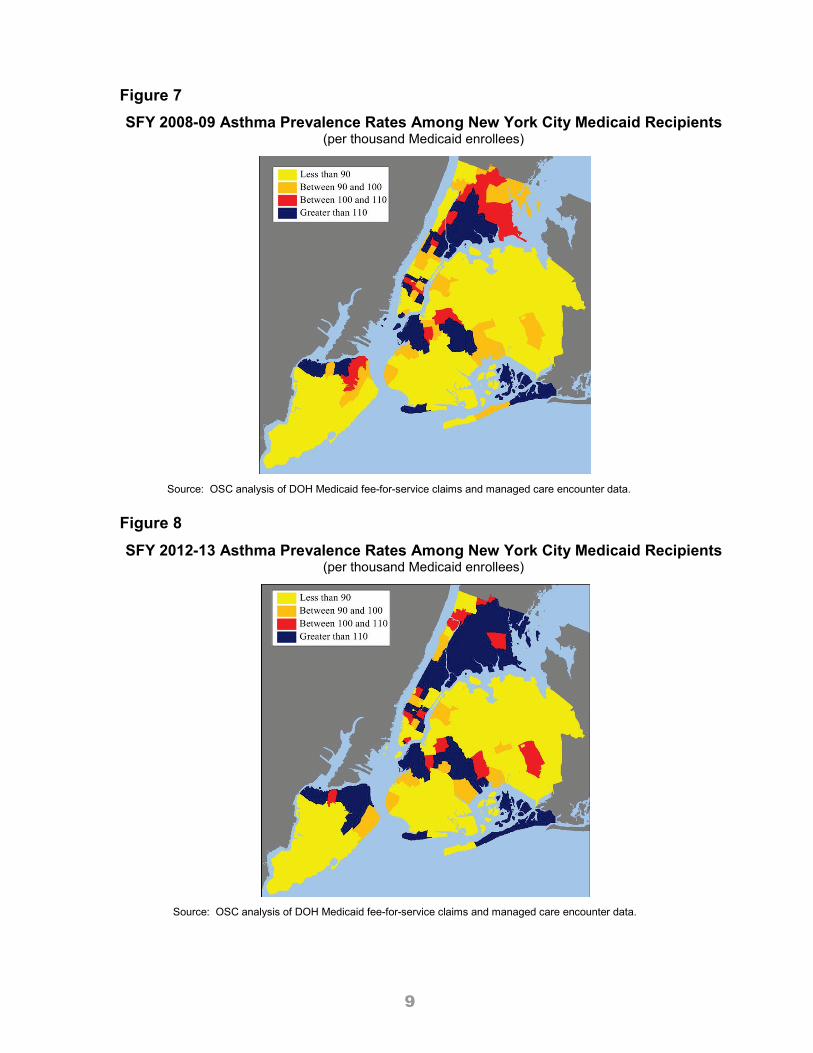
Figure 7
SFY 2008-09 Asthma Prevalence Rates Among New York City Medicaid Recipients (per thousand Medicaid enrollees)
Source: OSC analysis of DOH Medicaid fee-for-service claims and managed care encounter data. Figure 8
SFY 2012-13 Asthma Prevalence Rates Among New York City Medicaid Recipients (per thousand Medicaid enrollees)
Source: OSC analysis of DOH Medicaid fee-for-service claims and managed care encounter data.
10
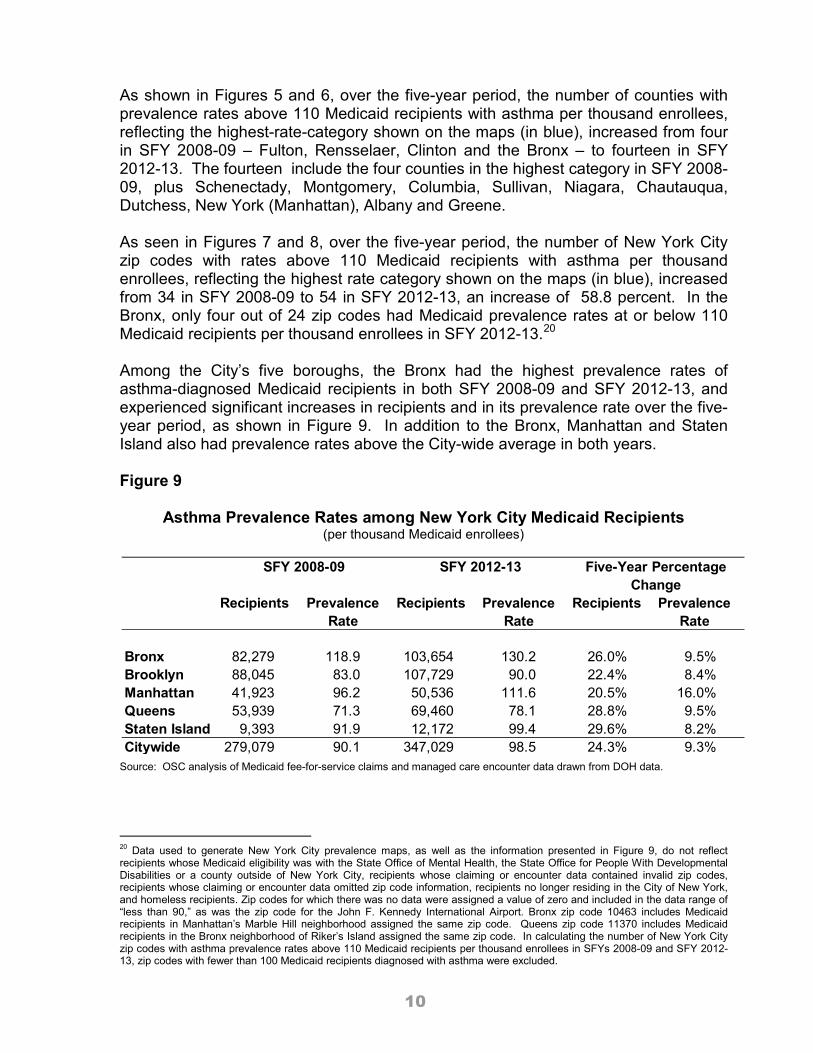
As shown in Figures 5 and 6, over the five-year period, the number of counties with prevalence rates above 110 Medicaid recipients with asthma per thousand enrollees, reflecting the highest-rate-category shown on the maps (in blue), increased from four in SFY 2008-09 – Fulton, Rensselaer, Clinton and the Bronx – to fourteen in SFY 2012-13. The fourteen include the four counties in the highest category in SFY 2008-09, plus Schenectady, Montgomery, Columbia, Sullivan, Niagara, Chautauqua, Dutchess, New York (Manhattan), Albany and Greene. As seen in Figures 7 and 8, over the five-year period, the number of New York City zip codes with rates above 110 Medicaid recipients with asthma per thousand enrollees, reflecting the highest rate category shown on the maps (in blue), increased from 34 in SFY 2008-09 to 54 in SFY 2012-13, an increase of 58.8 percent. In the Bronx, only four out of 24 zip codes had Medicaid prevalence rates at or below 110 Medicaid recipients per thousand enrollees in SFY 2012-13.20 Among the City’s five boroughs, the Bronx had the highest prevalence rates of asthma-diagnosed Medicaid recipients in both SFY 2008-09 and SFY 2012-13, and experienced significant increases in recipients and in its prevalence rate over the five-year period, as shown in Figure 9. In addition to the Bronx, Manhattan and Staten Island also had prevalence rates above the City-wide average in both years. Figure 9
Asthma Prevalence Rates among New York City Medicaid Recipients (per thousand Medicaid enrollees)
Source: OSC analysis of Medicaid fee-for-service claims and managed care encounter data drawn from DOH data.
20 Data used to generate New York City prevalence maps, as well as the information presented in Figure 9, do not reflect recipients whose Medicaid eligibility was with the State Office of Mental Health, the State Office for People With Developmental Disabilities or a county outside of New York City, recipients whose claiming or encounter data contained invalid zip codes, recipients whose claiming or encounter data omitted zip code information, recipients no longer residing in the City of New York, and homeless recipients. Zip codes for which there was no data were assigned a value of zero and included in the data range of “less than 90,” as was the zip code for the John F. Kennedy International Airport. Bronx zip code 10463 includes Medicaid recipients in Manhattan’s Marble Hill neighborhood assigned the same zip code. Queens zip code 11370 includes Medicaid recipients in the Bronx neighborhood of Riker’s Island assigned the same zip code. In calculating the number of New York City zip codes with asthma prevalence rates above 110 Medicaid recipients per thousand enrollees in SFYs 2008-09 and SFY 2012-13, zip codes with fewer than 100 Medicaid recipients diagnosed with asthma were excluded.
Recipients Prevalence Rate
Recipients Prevalence Rate
Recipients Prevalence Rate
Bronx 82,279 118.9 103,654 130.2 26.0% 9.5%Brooklyn 88,045 83.0 107,729 90.0 22.4% 8.4%Manhattan 41,923 96.2 50,536 111.6 20.5% 16.0%Queens 53,939 71.3 69,460 78.1 28.8% 9.5%Staten Island 9,393 91.9 12,172 99.4 29.6% 8.2%Citywide 279,079 90.1 347,029 98.5 24.3% 9.3%
SFY 2008-09 SFY 2012-13 Five-Year Percentage Change
11
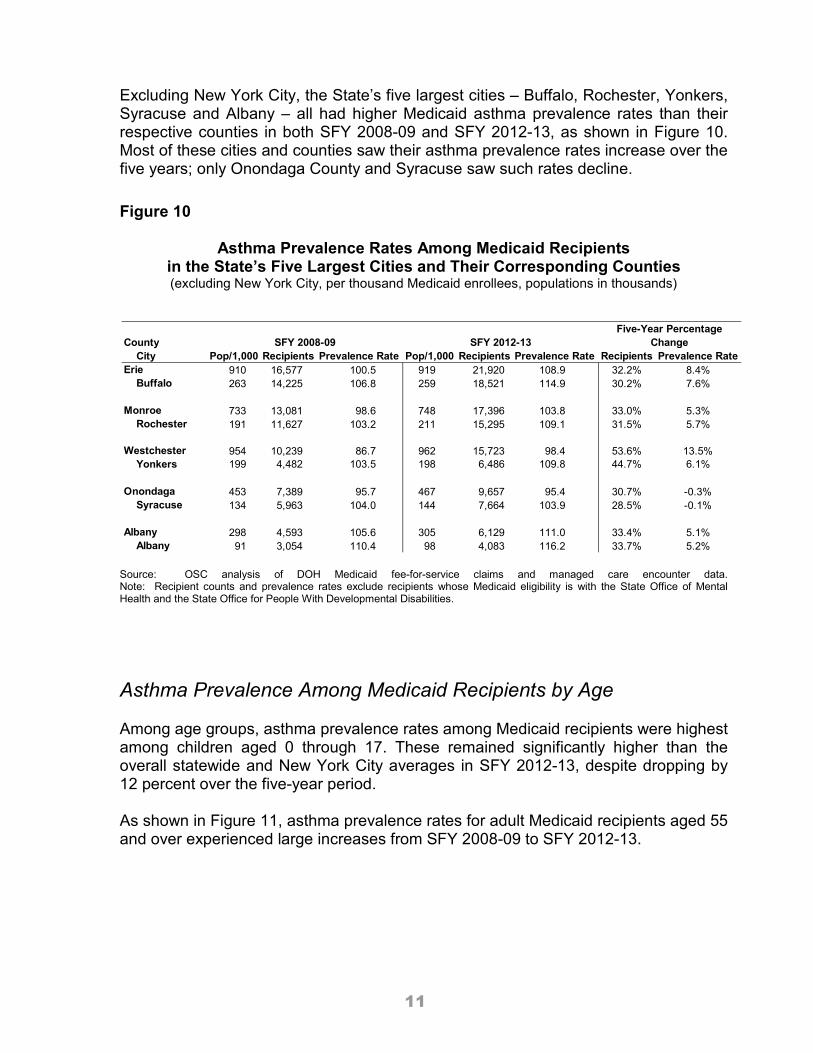
Excluding New York City, the State’s five largest cities – Buffalo, Rochester, Yonkers, Syracuse and Albany – all had higher Medicaid asthma prevalence rates than their respective counties in both SFY 2008-09 and SFY 2012-13, as shown in Figure 10. Most of these cities and counties saw their asthma prevalence rates increase over the five years; only Onondaga County and Syracuse saw such rates decline. Figure 10
Asthma Prevalence Rates Among Medicaid Recipients
in the State’s Five Largest Cities and Their Corresponding Counties (excluding New York City, per thousand Medicaid enrollees, populations in thousands)
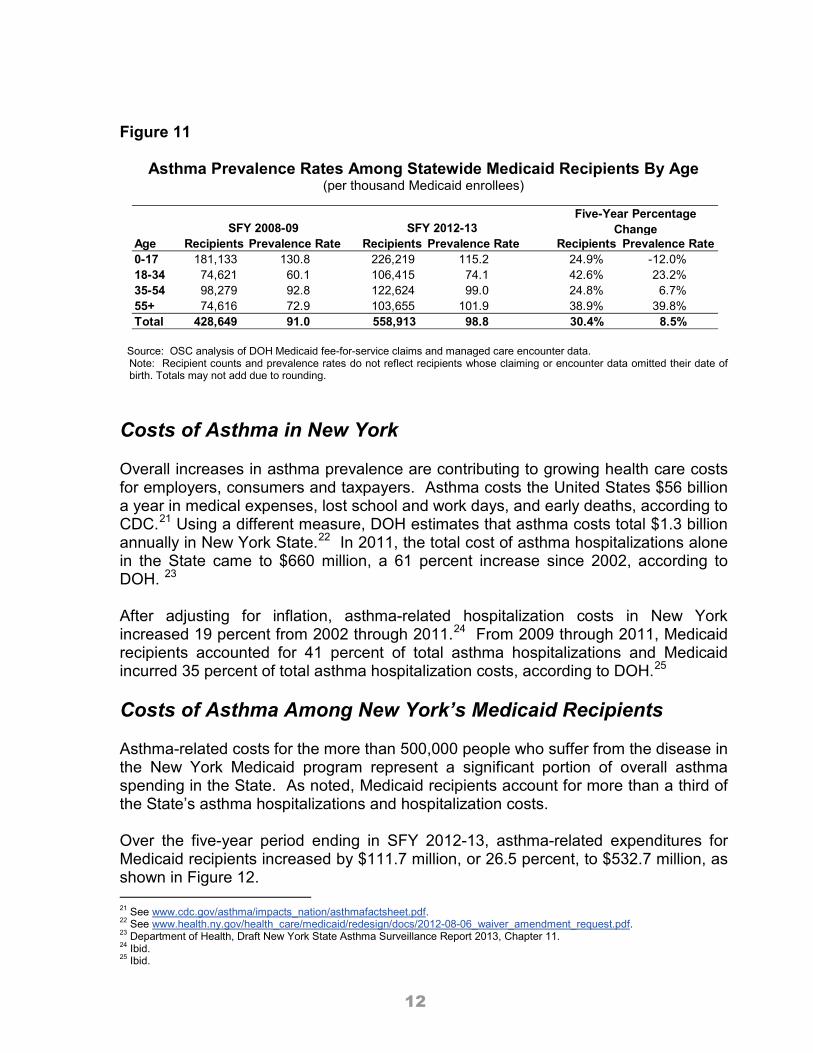
Source: OSC analysis of DOH Medicaid fee-for-service claims and managed care encounter data. Note: Recipient counts and prevalence rates exclude recipients whose Medicaid eligibility is with the State Office of Mental Health and the State Office for People With Developmental Disabilities. Asthma Prevalence Among Medicaid Recipients by Age Among age groups, asthma prevalence rates among Medicaid recipients were highest among children aged 0 through 17. These remained significantly higher than the overall statewide and New York City averages in SFY 2012-13, despite dropping by 12 percent over the five-year period. As shown in Figure 11, asthma prevalence rates for adult Medicaid recipients aged 55 and over experienced large increases from SFY 2008-09 to SFY 2012-13.
County City Pop/1,000 Recipients Prevalence Rate Pop/1,000 Recipients Prevalence Rate Recipients Prevalence RateErie 910 16,577 100.5 919 21,920 108.9 32.2% 8.4%
Buffalo 263 14,225 106.8 259 18,521 114.9 30.2% 7.6%
Monroe 733 13,081 98.6 748 17,396 103.8 33.0% 5.3%Rochester 191 11,627 103.2 211 15,295 109.1 31.5% 5.7%
Westchester 954 10,239 86.7 962 15,723 98.4 53.6% 13.5%Yonkers 199 4,482 103.5 198 6,486 109.8 44.7% 6.1%
Onondaga 453 7,389 95.7 467 9,657 95.4 30.7% -0.3%Syracuse 134 5,963 104.0 144 7,664 103.9 28.5% -0.1%
Albany 298 4,593 105.6 305 6,129 111.0 33.4% 5.1%Albany 91 3,054 110.4 98 4,083 116.2 33.7% 5.2%
SFY 2008-09 SFY 2012-13Five-Year Percentage
Change
12
Figure 11
Asthma Prevalence Rates Among Statewide Medicaid Recipients By Age
(per thousand Medicaid enrollees)
Source: OSC analysis of DOH Medicaid fee-for-service claims and managed care encounter data. Note: Recipient counts and prevalence rates do not reflect recipients whose claiming or encounter data omitted their date of birth. Totals may not add due to rounding.
Costs of Asthma in New York Overall increases in asthma prevalence are contributing to growing health care costs for employers, consumers and taxpayers. Asthma costs the United States $56 billion a year in medical expenses, lost school and work days, and early deaths, according to CDC.21 Using a different measure, DOH estimates that asthma costs total $1.3 billion annually in New York State.22 In 2011, the total cost of asthma hospitalizations alone in the State came to $660 million, a 61 percent increase since 2002, according to DOH. 23 After adjusting for inflation, asthma-related hospitalization costs in New York increased 19 percent from 2002 through 2011.24 From 2009 through 2011, Medicaid recipients accounted for 41 percent of total asthma hospitalizations and Medicaid incurred 35 percent of total asthma hospitalization costs, according to DOH.25 Costs of Asthma Among New York’s Medicaid Recipients Asthma-related costs for the more than 500,000 people who suffer from the disease in the New York Medicaid program represent a significant portion of overall asthma spending in the State. As noted, Medicaid recipients account for more than a third of the State’s asthma hospitalizations and hospitalization costs. Over the five-year period ending in SFY 2012-13, asthma-related expenditures for Medicaid recipients increased by $111.7 million, or 26.5 percent, to $532.7 million, as shown in Figure 12. 21 See www.cdc.gov/asthma/impacts_nation/asthmafactsheet.pdf. 22 See www.health.ny.gov/health_care/medicaid/redesign/docs/2012-08-06_waiver_amendment_request.pdf. 23 Department of Health, Draft New York State Asthma Surveillance Report 2013, Chapter 11. 24 Ibid. 25 Ibid.
Age Recipients Prevalence Rate Recipients Prevalence Rate Recipients Prevalence Rate0-17 181,133 130.8 226,219 115.2 24.9% -12.0%18-34 74,621 60.1 106,415 74.1 42.6% 23.2%35-54 98,279 92.8 122,624 99.0 24.8% 6.7%55+ 74,616 72.9 103,655 101.9 38.9% 39.8%Total 428,649 91.0 558,913 98.8 30.4% 8.5%
SFY 2008-09 SFY 2012-13Five-Year Percentage
Change
13
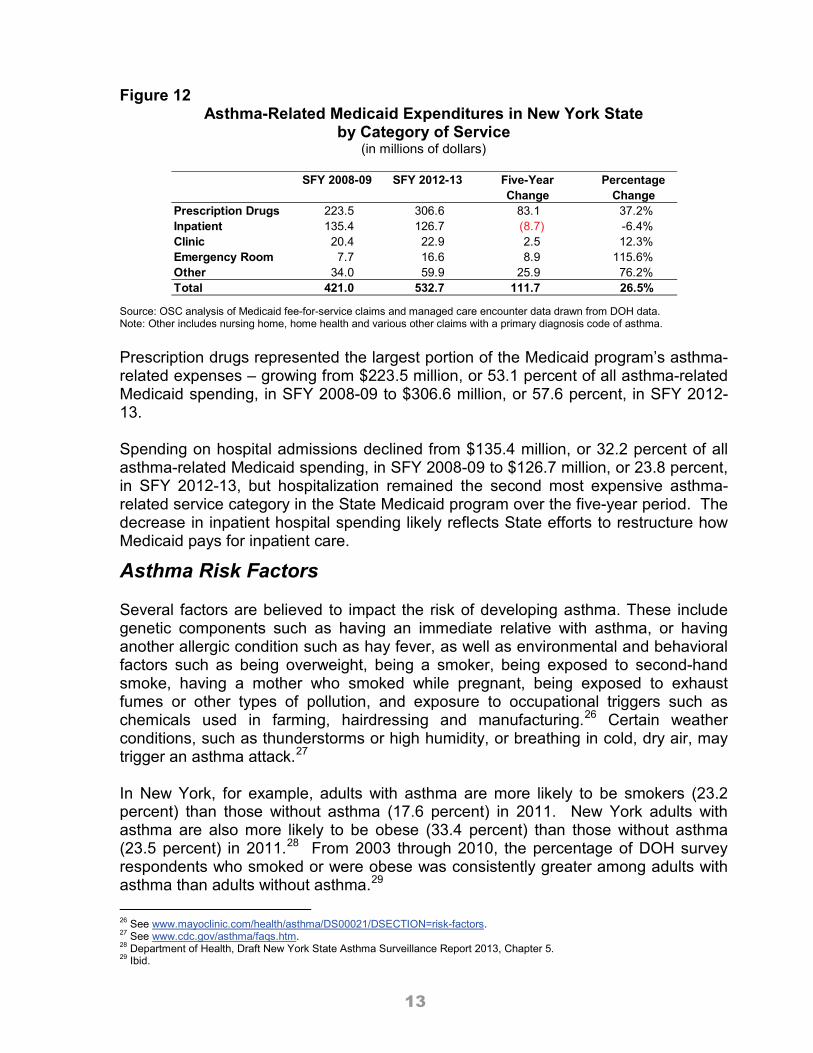
Figure 12 Asthma-Related Medicaid Expenditures in New York State
by Category of Service (in millions of dollars)
Source: OSC analysis of Medicaid fee-for-service claims and managed care encounter data drawn from DOH data. Note: Other includes nursing home, home health and various other claims with a primary diagnosis code of asthma. Prescription drugs represented the largest portion of the Medicaid program’s asthma-related expenses – growing from $223.5 million, or 53.1 percent of all asthma-related Medicaid spending, in SFY 2008-09 to $306.6 million, or 57.6 percent, in SFY 2012-13. Spending on hospital admissions declined from $135.4 million, or 32.2 percent of all asthma-related Medicaid spending, in SFY 2008-09 to $126.7 million, or 23.8 percent, in SFY 2012-13, but hospitalization remained the second most expensive asthma-related service category in the State Medicaid program over the five-year period. The decrease in inpatient hospital spending likely reflects State efforts to restructure how Medicaid pays for inpatient care.
Asthma Risk Factors Several factors are believed to impact the risk of developing asthma. These include genetic components such as having an immediate relative with asthma, or having another allergic condition such as hay fever, as well as environmental and behavioral factors such as being overweight, being a smoker, being exposed to second-hand smoke, having a mother who smoked while pregnant, being exposed to exhaust fumes or other types of pollution, and exposure to occupational triggers such as chemicals used in farming, hairdressing and manufacturing.26 Certain weather conditions, such as thunderstorms or high humidity, or breathing in cold, dry air, may trigger an asthma attack.27 In New York, for example, adults with asthma are more likely to be smokers (23.2 percent) than those without asthma (17.6 percent) in 2011. New York adults with asthma are also more likely to be obese (33.4 percent) than those without asthma (23.5 percent) in 2011.28 From 2003 through 2010, the percentage of DOH survey respondents who smoked or were obese was consistently greater among adults with asthma than adults without asthma.29 26 See www.mayoclinic.com/health/asthma/DS00021/DSECTION=risk-factors. 27 See www.cdc.gov/asthma/faqs.htm. 28 Department of Health, Draft New York State Asthma Surveillance Report 2013, Chapter 5. 29 Ibid.
SFY 2008-09 SFY 2012-13 Five-Year Change
Percentage Change
Prescription Drugs 223.5 306.6 83.1 37.2%Inpatient 135.4 126.7 (8.7) -6.4%Clinic 20.4 22.9 2.5 12.3%Emergency Room 7.7 16.6 8.9 115.6%Other 34.0 59.9 25.9 76.2%Total 421.0 532.7 111.7 26.5%
14
New York State’s Response to Asthma There is no known cure for asthma.30 However, important tools and strategies can help the approximately 1.7 million New York children and adults with asthma manage their symptoms and minimize serious health risks. On a personal level, the CDC says every person with asthma needs to have an asthma action plan, developed in consultation with a doctor, which lists all medications along with instructions on when they should be taken.31 The CDC says the plan should also describe how to achieve long-term control, how to handle asthma attacks, and when to call a doctor or go to the emergency room.32 The CDC’s national asthma control program, created in 1999, is an important part of the national effort to minimize the impact of the disease in the United States. Under this program, New York, 33 other states, the District of Columbia and Puerto Rico receive federal funding to support asthma surveillance systems, improve asthma management in schools, evaluate programs to identify and share best practices, and target interventions to populations and communities disproportionately affected by asthma.33 New York has taken additional steps to address the rising frequency of asthma in the State. Such steps include providing Medicaid access to a broad range of services such as medications and prescription drugs, nebulizers, self-management education, doctor visits and hospital care.34 The State also provides: asthma care and management for children at school-based health centers; technical assistance to local health departments, hospitals, regional asthma coalitions and other partners on evidence-based interventions and program monitoring and evaluation; and in-home assessments and interventions for asthma in selected communities throughout the State.35 Effective programs to control asthma can reduce New York’s Medicaid expenditures and significantly improve the public health. DOH’s new five-year plan to improve the health and quality of life of all New Yorkers – Prevention Agenda 2013-17: New York State’s Health Improvement Plan – promotes the use of evidence-based care to reduce asthma emergency room visits and hospitalizations, and increase the dispensing of appropriate asthma control medications for persons with persistent asthma.36 In addition, in February 2014, DOH received federal approval of the State’s Medicaid Redesign Team (MRT) waiver amendment application, the most recent description of which included two asthma-related proposals to:
30 See www.cdc.gov/asthma/impacts_nation/asthmafactsheet.pdf. 31 See www.ct.gov/dph/cwp/view.asp?a=3137&q=397020. 32 See www.cdc.gov/asthma/actionplan.html. 33 See www.cdc.gov/asthma/pdfs/investment_americas_health.pdf. 34 See www.health.ny.gov/statistics/ny_asthma/pdf/2009_asthma_surveillance_summary_report.pdf#page=1. 35 See www.health.ny.gov/statistics/ny_asthma/pdf/2009_asthma_surveillance_summary_report.pdf#page=1. 36 See www.health.ny.gov/prevention/prevention_agenda/2013-2017/plan/chronic_diseases/focus_area_3.htm#sector.
15
1. Expand the State’s Medicaid home-based asthma assessment and education program. Under this program, health care providers are required to partner with home care or other community-based programs to reduce avoidable hospitalizations by abating home environmental triggers such as second-hand smoke, mold and dust mites, encouraging appropriate use of asthma medications, and following up on emergency room or hospital visits to help Medicaid recipients and their families avoid future visits.37
2. Reduce childhood exposure to asthma triggers by enlisting health care providers and health plans to refer at-risk children to home evaluation services. Under this initiative, trained nursing and public health staff will arrange home visits to assess the need for hazard control within the home and help with any landlord issues or need for relocation.38
Details of the pending agreement between the State and CMS on the Medicaid asthma initiatives are not final, but the waiver amendment application DOH submitted to CMS in 2012 proposed to provide home-based asthma prevention and treatment services to about 10,000 Medicaid recipients a year. Such services are expected to cost about $6.5 million and generate $19.5 million in annual Medicaid savings by improving asthma control, promoting health and preventing avoidable emergency room visits and hospital admissions.39 The most recent description of DOH’s Medicaid asthma initiatives, included in waiver amendment documents submitted to CMS in January 2014, does not indicate how many Medicaid recipients would benefit from the State’s asthma initiatives, or the Medicaid-related costs and savings associated with them. State and local policymakers in New York, as well as various advocacy groups, support next steps in combating asthma that include: additional school-based programs to make children and their parents more aware of asthma triggers and the precursors to asthma attacks; further training for school nurses who are often on the front lines of addressing student asthma; mold remediation programs in public and private housing; and greater asthma self-management education among children and adults. Despite reductions in deaths and hospitalizations from the disease, overall asthma rates in New York remain a concern. Approximately one in fourteen children and one in ten adults, including over 500,000 Medicaid recipients, suffer from the disease. Asthma is a major public health problem with both human and economic costs. The CDC data and OSC’s analysis of asthma-related Medicaid expenditures present interpretive challenges while also suggesting promising avenues for research. DOH needs to work with academic experts, health-care providers and others to gain a better understanding of trends in asthma prevalence for adults and children, and within different communities, to ensure that initiatives to address the disease are targeted as effectively as possible.
37 See www.health.ny.gov/health_care/medicaid/redesign/docs/ny_mrt_dsrip_reducing_avoid_hosp_use.pdf. 38 See www.health.ny.gov/health_care/medicaid/redesign/docs/ny_mrt_dsrip_reducing_avoid_hosp_use.pdf. 39 See www.health.ny.gov/health_care/medicaid/redesign/docs/2012-08-06_waiver_amendment_request.pdf.
16
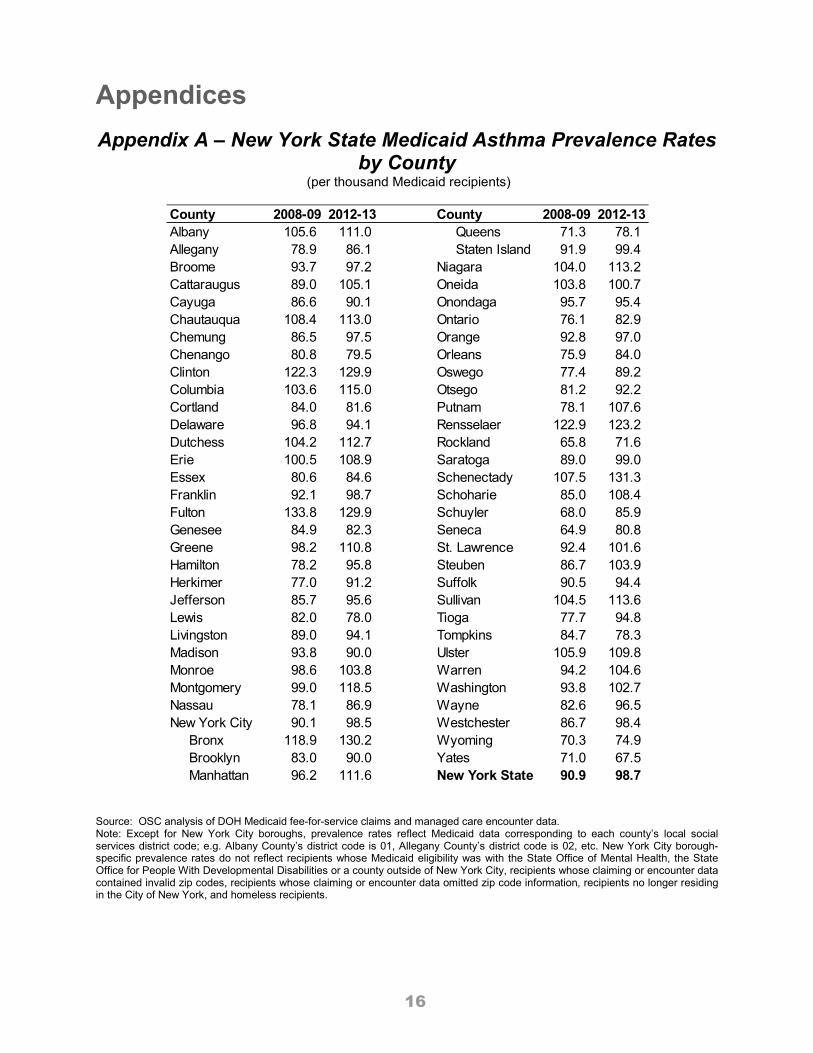
Appendices Appendix A – New York State Medicaid Asthma Prevalence Rates
by County (per thousand Medicaid recipients)
Source: OSC analysis of DOH Medicaid fee-for-service claims and managed care encounter data. Note: Except for New York City boroughs, prevalence rates reflect Medicaid data corresponding to each county’s local social services district code; e.g. Albany County’s district code is 01, Allegany County’s district code is 02, etc. New York City borough-specific prevalence rates do not reflect recipients whose Medicaid eligibility was with the State Office of Mental Health, the State Office for People With Developmental Disabilities or a county outside of New York City, recipients whose claiming or encounter data contained invalid zip codes, recipients whose claiming or encounter data omitted zip code information, recipients no longer residing in the City of New York, and homeless recipients.
County 2008-09 2012-13 County 2008-09 2012-13Albany 105.6 111.0 Queens 71.3 78.1Allegany 78.9 86.1 Staten Island 91.9 99.4Broome 93.7 97.2 Niagara 104.0 113.2Cattaraugus 89.0 105.1 Oneida 103.8 100.7Cayuga 86.6 90.1 Onondaga 95.7 95.4Chautauqua 108.4 113.0 Ontario 76.1 82.9Chemung 86.5 97.5 Orange 92.8 97.0Chenango 80.8 79.5 Orleans 75.9 84.0Clinton 122.3 129.9 Oswego 77.4 89.2Columbia 103.6 115.0 Otsego 81.2 92.2Cortland 84.0 81.6 Putnam 78.1 107.6Delaware 96.8 94.1 Rensselaer 122.9 123.2Dutchess 104.2 112.7 Rockland 65.8 71.6Erie 100.5 108.9 Saratoga 89.0 99.0Essex 80.6 84.6 Schenectady 107.5 131.3Franklin 92.1 98.7 Schoharie 85.0 108.4Fulton 133.8 129.9 Schuyler 68.0 85.9Genesee 84.9 82.3 Seneca 64.9 80.8Greene 98.2 110.8 St. Lawrence 92.4 101.6Hamilton 78.2 95.8 Steuben 86.7 103.9Herkimer 77.0 91.2 Suffolk 90.5 94.4Jefferson 85.7 95.6 Sullivan 104.5 113.6Lewis 82.0 78.0 Tioga 77.7 94.8Livingston 89.0 94.1 Tompkins 84.7 78.3Madison 93.8 90.0 Ulster 105.9 109.8Monroe 98.6 103.8 Warren 94.2 104.6Montgomery 99.0 118.5 Washington 93.8 102.7Nassau 78.1 86.9 Wayne 82.6 96.5New York City 90.1 98.5 Westchester 86.7 98.4
Bronx 118.9 130.2 Wyoming 70.3 74.9Brooklyn 83.0 90.0 Yates 71.0 67.5Manhattan 96.2 111.6 New York State 90.9 98.7
17
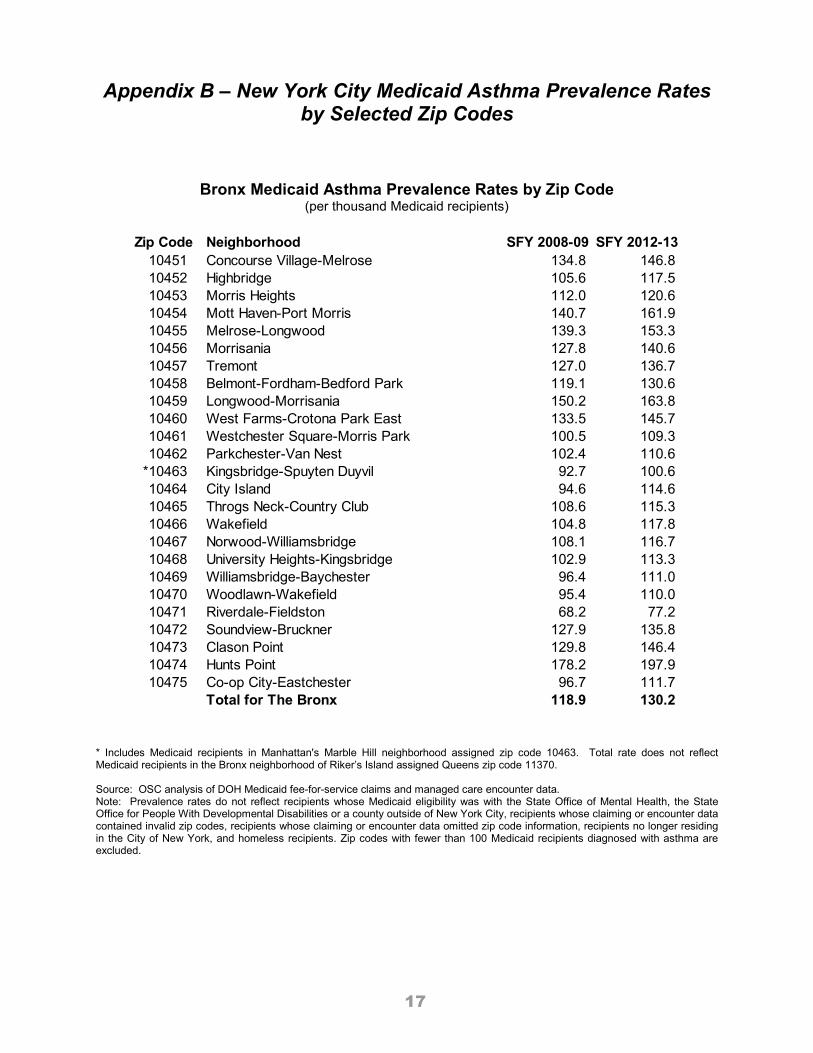
Appendix B – New York City Medicaid Asthma Prevalence Rates by Selected Zip Codes
Bronx Medicaid Asthma Prevalence Rates by Zip Code (per thousand Medicaid recipients)
* Includes Medicaid recipients in Manhattan's Marble Hill neighborhood assigned zip code 10463. Total rate does not reflect Medicaid recipients in the Bronx neighborhood of Riker’s Island assigned Queens zip code 11370. Source: OSC analysis of DOH Medicaid fee-for-service claims and managed care encounter data. Note: Prevalence rates do not reflect recipients whose Medicaid eligibility was with the State Office of Mental Health, the State Office for People With Developmental Disabilities or a county outside of New York City, recipients whose claiming or encounter data contained invalid zip codes, recipients whose claiming or encounter data omitted zip code information, recipients no longer residing in the City of New York, and homeless recipients. Zip codes with fewer than 100 Medicaid recipients diagnosed with asthma are excluded.
Zip Code Neighborhood SFY 2008-09 SFY 2012-1310451 Concourse Village-Melrose 134.8 146.810452 Highbridge 105.6 117.510453 Morris Heights 112.0 120.610454 Mott Haven-Port Morris 140.7 161.910455 Melrose-Longwood 139.3 153.310456 Morrisania 127.8 140.610457 Tremont 127.0 136.710458 Belmont-Fordham-Bedford Park 119.1 130.610459 Longwood-Morrisania 150.2 163.810460 West Farms-Crotona Park East 133.5 145.710461 Westchester Square-Morris Park 100.5 109.310462 Parkchester-Van Nest 102.4 110.6
*10463 Kingsbridge-Spuyten Duyvil 92.7 100.610464 City Island 94.6 114.610465 Throgs Neck-Country Club 108.6 115.310466 Wakefield 104.8 117.810467 Norwood-Williamsbridge 108.1 116.710468 University Heights-Kingsbridge 102.9 113.310469 Williamsbridge-Baychester 96.4 111.010470 Woodlawn-Wakefield 95.4 110.010471 Riverdale-Fieldston 68.2 77.210472 Soundview-Bruckner 127.9 135.810473 Clason Point 129.8 146.410474 Hunts Point 178.2 197.910475 Co-op City-Eastchester 96.7 111.7
Total for The Bronx 118.9 130.2
18
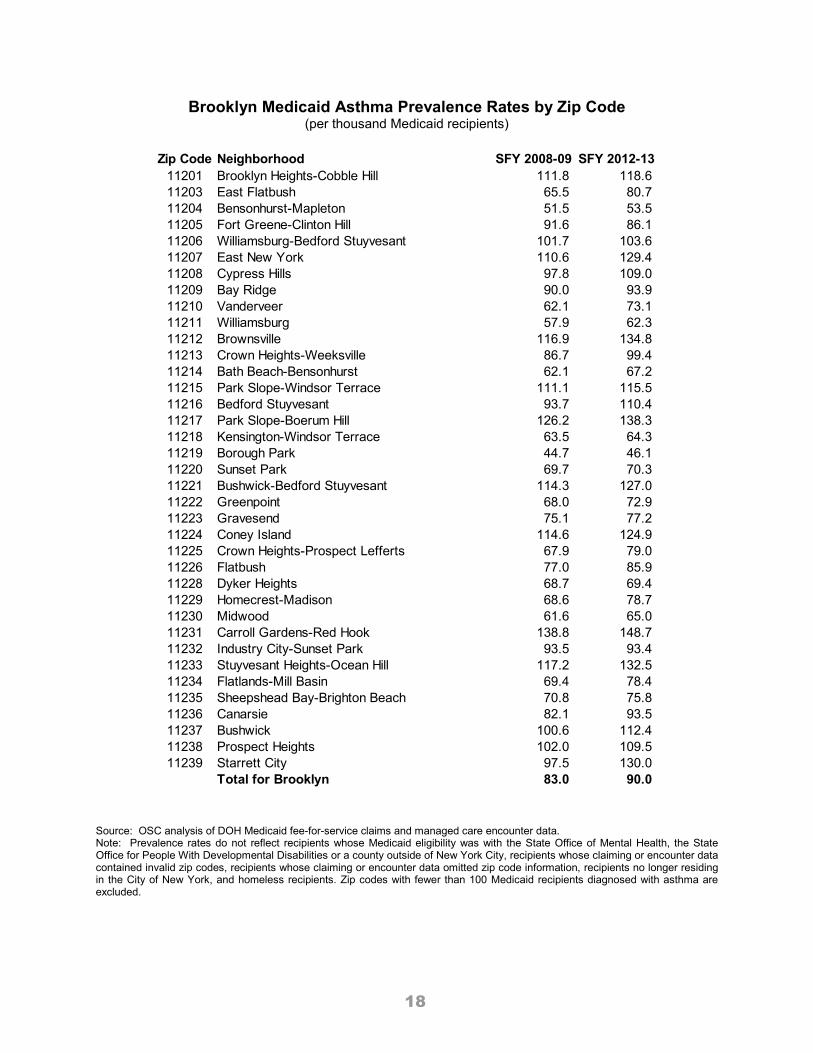
Brooklyn Medicaid Asthma Prevalence Rates by Zip Code
(per thousand Medicaid recipients)
Source: OSC analysis of DOH Medicaid fee-for-service claims and managed care encounter data. Note: Prevalence rates do not reflect recipients whose Medicaid eligibility was with the State Office of Mental Health, the State Office for People With Developmental Disabilities or a county outside of New York City, recipients whose claiming or encounter data contained invalid zip codes, recipients whose claiming or encounter data omitted zip code information, recipients no longer residing in the City of New York, and homeless recipients. Zip codes with fewer than 100 Medicaid recipients diagnosed with asthma are excluded.
Zip Code Neighborhood SFY 2008-09 SFY 2012-1311201 Brooklyn Heights-Cobble Hill 111.8 118.611203 East Flatbush 65.5 80.711204 Bensonhurst-Mapleton 51.5 53.511205 Fort Greene-Clinton Hill 91.6 86.111206 Williamsburg-Bedford Stuyvesant 101.7 103.611207 East New York 110.6 129.411208 Cypress Hills 97.8 109.011209 Bay Ridge 90.0 93.911210 Vanderveer 62.1 73.111211 Williamsburg 57.9 62.311212 Brownsville 116.9 134.811213 Crown Heights-Weeksville 86.7 99.411214 Bath Beach-Bensonhurst 62.1 67.211215 Park Slope-Windsor Terrace 111.1 115.511216 Bedford Stuyvesant 93.7 110.411217 Park Slope-Boerum Hill 126.2 138.311218 Kensington-Windsor Terrace 63.5 64.311219 Borough Park 44.7 46.111220 Sunset Park 69.7 70.311221 Bushwick-Bedford Stuyvesant 114.3 127.011222 Greenpoint 68.0 72.911223 Gravesend 75.1 77.211224 Coney Island 114.6 124.911225 Crown Heights-Prospect Lefferts 67.9 79.011226 Flatbush 77.0 85.911228 Dyker Heights 68.7 69.411229 Homecrest-Madison 68.6 78.711230 Midwood 61.6 65.011231 Carroll Gardens-Red Hook 138.8 148.711232 Industry City-Sunset Park 93.5 93.411233 Stuyvesant Heights-Ocean Hill 117.2 132.511234 Flatlands-Mill Basin 69.4 78.411235 Sheepshead Bay-Brighton Beach 70.8 75.811236 Canarsie 82.1 93.511237 Bushwick 100.6 112.411238 Prospect Heights 102.0 109.511239 Starrett City 97.5 130.0
Total for Brooklyn 83.0 90.0
19
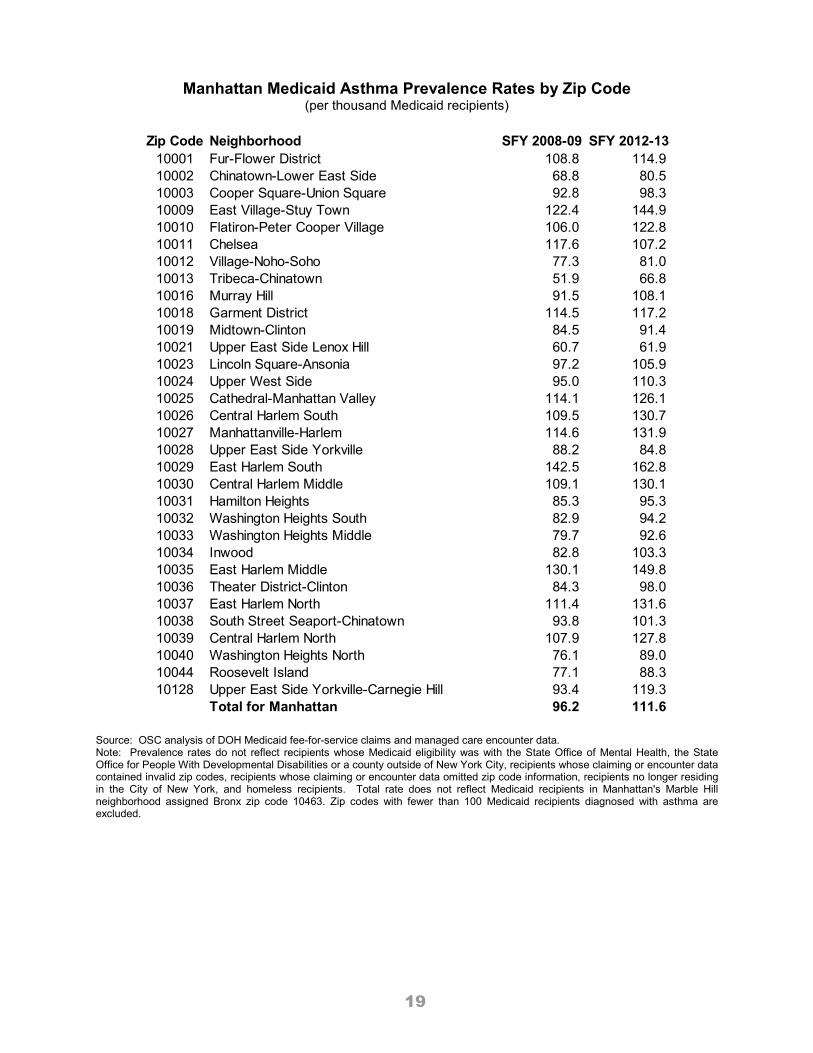
Manhattan Medicaid Asthma Prevalence Rates by Zip Code (per thousand Medicaid recipients)
Source: OSC analysis of DOH Medicaid fee-for-service claims and managed care encounter data. Note: Prevalence rates do not reflect recipients whose Medicaid eligibility was with the State Office of Mental Health, the State Office for People With Developmental Disabilities or a county outside of New York City, recipients whose claiming or encounter data contained invalid zip codes, recipients whose claiming or encounter data omitted zip code information, recipients no longer residing in the City of New York, and homeless recipients. Total rate does not reflect Medicaid recipients in Manhattan's Marble Hill neighborhood assigned Bronx zip code 10463. Zip codes with fewer than 100 Medicaid recipients diagnosed with asthma are excluded.
Zip Code Neighborhood SFY 2008-09 SFY 2012-1310001 Fur-Flower District 108.8 114.910002 Chinatown-Lower East Side 68.8 80.510003 Cooper Square-Union Square 92.8 98.310009 East Village-Stuy Town 122.4 144.910010 Flatiron-Peter Cooper Village 106.0 122.810011 Chelsea 117.6 107.210012 Village-Noho-Soho 77.3 81.010013 Tribeca-Chinatown 51.9 66.810016 Murray Hill 91.5 108.110018 Garment District 114.5 117.210019 Midtown-Clinton 84.5 91.410021 Upper East Side Lenox Hill 60.7 61.910023 Lincoln Square-Ansonia 97.2 105.910024 Upper West Side 95.0 110.310025 Cathedral-Manhattan Valley 114.1 126.110026 Central Harlem South 109.5 130.710027 Manhattanville-Harlem 114.6 131.910028 Upper East Side Yorkville 88.2 84.810029 East Harlem South 142.5 162.810030 Central Harlem Middle 109.1 130.110031 Hamilton Heights 85.3 95.310032 Washington Heights South 82.9 94.210033 Washington Heights Middle 79.7 92.610034 Inwood 82.8 103.310035 East Harlem Middle 130.1 149.810036 Theater District-Clinton 84.3 98.010037 East Harlem North 111.4 131.610038 South Street Seaport-Chinatown 93.8 101.310039 Central Harlem North 107.9 127.810040 Washington Heights North 76.1 89.010044 Roosevelt Island 77.1 88.310128 Upper East Side Yorkville-Carnegie Hill 93.4 119.3
Total for Manhattan 96.2 111.6
20
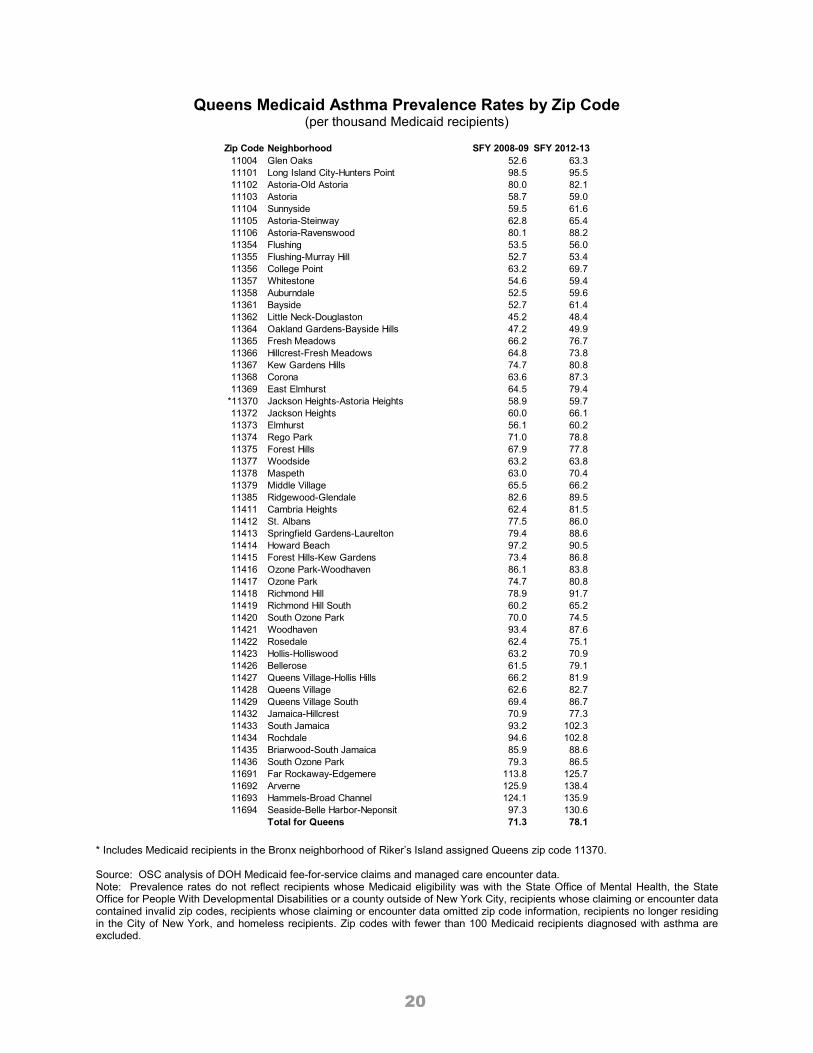
Queens Medicaid Asthma Prevalence Rates by Zip Code (per thousand Medicaid recipients)
* Includes Medicaid recipients in the Bronx neighborhood of Riker’s Island assigned Queens zip code 11370. Source: OSC analysis of DOH Medicaid fee-for-service claims and managed care encounter data. Note: Prevalence rates do not reflect recipients whose Medicaid eligibility was with the State Office of Mental Health, the State Office for People With Developmental Disabilities or a county outside of New York City, recipients whose claiming or encounter data contained invalid zip codes, recipients whose claiming or encounter data omitted zip code information, recipients no longer residing in the City of New York, and homeless recipients. Zip codes with fewer than 100 Medicaid recipients diagnosed with asthma are excluded.
Zip Code Neighborhood SFY 2008-09 SFY 2012-1311004 Glen Oaks 52.6 63.311101 Long Island City-Hunters Point 98.5 95.511102 Astoria-Old Astoria 80.0 82.111103 Astoria 58.7 59.011104 Sunnyside 59.5 61.611105 Astoria-Steinway 62.8 65.411106 Astoria-Ravenswood 80.1 88.211354 Flushing 53.5 56.011355 Flushing-Murray Hill 52.7 53.411356 College Point 63.2 69.711357 Whitestone 54.6 59.411358 Auburndale 52.5 59.611361 Bayside 52.7 61.411362 Little Neck-Douglaston 45.2 48.411364 Oakland Gardens-Bayside Hills 47.2 49.911365 Fresh Meadows 66.2 76.711366 Hillcrest-Fresh Meadows 64.8 73.811367 Kew Gardens Hills 74.7 80.811368 Corona 63.6 87.311369 East Elmhurst 64.5 79.4
*11370 Jackson Heights-Astoria Heights 58.9 59.711372 Jackson Heights 60.0 66.111373 Elmhurst 56.1 60.211374 Rego Park 71.0 78.811375 Forest Hills 67.9 77.811377 Woodside 63.2 63.811378 Maspeth 63.0 70.411379 Middle Village 65.5 66.211385 Ridgewood-Glendale 82.6 89.511411 Cambria Heights 62.4 81.511412 St. Albans 77.5 86.011413 Springfield Gardens-Laurelton 79.4 88.611414 Howard Beach 97.2 90.511415 Forest Hills-Kew Gardens 73.4 86.811416 Ozone Park-Woodhaven 86.1 83.811417 Ozone Park 74.7 80.811418 Richmond Hill 78.9 91.711419 Richmond Hill South 60.2 65.211420 South Ozone Park 70.0 74.511421 Woodhaven 93.4 87.611422 Rosedale 62.4 75.111423 Hollis-Holliswood 63.2 70.911426 Bellerose 61.5 79.111427 Queens Village-Hollis Hills 66.2 81.911428 Queens Village 62.6 82.711429 Queens Village South 69.4 86.711432 Jamaica-Hillcrest 70.9 77.311433 South Jamaica 93.2 102.311434 Rochdale 94.6 102.811435 Briarwood-South Jamaica 85.9 88.611436 South Ozone Park 79.3 86.511691 Far Rockaway-Edgemere 113.8 125.711692 Arverne 125.9 138.411693 Hammels-Broad Channel 124.1 135.911694 Seaside-Belle Harbor-Neponsit 97.3 130.6
Total for Queens 71.3 78.1
21
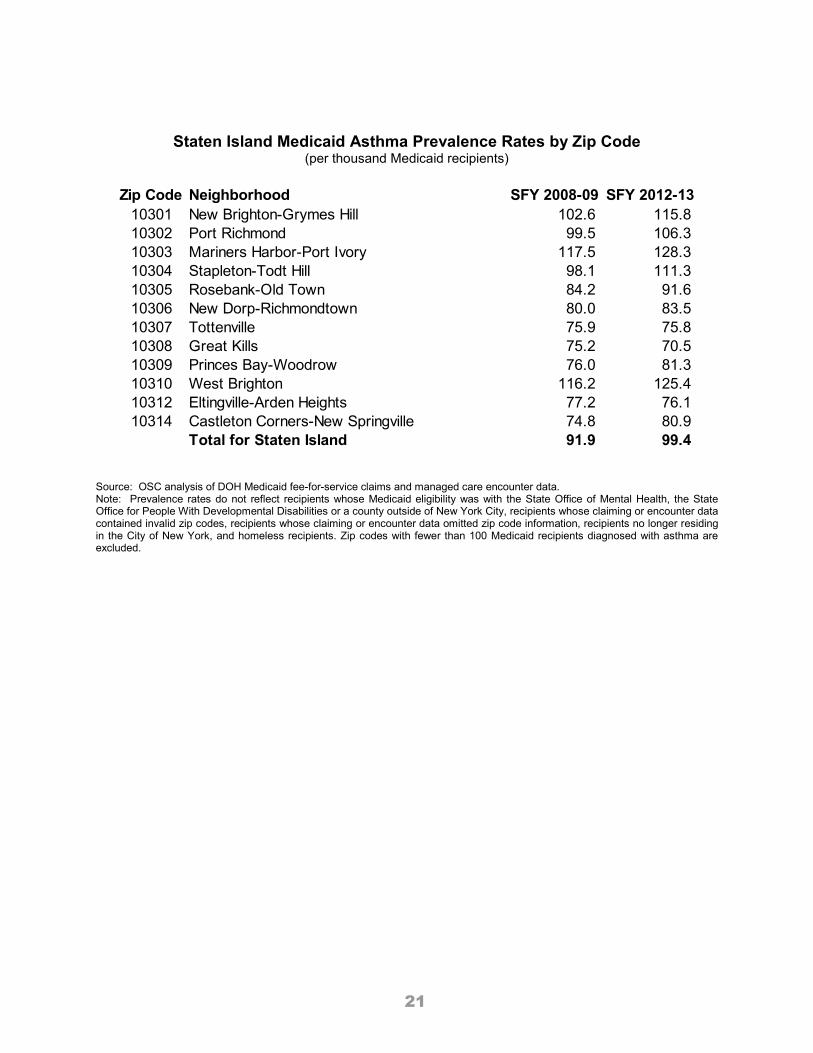
Staten Island Medicaid Asthma Prevalence Rates by Zip Code (per thousand Medicaid recipients)
Source: OSC analysis of DOH Medicaid fee-for-service claims and managed care encounter data. Note: Prevalence rates do not reflect recipients whose Medicaid eligibility was with the State Office of Mental Health, the State Office for People With Developmental Disabilities or a county outside of New York City, recipients whose claiming or encounter data contained invalid zip codes, recipients whose claiming or encounter data omitted zip code information, recipients no longer residing in the City of New York, and homeless recipients. Zip codes with fewer than 100 Medicaid recipients diagnosed with asthma are excluded.
Zip Code Neighborhood SFY 2008-09 SFY 2012-1310301 New Brighton-Grymes Hill 102.6 115.810302 Port Richmond 99.5 106.310303 Mariners Harbor-Port Ivory 117.5 128.310304 Stapleton-Todt Hill 98.1 111.310305 Rosebank-Old Town 84.2 91.610306 New Dorp-Richmondtown 80.0 83.510307 Tottenville 75.9 75.810308 Great Kills 75.2 70.510309 Princes Bay-Woodrow 76.0 81.310310 West Brighton 116.2 125.410312 Eltingville-Arden Heights 77.2 76.110314 Castleton Corners-New Springville 74.8 80.9
Total for Staten Island 91.9 99.4