Embed Size (px)
Citation preview
The Prevalence and Nature of Arrest-Related Deaths in the United States
A Content Analysis of Fatal Police-Citizen Encounters, 2005-2006
by
Andrea Borrego
A Dissertation Presented in Partial Fulfillment of the Requirements for the Degree
Doctor of Philosophy
Approved July 2015 by the Graduate Supervisory Committee:
Michael White, Chair
Danielle Wallace Cody Telep
ARIZONA STATE UNIVERSITY
December 2015
i
ABSTRACT
Recent events in places such as Ferguson, Missouri, and Baltimore, Maryland,
have focused the public's attention on citizen deaths during arrest encounters with
officers in police departments across the United States. Riots and protests have broken
out across the nation and resulted in a recent President's Task Force on 21st Century
Policing to address some of these major issues. Arrest-related deaths (ARDs), however,
are not a new phenomenon and have long generated controversy among the public.
Despite the reoccurring nature of ARDs, no publicly available, central national registry of
ARDs exists to allow for an in-depth analysis of such cases, as well as the development
of training and policies to decrease police and citizen harms. In an effort to fill this gap,
the current study conducts a retrospective, open-source, web-based search of media
reports to explore the prevalence and nature of all types of ARDs that occurred through
the United States in 2005 and 2006. The purpose of the study is to investigate ARDs, but
to also assess the reliability of media reports as a source of data. The study finds that
media reports are not adequate for identifying the prevalence of ARDs, but are useful
when investigating circumstances surrounding deadly police-citizen encounters to an
extent.

ii
ACKNOWLEDGMENTS
I am very grateful to my committee who have mentored and supported me
through the dissertation process and doctoral program. I wish to individually thank
Michael White who has guided me throughout my whole graduate career and provided
me with opportunities for learning and growth. I would also like to thank Danielle
Wallace and Cody Telep for their insight, comments, and wisdom along this journey.
Without them I would not be where I am today. I also wish to thank the three research
assistants, Kyle Kowalski, Stephanie Espinoza, and Amber Fogel, who spent countless
hours coding media reports. Lastly, I am grateful to my mom, dad, and sister for always
encouraging me along the way and to my fellow colleagues in the program, Jillian
Turanovic, Clair White, Natalie Ortiz, and Mario Cano for their constant support and
advice on how to roll with the changes throughout our graduate school endeavor. I
dedicate all of my work and accomplishments to my wonderful Fitzgerald who made sure
I always kept pushing on.
iii
TABLE OF CONTENTS
Page
LIST OF TABLES .................................................................................................................. v
LIST OF FIGURES ............................................................................................................... vi
CHAPTER
1 INTRODUCTION ................. .................................................................................... 1
Problem and Purpose ............................................................................... 7
2 BACKGROUND ..................................................................................................... 12
Authority for the Use of Force ............................................................... 12
Consequences of Use of Force .............................................................. 16
Arrest-Related Deaths ............................................................................ 27
Data Sources .......................................................................................... 45
Current Focus ......................................................................................... 55
3 METHODOLOGY ................. ................................................................................. 62
Data ........................................................................................................ 62
Analytic Strategy ................................................................................... 71
4 PREVALENCE OF MEDIA IDENTIFIED ARREST-RELATED DEATHS ..... 76
5 NATURE OF MEDIA IDENTIFIED ARREST-RELATED DEATH EVENTS . 87
6 DISCUSSION ................... ..................................................................................... 111
REFERENCES ....... ........................................................................................................... 128
APPENDIX Page
A MEDIA REPORT SEARCH TERMS ................................................................ 143
B DCRP ARD CJ-11A ADDENDUM ................................................................... 147

iv
APPENDIX Page
C CODING INSTRUMENT ................................................................................... 150
v
LIST OF TABLES
Table Page
1. Region and State .................................................................................................. 69
2. Arrest-Related Deaths by Region ....................................................................... 80
3. Regional State-by-State Comparisons of Media ARDS to DCRP ARDS ......... 82
4. Comparison of ARD Types by Year ................................................................... 85
5. Media Reported ARD Event Characteristics ....................................................... 90
6. Media Reported Deceased Characteristics and Behavior ................................... 93
7. Media Reported Officer Characteristics and Behavior ...................................... 95
8. Manner of Death and Sex .................................................................................... 96
9. Manner of Death and Calls for Service .............................................................. 97
10. Manner of Death and Deceased Unlawful Behavior ......................................... 98
11. Manner of Death and Deceased Behaviors ........................................................ 99
12. T-Test of Deceased Behaviors and Manner of Death ..................................... 101
13. Deceased Unlawful Behavior and Officer Use of Force ................................. 102
14. Deceased Behaviors and Officer Use of Force ................................................ 104
15. Deceased Weapon Use and Officer Use of Force ........................................... 106
16. Deceased Impairments and Officer Use of Force ............................................ 108
17. Deceased Drug Use .......................................................................................... 109
vi
LIST OF FIGURES
Figure Page
1. ARD Type for 2005 ...................................................................................... 77
2. ARD Type for 2006 ...................................................................................... 77
3. Arrest-Related Deaths by Region for 2005 .................................................. 79
4. Arrest-Related Deaths by Region for 2006 .................................................. 80
1
CHAPTER 1
INTRODUCTION
On November 21, 2014, the Bureau of Justice Assistance (BJA), in conjunction
with the Office of Community Oriented Policing Services (COPS Office), announced the
release of a resource guide to build stronger community-police relations. The Resource
Guide for Enhancing Community Relationships and Protecting Privacy and
Constitutional Rights is intended to encourage law enforcement from all jurisdictions to
work with the communities they serve to minimize needless confrontation (Department
of Justice, 2014a). Efforts to preserve peace, minimize harm, and sustain community trust
come in the wake of four high-profile cases in which citizens died during a police-citizen
interaction. In July of 2014, Eric Garner, an unarmed man, was confronted by New York
City police officers on suspicion of selling untaxed cigarettes. He subsequently died after
being put in a grappling hold by a New York City police officer, which was captured on
video and disseminated across the country. The next month, Michael Brown, an 18-year
old unarmed man, was shot in Ferguson, Missouri, after a struggle with a police officer
after Brown robbed a convenience store. These two incidents ignited outrage and distrust
among the public directed at law enforcement, which have manifested in both peaceful
and violent protests. Amidst the negative consequences, the two incidents sparked a
necessary national conversation about deaths that occur during police-citizen interactions.
During this time of heightened social unrest, two more fatal police-citizen
encounters occurred that increased tensions among the public and police even more. On
April 4, 2015, a routine daytime traffic stop for a non-functioning brake light resulted in
the shooting death of an unarmed black man named Walter Scott in North Charleston,
2
South Carolina. The officer involved, Michael Slager, shot Scott from behind eight times
because he claimed Scott took his Taser (Berman, Lowery, & Kindy, 2015). Days later
on April 12, 2015, Freddie Gray, a 25-year-old black man was arrested after running
from officers unprovoked and for having a switchblade. Six officers restrained him, put
him in a police van without a seatbelt, and failed to render medical help after Gray
complained about not being able to breathe multiple times (Almukhtar, Buchanan, Lai,
Wallace, & Yourish, 2015). Both incidents were recorded and disseminated among the
public leading to more protests and the demand to arrest the officers involved. Following
Freddie Gray’s arrest, Baltimore exploded into days of rioting parallel to the riots that
occurred in that same city in 1968 for discrimination and disenfranchisement of African-
Americans (Sanburn, 2015).
These four current events exemplify the need to study fatal police-citizen
encounters in order to better understand the phenomena, and to reduce citizen and officer
harm, quell social unrest, and improve police-citizen relationships. Police-citizen
interactions are similar to a chess game and involve mutual contributions from the officer
and the citizen in a given setting (Binder & Scharf, 1980). These transactional encounters
have the potential to escalate into situations that result in citizen death (Fyfe, 1988). But
the transactional nature of an incident also means that there may be opportunities for
police to de-escalate the encounter. Since the police are granted the authority to use
coercive force (Bittner, 1970), cases in which a citizen dies, known as arrest-related
deaths (ARDs), can result in a number of detrimental outcomes for the police, the
community, and the relationship between the two.
3
First, cases involving citizen deaths can lead to civil litigation, criminal
prosecution of officers, and irreparable damage to police legitimacy (Ross, 2002). The
average civil award in excessive force claims can range from the hundreds of thousands
of dollars to millions of dollars (Kappeler, Kappeler, & del Carmen, 1993; LRP, 1992).
Accordingly, ARDs increase the risk of police departments falling under federal control
(Kane, 2007). Second, public concern about inappropriate police action decreases police
legitimacy and fosters strained police-citizen relationships. Misconduct by law
enforcement officials undermines public confidence and social cooperation across the
country, especially in urban America where residents have had negative experiences with
police (Skolnick & Fyfe, 1993). Third, increased tensions between the police and the
community may result in community backlash, such as protests (Sherman & Langworthy,
1979) and riots (Fyfe, 1988; Geller & Karales, 1981a), as was evident in the Rodney
King incident in Los Angeles in 1991, and more recently in the polive-involved deaths of
Michael Brown in 2014 and Freddie Gray in 2015. Thus, citizen deaths that occur during
an arrest-related event, while interacting with police, or in police custody are of concern
for police agencies, the public, and policymakers alike.
Historically, ARD research has focused on officer-involved shootings of citizens
(e.g., Binder & Fridell, 1984; Binder & Scharf, 1980; Donahue & Horvath, 1991; Fyfe,
1981; White, 2002). Arrest-related deaths, however, are not restricted to officer-involved
shootings (Mumola, 2007), but may occur due to some other type of police action such as
in the cases of Eric Garner and Freddie Gray. Deaths in police custody can be the result
of no force by an officer, less-lethal forms of force, or deadly force. Less-lethal tools,
such as oleoresin capsicum (OC) spray and conducted energy devices (CEDs), have been
4
developed in efforts to decrease police shootings of citizens but both have also been
linked to citizen deaths (i.e., less lethal does not mean non-lethal). This trend toward less-
lethal alternatives has spurred public interest in police practices and new areas of
scholarship. More recent ARD research has begun to focus on the instances where OC
spray and CEDs, the most common of which is the TASER, have resulted in death (Ho,
Dawes, Nelson, Lundin, Ryan, Overton, Zeiders, & Minder, 2010; Kaminski, 2009; Gau,
Mosher, & Pratt, 2010; White & Ready, 2009; White, Ready, Riggs, Dawes, Hinz, & Ho,
2013). Moreover, scholarly investigations of deaths in police custody have identified
several ancillary causes of ARDs that are not directly related to police action including
drug intoxication and overdose, suicide, accidental injury, cardiac arrest, and excited
delirium (Ho, Heegard, Dawes, Natarajan, Reardon, & Miner, 2009; Krauskopf,
Mayerhoefer, Oberndorfer, Salameh, Bur, Schneider, & Risser, 2008; Mumola, 2007;
Stratton, Rogers, Brickett, & Gruzinski, 2008; Strote & Hutson, 2006).
Unfortunately, developments in ARD research have been restricted by limitations
in available data. For the last several decades, researchers have argued for the collection
of a publicly available central registry that catalogues arrest-related death events
(Blumberg, 1989; Geller & Scott, 1992; Kane, 2007; Klinger, 2008; Sherman, Cohn, &
Gartin, 1986). Scholars argue the public has a right to know how often individuals are
seriously injured or killed by representatives of the government (Geller & Scott, 1992;
Kane, 2007), yet there is still no reliable inventory of arrest-related events. Even though
researchers have often used official police data to explore the nature of use of force
tactics and strategies, findings have not provided a comprehensive understanding of
police and citizens interactions that result in an ARD (Alpert et al., 2005; Fyfe, 1988;
5
Kane, 2007). The national assessments that focus on deadly use of force have been found
to lack accuracy, completeness, or reliability to adequately assess the controversial issue
of citizens killed by law enforcement (Fyfe, 2002; Klinger, 2008).
The federal government has attempted to address this problem by enacting the
Deaths in Custody Reporting Act in 2000 (DICRA; Public Law 106-297). The
implementation of DICRA amended the Violent Crime Control and Law Enforcement
Act of 1994 (42 U.S.C. 13704) and required the Department of Justice to run a quarterly
collection of deaths of citizens that occur in the process of arrest, en route to be
incarcerated, or who are currently incarcerated at any local or state correctional facility.
The Deaths in Custody Reporting Program (DCRP) ARD collection, managed by the
Bureau of Justice Statistics (BJS), began in 2003 and gathers information on all types of
deaths that occur in the process of arrest. While this is a necessary step in the direction to
uncover a number of questions about in-custody deaths, the DCRP ARD collection1 has
two main problems.
First, it is not publicly available for researchers to analyze. The Bureau of Justice
Statistics has published two aggregate-level reports that provide limited information. As a
result, researchers cannot explore important questions related to the prevalence and
nature of ARDs. Similarly, researchers or practitioners cannot develop detailed policies
based on limited, aggregated information. Second, the collection provides data that are
not consistent with other collections and, based on some studies, appears to be
incomplete and inaccurate. For example, in a comparison of aggregate ARD published
counts to the Federal Bureau of Investigation’s (FBI) supplementary homicide reports’ 1 From here on out the DCRP ARD collection will be referred to as the DCRP. This still only refers to the arrest-related death collection and not the jail and prison collection.
6
(SHR) counts by state, Klinger (2008) found that officer-involved shooting deaths from
each data set did not consistently match. Of the 51 units of analysis from 2003 to 2005,
the DCRP count matches the SHR only 24 times out of 153 potential matches with the
DCRP reporting higher numbers than the SHR for about half the states each year
(Klinger, 2008). This supports the contention that the DCRP suffers from problems with
accuracy or completeness and both sources contain “substantial error” (Klinger, 2008, p.
607).
The BJS does not deny the methodological flaws and has discussed these issues.
The program cautions consumers about comparing jurisdictions from year to year since
states do not consistently report and reporting practices vary. In the most expansive
summary of the DCRP data for years 2003 to 2009, BJS revealed that several states did
not report to the program over a span of 1 to 3 years (Burch, 2011). More recently, a data
quality profile of the DCRP ARD program revealed that the data collection might only
capture half of the police-involved homicide cases that actually exist due to the
variability and quality in reporting from state to state (Planty, Burch, Banks, Couzens,
Blanton, & Cribb, 2015).
Given these limitations with the DCRP, researchers have turned to other data
collection strategies, such as official police data, if granted access, or the FBI’s SHR data
to examine incidents characterized as justifiable homicides by law enforcement. Other
recent scholarship, however, has turned to the publicly available source of media reports.
Researchers have employed media reports to examine sudden in-custody death events
(Ho et al., 2009; Williams, 2013), as well as TASER-proximate deaths and incidents
7
(Ready, White, & Fisher, 2008; Stinson, Reyns, & Liederbach, 2012; White et al., 2013;
White & Ready, 2009).
Problem and Purpose
Our society today is “a democracy that does not tell us how often we are forcibly
injured or killed by the people we pay to protect us” (Fyfe, 2002, p. 88). Police officers
are burdened with the paradox of preventing violence while often having to use violent
means (Sherman, 1980). As a society, we subcontract out and authorize law enforcement
to kill, hurt, or capture citizens who pose a threat to society (Sherman, 1980). It should
then be the contractual obligation of law enforcement agencies to provide society with
systematic data on their own activities, particularly when they exercise their authority to
use coercive force against citizens (Kane, 2007). Providing such information would keep
the police accountable to their social contract with citizens and ensure that police
brutality and vigilante justice is not taking place. Police are “law enforcement officers,
sworn to uphold the Constitution, trained and paid by the public to maintain a civilized
process of law” (Skolnick & Fyfe, 1993, p. 25).
In systematically cataloging ARDs of citizens, departments can identify
problematic officers, policies and practices (Kane, 2007), as well as support the need for
certain protocols. Taking the next step of publicly disseminating that data holds police
accountable through transparency, which would demonstrate whether or not they are
using force responsibly. Allowing the public to view data on official police activities
helps the police maintain legitimacy in the use of their legal authority (Reiss, 1971).
Additionally, researchers can aid in identifying ineffective policies and practices similar
to when Fyfe (1978, 1979) found problems with the broad discretionary deadly force
8
policies in the 1970s. Failure to provide open access to use-of-force data will keep police
accountability at a standstill and practices that increase the likelihood of citizen death will
persist (Kane, 2007). Furthermore, this lack of reliable and accurate data leaves
researchers with no starting point in identifying just how many arrest-related deaths
occur. There is not a reasonable basis for estimating the amount of force used by police in
the United States or what the persistent correlates of force may be (Hickman et al., 2008).
Without analyses of the prevalence and nature of ARDs that occur annually, researchers
are unable to conclusively infer if law enforcement are engaging in police brutality, and if
so, whether it disproportionately occurs against certain segments of the population
(Holmes, 2000). The proposed study seeks to shed light on these issues.
Despite the gains in research in recent years, the body of literature on arrest-
related deaths suffers from a number of limitations (Adams, 1999; Fyfe, 2002; Geller &
Scott, 1992). First, no publicly available national data collection of ARDs exists. That is,
how often these critical incidents occur is unknown. The Bureau of Justice Statistics
recently reviewed their national assessment of ARDs and claim that they might only
capture half of the estimated law enforcement homicides that occur each year from 2003
to 2009 and 2011 (Banks, Couzens, Blanton, & Cribb, 2015). Additionally, they found
variation in how state reporting agents gather information and report to BJS, with 26
states using media reports as a source of information instead of official information from
police departments themselves (Planty et al., 2015). More times than not, police
departments are not sharing their official counts of in-custody deaths to government or
public at large.
9
Second, the existing literature focuses on only certain categories of police-citizen
interactions, such as events that do not result in death (e.g., Terrill & Mastrofski, 2002;
Terrill, 2003; White, 2006), police-involved shootings (e.g., Binder & Scharf, 1980;
Donahue & Horvath, 1991; Friedrich, 1980; Jacobs & O’Brien, 1998; Kania & Mackey,
1977; Sherman & Langworthy, 1979; White, 2006; White & Klinger, 2012), and
TASER-proximate injuries and death (White et al., 2013; White & Ready, 2009). Very
few studies explore the characteristics related to other types of ARD events or all types of
ARDs in a single study (Ho et al., 2009). For example, in medical research, studies have
sought to uncover the cardiovascular and physiological effects of conducted electrical
devices (Ho et al., 2006), how resistance or a struggle with police may increase the risk
of sudden death (Ho et al., 2010; Stratton, Rogers, Brickett, & Gruzinski, 2008), or how
putting a citizen in the prone position may result in sudden death due to increased weight
restricting the flow of blood to the heart (Ho, Dawes, Moore, Caroon, & Miner, 2010;
Krauskopf, Mayerhoefer, Oberndorfer, Salameh, Bur, Schneider, & Risser, 2008).
Focusing on certain types of ARDs limits researchers’ ability to examine use of force
options or identify police practices that might pose increased risks for citizens. These, of
course, represent only a fragment of issues that may arise during police-citizen
interactions.
This limited body of research, however, is not a result of a lack of interest on the
part of researchers, but due to the lack of available data collected and shared by law
enforcement departments and government agencies (Fyfe, 2002). Thus, the purpose of the
current study is to explore the nature and prevalence of arrest-related deaths in the United
States using the media as a source of data. This dissertation intends to uncover the
10
prevalence and nature of ARDs in the United States by investigating the following
research questions:
1. How many ARDs does the media identify for 2005 and 2006?
2. Is the media a viable source of data for investigating the prevalence of ARDs?
3. Is the media a viable source for capturing the nature of ARDs?
The first research question involves the prevalence of ARDs identified through
avenues that are available to researchers and the public, which is a necessary first step in
uncovering the complexities of such interactions. The current data set begins several
years back in order to start creating a historical view of arrest-related deaths.
Furthermore, this was the most recent data available from BJS when data collection
began. In presenting the ARDs identified by the media, the current study will also
examine the distribution of types of ARDs across the country for 2005 to 2006 in an
effort to identify other trends that might exist.
The second research question explores whether or not the media is a viable source
of data for investigating police in-custody deaths of citizens. Media data, while
increasingly emerging as an option for scholars, has not been established as a reliable
source (but neither have official government statistics). Examining media-identified
ARDs allows us to investigate if certain types of deaths receive more media attention or
if media coverage of ARDs is more prevalent in certain states. This also allows the
current study to compare the media-identified number of ARDs to the number presented
by the Deaths In-Custody Reporting Program to add to the narrative on the utility of
media data.
11
Lastly, since no other publicly available data on the specifics of ARD events and
the parties involved exists, the current study seeks to use media data to explore the nature
of ARDs in the US. More specifically, the dissertation examines incident-level
characteristics of ARD cases where officers use force, such as police-involved shootings
and TASER-proximate deaths. What are the behavior and actions of the deceased and
officers involved? Furthermore, what are the behavior and actions of citizens in incidents
where death does not occur due to police action? How might these be different from
incidents where force is used? In particular, the current dissertation will examine how
incident, suspect, and officer characteristics vary across the different categories of ARDs,
which include police-involved shootings, other homicides by law enforcement, suicides,
deaths resulting from alcohol and drug intoxication, deaths due to accidental self-injury
or injuries from a third party, and deaths involving medical problems.
Overall, this dissertation seeks to address limitations of the current state of ARD
research through the examination of these questions. Exploring potential avenues for
research provides a starting point for policy development to potentially decrease police
and citizen harms. This could potentially increase police legitimacy in the eyes of the
public and promote public confidence and social cooperation among law enforcement
and citizens.
12
CHAPTER 2
BACKGROUND
This chapter begins by examining the role of police and their granted authority to
use force. The purpose of this section is to outline the uniqueness of the police as a
profession and the responsibilities and consequences of such authority and power,
especially when a civilian death occurs. The chapter then reviews the current literature
that has attempted to explain when and why deadly force is used at the case-level,
organizational-level, and community-level. Police-involved shootings of civilians have
been reviewed most extensively. This is followed by a review of less-lethal force and the
potentiality of civilian deaths. Lastly, deaths that occur suddenly while in police custody
are reviewed. Arrest-related deaths do not only include deaths as a result of deadly force
by police officers. Other factors increase the risk of an ARD.
The second section of the chapter shifts to the issues with the current
measurement of arrest-related deaths. Data sources, such as media reports and the DCRP
ARD collection, are discussed in terms of their availability, usefulness in exploring
ARDs, and criticisms. The chapter then concludes with a re-statement of the research
problem and an overview of how the current study will address the problem.
Authority for Use of Force
The role of police in society includes order maintenance, conflict resolution of
human problems, problem solving, and provision of services along with other activities
(Kelling & Moore, 1988; Skolnick & Fyfe, 1993). Crime control is an integral part of
police services that involves officers engaging in preventive patrol and rapid response to
calls for service (Kelling & Moore, 1988). Calls for service, such as citizens asking for
13
help or protection from troublesome individuals or an undesired imposition, require the
officer to exercise discretion in how to resolve the situation. Decision-making in the
regulation of human relationships and maintaining order may require officers to use force
or the threat of force (Sykes, 1986) and they have thus been authorized to use coercive
force when they see fit to remedy social problems (Bittner, 1970). That is, police are “a
mechanism for the distribution of situationally justified force in society” (Bittner, 1970,
p. 38). When responding to calls for service or stopping criminal acts, whether dangerous
or not, officers have the power and authority to overpower resistance. If an arrest occurs,
the imposition of force through a frisk or handcuffing is involved. Coercive power over
others is constantly emphasized as the central feature of policing (Skolnick & Fyfe,
1993).
Furthermore, they are granted broad discretion in when to use force and how
much force is necessary in a given situation. Most police-citizen encounters may be
handled informally without the use of force (Bittner, 1967; Muir, 1977; Reiss, 1971;
Rubinstein, 1973; Wilson, 1968), while a small proportion, usually around 1.7%
(Hickman, Piquero, & Garner, 2008), of all police-citizen contacts may require the use of
force or the threat of force (Bayley & Garofalo, 1989; Eith & Durose, 2011). Use of force
can range from nonlethal force, such as grabbing and control hold techniques, to the use
of less-lethal tools, to the use of deadly force (Alpert & Fridell, 1992; Alpert, Smith,
Kaminski, Fridell, MacDonald, & Kubu, 2011; Eith & Durose, 2011; Garner, Buchanan,
Schade, & Hepburn, 1996; Hickman et al., 2008). The choice to use violence by the
police “is both an occupational prerogative and a necessity” (Westley, 1953, p. 35). It is
the job of the street police officer to choose the appropriate level when handling a
14
situation, but it is also their duty to protect lives and not put themselves in harm’s way
just to avoid using more violent levels of force (Skolnick & Fyfe, 1993).
Such broad discretion, however, can result in negative consequences if not kept
balanced by policy. In the 1960s, President Johnson established a Task Force to examine
police-community relations, and the Presidential Commission found a pervasive absence
of use of deadly force policies (President’s Commission, 1967). At this time, police
officers were given wide discretion regarding the use of firearms and departments
provided little instruction as to when a firearm should be used (Blumberg, 2001).
Chapman (1967) provided examples of such discretionary policies, which included to
“never take me out in anger; never put me back in disgrace,” “leave the gun in the holster
until you intend to use it,” and “it is left to the discretion of each individual officer when
and how to shoot.” Most agencies deferred to state criminal statutes or case law that had
defined justifiable homicide, which often followed a fleeing felon rule (Fyfe, 1988).
Officers were authorized to use deadly force as a way to apprehend individuals fleeing
from suspected felonies, even if they were unarmed.
In 1985 this practice was scrutinized in the case of Tennessee v. Garner (471 U.S.
1) where an officer shot a fleeing 100-pound male juvenile burglary suspect from 30 feet
away. The Supreme Court ruled that deadly force should not be used against unarmed
and non-dangerous fleeing felons because it violates the Fourth Amendment’s guarantees
of freedom from unreasonable seizures. Deadly force may be used if the fleeing felon
threatens the officer or other individuals with a weapon or if he or she is fleeing a crime
where the infliction or threat of infliction of serious physical harm occurred (Tennesee v.
Garner). States around the country changed their policies following the Supreme Court
15
decision. This type of deadly force policy, however, was still too vague and did not
provide a comprehensive set of operational guidelines (Fyfe, 1988).
In Graham v. Connor in 1989 (490 U.S. 386), the Supreme Court ruled that an
officer must apply constitutionally appropriate levels of force based upon the
circumstances for that particular case, while keeping in mind what an objectively
reasonable officer would do in the same situation. It is up to the police officer to take into
account all necessary factors when deciding to use force. State criminal laws outline that
officers should use no more force than is necessary or reasonable, and force should only
be used as a last resort (Skolnick & Fyfe, 1993). Generally, training and policy of police
departments provide officers with a continuum of force options from which they are to
choose the least severe of degree of force that is most likely to remedy the situation at
hand (Skolnick & Fyfe, 1993).
Yet, these policies vary and are vague, even possibly intentionally (Fyfe, 1979).
Different officers may not interpret the same scenario in the field the same way, despite
being trained to keep in mind what an objectively reasonable officer would do. Police-
citizen interactions are transactional where the actions of the officer as well as the actions
of the citizen influence the trajectory and outcome of the encounter (Binder & Scharf,
1980). Officers must often make split-second decisions that cannot be leisurely mulled
over (Fyfe, 1979; Rubenstein, 1973). This potential for deadly interactions has spurred a
number of policy changes over the past several decades on the use of deadly force. Today
most major urban law enforcement agencies have moved to a more restrictive deadly
force policies that instruct officers to use deadly force only in the defense of life
(Blumberg, 2001).
16
Consequences of Use of Force
Despite police use of force being a statistically rare event (Adams, 1996; Bayley
& Garofalo, 1989; Eith & Durose, 2011; Geller & Scott, 1992), its occurrence has a
number of negative consequences for citizens, police, and society at large. First,
perceptions of misconduct or abuse of force cases often result in civil litigation against
the police (Ross, 2002). Second, police-citizen encounters involving use of force or cases
that result in civilian deaths can elicit violent responses from communities. Tumultuous
police-citizen relationships often stem from long-lasting distrust cultivated in poor, urban
communities between citizens and law enforcement (Holmes, 2000; Jackson, 1989).
Third, questionable use of force cases may lead to federal investigations into the incident
and the police department as a whole.
Civil Litigation
Police departments are local government agencies subject to certain legal
requirements and necessary actions should they violate certain terms. In 1983, the United
States Supreme Court ruled that a local government is a “person” that can be sued for the
deprivation of rights under Section 1983 of Title 42 of the United States Code after the
ruling in the case of Monell v. the Department of Social Services of the City of New York
(436 U.S. 658). That is, local government entities can be held accountable for
unconstitutional acts, such as in cases where police use excessive force against citizens.
Such cases have been found to be costly for police departments. For example, a
publication group (LRP, 1992) reported that in civil litigation involving police shootings,
plaintiffs were awarded compensation in 63 percent of the cases with an average award of
$1,327,927 (Ross, 2002). Further research has found that excessive force claims rank
17
sixth out of the top 20 categories of types of litigation where plaintiffs are likely to
prevail (Kappeler et al, 1993, updated in 1996). In these cases, the average award for
excessive force claims was $178,878 (Kappeler et al., 1993). Other reviews similarly
found excessive force or brutality claims to be the top reasons for citizen-initiated
lawsuits (Ross & Bodapati, 2006; Vaughn, Cooper, & del Carmen, 2001). Moreover,
failure to train the police in less-than-lethal force claims has also been cited as a top
reason for filing civil litigations against police (Ross, 2000).
Public Responses
Police excessive use of force incidents can also spur violent responses from the
public. Deaths that are the direct result of police action (particularly police-involved
shootings of a civilian) usually receive greater interest and experience higher levels of
public scrutiny (Pelfrey & Covington, 2007). These publicized incidents of police use of
deadly force, even if justified, can be particularly detrimental to police-citizen
relationships (Fyfe, 1988). Police officers who rely on coercive force to reduce threats
and increase safety might actually make the community more dangerous for themselves
and other officers (Muir, 1977) because the public begins to view all police officers as
abusive. Law enforcement officers then become a symbol to the public and possible
targets for retaliation (Skolnick & Fyfe, 1993).
Hostility and the risk for violent encounters between police and civilians has been
continually exacerbated by civilians who view the police as a symbol of oppression
among the disadvantaged (Binder & Scharf, 1980; Mulvihill & Tumin, 1969), and by the
police who use perceptual shorthand to identify certain types of individuals as potentially
threatening or dangerous (Skolnick & Fyfe, 1993). Minority communities, namely
18
African-American neighborhoods, have experienced higher rates of coercive force
incidents (e.g., Black & Reiss, 1967; Holmes, 2000; Smith, 1986), and are more likely to
file excessive force complaints (Fridell, 1993). Historically, African-Americans have
experienced “segregative disadvantage in education, employment, security, and
residence” (Calmore, 1993, p. 1488). This increased marginalization and creation of an
underclass has produced social ills in those communities that include crime, drug use and
sale, high rates of unemployment, increased homicide rates and interpersonal violence
among young black males (Skolnick & Fyfe, 1993).
While the development of the underclass is due to broader social and structural
factors, neighborhood context plays a role in how police and citizens view each other.
Officers patrolling disadvantaged minority communities may respond to the high levels
of crime based on their global perceptions of the area and view the citizens as bad and
dangerous, which, in turn, can influence his or her use of force decisions (Skolnick &
Fyfe, 1993; Smith, 1986). An officer might not stop to think about the broader social
problems plaguing the community because he or she is acting as a soldier against the war
on crime who finds many of their “enemies” in minority, inner city communities (Terrill
& Reisig, 2003; Skolnick & Fyfe, 1993). Because of this, the police are not seen as
community helpers, but potential punishers of the way of life found among the urban
poor (Mulvihill & Tumin, 1969).
Police use of excessive force may physically happen to a few individuals, but
other members of the community vicariously experience the event, which may influence
their perceptions of police (Weitzer & Tuch, 2005). Negative public perceptions of police
weaken their legitimacy (Fyfe, 1988; Tyler, 1990) and influence subsequent interactions
19
with members of society, especially among certain racial groups that feel targeted by
police practices. One of the primary mechanisms of police legitimacy is procedural
justice, or fairly exercising police discretion and carrying out authority on the part of
police officers in their profession (Sunshine & Tyler, 2003). When citizens perceive the
police as performing their duties in a fair way, they are more likely to view them as
legitimate. Increased legitimacy, in turn, increases the likelihood of citizens obeying the
law, complying during police encounters, and cooperating as victims or witnesses (Tyler,
1990; 2004). On the other hand “the perception of police practices as unfair or as racially
motivated may lead to more frequent and severe confrontations between police and
citizens and to greater distrust of the police” (Weitzer & Tuch, 2005, p. 1009).
Today’s technological advances provide citizens with quick access to any type of
information and can diminish police legitimacy in seconds with the sharing of images,
videos, and stories of police misconduct across the country (Brown, 2015; Goldsmith,
2010). Exposure to media reports of police misconduct, such as excessive force or arrest-
related deaths, may negatively affect individual’s confidence in the police, especially
among minority citizens (Kaminski & Jefferis, 1998; Sigelman, Welch, Bledsoe, &
Combs, 1997; Tuch & Weitzer, 1997; Weitzer, 2002; Weitzer & Tuch, 2005). In
particular, the case of Rodney G. King illustrates this point.
In 1991, Rodney G. King and a couple of fellow African-American passengers
engaged in a high-speed car chase with police in Los Angeles, California. Once police
were able to stop King’s vehicle, several officers beat King for a prolonged period of
time while he was in the prone position (Geller & Scott, 1992). Nearly two-dozen other
officers stood by and watched. A bystander happened to record the incident and provided
20
the public with a firsthand account of what took place that day which led to the criminal
prosecution of four officers.
On April 29, 1992, a jury that did not have one African-American juror on it,
acquitted the officers of assault and excessive use of force in state proceedings. Polls of
Americans revealed that most White Americans and all African-Americans disagreed
with the verdict (Marshall, 1992). Both the beating of Rodney King and the acquittals of
the officers set into motion several weeks’ worth of riots and protests, not only in the
southern Los Angeles area but also throughout the rest of Los Angeles and several cities
across the United States (Geller & Scott, 1992). This event, however, occurred when
video recording devices were not as common and not easily accessible at a moment’s
notice.
In more recent years, the public has gained quick and easy access to personal
phones that have the ability to capture pictures and video recordings and share that
information. The recent events surrounding the death of Eric Garner, a 43 year-unarmed
African-American male, during an altercation with police and the police-involved
shooting death of Michael Brown, 18 year-old unarmed African-American male,
illustrate the ease of information sharing and how that can spark unrest among
communities. On July 17, 2014, New York City police approached Eric Garner just after
he had broken up a fight outside of a beauty supply store and accused him of selling
untaxed cigarettes. He asked officers to leave him alone and resisted their attempts to
handcuff him. A struggle ensued and one of the five officers present put Garner in a
chokehold. While on the ground, Garner informed officers he could not breathe, but
officers placed him in handcuffs and searched him. On the way to the hospital, Garner
21
died. The New York City Medical Examiner’s Officer cited the cause of death as
compression of neck (choke hold), compression of chest and prone positioning during
physical restraint by police while asthma and heart disease also played a role (Nathan,
2014). A bystander recorded the incident on a cellular telephone. The video quickly made
its way across the country. Peaceful protests were held that same month in New York.
Less than a month later on August 9, 2014, in Ferguson, Missouri, Michael
Brown was fatally shot by a lone police officer. Brown had robbed a convenience store
with a friend and Officer Darren Wilson had stopped them based on the description
dispatched to officers. Mr. Brown’s friend, Dorian Johnson, provides an account of the
incident that differs from Officer Wilson’s account. Mr. Johnson claimed that Mr. Brown
had his hands up while informing Officer Wilson that he did not have a gun. Officer
Wilson claimed Mr. Brown had reached into his police car and grabbed his gun and
punched him prior to the shooting. Wilson also claimed that Mr. Brown was running with
his right hand under his shirt in his waistband ignoring the officer’s commands (CBS
News, 2014). In the end, Mr. Brown was shot multiple times and died at the scene. A
bystander did not electronically record this incident, but the news quickly spread
prompting peaceful protests and civil disorder across Ferguson (NBC News, 2014).
Both cases were placed under investigation and sent to the grand jury. On
November 24, 2014, a grand jury decided to not indict Officer Darren Wilson. News
spread across the country quickly an, again, members of the community engaged in
peaceful, nonviolent demonstrations as well as violent protests and riots. On December 3,
2014, a grand jury decided not to indict Officer Daniel Pantaleo, the officer who had
placed Mr. Garner in the chokehold. More peaceful demonstrations, including “die-ins”
22
where individuals simulate being dead in silent protest, occurred across the United States
from New York to San Francisco and even in London, England (BBC News, 2014).
During this time of heightened social unrest, two more fatal police-citizen
encounters occurred that increased tensions among the public and police even more. On
April 4, 2015, a routine daytime traffic stop for a non-functioning brake light resulted in
the shooting death of an unarmed black man named Walter Scott in North Charleston,
South Carolina. After being pulled over, Mr. Scott fled from his car when the officer,
Michael Slager, returned to his patrol car after talking with Mr. Scott. Officer Slager
pursued Mr. Scott and a scuffle ensued with Mr. Scott being shot with a TASER at least
once (Berman, Lowery, & Kindy, 2015). Mr. Scott ran again and Officer Slager shot him
eight times from behind. Officer Slager told dispatchers that Mr. Scott had taken his
TASER when he called in the incident (Berman et al., 2015). An eyewitness recorded the
encounter from the scuffle to the shooting on a camera phone, which showed that Mr.
Scott did not take Officer Slager’s TASER.
A week later on April 12, 2015, Freddie Gray, a 25-year-old black man, was
approached by police officers and fled. When officers caught up to him, they
apprehended him because he fled unprovoked upon noticing police presence (Bever &
Ohlheiser, 2015). Six officers arrested him after they found a switchblade inside his pants
pocket. Video of his arrest was captured at multiple stages. When he was first
apprehended he was placed in a crab-like position with his arms and legs were bend back
and then thrown into a police van (Bever & Ohlheiser, 2015) without a seatbelt to secure
him (Almukhatar, 2015). During his 30-minute ride to the police station, officers stopped
and placed more restraints on Gray. In between the first stop and the second stop, Gray
23
sustained a critical neck injury, but when checked on no one rendered medical assistance
(Almukhatar, 2015). Two more stops were made and Gray informed officers of his
inability to breathe yet a medic was not called until they arrived at the Western District
police station (Almukhatar, 2015). Gray died a week later after falling in and out of a
coma twice. When news spread of his death, riots and protest broke out across the city.
The social unrest experienced was likened to the riots of 1968 and called for several
nights of enforced curfew across the city (Sanburn, 2015). Law enforcement officers
drove around in armored vehicles to keep people off the streets just as the military did in
1968. People in other cities, such as New York City and Washington, DC, also
demonstrated in support of Baltimore and their stand against police brutality (Sanburn,
2015).
All four of these arrest-related death cases symbolize the negative consequences
that can occur when a police-citizen interaction results in a citizen’s death. Communities
reveal their deep-rooted distrust in law enforcement. Communities become unsafe for
residents and officers alike, and police-citizen relationships intensify (Department of
Justice, 2014b).
Federal Consent Decrees and Memorandum of Agreements
When ARD cases, such as Michael Brown and Eric Garner, or excessive force
cases, such as Rodney King occur, the federal courts and the Department of Justice (DOJ)
can intervene to investigate the problems of police misconduct. In 1994 as part of the
Violent Crime Control and Law Enforcement Act, Congress enacted new legislation that
allowed the DOJ to bring a lawsuit against a police department and not just individual
officers (42 U.S.C. 14141). Through this piece of legislation, the DOJ has been granted
24
the authority to initiate investigations through consent decrees or memorandum of
agreements (MOAs) of police departments that have established a pattern of policing that
deprives individuals of their constitutional rights. Consent decrees include court-ordered
remedies that address specific police misconduct identified by the DOJ for a particular
police department, with the overall goal of promoting police integrity and eliminating
misconduct. Some of the main reasons for federal intervention usually pertain to issues
with use of force, citizen complaints, usage of in-car video cameras, investigations,
arrests, searches and warrants, traffic stops, foot pursuits, and racial profiling (Ross &
Parke, 2009). The most common remedies included in consent decrees involve: revision
of or development of policies and procedures, the establishment of data-driven
information management systems – a necessary core component for all the factors
(Walker, 2003), establishing varying agency programs, the conduct of investigations, and
administrative oversight of the entire consent decree (Ross & Parke, 2009).
Since 2001, federal inquests have increasingly begun to use MOAs, which avoid
litigation (Davis, Henderson, Madelstam, Ortiz, & Miller, 2005). A MOA does not
involve judicial monitoring and is a less formal intervention based on a cooperative
agreement between the DOJ and the police department. These usually focus on issues
pertaining to use of force, the handling of citizen complaints, traffic stops, and searches
and seizures (Ross & Parke, 2009). The main components involved with MOAs include
investigations into officer actions, the improved handling of citizen complaints, and data
collection usually focused on traffic stops (Ross & Parke, 2009).
Since the passing of the legislation in 1995, consent decrees and MOAs have been
implemented in police departments across the U. S. in 19 different states and in 30
25
different departments (Davis et al., 2005; http://www.justice.gov, 2015; Ross & Parke,
2009). The first consent decree occurred in Pittsburgh, Pennsylvania, in 1997 after a
number of incidents that demonstrated the distrust between the police and the African-
American community (Davis et al., 2005). Citing excessive force, false arrests, improper
searches and seizures, failure to discipline officers adequately, and failure to supervise
officers, the DOJ and city of Pittsburgh entered into a consent decree. Consent decrees
have also been implemented for the Los Angeles Police Department (2001), Detroit
Police Department (2003), New Orleans Police Department (2012), Oakland Police
Department, and Seattle Police Department (2012) to name a few.
Repeated incidents of excessive force illustrate a need for police accountability to
help repair police-citizen relationships in those communities. When citizens die while in
police custody, whether it becomes a high-profile case or not, a certain level of
accountability is necessary. Unfortunately, the impact of consent decrees on police
department operations has not been thoroughly investigated and might only be marginally
effective (Ross & Parke, 2009). One survey of the Pittsburgh consent decree found that
the decree was useful and decreased citizen complaints according to focus groups
comprised of Pittsburgh officers and supervisors (Davis et al., 2005). The morale of
patrol officers, however, decreased and resulted in more officers leaving the department
or being less likely to engage in proactive policing strategies (Davis et al., 2005).
Additionally, consent decrees are timely and costly (Ross & Parke, 2009). A more
recent study that examined the implementation of consent decrees in five jurisdictions
revealed that successful implementations include having the necessary resources to carry
out the initiatives (Chanin, 2014). These departments also experienced a successful
26
reform process because they were highly motivated and typically led by reform-minded
chiefs who are strong, capable, and assertive (Chanin, 2014). Of course, the reform
process is more complex than just successfully implementing DOJ required initiatives
with external oversight. Such reform involves a meaningful and self-sustaining
organizational change even when the external oversight disappears. A recent examination
of three successful consent decree initiatives found that after the DOJ deems a
department as substantially complying and reforming, the department does not always
maintain such institutionalized change and may require more long-term maintenance and
federal oversight (Chanin, 2015).
More recently, the Community Oriented Policing Services (COPS) office under
the DOJ, has implemented a Collaborative Reform Initiative for Technical Assistance
(CRI-TA). This allows law enforcement agencies to be proactive in fixing departmental
issues without a formal investigation and consent decree. The purpose is to improve trust
between the law enforcement agency and the community it serves over the long-term.
This is another way for police departments to increase their legitimacy, but they must
voluntarily participate in the initiative and demonstrate a commitment to the
recommended reform efforts (COPS, 2015). While these several different protocols are
now in place to aid in the reparation of police-citizen relationships after arrest-related
death events or to even preemptively address exacerbating issues, problems might still
arise between police and citizens due to years of distrust among the public. Such
requirements and changes might have little influence on the attitudes of rank-and-file
officers and do not change their day-to-day activities (Johnson, 2015).
27
Arrest-Related Deaths
Correlates of Coercive Force
Police use of force is a complex issue that frequently revolves around the
changing situational dynamics of the arrest environment (Ross, 2002). It is the role of
researchers to provide a context to these dynamic events (Rojek et al., 2012). Robin’s
(1963) examination of all fatal shootings by Philadelphia police from 1950 to 1960 was
the first systematic study of deadly force (Blumberg, 2001; Fyfe, 1988). Since then,
scholarship has continued to attempt to uncover how many times a year citizens are killed
by officer-involved shootings, as well as the factors that are associated with such
incidents (Alpert & Fridell, 1992). The existing literature, however, still leaves a number
of questions to be answered about the amount of force used by the police or the factors
surrounding ARD incidents in the United States (Hickman et al., 2008). This is especially
problematic when “this country simply does not know how many of its own citizens it
kills each year under the authority of the state” (Sherman & Langworthy, 1979, p. 553).
Prior research, however, has consistently identified three categories of variables that
influence use of force decision-making: case-level characteristics, organizational-level
characteristics, and neighborhood-level characteristics2.
Case-level characteristics. Early use of force research largely included
descriptions of the extent and trends of incidents, but has since improved
methodologically to allow for analysis of determinants of use of force (Alpert & Fridell,
1992). Case-level characteristics refer to the suspect, officer, and situational factors
associated with deadly force. These include, but are not limited to, the race or ethnicity of 2 Problems associated with recording the number of in-custody death incidents will be reviewed in a later section when data sources are discussed.
28
the civilian or police officer, the actions of all parties, as well as the location and other
incident-related factors. The literature has emphasized the social dynamics of police-
citizen encounters and the cues that officers use to resolve the issues (Holmes, 2000).
Analyses of use of force determinants are particularly important in identifying factors that
lead to the escalation of potentially violent encounters.
Historically, use of force has been used disproportionately against racial
minorities (Fyfe, 1981; Jenkins, 1992; Geller & Karales, 1981a; Harding & Fahey, 1973;
Milton et al., 1997; Robin, 1963; Westley, 1953, 1970). Although, whether or not race is
the reason for the force has been unclear (Bolger, 2012). Initially, researchers during the
1970s and 1980s presented varying opinions on shooting circumstances across suspect
race (Fridell, 2010). One school of thought has argued that ARDs of minorities occur
because minority citizens are disproportionately involved in activities that increase the
risk of getting shot, such as the perpetration of violent crimes (Goldkamp, 1976). Low
socioeconomic status, higher levels of drug use and sales as well as violent crimes
overtime has lent to the development of an urban underclass (e.g., Calmore, 1993;
Skolnick & Fyfe, 1993). Within the underclass, researchers have theorized that they have
developed subcultures of violence that explain minority citizens’ disproportionate
involvement in violent crimes, which increases their likelihood of being shot (Wolfgang
& Ferracuti, 1967).
Scholarship in this area has yielded mixed findings. Several studies have
suggested that race is not a significant predictor in an officer’s decision to use deadly
force (Blumberg, 1974; Geller & Karales, 1981b; Binder, Scharf, & Galvin 1982; White,
2002; White & Klinger, 2012). Blumberg (1974) did not find any race differences in
29
police response to threat, measured as the number of officers who fired their weapons,
number of bullets fired, or whether the subject was injured or killed, in a study of police-
involved shootings in Atlanta and Kansas City. Additionally, Blacks and whites posed the
same level of threat to the officers, suggesting that officers respond similarly across
situations regardless of race (Blumberg, 1974). In these instances it is the situation
driving decisions to use deadly force.
The alternative school of thought, however, has explained disproportionate ARDs
of minority citizens as stemming from discriminatory police practices toward minorities
(Goldkamp, 1976). In a study of officer-involved shootings in Los Angeles, California,
that occurred from1974 to 1979, Meyer (1980) found that Black citizens were more likely
than white citizens to be unarmed when shot by police officers during an ARD event.
Fyfe (1982) examined police-involved shootings in Memphis to understand the
differential findings among researchers. He found that Blacks were disproportionately
shot and killed by police at a higher rate than whites, even though Black citizens were
significantly less combative and more likely to be unarmed. Observations and interviews
collected from 1949-1950 revealed that police viewed Black citizens as being naturally
prone to criminality and a particular threat to police authority (Westley, 1953, 1970).
Takagi (1974) described this as officers having “one trigger finger for whites and another
for blacks” (p. 29). While studies have revealed some support for both schools of
thought, citizen race has not been able to fully explain the use of deadly force by police
officers (Friedrich, 1980; Margarita, 1980; Smith, 1986; White, 2002).
Studies have also looked at other citizen factors that might influence the use of
force. Being male (Kobler, 1975) and/or having a lower socioeconomic status have also
30
been found as predictors of use of force (Bolger, 2014; McCluskey & Terrill, 2005;
Paoline & Terrill, 2005; Terrill & Mastrofski, 2002). Several studies have found that use
of force is more likely when suspects are under the influence of alcohol or illicit
substances (Adams, 1999; Bayley & Garofao, 1989; Bolger, 2014; Engel, Sabol, &
Warden, 2000; Sherman, 1980; Smith 1986; Swerdlow, Fishbein, Chaman, Lakkireddy,
& Tchou, 2009). Similarly, citizens with a hostile demeanor or who pose a real and
imminent danger to police officers (Binder & Fridell, 1984; Binder & Scharf, 1980;
Chevigny, 1969; Fyfe, 1980, 1981; Kobler, 1975; Margargita, 1980; White, 2002; White
& Klinger, 2012) have also been linked to an increased likelihood of police use of lethal
force.
Officer characteristics often play a role in the use of force as well. One main
finding uncovered by existing researcher has found that officers who have more
education are less likely to use force (Paoline & Terrill, 2007; Terrill & Mastrofski,
2002). Largely, studies have found that officer race does not influence use of force
decisions (Engel & Canon, 2004; Lawton, 2007; McCluskey et al., 2005; McCluskey &
Terill, 2005). Other officer characteristics have received less empirical investigation and
yielded inconsistent findings (Bolger, 2014). For example, some studies have found that
less experience and exhibiting aggressive behaviors is related to a greater likelihood of
using force (e.g., Kaminski et al., 2004), while others have found non-significant
relationships (e.g., Lawton, 2007; McCluskey et al., 2005; McCluskey & Terrill, 2005).
Despite this research, it is still difficult to draw firm conclusions regarding the
relationship between officer characteristics and certain types of job performance, such as
using deadly force (Fyfe, 1989).
31
Overall, however, research has found situational factors to be important in
understanding the use of deadly force (Friedrich, 1980; White, 2002). Particulary, the
outcomes of police-citizen encounters depend upon the actions taken by both the citizen
and the officer and how each actor responds to the other’s actions (Bayley, 1986; Binder
& scharf, 1980; Friedrich, 1980). In other words, an officer’s decision to use deadly force
is the end result of a sequence of decisions and actions, which can either increase or
decrease the probability of such force (Binder & Scharf, 1980). For example, a citizen’s
actions may often times increase the risk of death. Fatal shootings are more likely when
the citizen is armed (Binder & Fridell, 1984; Donahue & Horvath, 1991; Fyfe, 1980,
1981; Klinger, 2004; White & Ready, 2010), resisting, attacking, and fighting back with
the officer, or shooting at the officer first (White, 2006; White & Klinger, 2012). Certain
types of calls for service might also incite some of these actions. Calls that involve
assumed criminal or high-risk activities, such as a robbery or man with a gun, are more
likely to escalate into an ARD event (Donahue & Horvath, 1991; White, 2002; White &
Klinger, 2012). Furthermore, the number of officers can be an aggravating factor that
influences the outcome of such situations. The potential for a police-involved shooting
death of a citizen increases as the number of officers present during the situation
increases (White, 2006), which is accompanied by the potential to have multiple officers
discharge their weapons (Klinger, 2004; White, 1999; White & Klinger, 2012). Thus,
situations that present danger to the police officer are more likely to result in more
aggressive forms of force.
Organizational-level characteristics. Other research has examined how
organizational properties of police departments, such as administrative controls and
32
police subculture, have influenced the use of force (Holmes, 2000). Prior to the 1970s
most police departments followed a non-restrictive policy regarding the use of deadly
force, which allowed shooting at fleeing felons, shooting at or from moving vehicles, and
firing warning shots (White, 2000). This led to concern from the President’s Commission
on Law Enforcement and the Administration of Justice (1967) about the absence of
administrative guidelines for officer use of deadly force in 1967. During the early 1970s,
several police departments began to adopt more restrictive deadly force policies in large
response to community protests of unarmed suspects (White, 2000). During the 1980s
following the Tennessee v. Garner (1985) ruling, even more police departments moved
towards more restrictive policies that limited police discretion when using deadly force.
Largely, research has revealed that the implementation of restrictive deadly force
policies, when enforced, will lead to lower rates of police shootings of citizens (Fyfe,
1979; Gain, 1971; Geller, 1982, 1985; Geller & Scott, 1992; Nowacki, 2011; Sherman,
Cohn, & Gartin, 1986). For example, in 1968, the Oakland Police Department
implemented a policy that prohibited police officers from shooting burglary and theft
suspects. Investigation of the new policy revealed a decrease in the number of shooting
incidents per month (Gain, 1971). Similarly, Fyfe’s (1979) analysis of the New York City
Police Department’s implementation of a policy that permitted officer to shoot only in
defense of life showed significant decreases in use of deadly force as well as officer
injury and death. Decreases in shooting incidents following the implementation of
restrictive administrative policies were also found in Omaha, Kansas City, Los Angeles,
Dallas, Memphis (Geller & Scott, 1992), and Philadelphia (White, 2000, 2003). Other
33
research, however, has found that restrictive policies are beneficial for Blacks but not
whites (Nowacki, 2011).
Alternatively, departmental permissiveness can increase the likelihood of arrest-
related deaths of civilians occurring. When police departments switch from a more
restrictive policy to a more permissive policy they increase the likelihood of citizen
deaths (White, 2001). For example, the Philadelphia Police Department removed its
restrictive administrative policy regarding deadly force in 1974. The period after the
abolishment was accompanied by an increase in police shootings of citizens (White,
2001). Moreover, examination of the department revealed that police officers were not
being held accountable for violations of the restrictive policy before its removal, which
speaks to the departmental subculture (White, 2001).
Informal organizational rules can play a role in whether or not administrative
policy influences departmental change (Fyfe, 1980b, 1988; White, 2001). The police are
a unique entity in that they are granted coercive authority over other individuals. This
type of authority that no other profession has creates a community or brotherhood that
generates support for one another (Skolnick & Fyfe, 1993). The socially isolated and
extremely loyal type officer is generally suspicious of citizens, has negative views of
upper management, and focuses on the crime-fighting role of the job and rejects other
aspects (Paoline, 2003, 2006). Other researchers, however, have suggested that not all
officers take this role and a number of other typologies exist. Although, those officers
that do adhere to these more authoritative prominent roles are more likely to search
citizens during traffic stops (Paoline & Terrill, 2005) and use higher levels of force
(Terrill, Paoline, & Manning, 2003).
34
Policing as a profession pushes individuals toward certain types of mentalities.
The police role is constantly changing and calls for police to adapt quickly (PERF, 2015).
When dealing with citizens, officers are always dealing with unknowns or unfamiliar
circumstances and must use their discretion in how to approach a situation. Most officers
create perceptual shorthand typologies of people that consist of identifying them as
potentially threatening or dangerous, or “symbolic assailants” (Skolnick & Fyfe, 1993, p.
97). This heightened state of readiness could lead to certain behaviors, or elevated levels
of force, that can induce disrespect from the citizen. Such escalated behavior could be
indicative of a broader culture within police departments.
Community-level characteristics. Broader structural characteristics of an area,
such as the violent crime arrest rate, homicide rate, and population size, may also impact
police officer behavior and perceptions (Kania & Mackey, 1977; Fyfe, 1980, 1988;
Geller & Karales, 1981b; Alpert, 1989). These social and ecological aspects of areas can
also influence a police officer’s perceptions of how deserving a community might be of
police services, which can influence an officer’s response (Klinger, 1997; Lum, 2010).
From a conflict perspective, areas with large populations of minorities are viewed as
living outside of mainstream America and partaking in subcultures of violence (Sorenson
et al., 1993; Wolfgang & Ferracuti, 1967). Research has cited abusive police practices
(Reiss, 1968, 1971; Skolnick & Fyfe, 1993; Smith, 1986; Westley, 1953, 1970, Worden,
1996) and an increased likelihood of engaging in deadly force (Jacobs & O’Brien, 1998;
Liska & Yu, 1992; Sorensen et al., 1993) as having a significant relationship with the
racial composition of an area. While the race of an individual might not necessarily
influence police use of force decisions, the racial composition of neighborhood has been
35
linked to the use of coercive force (Smith, 1986). In such communities, ARDs due to
police use of force may reflect police perceptions of minority threat (Liska & Yu, 1992).
Racial composition is not the only neighborhood context that can influence police
behavior. High levels of economic inequality have also been found to influence the use of
higher levels of force by police officers (Jacobs & Britt, 1979; Sorenson et al., 1993;
Terrill & Reisig, 2003). Additionally, other research has uncovered that the use of deadly
force by police officers is related to the prevalence of community-level violence (Alpert,
1989; Fyfe, 1980; Geller & Karales, 1981b; Jacobs & Britt, 1979; Kania & Mackey,
1977; Liska & Yu, 1992; Matulia, 1985; Sherman & Langworthy, 1979; Sorensen et al.,
1993; White, 2003). In other words, police officers are more likely to use higher levels of
force in neighborhoods with more crime and disadvantage (Terrill & Reisig, 2003),
which can lead to a higher rate of arrest-related deaths due to police use of lethal force.
Less-Lethal Alternatives to the Firearm
Law enforcement agencies do not operate in a vacuum and are continually
influenced by the broader social context, especially when it comes to the use of lethal
force. During the 1850s, police officers started to routinely carry firearms, which has
caused controversy and public outcry since (Klinger, 2007). In the 1960s, public concerns
were then exacerbated by the deinstitutionalization of psychologically and emotionally
disturbed individuals who became a matter for the police and the criminal justice system
instead of health officials (Deane, Steadman, Borum, Veysey, & Morrissey, 1999;
Klinger, 2007; Teplin & Pruett, 1992). Coupled with the rise of order maintenance and
community-oriented policing, police contact with emotionally disturbed individuals who
sometimes pose a threat to him or herself and or others increased the potentiality of a
36
violent encounter and the likelihood of lethal force (Engel & Silver, 2001; Geller & Scott,
1992; Klinger, 2007). During the 1980s and 1990s, in response to such circumstances,
law enforcement began to focus on the development of less-lethal options to reduce
reliance on the firearm and increase both officer and public safety (Alpert, Smith,
Kaminski, Fridell, & Kubu, 2011; Vilke & Chan, 2007). Such less-lethal options include
impact munitions, chemical agents, and conducted energy devices.
Impact munitions. The development of impact munitions began in the 1960s and
1970s and allowed for police, particularly the Special Weapons and Tactics (SWAT)
teams, to control social unrest, such as race riots and civil disturbances, from a distance
(Klinger, 2007). This type of less-lethal option included the projectile launch of wooden
dowels, foam rubber projectiles, and beanbags. Such tools were able to deliver an
impactful blow without causing serious injury or death (Klinger, 2007). Eventually,
patrol officers incorporated the use of impact munitions when dealing with citizens armed
with edged weapons or other non-firearm weapons. It is not clear how many police
departments employ the use of impact munitions to date (Hickman & Reaves, 2003,
2006; Klinger, 2007), but research has revealed that arrest-related deaths can also occur
with the use of less-lethal tools (Hubbs & Klinger, 2004). For example, if an impact
munitions strikes a certain area of the body, such as the throat or near vital organs, or an
individual experiences multiple hits, then a potentiality for an ARD exists (Hubbs &
Klinger, 2004). While the possibility of citizen death can occur with the use of this type
of less-lethal tool, the number of known deaths due to impact munitions remains low, in
large part because use of these devices remains infrequent (Klinger, 2004).
37
Chemical agents. The emergence of less-lethal options also included the
development of chemical agents, such as CS and CN (tear gas) during the mid-1960s
(Kaminski, Edwards, & Johnson, 1998), and most notably oleoresin capsicum (OC)
during the 1990s. More commonly known as pepper spray, OC has become the chemical
agent of choice among law enforcement agencies and has been increasingly used during
resistive and forceful police-citizen encounters (Kaminski et al., 1998; McEwan &
Leahy, 1994; Pate & Fridell, 1993; Reaves & Smith, 1995). Evaluations of OC spray use
by police departments have indicated a decrease in the use of physical force by police
officers and citizens, officer and suspect injuries, and excessive force complaints (e.g.,
Gauvin, 1994; IACP, 1995; Kaminski et al., 1998; Lumb & Friday, 1997; Morabito &
Doerner, 1997).
Despite the recorded usefulness of OC, a number of negative side effects have
raised questions about its use. Some researchers have found that OC can cause skin
irritation, corneal and vocal cord damage, and breathing difficulties among individuals
with asthma (Brown, 1997; Dboutet, 1997; Petty, 1997). In an effort to understand the
effects, the National Institute of Justice funded a number of studies to examine the safety
and effectiveness of OC spray (Edwards, Granfield, & Onnen, 1997; Granfield, Onnen, &
Petty, 1994; Petty, 2004). Overall, reviews of the medical research revealed that OC
spray poses minimal health risks (Brown, 1997; Petty, 1997; Ruddick, 1993).
Additionally, studies have not been able to definitively link OC spray and deaths
of citizens, but they have occurred (Vilke & Chan, 2007). Other factors, such as drug
intoxication, positional asphyxia, and pre-existing health conditions, have been found to
exacerbate the risk of arrest-related deaths of citizens associated with OC (Granfield,
38
Onnen, & Petty, 1994; Petty, 1997; Steffee, Lantz, Flannagan, Thompson, & Jason,
1995). Such risks have ignited controversies among the public, which have resulted in
attempts to restrict law enforcement’s use of OC (Kaminski et al., 1998).
Conducted energy devices. In more recent years, conducted electrical devices,
such as the TASER3, have gained increasing popularity as a less-lethal option due to its
incapacitating effects in lieu of lethal force options. The TASER fires two probes at an
individual at the rate of 180 feet per second and delivers a 50,000-volt shock for five
seconds (Vilke & Chan, 2007). This inflicts acute discomfort upon an individual while
incapacitating him or her allowing police officers to subdue the individual and gain
control (Vilke & Chan, 2007). Recently, the Bureau of Justice Statistics reported that
more than 12,000 law enforcement agencies authorized the use of TASER devices for
their police officers (Reaves, 2015). The amount of law enforcement agencies employing
the use of TASER devices has increased from 7 percent in 2000 to 81 percent in 2013
(Reaves, 2015).
Similar to OC spray, the use of the TASER has also sparked controversy among
the public regarding the use, effectiveness, and potential negative outcomes of an
exposure. Questions regarding when, against whom, and under what conditions the
TASER should be used has fueled public concerns (Adams & Jennison, 2007; Alpert &
Dunham, 2010; Amnesty International, 2007; Morrison, 2009). In an effort to quell public
concerns and decrease departmental variation and use, the Police Executive Research
3 The TASER is one brand of CED, but is most commonly used across the United States and the world. Among107 different countries, more than 16,000 police departments have purchased the device (http://www.taser.com; National Institute of Justice, 2011). Based on this, the current study uses the term TASER and TASER-proximate to described arrest-related deaths that have occurred after the TASER has been used (see White et al., 2013).
39
Forum (PERF; 2005) and the International Association of Chiefs of Police (IACP; 2005)
created guidelines for police departments to follow when adopting the use of the TASER.
The guidelines include limiting the use of the TASER against certain individuals. For
example, both sets of guidelines recommend that the TASER not be used against children
or the elderly, except for emergencies, and it should only be used against suspects who
are actively resisting (IACP, 2005; PERF, 2005).
Researchers have taken it upon themselves to examine the effectiveness of the
TASER as well as the potential for negative outcomes, including arrest-related deaths.
White and Ready (2007, 2010) used officer satisfaction as a measure of TASER
effectiveness in their study of TASER incidents from a large metropolitan police
department for 2002 to 2004. They found officer satisfaction levels to be high,
particularly in encounters with greater risk (White & Ready, 2007). Lin and Jones (2010)
found in their examination of TASER deployments from the Washington State Patrol that
the TASER was more effective in non-life threatening situations. In a subsequent study,
White and Ready (2010) identified other characteristics linked to effectiveness. In an
analysis of TASER deployments by the New York City Police Department (NYPD) from
2002 to 2005, they found the device to be more effective when the suspect and officer
were more than three feet apart, both darts struck the intended target, the suspect weighed
200 pounds or less, and the suspect had a gun or knife (White & Ready, 2010). Overall,
the rate of effectiveness is rather high in terms of stopping resistance, ranging from 80 to
90 percent (Taser International, 2006; White & Ready, 2007).
Research that examines potential negative physiological outcomes of TASER
exposure can be separated into two lines of research: citizen and officer injuries and
40
adverse physiological effects. Most research suggests that the use of the TASER
decreases both officer and citizen injuries (Jenkinson, Neeson, & Bleetman, 2006; PERF,
2009; Smith, Kaminski, Rojek, Alpert, & Mathis, 2007; Taylor & Woods, 2010).
Moreover, advocates of TASER have argued that the tool can be used in lieu of lethal
force as well as other less-lethal tools that result in serious injury or death (Heck, 2003;
McBride & Tedder, 2005; Bureau of Justice Statistics, 1999). Investigations of suspect
injuries have cited injury rates ranging from about 14 percent (Durose, Schmitt, &
Langan, 2005; Kaminski, DiGiovanni, & Downs, 2004; Smith & Petrocelli, 2002) to
about 40 percent (Alpert & Dunham, 2004; Henriquez, 1999). Despite varying reported
rates, the investigations found that most of the injuries were minor, such as bruises,
abrasions, and muscle strains and sprains (Alpert & Dunham, 2004; Henriquez, 1999;
Kaminski et al., 2004; Smith, Kaminski, Rojek, Alpert, & Mathis, 2007; Smith &
Petrocelli, 2002). Examinations of officer injuries have also yielded varying rates of
injuries ranging from around 10 percent (Henriquez, 1999; Kaminski et al., 2004; Smith
& Petrocelli, 2002) to around 20 or 30 percent (Alpert & Dunham, 2000, 2004; Kaminski
& Sorensen, 1995). Again, however, most injuries were found to be relatively minor
(Alpert & Dunham, 2000; Kaminski et al., 2004; Smith et al., 2007; Smith & Petrocelli,
2002), especially in comparison to using bodily force (Alpert & Dunham, 2000).
Other studies, however, have called into question the benefits and safety of the
TASER (Lin & Jones, 2010; PERF, 2006; Terrill & Paoline, 2012). Lin and Jones (2010)
found that citizen injuries resulting from TASER use were less likely one year, but the
following year injuries were more likely to occur in comparison to when other types of
force were used. Another study comparing less-lethal forms of force conducted by the
41
Police Executive Research Forum (PERF; 2006) found the TASER to be related to an
increased probability of citizen injury. The study also revealed a relationship between the
TASER and increased odds of citizens requiring medical attention and hospitalization
(PERF, 2006). Similarly, Terrill and Paoline (2012) found an increased likelihood of
citizen injury as well as severity of injury and likelihood of hospitalization when the
TASER was used alone or with other types of force. In their exploration of citizen
injuries, Terrill and Paoline (2012) include any laceration that may draw blood as a
moderate injury, which might also include the puncture wounds sustained from the
probes of the TASER. These studies raise concerns over how injuries are being
measured. The public might still perceive puncture wounds as an illegitimate use of force
and increase the risk of public distrust of police (Terrill & Paoline, 2012).
Research about the potential physiological outcomes has been more consistent.
Several medical researchers have conducted controlled experiments on healthy human
volunteers to explore the relationship between TASER use and cardiac rhythm
disturbances, breathing, metabolic effects, and stress (Ho, Miner, Lakireddy, Bultman, &
Heegaard, 2006; Levine, Sloane, Chan, Vilke, & Dunford, 2005; McDaniel, Stratbucker,
Roeder, & Nerheim, 2003; Vioke & Chan, 2007). Consistently, the medical research has
revealed that the use of the TASER device does not increase the risk of death or pose
health risks to healthy human adults (Vilke & Chan, 2007). Occasionally, however,
individuals die unexpectedly while in custody after being shocked with a TASER.
According to Taser International (http://www.taser.com), TASERs have been
deployed over two million times. A report from Amnesty International (2013) cites that
540 people have died after being shocked by a TASER since 2001. One study identified
42
392 TASER-proximate arrest-related deaths from 2001-2008 in the United States, which
the authors argued represented nearly all such cases (White, Ready, Riggs, Dawes, Hinz,
& Ho, 2013). One study that examined ExDS cases in Los Angeles County from 1992 to
1998 found that out of 18 deaths, five of the deaths involved a CED (Stratton, Rogers,
Brickett, & Gruzinski, 2001). Ho and colleagues (2009) conducted an analysis of media
sources on all types of ARDs for a 12-month period and found that 50 of the 162
identified ARDs involved the use of a CED. Of the few studies that have examined
TASER-proximate ARDs, none have conclusively identified the TASER as a direct cause
of death (Alpert, Smith, Kaminski, Fridell, MacDonald, & Kubu, 2011). Additionally,
White and colleagues (2013), who used media sources in conjunction with medical
examiner (ME) reports to provide descriptive statistics, found the events to be dynamic
encounters with a number of factors contributing to civilian deaths, but they did not find
evidence that identified the TASER as a common cause of death. Studies have cited,
however, excited delirium (ExDS) as a common factor associated with TASER exposure
and sudden, in-custody deaths (e.g., Wetli, Mash, & Karch, 1996; Williams, 2013).
Excited delirium includes physiological features such as agitation, incoherence,
hyperthermia, paranoia, inappropriate and often violent behavior, constant motion, and
feats of incredible strength (Ho et al., 2006). Given the limited research on ExDS,
additional scientific inquiry is needed to improve our understanding of the phenomenon.
Sudden death
The question then, is why do individuals suddenly die while in police custody
when less-lethal forms of force are used? It is important to gather information on all
aspects of the ARD event to provide a full account of contributing factors. In the case of
43
deaths after the use of OC spray, the consideration of positional asphyxiation is
particularly salient. Research examining ARDs after the use of OC spray has found an
increased likelihood that the decedent was restrained or placed in the prone position,
meaning the individual was forced to lie flat on the ground with his or her chest down
and back up (Steffee et al., 1995). Being placed in such a position can be particularly
detrimental to the health of the individual. Death due to positional asphyxia occurs when
the body position obstructs normal gas exchange because it is impossible to move to
another position (Krauskopf et al., 2008). The resulting death is due to passive
entrapment, or essentially being physically or mechanically entrapped by another person
(Krauskopf et al., 2008), such as a police officer who is restraining a citizen. The
mechanism of positional asphyxiation, however, is not the impairment of respiratory
functioning, or suffocation (Ho et al., 2011; Krauskopf et al., 2008).
Recent medical research has suggested that being placed in the prone position,
especially with weight force applied to the thorax (the area between the head and the
abdomen), increases the risk of death due to an impairment of the inferior vena cava
(IVC; Ho et al., 2011). During an encounter, police officers may apply pressure, usually
with a knee or hand, to the back of the thorax to subdue and restrain a suspect
(Krauskopf, Obendorfer, Hudabiunigg, et al., 2006). Weight force to the thorax decreases
the diameter of the IVC (i.e., makes it smaller), which then restricts the flow of blood to
the heart (Ho et al., 2011). The more weight applied to the thorax, the greater likelihood
of death (Ho et al., 2011; Krauskopf et al., 2008).
Sudden ARDs have also been linked to cardiovascular problems following a
physiologically stimulating encounter with police. In a study of 62 healthy individuals,
44
Ho and colleagues (2010) simulated police-citizen encounters by randomly assigning
participants to five different conditions, which simulated arrest-related events4. After the
participation in his or her assigned condition, researchers drew blood to measure
catecholamine, Ph, lactate, and potassium levels every two minutes for the 10 minutes
following the tasks. This study explored the risk of sudden in-custody deaths through the
examination of acidosis and catecholamine. Metabolic acidosis occurs when the body
produces too much acid and the pH level of the blood becomes too low, which can cause
autonomic instability, depressed myocardial function, arrhythmias, and cardiovascular
collapse (Ho et al., 2010). Increases in catecholamine can result in increases in heart rate,
blood pressure, glucose levels, and can elicit a general response from the sympathetic
nervous system, which can also increase the risk of cardiac arrhythmia and ischemia, or
the restriction of blood to tissues and shortage of oxygen and glucose needed to keep
tissues alive (Dimsdale, Hartley, Guiney, Ruskin, & Greenblatt, 1984; Ho et al., 2010).
Ho and colleagues (2010) found that increases in physical exertion decreased pH
levels of the blood and increased catecholamine levels, supporting the idea that
physically stimulating police-citizen interactions increase the risk of death. A number of
factors may aggravate the risk of death, such as subsequent restraint (especially in the
prone position), illicit stimulant abuse, agitated behavior, excited delirium syndrome
(ExDS), and heavy physical resistance to police officers (Ho et al., 2010; Stratton,
Rogers, Brickett, & Gruzinski, 2008). Furthermore, OC exposure was found to cause
continually rising catecholamine levels, suggesting that monitoring after OC exposure is
4 Condition one included a 150-meter sprint and wall hurdle to simulate flight from arrest. Condition two required participants to strike a heavy bag for 45 seconds, which simulated physical resistance. Condition three exposed participants to a 10-second TASER shock. In condition four the use of a K-9 was employed to simulate fleeing and resistance. Condition five included OC exposure to the face and neck.
45
warranted. Exposure to the TASER did not increase the risk of acidosis differently than
continued exertion (Ho et al., 2010). Ho and colleagues (2006) presented a similar
finding in an earlier study of TASER exposure in resting adults.
In an examination of 37 autopsy reports of TASER-proximate ARDs, Strote
(2006) analyzed patient demographics, preexisting cardiac disease, toxicology, evidence
of excited delirium, restraint techniques, and listed cause of death. Similar to Ho and
colleagues (2010, 2011), Strote did not find the TASER to be the cause of death. It was
mentioned in 13 cases (35.1%) when discussing the cause of death, but only as a
contributing factor in four cases (10.8%). Moreover, 17 of the deaths were due to
stimulant intoxication (48.6%), while cardiopulmonary arrest, sudden death, and cardiac
arrhythmia were listed as the cause in 12 cases (32.4%). Excited delirium was also cited
as a factor in 28 of the cases (75.7%). The findings from these studies suggest that a
number of other factors must be taken into account other than just police use of restraints
and less-lethal tool exposure (for a more comprehensive review of the literature see
Howard, 2013; Vilke & Chan, 2007). Arrest-related death events are dynamic and must
be systematically catalogued to adequately identify police practices that generate an
increased risk of citizen death.
Data Sources
Since the 1960s, scholars have consistently emphasized the problems that arise
from police use of deadly force. Researchers have predominantly focused on officer-
involved shootings. The focus on this type of event is also echoed in the type of data that
is currently being collected. For example, the Federal Bureau of Investigation’s (FBI)
Supplementary Homicide Report (SHR) data as well as the Center for Disease Control
46
and Prevention (CDC) collect national data on homicides by law enforcement, also
termed deaths by legal interventions. These types of incidents, however, mostly capture
officer-involved shootings of citizens and deaths deemed as homicide due to police
action. They exclude other deaths that might occur during an ARD or when an officer
uses a lower level of force (such as TASER exposure) because the events are categorized
as a medical problem, such as cardiac arrest. Furthermore, across data sources, problems
of incompleteness and availability persist (Klinger, 2008; Loftin, Wiersema, McDowall,
& Dobrin, 2003).
In 1979, Sherman and Langworthy conducted a comparison of justifiable
homicide counts for thirty-six jurisdictions for various years between 1966 and 1976
using data from the National Center for Health Statistics (NCHS) and alternative data
sources, mainly police internal affairs records. They found that justifiable homicide
counts were inconsistent between data sources. Notably, homicide was underreported at a
rate of about fifty percent (Sherman & Langworthy, 1979). In 2002, Fyfe reviewed data
from a number of different sources to explore the state of deadly force data. In comparing
large police agency data, use of force data from the Bureau of Justice Statistics (BJS) and
the National Institute of Justice (NIJ), and the FBI’s SHR justifiable homicide counts to
one another, Fyfe (2002) concluded that while these data sets provide some insight as to
when and what is occurring in deadly force events, they are still only estimates. Fyfe
(2002) concluded that, “we still live in a society in which the best data on police use of
force come to use not from the government or from scholars, but from the Washington
Post” (p. 99).
47
The FBI’s SHR is the longest running, national-level incident-based dataset for
homicides that occur in the United States (Pizarro & Zeoli, 2013). Data depends on the
voluntary participation of local law enforcement agencies across the United States. Under
the collection, the FBI gathers information about the victim and offender, the relationship
between the two, the weapon involved, and the circumstances of the encounter (Loftin et
al., 2003). Officers are also asked to provide a brief statement regarding the
circumstances surrounding the citizen’s death (FBI, 1984). The death is coded as a
justifiable homicide if the individual is killed by a police officer, or a person with
specified legal authority to use deadly force, acting in the line of duty (Loftin et al.,
2003). Pizarro and Zeoli (2013) recently examined the SHR and concluded that the two
main limitations of the data are underreporting and missing information.
The questionable reliability of data is echoed by Klinger’s (2008) review of the
SHR justifiable homicide counts in comparison to the DCRP ARD’s officer-involved
shooting death counts from 2003 to 2005. Since the SHR data only includes justifiable
homicides counts, Klinger (2008) could not assess the consistency between data
collections for all types of ARDs. He found that the homicide by law enforcement counts
are the same in both data sets for only three states in 2003, ten states in 2004, and eleven
states in 2005 (Klinger, 2008). That is, of the 47 states that actually do participate in the
DCRP, the counts match the SHR counts only 24 times over a three year period, or 24
matches out of a total possible 141 matches (17%). Klinger’s (2008) comparison
underscores the problems with existing government run collections and reiterates that
neither source should be too heavily relied upon for accuracy.
48
Several years prior, the SHR’s justifiable homicide data were compared to the
justifiable homicide data collected by the National Vital Statistics System (NVSS) of the
National Center for Health Statistics. Loftin and colleagues (2003) assessed the
consistency of both reporting systems for a 23-year period ranging from 1976 to 1998.
Overall, they found the SHR estimate to be 29 percent larger than the NVSS, which
demonstrates that the SHR reports more justifiable homicides. Stratification of states’
reporting, however, revealed that 29 states reported more cases to NVSS over the SHR
(Loftin et al., 2003). Underreporting to the SHR is due to a number of agencies that do
not participate in the UCR and, of those that do participate, they do not always file SHR
reports (Wiersema, Loftin, & McDowall, 2000; Maltz, 2000). These findings suggest that
both systems underreport and further support the question and answer posed by Klinger
(2008): “how can we have any faith that SHR data provide an accurate picture of how
frequently U.S. police officers kill citizens? The clear answer is that we cannot” (p. 607).
Another source of data comes from the Center for Disease Control and Prevention
(CDC), which gathers information on homicides by law enforcement and labels such
events as deaths by legal intervention. The CDC National Center for Health Statistics
(NCHS) uses death certificates to classify deaths according to the International
Classification of Disease, 10th Revision (ICD-10) codes (Breiding & Wiersema, 2006).
The National Violent Death Reporting System (NVDRS), Web-based Injury Statistics
Query and Reporting System (WISQARS), and the Wide-ranging Online Data catalogue
these deaths for Epidemiologic Research (WONDER).
The WONDER data reports health information and is available to the public. It
includes deaths due to legal intervention. The WISQARS data comes from the CDC’s
49
National Vital Statistics System and is made available online (Breiding & Wiersema,
2006). WISQARS also includes deaths labeled as occurring during legal intervention.
Both collection efforts use coroner and medical examiner records for reporting and
represent a source that is independent of official police records. The WONDER and
WISQARS data, however, are not complete national collections of all types of ARDs. In
a BJS Special Report, Mumola (2007) reports count comparisons from the CDC’s NCHS,
the DCRP ARD counts, and the SHR for police-involved shooting deaths. More
specifically, the NCHS reported 679 death by legal intervention, which was 52 deaths
less than reported by the DCRP (731) and 60 deaths less than the SHR (739) for 2003 and
20045 (Mumola, 2007). Overall, the comparison revealed the CDC’s deaths due to legal
intervention counts to be lower than the DCRP’s counts and the SHR’s counts, again
highlighting the inconsistencies between datasets.
The CDC’s National Violent Death Reporting System’s (NVDRS) data is
relatively new and designed to provide a more detailed account of deaths by legal
intervention (Friday, 2006). The collection calls for collaboration between law
enforcement and public health agencies by using death certificates, medical
examiner/coroner records, law enforcement records, and records from crime laboratories
(Friday, 2006). The triangulation of information is more complex than the other CDC
data collections, the DCRP ARD collection, and the SHR collection. The NVDRS seeks
to provide more reliable information to characterize relationships between victims and
offenders, or in this case, citizens and law enforcement (Paulozzi, Mercy, Frazier, &
Annest, 2011). In 2008, Shields and Ward examined the integration of the SHR data with
5 At the time, data from the NCHS on legal intervention deaths were not available (Mumola, 2007).
50
the NVDRS data to inform homicide research and policy. They suggested that the
combination of the two data collections would yield more detailed accounts and enhance
our understanding of these encounters (Paulozzi et al., 2004). Unfortunately, the NVDRS
is currently in place in only 32 states and is not publicly available (Breiding & Wiersema,
2006), although restricted access is granted to only certain eligible groups
(http://www.cdc.gov).
The DCRP’s ARD collection is the only attempt at capturing all types of deaths
that occur in police custody. Housed in BJS, the DCRP collects data on any death of a
person who is either in physical custody, under the physical restraint of law enforcement
officers, or who is being actively sought out by police (Mumola, 2007). Deaths that occur
in the process of arrest include unintentional deaths attributable to certain types of police
contact, such as a carotid hold or placing someone in the prone position for too long (i.e.,
positional asphyxia). Arrest-related deaths may also occur while police are actively
searching for a suspect, such as a foot or vehicle pursuit, but the individual is not yet in
police custody. To be included in the DCRP, the vehicular accident deaths must be
accidents actively caused by law enforcement through the use of police vehicles, spike
strips, roadblocks, or any other means that are caused by the police (Mumola, 2007). The
cases collected by the DCRP do not focus exclusively on deaths by violent means. Other
types of ARDs include accidental injuries, alcohol or drug intoxications, and illness or
natural causes, as long as the death occurred during the process of arrest (or occur in
police custody).
The first report of the DCRP ARD data reviewed all types of ARDs from the
years 2003 to 2005. During the three year period, 47 states and Washington DC reported
51
2,002 ARDs as the first national measurement of all types of deaths that occur in the
process of arrest (Mumola, 2007). Out of the 2,002 ARDs, 1,095, or 55 percent, were
categorized as homicides by law enforcement with 364, 365, and 366 occurring in 2005,
2004, and 2003, respectively (Mumola, 2007). Homicides by law enforcement are
operationalized as deaths due to use of lethal force (i.e., firearm) by the DCRP (Burch,
2011; Mumola, 2007). Other ARD counts included 11 homicides by other persons, 252
deaths due to intoxication, 234 suicide deaths, 140 deaths due to accidental injury, 113
deaths caused by illness or natural causes, and 157 deaths categorized as other or
unknown (Mumola, 2007). More recently, BJS reported ARD characteristics for the years
2003-2009. The DCRP ARD data reported a total of 4,813 deaths with 2,931 categorized
as homicide by law enforcement personnel (Burch, 2011). The rest of the ARD counts
were substantially lower with 27 homicides by other persons, 541 suicide deaths, 525
deaths due to intoxication, 272 accidental injury deaths, 244 deaths occurring from
natural causes, and 273 deaths labeled as unknown. In the BJS reports, males accounted
for more than 90 percent of all ARD cases (Burch, 2011; Mumola, 2007).
Despite the DCRP ARD collection not being publicly available, researchers have
been able to pinpoint its limitations (Klinger, 2008). One limitation involves the
inconsistent reporting practices across states. Mumola (2007) reports that only two states,
Texas and California, have had a mandatory reporting method in place since the time
nationwide data collection began in 2003. The Law Enforcement Unit at BJS worked
with the other states to identify State Reporting Agents (SRA) to assume responsibility
for collecting arrest-related death records throughout each state (Mumola, 2007). Most
states use a SRA to identify in-custody deaths. For the states that do participate, state and
52
local law enforcement agencies commonly volunteer information, but some SRAs turn to
other sources in lieu of information from local law enforcement agencies or to
supplement information received. From 2003-2005, these sources include media accounts
used by 30 states, coroners or medical examiners used by 23 states, Uniform Crime
Report State contacts for 9 states, Attorney’s General offices or prosecutors by 6 states,
and other sources by 7 states (Mumola, 2007).
Inconsistent reporting practices also highlight the incompleteness of the
collection. Differences in reporting methods also raise concerns about the collection’s
ability to capture all ARD cases from state to state. Since the collection is not publicly
available, this has only been assessed on the aggregate level (Klinger, 2008).
Furthermore, participation in the DCRP is voluntary. When the collection began, all 50
states and the District of Columbia were eligible for Violent Offender Incarceration and
Truth in Sentencing (VOI/TIS) grants to assist in the collection of ARDs (Mumola,
2007). States that received the funding were required to report to the DCRP. States that
did not receive funding, however, could not be compelled to report. The most recent
published DCRP data on ARDs from 2003 to 2009 indicated that a number of states did
not submit data to BJS. In an effort to address this issue, BJS staff identified ARD cases
for Arkansas and New Mexico in 2009, and Georgia and Maryland in 2007, 2008, and
2009 (Burch, 2011). Thus, even if the DCRP data were to be made publicly available, it
might not be the most accurate source to assess the nature and prevalence of ARDs.
Media Reports
Since the DCRP is the only national assessment of all-types of ARDs and it is not
publicly available, researchers have turned to other data sources. More specifically,
53
researchers have turned to print media archives to gather information on ARD events (Ho
et al., 2009; White et al., 2013). Media reports arise as a possible data source due to their
availability and since crime-related stories are a salient feature in American media
(Chermak, 1995b, 1998; Chermak & Chapman, 2007; Graber, 1980; Robinson, 2011;
Charrer, 2008; Yanich, 2005). The more salient news topics are usually longer news
articles, and largely involve more violent crimes (Chermak, 1998; Chermak & Chapman,
2007). Moreover, police departments are often the sources for the media. Police
departments often have a public information officer (PIO) that regulates the flow of
information to the news media (Chermak & Chapman, 2007; Skolnick & McCoy, 1985;
Surette & Richard, 1995). This allows the police to promote a positive image by
providing what information they want (Surette, 1998; Chermak & Weiss, 2005; Chermak
et al., 2014). Usually, however, a crime incident receives more coverage when it first
occurs with rarely any follow-up, which gives the impression that the police are effective
(Reiner, 2002).
Of course, police departments are limited in how they control the media message.
Some researchers argue that the media inaccurately portrays crime and criminal justice
practices (Chermak, 1995; Hallett, 2007; Manning, 1997; Surette, 1998). News media has
also been found to overstate the crime problem because police are less effective in
controlling how the media depicts the message when use of force is involved (Chermak,
1994, 1995; Chermak et al., 2006; Tuch & Weitzer, 1997; Skogan & Maxfield, 1981).
For example, the media extensively covers situations involving police corruption,
excessive use of force, or the inability to solve a crime over short periods of time, which
can influence individuals to reevaluate their perceptions of the police (Chermak, 1995,
54
2003; Lawrence, 2000). Other studies have found that African-Americans view the police
less favorably after viewing a televised arrest or police misconduct (Kaminski &
Jefferies, 1998; Tuch & Weitzer, 1997; Weitzer, 2002). Additionally, in Ready and
colleagues’ (2008) content analysis, they found media reports often perpetuated myths
regarding the use of the TASER, such as the device not being effective or being
associated with an increased risk of death. Thus, while police departments may be
working toward better police-community relationships, the media may undermine their
effort.
Despite the known limitations, scholarship using news reports to study how
crimes are presented, how organizations produce stories, and how large amounts of crime
news exposure influences public perceptions has increased considerably over the last
several decades (Chermak, 1995; Marsh, 1989). For example, researchers have used
content analysis to explore the types of sources cited in general crime stories and specific
types of crime stories (Chermak, 1995a, 1995b; Chermak & Weiss, 2005, 2006; Ericson,
Baranek, & Chan, 1987, 1989, 1991). Studies have also focused on what crimes types are
most commonly covered, as well as reporting characteristics of the incident, victim,
suspect, and the status of the investigation or trial (Chermak, 1995a; Doyle, 2006)
Researchers have also explored media reporting of police issues (Chermak,
Scheer, & Wilson, 2014; Chermak & Weiss, 2006). With respect to ARDs, only a few
studies have employed the use of media reports as a data source. Early studies involved
the use of newspaper reports. From 1965 to 1969, Kobler (1975b) collected newspaper
clippings from across the United States regarding homicides of citizens by police
officers. Kobler (1975b) classified, coded, and assessed 911 fatal police-citizen
55
encounters in the course of ordinary duty, excluding riot-related cases. Newspaper
clippings were used because “simple data on police killings are hard to find, and details
of these homicidal encounters are extremely difficult to locate” (Kobler, 1975b, p. 164), a
problem that still exists currently. Kobler (1975b), however, concluded that the data were
too poor for statistical analysis, though he did provide descriptive characteristics of fatal
police-citizen encounters. Similarly, Sherman and Langworthy (1979) assessed the use of
newspaper articles and deemed them flawed and not suitable as a useful data source.
More recently, however, criminological researchers have found media reports to
be a useful data source. The research has commonly focused on TASER incidents and
TASER-proximate ARDS. Ready and colleagues (2008) conducted a content analysis of
media reports and official police data for nonfatal and fatal TASER incidents. The
researchers compared 353 news reports of police incidents involving the TASER to 375
police reports of all TASER deployments within the NYPD from 2002 to 2005. Analysis
of circumstances, suspect characteristics, predictors of suspect resistance, and repeat use
of the TASER by officers, revealed notable consistency across data sources.
Focusing on TASER-proximate ARDs, White and colleagues (2013) examined
392 media reports and 213 autopsy reports to identify patterns surrounding the events.
They also investigated incident-level characteristics and determined TASER-proximate
ARDs to be dynamic events with consistent suspect and officer characteristics over time
(White et al., 2013). Results revealed consistency across media reports and ME reports
for patterns of TASER device use, other force options, and cause of death, which provide
support for media reports as a viable source of data.
56
White and Ready (2009) used media reports as their only source in an empirical
analysis of nonfatal and fatal TASER incidents. Using a content analysis, the authors
identified incident and suspect characteristics. They then use multivariate analyses to
predict TASER-proximate deaths in the news media using the suspect and incident
factors as predictors. Their study underscores the utility of print media. Media reports
often include information from the police and medical examiners, which increase the
accuracy of the data (White & Ready, 2009). Furthermore, fatal incidents are more likely
to be deemed newsworthy because they are controversial (Morrison, 2009). Other
researchers support this approach, but caution about the constraints the data source might
pose due to the interpretation of facts about the TASER from media sources who might
not be as familiar with the technology (Morrison, 2009).
Several medical researchers have used media reports when exploring ARDs.
Strote (2006) used web-based searches of news reports to identify 75 TASER-proximate
deaths over a four-year period beginning January 2001. He then used the identified list of
deaths associated with TASER use to request autopsy reports. Media reports were not
used for analysis purposes, but were used as a first step in identifying TASER-proximate
ARDs, which highlights one component of their utility. Media reports provide
researchers with a starting point and allow them to retrospectively collect data on ARD
events.
Ho et al. (2009) conducted a 12-month prospective, web-based, open-source
search of media print archives of sudden ARDs, which they defined as deaths that are not
classified as homicide or suicide. Using the media reports, they collected information on
demographics, subject behavior, whether or not an illicit stimulant was used by the
57
decedent prior to the ARD event, and types of force used (which they categorize as none,
empty-hand control techniques, intermediate weapons, and deadly force). They found
162 ARD events that met their inclusion criteria during their study period, with the
majority of cases involving males with a mean age of 36 (Ho et al., 2009). The authors
also then obtained autopsy reports in about 50% of those cases to verify some
information, such as alcohol use.
Another more recent study also employed the use of a prospective, web-based,
open-source search of media print archives of ARDs for a 12 state-stratified random
sample (Borrego, 2011)6. The study compared media-identified counts of ARDs to the
DCRP ARD counts for 12 states in 2005, with the goal of determining the accuracy and
completeness of the DCRP ARD collection. The comparisons revealed that the DCRP is
not accurate or complete for the year 2005. Out of 132 comparisons, the DCRP
underreported 16 times, or 12 percent of the time, across 7 different states (Borrego,
2011). This is in accordance with other comparisons of the DCRP data to the SHR data
(Klinger, 2008; Mumola, 2007). Additionally, media report data identified more police-
involved homicide cases for California and Texas, which have a mandatory reporting
system in place (Borrego, 2011).
The second goal of the study was to explore other factors that should be included
in the DCRP since it is the only one of its kind (Borrego, 2011). First, the study found
that the media data consistently reported the city, manner of death, cause of death, and
death location similar to the DCRP (Borrego, 2011). Second the study uncovered several
more valuable variables that it recommended should be added to further understand 6 This current study uses Borrego (2011) as a starting point and seeks to expand upon it by extending data collection to all states over a two-year period.
58
ARDs. These include time of the event, where the event occurred, type of place the event
occurred (e.g., public, private, business), and how police became involved (e.g., types of
calls for service), which were consistently reported in the media (Borrego, 2011). The
study also suggested several other variables not captured consistently by the media or the
DCRP and include mental illness, race of the deceased and the officer, gender of the
officer, number of shots fired and if a TASER was used.
Thus, these key studies suggest that media reports are becoming increasingly
useful for researchers. Stories about critical incidents involving the police have been
found to be generally newsworthy (Chermak, 1995b; Chermak et al., 2014), which
provides further support for the use of media reports in researching ARD events
especially now with the ubiquity of cameraphones and social media (Brown, 2015).
Media now comes from a number of sources including the police and public.
Additionally, other news-based content analyses have been used for police misconduct
(Stinson et al., 2012; 2014), TASER lawsuits (Adams & Jennison, 2007), human
trafficking (Denton, 2010), and other medical and public health topics (e.g., Freifeld,
Mandle, Reis, & Brownstein, 2008). While these studies have not established media
reports as the definitive data source on police actions against citizens, they do highlight
the utility of media reports when other data are not available.
Current Focus
Police-citizen interactions that result in citizen deaths involve a number of
sequential decisions and behaviors from both the police officer and citizen (Binder &
Scharf, 1980). Currently, a few datasets collect information on police-citizen interactions
that result in the police-involved shooting death of a citizen, such as the SHR,
59
WONDER, and WISQARS data. Arrest-related deaths, however, include more than just
police shooting deaths of citizens, such as deaths that occur when other types of force are
used (e.g., TASER or restraints). Moreover, other types of deaths may occur outside the
use of force by police, such as accidental injury caused by others, alcohol or drug
intoxication, and heart attacks or other medical complications (Mumola, 2007). The SHR,
WONDER, and WISQARS collections do not collect information on other types of
ARDs and cannot provide estimates of how many citizens die while in police custody.
The only dataset that collections information on all types ARDs, the DCRP collection, is
not publicly available, has been found to be incomplete (Klinger, 2008), and the
information has only been published as aggregate counts twice (see Burch, 2011;
Mumola, 2007).
Citizen deaths at the hands of the police have the potential to diminish public trust
in law enforcement (Terrill & Paoline, 2012). Scholarship must move beyond just
investigating certain types of ARDs. A national database is needed to take stock of events
that result in citizen deaths in order to maintain public trust and police legitimacy. If
citizens are only privileged to what they view in the media, which often focuses on high-
profile cases (Chermak, 1995b), they are less likely to perceive law enforcement as
legitimate as well as obey the law, comply during police encounters, and cooperate as
victims and witnesses (Tyler, 2004). As previous research has uncovered, police-citizen
encounters are more likely to result in use of lethal force when a citizen in resistant or
presents imminent danger to police and others (Binder & Fridell, 1984; Binder & Scharf,
1980; Fyfe, 1980, 1981a; Kobler, 1975a, b; Margarita, 1980; Robin, 1963). To continue
to not share such data can result in a public safety issue, especially in the wake of current
60
events. The public must trust the institution of justice, or in this case the police, in order
for procedural justice to work (Katz, 2014). Thus, the focus of the current study seeks to
address data limitations by using media reports to create a dataset to explore the
prevalence and nature of all types of ARDs across the United States from 2005 to 2006.
Using media reports will allow for an exhaustive search for all types of in-custody
deaths from every state for a two-year period. How many ARDs exist from 2005 to 2006?
Examining the different types of death over a two-year period will allow for an
examination of the trends. Without a comprehensive count of ARDs it is not possible to
identify if in-custody deaths are increasing or decreasing. Furthermore, having counts of
ARDs from a two-year period will allow for a comparison of media reports to the
DCRP’s aggregate counts of ARDs. The current study will also compare police-involved
shooting counts to those of the FBI’s SHR data collection. Though similar data
comparisons have been completed in the past (Klinger, 2008; Mumola, 2007), the current
study involves a comparison of more recent data from the different data collection
systems. Such comparisons will allow for the assessment of the accuracy of each data
collection effort.
Creating a comprehensive dataset of ARDs will also allow for the exploration of
characteristics associated with different types of in-custody deaths, which prior research
has not provided. That is, the current study seeks to explore how incident, suspect, and
officer characteristics vary by the different types of ARDs, such as police-involved
shootings, suicides or deaths resulting from medical complications. The study will also
examine the types of force used across different types of ARDs in an effort to better
understand the risk associated with both lethal and less-lethal uses of force. Lastly, the

61
current study will explore how different types of ARDs vary by regions of the country.
Overall, the current study seeks to uncover the prevalence and nature of ARDs to better
inform law enforcement policy, and to better protect human life.
62
CHAPTER 3
METHODOLOGY
This dissertation conducts a quantitative content analysis of archived media
articles found on the Internet to objectively look at all types of arrest-related death events
over a two-year period. Researchers use content analysis for three general classes of
research problems that occur in nearly all disciplines. These include research projects
where data accessibility is problematic and the investigator is limited to using
documentary evidence; research where the communicator’s own language use and
structure is necessary and critical; and research where the volume of material exceeds the
investigator’s capability to examine it (Holsti, 1969). Since data accessibility is the
greatest barrier for investigating ARDs, a content analysis of media reports was deemed
the best research method. Furthermore, a quantitative content analysis allows the
researcher to present findings that are separate from the journalists’ opinions as well as
the broader public’s views (Riffe, Lacy, & Fico, 2005). That is, the study findings do not
reflect the opinions of those writing the articles or the broader public.
Data
To start, the current study expands upon an earlier study that compared ARD
counts identified by the media to ARD counts identified by the DCRP ARD collection for
a 12 state-stratified random sample for the year 2005 (Borrego, 2011). The year 2005 was
chosen because when data collection began in 2010 the most current statistics available
via the Deaths In Custody Reporting Program Arrest-Related Death collection was 2005.
Therefore, the current study uses 2005 as the first time point, but expanded the database
to include all 50 states for the years 2005 and 2006. Arrest-related death cases and their
63
corresponding media reports were found through a web-based, retrospective, open-search
of electronic news media reports using LexisNexis Academic, New York Times archives,
HighBeam.com, and Google.
Measurement
The first step in the current content analysis is to identify study units for sampling
(Riffe et al., 2005). In this case, the study unit is electronic news media archives for 2005
and 2006 identified through a list of search terms that characterize arrest-related death
events for all 50 states. The exhaustive list includes 70 search terms identified through
the existing literature as associated with all types of deaths that occur in police custody,
such as police-involved shooting deaths, TASER-proximate deaths, and sudden in-
custody deaths. Search terms include police-involved shootings, TASER deaths, excited
delirium, metabolic acidosis, hostage situation, suicide and other like terms. To be fully
exhaustive, terms that could have a hyphen, such as arrest-related death, was searched for
with and without the hyphen. During the searches for 2006, unique cases, if any, were
tracked to assess the value hyphen and non-hyphenated terms. For a full list, see
Appendix A.
Next, the sampling units were identified. This required the researcher to formulate
a definition of an arrest-related death. For the current study, the definition employed by
the DCRP ARD collection was used as a guideline. The DCRP definition was created in
consultation with the IACP, the National Sheriffs’ Association (NSA), and criminal
justice researchers (Mumola, 2007). Arrest-related death of civilians includes “all
juvenile and adult deaths of criminal and noncriminal individuals whose death was
attributed to events that occurred during an interaction with state or local law
64
enforcement personnel” (http://bjs.gov). Arrest-related deaths are attributed “to any use-
of-force by state or local law enforcement; injuries sustained while attempting to elude
law enforcement or injuries incurred in custody; self-imposed events, such as suicides,
accidents caused by the decedent, and intoxication; and medical conditions or illness”
(http://bjs.gov). In the case of suicides, law enforcement officers had to have been in
some kind of contact with the individual prior to the suicide (Mumola, 2007). The death
can occur in police-custody, at the scene of the event, on the way to a hospital facility, in
a hospital facility, on the way to a booking facility, or in a holding facility. The DCRP
program also excludes deaths if they include bystanders, hostages, and law enforcement
(line of duty deaths); deaths caused by federal law enforcement; deaths of wanted
criminal suspects prior to police contact; and deaths by vehicular pursuits without any
direct police action, such as using spike strips or a police vehicle (Mumola, 2007). Deaths
that occurred in a jail or prison after booking were excluded from the DCRP.
The current study adopted the DCRP definition as a guideline but included some
additional stipulations. First, the current dissertation does not restrict ARDs that only
include state or local law enforcement. Arrest-related deaths involving federal law
enforcement are also included. Oftentimes if a federal law enforcement agency is
involved they are working with a state or local agency. Second, the current study includes
deaths that occur during a vehicle pursuit even if it does not occur from direct police
action. In some instances the individual being pursued crashes a vehicle and subsequently
died due to other reasons, such as driving too fast or erratic driving. This falls under the
category of injuries sustained while attempting to elude law enforcement. Third, the
current study gathers information on deaths of third parties, but does not include them in
65
the analyses at this time. Third party deaths include deaths of innocent bystanders or
hostages. Some third party deaths are attributable to police action, such as using a firearm
on a crowded street and subsequently killing an innocent bystander. It is important to
track deaths that are caused by police action even if the individual was not subject to
police intervention. Lastly, if the death occurred after 48-hours of the ARD event or in a
booking facility, media reports were carefully examined to identify whether or not the
death was related to the events that occurred during the police-citizen encounter7. Deaths
that occurred in a jail facility were examined further and only included if the death
occurred prior to being booked into a jail facility8.
The third step involves identifying the recording units, or in this case, the types of
arrest-related deaths, as well as the other characteristics about each event. The main
recording unit is the classification of ARDs. The categories of ARDs include police-
involved shootings (PIS), other police-involved homicide (OH), suicide (S), accidental
injury to self (AIS), accidental injury caused by others (AIO), alcohol/drug intoxication
(ADI), medical problem (MP), unknown (U), and third party death (TP). This coding
scheme was also developed based on the DCRP ARD collection. The main difference
between the current study and DCRP schemes is that police-involved homicides are
broken into two categories in the current study. The DCRP ARD data operationalizes
police homicides as deaths occurring from lethal force (Mumola, 2007). Categorizing it
as such does not capture other deaths that are deemed as homicides, such as deaths 7 The 48-hour period is consistent with prior research on ARDs (e.g., Ho et al., 2009; White et al., 2013). Longer time frames create difficulty in identifying if the cause of death stemmed from the ARD. Encounters where the citizen sustained any life-threatening injuries or experienced any negative physiological reactions and died after the 48-hour period were included in the study. 8 Articles that describe incidents occurring in a booking facility were examined and coded as occurring before or after booking. Information about the death was coded and excluded from analysis if the death occurred after arraignment.
66
resulting from chokeholds or excessive use of force. Thus the current study separates
police-involved shootings to denote citizen deaths due to use of lethal force in the form of
a firearm, and other police-involved homicides to capture homicides due to other types of
police intervention that do not involve the use of a firearm.
Examples of suicides include an individual shooting him or herself, hanging him
or herself, or jumping off a building in police presence or while being pursued by police
after having initial contact. Individuals who commit suicide before police have made
contact with the suspect are excluded. Accidental injury to self includes deaths such as an
individual choking on a bag of drugs that he or she swallowed to avoid detection during a
police encounter or getting in a car accident during a police chase9. Deaths due to
accidental injuries caused by others occur when a third party causes injury to the suspect
during the arrest-related event. Alcohol/drug intoxication is characterized by individuals
who overdose on alcohol or drugs during the arrest-related event. Medical problems
include deaths that are due to physiological complications, such as cardiac arrest or an
asthma attack. In some instances the media does not report the cause of death. In these
cases, the death is categorized as unknown. Lastly, the third party definition refers to any
death of a third party caused by events surrounding the police-citizen encounter. This
may include an innocent bystander getting shot during a shootout or hostage situation, or
a bystander being hit by a car during a police chase.
The other recording units include the demographic information of the deceased
involved in the event, the characteristics surrounding the death, the incident
characteristics surrounding the death, the actions and behavior of the deceased, the 9 If police employed the use of spike strips to blow out tires or forced the individual off the road, then the death would be categorized as other homicide.
67
actions and behavior of the police officer(s) involved, and the location of the death. If the
ARD occurred in the process of booking, jail characteristics are also gathered. Within
each of these categories are individual variables to empirically assess the nature of in-
custody deaths.
Conducting the Searches
Electronic media reports were searched using LexisNexis Academic, New York
Times archives, and HighBeam Research as the primary search engines. When searching
in LexisNexis Academic, search terms were entered into the News search database. The
particular year (i.e., 2005, 2006) was entered into the “Search within Results” field to
further refine the search. To ensure no cases were excluded when further refining the
search, full results for the first search term were compared to the results from the refined
search. For example, results for the search term “in-custody death” were compared to a
search that use “in-custody death” entered in the first search field with “2005” entered
into the “Search within Results” field. Comparisons revealed that no news articles were
eliminated when results were refined per year.
When searching for articles using the New York Times archives, the same search
terms were used. A date range of January 1 of the search year to the current date was also
entered. This allowed for the identification of news articles about the death when it first
occurred and subsequent articles that may provide updated information, such as medical
examiner findings or toxicology reports. Searches in the HighBeam Research search
engine again used the same terms. This search engine also made use of date ranges from
January 1 of the search year to the “current date,” or the date in which the search was
conducted.
68
Together the three search engines yielded a large number of media reports with
each of the three different Internet sites returning unique ARD cases. Therefore using 3
main search engines provided the most coverage. The LexisNexis Academic (2015)
database granted access to about 3,000 vetted news websites from the United States and
across the world as well as broadcast transcripts from major television and radio
networks. The HighBeam Research (2015) database provided access to 1,367 online
newspapers from across the world. Most of the ARD cases came from these two
databases. The New York Times archive section was the most limited since it is only one
paper and was only fruitful for the year 2005. The coverage included the New York area
and other high profile stories that received national attention.
If the searches returned news media articles with little information, a search in the
Google search engine was conducted to look for other news articles that may have more
information10. Accordingly, a number of ARD cases had multiple articles for that one
arrest-related death event. The media archive article was then saved electronically in a
Microsoft Word document. Electronic folders were categorized into region as presented
in Table 111. Each region then contained a folder for the corresponding states. Each state
folder included a 2005 and 2006 folder. The articles were saved with the file name that
included the last name of the deceased, the type of death, and the state. If deaths had
multiple articles, those were all saved in the same file electronically.
Two researchers conducted the Internet searches, which included one primary
researcher and an undergraduate researcher. The primary researcher trained the
10 During the search period Google News Archives only yielded a small number of images of newspapers (less than 10) and was therefore not included as a search engine. 11 Regions were identified in the earlier study (Borrego, 2011) and followed the categorization used by BJS for the DCRP.
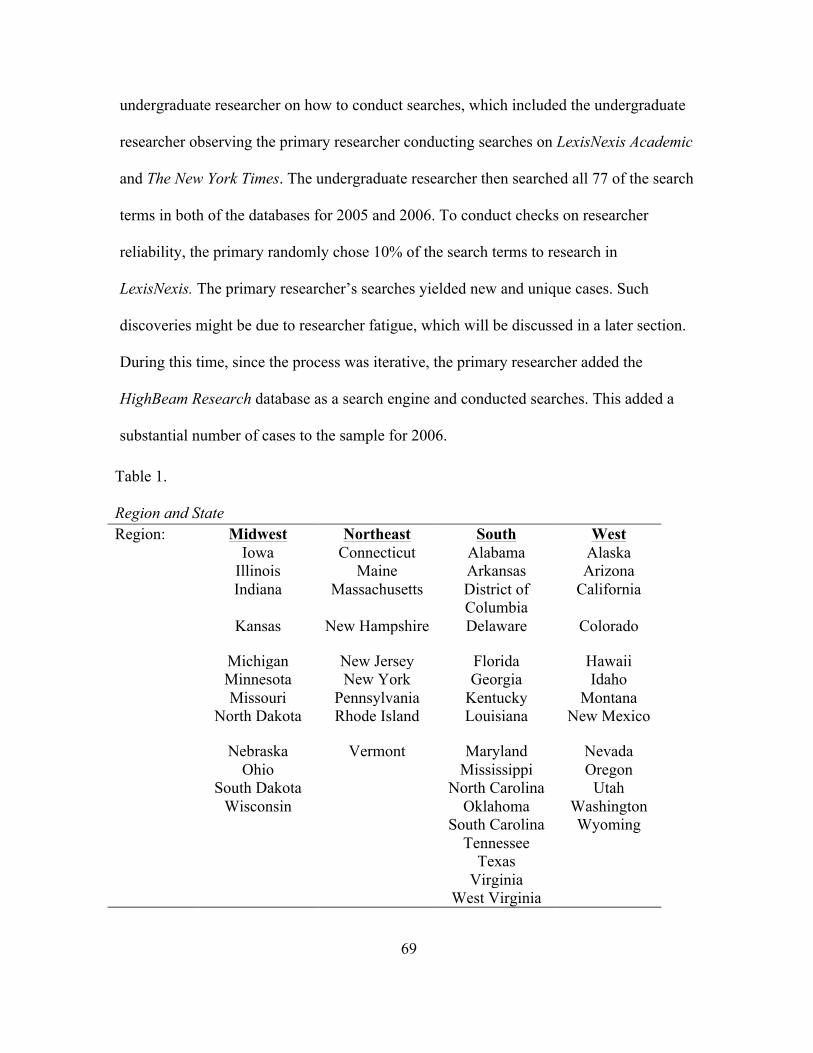
69
undergraduate researcher on how to conduct searches, which included the undergraduate
researcher observing the primary researcher conducting searches on LexisNexis Academic
and The New York Times. The undergraduate researcher then searched all 77 of the search
terms in both of the databases for 2005 and 2006. To conduct checks on researcher
reliability, the primary randomly chose 10% of the search terms to research in
LexisNexis. The primary researcher’s searches yielded new and unique cases. Such
discoveries might be due to researcher fatigue, which will be discussed in a later section.
During this time, since the process was iterative, the primary researcher added the
HighBeam Research database as a search engine and conducted searches. This added a
substantial number of cases to the sample for 2006.
Table 1. Region and State Region: Midwest Northeast South West Iowa Connecticut Alabama Alaska Illinois Maine Arkansas Arizona Indiana Massachusetts District of
Columbia California
Kansas New Hampshire Delaware Colorado
Michigan New Jersey Florida Hawaii Minnesota New York Georgia Idaho Missouri Pennsylvania Kentucky Montana North Dakota Rhode Island Louisiana New Mexico
Nebraska Vermont Maryland Nevada Ohio Mississippi Oregon South Dakota North Carolina Utah Wisconsin Oklahoma Washington South Carolina Wyoming Tennessee Texas Virginia West Virginia
70
Coding. Coding each ARD case is the fourth step in the process. Once a death
was identified and saved electronically, it was then entered into a database that
quantitatively coded for different characteristics. The current study used the reporting
document, known as the CJ-11A, employed by the DCRP ARD program from 2005 as a
starting point for the identification of the different recording units. See Appendix C for
the coding form used by the DCRP ARD program.
Using the variables presented in the CJ-11A along with variables commonly used
in the existing literature, the current study started with a coding instrument with 104
variables (Borrego, 2011). These variables were then operationalized and turned into
questions to create a coding form so that they may be quantitatively recorded. The
process was iterative and continually updated to reflect the variation of information, as
well as information deemed important to more fully capture the complex nature of deadly
police-citizen interactions. Ultimately, the coding instrument consists of 132 variables for
deaths that occur before being transported to a booking facility with an additional 18
variables if the death-inducing events or death itself occurred during the process of
booking at a law enforcement facility. The 151 variables were then organized into the
categories of demographics (e.g., state, year, name of deceased), death characteristics
(e.g., manner of death, number of injuries if applicable), incident characteristics (e.g.,
how contact was made), deceased characteristics (e.g., type of behavior, weapon use,
substance use, past criminal history), police officer(s) characteristics (e.g., use of force,
number of officers), and location characteristics (e.g., where the deceased died/was
pronounced dead, where the event took place), and jail death characteristics (e.g., was the
71
deceased exhibiting any health or mental health problems, did law enforcement personnel
use any force).
Coding included the objective characterization of the information provided in
each media report. This was conducted by four researchers, which included one primary
researcher and three undergraduate student researchers. The primary researcher trained
the undergraduate student researchers on how to objectively code the information. That
is, they did not interpret information to align with any biases or opinions they might have
had about the information presented by the media. They did not infer any information and
only coded what was provided.
Initial training involved all four researchers sitting together and coding the same
media report. Differences in coding were discussed after to ensure that all three
undergraduate researchers clearly understood how to code each item. In efforts to reduce
coder bias, the four researchers met weekly for several months to discuss and clarify any
questions or problems the researchers encountered each week. The three undergraduate
student researchers coded 9.3% of the cases, or 73 cases. The primary researcher
completed a coder reliability check by recoding about 15% of the total sample, which
included cases coded by the undergraduate researchers as well as by the primary coder.
About 30% of the cases, or the cases identified in Borrego’s (2011) study were also
recoded since 47 variables were added and amended as the process went on.
Analytic Strategy
Prevalence and Trends
The first part of the study is exploratory and will focus on the first two research
questions. First, how many ARDs does the media identify for 2005 and 2006? The
72
database was constructed to identify how often the media reports the death of civilians
while in police custody across the United States. Exploratory analysis will also examine
the regional distribution of the different types of ARDs.
Second, is the media a viable source of data for investigating the prevalence of
ARDs? The analysis of this question is trifold. The current study will assess this by first
presenting the counts and percentages of types of ARDs. Next, the study will compare the
counts of total ARDs for each state for 2005 and 2006 to the DCRP data as presented in
statistical tables published by BJS (see Burch, 2011). Since the DCRP is not publicly
available and all other tables are aggregate counts for 2003 to 2009, this is the only
comparison that can be made with the DCRP. Types of ARDs can be compared for 2005
and 2006, but not by state since BJS did not publish this type of table. This study differs
from the existing studies that have compared the DCRP data to the SHR data (Mumola,
2007; Klinger, 2008) because those were only cases of police-involved homicides. The
SHR does not collect information on all types of arrest-related deaths. Ho and colleagues
(2009) compared media data to the DCRP, but only for sudden in-custody deaths. This
study is the first to compare a national sample of all types of ARDs identified through the
media to the aggregate counts published through the DCRP, which allows for an
examination of possible other source of data readily available to researchers.
Hypothesis 1: The media report data will have a larger ARD count than the
DCRP.
Hypothesis 2: The media report data will have a larger police-involved
shooting count than the DCRP.
73
The third step in assessing media report data as a viable source focuses on a
comparative assessment of the contextual details on both the media and the DCRP. The
main characteristics the DCRP collects for each death are type, sex of deceased, race of
deceased, age of deceased, and offense type. Offense type is broken down into categories
of violent, property, drug, public-order, and no criminal charges intended – mental health,
unknown (Burch, 2011).
The current study collects those characteristics as well, but includes several more
in an effort to capture the complexity of arrest-related death events. For instance, mental
health is not categorized as an offense type. Instead, it is coded to capture mental health
problems as either a diagnosable mental illness, such as schizophrenia or depression, or
an emotionally disturbed individual, such as an individual who is despondent or agitated,
if a diagnosable mental health problem is not immediately known and reported by the
media. Additional variables include whether or not the decedent had a criminal history,
engaged in unlawful behavior, was suicidal, or intoxicated (including type of drug). The
current study also captures what type of weapon was used, who fired the first shots if
firearms were involved, police use of force and types of force, and the location of the
arrest-related event, such as inside or outside and type of space (private, public, or
business). Percentages of these events reported by the media will be presented to assess
the utility of media reports.
Nature of ARD Events
The second part of the study will include cross-tab analyses and chi-square test of
case-level factors for different types of deaths. A chi-square test will be used to measure
the statistical significance of the association between different case-level variables. To
74
measure the importance of the relationship between the variables Cramer’s V will be
calculated since the variables have more than two categories (Riffe et al., 2005).
Cramer’s V statistic ranges from a value of 0, or no relationship, to 1.0, a near-perfect
relationship, to assess the relationship. Cramer’s V of at least 0.3 is considered a
moderate relationship and a Cramer’s V of 0.5 or higher is considered a large relationship
(Cohen, 1988).
Case-level factors will include citizen characteristics, such as age, sex, alcohol or
drug intoxication, use of a weapon, and his or her actions. Unlawful behavior by the
deceased will be coded as no unlawful behavior; yes, but not threatening to police or
others; yes, physically aggressive to police or others; and yes, weapon attack on police or
others. Other case-level characteristics will include how the event was initiated (i.e., type
of call for service) and the number of officers present (if available). Again, ARD events
are dynamic and involve actions by both the suspect and the police officer. It is important
to know why and how the situation resulted in death. Identifying common characteristics
across different types of deaths may help identify problematic police responses to certain
situations, high-risk suspect actions, or calls for service that increase the risk of death.
Doing so can inform police policies and practices to decrease risk of harm to both the
officer and the citizen (Kane, 2007).
Hypothesis 3: Males will account for a larger percentage of the sample
Hypothesis 4: Police-initiated calls for service will account for a higher
percentage of police-involved shootings than citizen-initiated calls for service.
Hypothesis 5: Citizen actions against police that include more combative actions
will result in more police-involved shooting deaths than other types of
75
deaths.
Hypothesis 6: Calls for service due to an emotionally disturbed person or mentally
ill person will result in more frequent use of less-lethal force.
Hypothesis 7: Police-citizen interactions involving an intoxicated citizen will
result in more frequent use of higher levels of force by police.
76
CHAPTER 4
PREVALENCE OF MEDIA IDENTIFIED ARREST-RELATED DEATHS
The current study identified 782 arrest-related deaths for 2005 to 2006 through a
retrospective, web-based search of media archives. Overall, the study identified 429
ARDs for 2005 and 352 for 2006. For both years, police-involved shooting deaths
occurred the most frequently with the media identifying 283 in 2005 and 257 in 2006.
Suicide during a police-citizen encounter was the second most frequent death identified
in the media, but this type of ARD occurred far less often than police-involved shootings.
In 2005, police-involved shooting deaths accounted for 66 percent of the total identified
ARDs, but suicides accounted for only 10 percent of the sample. The year 2006 yielded
similar numbers. Police-involved suicides comprised 73 percent of the sample in 2006
while suicides accounted for 9 percent. For both 2005 and 2006 each of the remaining
categories (other homicides by law enforcement, accidental injury to self, injury caused
by third parties, alcohol/drug intoxication, medical problems, and unknown) made up 7
percent or less of the sample. See Figures 1 and 2 for the percentage divisions.
To further understand the sample, the current study also grouped arrest-related
deaths according to four regions, which include the Northeast, the Midwest, the South,
and the West. Again, these four regions were created in line with the regions that are
employed by the Bureau of Justice Statistics for the DCRP data. For 2005, the Northeast
had 52 ARDs, the Midwest had 61 ARDs, the South had 134 ARDs, and the West had the
most with 181 ARDs. For a regional map breakdown of 2005 Media ARDs see Figure 1.
Searches in the media archives, revealed fewer ARD cases for 2006, but there was a
similar regional divide proportionally to 2005. For 2006 the media identified 62 ARDs
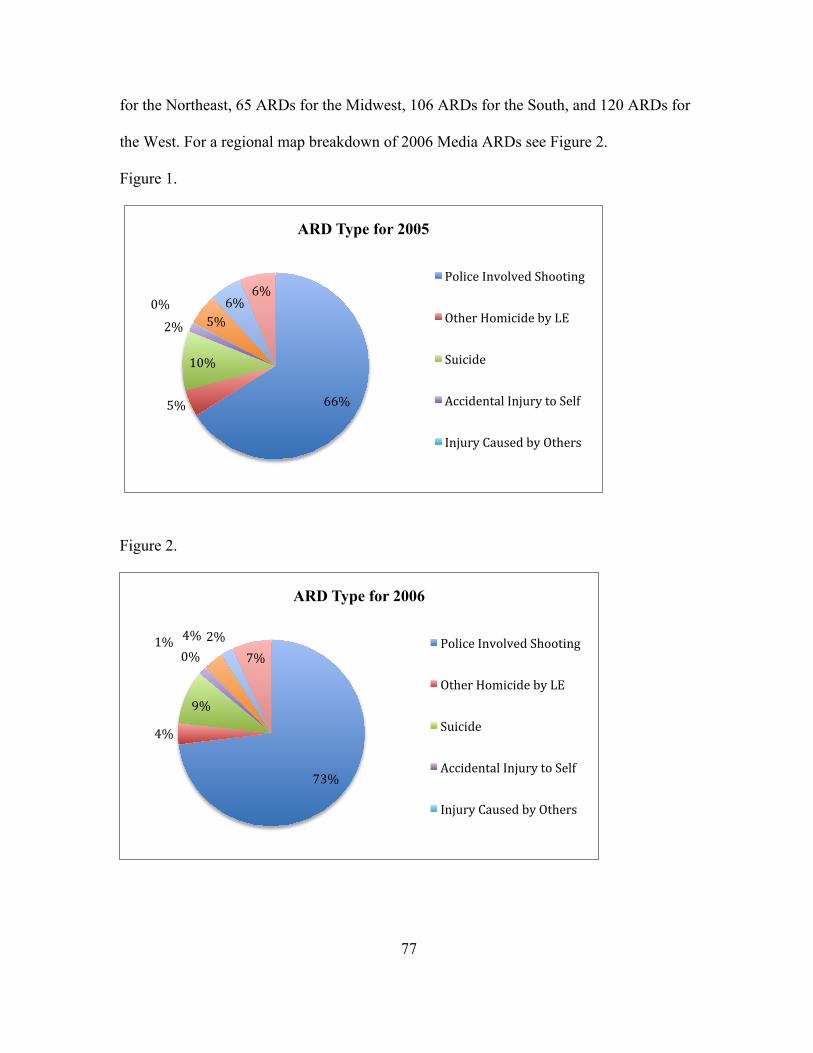
77
66% 5%
10%
2%
0% 5%
6% 6%
ARD Type for 2005
Police Involved Shooting
Other Homicide by LE
Suicide
Accidental Injury to Self
Injury Caused by Others
73%
4%
9%
1% 0% 4% 2%
7%
ARD Type for 2006
Police Involved Shooting
Other Homicide by LE
Suicide
Accidental Injury to Self
Injury Caused by Others
for the Northeast, 65 ARDs for the Midwest, 106 ARDs for the South, and 120 ARDs for
the West. For a regional map breakdown of 2006 Media ARDs see Figure 2.
Figure 1.
Figure 2.
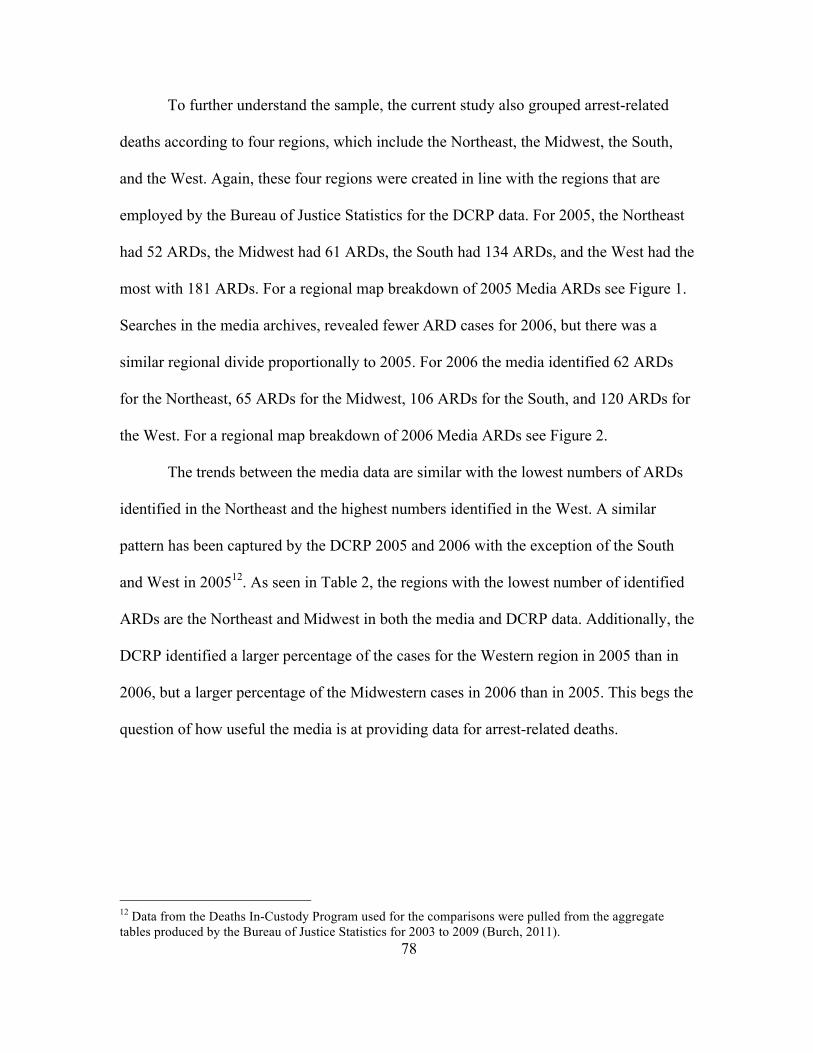
78
To further understand the sample, the current study also grouped arrest-related
deaths according to four regions, which include the Northeast, the Midwest, the South,
and the West. Again, these four regions were created in line with the regions that are
employed by the Bureau of Justice Statistics for the DCRP data. For 2005, the Northeast
had 52 ARDs, the Midwest had 61 ARDs, the South had 134 ARDs, and the West had the
most with 181 ARDs. For a regional map breakdown of 2005 Media ARDs see Figure 1.
Searches in the media archives, revealed fewer ARD cases for 2006, but there was a
similar regional divide proportionally to 2005. For 2006 the media identified 62 ARDs
for the Northeast, 65 ARDs for the Midwest, 106 ARDs for the South, and 120 ARDs for
the West. For a regional map breakdown of 2006 Media ARDs see Figure 2.
The trends between the media data are similar with the lowest numbers of ARDs
identified in the Northeast and the highest numbers identified in the West. A similar
pattern has been captured by the DCRP 2005 and 2006 with the exception of the South
and West in 200512. As seen in Table 2, the regions with the lowest number of identified
ARDs are the Northeast and Midwest in both the media and DCRP data. Additionally, the
DCRP identified a larger percentage of the cases for the Western region in 2005 than in
2006, but a larger percentage of the Midwestern cases in 2006 than in 2005. This begs the
question of how useful the media is at providing data for arrest-related deaths.
12 Data from the Deaths In-Custody Program used for the comparisons were pulled from the aggregate tables produced by the Bureau of Justice Statistics for 2003 to 2009 (Burch, 2011).
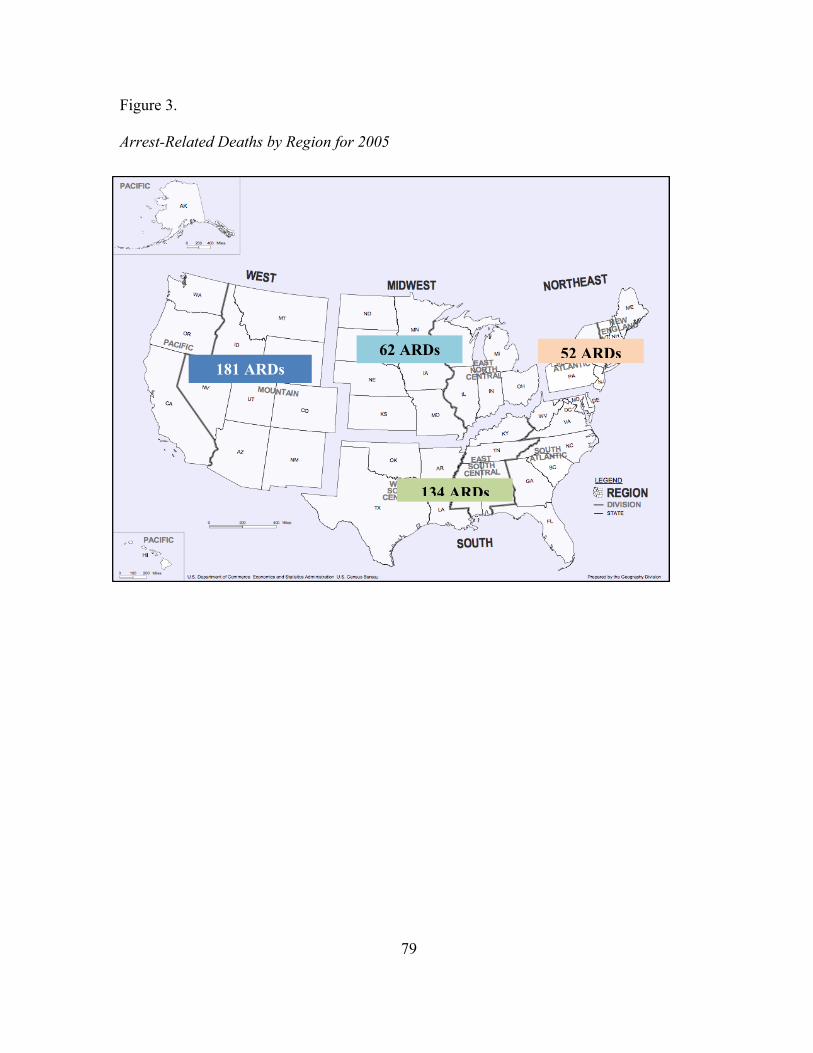
79
Figure 3.
Arrest-Related Deaths by Region for 2005
181 ARDs 62 ARDs 52 ARDs
134 ARDs
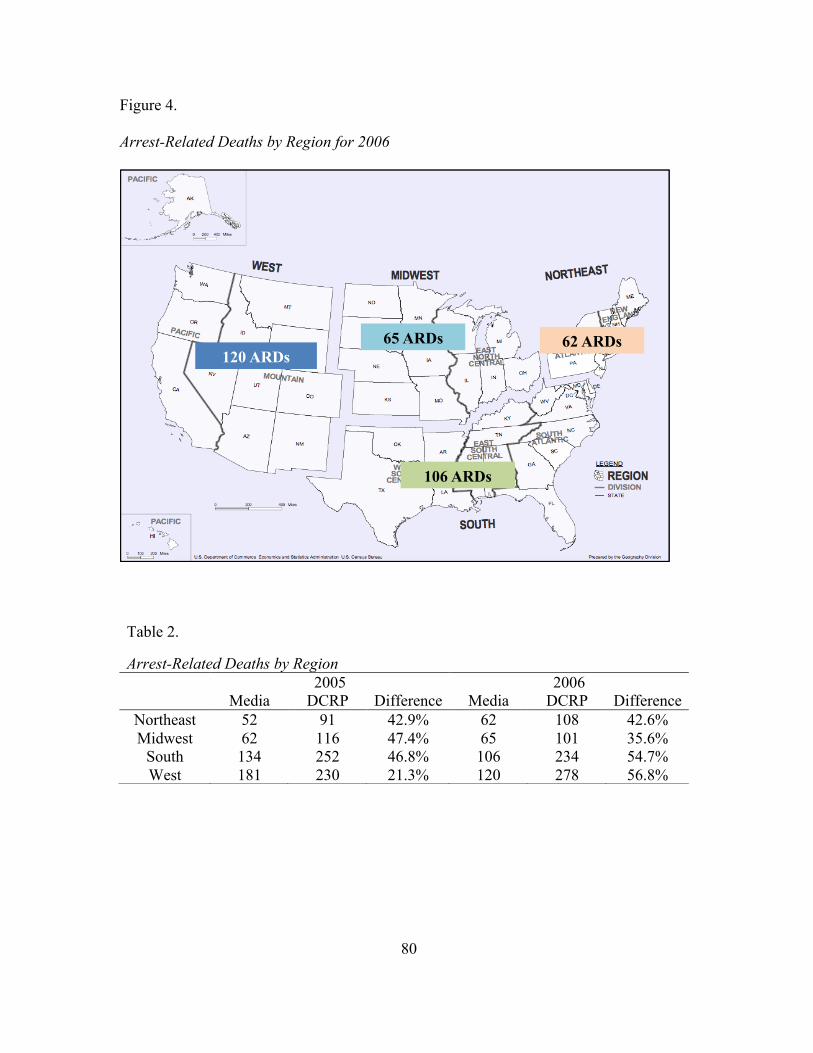
80
120 ARDs 65 ARDs 62 ARDs
106 ARDs
Figure 4.
Arrest-Related Deaths by Region for 2006
Table 2.
Arrest-Related Deaths by Region 2005 2006 Media DCRP Difference Media DCRP Difference
Northeast 52 91 42.9% 62 108 42.6% Midwest 62 116 47.4% 65 101 35.6%
South 134 252 46.8% 106 234 54.7% West 181 230 21.3% 120 278 56.8%
81
It is evident that the media identified far fewer cases than the DCRP, but this calls
for a further deconstruction of the media data compared to the DCRP data. In Table 3
each region has been broken down by state to compare the number of arrest-related
deaths between the media and the DCRP. Negative numbers reflect how many fewer
cases the media identified than the DCRP. Alternatively, positive numbers reflect how
many more cases the media identified than the DCRP. It is also important to note that
several states chose to not report their in-custody deaths to the DCRP. These states
include Georgia, Maryland, Montana, Nevada, and Wyoming for 2005 and 2006. North
Carolina and Oklahoma reported in 2005, but not in 2006. Lack of reporting among the
states highlights one of the disadvantages posed by the DCRP. In this case, the media
worked to fill in the gaps by identifying cases for those states that did not report.
Unfortunately, the media still only identified a percentage of cases that the DCRP
identified. This gap is explained by a handful of states, such as CA, TX, PA, and FL.
Notably, the media fell short in identifying 10 or more ARD cases in Pennsylvania,
Illinois (for 2005), Michigan, Florida, North Carolina (for 2005), Texas, Arizona,
California (for 2006), and Washington for both years.
The differences in terms of whether the media identified fewer cases than the
DCRP is consistent between years with the exception of California. In 2005, the media
identified 31 more arrest-related deaths than what was reported to the DCRP. This is
particularly interesting since California has a state-mandated program that collects
information on all in-custody deaths. That is, California should be reporting to the DCRP
based on the official statistics collected by the state. Again, such a discrepancy highlights
the existence of flaws among “official” statistics. In 2006, however, the DCRP reported
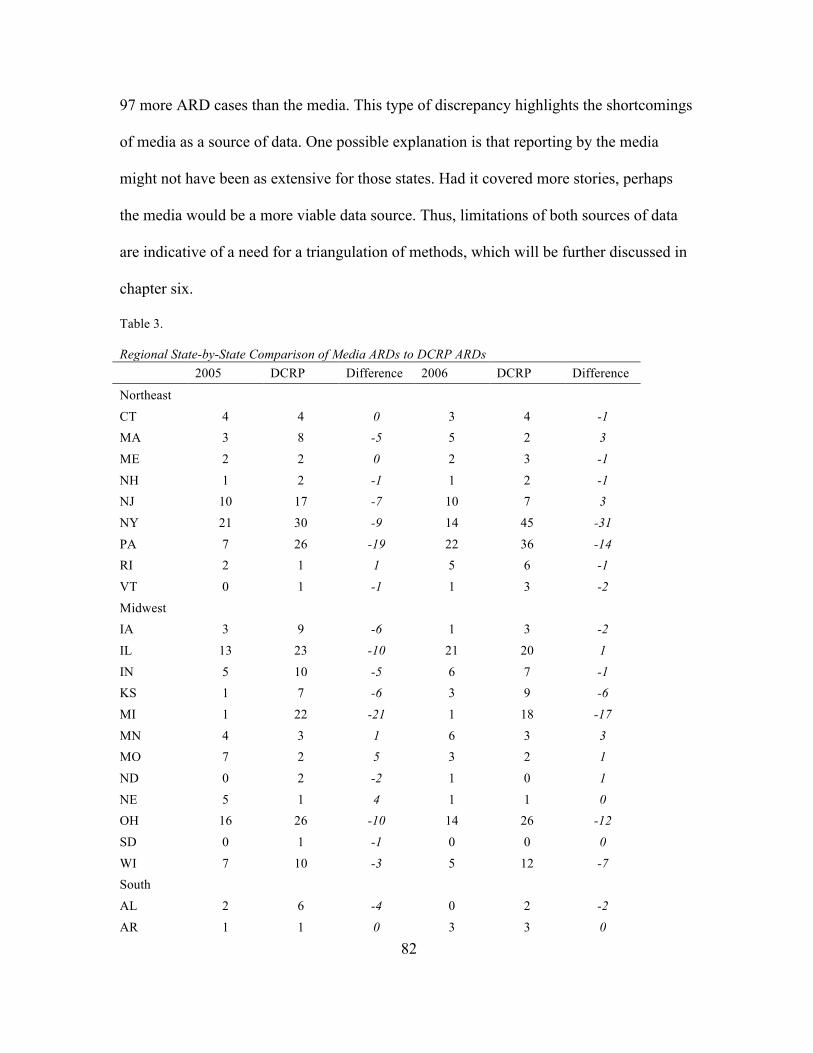
82
97 more ARD cases than the media. This type of discrepancy highlights the shortcomings
of media as a source of data. One possible explanation is that reporting by the media
might not have been as extensive for those states. Had it covered more stories, perhaps
the media would be a more viable data source. Thus, limitations of both sources of data
are indicative of a need for a triangulation of methods, which will be further discussed in
chapter six.
Table 3. Regional State-by-State Comparison of Media ARDs to DCRP ARDs 2005 DCRP Difference 2006 DCRP Difference
Northeast CT 4 4 0 3 4 -1 MA 3 8 -5 5 2 3 ME 2 2 0 2 3 -1 NH 1 2 -1 1 2 -1 NJ 10 17 -7 10 7 3 NY 21 30 -9 14 45 -31 PA 7 26 -19 22 36 -14 RI 2 1 1 5 6 -1 VT 0 1 -1 1 3 -2 Midwest IA 3 9 -6 1 3 -2 IL 13 23 -10 21 20 1 IN 5 10 -5 6 7 -1 KS 1 7 -6 3 9 -6 MI 1 22 -21 1 18 -17 MN 4 3 1 6 3 3 MO 7 2 5 3 2 1 ND 0 2 -2 1 0 1 NE 5 1 4 1 1 0 OH 16 26 -10 14 26 -12 SD 0 1 -1 0 0 0 WI 7 10 -3 5 12 -7 South AL 2 6 -4 0 2 -2 AR 1 1 0 3 3 0
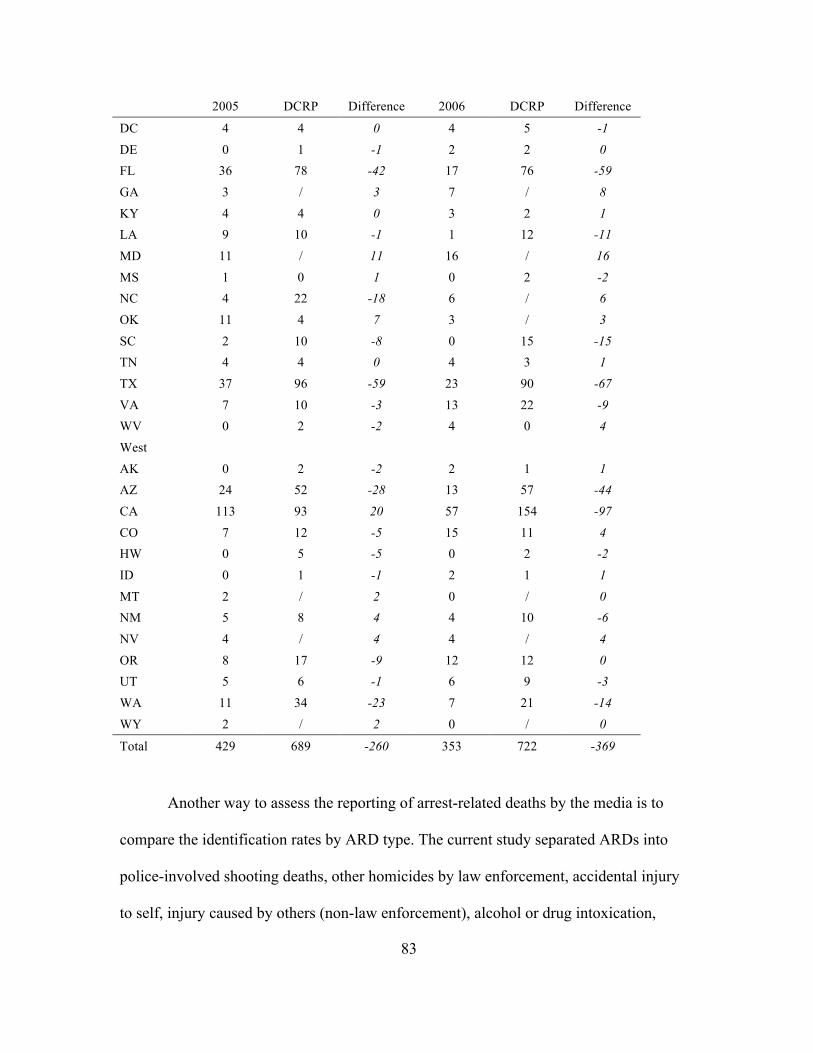
83
2005 DCRP Difference 2006 DCRP Difference
DC 4 4 0 4 5 -1 DE 0 1 -1 2 2 0 FL 36 78 -42 17 76 -59 GA 3 / 3 7 / 8 KY 4 4 0 3 2 1 LA 9 10 -1 1 12 -11 MD 11 / 11 16 / 16 MS 1 0 1 0 2 -2 NC 4 22 -18 6 / 6 OK 11 4 7 3 / 3 SC 2 10 -8 0 15 -15 TN 4 4 0 4 3 1 TX 37 96 -59 23 90 -67 VA 7 10 -3 13 22 -9 WV 0 2 -2 4 0 4 West AK 0 2 -2 2 1 1 AZ 24 52 -28 13 57 -44 CA 113 93 20 57 154 -97 CO 7 12 -5 15 11 4 HW 0 5 -5 0 2 -2 ID 0 1 -1 2 1 1 MT 2 / 2 0 / 0 NM 5 8 4 4 10 -6 NV 4 / 4 4 / 4 OR 8 17 -9 12 12 0 UT 5 6 -1 6 9 -3 WA 11 34 -23 7 21 -14 WY 2 / 2 0 / 0
Total 429 689 -260 353 722 -369
Another way to assess the reporting of arrest-related deaths by the media is to
compare the identification rates by ARD type. The current study separated ARDs into
police-involved shooting deaths, other homicides by law enforcement, accidental injury
to self, injury caused by others (non-law enforcement), alcohol or drug intoxication,
84
medical problems, or unknown. The DCRP employs the same categories except it groups
together all homicides by law enforcement. For comparison purposes, the categories of
police-involved shooting deaths and other homicides by law enforcement are added
together when calculating the difference percentage. See Table 4.
For both 2005 and 2006 the media data identified a higher percentage of
homicides by law enforcement reported by the DCRP than other types of deaths. In 2005,
the media failed to identify about 20% of police-involved homicides identified by the
DCRP and about 40% in 2006. That is, the media does a better job at reporting more high
profile deaths, such as police involved shooting deaths or cases that may involve a
perceived amount of excessive force by the media and society. For 2005, the media
identified 75% of the medical problem ARDs that the DCRP identified, but identified
only 25% in 2006. Police-involved shootings are the most prevalent type of ARD for
both years. This is not surprising since lethal force is more likely to result in the death of
a citizen. Another consideration involves the reporting of ARDs by the media. Other
types of in-custody deaths may occur more frequently, but are not picked up by the
media. Media tends to focus on stories that capture consumers’ attention, which are
usually a more serious criminal incident (Chermak, 1995, 1998; Chermak & Chapman,
2007), or violent crime (Cohen, 1975; Skogan & Maxfield, 1981). Yet, retrospective-
searches of media reports still yielded far fewer deaths than the DCRP identified in 2005
and 2006. Thus, this brings into question the potential utility of media data as a data
source on ARDs. It is possible that certain ARD cases are easier to find among Internet
media archives due to their publicity at the time. Media reporting and consumption are
intimately linked and reflect the interests of the broader public. Certain cases might
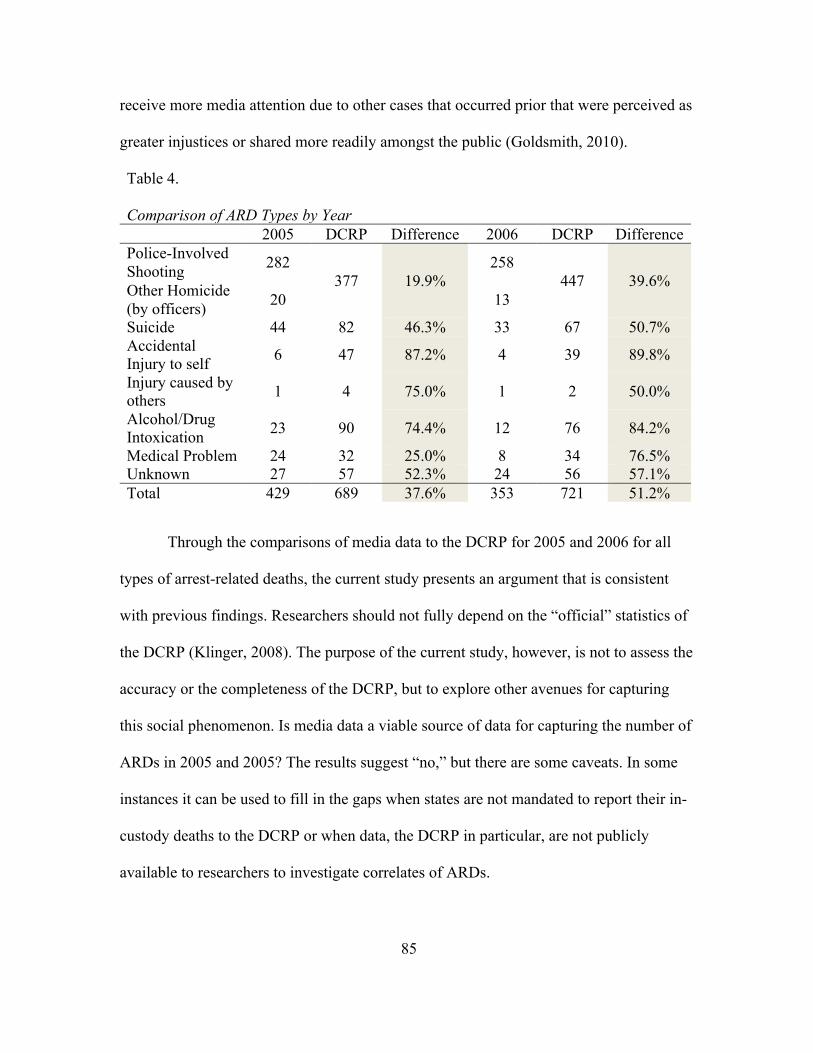
85
receive more media attention due to other cases that occurred prior that were perceived as
greater injustices or shared more readily amongst the public (Goldsmith, 2010).
Table 4. Comparison of ARD Types by Year 2005 DCRP Difference 2006 DCRP Difference Police-Involved Shooting 282
377 19.9% 258
447 39.6% Other Homicide (by officers) 20 13
Suicide 44 82 46.3% 33 67 50.7% Accidental Injury to self 6 47 87.2% 4 39 89.8%
Injury caused by others 1 4 75.0% 1 2 50.0%
Alcohol/Drug Intoxication 23 90 74.4% 12 76 84.2%
Medical Problem 24 32 25.0% 8 34 76.5% Unknown 27 57 52.3% 24 56 57.1% Total 429 689 37.6% 353 721 51.2%
Through the comparisons of media data to the DCRP for 2005 and 2006 for all
types of arrest-related deaths, the current study presents an argument that is consistent
with previous findings. Researchers should not fully depend on the “official” statistics of
the DCRP (Klinger, 2008). The purpose of the current study, however, is not to assess the
accuracy or the completeness of the DCRP, but to explore other avenues for capturing
this social phenomenon. Is media data a viable source of data for capturing the number of
ARDs in 2005 and 2005? The results suggest “no,” but there are some caveats. In some
instances it can be used to fill in the gaps when states are not mandated to report their in-
custody deaths to the DCRP or when data, the DCRP in particular, are not publicly
available to researchers to investigate correlates of ARDs.
86
Furthermore, a recent publication examining the DCRP data collection noted a
variation in ARD case identification with media reports being employed by 26 states
(Planty et al., 2015). Though it is often assumed that data housed in government agencies
are official statistics, it is evident that not all data are coming from official departments in
regards to the arrest-related death program. Further examination through a capture-
recapture analysis of the current data suggested that the DCRP only captures half of all
ARDs each year (Planty et al., 2015). That is, the authors warn that investigators should
think of their numbers as conservative. Thus, it is clear that we still do not know how
many citizens die at the hands of the police each year. Media reports or the DCRP alone
cannot identify the universe of arrest-related deaths. The comparisons of the two datasets
also underscore the importance of the triangulation of information. The DCRP already
relies on media data for about half of the states that report to the data collection (Planty et
al., 2015). Combining different sources of data will lead to a more complete picture of
ARDs than relying on any one type of data source. The next chapter further explores this
idea by presenting the nature of arrest-related deaths in the United States.
87
CHAPTER 5
NATURE OF MEDIA IDENTIFIED ARREST-RELATED DEATH EVENTS
It is apparent that media archives are not adequate enough to build a complete
national database of arrest-related deaths that have occurred at least a decade back in
time. The current national system that uses a number of methods of identification,
however, is not adequate for capturing the near-universe of arrest-related deaths either
(Planty et al., 2015). Despite low identifications rates, the current study did find that
media archives provide a number of case-level details needed to further understand the
nuances surrounding fatal police-citizen encounters.
As repeatedly stated, the DCRP housed in the Bureau of Justice Statistics is the
only national database of all types of arrest-related deaths. They collect data using what is
called a CJ-11A Addendum. For deaths that occur before the deceased is taken to a law
enforcement or booking facility, the CJ-11A asks a total of 19 questions about the
incident. These questions include basic demographics, as well as the manner of death,
whether or not a medical examiner or coroner conducted an evaluation, the medical cause
of death, offenses the deceased was being charged with at the time, types of restraints
used during the incident, the behavior of the deceased, and several other questions. If the
death occurred after the deceased was taken to a booking facility, individuals completing
the form are instructed to skip questions 13 through 19 that ask about the behavior of the
deceased and use of force options engaged by the police and to proceed to the last four
questions. These four questions ask about the behavior of the deceased at the time of
entry into the facility, who caused the death, and the means of the death. For the full CJ-
11A see Appendix B. Since the beginning of the DCRP collection, this form has changed
88
very little. The most recent form from 2012 still only asks 19 questions about the incident
prior to booking.
The lack of publicly available data has left researchers and even the broader
public searching for other ways to keep track of arrest-related deaths. Recently, several
web-based media sites have attempted to enumerate how many individuals have been
shot and killed by police officers within the last several years. For example, The
Washington Post recently published an article tracking the number of deadly police
shootings in 2015. Other sites, such as FatalEncounters.org and theguardian.com’s The
Counted datasets are compiling a list of police-involved homicides, not just deadly
police-involved shootings. FatalEncounters.org is backtracking to January 1, 2000, while
The Counted only has data from this year. Both collect minimal information, such as
basic demographics and the manner of death. While these are readily available to the
public, they are limited in the information they can provide and in their ability to offer
solutions for increased public safety. Thus the current study used a similar approach by
relying on media reports, but used them in a way that objectively coded for 132 variables
to investigate arrest-related deaths.
Event Characteristics
The current study separated the list of variables into demographics, death
characteristics, incident characteristics, deceased behavior, police officer(s) behavior, and
booking facility death. For descriptive purposes, the ARD information is separated into
event characteristics, deceased characteristics and behavior, and police officer(s)
characteristics and behavior. Table 5 presents the summary statistics for the event
characteristics. Similar to the DCRP (Burch, 2011), males comprise a majority of the
89
sample accounting for 96.75% of media-identified ARDs. The average age is 17.38 years,
but widely varies with a standard deviation of 41.5 years. Whites accounted for two
percent of the sample, Blacks accounted for five percent of the sample, while Hispanics
made up just less than four percent of the sample. Unfortunately, media data was not a
reliable source for capturing race since 87.1% of the media-identified ARDs did not
report race.
Again, as presented in Figures 1 and 2, police-involved shootings occurred most
frequently, which resulted in 81.5% of the deaths occurring from injuries sustained
during the police-citizen encounter (e.g., cause of death). The media reported the
presence of excited delirium in 3.8% of the cases, but whether or not this is useful
reporting cannot be assessed since there is no other data to compare. The same
conclusion can be drawn for whether or not a medical examiner examined the body since
BJS has not published disaggregated data for this variable (Mumola, 2007; Burch, 2011).
In terms of incident characteristics, 42.9% of the cases were police-initiated while
52.9% were citizen-initiated calls for service that brought the deceased and citizen into
contact. Of the police-initiated contacts, 22.6% occurred when an officer, or officers,
witnessed an event and intervened. Among the citizen-initiated calls for service, 49.4%
were calls for assistance with 4.0 percent being mental health calls. The low percentage
of mental health calls might be attributable to the media underreporting mental health
issues. There is no data comparison to definitively draw this conclusion. Knowing the
nature of how the police and citizen came into contact may have training value if a
certain type of call is related to a certain type of arrest-related death (Geller & Karales,
1981). This will be further examined in this section.
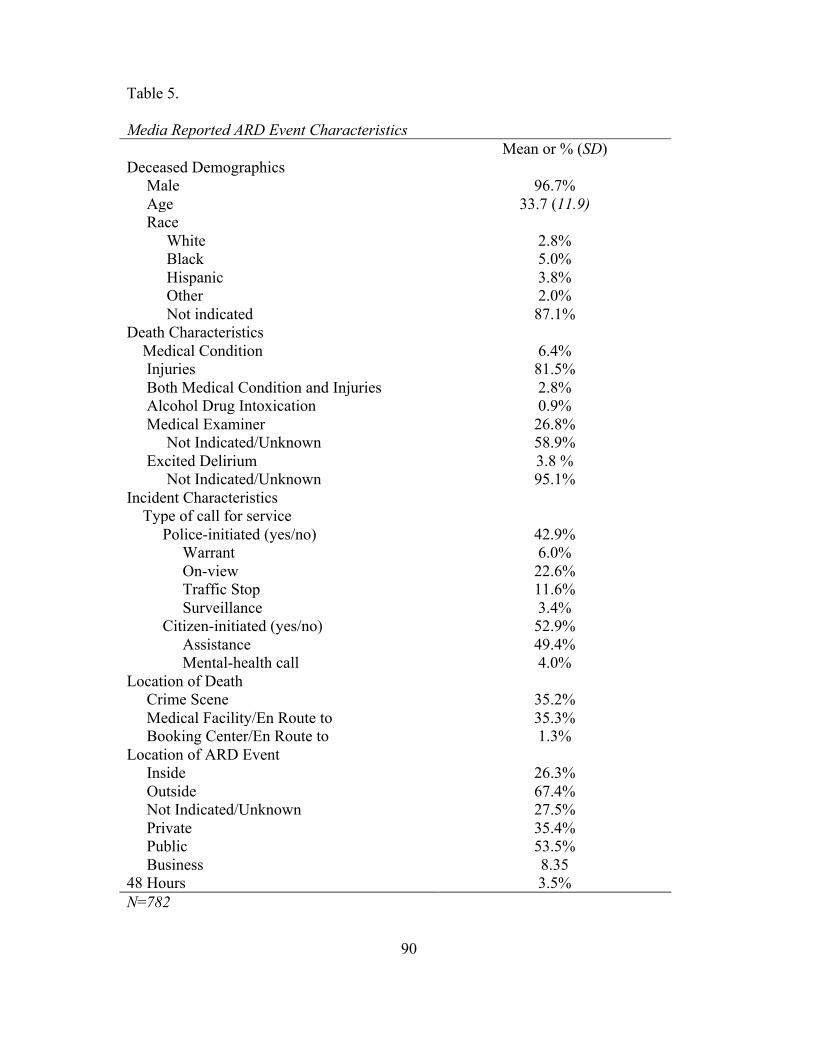
90
Table 5. Media Reported ARD Event Characteristics Mean or % (SD) Deceased Demographics Male 96.7% Age 33.7 (11.9) Race White 2.8% Black 5.0% Hispanic 3.8% Other 2.0% Not indicated 87.1% Death Characteristics Medical Condition 6.4% Injuries 81.5% Both Medical Condition and Injuries 2.8% Alcohol Drug Intoxication 0.9% Medical Examiner 26.8% Not Indicated/Unknown 58.9% Excited Delirium 3.8 % Not Indicated/Unknown 95.1% Incident Characteristics Type of call for service Police-initiated (yes/no) 42.9% Warrant 6.0% On-view 22.6% Traffic Stop 11.6% Surveillance 3.4% Citizen-initiated (yes/no) 52.9% Assistance 49.4% Mental-health call 4.0% Location of Death Crime Scene 35.2% Medical Facility/En Route to 35.3% Booking Center/En Route to 1.3% Location of ARD Event Inside 26.3% Outside 67.4% Not Indicated/Unknown 27.5% Private 35.4% Public 53.5% Business 8.35 48 Hours 3.5% N=782
91
The location of the arrest-related death event occurs outside more frequently
(67.4%) and out in public (53.5%) more often that at a private location (35.4%). This is in
line with previous research and calls for an emphasis on outdoor tactics when handling
potentially dangerous situations as opposed to tactics used for indoors (PERF, 2015). In
the media-identified sample, the deceased is reported dead at the scene in 35.2% of the
cases and reported as dead at a medical facility or en route to a medical facility 35.5% of
the time. Deaths that occur at a booking facility before arraignment occur far less
frequently (1.3%). Thus, only a handful of cases were coded using the last 19 variables of
the coding instrument.
Deceased Characteristics and Behaviors
The DCRP program asks for a subjective interpretation on the CJ-11A if state
reporting agents are using media reports to determine what type of behavior the deceased
was engaging in. That is, they ask what offenses, if any, was the deceased being charged
with at the time and individuals completing the form must interpret what offense they
think the deceased would have been charged with. With about half the states using media
reports to complete the CJ-11A (Planty et al., 2015) and few media reports indicating if
the deceased was being charged, some bias may exist. In the most recent BJS bulletin of
tables, about 60% of ARD cases from 2003 to 2009 included a violent offense, such as
homicide, sexual assault, robbery, and assault. While these are important to know to
better understand patterns in circumstances surrounding in-custody deaths, the type of
offense charge should come from police departments, which alludes to the need for a
triangulation of methods. This will be further discussed in the next chapter.
92
The current study did incorporate the offense charge question from the CJ-11A,
but found that 9.5% of media reports indicated that a charge had been filed, 6.9%
indicated no, but intended to, and 83.5% reported no charges or did not indicate any type
of charge. To measure potentially violent behavior the current study objectively coded
what types of behaviors the deceased was engaging in. From this, a typology of unlawful
behavior was created to further explore and disentangle potentially significant
relationships. The unlawful behavior typology consists of “no,” “yes, not threatening to
officers or others,” yes, physically aggressive to police or others,” and “yes, weapon
attack/threat on police or others.” The media-identified ARDs reported that 60.8% of the
sample was engaging in some type of weapon attack or threat on police or others. The
most common type of weapon used was a firearm (42.3%). The second most commonly
used type of weapon was a knife or edged weapon (10.4%), followed by a vehicle
(8.2%). Other types of weapons included such things as pipes, broomsticks, and carjacks.
In instances that involved a firearm, the deceased shot first in 21.1% of the cases. See
Table 6.
Oftentimes, individuals do not initially engage in violent behavior. The police-
citizen encounter is transactional (Fyfe, 1988; Binder & Scharf, 1980). In an attempt to
measure this, the current study coded for behaviors that ranged from refusing orders to
grabbing or hitting officers. In 83.3% of the cases, the deceased refused orders. Only 29%
physically resisted or struggled with officers, but 61.7% threatened the officers in some
way. This included pointing a gun at officers, perhaps during a standoff situation, but not
engaging physically. About 18% of the sample actually physically fought and about 47%
of the sample charged at or confronted an officer, both of which can be conceptualized as
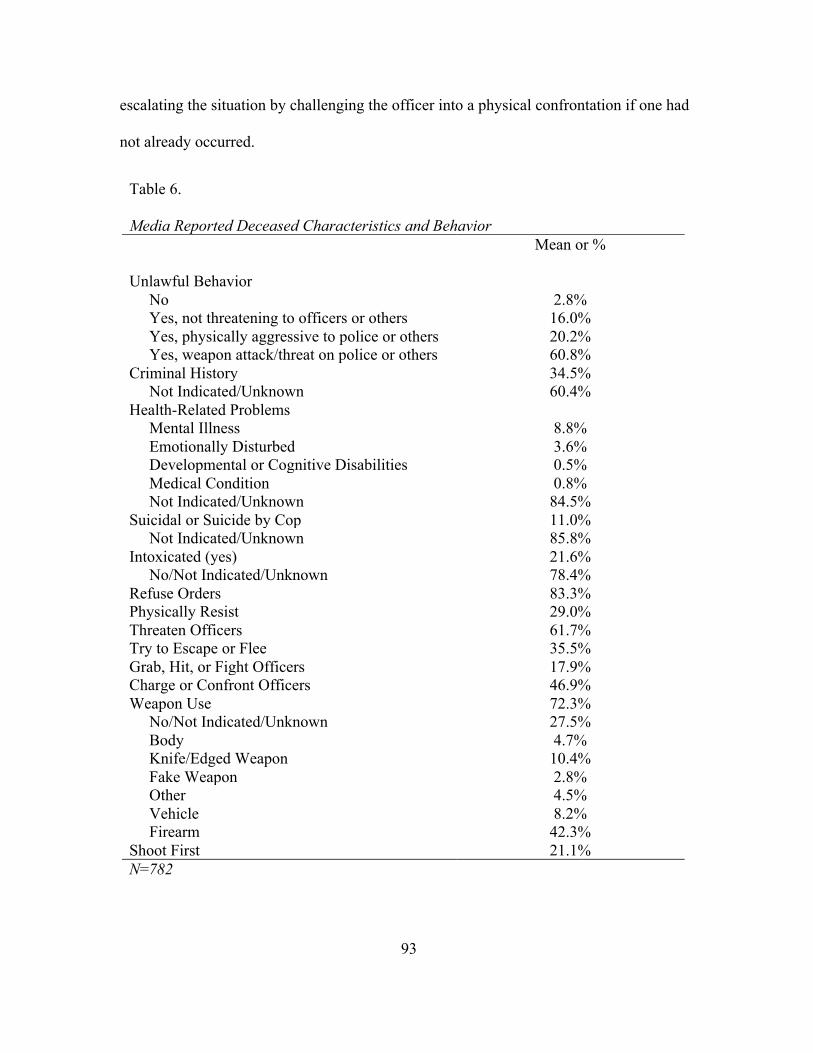
93
escalating the situation by challenging the officer into a physical confrontation if one had
not already occurred.
Table 6. Media Reported Deceased Characteristics and Behavior Mean or %
Unlawful Behavior No 2.8% Yes, not threatening to officers or others 16.0% Yes, physically aggressive to police or others 20.2% Yes, weapon attack/threat on police or others 60.8% Criminal History 34.5% Not Indicated/Unknown 60.4% Health-Related Problems Mental Illness 8.8% Emotionally Disturbed 3.6% Developmental or Cognitive Disabilities 0.5% Medical Condition 0.8% Not Indicated/Unknown 84.5% Suicidal or Suicide by Cop 11.0% Not Indicated/Unknown 85.8% Intoxicated (yes) 21.6% No/Not Indicated/Unknown 78.4% Refuse Orders 83.3% Physically Resist 29.0% Threaten Officers 61.7% Try to Escape or Flee 35.5% Grab, Hit, or Fight Officers 17.9% Charge or Confront Officers 46.9% Weapon Use 72.3% No/Not Indicated/Unknown 27.5% Body 4.7% Knife/Edged Weapon 10.4% Fake Weapon 2.8% Other 4.5% Vehicle 8.2% Firearm 42.3% Shoot First 21.1% N=782
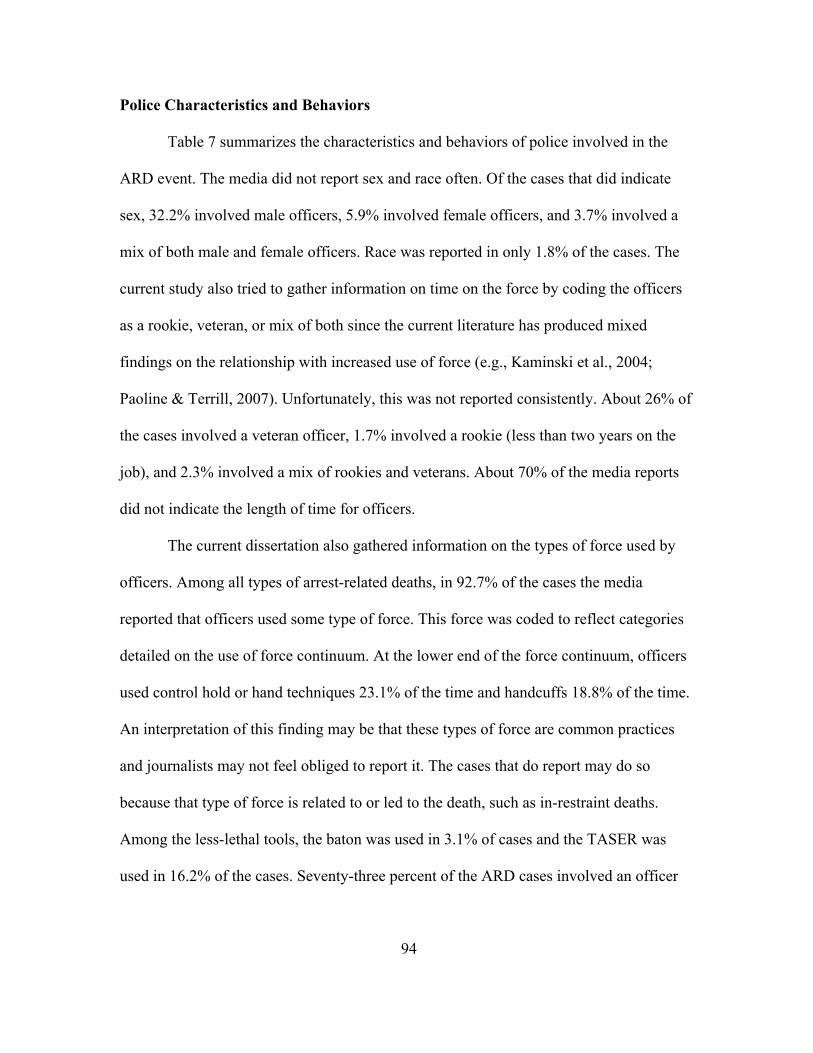
94
Police Characteristics and Behaviors
Table 7 summarizes the characteristics and behaviors of police involved in the
ARD event. The media did not report sex and race often. Of the cases that did indicate
sex, 32.2% involved male officers, 5.9% involved female officers, and 3.7% involved a
mix of both male and female officers. Race was reported in only 1.8% of the cases. The
current study also tried to gather information on time on the force by coding the officers
as a rookie, veteran, or mix of both since the current literature has produced mixed
findings on the relationship with increased use of force (e.g., Kaminski et al., 2004;
Paoline & Terrill, 2007). Unfortunately, this was not reported consistently. About 26% of
the cases involved a veteran officer, 1.7% involved a rookie (less than two years on the
job), and 2.3% involved a mix of rookies and veterans. About 70% of the media reports
did not indicate the length of time for officers.
The current dissertation also gathered information on the types of force used by
officers. Among all types of arrest-related deaths, in 92.7% of the cases the media
reported that officers used some type of force. This force was coded to reflect categories
detailed on the use of force continuum. At the lower end of the force continuum, officers
used control hold or hand techniques 23.1% of the time and handcuffs 18.8% of the time.
An interpretation of this finding may be that these types of force are common practices
and journalists may not feel obliged to report it. The cases that do report may do so
because that type of force is related to or led to the death, such as in-restraint deaths.
Among the less-lethal tools, the baton was used in 3.1% of cases and the TASER was
used in 16.2% of the cases. Seventy-three percent of the ARD cases involved an officer
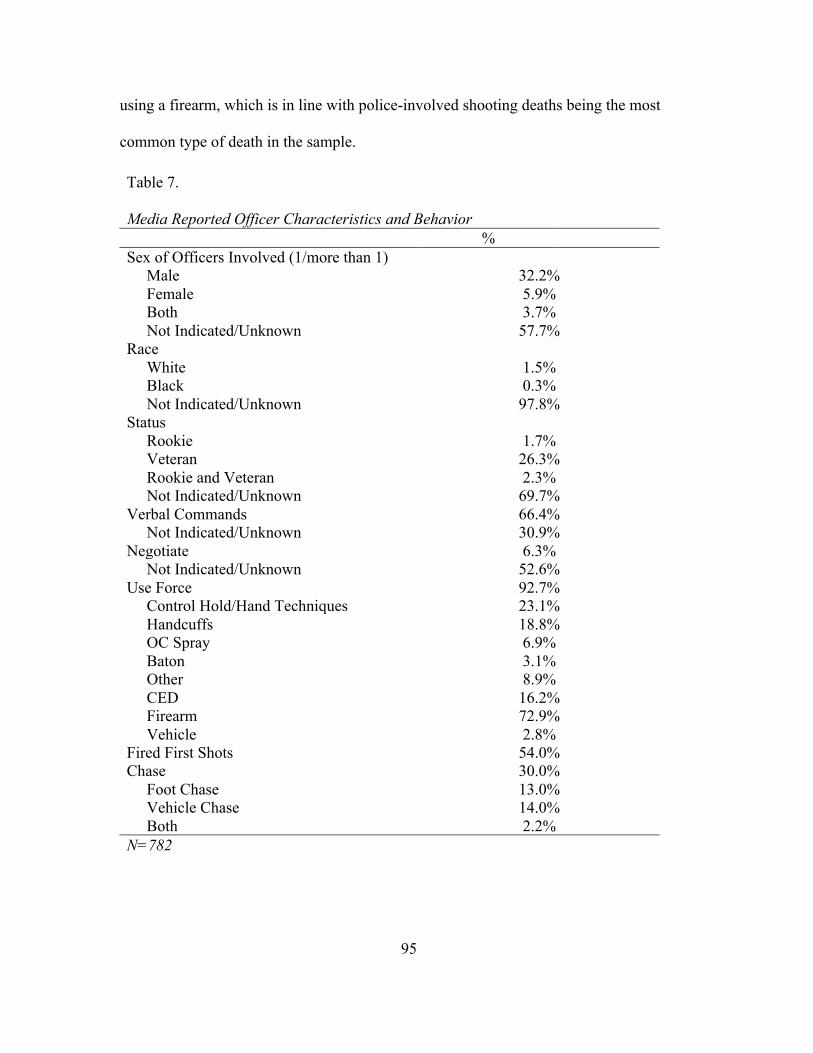
95
using a firearm, which is in line with police-involved shooting deaths being the most
common type of death in the sample.
Table 7. Media Reported Officer Characteristics and Behavior % Sex of Officers Involved (1/more than 1) Male 32.2% Female 5.9% Both 3.7% Not Indicated/Unknown 57.7% Race White 1.5% Black 0.3% Not Indicated/Unknown 97.8% Status Rookie 1.7% Veteran 26.3% Rookie and Veteran 2.3% Not Indicated/Unknown 69.7% Verbal Commands 66.4% Not Indicated/Unknown 30.9% Negotiate 6.3% Not Indicated/Unknown 52.6% Use Force 92.7% Control Hold/Hand Techniques 23.1% Handcuffs 18.8% OC Spray 6.9% Baton 3.1% Other 8.9% CED 16.2% Firearm 72.9% Vehicle 2.8% Fired First Shots 54.0% Chase 30.0% Foot Chase 13.0% Vehicle Chase 14.0% Both 2.2% N=782
96
Cross-Tab Comparisons
This next section explores the circumstances surrounding arrest-related deaths.
Research examining deadly use of force events, as well as other types of in-custody
deaths, must focus on the details to build a knowledge base to assist policymakers, police
departments and the public to minimize citizen deaths without increasing risks to the
police or the public (Geller & Karales, 1981). First, hypotheses 3 and 4 were assessed to
begin to uncover different relationships among the case-level characteristics surrounding
the arrest-related death.
Hypothesis three stated that males would account for a larger percentage of the
sample, which is supported. Similar to other researcher, the sample is overwhelmingly
male. While females in the sample account for a small percentage of the sample (n=23),
they were involved in police-involved shooting deaths at the same rate as the males in the
sample. The percentage of females involved in police-involved shooting deaths 69.6%
and the percentage of males involved in police-involved shooting deaths was 69.3%. See
Table 8.
Table 8. Manner of Death and Sex PIS
% (n)
OH % (n)
S 5
(n)
AIS % (n)
IO % (n)
ADI % (n)
MP % (n)
U % (n)
Male
69.3 (524)
4.4 (33)
10.0 (76)
1.2 (9)
0.3 (2)
4.1 (31)
4.2 (32)
6.5 (49)
Female
69.6 (16)
0.0 (0)
4.3 (1)
0.0 (0)
0.0 (0)
17.4 (4)
0.0 (0)
8.7 (2)
N=782; *p<0.05 **p<.001; 2= 37.096**
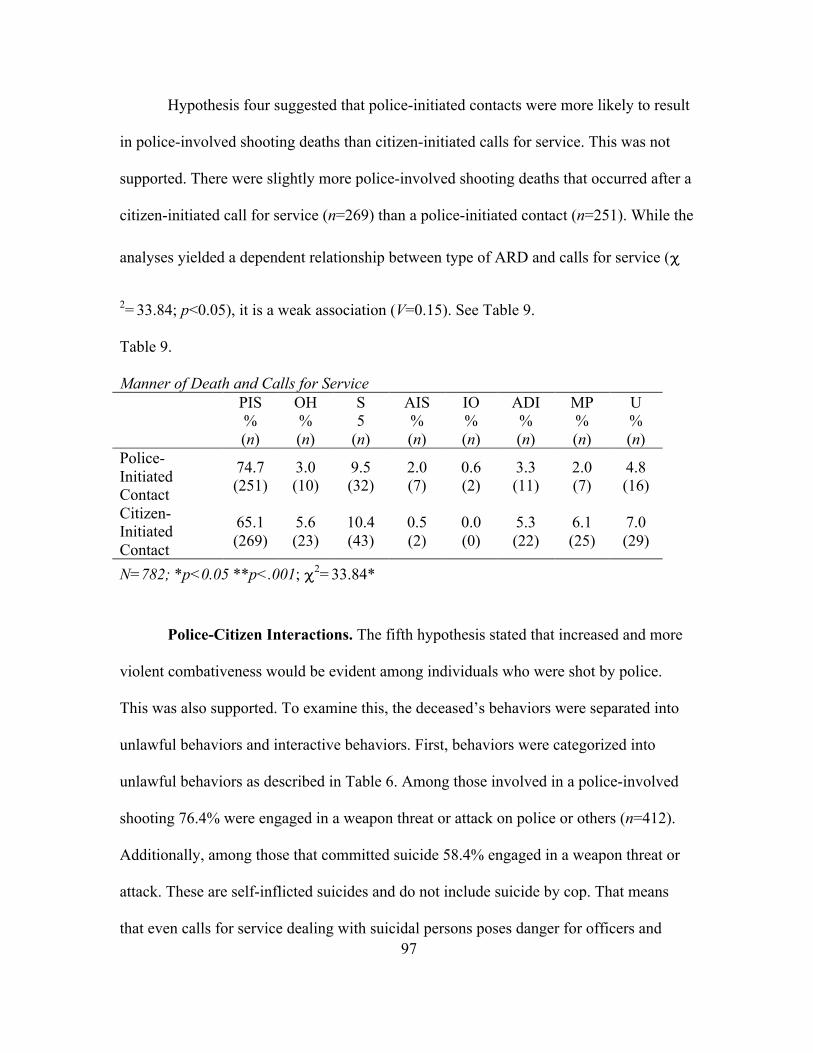
97
Hypothesis four suggested that police-initiated contacts were more likely to result
in police-involved shooting deaths than citizen-initiated calls for service. This was not
supported. There were slightly more police-involved shooting deaths that occurred after a
citizen-initiated call for service (n=269) than a police-initiated contact (n=251). While the
analyses yielded a dependent relationship between type of ARD and calls for service (
2= 33.84; p<0.05), it is a weak association (V=0.15). See Table 9.
Table 9. Manner of Death and Calls for Service PIS
% (n)
OH % (n)
S 5
(n)
AIS % (n)
IO % (n)
ADI % (n)
MP % (n)
U % (n)
Police-Initiated Contact
74.7 (251)
3.0 (10)
9.5 (32)
2.0 (7)
0.6 (2)
3.3 (11)
2.0 (7)
4.8 (16)
Citizen-Initiated Contact
65.1 (269)
5.6 (23)
10.4 (43)
0.5 (2)
0.0 (0)
5.3 (22)
6.1 (25)
7.0 (29)
N=782; *p<0.05 **p<.001; 2= 33.84*
Police-Citizen Interactions. The fifth hypothesis stated that increased and more
violent combativeness would be evident among individuals who were shot by police.
This was also supported. To examine this, the deceased’s behaviors were separated into
unlawful behaviors and interactive behaviors. First, behaviors were categorized into
unlawful behaviors as described in Table 6. Among those involved in a police-involved
shooting 76.4% were engaged in a weapon threat or attack on police or others (n=412).
Additionally, among those that committed suicide 58.4% engaged in a weapon threat or
attack. These are self-inflicted suicides and do not include suicide by cop. That means
that even calls for service dealing with suicidal persons poses danger for officers and
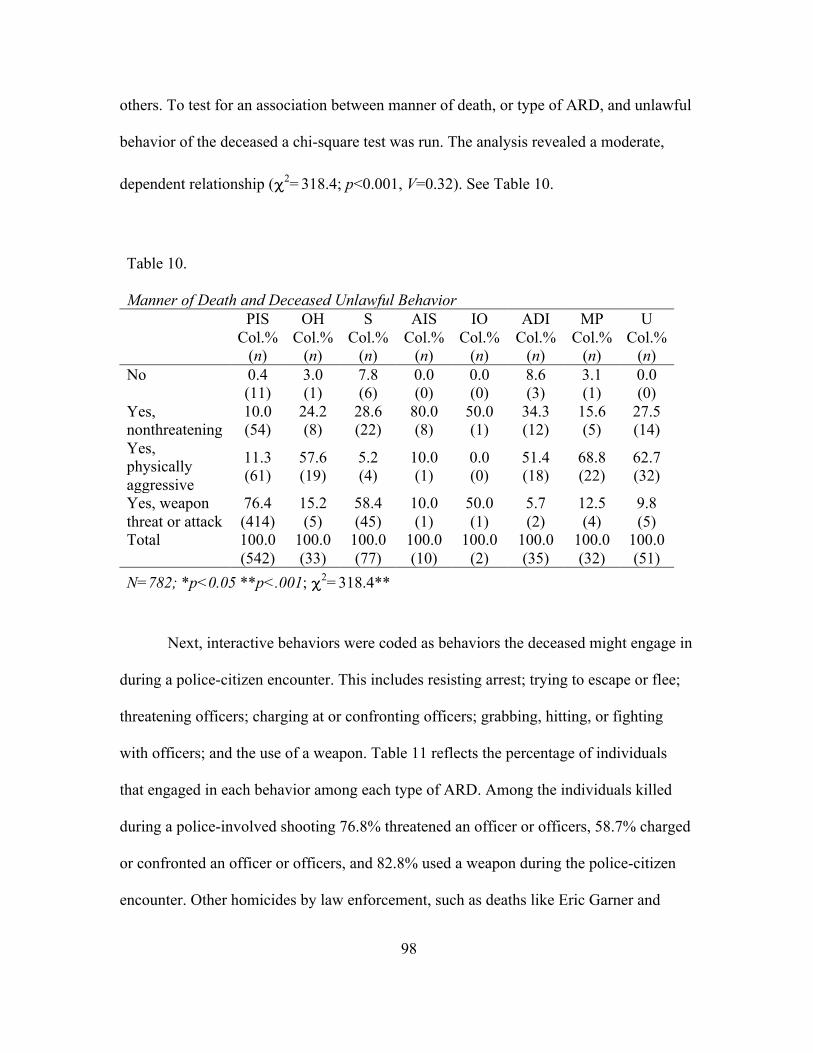
98
others. To test for an association between manner of death, or type of ARD, and unlawful
behavior of the deceased a chi-square test was run. The analysis revealed a moderate,
dependent relationship ( 2= 318.4; p<0.001, V=0.32). See Table 10.
Next, interactive behaviors were coded as behaviors the deceased might engage in
during a police-citizen encounter. This includes resisting arrest; trying to escape or flee;
threatening officers; charging at or confronting officers; grabbing, hitting, or fighting
with officers; and the use of a weapon. Table 11 reflects the percentage of individuals
that engaged in each behavior among each type of ARD. Among the individuals killed
during a police-involved shooting 76.8% threatened an officer or officers, 58.7% charged
or confronted an officer or officers, and 82.8% used a weapon during the police-citizen
encounter. Other homicides by law enforcement, such as deaths like Eric Garner and
Table 10. Manner of Death and Deceased Unlawful Behavior PIS
Col.% (n)
OH Col.%
(n)
S Col.%
(n)
AIS Col.%
(n)
IO Col.%
(n)
ADI Col.%
(n)
MP Col.%
(n)
U Col.%
(n) No 0.4
(11) 3.0 (1)
7.8 (6)
0.0 (0)
0.0 (0)
8.6 (3)
3.1 (1)
0.0 (0)
Yes, nonthreatening
10.0 (54)
24.2 (8)
28.6 (22)
80.0 (8)
50.0 (1)
34.3 (12)
15.6 (5)
27.5 (14)
Yes, physically aggressive
11.3 (61)
57.6 (19)
5.2 (4)
10.0 (1)
0.0 (0)
51.4 (18)
68.8 (22)
62.7 (32)
Yes, weapon threat or attack
76.4 (414)
15.2 (5)
58.4 (45)
10.0 (1)
50.0 (1)
5.7 (2)
12.5 (4)
9.8 (5)
Total 100.0 (542)
100.0 (33)
100.0 (77)
100.0 (10)
100.0 (2)
100.0 (35)
100.0 (32)
100.0 (51)
N=782; *p<0.05 **p<.001; 2= 318.4**
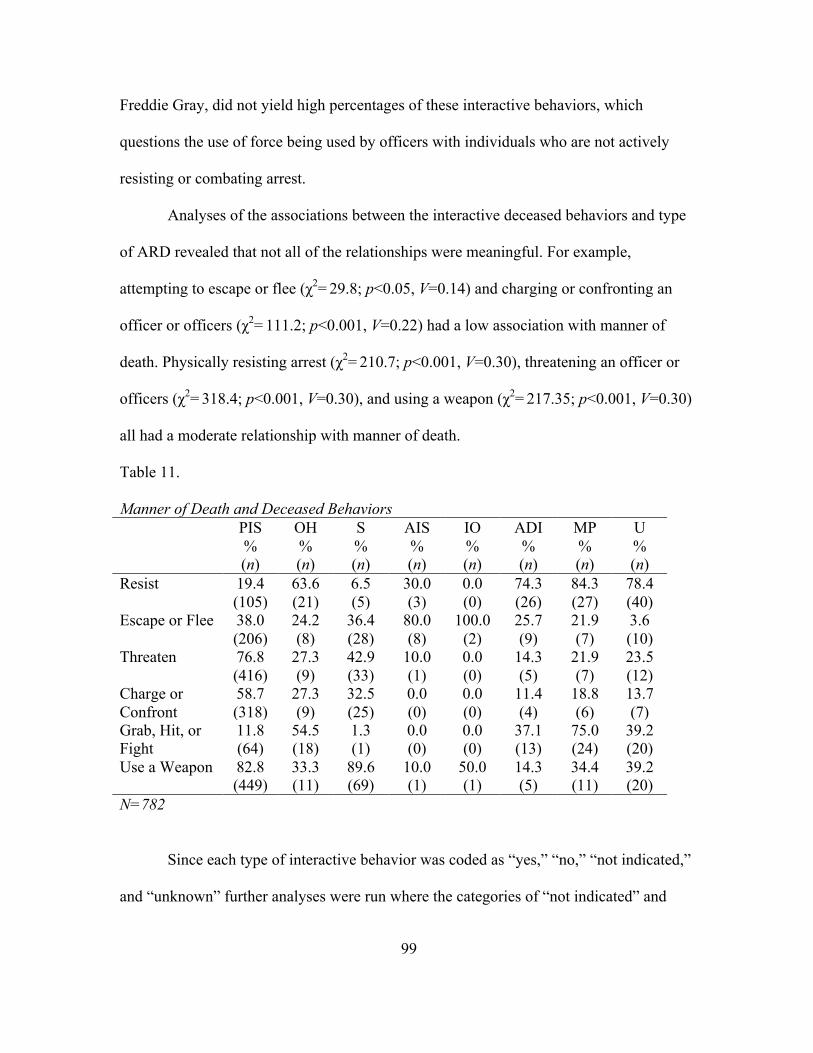
99
Freddie Gray, did not yield high percentages of these interactive behaviors, which
questions the use of force being used by officers with individuals who are not actively
resisting or combating arrest.
Analyses of the associations between the interactive deceased behaviors and type
of ARD revealed that not all of the relationships were meaningful. For example,
attempting to escape or flee (χ2= 29.8; p<0.05, V=0.14) and charging or confronting an
officer or officers (χ2= 111.2; p<0.001, V=0.22) had a low association with manner of
death. Physically resisting arrest (χ2= 210.7; p<0.001, V=0.30), threatening an officer or
officers (χ2= 318.4; p<0.001, V=0.30), and using a weapon (χ2= 217.35; p<0.001, V=0.30)
all had a moderate relationship with manner of death.
Table 11. Manner of Death and Deceased Behaviors PIS
% (n)
OH % (n)
S % (n)
AIS % (n)
IO % (n)
ADI % (n)
MP % (n)
U % (n)
Resist 19.4 (105)
63.6 (21)
6.5 (5)
30.0 (3)
0.0 (0)
74.3 (26)
84.3 (27)
78.4 (40)
Escape or Flee 38.0 (206)
24.2 (8)
36.4 (28)
80.0 (8)
100.0 (2)
25.7 (9)
21.9 (7)
3.6 (10)
Threaten 76.8 (416)
27.3 (9)
42.9 (33)
10.0 (1)
0.0 (0)
14.3 (5)
21.9 (7)
23.5 (12)
Charge or Confront
58.7 (318)
27.3 (9)
32.5 (25)
0.0 (0)
0.0 (0)
11.4 (4)
18.8 (6)
13.7 (7)
Grab, Hit, or Fight
11.8 (64)
54.5 (18)
1.3 (1)
0.0 (0)
0.0 (0)
37.1 (13)
75.0 (24)
39.2 (20)
Use a Weapon 82.8 (449)
33.3 (11)
89.6 (69)
10.0 (1)
50.0 (1)
14.3 (5)
34.4 (11)
39.2 (20)
N=782
Since each type of interactive behavior was coded as “yes,” “no,” “not indicated,”
and “unknown” further analyses were run where the categories of “not indicated” and
100
“unknown” were collapsed into the “no” category. Physically resisting and using weapon
still had a significant relationship with type of death, but was stronger. Physically
resisting yielded a Cramer’s V of 0.51 (χ2= 206.3; p<0.001) and using a weapon yielded a
Cramer’s V of 0.50 (χ2= 197.1; p<0.001). Additionally, threatening an officer (χ2= 181.0;
p<0.001, V=0.48) and charging or confronting an officer (χ2= 102.6; p<0.001, V=0.36)
also had moderate statistically significant relationships with type of ARD. That is there is
a statistically significant relationship in how the deceased are distributed across manner
of death and whether or not they engaged in certain interactive behaviors.
As seen in Table 11, the individuals in the sample engaged in interactive
behaviors more often among police-involved shooting deaths. To further understand the
relationship, type of ARD was recoded into a binary variable of “police-involved
shooting death” and “all other ARDs.” This allowed for the current study to analyze
whether or not police-involved shooting deaths were statistically significant from other
types of ARDs by the different type of interactive behaviors that yielded significant
relationships with manner of death.
Table 12 displays the four interactive behaviors that yielded a significant and
moderate relationship with manner of death. These were analyzed through a two-sample
t-test to explore whether or not the two populations, police-involved shooting deaths and
all other deaths, differ significantly in respect to the types of behaviors engaged in by the
deceased individuals in the sample. Those individuals who did not physically resist an
officer during the police-citizen encounter were more likely to be killed by a police-
involved shooting (M=0.46, SD=0.50), or those who did resist were more likely to be in
another type of ARD group. The analyses also revealed that those who engaged in
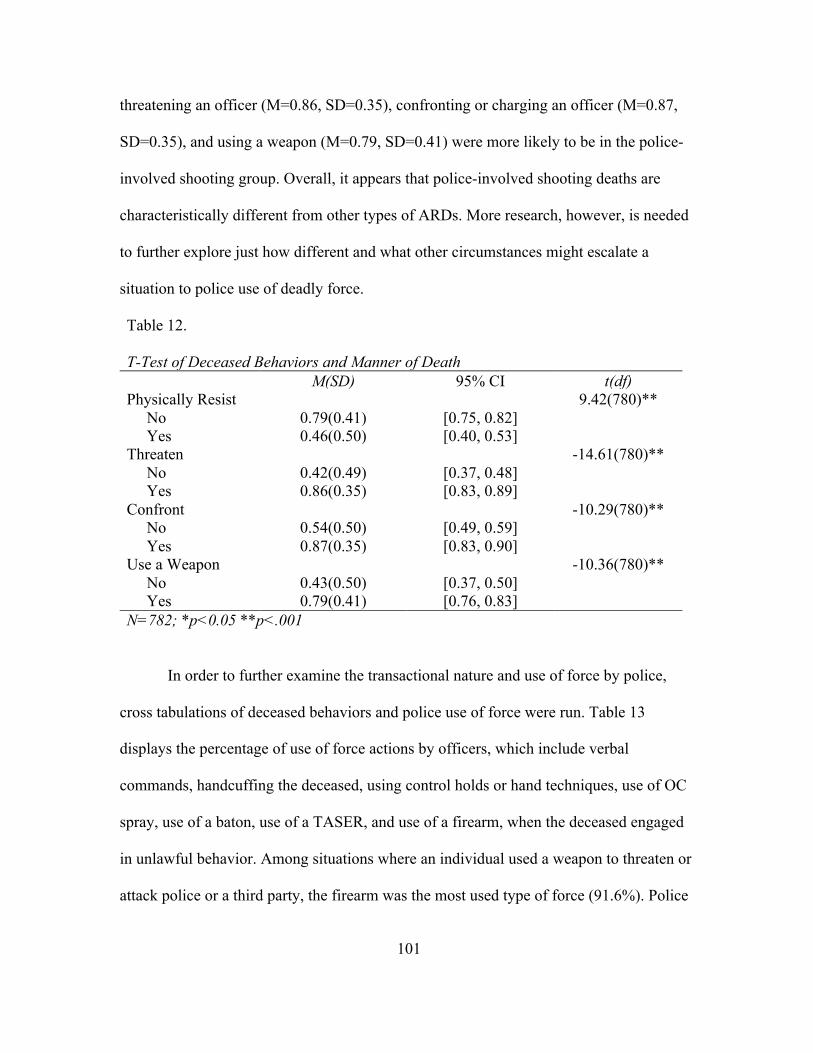
101
threatening an officer (M=0.86, SD=0.35), confronting or charging an officer (M=0.87,
SD=0.35), and using a weapon (M=0.79, SD=0.41) were more likely to be in the police-
involved shooting group. Overall, it appears that police-involved shooting deaths are
characteristically different from other types of ARDs. More research, however, is needed
to further explore just how different and what other circumstances might escalate a
situation to police use of deadly force.
Table 12. T-Test of Deceased Behaviors and Manner of Death M(SD) 95% CI t(df) Physically Resist 9.42(780)** No 0.79(0.41) [0.75, 0.82] Yes 0.46(0.50) [0.40, 0.53] Threaten -14.61(780)** No 0.42(0.49) [0.37, 0.48] Yes 0.86(0.35) [0.83, 0.89] Confront -10.29(780)** No 0.54(0.50) [0.49, 0.59] Yes 0.87(0.35) [0.83, 0.90] Use a Weapon -10.36(780)** No 0.43(0.50) [0.37, 0.50] Yes 0.79(0.41) [0.76, 0.83] N=782; *p<0.05 **p<.001
In order to further examine the transactional nature and use of force by police,
cross tabulations of deceased behaviors and police use of force were run. Table 13
displays the percentage of use of force actions by officers, which include verbal
commands, handcuffing the deceased, using control holds or hand techniques, use of OC
spray, use of a baton, use of a TASER, and use of a firearm, when the deceased engaged
in unlawful behavior. Among situations where an individual used a weapon to threaten or
attack police or a third party, the firearm was the most used type of force (91.6%). Police
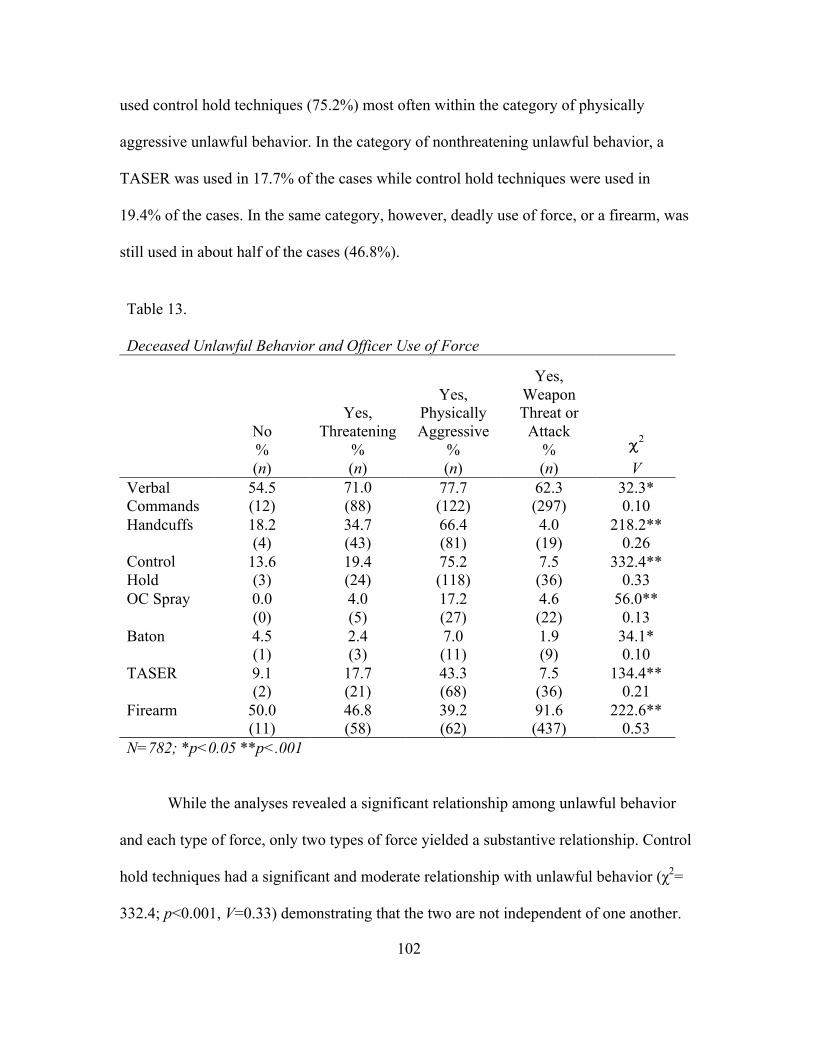
102
used control hold techniques (75.2%) most often within the category of physically
aggressive unlawful behavior. In the category of nonthreatening unlawful behavior, a
TASER was used in 17.7% of the cases while control hold techniques were used in
19.4% of the cases. In the same category, however, deadly use of force, or a firearm, was
still used in about half of the cases (46.8%).
While the analyses revealed a significant relationship among unlawful behavior
and each type of force, only two types of force yielded a substantive relationship. Control
hold techniques had a significant and moderate relationship with unlawful behavior (χ2=
332.4; p<0.001, V=0.33) demonstrating that the two are not independent of one another.
Table 13. Deceased Unlawful Behavior and Officer Use of Force
No % (n)
Yes, Threatening
% (n)
Yes, Physically Aggressive
% (n)
Yes, Weapon Threat or
Attack % (n)
2
V Verbal Commands
54.5 (12)
71.0 (88)
77.7 (122)
62.3 (297)
32.3* 0.10
Handcuffs 18.2 (4)
34.7 (43)
66.4 (81)
4.0 (19)
218.2** 0.26
Control Hold
13.6 (3)
19.4 (24)
75.2 (118)
7.5 (36)
332.4** 0.33
OC Spray 0.0 (0)
4.0 (5)
17.2 (27)
4.6 (22)
56.0** 0.13
Baton 4.5 (1)
2.4 (3)
7.0 (11)
1.9 (9)
34.1* 0.10
TASER 9.1 (2)
17.7 (21)
43.3 (68)
7.5 (36)
134.4** 0.21
Firearm 50.0 (11)
46.8 (58)
39.2 (62)
91.6 (437)
222.6** 0.53
N=782; *p<0.05 **p<.001
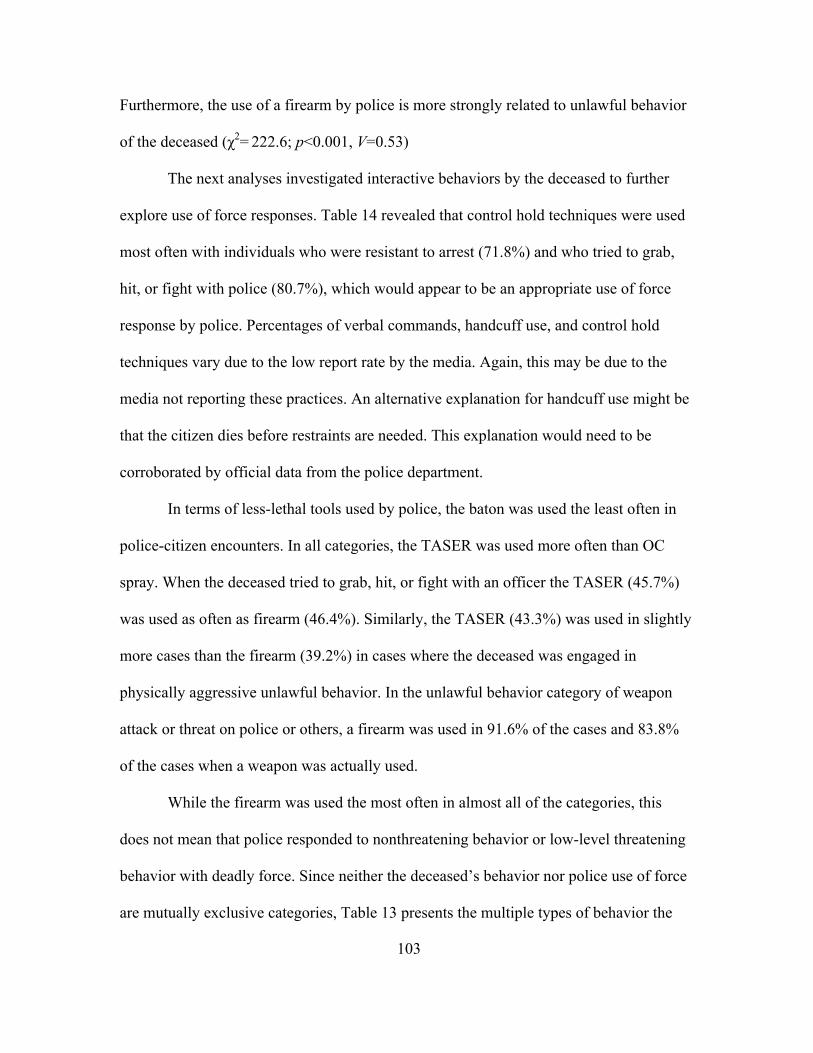
103
Furthermore, the use of a firearm by police is more strongly related to unlawful behavior
of the deceased (χ2= 222.6; p<0.001, V=0.53)
The next analyses investigated interactive behaviors by the deceased to further
explore use of force responses. Table 14 revealed that control hold techniques were used
most often with individuals who were resistant to arrest (71.8%) and who tried to grab,
hit, or fight with police (80.7%), which would appear to be an appropriate use of force
response by police. Percentages of verbal commands, handcuff use, and control hold
techniques vary due to the low report rate by the media. Again, this may be due to the
media not reporting these practices. An alternative explanation for handcuff use might be
that the citizen dies before restraints are needed. This explanation would need to be
corroborated by official data from the police department.
In terms of less-lethal tools used by police, the baton was used the least often in
police-citizen encounters. In all categories, the TASER was used more often than OC
spray. When the deceased tried to grab, hit, or fight with an officer the TASER (45.7%)
was used as often as firearm (46.4%). Similarly, the TASER (43.3%) was used in slightly
more cases than the firearm (39.2%) in cases where the deceased was engaged in
physically aggressive unlawful behavior. In the unlawful behavior category of weapon
attack or threat on police or others, a firearm was used in 91.6% of the cases and 83.8%
of the cases when a weapon was actually used.
While the firearm was used the most often in almost all of the categories, this
does not mean that police responded to nonthreatening behavior or low-level threatening
behavior with deadly force. Since neither the deceased’s behavior nor police use of force
are mutually exclusive categories, Table 13 presents the multiple types of behavior the
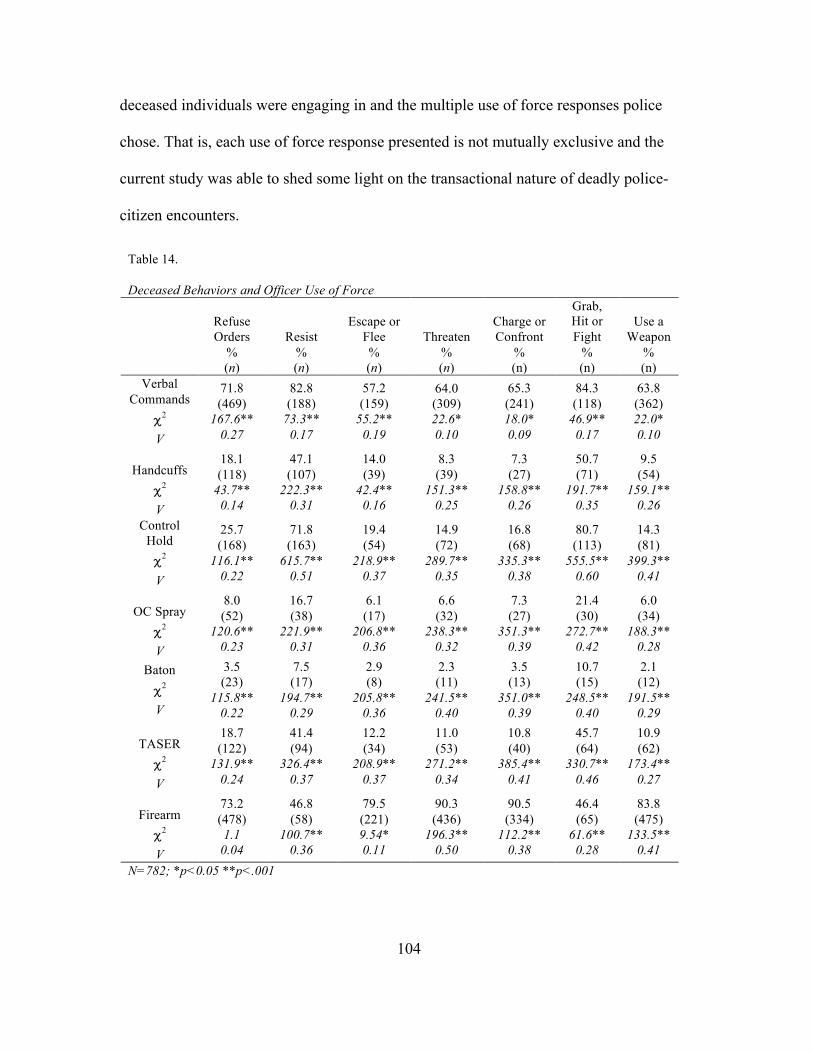
104
deceased individuals were engaging in and the multiple use of force responses police
chose. That is, each use of force response presented is not mutually exclusive and the
current study was able to shed some light on the transactional nature of deadly police-
citizen encounters.
Table 14. Deceased Behaviors and Officer Use of Force
Refuse Orders
% (n)
Resist % (n)
Escape or Flee % (n)
Threaten % (n)
Charge or Confront
% (n)
Grab, Hit or Fight
% (n)
Use a Weapon
% (n)
Verbal Commands
2 V
71.8 (469)
167.6** 0.27
82.8 (188)
73.3** 0.17
57.2 (159)
55.2** 0.19
64.0 (309) 22.6* 0.10
65.3 (241) 18.0* 0.09
84.3 (118)
46.9** 0.17
63.8 (362) 22.0* 0.10
Handcuffs
2 V
18.1 (118)
43.7** 0.14
47.1 (107)
222.3** 0.31
14.0 (39)
42.4** 0.16
8.3 (39)
151.3** 0.25
7.3 (27)
158.8** 0.26
50.7 (71)
191.7** 0.35
9.5 (54)
159.1** 0.26
Control Hold
2 V
25.7 (168)
116.1** 0.22
71.8 (163)
615.7** 0.51
19.4 (54)
218.9** 0.37
14.9 (72)
289.7** 0.35
16.8 (68)
335.3** 0.38
80.7 (113)
555.5** 0.60
14.3 (81)
399.3** 0.41
OC Spray
2 V
8.0 (52)
120.6** 0.23
16.7 (38)
221.9** 0.31
6.1 (17)
206.8** 0.36
6.6 (32)
238.3** 0.32
7.3 (27)
351.3** 0.39
21.4 (30)
272.7** 0.42
6.0 (34)
188.3** 0.28
Baton 2
V
3.5 (23)
115.8** 0.22
7.5 (17)
194.7** 0.29
2.9 (8)
205.8** 0.36
2.3 (11)
241.5** 0.40
3.5 (13)
351.0** 0.39
10.7 (15)
248.5** 0.40
2.1 (12)
191.5** 0.29
TASER
2 V
18.7 (122)
131.9** 0.24
41.4 (94)
326.4** 0.37
12.2 (34)
208.9** 0.37
11.0 (53)
271.2** 0.34
10.8 (40)
385.4** 0.41
45.7 (64)
330.7** 0.46
10.9 (62)
173.4** 0.27
Firearm
2 V
73.2 (478) 1.1
0.04
46.8 (58)
100.7** 0.36
79.5 (221) 9.54* 0.11
90.3 (436)
196.3** 0.50
90.5 (334)
112.2** 0.38
46.4 (65)
61.6** 0.28
83.8 (475)
133.5** 0.41
N=782; *p<0.05 **p<.001
105
For example, in 73.2% of the cases where the deceased refused orders a firearm
was used. This does not mean that police were responding to nonthreatening behavior
with deadly force. Refusing orders may have been just one of the interactive behaviors
during the police-citizen encounter that escalated the situation. While this appears to be
one of the overall trends, more information is still needed to further investigate the
developmental nature of police-citizen encounters (Terrill, 2010).
Moreover, it appears that all of the relationships examined retuned significant
results, but not all demonstrated a meaningful relationship. For example, verbal
commands had a weak relationship with all types of interactive behaviors displayed by
the individuals in the sample. Several other relationships, however, yielded moderate to
strong relationships. Notably, control hold techniques and physically resisting by the
deceased are strongly and significantly related (χ2= 615.7; p<0.001, V=0.51), as were use
of a firearm by an officer and threatening an officer (χ2= 196.3; p<0.001, V=0.50), and
control hold techniques and grabbing, hitting, or fighting by the deceased (χ2= 555.5;
p<0.001, V=0.60). Based on these analyses, it appears that putting on hands on one
another, whether it is the police officer grabbing the deceased or the deceased grabbing
the officer, escalates the police-citizen encounter. While the current study could not get
at temporal ordering, these findings support the transactional nature of ARDs.
Since the firearm was used most often in response to weapon use by the deceased,
these two categories were examined together to further investigate the nature of deadly
police-citizen encounters. Table 15 presents the categories of weapons used by the
deceased individuals. In 533 cases out of the entire sample, a deceased individual used a
weapon. These include the knife or bladed instruments such as a machete; fake weapons
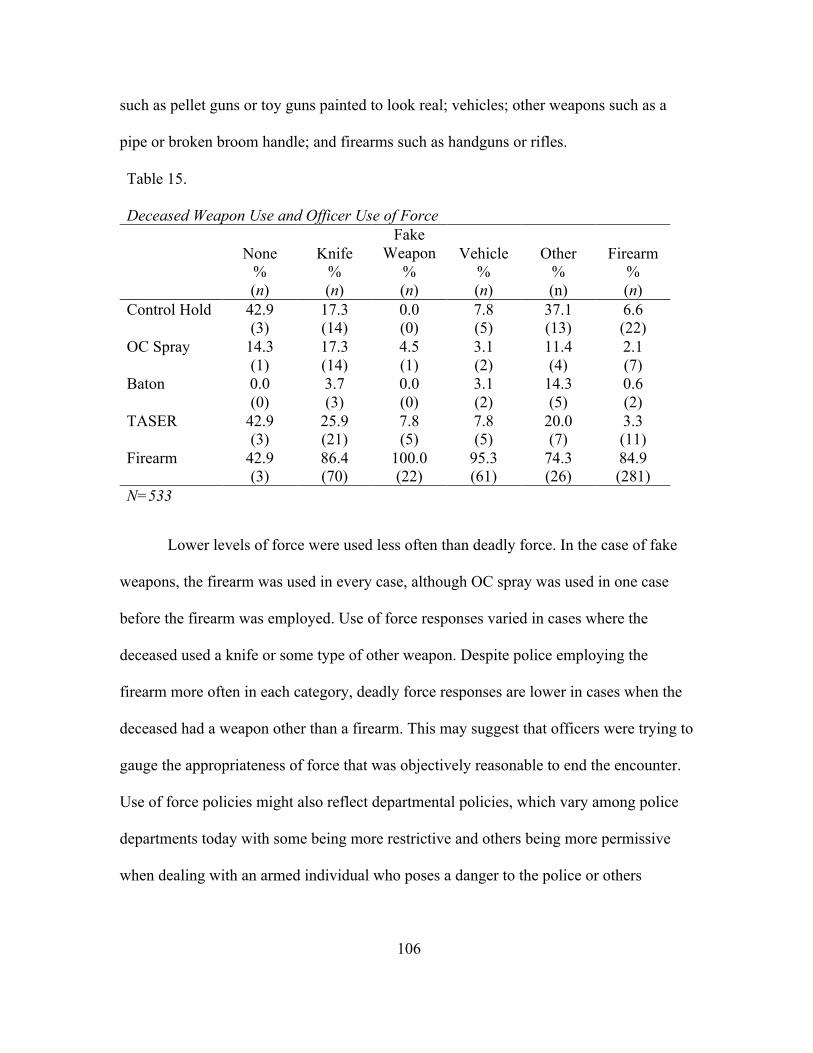
106
such as pellet guns or toy guns painted to look real; vehicles; other weapons such as a
pipe or broken broom handle; and firearms such as handguns or rifles.
Table 15. Deceased Weapon Use and Officer Use of Force
None % (n)
Knife % (n)
Fake Weapon
% (n)
Vehicle % (n)
Other % (n)
Firearm % (n)
Control Hold 42.9 (3)
17.3 (14)
0.0 (0)
7.8 (5)
37.1 (13)
6.6 (22)
OC Spray 14.3 (1)
17.3 (14)
4.5 (1)
3.1 (2)
11.4 (4)
2.1 (7)
Baton 0.0 (0)
3.7 (3)
0.0 (0)
3.1 (2)
14.3 (5)
0.6 (2)
TASER 42.9 (3)
25.9 (21)
7.8 (5)
7.8 (5)
20.0 (7)
3.3 (11)
Firearm 42.9 (3)
86.4 (70)
100.0 (22)
95.3 (61)
74.3 (26)
84.9 (281)
N=533
Lower levels of force were used less often than deadly force. In the case of fake
weapons, the firearm was used in every case, although OC spray was used in one case
before the firearm was employed. Use of force responses varied in cases where the
deceased used a knife or some type of other weapon. Despite police employing the
firearm more often in each category, deadly force responses are lower in cases when the
deceased had a weapon other than a firearm. This may suggest that officers were trying to
gauge the appropriateness of force that was objectively reasonable to end the encounter.
Use of force policies might also reflect departmental policies, which vary among police
departments today with some being more restrictive and others being more permissive
when dealing with an armed individual who poses a danger to the police or others
107
(Walker, 2010). More information is needed to fully understand the transactions that
transpire during a deadly police-citizen encounter.
Deceased Impairment. The last two hypotheses focus on ARDs that included
impaired citizens. This analysis focused on mental illness and emotionally disturbed
individuals as described in media reports, as well as intoxicated individuals13. The
deceased were coded as having a mental illness if the media report identified a known
mental health diagnosis or indicated the deceased had sought treatment. The term
emotionally disturbed was used if the deceased was described as emotionally disturbed or
in other less formal terms such as “distraught” were used. The point was to categorize
situations where an individual may not have been in his or her right mind. Intoxication
impairment was also separated into two categories. The first category of “intoxicated”
refers to the media’s description of the deceasing being intoxicated. Some media reports
indicated which drug or reported on the toxicology report, but not all did. In essence,
there might not have been any corroboration by officials and was just the word of a
witness. The category “toxicology report” indicated that the media had been informed
about an official investigation into whether or not the deceased had some type of
substance in his or her system at the time of the ARD event. The media reported
toxicology reports less often and sometimes did not follow up when they published a
story where results were still pending.
Hypothesis six posited that police would respond to mentally ill or emotionally
disturbed individuals with less lethal tools. Table 16 shows that this was not supported
13 The mental health category also coded for developmental and cognitive disabilities, such as autism or deafness, and health problems, such as epilepsy or stroke history. These were not included in this analysis because both categories combined only accounted for 1.3% of the cases.
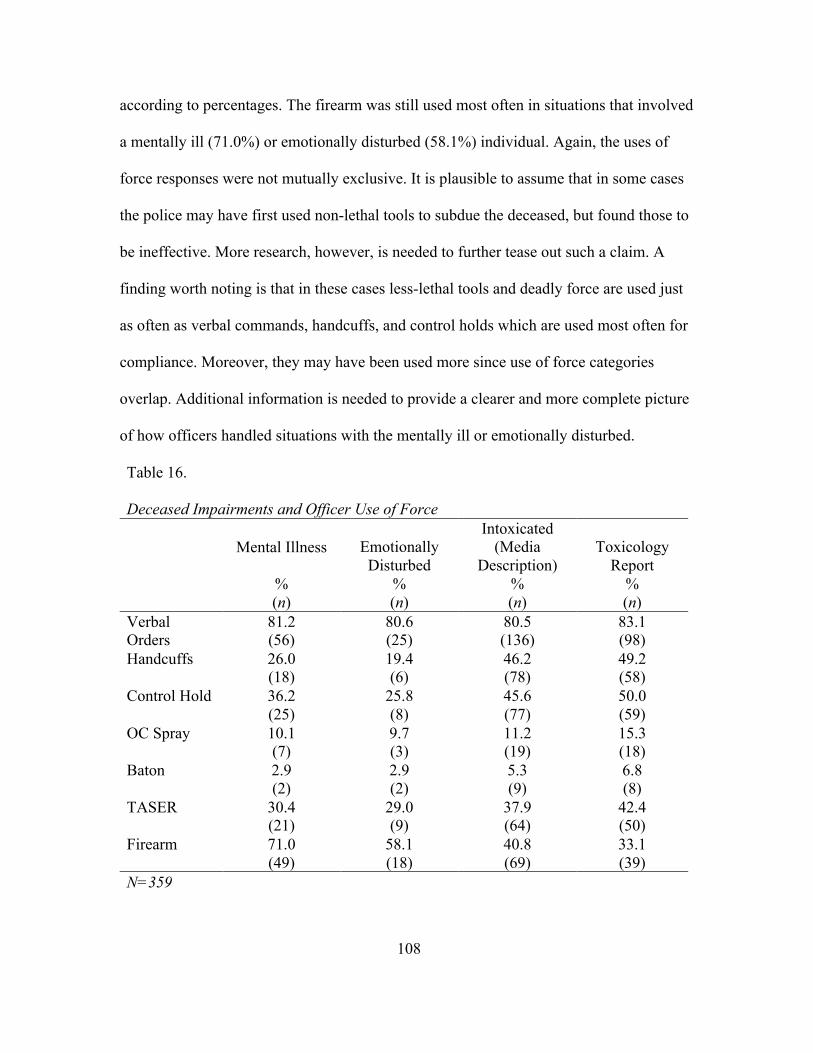
108
according to percentages. The firearm was still used most often in situations that involved
a mentally ill (71.0%) or emotionally disturbed (58.1%) individual. Again, the uses of
force responses were not mutually exclusive. It is plausible to assume that in some cases
the police may have first used non-lethal tools to subdue the deceased, but found those to
be ineffective. More research, however, is needed to further tease out such a claim. A
finding worth noting is that in these cases less-lethal tools and deadly force are used just
as often as verbal commands, handcuffs, and control holds which are used most often for
compliance. Moreover, they may have been used more since use of force categories
overlap. Additional information is needed to provide a clearer and more complete picture
of how officers handled situations with the mentally ill or emotionally disturbed.
Table 16. Deceased Impairments and Officer Use of Force
Mental Illness
% (n)
Emotionally Disturbed
% (n)
Intoxicated (Media
Description) % (n)
Toxicology Report
% (n)
Verbal Orders
81.2 (56)
80.6 (25)
80.5 (136)
83.1 (98)
Handcuffs 26.0 (18)
19.4 (6)
46.2 (78)
49.2 (58)
Control Hold 36.2 (25)
25.8 (8)
45.6 (77)
50.0 (59)
OC Spray 10.1 (7)
9.7 (3)
11.2 (19)
15.3 (18)
Baton 2.9 (2)
2.9 (2)
5.3 (9)
6.8 (8)
TASER 30.4 (21)
29.0 (9)
37.9 (64)
42.4 (50)
Firearm 71.0 (49)
58.1 (18)
40.8 (69)
33.1 (39)
N=359
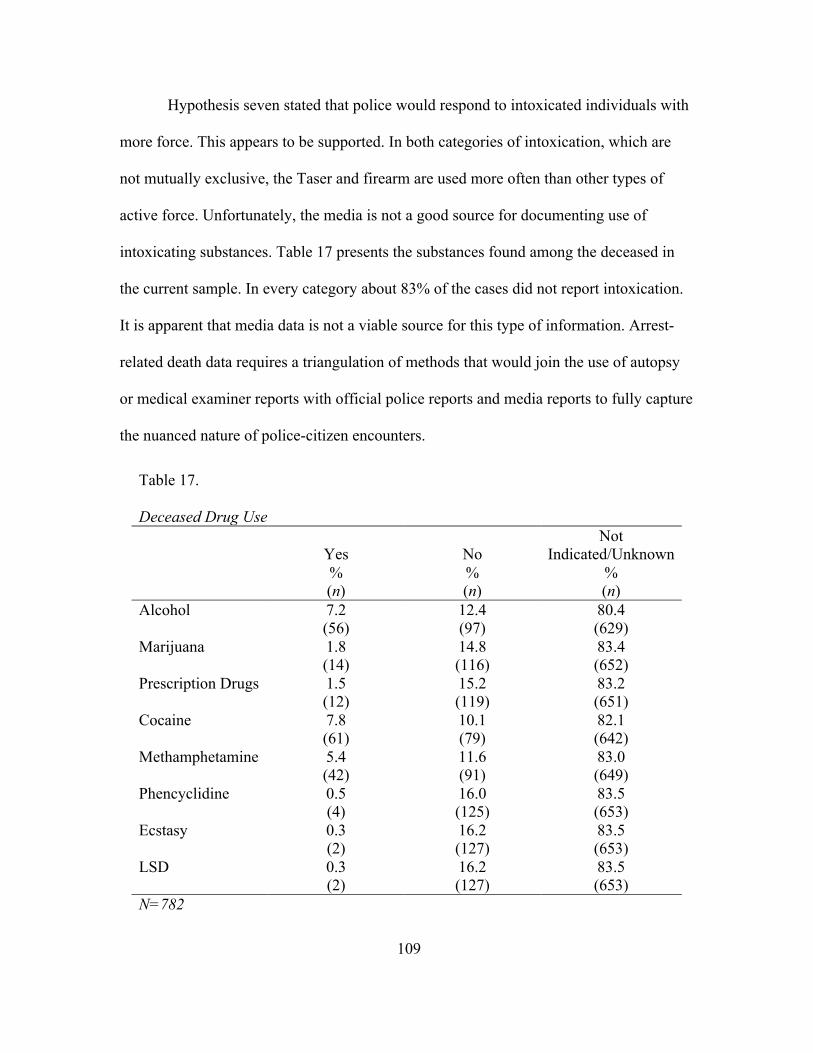
109
Hypothesis seven stated that police would respond to intoxicated individuals with
more force. This appears to be supported. In both categories of intoxication, which are
not mutually exclusive, the Taser and firearm are used more often than other types of
active force. Unfortunately, the media is not a good source for documenting use of
intoxicating substances. Table 17 presents the substances found among the deceased in
the current sample. In every category about 83% of the cases did not report intoxication.
It is apparent that media data is not a viable source for this type of information. Arrest-
related death data requires a triangulation of methods that would join the use of autopsy
or medical examiner reports with official police reports and media reports to fully capture
the nuanced nature of police-citizen encounters.
Table 17. Deceased Drug Use
Yes % (n)
No % (n)
Not Indicated/Unknown
% (n)
Alcohol 7.2 (56)
12.4 (97)
80.4 (629)
Marijuana 1.8 (14)
14.8 (116)
83.4 (652)
Prescription Drugs 1.5 (12)
15.2 (119)
83.2 (651)
Cocaine 7.8 (61)
10.1 (79)
82.1 (642)
Methamphetamine 5.4 (42)
11.6 (91)
83.0 (649)
Phencyclidine 0.5 (4)
16.0 (125)
83.5 (653)
Ecstasy 0.3 (2)
16.2 (127)
83.5 (653)
LSD 0.3 (2)
16.2 (127)
83.5 (653)
N=782
110
Based on the media data, it is largely unknown how many cases involved some
type of impaired individual. Moreover, the data do not lend to any type of training
implications, especially in response to impaired individuals. Police-citizen encounters
involving impaired individuals, whether it is because of a mental illness or substance
intoxication, require certain informed responses by police (DiMaio & DiMaio, 2006).
Research has uncovered sudden in-custody deaths are related to excited delirium, which
includes behaviors associated with mental health and intoxicated impairments (Ho et al.,
2006). While less-lethal types of force may not directly contribute to the death of a
civilian, they may play a role due to an individual’s mental and physiological state. It is
difficult to gather from media reports how the interaction of force and impairment
influences death without more information. Triangulating data sources can help inform
training among police departments to reduce risks to the officers when dealing with
potentially dangerous individuals and to reduce risks to the individuals themselves.
111
CHAPTER 6
DISCUSSION
The role of police is complex and demanding where some citizens, or clients, require
assistance and others require restraint or even force (Skolnick & Fyfe, 1993). Researchers
have investigated these different types of police-citizen interactions for the past several
decades, but still seem to ask the same questions. As a nation, we still do not know how
many individuals die during police-citizen interactions or the circumstances surrounding
the event (Kane, 2007). Based on the past research and decades of public policy
recommendations, the current study set out to systematically investigate arrest-related
death events using media reports as a source for data.
The heightened tensions among the public and police due to current events has
made deadly police-citizen encounters one of the most pressing matters in the United
States today. Unfortunately, the lack of data on ARDs and accountability of police
departments to provide such data creates difficulties in assessing how researchers and
practitioners might mitigate both police and citizen harms. The Deaths in Custody
Reporting Act of 2000 (DICRA; Public Law 106.297) attempted to address this issue by
creating a national assessment of all ARDs, but the DCRP ARD collection has only
published limited aggregated data on ARDs from 2003 to 2009. More recently, the
Bureau of Justice Statistics released a technical report that stated the program might only
capture 50% of ARD cases (Planty et al., 2015). This may be due to the varied reporting
practices, but also because police departments are not federally mandated to provide
ARD information. States can choose not to participate in the program. When they do not
112
participate, it has been the practice of the DCRP to fill in the gaps using media reports
(Burch, 2011).
This lack of information coupled with current events highlight the importance of
creating a systematic, national database that collects useful information on arrest-related
deaths. The expedited dissemination of information across the nation due to camera
phones and social media creates a new dynamic to police citizen relationships
(Goldsmith, 2010). Police no longer control the narrative being broadcasted to the
broader public (Goldsmith, 2010), whereas before they were one of the main sources of
information for news outlets, which allowed them to promote a positive image of their
department (Chermak, 1995; Chermak & Weiss, 2005; Surette, 1998). If an individual
records an arrest-related death or perceived police brutality, it is shared with the nation
within seconds, making it more difficult for police to explain what occurred during the
incident. Technology bombards individuals with news, pictures, and videos and pushes
them to choose a side. Media has the power to frame political rhetoric and set a tone
across the nation (Callaghan & Schnell, 2001). Such police “scandals” undermines
citizens’ confidence in all police and leads distrust of all officers and especially in
minority communities, citizens question whether police are carrying out justice fairly
(Skolnick & Fyfe, 1993; Tyler, 1990; 2004). Citizens, especially minority citizens with a
long-standing history of strained police-citizen relationships, do not want to cooperate
with police. Perceived injustice and low cooperation create a cycle of increased wariness
from both officers and citizens.
Based on this, the purpose of the current study was twofold. First, the study
sought to assess media reports as a viable option for data to investigate arrest-related
113
deaths since there is no publicly available data to do so. Second, the study explored the
nature of arrest-related deaths in an attempt to provide some insight into these events.
Findings from the current study indicate that media reports alone are not a viable source
of data, especially in terms of identification. Since the no publicly available data exists in
disaggregated form for all types of ARDs, the media can be used to understand some
incident-level characteristics, such as manner of death, deceased behaviors, and certain
types of police use of force, but the media falls short in other categories. Based on these
overall findings the current study argues for the creation of a publicly available,
systematic, triangulated, mandatory national database of all types of arrest-related deaths.
National Database
The current national collection of ARDs is problematic because it is not publicly
available and the DCRP estimates are possibly lower than the actual rate of ARDs (Planty
et al., 2015). Researchers have called for a central registry that catalogues all arrest-
related deaths for several decades (Blumberg, 1989; Geller & Scott, 1992; Kane, 2007;
Klinger, 2008; Sherman, Cohn, & Gartin, 1986), but the federal government only
recently emphasized this point. In the wake the controversial deaths of minority citizens
across the country, such as Michael Brown and Freddie gray, the President’s Task Force
on 21st Century Policing (2015), the most recent presidential task force since 1967, was
called. The final report from the task force addresses the issue of a national database.
Action item 2.2.4 calls for the implementation of policies on use of force that “require
agencies to collect, maintain, and report data to the Federal Government on all officer-
involved shootings, whether fatal or nonfatal, as well as any in-custody death”
(President’s Task Force on 21st Century Policing, 2015, p. 88). Furthermore, action item
114
7.3 suggests that the COPS office and BJS establish a central repository of the data
together. It is important to note that the implementation of DICRA required all states to
report, but this has not been enforced.
Thus it is apparent that a national central registry must require all police
departments across the country to report on deaths that occur during police-citizen
encounters and the federal government must enforce and incentive participation. Doing
so would increase legitimacy and transparency among police departments. While the
implementation of the Deaths in Custody Reporting Act in 2000 (DICRA; Public Law
106-297) required the quarterly collection of deaths that occurred in custody at state or
local correctional facilities as well as any person who is in the process of arrest, there was
not enforcement of the law or incentive to comply on the part of police departments. All
of the 50 states and the District of Columbia were eligible for Violent Offender
Incarceration and Truth in Sentencing (VOI/TIS) grants to assist in the collection of
ARDs, but these funds were awarded to state departments of correction since the ARD
program was not added until 2003 (Planty et al., 2015). Some of the states used the funds
and made their state department of corrections in charge of compiling the ARD records
(http://bjs.gov). Other states did not and chose various agencies as the state reporting
coordinators (SRCs) that collect all ARDs for the entire state. These include a state
criminal justice agency, state department of public safety, or the state attorney general.
The states whose SRCs were employed by state justice statistics analysis centers (SACs)
received federal funds to support their ARD collection and in a little more than half of the
states the SRC served as the SAC (Planty et al., 2015). Other than those funds they may
have received, participated in the DCRP ARD collection is voluntary. Moreover, several
115
states have not reported at all (e.g., Georgia, Maryland, and Montana) and others do not
consistently report and have dropped out over the past several years. That is compliance
is voluntary and enforcement is nonexistent.
Stemming from this issue is the varying data collection process across states. The
Bureau of Justice Statistics provides the CJ11-A Addendum and assistance in how to
collect the data, but does not enforce a standardized methodology. Information for ARDs
come from a number of entities, which include law enforcement surveys or referrals,
medical examiner data request, prosecutor surveys, and open source searches such as
media reports (Planty et al., 2015). In 17 states the SRC uses multiple methods for
identifying and collecting information on ARDs while 24 states use only one source and
no two states used the exact same procedures (Planty et al., 2015). Lack of
standardization can lead to low identification rates, as suggested in the quality profile of
the ARD program, and possible missing data for the cases that are reported.
Standardization across states needs to be put in place at the SAC, SRC, and data
collection levels. Due to these discrepancies in the data, the DCRP ARD program was
suspended in March 2014). More recently, however, in light of recent current events, the
DCRP ARD program is undergoing improvement efforts that should include
standardization across SRCs in terms of the identification and collection process, which
may include law enforcement agencies and medical examiners/coroners as potential
contacts for information (M. Planty, personal communication, July 30, 2015).
Based on the findings of the current study and past research, the current study
proposes a number of recommendations for the revamping of the ARD program. First, as
discussed previously, more accountability needs to be placed upon police departments to
116
gather this information and share it with a SRC or the entity that is collecting the data.
Second, BJS should consider the use of universities as SRCs for each state. Universities
are equipped with data collection capabilities and a number of law enforcement agencies
have developed relationships with universities and other researchers (PERF, 2014).
Third, the standardization of information should include the triangulation of data
sources for all states. About 32 states that report to the DCRP ARD program use web-
based, open-source searchers as their source of data. Media reports are useful sources of
information in some aspects, but should not be the only source of data. Issues with
missing data will arise, especially in terms of race, mental health, intoxication, and
certain types of medical deaths, such as sudden in-custody deaths. Including the use of
medical examiner or coroner reports will fill in these gaps. They also provide a source
data that should be unbiased and independent of police departments.
Similarly, while media reports do provide information on use of force by police
and interactive behaviors on the part of the deceased, they do not always report on the
sequence of events. Research supports the idea that police-citizen interactions are
transactional in nature with certain behaviors escalating the situation (Binder & Scharf,
1980). Incorporating police reports with media reports and medical examiner reports can
provide more information on the sequence of events during the police-citizen interaction,
such as the behavior of the deceased and what type of response and officer engaged in.
Triangulation methods have been used in other data collection efforts, such as the
National Violent Death Reporting System (NVDRS), and should be implemented within
the DCRP ARD collection as well.
117
Triangulating data sources would provide the most comprehensive account of
each incident, but this would also require BJS to expand the CJ11-A Addendum. Thus,
the fourth recommendation is to include more items on the CJ11-A to capture the
complex nature of ARDS. One of the findings of the current study is that the DCRP does
not ask an adequate amount of questions to capture the complex nature of ARDs. Asking
so few questions is problematic for researchers to disentangle the complexities of fatal
police-citizen encounters. For example, the CJ-11A addendum does not ask how the
police and the deceased came into contact. Offense type is collected and separated into
violent, property, drug, public-order, no criminal charges intended – mental health, and
unknown. While offense type might allude to what type of behavior the deceased may be
engaging in, it does not depict the story of how the police and a citizen came into contact
or the transaction that took place. Thus, the DCRP data do not provide any insight as to
what types of calls for service could potentially escalate into a fatal encounter. More
broadly, the DCRP data may not be the best data to analyze when trying to gather
training or safety information for law enforcement.
Additionally, the way that the CJ-11A is set up can miss out on important aspects
of an incident. For example, in the case of Freddie Gray, paramedics were not called until
he was taken to Western District police station, before eventually being transported to the
University of Maryland R. Adams Cowley Shock Trauma Center in Baltimore (Bever &
Ohlheiser, 2014). According to the instructions on the CJ-11A, the use of force used
against Mr. Gray prior to him arriving at the booking facility would not be recorded. This
is a serious exclusion of information since it appears that the actions of officers prior to
arrival at the Western District station caused his death.
118
Lastly, the DCRP ARD program should revise their definition to include certain
types of deaths they currently exclude. For example, deaths that occur during a police
chase but that do not occur due to direct police intervention should be included. A person
might not otherwise be involved in a vehicle crash if the police were not chasing him or
her. The collection should also include deaths that occur during a police-citizen
interaction involving federal law enforcement agencies. A federally mandated collection
of all death in-custody should include federal law enforcement agencies in addition to the
state and local law enforcement agencies. Excluding such deaths does not tell inform the
public how many citizens die at the hands of police each year. Lastly, deaths of third
parties not subject to arrest should be included. These deaths would be individuals that
die from police action but who were not actively sought out by police, such as a hostage
being shot by a police bullet or a bystander being hit by a stray police bullet. Such deaths
can inform policy about under what situations police use of deadly force might result in
more deaths than not.
The final recommendation is to report the data publicly in disaggregated form.
The President’s Task Force on 21st Century Policing (2015) may call for the federally
mandated collection of use of force events, but only reporting aggregated numbers and
minimal characteristics answers so many questions posed by researchers, policymakers,
and the public. Aggregate numbers do not inform the public whether or not police are
using force appropriately and still limits the public’s confidence in police departments.
Police reform and the mending of the police-citizen relationships starts with openness
about police and what they do (Skolnick & Fyfe, 1993).
119
Furthermore, making the incident-level data publicly available would allow
researchers to analyze it and possibly supplement it with data reported in the media if the
amount of information collected remains small. As mentioned previously, findings of the
current study suggest that media reports can add value by providing context and detail of
ARDs, such as how the police and citizen came into contact, as well as behaviors of the
deceased and the police. In turn, the disaggregated, publicly available federally mandated
information would fill in the gaps with media reports. For example, deceased and officer
race as well as officer length of service were consistently underreported in the media. But
this type of information is likely available in the DCRP data or at least attainable should
they expand the CJ11-A. Public release of this information would allow researchers to
investigate racial disparities, which is one of the main controversies surrounding recent
deadly police-citizen encounters. Having publicly available data would allow for the
identification of problematic practices and could inform the development of training to
reduce racial stereotypes that may influence officer decisions (Gau et al., 2010; Kane,
2007). The purpose of creating a national, central registry is not to launch unwarranted
investigations into police departments, but to inform policy and practice to reduce harm
to both citizens and officers.
Future Research
Deadly police-citizen interactions are situationally dynamic and result in a
number of complex issues, especially when police use of force is involved (Ross, 2002).
While the current study shed some light on deadly police-citizen encounters, more
research and data are needed to fully understand the complexities associated with ARDs,
especially in regards to media data as a source. The current study used media reports that
120
were published up to 10 years prior. Methodological research that examines the utility of
more recently published media reports found through open-source web-based searches
are needed to explore just how comprehensive the information can be. One of the main
questions that need to be explored is if more recent media reports identify more ARDs
than media reports from 10 years ago, as well as how comprehensive is the content
provided in more recent media reports. For example, in light of recent racial issues
surrounding police-citizen relationships, would the media report more information such
as race?
Additionally, as recommended, future research should incorporate multiple
sources of data to more fully and accurately capture the nature of ARDs. If federal
government data continues to be restricted, researchers should look to media reports
coupled with other types of data, such as autopsy reports. Other studies have used
requests under the Freedom of Information Act (FOIA) to gather medical examiner
reports in addition to media reports to examine Taser-proximate deaths (White et al.,
2013). This, however, can be timely. Ideally, police departments would also seek out
researchers to help organize and analyze their data. The participation of police
departments with entities such as universities would signal to the public they are
attempting to improve strategies and policies and potentially increase their legitimacy
(PERF, 2012).
Other future research should incorporate neighborhood level data. Power attracts
violence and in some neighborhoods backing down from a police officer can be viewed
as cowardly (Muir, 1980). Not trying to exert power and dominance over an officer
during a police-citizen encounter can have negative consequences for an individual after
121
the officer leaves (Muir, 1980). This might also provide more information on the question
of force being used disproportionately against minority citizens. The media is not a good
source for understanding the role of race. Researchers have suggested that minorities may
be disproportionately killed by police due to the over involvement in criminal activities
and subcultures of violence (e.g., Calmore, 1993; Wolfgang & Ferracuti, 1967). Adding
in neighborhood-level data would also allow researchers to further investigate how
socioeconomic status may place a role.
Lastly, as recommended in the final report of the President’s Task Force on 21st
Century Policing (2015) in action item 2.2.4 the federally mandated collection should
include all use of force events, even those that do not result in a citizen’s death. This
allows for more complex analyses of potentially dangerous police-citizen encounters.
Researchers would be able to employ a control group and compare citizen behaviors and
police use of force. Such analyses could information policy and training for police
departments. For example, research has uncovered that officers receive inadequate mental
health training and they cannot always identify a mentally ill or intoxicated individual
(DiMaio & DiMaio, 2006). In police-citizen encounters each move matters and police
have to decide how to handle the situation rapidly. When dealing with a mentally ill or
intoxicated individual an officer may not have the necessary tools to de-escalate the
situation, such as psychiatric assessment skills needed to identify behavioral, cognitive,
or emotional behaviors (DiMaio & DiMaio, 2006). Being able to compare deadly police-
citizen incidents to non-deadly police-citizen incidents can more fully inform policy.
Until such a database exists with all known incidents included, training and policy
implications remain unknown. Further, continued failure to fully study all types of arrest-
122
related deaths will continue to deteriorate the relationships between police and citizens.
Society has given up their right to use coercive force and placed the responsibility with
the government. In the United States there is a democratic process where “the public
funds police departments and all dimensions of their coercive activities. The public owns
all information related to police operations and processes,” and should therefore have
access to it (Kane, 2007, p. 778). The public has a right to a more transparent police
force. With today’s technological advancements, it is important to provide that
transparency to insure police legitimacy. Police no longer control the narrative behind
incidents because of the proliferation and accessibility of social media and video
recordings (Goldsmith, 2010). A publicly available national database would work to
information the public about fatal police encounters and diminish myths perpetuated by
false knowledge. Increased legitimacy should lead to improved police-citizen
relationships, and stronger relationships with the community will enhance the
effectiveness of the police in reducing and preventing crime.
Limitations
The current study suffers from several limitations. First, the study relied on data
derived from an objective analysis of media reports. While news media largely receives
their information from police departments, they do not always receive all the information
surrounding the arrest-related death event (Chermak et al., 2014). These events become
ongoing investigations and police might not know all the details at first resulting in scant
or inaccurate information at first (PERF, 2015). Thus, completeness and accuracy within
an article is a large issue. In addition to this, bias in depicting police practices is also an
issue (Chermak, 1995a; Surette, 1998). Despite the news receiving a substantial amount
123
of information from police agencies, the agency does not control the message portrayed
by the media (Chermak, McGarrell, & Gruenewald, 2006; Goldsmith, 2010). For
example, when it comes to police practices, the news writer may not be educated on the
subject and may inaccurately depict what happened. Or, the media may choose to receive
its information elsewhere, such as from videos or witness accounts from the public
(Brown, 2015; Goldsmith, 2010).
Next, while events involving violent crime as well as police practices, such as the
use of the TASER are seen as newsworthy (Chermak, 1995b; Morrison, 2009), some
incidents may go unreported or may not be identified in media searches (Borrego, 2011).
Media sources exercise discretion when deciding what types of stories to cover as well as
the nature of the content reported in each story (Carlson, 2007). This discretion leads to
varying reporting styles from place to place and may depend on the overall crime rate of
the area or the level of seriousness (Chermak, 1995b). Moreover city-size has been linked
to what types of news stories are reported in the media. For example, mid-sized cities are
more likely to report other violent crimes and drug crimes than large and extra-large
cities (Chermak, 1995b). The current study suffered from these varying reporting
practices, which result in differing levels of detail of information from case to case and
missing data for several variables of interest for some cases.
Lastly, limitations arise from the time frame and methodology used for the current
study. The study collects media archives from up to 10 years ago. In 2005 and 2006,
online consumption of online news media was at about 20%, but has increased since then
to about 40% in 2012 in a recent survey by the Pew Research Center (Sasseen, Olmstead,
& Mitchell, 2013). Today most mobile news consumers use multiple platforms to receive
124
their news (Sasseen et al., 2013). Low identification rates for the current study may be
due to lower rates of online news media since consumption was not as rampant. It is
possible that the viability of media reports as a data source may have improved over past
decade. More research is needed to explore this phenomenon.
Additionally, some media news outlets may not archive their new articles. At the
beginning of the study, Google News archived media reports were not available for 2005
and 2006. This eliminated the use of one potential search engine. Moreover, in searching
for 2006 ARDs the New York Times archives would not yield any search results, again
eliminating the use of another search engine. Two researchers also conducted the
searches, which adds an element of human error when searching thousands of search
results. Both researchers conducted the 2005 searches. One researcher conducted the bulk
of the searches and the second researcher randomly chose ten percent of the search terms
to re-search in one search engine. This yielded several more unique cases that were not
identified by the original researcher. Given the number of search results per search term,
researcher fatigue may have increased the likelihood of not identifying unique cases.
Lessons Learned
While the use of media reports as a data source is gaining popularity in the field
of criminology, there are still few examples to follow in terms of data collection and
process. Furthermore, each study is unique and the data is complex and nuanced. Since
the current study was an expansion of an earlier study, the data collection process
spanned from 2010 to 2015. The sample grew from 252 cases to 758 cases.
Undergraduate researchers were brought on to help with the data collection and coding
125
process. The process itself was iterative and time consuming and provided a number of
learning points throughout the past five years.
First, a number of unforeseen problems were encountered when dealing with the
same search engines over a span of five years. At the beginning of data collection in
2010, LexisNexis Academic provided the most media reports on ARDs for the twelve-
state stratified random sample (Borrego, 2011). When all other states were included in
the sample and searched for the number of results did not match what was previously
found. That is, far fewer ARDs were identified through LexisNexis Academic for the
years 2005 and 2006. Similarly, The New York Times Archives identified a number of
ARDs for 2005, but did not work for 2006 when searching resumed in 2014. Several
different computers and web browsers were used, but searches that included the 2006
time frame did not yield any results. Thus, this is when the HighBeam Research database
was included in the current study.
Second, creating a comprehensive codebook was an iterative process. The first
codebook expanded upon the CJ-11A Addendum used by the Bureau of Justice Statistics
and included 104 variables. Based upon the findings in Borrego’s (2011) initial study,
other research and the newly identified media reports, a number of variables were added
to the 104. Understanding the data and what needed to be coded came from reading and
coding the media reports themselves. Overtime, it became apparent that the current study
needed to add certain variables, make distinctions among others, and recode for
quantitative analysis. For example, whether or not a person was intoxicated became two
variables overtime. One of the variables indicates whether or not the media report
mentioned or described the deceased as intoxicated or under the influence of drugs of
126
alcohol. The information could be broad or specific by identifying the substance. The
second variable was based on whether or not the media report toxicology findings from a
medical examiner. Another example includes the health variable. This variable was
initially a mental health variable that coded whether or not a person was referred to as
having a mental illness or emotionally disturbed. Overtime, a number of other cognitive
health issues appeared in the media reports such as an individual being autistic of deaf.
The mental health variable was then categorized into mental illness, emotionally
disturbed, cognitive or developmental disability, or medical condition, such as history of
strokes. After several versions of the codebook, the current study ended up with 152
variables.
Third, since the entire data collection and coding process was iterative, training
undergraduate research assistants was challenging. Searching 77 search terms over three
databases exerted a certain amount of fatigue over the researcher, which resulted in a
number of missed ARDs. Perhaps it is too much of a task for one person to undertake all
of the searches by themselves unless it is broken up into time segments. Detailed notes on
each search term, such as number of total cases identified, total of unique cases, and
number of search result pages, for each search engine is necessary to track which search
terms are most helpful. This was not implemented until the end of the study, but will be
used moving forward.
The training undergraduate research assistants how to code cases was also
challenging since the codebook went through a number of changes while coding was
taking place. Having others code the media reports and bring up questions also helped
with the operationalization of the different variables and improved the study. The
127
undergraduate researchers were able to read the media reports with fresh perspective and
question information that was unclear or new to them. Weekly meetings helped clarify
questions and create new variables. While this was extremely helpful, it also lent to more
work since previously coded cases had to be revisited and recoded to fill in the missing
data for the new variables.
Thus, while a number of challenges were met through the data collection process, the
current study revealed one important overall lesson when collecting one’s own data: time.
The amount of time needed to identify cases will always be more than expected. Creating
a codebook and database from the ground up will always taking more than expected.
Training and managing research assistants will always occupy more time than expected.
Despite this, more time allowed for the current study to improve in all aspects and create
research plans for the future to combat potential problems.
128
REFERENCES
Adams, K. (1996). Measuring the prevalence of police abuse of force. In W. a. Geller & H. Toch (Eds.), Police Violence: Understanding and Controlling Police Abuse of Force (pp. 52-93). New Haven, CT: Yale University.
Adams, K. (1999). What we know about police use of force. Washington, DC: National
Institute of Justice. Akiyama, Y. & Nolan, J. (1999). Methods for understanding and analyzing NIBRS data.
Journal of Quantitative Criminology, 15(2), 225-238.
Almukhtar, S., Buchanan, L., Lai, R. K. K., Wallace, T., & Yourish, K. (May 2015). The timeline of Freddie Gray’s arrest and the charges filed. The New York Times. Retried from http://www.nytimes.com/interactive/2015/04/30/us/what-happened- freddie-gray-arrested-by-baltimore-police-department-map-timeline.html?_r=0
Alpert, G. P. (1989). Police use of deadly force: The Miami experience. In R G. Dunham
& G. P. Alpert (Eds.), Critical Issues in Policing (pp. 480-496). Prospect Heights, IL: Waveland.
Alpert, G. P. &Dunham, R. G. (2000). Analysis of police use of force data. Washington,
DC: National Institute of Justice.
Alpert, G. P. & Dunham, R. G. (2004). Understanding police use of force: Officers, suspects, and reciprocity. Cambridge, MA: Cambridge University Press.
Alpert, G. P., Dunham, R. G., & MacDonald, J. M. (2004). Interactive police-citizen encounters that result in force. Police Quarterly, 7(4), 475-488.
Alpert, G., & MacDonald, J. (2001). Police use of force: An analysis of organizational
characteristics. Justice Quarterly, 18, 393-409. Alpert, G. P., Smith, M., Kaminiski, R., Fridell, L., & Kubu, B. (2011). Police use of
force, TASERs and other less-lethal weapons. Washington, D.C.: National Institute of Justice.
Banks, D., Couzens, L., Blanton, C., & Cribb, D. (2015). Arrest-related deaths program assessment: Technical Report. Washington, DC: Bureau of Justice Statistics. Bayley, D. H. & Bittner, E. (1984). Learning the skills of policing. Law and
Contemporary Problems, 47(4), 35-59. Bayley, D. H. & Garofalo, J. (1989). The management of violence by police patrol officers. Criminology, 27(1), 1-25.
129
BBC News. (2014, December 10). Eric Garner death: 76 arrested at London Westfield
demo. Retrieved from http://www.bbc.com/news/uk-england-london-30424338 Bever, L. & Ohlheiser, A. (2014, April 20). Baltimore police: Freddie Gray died from a
‘tragic injury to his spinal cord’. The Washington Post. Retrieved from http://www.washingtonpost.com/news/morning-mix/wp/2015/04/20/baltimore- police-freddie-gray-arrested-without-force-or-incident-before-fatal-injury/
Binder, A. & Fridell, L. (1984). Lethal force as a police response. Criminal Justice Abstracts, 16 (2), 250-280.
Binder, A. & Scharf, P. (1980). The violent police-citizen encounter. Annals of the American Academy of Political and Social Science, 452, 111-121.
Bittner, E. (1967). Police discretion in emergency apprehension of mentally ill persons. Social Problems, 14, 278-292.
Bittner, E. (1970). The functions of the police in modern society. Rockville, MD: National
Institute of Mental Health. Blumberg, M. (1989). Controlling police use of deadly force: Assessing two decades of
progress. In R. G. Dunham and G. P. Alpert (Eds.), Critical Issues in Policing (pp. 442-464). Prospect Heights, IL: Waveland Press.
Bolger, P. C. (2014). Just following orders: A meta-analysis of the correlates of
American police officer use of force decisions. American Journal of Criminal Justice, 1-27.
Borrego, A. R. (2011). Arrest-related deaths in the United States: An assessment of the
current measurement. (Unpublished master’s thesis). Arizona State University, Arizona.
Breiding, M. J. & Wiersema, B. (2006). Variability of undetermined manner of death
Classification in the US. Injury Prevention, 12(Suppl II), ii49-ii54. Center for Disease Control and Prevention Wide-ranging Online Data for Epidemiologic Research. Available at <http://wonder.cdc.gov/>. Accessed March 11, 2011.
Brown, G. R. (2015). The blue line on thin ice: Police use of force modifications in the
era of cameraphones and Youtub. British Journal of Criminology, 1(1), 1-20. Brown, J. M. & Langan, P. A. (2001). Policing and homicide, 1976-98: Justifiable
homicide by police, police officer murdered by felons. Washington, DC: Bureau of Justice Statistics.
Burch, A. M. (2011). Arrest-related deaths, 2003-2009 – Statistical tables. Washington,
130
DC: Bureau of Justice Statistics. Callaghan, K. & Schnell, F. (2001). Assessing the democratic debate: How the news
media frame elite policy discourse. Political Communication, 18(2), 183-213. Calmore, J. O. (1993). Spatial equality and the Kerner Commission Report: A back-to-
the-future essay. North Carolina Law Review, 71, 1487-1518. Centers for Disease Control and Prevention. (2013). Retrieved from
www.cdc.gov/violenceprevention/datacollectionaccess.html CBS News. (2014, November 25). Documents describe Ferguson officer’s version of fatal
shooting. Retrieved from http://www.cbsnews.com/news/documents-describe- ferguson-officers-version-of-fatal-shooting/
Chanin, J. M. (2014). On the implementation of pattern or practice police reform.
Criminology, Criminal Justice, Law & Society, 15(3), 38-56. Chanin, J. M. (2015). Examining the sustainability of pattern or practice police
misconduct reform. Police Quarterly, 18(2), 163-192. Chapman, S. G. (1967). Police policy on the use of firearms. The Police Chief, 16-37. Chermak, S. M (1995a). Image control: How police affect the presentation of crime
news. American Journal of Police, 14, 21-43. Chermak, S. M. (1995b). Victims in the news: Crime and the American news media.
Boulder, CO: Westview Press Inc. Cohen, S. (1975). A comparison of crime coverage in Detroit and Atlanta newspapers.
Journalism Quarterly, 52(4), 726-730. Cohen, J. (1988). Statistical power analysis for the behavioral sciences. Hillsdale, NJ:
Lawrence Erlbaum. Davis, R. C., Henderson, N. J., Mandelstam, J., Ortiz, C. W. & Miller, J. (2005). Federal
intervention in local policing: Pittsburgh’s experience with a consent decree. Washington, DC: US Department of Justice, Office of Community Oriented Policing Services.
Deane, M. W., Steadman, H. J., Borum, R., Veysey, B., & Morrissey, J. P. (1999).
Emerging partnerships between mental health and law enforcement. Psychiatric Services, 50, 99-101.
Department of Justice. (2014a). Department of Justice releases resource guide to help law
131
enforcement strengthen relationships with communities. Retrieved from http://www.justice.gov/opa/pr/department-justice-releases-resource-guide-help- law-enforcement-strengthen-relationships.
Department of Justice. (2014b). Statement by Attorney General Holder on the ongoing
situation in Ferguson, Missouri. Retrieved from http://www.fbi.gov/stlouis/press- releases/2014/statement-by-attorney-general-holder-on-the-ongoing-situation-in- ferguson-missouri
Di Maio, T. G. & Di Maio, V. J. M. (2006). Excited delirium syndrome: Cause of death and prevention. Boca Raton, FL: Taylor & Francis Group.
Durose, M. R., Schmitt, E. L., & Langan, P. A. (2005). Contacts between police and the
public. Washington, DC: Bureau of Justice Statistics. Donahue, M.E. & Horvath, F.S. (1991). Police shooting outcomes: Suspect criminal
history and incident behaviors. American Journal of Police, 10 (3), 17-34. Eith, C. & Durose, M. R. (2011). Contacts between police and the public, 2008.
Washington, DC: Bureau of Justice Statistics. Freifeld, C. C., Mandl, K. D., Reis, B. Y, & Brownstein, J. S. (2008). HealthMap: Global
Infectious disease monitoring through automated classification and visualization of internet media reports. J Am Med Inform Association, 15, 150-157.
Friedrich, R. J. (1980). Police use of force: Individuals, situations, and organizations. The
ANNALS of the American Academy of Political and Social Science, 452, 82-97. Friday, J. C. (2006). Law enforcement and the National Violent Death Reporting System:
A partnership in the making. Injury Prevention, 12, ii55-ii57.
Fridell, L. A. & Binder, A. (1992). Police officer decisionmaking in potentially violent confrontations. Journal of Criminal Justice, 20, 385-399.
Fyfe, J. J. (1978). Shots fired: An examination of New York City police firearm
discharges. Doctoral dissertation. State University of New York at Albany. Fyfe, J. J. (1979). Administrative interventions on police shooting discretion: An
empirical examination. Journal of Criminal Justice, 7, 309-323. Fyfe, J. J. (1980). Philadelphia police shootings, 1975-1978: A system model analysis.
Report for the Civil Rights Division. Washington, DC: U.S. Department of Justice.
Fyfe, J. J. (1981a). Toward a typology of police shootings. In Contemporary Issues in
132
Law Enforcement. (ed.) James J. Fyfe. Beverly Hills, CA: Sage Publications. Fyfe, J. J. (1981b). Who shoots? A look at officer race and police shootings. Journal of
Police Science and Administration, 9, 367-392.
Fyfe, J. J. (1982). Blind justice: Police shootings in Memphis. The Journal of Criminal Law & Criminology, 73(2), 707-722.
Fyfe, J. J. (1988). Police Use of Deadly Force: Research and Reform. Justice Quarterly, 5, 165-205.
Fyfe, J. J. (2002). Too many missing cases: Holes in our knowledge about police use of force. Justice Research and Policy, 4(Special Issue), 87-102.
Gain, C. (1971). Discharge of firearms policy: Effecting justice through administrative
regulation. Unpublished memorandum. December 23. Garner, J. H., Buchanan, J., Schade, T., & Hepburn, J. (1996). Understanding the use of
force by and against the police. Washington, DC: National Institute of Justice. Garner, J. H., Maxwell, C. D., & Heraux, C. G. (2002). Characteristics associated with
the prevalence and severity of force used by the police. Justice Quarterly, 19, 705-746.
Gau, J., Mosher, C., & Pratt, T. (2010). An inquiry into the impact of suspect race on
police use of tasers. Police Quarterly. 13(1), 27-48.
Geller, W. & Karales, K. (1981a). Shootings of and by Chicago police: Uncommon crises- part I shootings by Chicago police.” Journal of Criminal Law and Criminology, 72(4), 1813-1866.
Geller, W. A. & Karales, K. (1981b). Split-second decisions: Shootings of and by
Chicago Police. Chicago Law Enforcement Study Group, Chicago, IL. Geller, W. A. & Scott, M. S. (1992). Deadly force: What we know: A practitioner’s desk
reference on police-involved shootings. Washington, DC: Police Executive Research Forum.
Goldkamp, J. S. (1976). Minorities as victims of police shootings: Interpretations of
racial disproportionality and police use of deadly force. The Justice System Journal, 2(2), 169-183.
Henriquez, M. (1999). IACP national database project on police use of force. In Use of
Force by Police: Overview of National and Local Data (pp. 19-24). Washington, DC: National Institute of Justice and Bureau of Justice Statistics.
133
Hickman, M. J. , Atherley, L. T., Jowery, P. G., & Alpert, G. P. (2015). Reliability of the
force factor method in police use-of-force research. Police Quarterly, 0(0), 1-29. Hickman, M. J., Piquero, A. R., & Garner, J. (2008). Toward a national estimate of police
use of nonlethal force. Criminology & Public Policy, 7(4), 563-604.
Hickman, M. J. & Reaves, B. (2003). Local police departments 2000. Washington, DC: US Department of Justice.
Hickman, M. J. & Reaves, B. (2006). Local police departments 2003. Washington, DC:
US Department of Justice. HighBeam Research. (2015). Publications by category. Retrieved from
http://www.highbeam.com/publications
Ho, J. D., Dawes, D. M., Nelson, R. S., Lundin, E. J., Ryan, F. J., Overton, K. G., Zeiders, A. J., & Minder, J. R. (2010). Acidosis and catecholamine evaluation following simulated law enforcement “use of force” encounters. Academic Emergency Medicine, 17, E60-E68.
Ho, J. D., Heegard, W. G., Dawes, D. M., Natarajan, S., Reardon, R. F., & Miner, J. R.
(2009). Unexpected arrest-related deaths in America: 12 months of open source surveillance. Western Journal of Emergency Medicine, X(2), 68-73.
Holmes, M. D. (2000). Minority threat and police brutality: Determinants of civil rights
criminal coplainst in U.S. municipalities. Criminology, 38(2), 343-368. Homant, R. J. & Kennedy, D. B. (2000). Suicide by police: A proposed typology of law
enforcement officer-assisted suicide. Policing: An International Journal of Police Strategies & Management, 23(3), 339-355.
Hutson, H. R., Anglin, D., Yarbrough, J., Hardaway, K., Russell, M., Strote, J., Canter,
M., & Blum, B. (1998). Suicide by cop. Annals of Emergency of Medicine, 32(6), 665-669.
Ingram, J. R., Paoline, E. A., III, & Terrill, W. (2013). A multilevel framework for
understanding police culture. Criminology, 51, 365-397. International Association of Chiefs of Police. (1995). Pepper spray evaluation project:
Results of the introduction of oleoresin capsicum (OC) into the Baltimore County, MD, police department. Final report submitted to the National Institute of Justice. Alexandria, VA: International Association of Chiefs of Police.
Jackson, P. I. (1989). Minority group threat, crime, and policing: Social context and
134
social control. New York, NY: Preager. Jacobs, D. & O’Brien, R. M. (1998). The determinants of deadly force: A structural
analysis of police violence. American Journal of Sociology 103(4), 837-862. Johnson, R. R. (2015). Examining the effects of agency accreditation on police officer
behavior. Public Organization Review, 15, 139-155. Kania, R. E. & Mackey, W. C. (1977). Police violence as a function of community
characteristics. Criminology, 15, 27-48.
Kaminski, R. (2009). Research on conducted energy devices: Findings, methods, and a possible alternative. Criminology & Public Policy 8(4), 903-913.
Kaminski, R. & Adang, O. (2010). Pepper spray: Practice, policy, and research. In J. B. Kuhns & J. Knutsson (Eds.), Police use of force: A global perspective (pp. 167- 176).
Kaminski, R. & Sorensen, D. W. M. (1995). A multivariate analysis of individual,
situational, and environmental factors associated with police assault injuries. American Journal of Police, 14(3/4), 3-48.
Kaminski, R., DiGiovanni, C., & Downs, R. (2004). The use of force between the police
and persons with impaired judgment. Police Quarterly, 7, 311-338. Kaminski, R., Edwards, S., & Johnson, J. (1998). The deterrent effects of oleoresin
capsicum on assaults against police: Testing the velcro-effect hypothesis. Police Quarterly, 1, 1-20.
Kaminski, R., Edwards, S., & Johnson, J. (1999). Assessing the incapacitative effects of
pepper spray during resistive encounters with the police. Policing: An International Journal of Police Strategies and Management 22(1), 7-29.
Kaminski, R. J. & Jefferis, E. S. (1998). The effect of a violent televised arrest on public perceptions of the police. Policing: An International Journal of Police Strategies & Management, 21(4), 683-706.
Kaminski, R. J., Jefferis, E. S., & Chanhatasilpa, C. (2000). A spatial analysis of
American police killed in the line of duty. In L. Turnbull, H. E. Hendrix, & B. D. Dent (Eds.), Atlas of Crime: Mapping the Criminal Landscape (pp. 212-220). Phoenix, AZ: Oryx Press.
Katz, W. (2014). Enhancing accountability and trust with independent investigations of
police lethal force. Harvard Law Review Forum, 128, 235-242.
135
Kane, R. J. (2007). Collect and release data on coercive police actions. Criminology, 6(4), 773-780.
Klinger, D. A. (1997). Negotiating order in patrol work: An ecological theory of police response to deviance. Criminology, 35(2), 277-306.
Klinger, D. A. (2004). Environment and organization: Reviving a perspective on the
police. Annals of the American Academy of Political and Social Science, 593I, 119-136.
Klinger, D. A. (2007). Impact munitions: A discussion of key information. Policing: An
International Journal of Police Strategy & Management, 30(3), 385-397. Klinger, D. A. (2008). On the importance of sound measures of forceful police actions.
Criminology and Public Policy, 7(4), 605-617. Kobler, A. L. (1975a). Police homicide in a democracy. Journal of Social Issues, 31(1),
163-184. Kobler, A. L. (1975b). Figures (and perhaps some facts) on police killing civilians in the
United States, 1965-1969. Journal of Social Issues, 31, 185-191. Krauskopf, A., Mayerhoefer, M., Oberndorfer, F., Salameh, B., Bur, A., Schneider, B., &
Risser, D. (2008). Does weight force application to the lower torso have an influence on inferior vena cava and cardiovascular parameters? The American Journal of Emergency Medicine, 26, 603-607.
LexisNexis. (2015). LexisNexis academic. Retrieved from http://www.lexisnexis.com/en-
us/products/lexisnexis-academic.page Liska, A. E. & Yu, J. (1992). Specifying and testing the threat hypothesis. In A.E. Liska
(Ed.), Social threat and social control (pp. 53-68). Albany: State University of New York Press.
Loftin, C., Wiersema, B., McDowall, D., & Dobrin, A. (2003). Underreporting of
justifiable homicides committed by police officers in the United States, 1976- 1998. Research and Practice, 93(7), 1117-1121.
Lumb, R. & Friday, P. (1997). Impact of pepper spray availability on police officer use of
force decisions. Policing: An International Journal of Police Strategies and Management, 20(1), 136-148.
Maltz, M. D. (1999). Bridging gaps in police crime data. Washington, DC: Bureau of
Justice Statistics.
136
Margarita, M. (1980). Killing the police: Myths and motives. Annals of the American
Academy of Political and Social Science, 452, 72-81. McCluskey, J. & Terrill, W. (2005). Departmental and citizen complaints as predictors of
police coercion. Policing: An international journal of police strategies and management, 28, 513-529.
McCluskey, J., Terrill, W., & Paoline, E. (2005). Peer group aggressiveness and the use
of coercion in police-suspect encounters. Police Practice & Research, 6, 29-37. McEwen, T. (1996). National data collection of police use of force. US Department of
Justice.
McEwen, T. & Leahy, F. J. (1994). Less than lethal force technologies in law enforcement and correctional agencies. Final report. Washington, DC: National Institute of Justice.
Meyer, M. W. (1980). Police shootings at minorities: The case of Los Angeles. The
ANNALS of the American Academy of Political and Social Science, 452, 98-110. Morrison, G. B. (2006). Deadly force programs among larger U.S. police departments.
Police Quarterly, 9(3), 331-360. Morrison, G. B. (2009). Conducted energy weapons: Learning from operational
discretion and encounter outcomes. Criminology & Public Policy, 8(4), 915-925. Muir, W. K. (1977). Police: Street-corner politicians. Chicago, IL: University of Chicago
Press. Mulvey, P. & White, M. (2014). The potential for violence in arrests of persons with
mental illness. Policing: An International Journal of Police Strategies & Management, 37(2), 404-419.
Mumola, C. J. (2007). Arrest-related deaths in the United States, 2003-2005. Washington,
DC: Bureau of Justice Statistics.
Nathan, Giri. (2014, August 1). Eric Garner died from chokehold while in police custody. Time. Retrieved from http://time.com/3071288/eric-garner-chokehold-death- nypd-medical-examiner/
NBC News. (2014, August 10). Looting erupts after vigil for slain Missouri teen Michael
Brown. Retrieved from http://www.nbcnews.com/storyline/michael-brown- shooting/looting-erupts-after-vigil-slain-missouri-teen-michael-brown-n177426
137
Nowacki, J. S. (2011). Organizational-level police discretion: An application for police use of lethal force. Crime & Delinquency, 1-26.
Paoline, E. A., III. (2003). Taking stock: Toward a richer understanding of police
culture. Journal of Criminal Justice, 31, 199-214. Pate, A. M. & Fridell, L. A. (1993). Police use of force: Official reports, citizen
complaints and legal consequences. Washington, DC: Police Foundation. Paulozzi, L. J., Mercy, J., Frazier, L. & Annest, J. L. (2011). CDC’s National Violent
Death Reporting System: Background and methodology. Injury Prevention, 10, 47-52.
Pelfrey, W. V. & Covington, M. W. (2007). Deaths in custody: The utility of data collected from county coroners. Criminal Justice Studies, 20(1), 65-78.
Perkins, J. E. & Bourgeois, M. J. (2006). Perceptions of police use of deadly force.
Journal of Applied Social Psychology, 36I(1), 161-177. Pinizzotto, A. J., Davis, E. F., Bohrer, S. B., & Infanti, B. J. (2012). Law enforcement
restraint in the use of deadly force within the context of ‘the deadly mix.’ International Journal of Police Science & Management, 14(4), 285-298.
Pizarro, J. M. & Zeoli, A. M. (2013). An assessment of the quality of homicide data in
the supplementary homicide reports: A research note. Justice Quarterly, 30(4), 711-731.
Polgreen, P. M., Chen, Y., Pennock, D. M., & Nelson, F. D. (2008). Using internet
searches for influenza surveillance. Healthcare Epidemiology, 47, 1443-1448.
Police Executive Research Forum. (2012). Critical issues in policing series: An integrated approach to de-escalation and minimizing use of force. Washington, DC: Police Executive Forum.
Police Executive Research Forum. (2015). Future trends in policing. Washington, DC:
Office for Community Oriented Policing Services. Police Executive Research Forum. (2015). Critical issues in policing series: Defining
moments for police chiefs. Washington, DC: Police Executive Research Forum. Planty, M., Burch, A. M., Banks, D., Couzens, L., Blanton, C., & Dribb, D. (2015).
Arrest-related deaths program: Data Quality Profile. Washington, DC: Bureau of Justice Statistics.
President’s Commission on Law Enforcement and Administration of justice. (1967). Task
138
force report: The police. Washington, DC: Government Printing Office. President’s Task Force on 21st Century Policing. (2015). Final report of the President’s task force on 21st century policing. Washington, DC: Office of Community Oriented Policing. Ready, J. T. & White, M. D. (2011). Exploring patterns of TASER use by the police: An
officer-level analysis. Journal of Crime and Justice, 34(3), 190-204. Reaves, B. A. & Smith, P. Z. (1995). Law enforcement management and administrative
statistics, 1993: Data for individual state and local agencies with 100 or more officers. Washington, DC: Bureau of Justice Statistics.
Reiss, A. J. (1971). The police and the public. New Haven, CT: Yale University Press. Reiss, A. J. (1980). Controlling police use of deadly force. Annals of the American
Academy of Political and Social Science, 452, 122-134. Riffe, D., Lacy, S. & Fico, F. G. (2005). Analyzing media messages: Using quantitative
content analysis in research. New York, NY: Taylor & Francis Group.
Robin, G. D. (1963). Justifiable homicide by police officers. The Journal of Criminal Law, Criminology, and Police Science, 54(2), 225-231.
Rojek, J., Alpert, G. P., & Smith, H. P. (2012). Examining officer and citizen accounts of
police use-of-force incidents. Crime & Delinquency, 58(2), 301-327. Ross, D. L. (2000). Emerging trends in police failure to train liability. Policing: An
International Journal of Police Strategies & Management, 23(2), 169-193. Ross, D. L. (2002). An assessment of Graham v. Connor, ten years later. Policing; An
International Journal of Police Strategies & Management, 25(2), 294-318. Ross, D. L. & Bodapati, M. R. (2006). A risk management analysis of the claims,
litigation, and losses of Michigan law enforcement agencies: 1985-1999. Policing: An International Journal of Police Strategies & Management, 29(1), 38-57.
Ross, D. L. & Parke, P. A. (2009). Policing by consent decree: An analysis of 42 U.S.C
14141 and the new model for police accountability. Police Practice and Research, 10(3), 199-208.
Rubenstein, J. (1973). City police. New York, NY: Ballantine. Rumbaut, R. G. & Bittner, E. (1979). Changing conceptions of the police role: A
139
sociological review. Crime and Justice, 1, 239-288. Sanburn, J. (April 2015). What’s next for Baltimore. Time. Retrieved from
http://time.com/3840364/baltimore-riots-protest-economy/ Sasseen, J., Olmstead, K., & Mitchell, A. (2013). Digital: By the numbers. Washington,
DC: The Pew Researcher Center’s Project for Excellence in Journalism. Retrieved from http://www.stateofthemedia.org/2013/digital-as-mobile-grows-rapidly-the- pressures-on-news-intensify/
Sherman, L. W. (1980). Perspectives on police and violence. The ANNALS of the
American Academy of Political and Social Science, 452, 1-12. Sherman, L. W., Cohn, E. G., & Gartin, P. R. Citizens killed by big city police, 1970-84.
Washington, DC: Crime Control Insitute. Sherman, L. W. & Langworthy, R. H. (1979). Measuring homicide by police officers.
The Journal of Criminal Law & Criminology, 70(4), 546-560. Shields, R. T. & Ward, B. W. (2008). Comparison of the National Violent Death
Reporting System and Supplementary Homicide Report: Potential benefits of integration.
Sigelman, L, Welch, S., Bledsoe, T., & Combs, M. (1997). Police brutality and public
perceptions of racial discrimination. Political Research Quarterly, 50, 777-791. Skogan, W. G. & Maxfield, M. G. (1981). Coping with crime: Individual and
neighborhood reactions. Beverly Hills, CA: Sage Publications. Skolnick, J. H. & Fyfe, J. J. (1993). Above the law: Police and the excessive use of force.
New York, NY: Free Press. Smith, D. A. (1986). The neighborhood context of police behavior. Crime and Justice, 8,
313-341. Smith, M. R. (2008). Toward a national use-of-force collection system: One small and
focused step is better than a giant leap. Criminology & Public Policy, 7, 619-627. Smith, M. R. & Petrocelli, M. (2002). The effectiveness of force used by police in
making arrests. Police Practice and Research, 3(3), 201-215. Smith, M. R., Petrocelli, M., & Scheer, C. (2007). Excessive force, civil liability, and the
Taser in the nation’s courts: Implications for law enforcement policy and practice. Policing: An International Journal of Police Strategies and Management, 30(3), 398-422.
140
Sorensen, J. R., Marquart, J. W., & Brock, D. E. (1993). Factors related to the killings of
felons by police officers: A test of the community violence and conflict hypotheses. Justice Quarterly, 10(3), 417-440.
Steffee, C. H., Lantz, P. E., Flannagan, L. M., Thompson, R. L., & Jason, D. R. (1995).
Oleoresin capsicum (pepper) spray and “in-custody deaths.” The American Journal of Forensic Medicine and Pathology, 16(3), 185-192.
Stinson, P. M., Reyns, B. W., & Liederbach, J. (2012). Police crime and less-than-lethal
coercive force: A description of the criminal misuse of TASERs. International Journal of Police Science & Management, 14(1), 1-19.
Stratton, S. J., Rogers, C., Brickett, K., & Gruzinski, G. (2008). Factors associated with
sudden death of individuals requiring restraint for excited delirium. American Journal of Emergency Medicine, 19(3), 187-191.
Swerdlow, C. D., Fisbein, M. C., Chaman, L., Lakkireddy, D. R., & Tchou, P. (2009).
Presenting rhythm in sudden deaths temporarily proimate to discharge of TASER conducted electrical weapons. Academic Emergency Medicine, 16 726-739.
Sykes, G. W. (1986). Street justice: A moral defense of order maintenance policing.
Justice Quarterly, 3, 497-512. Takagi, P. (1974). A Garrison state in “democratic” society. Crime and Social Justice, 1,
27-33. Tennenbaum, A. N. (1994). The influence of the “Garner” decision on police use of
deadly force. The Journal of Criminal Law and Criminology, 85(1), 241-260. Teplin, L. A. & Pruett, N. S. (1992). Police as streetcorner psychiatrist: Managing the
mentally ill. International Journal of Law and Pyschiatry, 15, 139-156. Terrill, W. (2003). Police use of force and suspect resistance: The micro process of the
police-suspect encounter. Policy Quarterly, 6(1), 51-83. Terrill, W. (2005). Police use of force: A transactional approach. Justice Quarterly,
22(1), 107-138. Terrill, W. & Mastrofski, S. D. (2002). Situational and officer-based determinants of
police coercion. Justice Quarterly, 19(2), 215-248. Terrill, W. & Paoline, E. A., III. (2015). Citizen complaints as threats to polic legitimacy:
The role of officers’ occupational attitudes. Journal of Contemporary Criminal Justice, 31(2), 192-211.
141
Terrill, W. & Reisig, M. D. (2003). Neighborhood context and police use of force.
Journal of research in crime and delinquency, 40(3), 291-321. Tyler, T. R. (1990). Why people obey the law. New Haven: Yale University Press. Tyler, T. R. (2004). Enhancing police legitimacy. The ANNALS of the American Academy
of Political and Social Science, 593, 84-99. Tuch, S. A. Weitzer, R. (1997). Racial differences in attitudes toward the police. Public
Opinion Quarterly, 61, 642-663. Uniform crime reporting handbook. (1984). Washington, DC: Federal Bureau of
Investigation.
Vaughn, M. S., Cooper, T. W., & del Carmen, R. V. (2001). Assessing legal liabilities in law enforcement: Police chiefs views. Crime & Delinquency, 47, 3-27.
Vermette, H. S., Pinals, D. A., & Appelbaum, P. S. (2005). Mental health training for law
enforcement professionals. The Journal of the American Academy of Psychiatry and the Law, 33, 42-46.
Vilke, G. M. & Chan, T. C. (2007). Less lethal technology: Medical issues. Policing: An
International Journal of Police Strategies and Management, 30, 341-357. Walker, S. (1993). Taming the system: The control of discretion in criminal justce, 1950-
1990. New York, NY: Oxford University Press. Walker, S. (2003). New approaches to ensuring the legitimacy of police conduct: The
new paradigm of police accountability: The U.S. Justice Department ‘pattern or practice’ suits in context. Saint Louis University Public Law Review, 22(3), 3-52.
Weitzer, R. (2002). Incidents of police misconduct and public opinion. Journal of
Criminal Justice, 30, 397-408. Weitzer, R. & Tuch, S. A. (2005). Racially biased policing: Determinants of citizen
perceptions. Social Forces, 83(3). Welti, C. V., Mash, D., & Karch, S. B. (1996). Cocaine-associated agitated delirium and
the neuroleptic malignant syndrome. American Journal of Emergency Medicine, 14, 25-28.
Westley, W. A. (1953). Violence and the police. American Journal of Sociology, 59, 34-41.
142
Westley, W. A. (1970). Violence and the police: A sociological study of law, custom, and morality. Cambridge, MA: Massachusetts Institute of Technology.
Wiersema, B., Loftin, C., & McDowall, D. (2000). A comparison of supplementary
homicide reports and National Vital Statistics System homicide estimates for US counties. Homicide Studies, 4, 317-340.
White, M. D. (2000). Assessing the impact of administrative policy on use of deadly
force by on- and off-duty police. Evaluation Review, 24(3), 295-318. White, M. (2002). Identifying situational predictors of police shootings using multivariate
analysis. Policing: An International Journal of Police Strategies & Management, 25(4), 726-751.
White, M. D. (2006). Hitting the target (or not): Comparing characteristics of fatal,
injurious, and noninjurious police shootings. Police Quarterly, 9(3), 303-330. White, M. D. & Klinger, D. (2012). Contagious fire? An empirical assessment of the
problem of multi-shooter, mulit-shot deadly force incidents in police work. Crime & Delinquency, 58(2), 196-221.
White, M. D. & J. Ready. (2009). Examining fatal and nonfatal incidents involving the
TASER: Identifying predictors of suspect death reported in the media. Criminology & Public Policy 8(4), 865-891.
White, M. D. & Ready, J. (2010). The impact of the taser on suspect resistance:
Identifying predictors of effectiveness. Crime & Delinquency, 56(1), 70-102. White, M. D., Ready, J., Riggs, C., Dawes, D. M., Hinz, A., & Ho, J. D. (2013). An
incident-level profile of TASER device deployments in arrest-related deaths. Police Quarterly, 16(1), 85-112.
Wilson, J. Q. (1968). Varieties of police behavior: The management of law and order in
eight communities. Cambridge, MA: Harvard University Press. Wolfgang, M. E. & Ferracuti, F. (1967). The subculture of violence: Towards an
integrated theory in criminology. New York, NY: Social Science.

143
APPENDIX A
MEDIA REPORT SEARCH TERMS
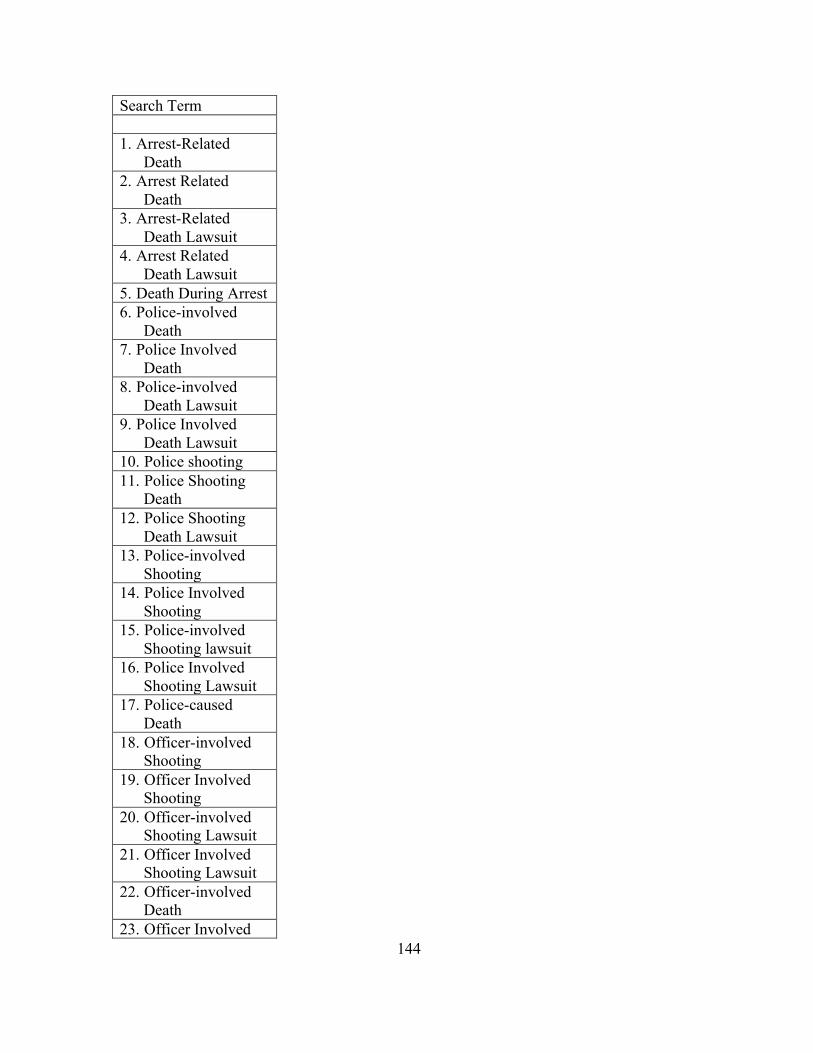
144
Search Term 1. Arrest-Related
Death 2. Arrest Related
Death 3. Arrest-Related
Death Lawsuit 4. Arrest Related
Death Lawsuit 5. Death During Arrest 6. Police-involved
Death 7. Police Involved
Death 8. Police-involved
Death Lawsuit 9. Police Involved
Death Lawsuit 10. Police shooting 11. Police Shooting
Death 12. Police Shooting
Death Lawsuit 13. Police-involved
Shooting 14. Police Involved
Shooting 15. Police-involved
Shooting lawsuit 16. Police Involved
Shooting Lawsuit 17. Police-caused
Death 18. Officer-involved
Shooting 19. Officer Involved
Shooting 20. Officer-involved
Shooting Lawsuit 21. Officer Involved
Shooting Lawsuit 22. Officer-involved
Death 23. Officer Involved
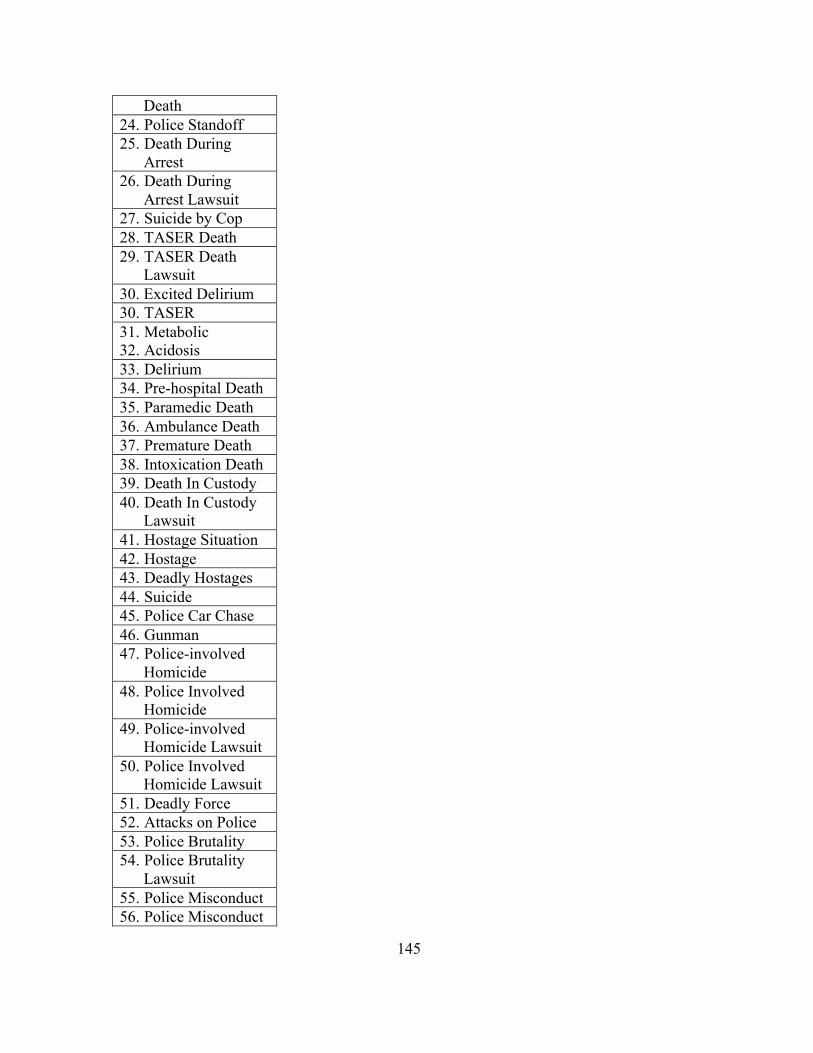
145
Death 24. Police Standoff 25. Death During
Arrest 26. Death During
Arrest Lawsuit 27. Suicide by Cop 28. TASER Death 29. TASER Death
Lawsuit 30. Excited Delirium 30. TASER 31. Metabolic 32. Acidosis 33. Delirium 34. Pre-hospital Death 35. Paramedic Death 36. Ambulance Death 37. Premature Death 38. Intoxication Death 39. Death In Custody 40. Death In Custody
Lawsuit 41. Hostage Situation 42. Hostage 43. Deadly Hostages 44. Suicide 45. Police Car Chase 46. Gunman 47. Police-involved
Homicide 48. Police Involved
Homicide 49. Police-involved
Homicide Lawsuit 50. Police Involved
Homicide Lawsuit 51. Deadly Force 52. Attacks on Police 53. Police Brutality 54. Police Brutality
Lawsuit 55. Police Misconduct 56. Police Misconduct
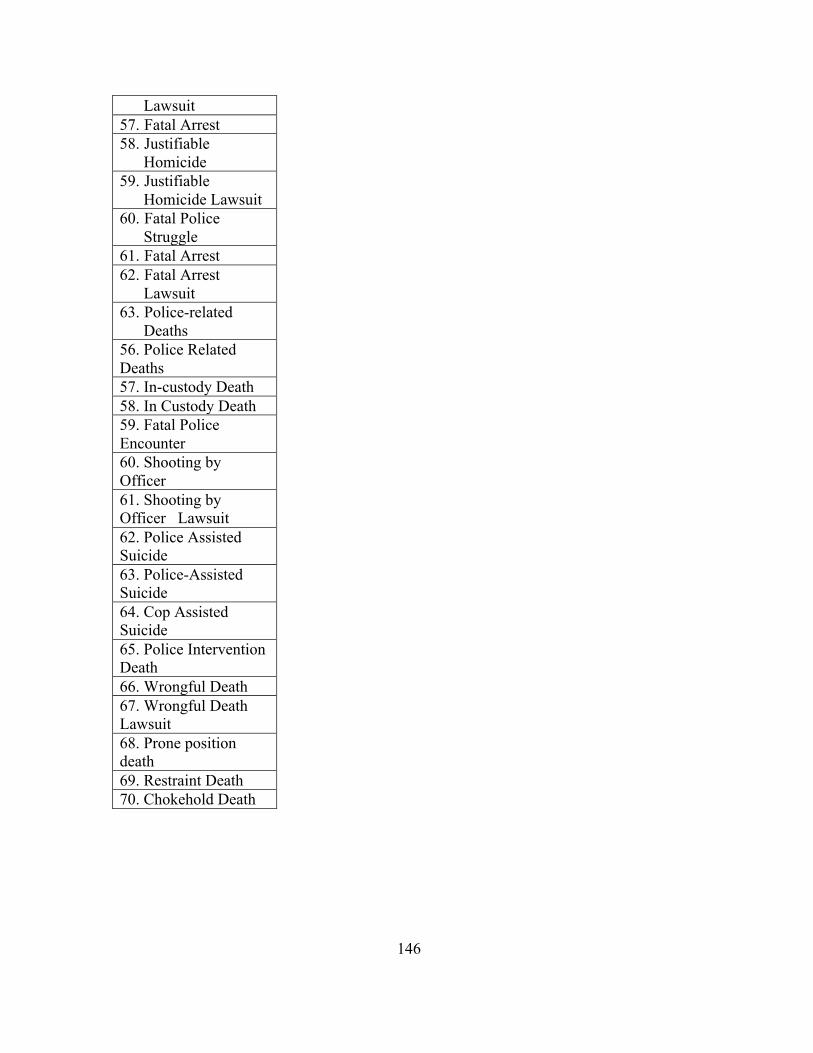
146
Lawsuit 57. Fatal Arrest 58. Justifiable
Homicide 59. Justifiable
Homicide Lawsuit 60. Fatal Police
Struggle 61. Fatal Arrest 62. Fatal Arrest
Lawsuit 63. Police-related
Deaths 56. Police Related Deaths 57. In-custody Death 58. In Custody Death 59. Fatal Police Encounter 60. Shooting by Officer 61. Shooting by Officer Lawsuit 62. Police Assisted Suicide 63. Police-Assisted Suicide 64. Cop Assisted Suicide 65. Police Intervention Death 66. Wrongful Death 67. Wrongful Death Lawsuit 68. Prone position death 69. Restraint Death 70. Chokehold Death

147
APPENDIX B
DCRP ARD CJ-11 A ADDENDUM
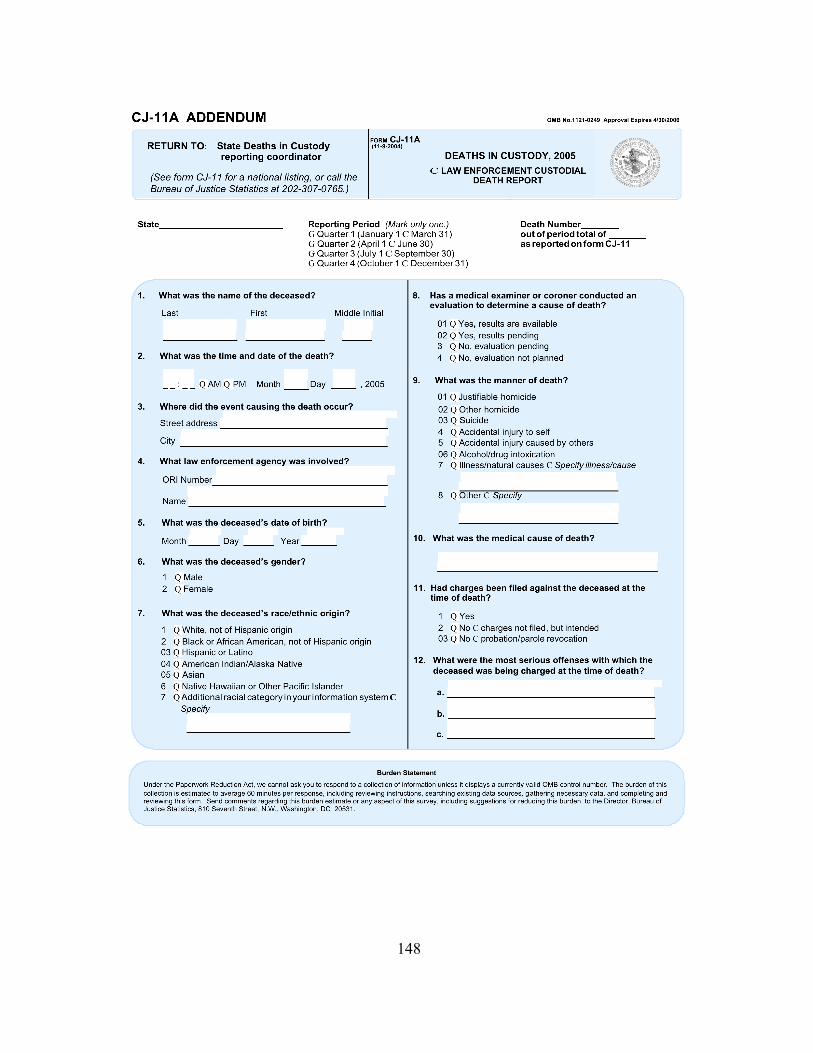
148
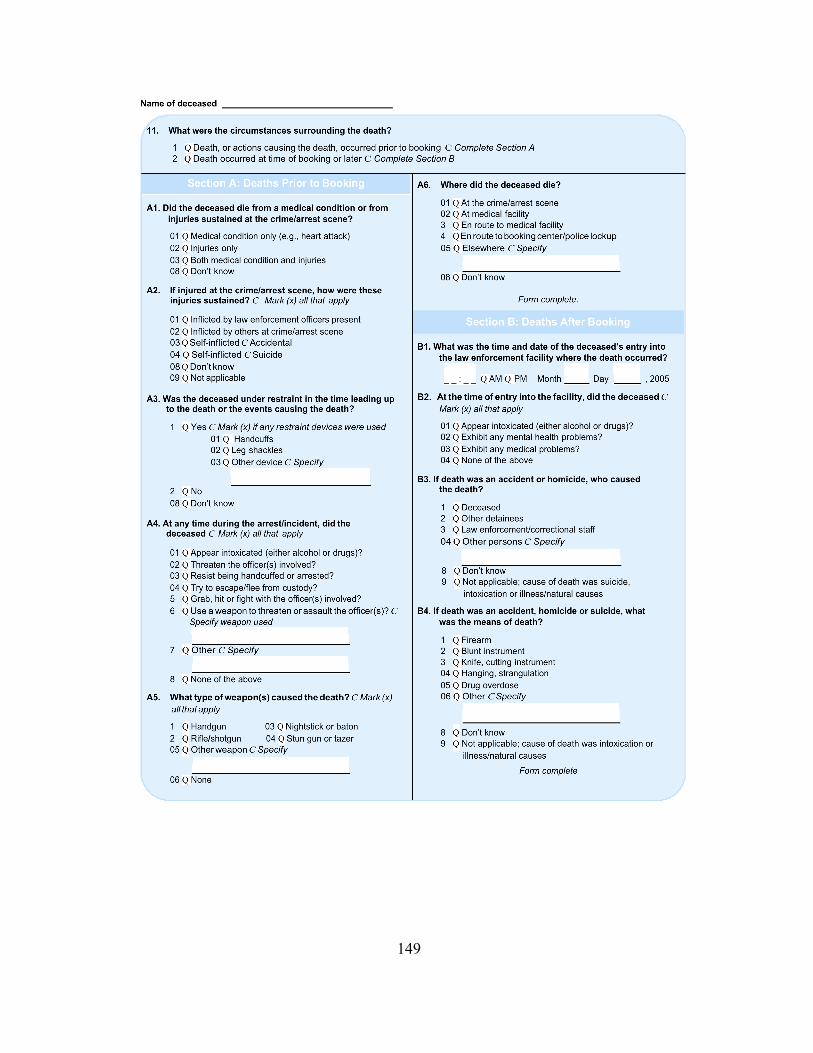
149

150
APPENDIX C
CODING INSTRUMENT
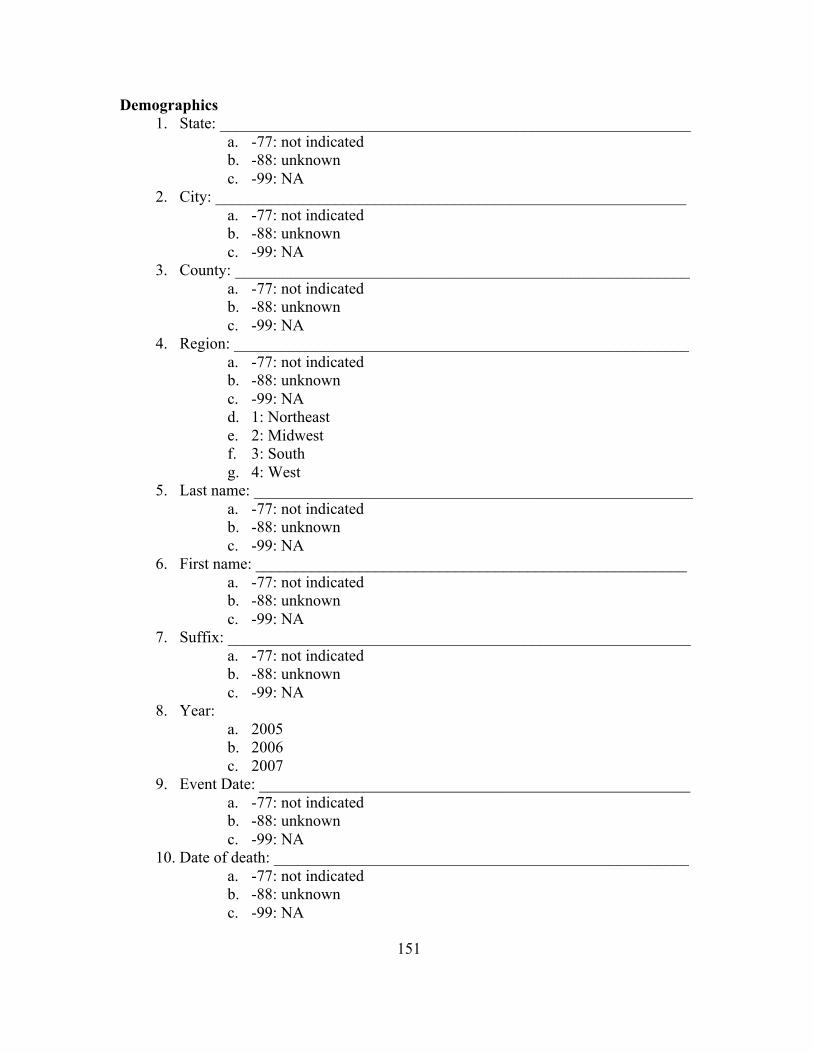
151
Demographics 1. State: ___________________________________________________________
a. -77: not indicated b. -88: unknown c. -99: NA
2. City: ___________________________________________________________ a. -77: not indicated b. -88: unknown c. -99: NA
3. County: _________________________________________________________ a. -77: not indicated b. -88: unknown c. -99: NA
4. Region: _________________________________________________________ a. -77: not indicated b. -88: unknown c. -99: NA d. 1: Northeast e. 2: Midwest f. 3: South g. 4: West
5. Last name: _______________________________________________________ a. -77: not indicated b. -88: unknown c. -99: NA
6. First name: ______________________________________________________ a. -77: not indicated b. -88: unknown c. -99: NA
7. Suffix: __________________________________________________________ a. -77: not indicated b. -88: unknown c. -99: NA
8. Year: a. 2005 b. 2006 c. 2007
9. Event Date: ______________________________________________________ a. -77: not indicated b. -88: unknown c. -99: NA
10. Date of death: ____________________________________________________ a. -77: not indicated b. -88: unknown c. -99: NA
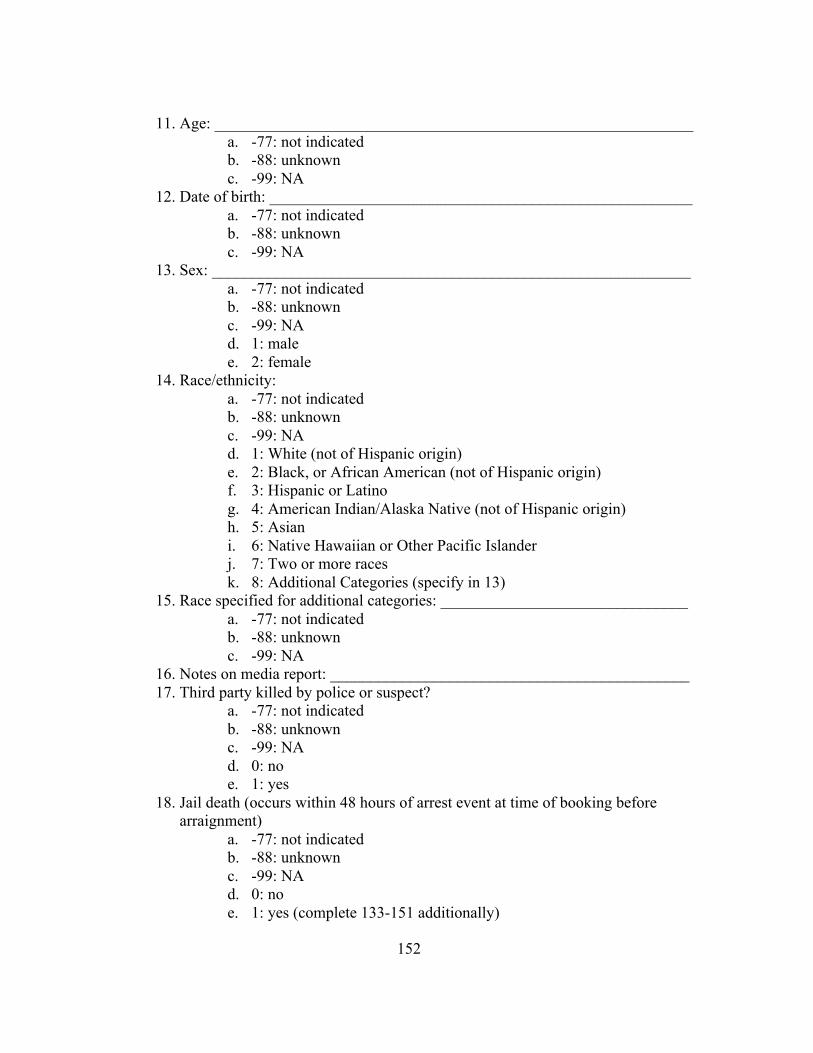
152
11. Age: ____________________________________________________________
a. -77: not indicated b. -88: unknown c. -99: NA
12. Date of birth: _____________________________________________________ a. -77: not indicated b. -88: unknown c. -99: NA
13. Sex: ____________________________________________________________ a. -77: not indicated b. -88: unknown c. -99: NA d. 1: male e. 2: female
14. Race/ethnicity: a. -77: not indicated b. -88: unknown c. -99: NA d. 1: White (not of Hispanic origin) e. 2: Black, or African American (not of Hispanic origin) f. 3: Hispanic or Latino g. 4: American Indian/Alaska Native (not of Hispanic origin) h. 5: Asian i. 6: Native Hawaiian or Other Pacific Islander j. 7: Two or more races k. 8: Additional Categories (specify in 13)
15. Race specified for additional categories: _______________________________ a. -77: not indicated b. -88: unknown c. -99: NA
16. Notes on media report: _____________________________________________ 17. Third party killed by police or suspect?
a. -77: not indicated b. -88: unknown c. -99: NA d. 0: no e. 1: yes
18. Jail death (occurs within 48 hours of arrest event at time of booking before arraignment)
a. -77: not indicated b. -88: unknown c. -99: NA d. 0: no e. 1: yes (complete 133-151 additionally)
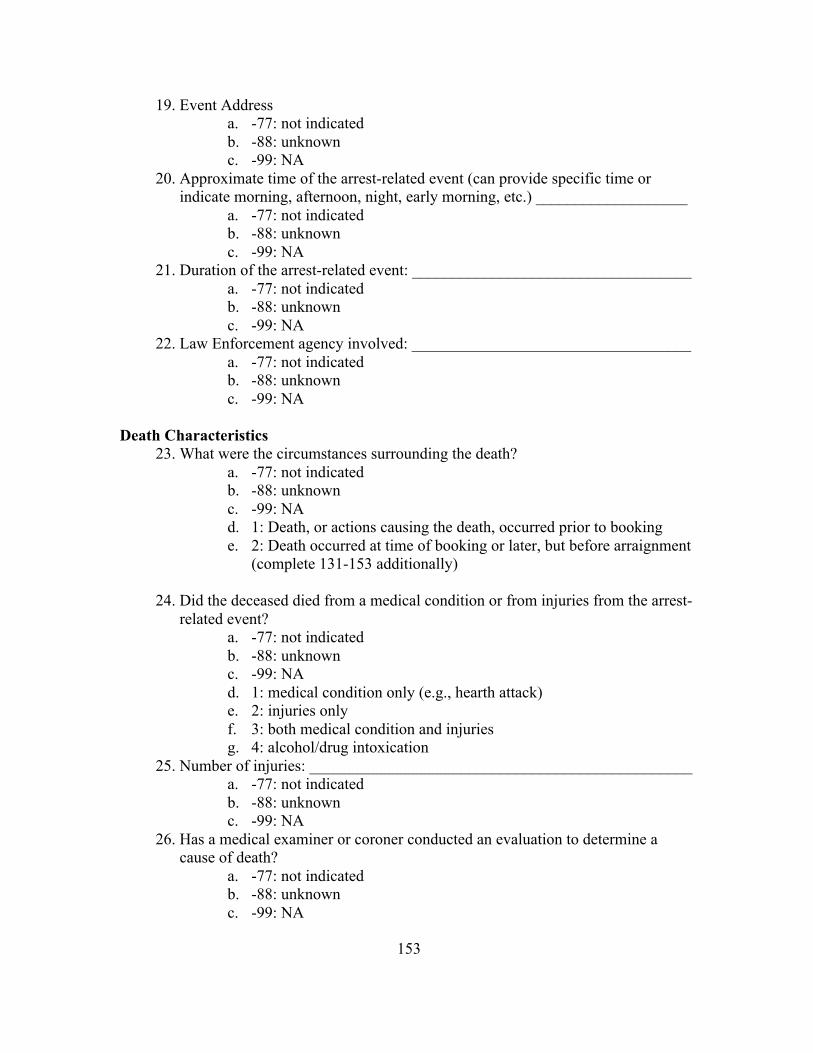
153
19. Event Address a. -77: not indicated b. -88: unknown c. -99: NA
20. Approximate time of the arrest-related event (can provide specific time or indicate morning, afternoon, night, early morning, etc.) ___________________
a. -77: not indicated b. -88: unknown c. -99: NA
21. Duration of the arrest-related event: ___________________________________ a. -77: not indicated b. -88: unknown c. -99: NA
22. Law Enforcement agency involved: ___________________________________ a. -77: not indicated b. -88: unknown c. -99: NA
Death Characteristics
23. What were the circumstances surrounding the death? a. -77: not indicated b. -88: unknown c. -99: NA d. 1: Death, or actions causing the death, occurred prior to booking e. 2: Death occurred at time of booking or later, but before arraignment
(complete 131-153 additionally)
24. Did the deceased died from a medical condition or from injuries from the arrest-related event?
a. -77: not indicated b. -88: unknown c. -99: NA d. 1: medical condition only (e.g., hearth attack) e. 2: injuries only f. 3: both medical condition and injuries g. 4: alcohol/drug intoxication
25. Number of injuries: ________________________________________________ a. -77: not indicated b. -88: unknown c. -99: NA
26. Has a medical examiner or coroner conducted an evaluation to determine a cause of death?
a. -77: not indicated b. -88: unknown c. -99: NA
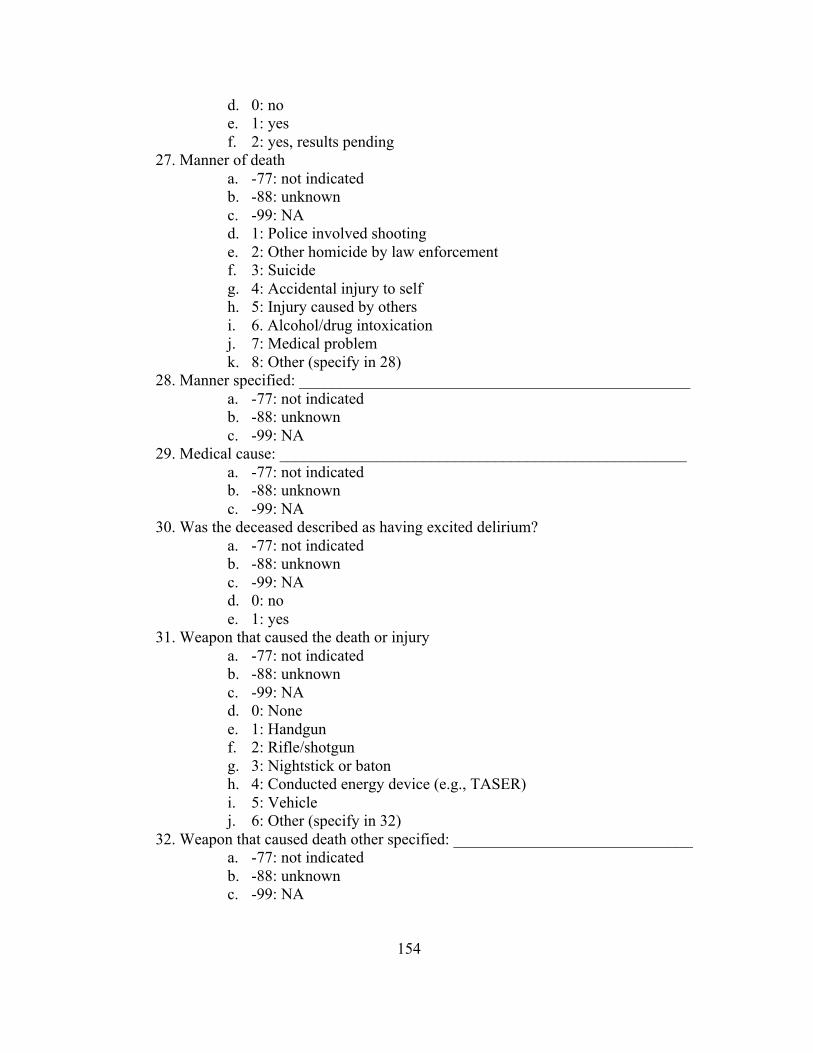
154
d. 0: no e. 1: yes f. 2: yes, results pending
27. Manner of death a. -77: not indicated b. -88: unknown c. -99: NA d. 1: Police involved shooting e. 2: Other homicide by law enforcement f. 3: Suicide g. 4: Accidental injury to self h. 5: Injury caused by others i. 6. Alcohol/drug intoxication j. 7: Medical problem k. 8: Other (specify in 28)
28. Manner specified: _________________________________________________ a. -77: not indicated b. -88: unknown c. -99: NA
29. Medical cause: ___________________________________________________ a. -77: not indicated b. -88: unknown c. -99: NA
30. Was the deceased described as having excited delirium? a. -77: not indicated b. -88: unknown c. -99: NA d. 0: no e. 1: yes
31. Weapon that caused the death or injury a. -77: not indicated b. -88: unknown c. -99: NA d. 0: None e. 1: Handgun f. 2: Rifle/shotgun g. 3: Nightstick or baton h. 4: Conducted energy device (e.g., TASER) i. 5: Vehicle j. 6: Other (specify in 32)
32. Weapon that caused death other specified: ______________________________ a. -77: not indicated b. -88: unknown c. -99: NA
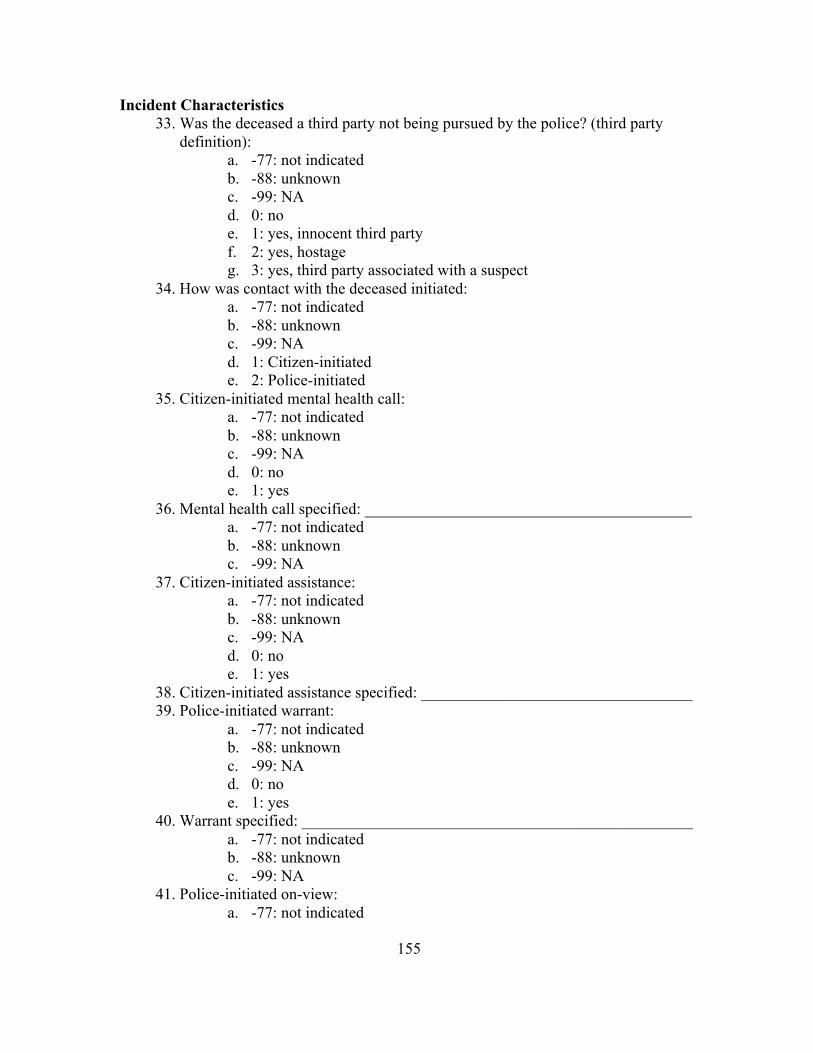
155
Incident Characteristics 33. Was the deceased a third party not being pursued by the police? (third party
definition): a. -77: not indicated b. -88: unknown c. -99: NA d. 0: no e. 1: yes, innocent third party f. 2: yes, hostage g. 3: yes, third party associated with a suspect
34. How was contact with the deceased initiated: a. -77: not indicated b. -88: unknown c. -99: NA d. 1: Citizen-initiated e. 2: Police-initiated
35. Citizen-initiated mental health call: a. -77: not indicated b. -88: unknown c. -99: NA d. 0: no e. 1: yes
36. Mental health call specified: _________________________________________ a. -77: not indicated b. -88: unknown c. -99: NA
37. Citizen-initiated assistance: a. -77: not indicated b. -88: unknown c. -99: NA d. 0: no e. 1: yes
38. Citizen-initiated assistance specified: __________________________________ 39. Police-initiated warrant:
a. -77: not indicated b. -88: unknown c. -99: NA d. 0: no e. 1: yes
40. Warrant specified: _________________________________________________ a. -77: not indicated b. -88: unknown c. -99: NA
41. Police-initiated on-view: a. -77: not indicated
156
b. -88: unknown c. -99: NA
42. On-view specified: ________________________________________________ a. -77: not indicated b. -88: unknown c. -99: NA
43. Police-initiated traffic stop: a. -77: not indicated b. -88: unknown c. -99: NA d. 0: no e. 1: yes
44. Traffic stop specified: ______________________________________________ a. -77: not indicated b. -88: unknown c. -99: NA
45. Police-initiated surveillance a. -77: not indicated b. -88: unknown c. -99: NA d. 0: no e. 1: yes
46. Surveillance specified: _____________________________________________ a. -77: not indicated b. -88: unknown c. -99: NA
47. Had charges been filed against the deceased at the time of death? a. -77: not indicated b. -88: unknown c. -99: NA d. 0: no e. 1: yes f. 2: no, but intended g. 3: no, probation/parole revocation
48. Charges specified _________________________________________________ a. -77: not indicated b. -88: unknown c. -99: NA
Deceased Behavior
49. Describe the actions and behavior of the deceased: _______________________
_____________________________________________________________________ a. -77: not indicated b. -88: unknown
157
c. -99: NA 50. Did the deceased engage in unlawful behavior?
a. -77: not indicated b. -88: unknown c. -99: NA d. 0: no e. 1: yes, but non-threatening to police or others f. 2: yes, physically aggressive to police or others g. 3: yes, weapon threat or attack on police or others
51. Did the deceased have a history of criminal behavior? a. -77: not indicated b. -88: unknown c. -99: NA d. 0: no e. 1: yes
52. Criminal history specified ___________________________________________ a. -77: not indicated b. -88: unknown c. -99: NA
53. Was the deceased with others? (exclude hostages) a. -77: not indicated b. -88: unknown c. -99: NA d. 0: no e. 1: yes
54. Describe who the deceased was with: __________________________________ a. -77: not indicated b. -88: unknown c. -99: NA
55. Was the deceased described as being mentally ill, emotionally disturbed, having a cognitive or developmental disability, or medical condition?
a. -77: not indicated b. -88: unknown c. -99: NA d. 0: no e. 1: yes, mental illness f. 2: yes, emotionally disturbed (e.g., despondent, agitated) g. 3: yes, cognitive or developmental disability h. 4: yes, medical condition (e.g., deaf, epileptic)
56. Mental or physical health specified: ___________________________________ a. -77: not indicated b. -88: unknown c. -99: NA
57. Was the deceased described as being suicidal? a. -77: not indicated
158
b. -88: unknown c. -99: NA d. 0: no e. 1: yes f. 2: yes, suicide by cop
58. Was the deceased described as having a history of drug abuse? a. -77: not indicated b. -88: unknown: c. -99: NA d. 0: no e. 1: yes
59. Was the deceased in possession of narcotics? a. -77: not indicated b. -88: unknown c. -99: NA d. 0: no e. 1: yes
60. Was the deceased described as being intoxicated? a. -77: not indicated b. -88: unknown c. -99: NA d. 0: no e. 1: yes
61. Was there a toxicology report? a. -77: not indicated b. -88: unknown c. -99: NA d. 0: no e. 1: yes f. 2: yes, pending
62. Did the toxicology report any drugs in the system of the deceased a. -77: not indicated b. -88: unknown c. -99: NA d. 0: no e. 1: yes
63. Was the deceased described as having alcohol in his or her system? a. -77: not indicated b. -88: unknown c. -99: NA d. 0: no e. 1: yes
64. Was the deceased described as having marijuana in his or her system? a. -77: not indicated b. -88: unknown
159
c. -99: NA d. 0: no e. 1: yes
65. Was the deceased described as having prescription drugs in his or her system? a. -77: not indicated b. -88: unknown c. -99: NA d. 0: no e. 1: yes
66. Was the deceased described as having cocaine in his or her system? a. -77: not indicated b. -88: unknown c. -99: NA d. 0: no e. 1: yes
67. Was the deceased described as having methamphetamine in his or her system? a. -77: not indicated b. -88: unknown c. -99: NA d. 0: no e. 1: yes
68. Was the deceased described as having phencyclidine in his or her system? a. -77: not indicated b. -88: unknown c. -99: NA d. 0: no e. 1: yes
69. Was the deceased described as having MDMA/ecstasy in his or her system? a. -77: not indicated b. -88: unknown c. -99: NA d. 0: no e. 1: yes
70. Was the deceased described as having LSD in his or her system? a. -77: not indicated b. -88: unknown c. -99: NA d. 0: no e. 1: yes
71. Did the deceased refuse orders from the police a. -77: not indicated b. -88: unknown c. -99: NA d. 0: no e. 1: yes
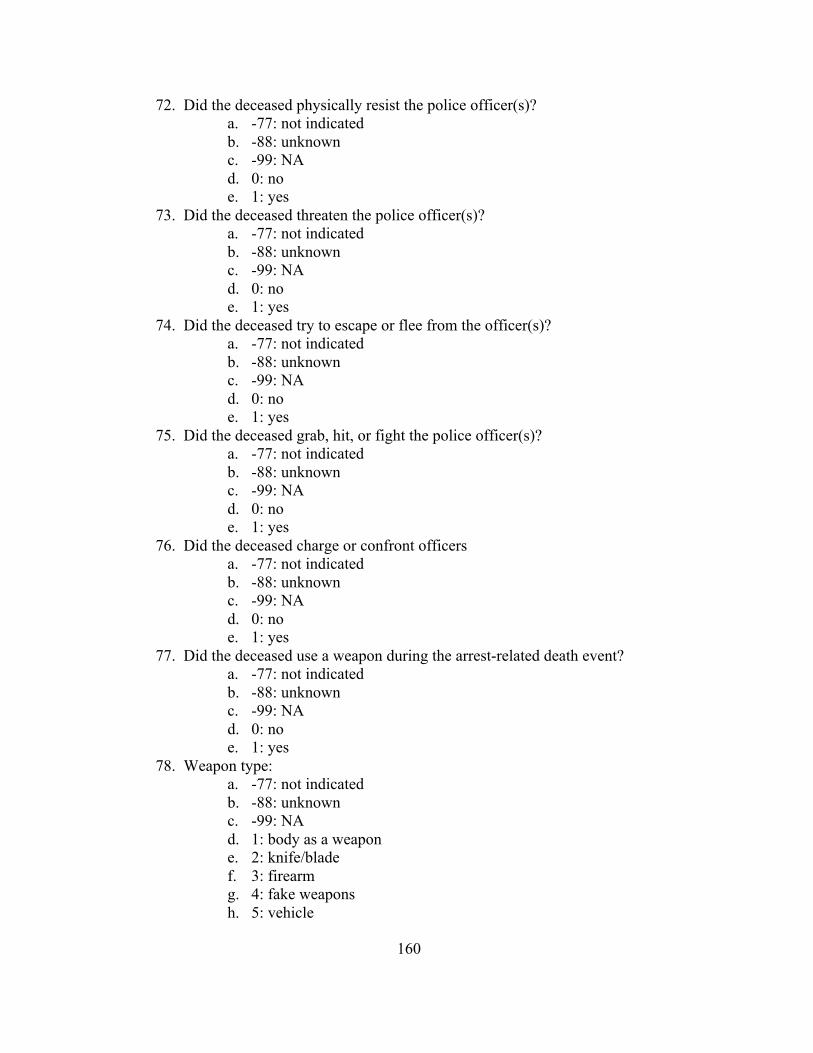
160
72. Did the deceased physically resist the police officer(s)? a. -77: not indicated b. -88: unknown c. -99: NA d. 0: no e. 1: yes
73. Did the deceased threaten the police officer(s)? a. -77: not indicated b. -88: unknown c. -99: NA d. 0: no e. 1: yes
74. Did the deceased try to escape or flee from the officer(s)? a. -77: not indicated b. -88: unknown c. -99: NA d. 0: no e. 1: yes
75. Did the deceased grab, hit, or fight the police officer(s)? a. -77: not indicated b. -88: unknown c. -99: NA d. 0: no e. 1: yes
76. Did the deceased charge or confront officers a. -77: not indicated b. -88: unknown c. -99: NA d. 0: no e. 1: yes
77. Did the deceased use a weapon during the arrest-related death event? a. -77: not indicated b. -88: unknown c. -99: NA d. 0: no e. 1: yes
78. Weapon type: a. -77: not indicated b. -88: unknown c. -99: NA d. 1: body as a weapon e. 2: knife/blade f. 3: firearm g. 4: fake weapons h. 5: vehicle
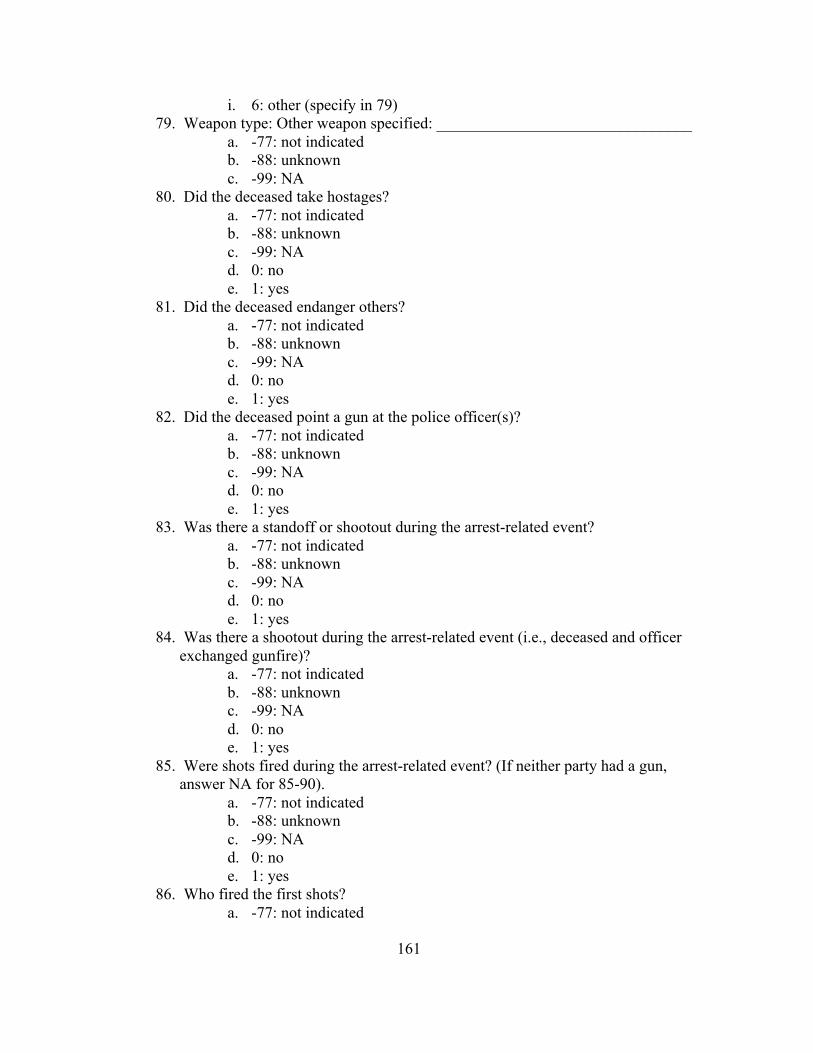
161
i. 6: other (specify in 79) 79. Weapon type: Other weapon specified: ________________________________
a. -77: not indicated b. -88: unknown c. -99: NA
80. Did the deceased take hostages? a. -77: not indicated b. -88: unknown c. -99: NA d. 0: no e. 1: yes
81. Did the deceased endanger others? a. -77: not indicated b. -88: unknown c. -99: NA d. 0: no e. 1: yes
82. Did the deceased point a gun at the police officer(s)? a. -77: not indicated b. -88: unknown c. -99: NA d. 0: no e. 1: yes
83. Was there a standoff or shootout during the arrest-related event? a. -77: not indicated b. -88: unknown c. -99: NA d. 0: no e. 1: yes
84. Was there a shootout during the arrest-related event (i.e., deceased and officer exchanged gunfire)?
a. -77: not indicated b. -88: unknown c. -99: NA d. 0: no e. 1: yes
85. Were shots fired during the arrest-related event? (If neither party had a gun, answer NA for 85-90).
a. -77: not indicated b. -88: unknown c. -99: NA d. 0: no e. 1: yes
86. Who fired the first shots? a. -77: not indicated
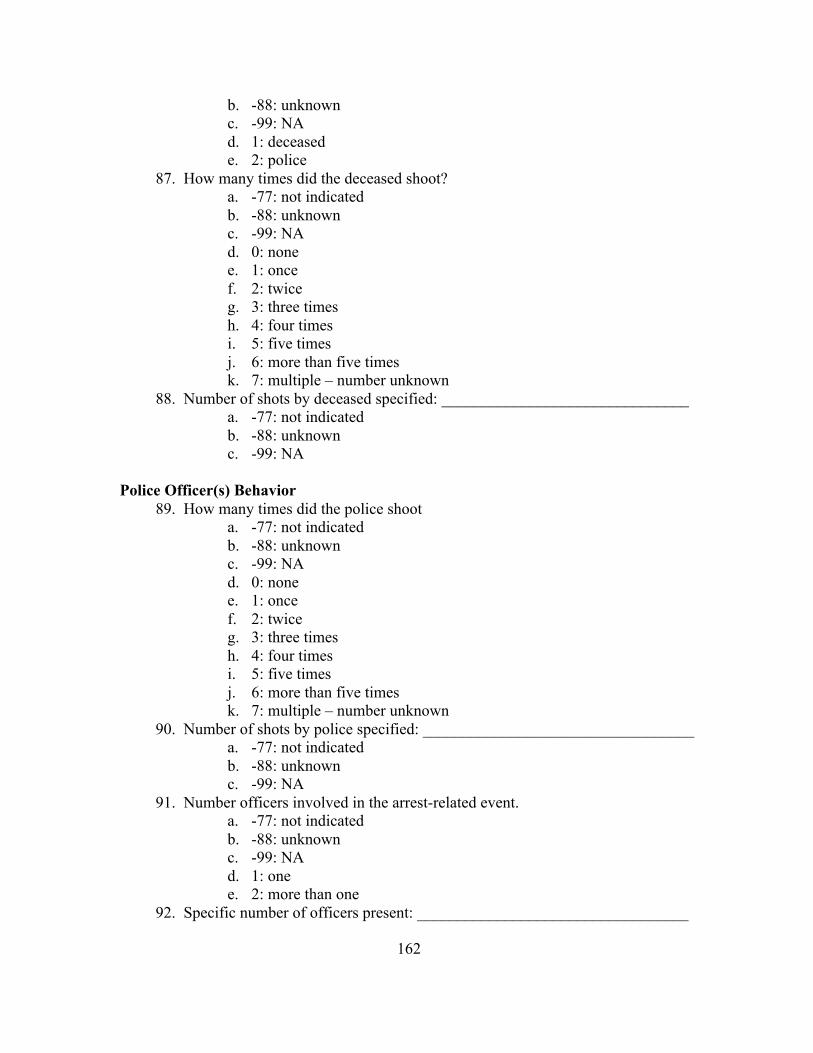
162
b. -88: unknown c. -99: NA d. 1: deceased e. 2: police
87. How many times did the deceased shoot? a. -77: not indicated b. -88: unknown c. -99: NA d. 0: none e. 1: once f. 2: twice g. 3: three times h. 4: four times i. 5: five times j. 6: more than five times k. 7: multiple – number unknown
88. Number of shots by deceased specified: _______________________________ a. -77: not indicated b. -88: unknown c. -99: NA
Police Officer(s) Behavior
89. How many times did the police shoot a. -77: not indicated b. -88: unknown c. -99: NA d. 0: none e. 1: once f. 2: twice g. 3: three times h. 4: four times i. 5: five times j. 6: more than five times k. 7: multiple – number unknown
90. Number of shots by police specified: __________________________________ a. -77: not indicated b. -88: unknown c. -99: NA
91. Number officers involved in the arrest-related event. a. -77: not indicated b. -88: unknown c. -99: NA d. 1: one e. 2: more than one
92. Specific number of officers present: __________________________________
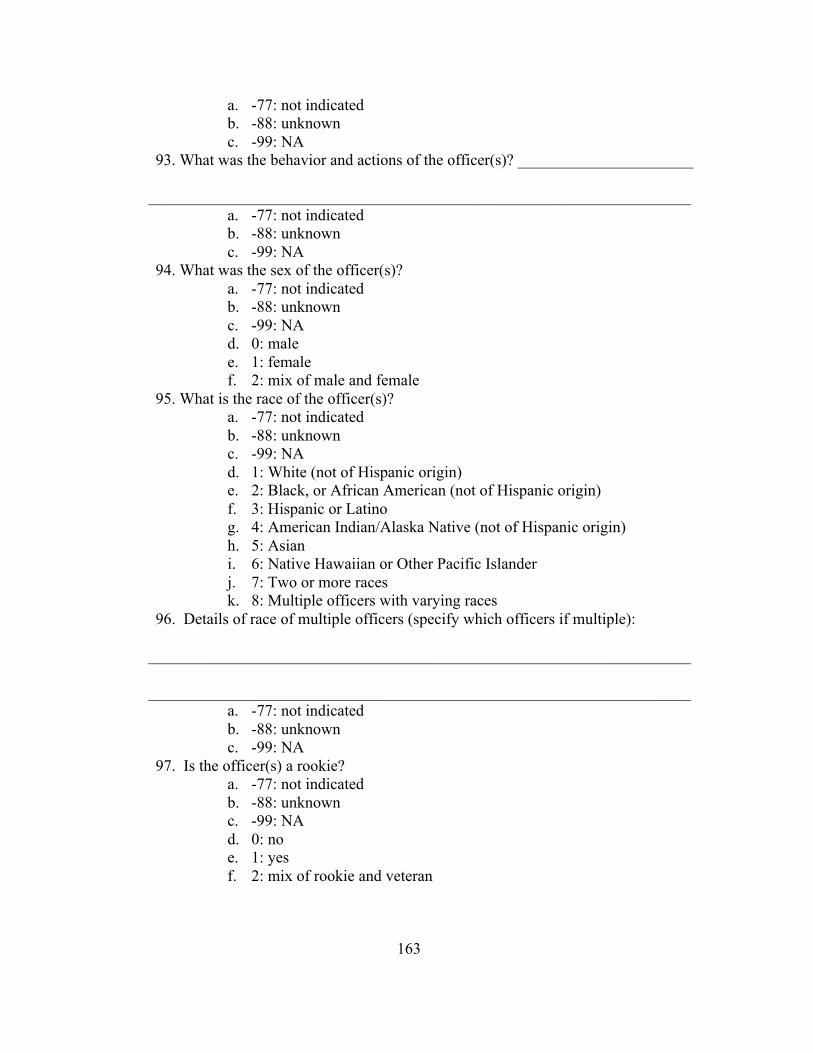
163
a. -77: not indicated b. -88: unknown c. -99: NA
93. What was the behavior and actions of the officer(s)? ______________________ ____________________________________________________________________
a. -77: not indicated b. -88: unknown c. -99: NA
94. What was the sex of the officer(s)? a. -77: not indicated b. -88: unknown c. -99: NA d. 0: male e. 1: female f. 2: mix of male and female
95. What is the race of the officer(s)? a. -77: not indicated b. -88: unknown c. -99: NA d. 1: White (not of Hispanic origin) e. 2: Black, or African American (not of Hispanic origin) f. 3: Hispanic or Latino g. 4: American Indian/Alaska Native (not of Hispanic origin) h. 5: Asian i. 6: Native Hawaiian or Other Pacific Islander j. 7: Two or more races k. 8: Multiple officers with varying races
96. Details of race of multiple officers (specify which officers if multiple): ____________________________________________________________________ ____________________________________________________________________
a. -77: not indicated b. -88: unknown c. -99: NA
97. Is the officer(s) a rookie? a. -77: not indicated b. -88: unknown c. -99: NA d. 0: no e. 1: yes f. 2: mix of rookie and veteran
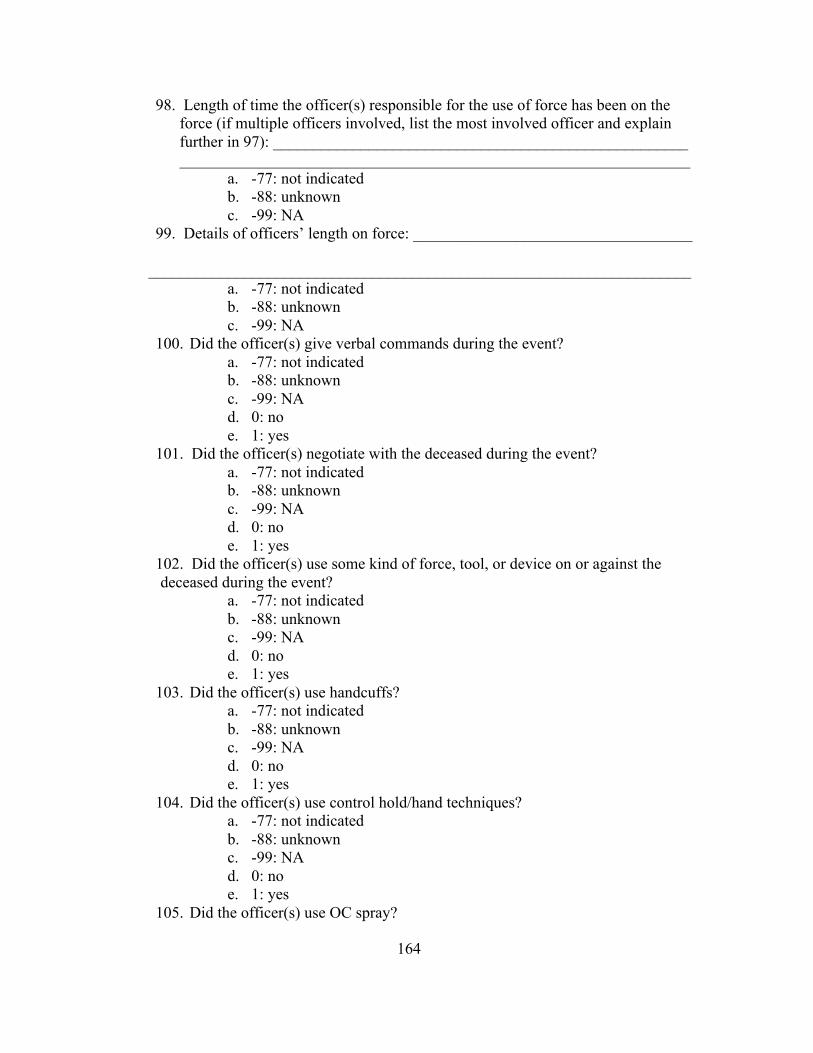
164
98. Length of time the officer(s) responsible for the use of force has been on the force (if multiple officers involved, list the most involved officer and explain further in 97): ____________________________________________________ ________________________________________________________________
a. -77: not indicated b. -88: unknown c. -99: NA
99. Details of officers’ length on force: ___________________________________ ____________________________________________________________________
a. -77: not indicated b. -88: unknown c. -99: NA
100. Did the officer(s) give verbal commands during the event? a. -77: not indicated b. -88: unknown c. -99: NA d. 0: no e. 1: yes
101. Did the officer(s) negotiate with the deceased during the event? a. -77: not indicated b. -88: unknown c. -99: NA d. 0: no e. 1: yes
102. Did the officer(s) use some kind of force, tool, or device on or against the deceased during the event?
a. -77: not indicated b. -88: unknown c. -99: NA d. 0: no e. 1: yes
103. Did the officer(s) use handcuffs? a. -77: not indicated b. -88: unknown c. -99: NA d. 0: no e. 1: yes
104. Did the officer(s) use control hold/hand techniques? a. -77: not indicated b. -88: unknown c. -99: NA d. 0: no e. 1: yes
105. Did the officer(s) use OC spray?
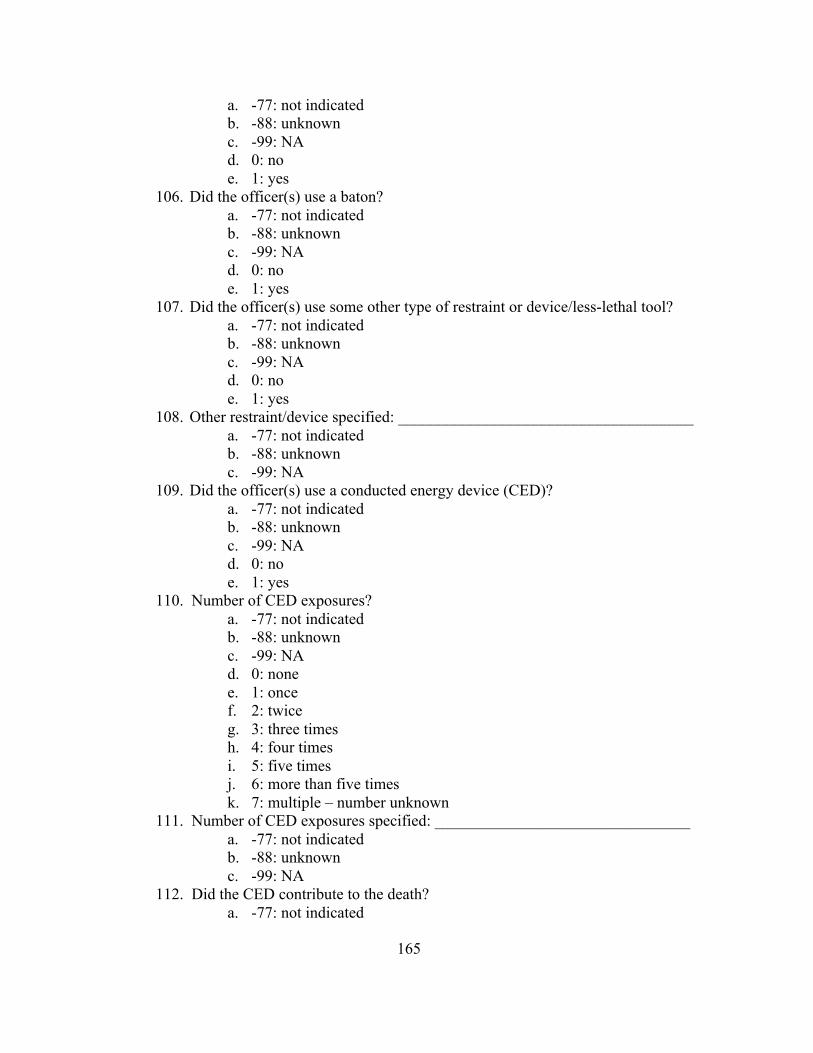
165
a. -77: not indicated b. -88: unknown c. -99: NA d. 0: no e. 1: yes
106. Did the officer(s) use a baton? a. -77: not indicated b. -88: unknown c. -99: NA d. 0: no e. 1: yes
107. Did the officer(s) use some other type of restraint or device/less-lethal tool? a. -77: not indicated b. -88: unknown c. -99: NA d. 0: no e. 1: yes
108. Other restraint/device specified: _____________________________________ a. -77: not indicated b. -88: unknown c. -99: NA
109. Did the officer(s) use a conducted energy device (CED)? a. -77: not indicated b. -88: unknown c. -99: NA d. 0: no e. 1: yes
110. Number of CED exposures? a. -77: not indicated b. -88: unknown c. -99: NA d. 0: none e. 1: once f. 2: twice g. 3: three times h. 4: four times i. 5: five times j. 6: more than five times k. 7: multiple – number unknown
111. Number of CED exposures specified: ________________________________ a. -77: not indicated b. -88: unknown c. -99: NA
112. Did the CED contribute to the death? a. -77: not indicated
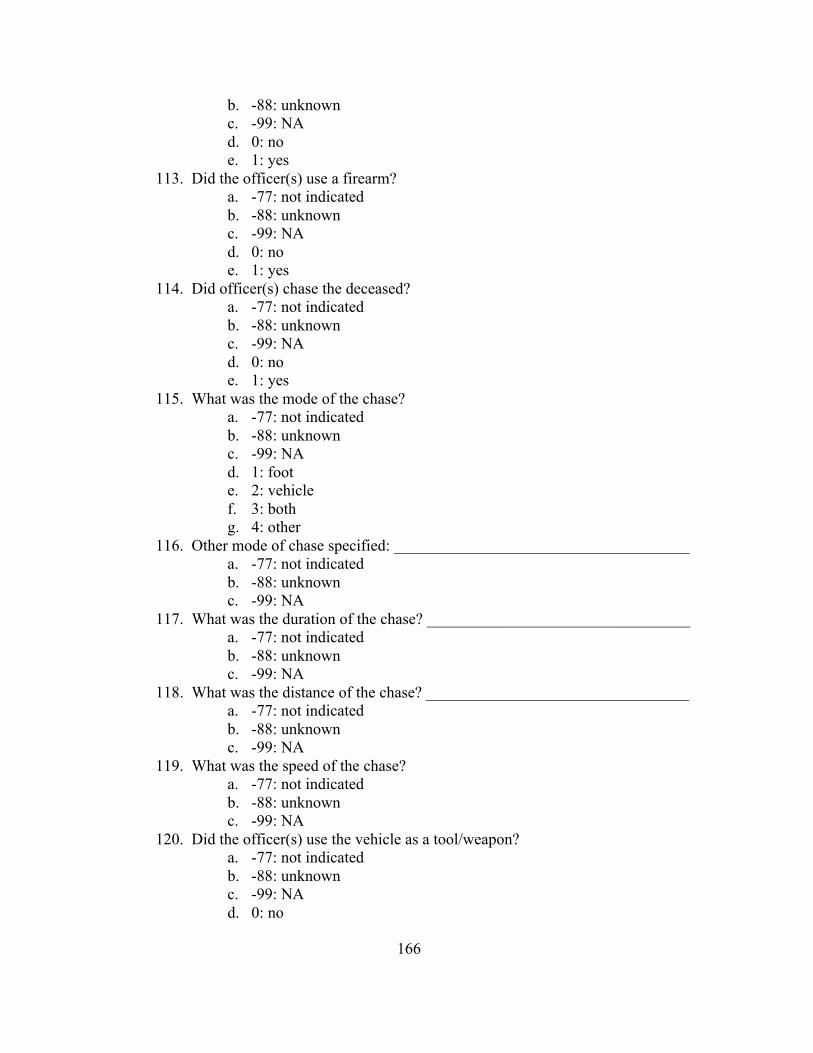
166
b. -88: unknown c. -99: NA d. 0: no e. 1: yes
113. Did the officer(s) use a firearm? a. -77: not indicated b. -88: unknown c. -99: NA d. 0: no e. 1: yes
114. Did officer(s) chase the deceased? a. -77: not indicated b. -88: unknown c. -99: NA d. 0: no e. 1: yes
115. What was the mode of the chase? a. -77: not indicated b. -88: unknown c. -99: NA d. 1: foot e. 2: vehicle f. 3: both g. 4: other
116. Other mode of chase specified: _____________________________________ a. -77: not indicated b. -88: unknown c. -99: NA
117. What was the duration of the chase? _________________________________ a. -77: not indicated b. -88: unknown c. -99: NA
118. What was the distance of the chase? _________________________________ a. -77: not indicated b. -88: unknown c. -99: NA
119. What was the speed of the chase? a. -77: not indicated b. -88: unknown c. -99: NA
120. Did the officer(s) use the vehicle as a tool/weapon? a. -77: not indicated b. -88: unknown c. -99: NA d. 0: no
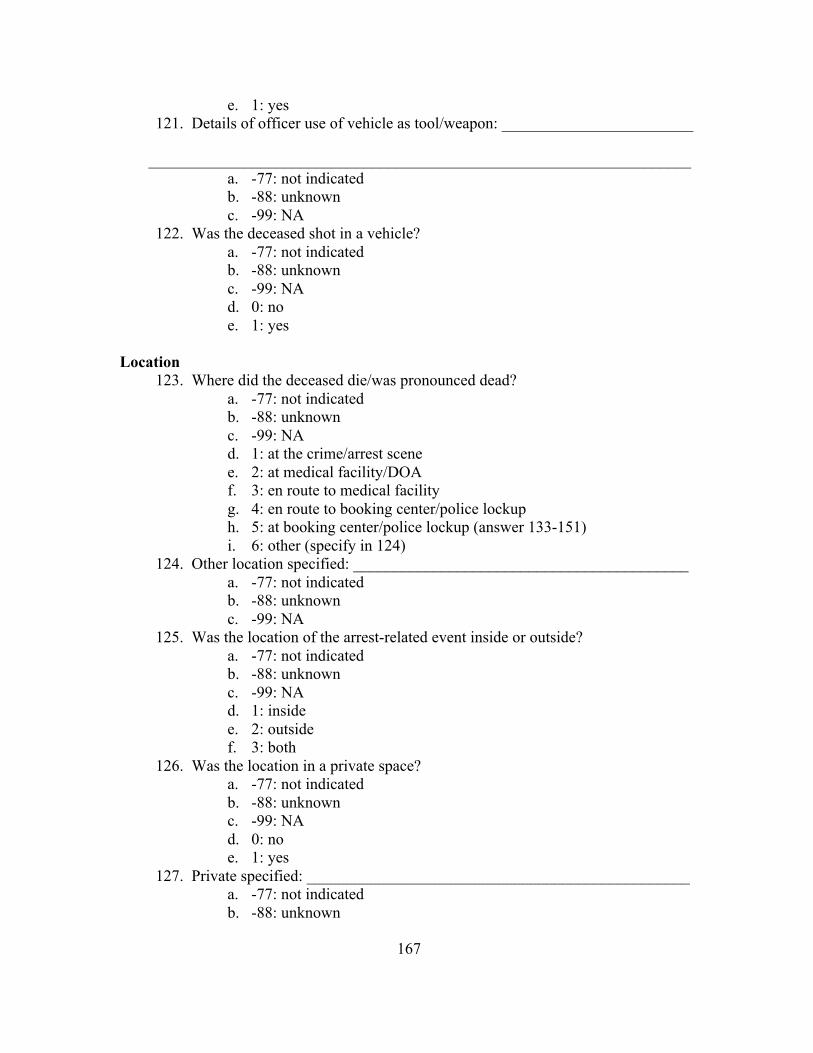
167
e. 1: yes 121. Details of officer use of vehicle as tool/weapon: ________________________
____________________________________________________________________
a. -77: not indicated b. -88: unknown c. -99: NA
122. Was the deceased shot in a vehicle? a. -77: not indicated b. -88: unknown c. -99: NA d. 0: no e. 1: yes
Location
123. Where did the deceased die/was pronounced dead? a. -77: not indicated b. -88: unknown c. -99: NA d. 1: at the crime/arrest scene e. 2: at medical facility/DOA f. 3: en route to medical facility g. 4: en route to booking center/police lockup h. 5: at booking center/police lockup (answer 133-151) i. 6: other (specify in 124)
124. Other location specified: __________________________________________ a. -77: not indicated b. -88: unknown c. -99: NA
125. Was the location of the arrest-related event inside or outside? a. -77: not indicated b. -88: unknown c. -99: NA d. 1: inside e. 2: outside f. 3: both
126. Was the location in a private space? a. -77: not indicated b. -88: unknown c. -99: NA d. 0: no e. 1: yes
127. Private specified: ________________________________________________ a. -77: not indicated b. -88: unknown
168
c. -99: NA 128. Was the location in a public space:
a. -77: not indicated b. -88: unknown c. -99: NA d. 0: no e. 1: yes
129. Public space specified: ____________________________________________ a. -77: not indicated b. -88: unknown c. -99: NA
130. Was the location of the arrest-related event at a business: a. -77: not indicated b. -88: unknown c. -99: NA d. 0: no e. 1: yes
131. Business specified: _______________________________________________ a. -77: not indicated b. -88: unknown c. -99: NA
132. Did the death occur more than 48 hours after arrest? a. -77: not indicated b. -88: unknown c. -99: NA d. 0: no e. 1: yes
Jail Death (only answer if death occurred or stemmed from actions in booking facility)
133. Date of entry into booking center or police lockup: _____________________ a. -77: not indicated b. -88: unknown c. -99: NA
134. Time of entry into booking center or police lockup: _____________________ a. -77: not indicated b. -88: unknown c. -99: NA
135. At the time of entry, was the deceased described as being intoxicated? a. -77: not indicated b. -88: unknown c. -99: NA d. 0: no e. 1: yes
169
136. At the time of entry, was the deceased described as exhibiting any mental health problems?
a. -77: not indicated b. -88: unknown c. -99: NA d. 0: no e. 1: yes
137. At the time of entry, was the deceased described as exhibiting medical problems?
a. -77: not indicated b. -88: unknown c. -99: NA d. 0: no e. 1: yes
138. At the time of entry, was the deceased described as struggling with the officer(s) or becoming combative?
a. -77: not indicated b. -88: unknown c. -99: NA d. 0: no e. 1: yes
139. While at the booking center or police lockup, did the officer(s) use a tool or device on or against the deceased?
a. -77: not indicated b. -88: unknown c. -99: NA d. 0: no e. 1: yes
140. While at the booking center or police lockup, did the officer(s) use control hold/hand techniques?
a. -77: not indicated b. -88: unknown c. -99: NA d. 0: no e. 1: yes
141. While at the booking center or police lockup, did the officer(s) use handcuffs? a. -77: not indicated b. -88: unknown c. -99: NA d. 0: no e. 1: yes
142. While at the booking center or police lockup, did the officer(s) use OC spray? a. -77: not indicated b. -88: unknown c. -99: NA
170
d. 0: no e. 1: yes
143. While at the booking center or police lockup, did the officer(s) use a baton? a. -77: not indicated b. -88: unknown c. -99: NA d. 0: no e. 1: yes
144. While at the booking center or police lockup, did the officer(s) use some other type of restraint or device/less-lethal tool?
a. -77: not indicated b. -88: unknown c. -99: NA d. 0: no e. 1: yes
145. Other restraint/device specified: ____________________________________ a. -77: not indicated b. -88: unknown c. -99: NA
146. While at the booking center or police lockup, did the officer(s) use a conducted energy device (CED)?
a. -77: not indicated b. -88: unknown c. -99: NA d. 0: no e. 1: yes
147. Number of CED exposures? a. -77: not indicated b. -88: unknown c. -99: NA d. 0: none e. 1: once f. 2: twice g. 3: three times h. 4: four times i. 5: five times j. 6: more than five times k. 7: multiple – number unknown
148. Number of CED exposures specified: ________________________________ a. -77: not indicated b. -88: unknown c. -99: NA
149. Did the CED contribute to the death? a. -77: not indicated b. -88: unknown
171
c. -99: NA d. 0: no e. 1: yes
150. While at the booking center or police lockup, did the officer(s) use a firearm? a. -77: not indicated b. -88: unknown c. -99: NA d. 0: no e. 1: yes
151. What were the behavior and actions of the deceased and/or officer(s) at the jail?
a. -77: not indicated b. -88: unknown c. -99: NA
Researcher name: _______________________
Date: _________________________________