Embed Size (px)
Citation preview

2 Economic Perspectives
The price of bank mergers in the 1990s
Elijah Brewer III, William E. Jackson III,Julapa A. Jagtiani, and Thong Nguyen
Elijah Brewer III is a senior economist and economicadviser in the Research Department at the FederalReserve Bank of Chicago. William E. Jackson III is anassociate professor of finance and economics at theKenan�Flagler Business School of the University of NorthCarolina, Chapel Hill. Julapa A. Jagtiani is a seniorfinancial economist in the Supervision and RegulationDepartment at the Federal Reserve Bank of Chicago.Thong Nguyen is a Ph.D. student in the Department ofEconomics at Yale University. The research assistance ofGene Amromin, Sumeet Sawhrey, Susan Yuska, OscarCerda, Betsy Dale, and Erin Davis is greatly appreciated.
Introduction and summary
The last decade has witnessed an unprecedented paceof bank mergers and acquisitions. Between 1990 and1998, the number averaged about 510 per year com-pared with 345 per year over the 1980�89 period. Asa result of this activity, the number of banks operatingin the U.S. has declined about 30 percent since 1990.In this article, we examine the primary motivationsfor this massive wave of bank mergers during the1990s by analyzing the market prices of these mergers.A better understanding of the factors that determinemarket prices for bank mergers will shed some lighton the implications of continuing mergers and acqui-sitions in the banking industry. We recognize thatrapidly changing supply and demand conditions arefundamental to understanding what drives bankmerger markets. For example, bank mergers may bedriven by a desire to reduce overall risk by diversifyinginto new geographic or product markets. Additional-ly, bank mergers may be motivated by a strategicdecision to exploit economies of scale, or to cut over-head and eliminate duplication by closing branches,or to achieve synergies through economies of scope.Of course, bank mergers may also be an attempt bybanks to simply increase their market power or toquickly grow into superregional or money center banks.
To some extent, each of these motivations, andresultant strategies, became more feasible in the 1990swith the relaxing of state and federal restrictionson banks� activities. For example, the Riegle�NealInterstate Banking and Branching Efficiency Act of1994 allowed banks to branch interstate by consoli-dating existing out-of-state bank subsidiaries or byacquiring banks or individual branches throughmergers and acquisitions. Prior to the Riegle�NealAct, federal and state laws prevented banks fromexpanding across state lines (with some exceptions).1
The Riegle�Neal Act allowed bank holding companies
to acquire banks in any state, effective September29, 1995, and allowed mergers between banks lo-cated in different states beginning June 1, 1997.2
On November 12, 1999, President Clintonsigned the Financial Services Modernization Act(Gramm�Leach�Bliley Act of 1999), allowingbanks to merge with securities firms and insurancecompanies within financial holding companies.This will further expand the merger opportunitiesfor banking organizations and may lead to a newwave of consolidation in banking and other sectorsof the financial services industry.
Another potential regulatory effect on bankmerger trends is the Federal Deposit InsuranceCorporation Improvement Act (FDICIA) of 1991.FDICIA introduced mandatory procedures calledprompt corrective actions (PCA), which requireregulators to promptly close depository institutionswhen their capital falls below predeterminedquantitative standards, thus eliminating the possi-bility of regulators providing special considerationto large banks because of the possible systemicimpact of large bank failure. Therefore, the notionof �too-big-to-fail� should be less relevant sinceFDICIA. However, an increase of megamergershas been noticeable in the mid- to late-1990s.

3Federal Reserve Bank of Chicago
Some research suggests that too-big-to-fail may havebeen one of the reasons for the rise in megamergersin the 1990s (see Kane, 1998). This is an importantpolicy issue because previous research raises the pos-sibility that banking organizations seek to becomelarger to increase the probability that the FDIC willcover 100 percent of their deposits. While most ofthe mergers between large publicly traded banks inthe early and mid-1980s were not due to attempts toexploit deposit insurance, the too-big-to-fail consid-eration may have been important in megamergers ofthe 1990s (Benston, Hunter, and Wall, 1995; Hunterand Wall, 1989; and Boyd and Graham, 1991).3 Inthis article, we examine the distinguishing character-istics of these megamergers.
Obviously, merger prices play an important rolein the rise in bank mergers in the last decade. Weanalyze two types of prices commonly employed byboth regulators and analysts: the merger bid premiumsoffered for a target bank, defined as the ratio of themarket price offered for the target to the book valueof equity of the target bank, and the excess stockreturns earned by shareholders of the target bankaround the merger announcement date.
We examine whether prices offered to target bankshave been increasing over time. Increased prices wouldtend to make bank owners more willing to sell. Thereare theoretical reasons why prices must either increaseor decrease as restrictions on expansion are reduced(Adkisson and Fraser, 1990). First, prior to Riegle�Neal, the number of potential bidders for a given targetbank was limited by laws governing intrastate andinterstate acquisitions. The removal of these restric-tions should increase the demand for target banks asthe number of potential bidders increases, resulting inhigher acquisition prices. Thus, higher prices shouldbe observed in the post-Riegle�Neal environment.
Alternatively, acquisition prices could be lowerwhen restrictions are removed. Restrictions on geo-graphical expansion form a barrier to entry that pro-vides a bank with a protected niche and permits it toearn excess profits. These excess profits become partof the price in merger negotiations. Decreasing thebarriers to entry reduces the excess profits and therebylowers merger prices. By ensuring that they earnonly normal profits, lowering the barriers to entrymay increase substitutability among target banks, en-larging�from the acquirer�s perspective�the effectivesupply of alternatives. Under the barriers to entryhypothesis, lower prices should be observed in thepost-Riegle�Neal environment.
During the late 1970s and 1980s, individual statestook steps, as permitted by the Douglas Amendment
to the Bank Holding Company Act of 1956, to allowacquisition of banks in their states by bank holdingcompanies headquartered in other states. The BankHolding Company Act permitted multibank holdingcompanies to acquire bank subsidiaries only to theextent allowed by the laws of the state in which theproposed target bank resided. Many states allowedacquisition by holding companies headquartered inonly a limited number of states. Other states allowedentry from all states.
States in several regions developed formal com-pacts or treaties to allow entry from states in the re-gion. The states in the Southeast formed the mostcohesive unit, generally allowing entry from otherstates in the region and excluding entry from statesoutside the region (Savage, 1993). We use a South-east indicator to test whether target banks in theSoutheast received higher bid premiums than banksin other parts of the country.
In addition to examining how bank merger priceshave changed over the 1990s and whether targetbanks in the Southeast receive higher bid premiumsthan other banks, we determine how prices are corre-lated with the financial characteristics of target banksand their market structure. As with any investment,the target bank�s value to the acquiring bank shouldreflect its present discounted value of future net cashflows. At a minimum, the bid price should reflect thestand-alone value of the net assets of the target bankand the net cash flows from higher-valued depositinsurance as a result of the proposed merger.
Market structure, consisting of the number, sizedistribution, and market share of banks, influences thedegree of competition and, thus, determines a bank�sprofitability. An often used measure of the degree ofcompetition in banking markets is the Herfindahl-Hirschman Index (HHI), which is calculated by add-ing together the squares of the deposit shares of partic-ipants in a banking market and multiplying by 10,000.This index equals 10,000 for a monopoly market, andtakes on lower values as more banks enter the market.For example, if there are five firms in a market andtheir deposit shares are 20 percent each, the HHIwould be computed as follows: [(.2)2 + (.2)2 + (.2)2 +(.2)2 + (.2)2 ] × 10,000 = 2,000. Antitrust regulatorsuse this measure to screen bank merger applicationsfor potential anticompetitive effects.
In theory, target banks in markets with relativelyhigh HHIs and, thus, operating in less competitivemarkets tend to receive high bid offers. A factorcounterbalancing this tendency is the bank mergerreview process enforcing the U.S. Department ofJustice�s (DOJ) merger guidelines. This review

4 Economic Perspectives
process could result in divestitures of banking officesas a condition of approval. Thus, the price an acquireris willing to pay for a target bank should reflect theprobable reaction of the antitrust authorities. If themerger review process works well, participating ina merger does not give banks greater market power.One way to analyze the effectiveness of the processis to determine the effects of market concentration|on bid premiums. Bid premiums should be higherfor targets in more concentrated markets.
We find a variety of interesting and importantresults. We find that higher performing targets, asmeasured by both return on equity and return on assets,receive higher bids. We also find that the lower thecapital-to-deposit ratio, the larger the bid the acquir-ing bank is willing to offer. This may be because thetarget bank is funding its assets with relatively cheapfunds. Additionally, we find that larger targets� loan-to-assets ratios are correlated with larger bid premiums,although this effect is not statistically significant.Bank size is positively related to bid premiums. Marketconcentration is not significantly correlated with bidpremiums, reflecting the difficulties of applying ourmeasure of concentration to banking organizationswhose geographic scope and product mix may bebroader than the local market area.
Prior to Riegle�Neal, prices paid for target banksin the Southeast regional compact tended to be higherthan in other areas, perhaps reflecting the barrier toentry that provides the target in that region with aprotected niche and permits it to earn excess profits.After Riegle�Neal, the Southeast effect was not sig-nificant. Overall, however, the price for target bankstends to be larger during the post-Riegle�Neal period,possibly because of the increase in the actual or poten-tial number of bidders. Because Riegle�Neal providesincreased interstate branching and banking opportu-nities, the demand for targets should increase as theuniverse of bidders increases, resulting in higheracquisition prices. Thus, we observe higher pricesin the post-Riegle�Neal environment.
To get a better sense of how bank mergers arepriced, we use daily stock return data to examine thestock market reaction to news of an announced merger.Results of this test are especially useful to interpretthe wave of large bank mergers. If banks are usingtheir increased freedom to merge in a way intendedto increase the value of their deposit insurance, thenmegamergers should generate high bid premiumsand, thus, greater than expected stock market returnsthan other types of mergers. However, bank managersmay also pursue mergers to enhance their salary, per-quisites, and personal prestige. As a result, high bidpremiums for large banking organizations may be
related to several different motivations, many ofwhich will tend to lead to high merger prices.
A countervailing factor in large bank mergers,however, is the difficulty of merging two large bank-ing organization or two organizations of equal size.According to organization theorists, melding culturesin a merger is more difficult and costly when thetarget is closer in size to the acquirer. If the short-run costs are a positive function of size and thesecosts outweigh the value of increased access to de-posit insurance, then we would expect to see an in-verse relationship between size and merger prices(Benston, Hunter, and Wall, 1995). Our stock returnresults suggest that the stock market views large bankmergers more favorably than small bank mergers.The unexpected stock returns for large bank targetsare more than double those of small targets.
Our results suggest that changes in state and fed-eral banking regulations have a significant impact onbank merger activity in general, and bank mergerprices in particular. Furthermore, by restricting thetypes of merger transactions that can take place, stateand federal interstate and intrastate banking laws mayhave had unintended consequences. Because restric-tions on geographical expansion form a barrier toentry that provides a bank with a protected marketand permits it to earn excess profits, we observehigher bid premiums in Southeast compact states rel-ative to other parts of the country. Once these restric-tions were removed with the passage of Riegle�Nealin 1994, bid premiums were no longer higher in theSoutheast states than in other states. However, theyrose overall relative to the pre-Riegle�Neal period.Thus, our results show how federal and state regula-tory policies that restrict interstate branching andbanking may produce very different (and distorted)merger prices relative to policies that are less restric-tive and market driven.
Finally, our results provide empirical evidencethat when target banks are large, but not megamerg-ers of equals, there is a greater stock market reactionto the merger announcement than for other target banks.This is consistent with the notion that large banks areusing their increased freedom to merge in a way intend-ed to increase the value of their deposit insurance.A partial explanation for the recent wave of mergers,especially megamergers, may be the desire of merginginstitutions to obtain a size level sufficient to placethem in the too-big-to-fail category. This is an impor-tant issue for policymakers, who are concerned aboutcontrolling bank risk-taking propensities and minimiz-ing the loss exposure of the federal deposit insurancefunds. Thus, size is important in merger decisions

5Federal Reserve Bank of Chicago
FIGURE 1
Growth in commercial banks and bank mergers
number
Mergers(left scale)
number
Totalright scale)
Source: Authors’ calculations based on data from theFederal Deposit Insurance Corporation.
TABLE 1
Size distribution of commercial banks
Number Percent CumulativeAsset size ($ millions) of banks of banks percent Percent Cumulative
A. December 31, 1980Less than 25 7,233 49 49 5 425–50 3,566 24 73 6 1150–100 2,048 14 87 7 18100–500 1,496 10 97 15 33500–1,000 195 1 98 7 401,000–5,000 192 1 99 19 595,000–10,000 21 – 99 7 6610,000 or more 18 – 100 34 100
Total 14,769 100
B. December 31, 1998a
Less than 25 3,156 36 36 3 325–50 2,261 26 62 5 850–100 1,700 19 81 7 15100–500 1,279 15 96 14 29500–1,000 149 2 98 6 351,000–5,000 114 1 99 15 505,000–10,000 20 – 99 8 5810,000 or more 25 – 100 42 100
Total 8,704 100
aAdjusted for inflation using the Consumer Price Index (all items, 1982–84 = 100).Note: Numbers are rounded to the nearest whole number.Source: Authors’ calculations based on data from Quarterly Reports of Condition and Income.
Total assets
because larger institutions may have increasedaccess to deposit insurance. This greater ac-cess tends to be reflected in the stock marketreactions to merger announcements.
Regulatory background
Opportunity for nationwidebranch banking
Figure 1 shows that the number ofbanking organizations in the U.S. hasdecreased by about 40 percent since 1980.This decline is related to the surge in thenumber of bank mergers�225 per yearduring the early 1980s compared with 580per year during the late 1990s. The shareof domestic deposits held by the nation�sten largest commercial banks nearly dou-bled from about 19 percent in 1980 to 37percent in 1998 (DeYoung, 1999). Table 1provides further evidence of the consolida-tion trend in banking, which has occurred contempo-raneously with the reduction in restrictions oninterstate banking and branching.
As mentioned earlier, under Riegle�Neal, bankshave been permitted to engage in nationwide branchbanking since June 1, 1997. This liberalization made

6 Economic Perspectives
possible the merger of large banking organizations tocreate true nationwide banking in the U.S.
However, Riegle�Neal was only the final pieceof legislation in a long line of banking deregulationat the state level. Historically, restrictions on banks�ability to expand geographically have been among theprimary determinants of the structure of commercialbanking in the U.S (Frieder, 1988; and Cornett andDe, 1991a). Concerns about undue concentration ofbanking resources and that banks might exercise theirmarket power by setting high prices and restrictingservice led to the imposition of restrictions at boththe state and national levels. The McFadden Act of1927 restricted nationally chartered banks� branchingability to the same extent allowed to state-charteredbanks. The Bank Holding Company Act of 1956 pre-vented multibank holding companies (MBHCs) fromacquiring existing banks or chartering new banks instates other than their home state. The DouglasAmendment of the 1956 act allowed MBHCs to acquirebanks only to the extent permitted by the laws of thestate of the target bank. Even the Riegle�Neal Actlimits the market share that a banking organizationcan hold nationwide or in any given state. The actestablished a 10 percent nationwide deposit concentra-tion limit on organizations making interstate acquisi-tions and a uniform 30 percent statewide limit (unlessa state chooses a different limit).
The first state statutes permitting entry to out-of-state MBHCs in accordance with the Douglas Amend-ment were enacted in 1975 and 1982 by Maine andAlaska, respectively. By the late 1980s, 41 statesand the District of Columbia had passed similar laws(Amel, 1986; Frieder, 1988; and Cornett and De,1991a). Moreover, several states formed reciprocalregional banking pacts to allow banks in pact statesto acquire targets in other pact states. For example,prior to the Riegle�Neal Act, Wisconsin�s regionalreciprocal law allowed entry by acquisition forbanking organizations from Illinois, Iowa, Indiana,Kentucky, Michigan, Minnesota, Missouri, and Ohioas long as those states allowed acquisitions byWisconsin banks in their markets (Saunders, 1997).
Antitrust statutes and authoritiesThe federal statutes that govern bank mergers
are the Bank Holding Company Act, the Bank MergerAct of 1960, and section 7 of the Clayton Act of 1914.The DOJ has general enforcement authority over allmerger and acquisition activities and has establishedbasic guidelines to cover the evaluation of competitiveissues (Jackson, 1992; and Kwast, Starr-McCluer,and Wolken, 1997). Box 1 provides a discussion ofthe antitrust legal standards.
Under the Bank Merger Act the three federalregulatory agencies�the Board of Governors of theFederal Reserve System, the office of the Comptrol-ler of the Currency (OCC), and the Federal DepositInsurance Corporation (FDIC)�are required to takeinto account the competitive effects of a proposedmerger. The agency to which a merger applicationshould be submitted depends on the �resultant bank-ing organization.� If the resultant banking organizationis a nonmember federally insured bank, the applicationneeds to be made to the FDIC. If the resultant bankingorganization is a state member bank, the applicationneeds to be made to the appropriate Federal ReserveBank, and if it is a national bank, the merger applicationshould be made to the OCC. In addition to the powersprovided in the Bank Merger Act, the Federal ReserveSystem derives its legal authority over bank mergersfrom the Bank Holding Company Act, which prohib-its a bank holding company from acquiring a bankunless the bank holding company has received priorapproval from the Federal Reserve System. The DOJmay prevent consummation of the merger within 30days of the approval from the relevant federal agency.After this 30-day period, the merger is immune fromthe DOJ and other private party litigation.
Antitrust guidelinesThe regulators have adopted the DOJ�s numerical
criteria for assessing the impact of a merger or acquisi-tion on competition. These criteria, first issued in1968, were updated in June 1982 based on the HHI.In evaluating a merger application, antitrust authori-ties consider both the level of post-merger HHI andthe change in the HHI resulting from the proposedtransaction (see table 2).4 If the post-merger marketHHI is lower than 1,800 points, or the increase in theindex from the pre-merger situation is less than 200points (or 50 points in industries other than banking),5
the merger is presumed to have no anticompetitiveeffects and is generally approved by regulators. TheFederal Reserve uses the acquiring firm�s marketshare as an additional merger screen. A merger islikely to raise concerns if the acquirer�s pro formamarket share exceeds 35 percent.
When a merger application violates the guidelines,regulators consider mitigating factors that would off-set the anticompetitive effects of the proposed trans-action. These factors include competitive viability ofthe target, presence of active competition from thriftsand other financial institutions in the market, compe-tition from out-of-market financial institutions, andmarket attractiveness. These factors are weightedagainst the increase in concentration. If the increasein concentration is too large to be justified by mitigating

7Federal Reserve Bank of Chicago
BOX 1
Antitrust legal standards
The major antitrust concern of each of the fed-eral bank regulatory authorities is the competitiveeffect of mergers and acquisitions. An examinationof this issue requires a clear and concise definitionof the product and geographical markets in whichcompetition takes place and a standard to measurethe competitive effects of each merger (see Jackson,1992). This framework was not specifically statedin the federal statutes that govern mergers. Instead,it has evolved from three Supreme Court decisionsin the 1960s and 1970s: United States vs. PhiladelphiaNational Bank (1963), United States vs. PhillipsburgNational Bank and Trust (1970), and United Statesvs. Connecticut National Bank (1974).1
In the Philadelphia National Bank case, theSupreme Court:
■ provided the principles by which product andgeographic markets should be defined to assessthe probable competitive effects of a bank mergeror acquisition, and
■ noted that commercial banks are unique amongfinancial institutions (including thrifts) in thatthey alone are permitted by law to accept demanddeposits and operate with the benefit of federaldeposit insurance.
The court ruled that the relevant product marketwas the �cluster of commercial banking servicesdifferentiating commercial banking as a unique lineof business.� Thus, only competing commercialbanks were included in the framework for the pur-poses of analyzing a proposed bank merger underthe Clayton Act. The exact definition of cluster wasnot specifically stated in the court�s decision. How-ever, antitrust regulators have used total deposits asa proxy for the ability of commercial banking orga-nizations to provide the cluster of banking servicesto both businesses and households in a given localbanking market (Rhoades, 1987).
In the Philadelphia National Bank case, thecourt noted that the appropriate geographical marketfor competitive analysis does not depend on wherethe parties to a merger do business or compete.Instead, it depends on the geographical structureof the supplier�customer relationships and where apurchaser of products and services can practicablyturn for alternative banking services. The courtfound that convenience of location is essential toeffective competition, suggesting that geographicalmarkets for commercial banking are generally con-sidered to be local, for example, within counties ormetropolitan statistical areas (Holder, 1993).
In the Phillipsburg National Bank and Trustcase (1970), the Supreme Court held that:
■ for the purposes of analyzing a proposed mergerunder the Clayton Act, regulators should con-sider both the level of concentration and thechange in concentration of firms in the appro-priate geographical market, and
■ a merger application may be accepted if it canbe shown that the transaction provides substan-tial public benefits even though it may violateantitrust guidelines.
The structure�conduct�performance paradigmsuggests that market concentration beyond a certainpoint will likely lead to collusive or monopolisticbehavior by banks, a direct violation of the ClaytonAct. Banking regulators have thus focused on theanticompetitive issues of bank mergers and acqui-sitions in terms of the resultant effects on marketconcentration (Rhoades, 1987).
In the Connecticut National Bank case, theSupreme Court:
■ revisited the geographical market definitionand ruled that the relevant banking market isnot a state but rather a segmented group of bankoffice areas where a bank would seek businessand, as a practical matter, most of its customerswould do their banking, and
■ concluded that thrift institutions should not befactored into antitrust analysis, but acknowl-edged that they may be included �when and ifsaving banks become significant participantsin the marketing of bank services to commercialenterprises.�
These three court decisions provide the funda-mental concepts for analyzing competitive effectsof bank mergers and acquisitions. In particular, theyhold that 1) the �cluster� of bank products is therelevant product line for competitive analysis; 2)this cluster is typically viewed as being consumedin geographically local banking markets; and 3)market structure is a key determinant of the degreeof competition (Kwast, Starr-McCluer, and Wolken,1997; and Jackson, 1992).
1United States vs. Connecticut National Bank, 418 U.S. 656(1974); United States vs. Phillipsburg National Bank andTrust Company, 399 U.S. 350 (1970), and United States vs.Philadelphia National Bank, 374 U.S. 321 (1963).

8 Economic Perspectives
TABLE 2
1982 Department of Justice horizontal merger guidelines
Post-merger Post-merger change in HHImarket concentration Level of HHI and likelihood of challenge
Highly concentrated Greater than 1,800 Greater than 100—Challenge likely
50 to 100—Depends on other factorsa
Less than 50—Challenge unlikely
Moderately concentrated 1,000 to 1,800 Greater than 100—Challenge likely;other factors considereda
Less than or equal to 100—Challenge unlikely
Unconcentrated Less than 1,000 Any increase—Challenge unlikely
aLead firm provision—A merger is likely to be challenged if the merger is between the lead firm and a firmwith a market share of 1 percent or more provided that the lead firm has a market share of 35 percent or moreand is approximately twice the size of the second largest firm in the market. These so-called other factors are oftenrelated to ease and profitability of collusion. In banking, they are often referred to as mitigating factors and includecompetitive viability of the target, presence of active competition from thrifts and other financial institutions in themarket, competition from out-of-market financial institutions, and market attractiveness.Note: When released on June 14, 1982, the guidelines in this table applied to all U.S. industries. In 1985, theU.S. Department of Justice modified the 1,800/50 rule for bank mergers to 1,800/200 to recognize the impactof competition from limited purpose lenders and other nondepository financial institutions.Source: U.S. Department of Justice, 1982, press release, June 14.
factors, divestiture of some branches and offices maybring the concentration indicator close to or belowthe DOJ guidelines. Consequently, very few bankmergers are denied due to antitrust concerns. However,the official statistics do not include applications thatare voluntarily withdrawn when consultation withregulatory agencies indicates they would be found tobe anticompetitive.
Effects of geographical deregulation on bankacquisition prices
The literature suggests two competing hypothesesto explain how geographic deregulation might affectthe prices paid for bank acquisitions (Adkisson andFraser, 1990). Under the excess demand theory, pricesof acquisitions should increase as restrictions on expan-sion are reduced. Prior to Riegle�Neal, the number ofpotential bidders for a target bank was limited by statelaw governing intrastate and interstate acquisitions.
As noted above, during the late 1970 and 1980s,some states formed regional banking pacts to allowbanks to merge with or acquire targets in pact states(see details in table 3). Other states allowed nationwideentry with reciprocal arrangements. As these restric-tions are removed, the demand for targets should in-crease as the universe of bidders increases, resultingin higher acquisition prices. Thus, all else beingequal, higher prices should be observed as states lib-eralize their interstate banking laws and in the post-Riegle�Neal environment.
Conversely, the barrier to entry theory predicts thatmerger prices will be lower when bank acquisition lawsare more liberal. Geographical expansion restrictionsform a barrier to entry that provides the target with aprotected niche and permits it to earn excess profits.Decreasing the barriers to entry reduces the excessprofits and thereby lowers merger prices. By ensur-ing that they earn only normal profits, lowering thebarriers to entry may increase substitutability amongtarget banks, enlarging (from the acquirer�s perspec-tive) the effective supply of alternatives. Thus, lowerprices should be observed in regional compact statesand in the post-Riegle�Neal environment.
There are at least two approaches to calculatingthe price offered by acquirers for targets. One approachmeasures the size of the merger premium (or bid pre-mium). More attractive targets receive higher bidpremiums. The second approach uses stock returndata and is usually called the event study approach.Under this approach, excess returns (or abnormalreturns) are computed around the merger announce-ment date (see box 2).
Literature review and our contribution
Previous studies on mergers and acquisitions ofnonfinancial firms have produced mixed results aboutthe determinants of merger premiums. It is even morecomplicated to identify the determinants of these pre-miums in the banking industry due to the high level ofgovernmental regulations and monitoring. In addition

9Federal Reserve Bank of Chicago
TABLE 3
Interstate banking laws prior to Riegle�Neal Act
State Area covered and reciprocity
Alabama Reciprocal, 13 states (AR, FL, GA, KY, LA, MD, MS, NC, SC, TN, TX, VA, WV)Alaska National, no reciprocityArizona National, no reciprocityArkansas Reciprocal, 16 states (AL, FL, GA, KY, LA, MD, MO, MS, NC, NE, OK, SC, TN, TX, VA, WV)
and DCCalifornia National, reciprocalColorado National, no reciprocityConnecticut National, reciprocalDelaware National, reciprocalDistrict of Columbia Reciprocal, 11 states (AL, FL, GA, LA, MD, MS, NC, SC, TN, VA, WV)Florida Reciprocal, 11 states (AL, AR, GA, LA, MD, MS, NC, SC, TN, VA, WV) and DCGeorgia Reciprocal, 11 states (AL, FL, KY, LA, MD, MS, NC, SC, TN, VA, WV) and DCIdaho National, no reciprocityIllinois National, reciprocalIndiana National, reciprocalIowa Reciprocal, 6 states (IL, MN, MO, NE, SD, WI)Kansas Reciprocal, 6 states (AR, CO, IA, MO, NE, OK)Kentucky National, reciprocalLouisiana National, reciprocalMaine National, no reciprocityMaryland Reciprocal, 14 states (AL, AR, DE, FL, GA, KY, LA, MS, NC, PA, SC, TN, VA, WV) and DCMassachusetts National, reciprocalMichigan National, reciprocalMinnesota Reciprocal, 16 states (CO, IA, ID, IL, IN, KS, MI, MO, MT, ND, NE, OH, SD, WA, WI, WY)Mississippi Reciprocal, 13 states (AL, AR, FL, GA, KY, LA, MO, NC, SC, TN, TX, VA, WV)Missouri Reciprocal, 8 states (AR, IA, IL, KS, KY, NE, OK, TN)Montana Reciprocal, 7 states (CO, ID, MN, ND, SD, WI, WY)Nebraska National, reciprocalNevada National, no reciprocityNew Hampshire National, no reciprocityNew Jersey National, reciprocalNew Mexico National, no reciprocityNew York National, reciprocalNorth Carolina Reciprocal, 13 states (AL, AR, FL, GA, KY, LA, MD, MS, SC, TN, TX, VA, WV) and DCNorth Dakota National, reciprocalOhio National, reciprocalOklahoma National, no reciprocity for initial entry; after initial entry, bank holding company must
be from state offering reciprocity or wait 4 years to expandOregon National, no reciprocityPennsylvania National, reciprocalSouth Carolina Reciprocal, 12 states (AL, AR, FL, GA, KY, LA, MD, MS, NC, TN, VA, WV) and DCRhode Island National, reciprocalSouth Dakota National, reciprocalTennessee National, reciprocalTexas National, no reciprocityUtah National, no reciprocityVermont National, reciprocalVirginia Reciprocal, 12 states (AL, AR, FL, GA, KY, LA, MD, MS, NC, SC, TN, WV) and DCWashington National, reciprocalWest Virginia National, reciprocalWisconsin Reciprocal, 8 states (IA, IL, IN, KY, MI, MN, MO, OH)Wyoming National, no reciprocity
Note: Hawaii did not enact interstate bank holding company legislation.Source: Savage (1993).

10 Economic Perspectives
BOX 2
Estimating the stock price impact of mergers
We estimate the stock price impact of each ofthese merger announcements by employing a multi-variate regression model (MVRM), similar to thoseused in Schipper and Thompson (1983), Binder(1988), and Cornett and Tehranian (1989). In theMVRM, abnormal returns are obtained by addinga (0,1) binary variable to the right-hand side of thetraditional market model to capture the impact ofthe announcement or �event� date. The model takesthe following form:
, ,1 , 2 , 2 , 1 ,3 ,
1
, 4 , 1 ,5 , 2 , ,0
,
j t j j M t j M t j M t
j M t j M t j s s j ts
R R R R
R R D
− −
+
+ −=
= α + β + β + β +
β + β + γ + ε∑
where Rj,t is the return on firm j on day t; R
M,t is the
return on the market portfolio; αj is an intercept
coefficient for bank j; βj,1...j,5 are risk coefficients forthe jth bank; γ
j is the effect of the merger announce-
ment event on the jth firm; Ds is an event binary
variable which equals 1 on day s (s = 0 to +1) in theevent window, and 0 otherwise; and εj,t is a randomerror term which is assumed to be identically distrib-uted normally, independent of the return on themarket and the binary variables. We specify themarket return at several leads and lags as an explan-atory variable to correct for the possibility of non-synchronous trading, especially of some of thesmaller banks (Scholes and Williams, 1977).
With this specification, the estimated parametersγ
j measure the daily abnormal returns associated with
a merger announcement. We are testing for dailyintercept shifts in the interval day 0 to day +1.Since this interval is �dummied out,� the observa-tions in the day 0 to day +1 interval do not influ-ence the estimate of the intercept. Only those
observations without dummies determine the valueof the intercept.
We estimate the target bank�s cumulative ab-normal stock market returns over the two tradingday period that includes the announcement dateand the day after. The two-day cumulative abnormalreturns (CAR) around the merger announcementdate (t = 0 and +1) are then calculated by addingγ
j ,0 and γ
j ,1. The standardized cumulative abnormal
returns are computed using a procedure reported inBradley, Desai, and Kim (1988), and Stultz, Walk-ing, and Song (1990). First, the standardized ab-normal return to the jth security on day t (SAR
j,t)
is computed using the following equation:
1/ 2
2,
, ,
2,
1
( )1/ 1 ,
( )j
m t mj t j t j T
jm m
R RSAR AR
TR Rτ
τ=
− = σ + + −
∑
where ARj,t is the abnormal return to the jth security
on day t, Sj is the standard deviation of the residu-
als in the market model estimation period, Tj is the
number of days in the estimation period, Rm,t
is thereturn on the market portfolio on day t, and R�
m is
the mean return on the market portfolio over theestimation period.
The SARj,t
is then used to obtain the standard-ized cumulative abnormal returns over the twoevent days:
2
, ,1
/ 2.j t j tt
SAR SAR=
=
∑
to characteristics of the deal, the target, and theacquiring banks, regulatory environments in bothacquiring and target bank states tend to affect the bidpremiums (see Palia, 1993). The analysis of bankmerger premiums is further complicated by regulatoryuncertainty (see Desai and Stover, 1985). All bankmergers require time-consuming regulatory approval,making hostile takeovers extremely difficult to execute.
Previous bank studies (Beatty, Santomero, andSmirlock, 1987; Cheng, Gup, and Wall, 1989; Fraserand Kolari, 1988; Rogowski and Simonson, 1989;and Rose, 1991), find that asset size, profitability,management, leverage, means of payment, and
whether the mergers are interstate or intrastate aresignificant in determining the bid premiums orexplaining the stock market�s reaction to bank mergerannouncements.
The literature suggests that size is important indetermining the bid premiums offered to the target,but less important in determining the abnormal returns.For example, Desai and Stover (1985) find that therelative size of target and acquiring banks has no sig-nificant impact on the abnormal returns around theannouncement date. However, Shawky, Kilb, andStaas (1996) find that smaller targets tend to be offereda larger bid premium, and Palia (1993) finds that the

11Federal Reserve Bank of Chicago
relative size of targets and acquiring banks is impor-tant in explaining the variation in the bid premiums.
With regard to profitability and capital, Shawky,Kilb, and Staas (1996) find that higher bid premiumstend to be offered to target banks with larger returnson equity and those with higher leverage. The latterresult suggests that higher leverage may be associatedwith more efficient use of capital.
Whether the merger deals are stock exchangeoffers or cash offers may also affect the abnormalreturns and the bid premiums�because of the differ-ential tax implications associated with these offers.The market may view a cash offer positively for theacquirer, because it allows the acquiring bank to in-crease the depreciation tax shield as the depreciationbasis of the acquired assets rises to the market value.However, the market may view it negatively for thetarget, because it imposes a greater immediate taxburden on target shareholders. However, the marketmay view a cash offer negatively for the acquirer andpositively for the target if the acquirer�s share price isrelatively overvalued. Shawky, Kilb, and Staas (1996)find that the bid premiums offered to target banks arelarger for stock deals (rather than cash payment),supporting the acquirer�s overvalued stock hypothesis.However, Cornett and De (1991b) find that mergersfinanced with only stock or only cash produce higherabnormal returns to target shareholders than thosefinanced with combinations of stock and cash. Inter-estingly, previous studies on nonbank mergers findmedium of payment to be unimportant (Eckbo andLangohr, 1989; and Travlos, 1987).
Rhoades (1987) suggests that geographical expan-sion may be a primary motivation for bank mergers.Palia (1993) and Shawky, Kilb, and Staas (1996) findthat the bid premiums offered to target banks arelarger for out-of-state mergers than intrastate merg-ers. Using interstate bank mergers, Cornett and De(1991a) find significant positive announcement peri-od abnormal returns for both target and acquiringbanks. Again, this contrasts with findings for nonbankmergers, suggesting that bank mergers are differentand, thus, the results for nonbank mergers cannot begeneralized to the banking sector.
Examining the postmerger performance of largebank mergers between 1982 and 1987, Cornett andTehranian (1992) find that merged banks tend to per-form better than the banking industry overall. Thissuperior performance resulted from improvements inthe merged banks� ability to attract loans and deposits,employee productivity, and asset growth. (For a recentliterature review on bank merger performance, seeBerger, DeYoung, Genay, and Udell, 2000.)
Cornett and Tehranian (1992) examine operatingcash flows as well as several accounting variables ofthe merged banks for one to three years after themergers. Recognizing that accounting data are notperfect measures of economic performance, they uti-lize both accounting and market data to determinewhether stock price gains associated with mergersannouncement (short run) are the result of real eco-nomic gains (long run). Interestingly, they find a sig-nificant correlation between announcement-periodabnormal stock returns and the various long-term per-formance measures, and conclude that market partici-pants are able to identify in advance the improvedperformance associated with bank acquisitions.6 Wefocus on short-term performance, using market data,rather than testing whether mergers will result in effi-ciency gains or improved long-run performance.
Overall, the empirical results presented in theprevious studies have been mixed and largely dependon the sample period, sample observations, and meth-odology. We reexamine this issue using more recentand more complete data on bank mergers. Our resultsare more applicable to current policy issues thanprevious studies, given the rapidly evolving environ-ment the banking industry faces.
The data
We obtained details of all bank mergers and acqui-sitions from 1990 to mid-1998 from the Security DataCorporation (SDC). To be included in our sample,both the target and bidding banks must be publiclytraded.7 We obtained financial data from the quarterlycall reports and bank holding company Y9 reports, asof yearend prior to the merger announcement date.Stock market returns for target banks and the stockmarket index are from the Center for Research inSecurity Prices data tape. The merger announcementdate, target name, acquirer name, value of the deal,bid premium, and other characteristics of the mergerannouncement are from the SDC database. We ob-tained the HHIs for various banking markets from theBoard of Governors of the Federal Reserve System.
Banking agencies consider a local, economicallyintegrated area to be a banking market. In practice,this usually means a city, a metropolitan statistical area(MSA), or a rural county. We matched the target bank�sheadquarters with an MSA or county. This does notallow us to consider a target bank present in severaldifferent market areas and points to the difficulty ofusing local market concentration measures for bankingorganizations that have broad geographical scope andproduct mix. The price that a bank offers (or accepts)reflects the activities of the entire organization.
12 Economic Perspectives
BOX 3
The model
The following basic specification is used to ex-amine the factors that are correlated with thebid premium offered for the target (BVPREM):
, 0 1 , 2 ,
3 , 4 ,
5 , 6 ,
7 , 8 ,
9 , ,
1)
,
j t j t j t
j t j t
j t j t
j t j t
j t j t
BVPREM PROFIT LEV
SIZE LOAN
CHARGE MEQUAL
THRIFT SEAST
RNEAL
= α + α + α
+ α + α
+ α + α
+ α + α
+ α + ε
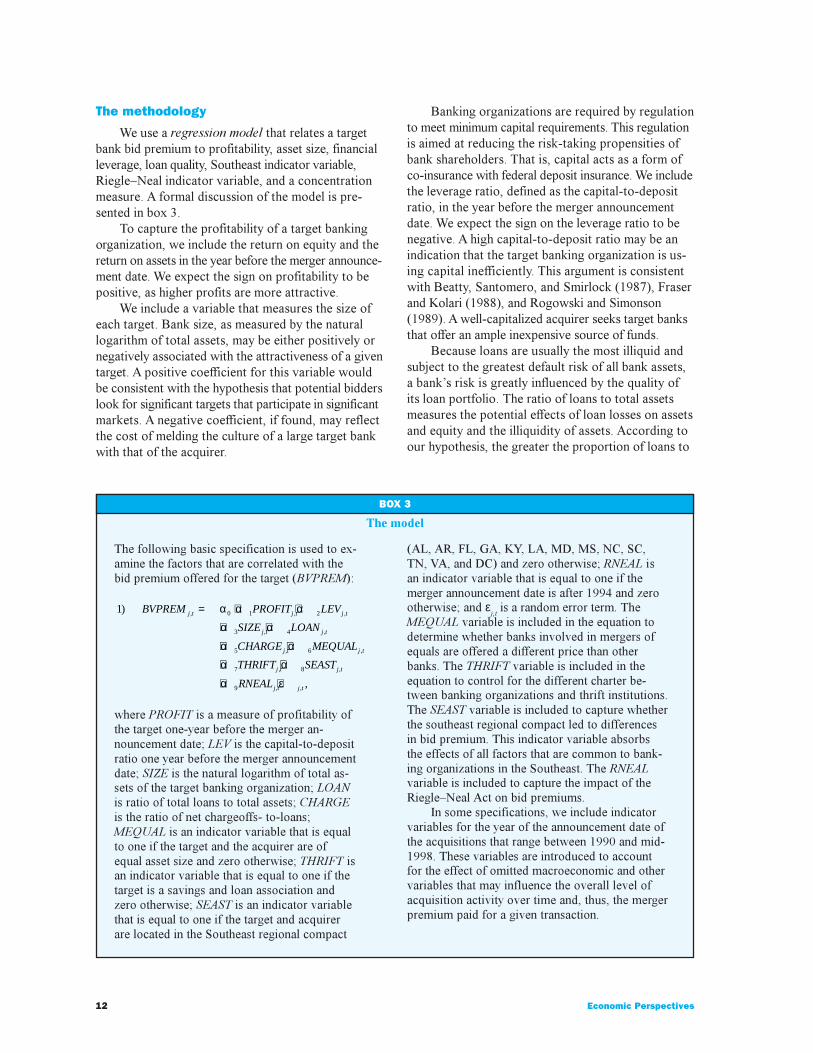
where PROFIT is a measure of profitability ofthe target one-year before the merger an-nouncement date; LEV is the capital-to-depositratio one year before the merger announcementdate; SIZE is the natural logarithm of total as-sets of the target banking organization; LOANis ratio of total loans to total assets; CHARGEis the ratio of net chargeoffs- to-loans;MEQUAL is an indicator variable that is equalto one if the target and the acquirer are ofequal asset size and zero otherwise; THRIFT isan indicator variable that is equal to one if thetarget is a savings and loan association andzero otherwise; SEAST is an indicator variablethat is equal to one if the target and acquirerare located in the Southeast regional compact
(AL, AR, FL, GA, KY, LA, MD, MS, NC, SC,TN, VA, and DC) and zero otherwise; RNEAL isan indicator variable that is equal to one if themerger announcement date is after 1994 and zerootherwise; and ε
j,t is a random error term. The
MEQUAL variable is included in the equation todetermine whether banks involved in mergers ofequals are offered a different price than otherbanks. The THRIFT variable is included in theequation to control for the different charter be-tween banking organizations and thrift institutions.The SEAST variable is included to capture whetherthe southeast regional compact led to differencesin bid premium. This indicator variable absorbsthe effects of all factors that are common to bank-ing organizations in the Southeast. The RNEALvariable is included to capture the impact of theRiegle�Neal Act on bid premiums.
In some specifications, we include indicatorvariables for the year of the announcement date ofthe acquisitions that range between 1990 and mid-1998. These variables are introduced to accountfor the effect of omitted macroeconomic and othervariables that may influence the overall level ofacquisition activity over time and, thus, the mergerpremium paid for a given transaction.
The methodology
We use a regression model that relates a targetbank bid premium to profitability, asset size, financialleverage, loan quality, Southeast indicator variable,Riegle�Neal indicator variable, and a concentrationmeasure. A formal discussion of the model is pre-sented in box 3.
To capture the profitability of a target bankingorganization, we include the return on equity and thereturn on assets in the year before the merger announce-ment date. We expect the sign on profitability to bepositive, as higher profits are more attractive.
We include a variable that measures the size ofeach target. Bank size, as measured by the naturallogarithm of total assets, may be either positively ornegatively associated with the attractiveness of a giventarget. A positive coefficient for this variable wouldbe consistent with the hypothesis that potential bidderslook for significant targets that participate in significantmarkets. A negative coefficient, if found, may reflectthe cost of melding the culture of a large target bankwith that of the acquirer.
Banking organizations are required by regulationto meet minimum capital requirements. This regulationis aimed at reducing the risk-taking propensities ofbank shareholders. That is, capital acts as a form ofco-insurance with federal deposit insurance. We includethe leverage ratio, defined as the capital-to-depositratio, in the year before the merger announcementdate. We expect the sign on the leverage ratio to benegative. A high capital-to-deposit ratio may be anindication that the target banking organization is us-ing capital inefficiently. This argument is consistentwith Beatty, Santomero, and Smirlock (1987), Fraserand Kolari (1988), and Rogowski and Simonson(1989). A well-capitalized acquirer seeks target banksthat offer an ample inexpensive source of funds.
Because loans are usually the most illiquid andsubject to the greatest default risk of all bank assets,a bank�s risk is greatly influenced by the quality ofits loan portfolio. The ratio of loans to total assetsmeasures the potential effects of loan losses on assetsand equity and the illiquidity of assets. According toour hypothesis, the greater the proportion of loans to
13Federal Reserve Bank of Chicago
TABLE 4
Selected financial characteristics of target and price information
Quartile Range %Financial characteristics (1 = lowest) (of explanatory variable) CAR (%) SCAR (%) BVPREM
Book value of capital/total assets 1 2.2–6.8 14.0 5.1 2.12 6.8–8.1 11.0 4.2 2.43 8.1–9.4 12.5 4.8 2.14 9.4–25.4 8.3 3.4 2.2
Total loans/total assets 1 22.3–55.5 12.1 4.8 1.92 55.5–63.5 13.3 5.3 2.33 63.5–68.9 9.2 3.9 2.34 68.9–89.2 11.1 3.5 2.2
Total assets (in millions) 1 35.7–272.0 11.4 3.6 2.12 272.0–902.3 13.2 4.4 2.03 902.3–3,276.1 10.2 4.1 2.34 3,276.1–260,159 11.0 5.5 2.2
Return on assets 1 –1.3–0.4 10.8 3.6 1.62 0.4–0.9 12.9 4.8 2.13 0.9–1.2 10.5 3.9 2.24 1.2–2.2 11.5 5.2 2.8
Riegle–Neal (0 before act, 1 after) 0 96 (122) 13.0 4.1 1.71 146 (205) 10.4 4.6 2.4
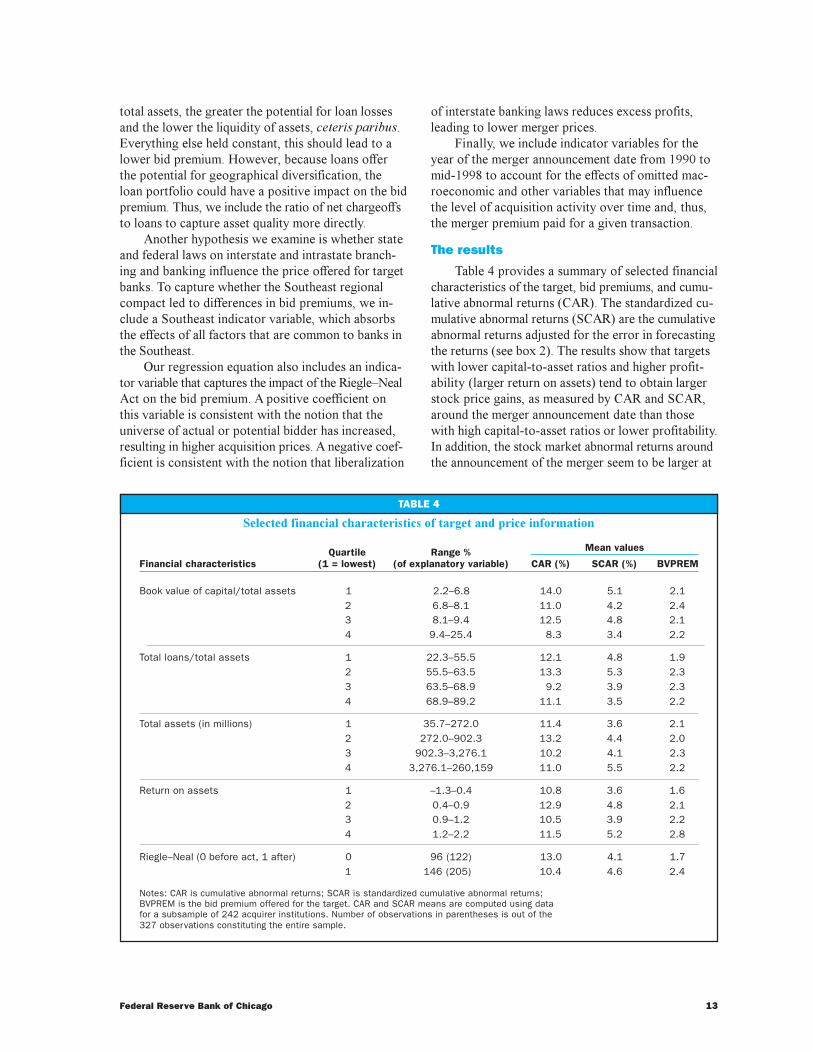
Notes: CAR is cumulative abnormal returns; SCAR is standardized cumulative abnormal returns;BVPREM is the bid premium offered for the target. CAR and SCAR means are computed using datafor a subsample of 242 acquirer institutions. Number of observations in parentheses is out of the327 observations constituting the entire sample.
Mean values
total assets, the greater the potential for loan lossesand the lower the liquidity of assets, ceteris paribus.Everything else held constant, this should lead to alower bid premium. However, because loans offerthe potential for geographical diversification, theloan portfolio could have a positive impact on the bidpremium. Thus, we include the ratio of net chargeoffsto loans to capture asset quality more directly.
Another hypothesis we examine is whether stateand federal laws on interstate and intrastate branch-ing and banking influence the price offered for targetbanks. To capture whether the Southeast regionalcompact led to differences in bid premiums, we in-clude a Southeast indicator variable, which absorbsthe effects of all factors that are common to banks inthe Southeast.
Our regression equation also includes an indica-tor variable that captures the impact of the Riegle�NealAct on the bid premium. A positive coefficient onthis variable is consistent with the notion that theuniverse of actual or potential bidder has increased,resulting in higher acquisition prices. A negative coef-ficient is consistent with the notion that liberalization
of interstate banking laws reduces excess profits,leading to lower merger prices.
Finally, we include indicator variables for theyear of the merger announcement date from 1990 tomid-1998 to account for the effects of omitted mac-roeconomic and other variables that may influencethe level of acquisition activity over time and, thus,the merger premium paid for a given transaction.
The results
Table 4 provides a summary of selected financialcharacteristics of the target, bid premiums, and cumu-lative abnormal returns (CAR). The standardized cu-mulative abnormal returns (SCAR) are the cumulativeabnormal returns adjusted for the error in forecastingthe returns (see box 2). The results show that targetswith lower capital-to-asset ratios and higher profit-ability (larger return on assets) tend to obtain largerstock price gains, as measured by CAR and SCAR,around the merger announcement date than thosewith high capital-to-asset ratios or lower profitability.In addition, the stock market abnormal returns aroundthe announcement of the merger seem to be larger at

14 Economic Perspectives
TABLE 5
Pricing of bank mergers, regional, andfinancial characteristics
StandardizedBook value cumulativepremium excess returns
Southeast regional compactYes (AL, AR, FL, GA, KY, LA, MD, 2.4469 5.6950MS, NC, SC, TN, VA and DC)
No 2.0600 3.9400
Difference 0.3869 1.7550(2.06)** (1.51)
Before Riegle–Neal Act 2.4687 7.2392
After Riegle–Neal Act 1.7907 2.5294
Difference 0.6780 4.7098(3.80)*** (2.73)***
Asset characteristicsAssets ≥$10 billiona 2.3612 8.1679
Assets <$10 billion 2.1456 4.0603
Difference 0.2156 4.1076(0.89) (3.37)***
Banks versus thriftsBanks 2.2500 4.4376
Thrifts 1.4721 3.9604
Difference 0.7779 0.4772(7.21)*** (0.46)
aExcluding banking organizations classified as mergers of equals.***Indicates significance at the 1 percent level.**Indicates significance at the 5 percent level.Note: The t-statistics are in parentheses.
returns) varies depending on the size of thetarget banks. Overall, the larger the targetbank, the larger the standardized cumula-tive abnormal returns around the mergerdate (see table 4).8 Finally, table 5 showsthat the standardized cumulative abnor-mal returns are not statistically differentwhether the target is a bank or thrift.However, the bid premiums offered fortarget banks are, on average, significantlylarger then those offered for thrifts.
Table 6 separates the megamergerdeals from the rest of the sample. Thepattern of variation of the bid premiumsaccording to target size is now more evi-dent. Within the large target bank group,there appears to be a U-shaped relation-ship between total assets and bid premi-ums: relatively high for the lowest quartileof banking organizations, decreasing tothe next quartile, and rising thereafter.There appears to be little if any noticeablepattern in bid premiums for targets withtotal assets less than $10 billion. Whilereturns are smaller for megamergers oftarget banks larger than $10 billion thanfor other mergers, there is no clear patternof variation in standardized cumulativeabnormal returns within each group.
Table 7 provides information onmarket concentration and merger prices.These numbers suggest that bid premi-ums increase with concentration, espe-
cially for banks with total assets greater than orequal to $10 billion. Thus, it appears that large
TABLE 6
Size and pricing of bank mergers
BookQuartile value
(1 = lowest) premium SCARb
Assets ≥$10 billiona 1 2.43 8.612 1.83 3.213 2.50 11.654 2.69 9.27
Assets <$10 billion 1 2.16 2.722 2.03 4.843 2.25 3.744 2.15 4.46
aExcluding banking organizations classified as mergersof equals.bStandardized cumulative abnormal returns.
larger target banks. The abnormal returns tend todecline as the target�s proportion of loans to assetsincreases. Similarly, the bid premiums tend to increasewith the target�s return on assets, and have becomelarger in the post-Riegle�Neal period. Unlike theabnormal returns, the bid premiums offered for tar-gets seem to be positively correlated with the loanto assets ratio.
Table 5 presents the bid premiums and the stan-dardized cumulative abnormal returns for differenttarget characteristics. The target�s abnormal returnsaround the merger announcement date are significantlylarger for targets in the Southeast regional compact.Interestingly, while both the bid premiums and theabnormal returns are generally larger in the post-Riegle�Neal periods (as presented in table 4), they aresignificantly smaller for target banks in the Southeast.
The results from both tables 4 and 5 suggest thatthe bid premiums are not statistically different amongtargets with different asset sizes. However, the stockmarket reaction (the standardized cumulative abnormal

15Federal Reserve Bank of Chicago
TABLE 7
Market concentration and the pricingof bank mergers
Concentration Bookquartile value
(1 = lowest) premium SCARb
Assets ≥$10 billiona 1 1.61 7.682 2.35 11.933 2.43 3.494 2.93 9.59
Assets <$10 billion 1 1.93 4.152 2.48 5.623 2.00 3.054 2.17 3.27
aExcluding banking organizations classified as mergersof equals.bStandardized cumulative abnormal returns.
banks pay more for target banks located in lesscompetitive markets.
Table 8 provides detail on megamergers of tar-gets larger than $10 billion, as well as megamergersof equals�the bid premium and the standardizedcumulative abnormal return around the merger an-nouncement date are presented for each merger deal.The standardized cumulative abnormal returns, onaverage, are much larger for megamergers overall thanfor megamergers of equals. The problem of meldingthe culture of a large target bank with that of the ac-quirer is anticipated by the market to be more seriousin megamergers of equals deals. Unlike the standard-ized cumulative abnormal returns, the bid premiumsare approximately the same, on average, for both mega-mergers of equals and other megamergers.
The statistics presented in tables 4, 5, 6, 7, and 8are averages, and do not control for the other character-istics of the target, the acquiring bank, the deal, and theyear of the merger. We control for these characteristicsin the regression analysis presented in tables 9�11.
Table 9 presents the regression analysis explainingthe bid premiums offered for targets using the finan-cial characteristics of the target and selected factorsassociated with the transaction, based on equation 1in box 3. The first three columns present the resultsusing return on book equity as a measure of profit-ability. The last three columns present the results using return on assets as a measure of profitability.Columns 1 and 4 of table 9 represent the basic modelfor each measure of profitability, excluding the timeindicator variables and the composite of the South-east region compact indicator and the Riegle�Nealindicator. Columns 2 and 5 expand the basic equa-tion to include the composite term. Finally, columns
3 and 6 add the time indicator variables that controlfor the year of each merger announcement.
The results in column 1 of table 9 show thatmore profitable target banks, as measured by higherreturn on equity, are offered larger bid premiumsthan less profitable targets. The bid premium increaseswith the asset size of the target and decreases withthe ratio of equity to deposits, although the effectsare not statistically significant. Similarly, the loan-to-assets and net-chargeoffs-to-loans ratios are bothinsignificant in explaining variation in the bid pre-mium across deals. The results also indicate that bidpremiums are larger for target banks than thrifts,larger for targets located in the Southeast regionalcompact, and larger in the post-Riegle�Neal period.The results in table 9 also suggest that the bid pre-miums tend to be lower for megamergers of equalsthan for other mergers. However, this effect is notstatistically significant at conventional levels.
Table 9, column 2 includes the composite termthat interacts the Riegle�Neal indicator variable withthe Southeast regional compact indicator variable.The total impact on the bid premium for target bankslocated in the Southeast regional compact afterRiegle�Neal is the sum of the coefficients on theSoutheast regional compact indicator variable, 0.4459,and the Riegle�Neal and Southeast regional compactcomposite indicator variable, �0.2681. Thus, holdingeverything else constant, in the post-Riegle�Neal pe-riod, bid premiums are lower in the Southeast region-al compact states than in the pre-Riegle�Neal period.
Column 3 of table 9 reports the results of in-cluding time indicator variables (and excluding theRiegle�Neal indicator variable) and the compositeterm in the basic regression equation. When we addthe time indicator variables, the coefficient estimateson return on equity, thrift indicator, and Southeastregional compact indicator are qualitatively similarto those reported in column 1 of table 9. For example,the coefficient on the Southeast regional compactindicator continues to suggest that mergers betweenbanking organizations located in the Southeast statesduring the post-Riegle�Neal period result in higherbid premiums than those in other states. The effectof 0.4333 in this specification is even greater thanthe effect of 0.3439 in the basic model in column 1.In the specification in column 3, both the asset sizeof the target banks and the ratio of equity to depositsare now significantly correlated with bid premiums.The results suggest that larger target banks receivelarger bid premiums. This result is consistent withthe notion that banks are using their increased freedomto merge in a way intended to increase the valueof their deposit insurance, generating higher bid

16 Economic Perspectives
TABLE 8
Characteristics of large bank mergers during the 1990s
Book StandardizedTotal assets value excess
Acquiring bank of target premium return Year
($ bil.)
Targets with assets >$10 billionManufacturers Hanover Corporation Chemical Banking Corporation 61.5 0.70 7.57 1991C&S/Sovran Corporation NCNB Corporation 51.4 1.49 4.62 1991Security Pacific Corporation BankAmerica Corporation 88.0 1.17 11.50 1991Ameritrust Corporation Society Corporation 11.0 1.99 0.65 1991Manufacturers National Corporation Comerica Inc. 12.1 1.34 6.46 1991MNC Financial Inc. NationsBank Corporation 17.5 1.33 –1.55 1992Continental Bank Corporation BankAmerica Corporation 22.5 1.35 10.20 1994Michigan National Corporation National Australia Bank Ltd. 10.2 1.69 10.03 1995Shawmut National Corporation Fleet Financial Group Inc. 31.3 1.79 9.18 1995First Fidelity Bancorporation First Union Corporation 36.2 1.92 13.82 1995Midlantic Corporation PNC Bank Corporation 13.3 2.12 6.54 1995Integra Financial Corporation National City 13.7 1.97 4.87 1995Meridian Bancorp Inc. Corestates Financial Corporation 15.0 2.17 5.71 1995First Interstate Bancorp Wells Fargo & Company 55.8 3.35 18.16 1995BayBanks Bank of Boston Corporation 10.8 2.22 5.40 1995Boatmen’s Bancshares NationsBank Corporation 33.7 2.71 14.35 1996Standard Fed Bancorp ABN-AMRO Holding NV 13.3 2.05 –2.76 1996US Bancorp First Bank System 31.9 3.38 9.76 1997Central Fidelity Banks Inc. Wachovia Corporation 10.6 2.81 8.32 1997Signet Banking Corporation First Union Corporation 11.7 3.46 18.64 1997Barnett Banks NationsBank Corporation 41.4 4.05 10.28 1997Corestates Financial Corporation First Union Corporation 45.6 5.39 3.51 1997First of American Bank National City 22.1 3.84 12.58 1997
Average 28.7 2.36 8.17
Mergers of equalsKeyCorp, Albany, NY Society Corporation 25.5 1.82 — 1993BB&T Financial Corporation Southern National 9.2 2.32 2.29 1994First Chicago Corporation NBD Bancorp 65.9 1.30 1.87 1995Chase Manhattan Corporation Chemical Banking Corporation 114.0 1.38 3.76 1995First Chicago NBD Corporation Banc One Corporation 114.1 3.68 0.52 1998BankAmerica Corporation NationsBank Corporation 260.0 3.06 1.52 1998Wells Fargo & Company Norwest Corporation 97.5 2.70 –2.13 1998
Average 98.0 2.32 1.30
premiums with higher asset size. The ratio of equityto deposits (leverage ratio) is significantly negative,indicating that higher leverage targets are offeredlarger bid premiums than other leveraged institutions.These less-capitalized target banks are viewed by theacquirers as being more efficient in their use of expen-sive capital funding; thus, the acquirers are willing topay a larger bid premium. Finally, the time indicatorssuggest that bid premiums have been increasing overtime. For example, merger bid premiums in 1997were, on average, 0.6692 percentage points belowthose in 1998, while in 1996 they were 1.2543 per-centage points below the 1998 level.
Columns 4 to 6 of table 9 report the results ofusing return on assets rather than return on equity as
a measure of profitability. As in columns 1 to 3, bidpremiums increase with profitability as measured byreturn on assets. Moreover, the asset size of the targetbanks and the ratio of equity to deposits are statisti-cally significantly related to bid premiums in almostevery empirical specification. The coefficients on thethrift and Southeast regional compact indicators areroughly the same as those reported in columns 1�3of table 9. The model specification fits well, explain-ing almost 25 percent of the variation in the bid pre-miums offered for targets across all merger deals.
Table 10 uses the target�s standardized excessreturns as the dependent variable in the regressionequation rather than the bid premium. As shown in

17Federal Reserve Bank of Chicago
TABLE 9
Relationship between bid premium and target financial characteristics
Profitability as return on equity Profitability as return on total assets
Southeast Southeastcompact compact
Basic interacted with Time binary Basic interacted with BasicVariables controls Riegle–Neal variables controls Riegle–Neal variables
Return on equity 3.3169 3.2695 3.0487 — — —(2.82)*** (2.86)*** (2.82)***
Return on assets — — — 39.8565 40.4137 31.8314(2.69)*** (2.73)*** (2.18)**
Natural logarithm 0.0636 0.0630 0.0758 0.0681 0.0676 0.0812 of total assets (1.54) (1.52) (1.89)* (1.65)* (1.63)* (2.02)**
Book value of equity –2.9059 –2.8209 –3.8521 –4.1854 –4.1216 –4.9113 to total deposits (–1.51) (–1.46) (–2.11)** (–2.14)** (–2.10)** (–2.64)***
Loans to total assets 0.7767 0.7357 0.6238 0.7742 0.7341 0.5952(1.31) (1.24) (1.12) (1.31) (1.24) (1.06)
Net chargeoffs to loans –12.9726 –12.6326 –10.4068 –14.7443 –14.4692 –14.2260(–1.18) (–1.15) (–1.00) (–1.37) (–1.34) (–1.38)
Thrift indicator –0.5178 –0.5191 –0.4248 –0.4846 –0.4859 –0.4412(–2.21)** (–2.22)** (–1.92)* (–2.01)** (–2.01)** (–1.92)*
Megamergers of equals –0.1573 –0.1281 –0.4647 –0.0554 –0.0254 –0.3568 indicator (–0.32) (–0.26) (–0.99) (–0.11) (–0.05) (–0.76)
Southeast regional 0.3439 0.4459 0.4333 0.3287 0.4274 0.4197 compact indicator (2.39)** (2.44)** (2.51)** (2.27)** (2.34)** (2.42)**
Riegle–Neal 0.3577 0.2855 — 0.3621 0.2923 —(2.52)** (1.75)* (2.54)** (1.79)*
(Southeast regional — –0.2681 –0.2753 — –0.2598 –0.2554 compact) x (Riegle–Neal (–0.91) (–0.99) (–0.88) (–0.92) indicator)
1990 — — –2.1043 — — –2.0594(–4.88)*** (–4.74)***
1991 — — –1.5333 — — –1.5081(–4.92)*** (–4.76)***
1992 — — –1.5709 — — –1.5937(–4.85)*** (–4.89)***
1993 — — –0.9094 — — –0.9140(–3.23)*** (–3.23)***
1994 — — –1.0488 — — –1.0410(–3.75)*** (–3.70)***
1995 — — –1.3827 — — –1.3468(–5.55)*** (–5.37)**
1996 — — –1.2543 — — –1.2362(–4.96)*** (–4.85)***
1997 — — –0.6692 — — –0.6642(–2.71)*** (–2.59)**
Number of observations 327 327 327 327 327 327
Adjusted R2 0.1337 0.1358 0.2432 0.1319 0.1313 0.2355
F-statistic 6.592 6.693 7.1641 6.503 5.926 6.908
***Indicates significance at the 1 percent level.**Indicates significance at the 5 percent level.*Indicates significance at the 10 percent level.Note: Numbers in parentheses are t-statistics.

18 Economic Perspectives
TABLE 10
Standardized excess returns of target and target financial characteristics
Profitability as return on equity Profitability as return on assets
Southeast Southeastcompact compact
Basic interacted with Time Basic interacted with TimeVariables controls Riegle–Neal indicator controls Riegle–Neal indicator
Return on equity 0.1101 0.1249 0.1189 — — —(1.55) (1.78)* (1.66)*
Return on assets — — — 0.7750 0.9671 1.0524(0.82) (1.03) (1.10)
Natural logarithm 0.0074 0.0076 0.0073 0.0077 0.0079 0.0076 of total assets (2.88)*** (3.00) *** (2.77)*** (3.03)*** (3.16)*** (2.87) ***
Book value of equity –0.1361 –0.1267 –0.1127 –0.1598 –0.1561 –0.1427 to total deposits (–1.07) (–1.01) (–0.89) (–1.23) (–1.22) (–1.01)
(–2.52)** (–2.58)** (–2.24)** (–2.57)** (–2.62)*** (–2.25)**
Net chargeoffs to loans 0.1095 0.0187 0.0113 0.4139 0.2940 0.2370(–0.16) (–0.03) (–0.02) (–0.51) (–0.44) (–0.35)
Thrift indicator 0.0158 0.0172 0.0141 0.0124 0.0140 0.0120(1.10) (1.22) (0.97) (0.83) (0.95) (0.79)
Megamergers of equals indicator –0.0592 0.0518 –0.0445 0.0561 –0.0484 –0.0412
(2.05)** (1.82)* (–1.51) (1.94)* (1.69)* (–1.40)
Southeast regional 0.0224 0.0421 0.0420 0.0226 0.0418 0.0416 compact indicator (2.47)** (3.77)*** (3.65) *** (2.45)** (3.72)*** (3.60)***
Riegle–Neal indicator 0.0068 –0.0061 — 0.0074 –0.0052 —(0.77) (–0.63) (0.84) (–0.54)
(Southeast regional — –0.0548 –0.0543 — –0.0538 –0.0536 compact) × (Riegle-Neal (–2.95) *** (–2.89)*** (–2.89)*** (–2.84) *** indicator)
1990 — — 0.0504 — — 0.0519(1.98)** (2.03)**
1991 — — 0.0306 — — 0.0308(1.55) (1.54)*
1992 — — 0.0267 — — 0.0253 (1.21) (1.14)
1993 — — 0.0217 — — 0.0206(1.14) (1.08)
1994 — — 0.0258 — — 0.0264(1.38) (1.40)
1995 — — 0.0335 — — 0.0349(1.92)* (2.00)**
1996 — — 0.0302 — — 0.0303(1.75)* (1.75)*
1997 — — 0.0136 — — 0.0141(0.80) (0.83)
Number of observations 242 242 242 242 242 242
Adjusted R2 0.0694 0.0994 0.0994 0.0625 0.0912 0.0933
F-statistics 2.996 3.659 2.565 2.784 3.4519 2.458
***Indicates significance at the 1 percent level.**Indicates significance at the 5 percent level.*Indicates significance at the 10 percent level.Note: Numbers in parentheses are t-statistics.

19Federal Reserve Bank of Chicago
table 10, the standardized excess returns tend to begreater for more profitable banks. However, the effectis only marginally significant. On the other hand,
there is a greater stock market reactionfor larger target banks, possibly reflectingthe fact that bid premiums tend to increasewith target bank asset size. The coeffi-cient on the megamergers of equals indica-tor variable is negative and, in four out ofsix cases, statistically significant at con-ventional levels, indicating that the stockmarket reacts relatively negatively to an-nouncements of such mergers. For exam-ple, the coefficient estimate in column 1of table 10 suggests that standardized ex-cess returns for these megamergers ofequals announcements were 5.92 percent-age points less than for other merger an-nouncements. This negative response maybe due to the higher cost of melding theculture of two large banking organiza-tions. The Southeast regional compact in-dicator variable has a positive coefficientin all six specifications in table 10, show-ing that the target�s standardized excessreturns around the merger announcementdate are significantly larger for targets inthe Southeast regional compact states.The composite term that interacts theRiegle�Neal and the Southeast regionalcompact indicators is negative and statis-tically significant. Thus, relative to thepre-Riegle�Neal period, the stock marketreaction is less in the post-Riegle�Nealperiod to announcements of mergers ofbanks located in the Southeast regionalcompact states. This result is consistentwith the notion that bank merger priceswill be lower when bank acquisition lawsare more liberal.
The target�s standardized excess re-turns around the merger announcementdate are significantly lower for targetswith higher loan-to-asset ratios. Theresults indicate that the book value ofequity to total deposits and net-charge-offs-to-loans ratios are insignificant inexplaining variation in standardized ex-cess returns across deals. As in table 5,the results in table 10 show that standard-ized excess returns are not statisticallydifferent for banks and thrifts.
Table 11 presents the regression anal-ysis explaining merger prices using market concentra-tion, in addition to the financial characteristics of thetarget and control factors used in tables 9 and 10.
TABLE 11
Bid premiums and financial characteristics with marketconcentration measure
Profitability as Profitability asVariables return on equity return on total assets
Return on equity 3.0500 —(2.81)***
Return on assets — 30.9000(2.18)**
Natural logarithm 0.0760 0.0815of total assets (1.88)* (2.02)**
Book value of equity –3.8590 –4.9265to total deposits (–2.11)** (–2.64)**
Loans to total assets 0.6239 0.5944(1.12) (1.06)
Net chargeoffs to loans –10.4294 –14.2521(–1.00) (–1.38)
Market concentration –0.0364 –0.0625(–0.06) (–0.11)
Thrift indicator –0.4243 –0.4401(–1.91)* (–1.91)*
Southeast regional 0.4323 0.4179compact indicator (2.49)** (2.39)**
(Southeast regional compact) –0.2727 –0.2509x (Riegle–Neal indicator) (–0.97) (–0.88)
1990 –2.1054 –2.0611(–4.87)*** (–4.74)***
1991 –1.5345 –1.5101(–4.90)*** (–4.76)***
1992 –1.5720 –1.5954(–4.84)*** (–4.88)***
1993 –0.9100 –0.9150(–3.23)*** (–3.22)***
1994 –1.0491 –1.0416(–3.74)*** (–3.69)***
1995 –1.3819 –1.3454(–5.53)*** (–5.35)***
1996 –1.2540 –1.2355(–4.95)*** (–4.84)***
1997 –0.6686 –0.6431(–2.70)*** (–2.58)**
Number of observations 327 327
Adjusted R2 0.2408 0.2331
F-statistic 6.744 6.504
***Indicates significance at the 1 percent level.**Indicates significance at the 5 percent level.*Indicates significance at the 10 percent level.Note: Numbers in parentheses are t-statistics.

20 Economic Perspectives
NOTES
The main results remain pretty much unchangedfrom table 9. For example, the coefficient on theSoutheast regional compact indicator continues to bepositive, suggesting that mergers between bankingorganizations in the Southeast during the post-Riegle�Neal period result in higher bid premiums (and stan-dardized excess returns, which are not shown here butare available from the authors) than those in otherstates. The results in table 11 indicate that market con-centration is not significant in explaining either thevariation in the bid premiums that the acquiring banksare willing to pay or the standardized excess returnsas a result of the merger announcement, when con-trolling for characteristics of the targets and thetransactions.
Conclusion
The wave of bank consolidation in the 1990s hasdramatically changed the structure of the U.S. bankingindustry. The number of banks has significantlydeclined, with much fewer smaller banks and morelarge superregional and money center banks. Themarket shares of large banks have also become muchlarger as a result of megamergers and mergers ofequals. The rapid pace of bank mergers and acquisi-tions is likely to continue into the future. Moreover,the pace of bank acquisitions of security firms andinsurance companies is also likely to rise in the futureas a result of the recent enactment of the Gramm�Leach�Bliley Act of 1999.
This article presents evidence on the differentmotivations affecting merger bid premiums that theacquiring banks are willing to offer for the targetsas well as the announcement-period abnormal stockreturns. We find that the following target banks arelikely to be offered a larger bid premium�moreprofitable targets with higher returns on assets and/orreturns on equity, and less-capitalized target bankswith high leverage ratios.
The positive correlation between target size andthe standardized abnormal (excess) returns aroundthe merger announcement date implies that the mar-ket views the mergers positively when the potentialbidders look for large targets that participate in signifi-cant markets. However, the abnormal returns are sig-nificantly lower for megamergers of equals than forother mergers, probably because the market antici-pates problems in melding the cultures of two largebanks. Regarding the capital ratio, unlike bank regu-lators, which favor better-capitalized banks, acquir-ing banks tend to prefer targets that offer an ample,inexpensive source of funds. In addition, target bankstend to receive larger bid offers than thrifts.
Our results show that banks located in theSoutheast regional compact states�the only groupthat operated as a cohesive unit in our sample period,restricting entry by banks from states outside of theregion�receive larger bid premiums than targets inother parts of the country. Overall, the bid premiums arelarger in the post-Riegle�Neal period, consistent withthe notion that as the universe of actual or potential bid-ders has expanded, acquisition prices have risen.
If market participants are able to identify inadvance the improved performance associated withbank acquisitions, as documented in Cornett andTehranian (1992), the bid premiums and the announce-ment-period abnormal stock returns examined hereshould be positively correlated with the long-termperformance of the merged banks. Smaller bid premi-ums and abnormal returns at targets larger than $10billion in megamergers of equals suggest that futuremegamerger applications between banks and otherbank or nonbank financial institutions should be moni-tored more closely. Our results also imply that thesemegamergers of equals are not perceived by the mar-ket to have the benefit of creating a bank that is toobig to fail.
1Prior to the Riegle�Neal Act, banking organizations could con-duct interstate banking operations through �nonbank banks��those that do not meet the definition of bank. Banks are commonlydefined as institutions that both accept demand deposits and makecommercial loans.
2States could individually opt out of this branching authority orchoose to adopt an earlier starting date.
3Siems (1996) examines bank megamerger deals in 1990�95, andconcludes that market powers are not the primary motivation forthe mergers.
4See Cetorelli (1999) for a discussion of the HHI.
5When first introduced the 1982, the DOJ horizontal mergerguidelines listed in table 2 applied to all U.S. industries. In 1985,the DOJ modified the 1,800/50 rule for bank mergers to 1,800/200 to recognize the impact of competition from thrifts and non-depository institutions.
As mentioned earlier, the Supreme Court, in the ConnecticutNational Bank case (1974), concluded that thrifts should not beincluded in the calculation of concentration measures becausethey were not offering the cluster of banking services. However,the court did recognize that thrifts could be included if theybecame significant competitors for a broad range of consumerservices. With the passage of the Depository Institutions Deregu-lation and Monetary Control Act (1980) and the Garn�St. Germain

21Federal Reserve Bank of Chicago
Act (1982), which effectively deregulated the thrift industry,thrifts were authorized to compete with banks in providing thecluster of products previously unique to commercial banking or-ganizations. By the mid-1980s competition from thrifts hadgrown to such a point that the Federal Reserve Board changed itsrules regarding delegation of authority of the Federal ReserveBanks to give thrifts a weight of 50 percent when calculatingconcentration numbers, to reflect both actual and potential com-petition from thrifts. In some cases, it may give 100 percentweight to thrifts when they are significant competitors.
6Healy, Palepu, and Ruback (1991) perform a similar study onnonregulated firms.
7Due to the sample bias problem stemming from this criterion, theresult may not be applicable to small banks.
8An exception is evident, however, for megamergers of equals(shown in table 8). That is, the abnormal returns are significantlysmaller for money center banks with total assets more than $10billion compared with the rest of the population. The smallerstock price gain around the merger date for megamergers ofequals of targets larger than $10 billion may represent a highercost of melding the culture of a large target bank with that of theacquirer.
REFERENCES
Adkisson, J. Amanda, and Donald R. Fraser,1990, �The effect of geographical deregulation onbank acquisition premium,� Journal of FinancialServices Research, Vol. 4, July, pp. 145�155.
Amel, Dean, 1988, �State laws affecting commercialbank branching, multibank holding company expan-sion, and interstate banking,� Board of Governors ofthe Federal Reserve System, working paper.
Bain, Joe S., 1951, �Relation of the profit rate toindustry concentration: American manufacturing,�Quarterly Journal of Economics, Vol. 65, August,pp. 293�324.
Baradwaj, Babu, Donald Fraser, and EugeneFurtado, 1990, �Hostile bank takeover offers,� Journal of Banking and Finance, Vol. 14, No. 6, pp.1229�1242.
Beatty, Randolph P., Anthony M. Santomero, andMichael Smirlock, 1987, �Bank merger premiums�Analysis and evidence,� New York University,Salomon Brothers Center for the Study of FinancialInstitutions, monograph, No. 1987a-3.
Benston, G. J., W. C. Hunter, and L. D. Wall,1995, �Motivations for bank mergers and acquisi-tions: Enhancing the deposit insurance put optionversus earnings diversification,� Journal of Money,Credit, and Banking, August, pp. 777�788.
Berger, Allen N., Robert DeYoung, Hesna Genay,and Gregory F. Udell, 2000, �Globalization of finan-cial institutions: Evidence from cross-border bankingperformance,� in Brookings-Wharton Papers on Finan-cial Services: Toward a Global Financial Market,Washington: Brookings Institution, forthcoming.
Binder, John J., 1988, �The Sherman Antitrust Actand the railroad cartels,� Journal of Law and Eco-nomics, Vol. 31, October, pp. 443�467.
Boyd, John, and Stanley Graham, 1991, �Investi-gating the bank consolidation trend,� QuarterlyReview, Federal Reserve Bank of Minneapolis,Spring, pp. 3�15.
Bradley, Michael, Anand Desai, and E. Han Kim,1988, �Synergistic gains from corporate acquisitionsand the division between the stockholders of targetand acquiring firms,� Journal of Financial Economics,Vol. 21, No. 1, pp. 3�40.
Cetorelli, Nicola, 1999, �Competitive analysis inbanking: Appraisal of the methodologies,� FederalReserve Bank of Chicago, Economic Perspectives,Vol. 23, First Quarter, pp. 2�15.
Cheng, David, Benton Gup, and Larry Wall,1989, �Financial determinants of bank takeovers,�Journal of Money, Credit, and Banking, Vol. 21,No. 4, November, pp. 524�536.
Cornett, Marcia Millon, and Sankar De, 1991a,�Common stock returns in corporate takeover bids:Evidence from interstate bank mergers,� Journal ofBanking and Finance, Vol. 15, No. 2, pp. 273�295.
_________, 1991b, �Medium of payment in corpo-rate acquisitions: Evidence from interstate bankmergers,� Journal of Money, Credit, and Banking,Vol. 23, No. 4, pp. 767�776.
Cornett, Marcia Millon, and Hassan Tehranian,1992, �Changes in corporate performance associatedwith bank acquisitions,� Journal of Financial Eco-nomics, Vol. 31, April, pp. 211�234.
Desai, Anand, and R. D. Stover, 1985, �Bank hold-ing company acquisitions, stockholder returns, andregulatory uncertainty,� Journal of Financial Re-search, Vol. 8, No. 2, pp. 145�156.

22 Economic Perspectives
DeYoung, Robert, 1999, �Mergers and the changinglandscape of commercial banking,� Federal ReserveBank of Chicago, Chicago Fed Letter, September,No. 145.
Dubofsky, D., and Donald R. Fraser, 1989, �Thedifferential impact of two significant court decisionsconcerning banking consolidation,� Journal of Bank-ing and Finance, Vol. 13, July, pp. 339�354.
Eckbo, Espen, and Herwig Langohr, 1989, �Infor-mation disclosure, measure of payment, and takeoverpremiums: Public and private tender offers in France,�Journal of Financial Economics, Vol. 24, October,pp. 363�404.
Fraser, Donald R., and James W. Kolari, 1988,�Pricing small bank acquisitions,� Journal of RetailBanking, Vol. 10, No. 4, Winter, pp. 23�28.
Frieder, Larry A., 1988, �The interstate bankinglandscape: Legislative policies and rationale,� Con-temporary Policy Issues, Vol. 6, April, pp. 41�66.
Healy, Paul M., Krishna Palepu, and Richard S.Ruback, 1991, �Does corporate performance improveafter mergers?,� Journal of Financial Economics,Vol. 31, April, pp. 135�175.
Holder, Christopher L., 1993, �Competitive consid-erations in bank mergers and acquisitions: Economictheory, legal foundation, and the Fed,� Federal ReserveBank of Atlanta, Economic Review, Vol. 78, January/February, pp. 23�36.
Hunter, William C., and Larry Wall, 1989, �Bankmerger motivations: A review of the evidence andexamination of key target bank characteristics,�Federal Reserve Bank of Atlanta, Economic Review,September, pp. 2�19.
Jackson, William E. III, 1992, �Is the market welldefined in bank merger and acquisition analysis?,�The Review of Economics and Statistics, Vol. 74,November, pp. 655�661.
Jensen, Michael, and Richard S. Ruback, 1983,�The market for corporate control: The scientificevidence,� Journal of Financial Economics, Vol. 11,April, pp. 5�50.
Kane, Edward J., 1998, �Megabank mergers andthe too-big-to-fail doctrine: Some preliminary results,�Boston College, unpublished paper.
Kwast Myron L., Martha Starr-McCluer, andJohn D. Wolken, 1997, �Market definition and theanalysis of antitrust in banking,� The Antitrust Bulletin,Vol. 42, Winter, pp. 973�995.
Neely, Walter, 1987, �Banking acquisitions: Acquirerand target shareholder returns,� Financial Manage-ment, Winter, pp. 66�74.
Palia, Darius, 1994, �Recent evidence on bankmergers,� Financial Markets, Institutions, and In-struments, Vol. 3, No. 5, pp. 36�59.
__________, 1993, �The managerial, regulatory, andfinancial determinants of bank merger premiums,�Journal of Industrial Economics, Vol. 41, March,pp. 91�102.
Rhoades, Stephen A., 1987, �Determinants of pre-miums paid in bank acquisitions,� Atlantic EconomicJournal, Vol. 15, No. 1, March, pp. 20�30.
Rogowski, Robert J., and Donald G. Simonson,1989, �Bank merger pricing premiums and interstatebidding,� in Bank Mergers: Current Issues and Per-spectives, Benton E. Gup (ed.), Amsterdam: KluwerAcademic Publishers, pp. 87�106.
Rose, Peter S., 1991, �Bidding theory and bankmerger premiums: The impact of structural and regu-latory factors,� Review of Business and EconomicResearch, Vol. 26, No. 2, Spring, pp. 22�40.
Saunders, A., 1997, Financial Institutions Manage-ment: A Modern Perspective, second edition, Chica-go: Richard D. Irwin.
Savage, Donald T., 1993, �Interstate banking: Astatus report,� Federal Reserve Bulletin, Vol. 73,December, pp. 1075�1089.
Schipper, Katherine, and Rex Thompson, 1983,�The impact of merger-related regulations on theshareholders of acquiring firms,� Journal of Account-ing Research, Vol. 21, Spring, pp. 184�221.
Scholes, Myron, and Joseph Williams, 1977, �Esti-mating betas from nonsynchronous data,� Journal ofFinancial Economics, Vol. 5, No. 3, pp. 309�327.
Shawky, Hany, Tobias Kilb, and Carsten Staas,1996, �Determinants of bank merger premiums,�Journal of Economics and Finance, Vol. 20, No. 1,pp. 117�131.

23Federal Reserve Bank of Chicago
Siems, Thomas, 1996, �Bank mergers and shareholderwealth: Evidence from 1995�s megamerger deals,�Financial Industry Studies, Federal Reserve Bank ofDallas, August, pp. 1�12.
Stultz, R. M., R. Walking, and M. H. Song, 1990,�The distribution of target ownership and the divisionof gains in successful takeovers,� Journal of Finance,July, pp. 817�833.
Sushka, M. E., and Y. Bendeck, 1988, �Bank ac-quisitions and stock holders� wealth,� Journal ofBanking and Finance, Vol. 12, No. 4, pp. 551�562.
Travlos, Nickolaos, 1987, �Corporate takeoverbids, methods of payment, and bidding firms� stockreturns,� Journal of Finance, Vol. 42, September,pp. 943�964.
Trifts, J. W., and K. P. Scanlon, 1987, �Interstatebank mergers: The early evidence,� Journal ofFinancial Research, Vol. 10, No. 4, pp. 305�311.