Embed Size (px)
Citation preview

The Price of Business-as-Usual: The Impacts of Energy Efficiency Beyond
Generation Capacity
Ben Edwards and Bridget Herring
Presented at the 2013 ACEEE National Conference
on Energy Efficiency as a Resource

What is utility-scale energy efficiency?
ian.umces.edu
= kaneva.com

What is utility-scale energy efficiency?
+18,000MW capacity By 2030
$74B
6.5 M homes (+30-50% projected increase)
How much can be offset through EE? 1kW/home?
$74B?
• Builders and weatherization crews • Materials manufacturers
• Energy auditors • Design professionals
Source: DOE 2010, utility IRPs, Census 2010

Generation Additions • Last 15 years = $4.5B on new plant construction
• Next 15 years = $29.8B projected (IRPs/EIA)
• .
Natural Gas 50%
Nuclear 40%
Coal 4%
Renewables 4%
Uprates 2%
Fuel Mix for Planned Capacity Additions by North and South Carolina Utilities, 2010-2030
“We will have to retire and replace virtually every plant by 2050.” - Jim Rogers, Former CEO, Duke Energy

Changes since PBAU 1
• Effect of hydraulic fracturing on gas market
• Rollout of new energy codes
• Duke Power + Progress Energy
• Continuing population growth and construction

Why utility-scale energy efficiency?
• Reduce cost of additional generation, transmission
• Reduce cost of fuel for non-renewables
• Reduce cost of water used for generation
• Add flexibility to load management
• Add resilience to electric infrastructure
• Add jobs in the energy sector

National conservation and pollution reduction economy (“green jobs”)
Adapted from Measuring the Green Economy, 2010 esa.doc.gov

National conservation and pollution reduction economy (“green jobs”)
Adapted from Measuring the Green Economy, 2010 esa.doc.gov
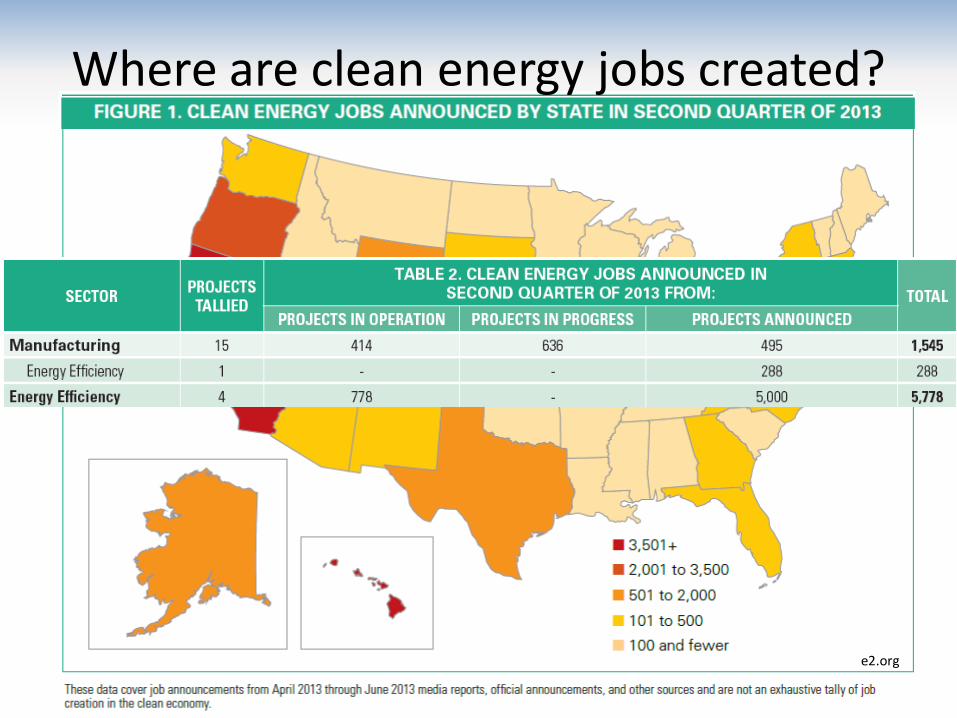
e2.org
Where are clean energy jobs created?

Green Technologies and Practices
Industries <2% total GTP truncated, BLS.gov
IndustryIndustry GTP employment as % of
total GTP employment
Industry GTP employment
as % of total industry
employment
Industry GTP employment
Total GTP employment, all
industries100.00% 0.70% 854,700
Administrative and Waste
Services17.80% 2.00% 151,900
Construction 15.70% 2.30% 134,100
Professional, Scientific, and
Technical Services11.70% 1.30% 99,800
Health Care and Social
Assistance7.50% 0.40% 63,900
Accommodation and Food
Services6.90% 0.50% 58,800
Public Administration 6.80% 0.80% 57,800
Manufacturing 6.70% 0.50% 57,600
Retail Trade 4.60% 0.30% 39,700
Transportation and
Warehousing4.10% 0.70% 35,100
Educational Services 3.60% 0.30% 30,800
Other Services (except
Public Administration)3.20% 0.70% 27,800
Wholesale Trade 2.70% 0.40% 22,900
Agriculture, Forestry, Fishing
and Hunting2.20% 1.50% 18,900
Utilities 2.00% 2.10% 16,800

Regional Green Technologies and Practices
• South has the lowest % of total employment, yet the greatest absolute number.
BLS.gov

NC’s business landscape
NCCommerce.com
Note: Scale

NC renewable and efficiency jobs
• Energy efficient design, construction, and retrofitting account for 7,218 FTE, or 47% of the “clean energy” jobs in the state.
Source: NCSEA 2012

National model, state investment
• $1M spent on EE 2.5 to 8.9 person-years of employment
• What might $74B spent in the Carolinas over a decade do?
Source: LBNL 2012

Energy Efficiency Instead? • EE more durable than generation, transmission
• No Emissions (SOX, NOX, CO2, particulate)
• No water withdrawals for cooling, steam (500gal/kWh)
• Price stability; no surprises in construction
• No fuel instability, risk
“We are investing in new technologies, expanding our use of energy efficiency as the ‘fifth fuel’.” - Jim Rogers, Former CEO, Duke Energy

Other benefits
• Mortgages more secure, property value stabilization
• Save non-renewable resources (uranium, soil, fossil fuels)
• Liquidity in the local economy.

Current Duke Energy models
• Home Energy House Call
– energy audit
• Appliance Recycling
– $30 for white goods
• Power Manager®
– HVAC DSM
• Smart $aver®
– mix of other programs
Glogster.com

Current Duke Energy models
Residential Smart $aver®:
Holistic?
Why install another 4 ton HVAC if the windows still are
terrible?

Current Duke Energy models
Commercial Smart $aver®:
capetown.gov.za
• Low-hanging fruit
• More holistic, but results not measured!
• Proposals welcome.

Political Climate • “A common theme among respondents was the
importance of stability and predictability to the clean energy industry.” NCSEA survey respondents, 2012
• "You have that [energy] hub developing here, and one thing that will bring more companies in is certainty - certainty about what the rules are and that they won't change." House Speaker, Thom Tillis, Charlotte Business Journal, 2013
Wikipedia.com

Next steps
• Confirm the energy efficiency / weatherization potential in NC based on usage and construction data.
• Calculate the actual peak load savings
• Demonstrate the job creation and general economic stimulation from the energy upgrade investment
• Get legislative buy-in
• With the PUC develop incentive programs to make money from energy upgrades.

The Price of Business-as-Usual: The Impacts of Energy Efficiency Beyond
Generation Capacity
Questions?