Embed Size (px)
Citation preview

© OECD/IEA - 2011
The Price of Oil:Fundamentals v Speculation
and Data v Politics
Bahattin BuyuksahinSenior Oil Market Analyst, IEA

© OECD/IEA - 2011
Outline
� Overview of Oil Market
� Determinants of Oil Price
� Inter-Commodity Linkages
� The Role of Speculators� Herding
� Granger Causality
� Markov Switching Model
� Cross Market Linkages
� OPEC Fair Price Announcements

© OECD/IEA - 2011
Quick Overview of Oil Market:
3Source: IEA Oil Market Report
� Exceptional volatility in crude oil prices: down in most of June amid worsening euro zone crisis and higher crude oil supplies, then a sharp rebound on Iran and Norway.
� Muted economic recovery in 2013 supports a 1.0 mb/d rise in oil demand to 90.9 mb/d. While stronger than estimated 0.8 mb/d gain envisaged for 2012, growth remains well below the pre-credit crunch trend. Non-OECD demand overtakes that expected for the OECD in 2013, with 2Q13 the potential inflection point.
� OPEC crude supply falls by 0.1 mb/d, to 31.8 mb/d in June on reduced production in Angola and Iran.
� Non-OPEC supply grew by 0.6 mb/d annually in 1H12, as geopolitical and technical outages dent growth in the Americas.
� Unplanned outages reach around 1.3 mb/d in 2Q12
� May OECD industry oil stocks rose by 15.4 mb to 2 672 mb, lagging a five-year average build of 25.1 mb. Forward demand cover fell by 0.8 days to 58.9 days from April. Preliminary data indicate a 7.2 mb decline in June.
� Global throughputs set to rise 1.4 mb/d from 2Q12 low point of 74.4 mb/d, to 75.8 mb/d in 3Q12
� Weak refinery margins could persist in 2012-2013 as refinery capacity additions again surpass expected demand growth – unless more closures announced.
© OECD/IEA - 2011
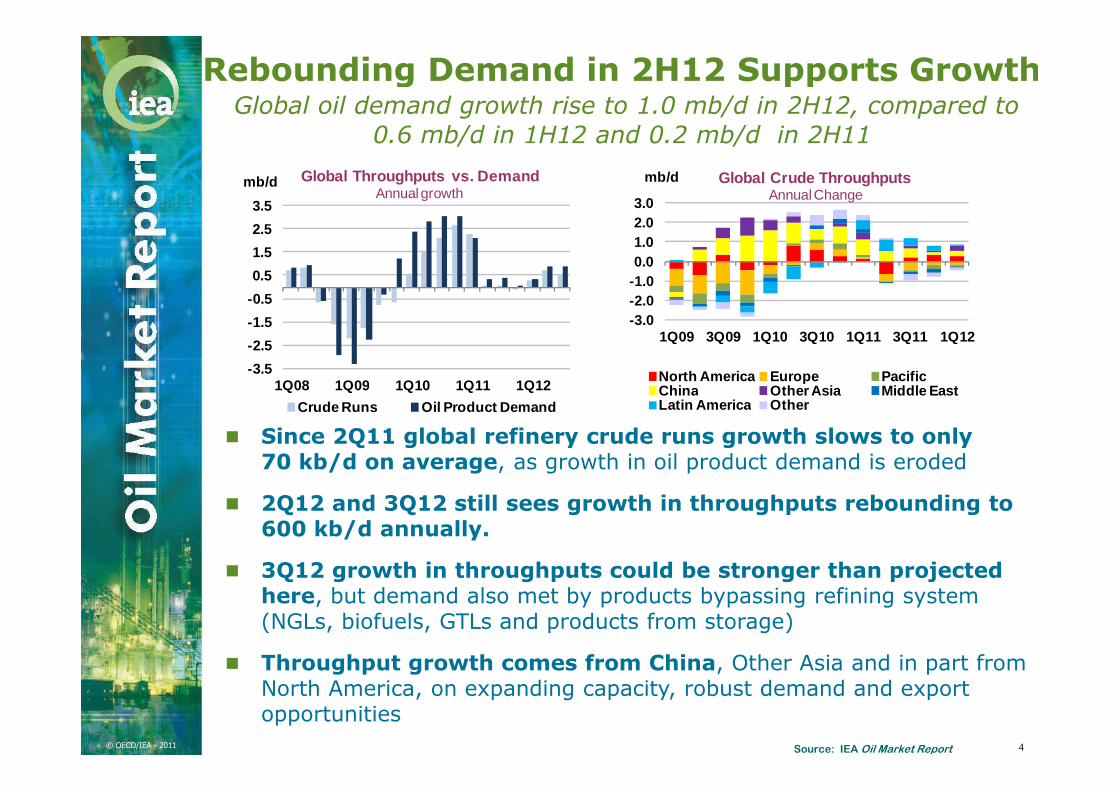
Rebounding Demand in 2H12 Supports GrowthGlobal oil demand growth rise to 1.0 mb/d in 2H12, compared to
0.6 mb/d in 1H12 and 0.2 mb/d in 2H11
� Since 2Q11 global refinery crude runs growth slows to only 70 kb/d on average, as growth in oil product demand is eroded
� 2Q12 and 3Q12 still sees growth in throughputs rebounding to 600 kb/d annually.
� 3Q12 growth in throughputs could be stronger than projected here, but demand also met by products bypassing refining system (NGLs, biofuels, GTLs and products from storage)
� Throughput growth comes from China, Other Asia and in part from North America, on expanding capacity, robust demand and export opportunities
4Source: IEA Oil Market Report
-3.5
-2.5
-1.5
-0.5
0.5
1.5
2.5
3.5
1Q08 1Q09 1Q10 1Q11 1Q12
mb/d Global Throughputs vs. DemandAnnual growth
Crude Runs Oil Product Demand
-3.0-2.0-1.00.01.02.03.0
1Q09 3Q09 1Q10 3Q10 1Q11 3Q11 1Q12
mb/d Global Crude ThroughputsAnnual Change
North America Europe PacificChina Other Asia Middle EastLatin America Other

© OECD/IEA - 2011
Oil Demand Growth +1.0 mb/d in 2013Supported by Modest Uptick in Underlying Economics
5Source: IEA Oil Market Report
� Accelerating from anticipated growth of 0.8 mb/d in 2012
� Chiefly on account of strengthening economic backdrop
� Gaining support from lower futures prices
� Global consumption of 90.9 mb/d assumed in 2013
Oil Demand Growth by Region, 2007-2013
(3)
(2)
(1)
-
1
2
3
4
2007 2008 2009 2010 2011 2012 2013
mb/d
(2.0)
(1.0)
-
1.0
2.0
3.0
OECD China Oth. AsiaM. East Latam OtherWorld (RHS)
% change 2012 2013 2012 2013WORLD 1.1 1.5 WORLD (0.7) (0.5)
OECD 1.6 2.4 OECD (1.1) (0.8) Non-OECD 2.6 3.3 Non-OECD (0.0) (0.1)
Sources: IMF, IEA
Real GDP Growth Current vs. PreviousOMR dated 12 July 2012 OMR dated 12 July 2012

© OECD/IEA - 2011
Tale of Two Markets PersistWhile OECD refiners struggle, non-OECD booms ahead
� OECD refiners struggle with structural decline in demand and poor economics
� 3.5 mb/d of OECD capacity is shut or committed to shut since economic downturn
� Non-OECD refiners, on the other hand, build, expand and able to run at higher rates
30.0
32.0
34.0
36.0
38.0
40.0
42.0
1Q2004 1Q2006 1Q2008 1Q2010 1Q2012
mb/d OECD vs. Non-OECD Crude Runs
OECD Non-OECD
3435363738394041
Jan Mar May Jul Sep Nov Jan
mb/dOECD Total
Crude Throughput
Range 07-11 Average 07 -112011 20122012 est.
3334353637383940
Jan Mar May Jul Sep Nov Jan
mb/dNon-OECD Total Crude Throughput
Range 07-11 Average 07 -112010 20112012 est.

© OECD/IEA - 2011
OECD also See Diverging TrendsWhile Europe struggles with weak demand – US surges ahead
� US surge in runs despite shutdown of Motiva’s new 325 kb/d crude unit in early June. Runs supported by strong product exports. Cheap crude supports Midwest runs, while PADD1 face same problem as Europe (more expensive feedstocks and less efficient plants
� Delta purchase of Marcus Hook Refinery refinery will lift US East Coast runs again after summer
US PADD 1 Refinery Throughputs
0.6
0.8
1.0
1.2
1.4
1.6
1.8
Jan Mar May Jul Sep Nov
mb/d
Range 2007-2011 5-yr Average2011 2012
Source: EIA
11.5
12.0
12.5
13.0
13.5
14.0
Jan Mar May Jul Sep Nov Jan
mb/d OECD Europe Crude Throughput
Range 07-11 Average 07 -112011 2012 est.2012
-2.5-2.0-1.5-1.0-0.50.00.51.01.5
1Q09 3Q09 1Q10 3Q10 1Q11 3Q11 1Q12 3Q12
mb/d OECD Crude ThroughputsAnnual Change
North America Europe Pacific
US Weekly Refinery Throughput
13.5
14.0
14.5
15.0
15.5
16.0
16.5
Jan Mar May Jul Sep Nov
mb/d
Range 2007-2011 5-yr Average2011 2012
Source: EIA
© OECD/IEA - 2011
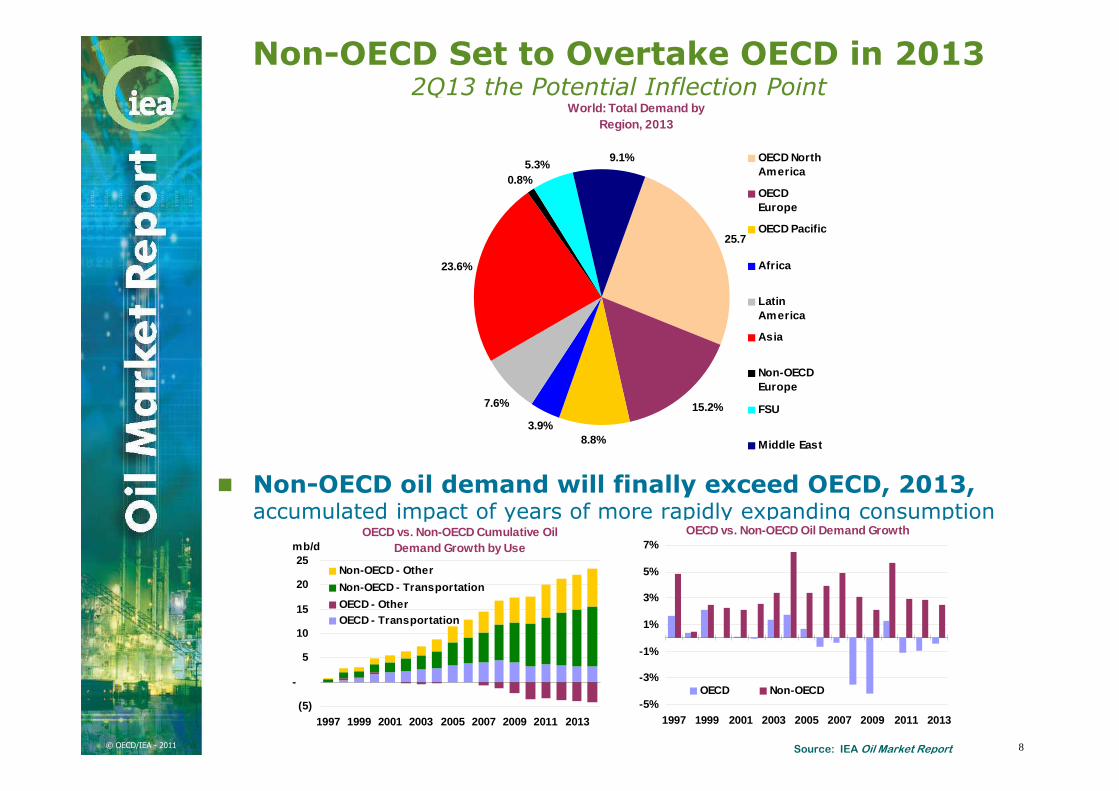
Non-OECD Set to Overtake OECD in 2013 2Q13 the Potential Inflection Point
� Non-OECD oil demand will finally exceed OECD, 2013, accumulated impact of years of more rapidly expanding consumption
8Source: IEA Oil Market Report
World: Total Demand byRegion, 2013
25.7%
15.2%
8.8%3.9%
7.6%
23.6%
0.8%5.3%
9.1% OECD NorthAmerica
OECDEurope
OECD Pacific
Africa
LatinAmerica
Asia
Non-OECDEurope
FSU
Middle East
OECD vs. Non-OECD Cumulative Oil Demand Growth by Use
(5)
-
5
10
15
20
25
1997 1999 2001 2003 2005 2007 2009 2011 2013
mb/d
Non-OECD - Other
Non-OECD - Transportation
OECD - OtherOECD - Transportation
OECD vs. Non-OECD Oil Demand Growth
-5%
-3%
-1%
1%
3%
5%
7%
1997 1999 2001 2003 2005 2007 2009 2011 2013
OECD Non-OECD

© OECD/IEA - 2011
Global Oil Supply fell by 500 kb/d in Junenon-OPEC crude supplies accounted for 75% of the decline
9Source: IEA Oil Market Report
� Compared to a year ago, global oil production stood 2.0 mb/d higher
� All of increase stemmed from higher output of OPEC crude and NGLs
� Risk of outages worldwide persists
OPEC and Non-OPEC Oil Supply Year-on-Year Change
-0.50.00.51.01.52.02.53.03.54.04.5
Mar 11 Jun 11 Sep 11 Dec 11 Mar 12 Jun 12
mb/d
OPEC Crude Non-OPECOPEC NGLs Total Supply
OPEC and Non-OPEC Oil Supply
50
52
54
56
58
60
62
Jan 12 Jul 12 Jan 13 Jul 13
mb/d
28.028.529.029.530.030.531.031.532.0mb/d
Non-OPEC OPEC NGLsOPEC Crude - RS

© OECD/IEA - 2011 Source: IEA Oil Market Report
� OPEC crude oil supplies fell by 0.1 mb/d in June to 31.8 mb/d.
� Angola and Iran posted the largest declines and offset near-record production of 10.15 mb/d from Saudi Arabia
� The ‘call on OPEC crude and stock change’ for 2012 is unchanged at 30.5 mb/d
� The call is not expected to increase in 2013
OPEC Crude Supply Edges Lower In May Output Still Near 4-Year Highs
10
Quarterly Call on OPEC Crude + Stock Change
26
27
28
29
30
31
32
1Q 2Q 3Q 4Q
mb/d
2011 2012 2013Entire series based on OPEC Composition as o f January 2009 onwards (including Angola & Ecuador & excluding Indonesia)
OPEC Crude Oil Production
28
29
30
31
32
Jan Mar May Jul Sep Nov Jan
mb/d
2009 2010 2011 2012
Entire series based on OPEC Composition as of January 2009 onwards (including Ango la & Ecuador & excluding Indonesia)

© OECD/IEA - 2011 Source: IEA Oil Market Report
Iran Oil Exports Lower In May, up in July?
11
� Iranian crude supply declines slightly to 3.2 mb/d in June, around 300 kb/d below end-2011 levels of 3.5 mb/d
� Preliminary tanker data show imports rebounded sharply in June, led by China, to 1.95 mb/d compared with an estimated 1.42 mb/d in May.
� Implementation of full sanctions is assumed to ultimately lead to a cut of some 1 mb/d in Iranian supplies in 2H12 as storage tanks both onshore and offshore reach maximum capacity unless the country finds alternative outlets
� The US has exempted 20 countries from sanctions effective 28 June after demonstrating that they have significantly reduced imports of Iranian crudes
� 180-day waiver intended to allow countries more time to reduce imports from Iran further
0.0
0.5
1.0
1.5
2.0
2.5
3.0
3.5
0.0
0.2
0.4
0.6
0.8
1.0
1.2
1.4
Jan-11Apr-11 Jul-11 Oct-11Jan-12Apr-12
mb/d Iranian Crude Imports
Total - RHS OECD EUROECD PAC China / IndiaOther Non-OECD
?

© OECD/IEA - 2011 Source: IEA Oil Market Report
OPEC Spare Capacity Pegged at 2.38 Mb/dSaudis Hold Near 80% of Spare Capacity
12
� OPEC’s ‘effective’ spare capacity at 2.38 mb/d, with Saudi Arabia accounting for 1.88 mb/d
� 3Q12 OPEC sustainable production capacity expected to increase by 380 kb/d to 35.4 mb/d versus 34.97 mb/d in 2Q12
� Iraq, Angola and Venezuela bring onstream new production
� Smaller increases also seen in Nigeria and Libya
0
1
2
3
4
5
6
7
8
9
2000 2001 2002 2003 2004 2005 2006 2007 2008 2009 2010 2011 2012
mb/d OPEC Spare Capacity
OPEC Effective Spare Capacity Iraq Ven/Nig Libya Iran

© OECD/IEA - 2011
500
650
800
950
1,100
1,250
BFOE* Crude
2010 2011 2012 2013
kb/d
*Includes Brent, Ninian, Forties, ETAP, Ekofisk, Oseberg
North American Supplies Supporting Non-OPEC growth
� Supplies fell by 0.5 mb/d in Q2 from prior year on seasonal decline in global biofuels, unplanned outages
� Unplanned outages reach around 1.3 mb/d in 2Q12
� Mechanical, weather-related outages in the North Sea and Canada
� continued unrest and additional sanctions in Syria,
� pipeline sabotage and labour strikes in Colombia, Oman, and Yemen
� Transit dispute and military unrest between Sudan and South Sudan.
� North American supplies should support non-OPEC supply growth of 0.4 mb/d in 2012
� Downward revision this month due to Norway labor strike, processing gains
13Source: IEA Oil Market Report
BFOE falls under .65 mb/d
-320
-750 -540 -760-1210
-1260-1180
-1020
-2000-1700-1400-1100-800-500-200
1Q11 2Q11 3Q11 4Q11 1Q12 2Q12 3Q12 4Q12kb/d
Non-OPEC Selected Shut-ins & Maintenance
North Sea planned maintenanceUnplanned Outages (N.Sea)Other Unplanned Outages
Unplanned outages

© OECD/IEA - 2011
Non-OPEC Supply to Grow By 0.7 mb/d in 2013Are 2011 & 2012 the new norm?
� US Light Tight Oil (LTO), Canadian Oil Sands, Brazilian Deepwater production largest contributors to growth
� LTO supply from selected plays should reach 1.6 mb/d, a growth of 0.4 mb/d from 2012, and leads to similar growth in total US crude and condensate output to 6.6 mb/d.
� Non-OPEC oil supply projected to rise 0.7 mb/d to 53.9 mb/d in 2013, a return to the magnitude of growth seen in 2009/2010 and 2000-2004
14Source: IEA Oil Market Report
-0.5
-0.1
0.3
0.7
1.1
1.5
1Q12 3Q12 1Q13 3Q13
mb/d Non-OPEC Supply - Yearly Change
OECD FSUNon -OECD Asia LAMOther Total
-0.6-0.3
0.00.3
0.6
0.91.2
1.5
2001 2003 2005 2007 2009 2011 2013
mb/d Non-OPEC Supply - Yearly Change
Crude NGLProcessing Gains Non-convGlobal Biofuels Total

© OECD/IEA - 2011
OECD Total Oil Stocks Days of Forward Demand
51535557596163
Jan Mar May Jul Sep Nov Jan
days
Range 2007-2011 Avg 2007-2011
2011 2012
OECD Commercial Oil InventoriesRose in May but Declined in June
� May OECD industry stocks rose by 15.4 mb, to 2 672 mb, a milder increase than the five-year average of 25.1 mb
� OECD commercial oil stocks have risen since February 2012, in line with seasonal trends
� Days of forward demand cover fell by 0.8 day to 58.9 days m-o-m, but still 1.4 days above the five-year average
� Crude and product inventories increased by 8.0 mb and 8.3 mb, respectively
� Preliminary data indicate a 7.2 mb decrease in June OECD industry inventories
15Source: IEA Oil Market Report
OECD Total Oil Stocks
2,500
2,550
2,600
2,650
2,700
2,750
2,800
Jan Mar May Jul Sep Nov Jan
mb
Range 2007-2011 Avg 2007-20112011 2012

© OECD/IEA - 2011
North American Industry Oil Inventories Rose both in May and June
� May North American industry oil stocks rose by 21.4 mb to 1 353 mb, in line with a seasonal build of 18.0 mb
� Crude and product inventories increased by 6.7 mb and 14.7 mb, respectively
� US oil inventories increased by 10.8 mb in June
� Crude oil inventories declined by 1.7 mb while refined product inventories rose by 13.8 mb
� Crude levels at Cushing edged down by 0.1 mb but remained just shy of recent record highs
16Source: IEA Oil Market Report
US Weekly Cushing Crude Stocks
101520253035404550
Jan Apr Jul Oct
mb
Range 2007-11 5-yr Average2011 2012
Source: EIA
OECD North America Total Oil Stocks
1,150
1,200
1,250
1,300
1,350
1,400
1,450
Jan Mar May Jul Sep Nov Jan
mb
Range 2007-2011 Avg 2007-20112011 2012

© OECD/IEA - 2011
OECD Europe Total Oil Stocks Days of Forward Demand
56
61
66
71
Jan Mar May Jul Sep Nov Jan
days
Range 2007-2011 Avg 2007-2011
2011 2012
European Commercial Inventories decreased both in May and June
� May European Industry oil stocks fell by 18.6 mb to 904 mb, in contrast with a five-year average 2.6 mb build
� Moreover, forward demand cover in Europe has tightened after nine months at above traditional seasonal levels
� Crude and product inventories fell by 6.4 mb and 10.8 mb, respectively
� June preliminary data show a 12.5 mb stock draw
� Crude and product inventories fell by 7.1 mb and 5.4 mb, respectively
17Source: IEA Oil Market Report
OECD Europe Total Oil Stocks
880900920940960980
1,0001,020
Jan Mar May Jul Sep Nov Jan
mb
Range 2007-2011 Avg 2007-20112011 2012

© OECD/IEA - 2011
Futures Markets Exceptionally Volatile in June
� Downturn in crude oil prices in most of June, amid worsening euro zone crisis and rising global inventory. In the third week of June, Brent touched 18-month lows below $90/bbl, while WTI fell below $80/bbl for the first time since October 2011
� This trend reversed towards the end of the month and early July on rising tensions between Iran and the international community and a threat of Norwegian offshore production shutdown due to workers’ strike
18Source: IEA Oil Market Report
70
80
90
100
110
120
130
Jun 11 Sep 11 Dec 11 Mar 12 Jun 12
$/bblCrude Futures
Front Month Close
NYMEX WTI ICE Brent
Source: ICE, NYMEX 9095
100105110115120125130
M1 2 3 4 5 6 7 8 9 10 11 12
$/bbl ICE BrentForward Price Curve
06 Apr 12 07 May 1206 Jun 12 06 Jul 12
Source: ICE

© OECD/IEA - 2011
Brent Futures in ContangoBrent M1-M12 Down to $-2.17/bbl in the Third Week of June
� Brent futures contracts flipped to contango for about 10 days after trading in backwardation for more than 15 months
� Brent M1-M12 backwardation narrowed sharply in June, before rebounding in the first week of July to an average $1.58/bbl
� Increased crude supplies in Europe from West Africa, Libya, Iraq and Saudi Arabia, continue to add downward pressure on the front end of the forward curve for Brent
� The sharp downturn in oil prices over the month also saw a decoupling from key financial indicators such as the S&P
19Source: IEA Oil Market Report
-15
-10
-5
0
5
10
Oct 10 Apr 11 Oct 11 Apr 12
$/bblCrude Futures
Forward Spreads
WTI M1-M12 Brent M 1-M12
Source: ICE, NYMEX
1000
1100
1200
1300
1400
1500
60
70
80
90
100
110
120
Jan 10 Jul 10 Jan 11 Jul 11 Jan 12 Jul 12
IndexUS$/bbl NYMEX WTI vs S&P 500
NYMEX WTI S&P 500 (RHS)
Source: NYMEX

© OECD/IEA - 2011
Spot Crude Oil Prices Down and Up in June
� Spot crude oil prices continued their trend from May and plummeted by around $13-17/bbl in June on rising global oil supplies and worsening economic outlook
� North Sea Dated fell by $15.45/bbl, to an average $94.80/bbl, supported by plentiful supplies of African light crudes in Europe before rebounding to above $100/bbl on fears of a complete shutdown in the Norwegian North Sea
� Implementation of Iran sanctions on 1 July triggered an increase in demand for Urals crude. The discount for Urals to Brent in the Mediterranean narrowed to just -$0.10/bbl in the first week of July
20Source: IEA Oil Market Report
-4
-3
-2
-1
0
1
Jun 11 Sep 11 Dec 11 Mar 12 Jun 12
$/bbl UralsDifferentials to North Sea Dated
Urals (NWE) Urals (Med)
Copyright © 2012 Argus Media Ltd
© OECD/IEA - 2011
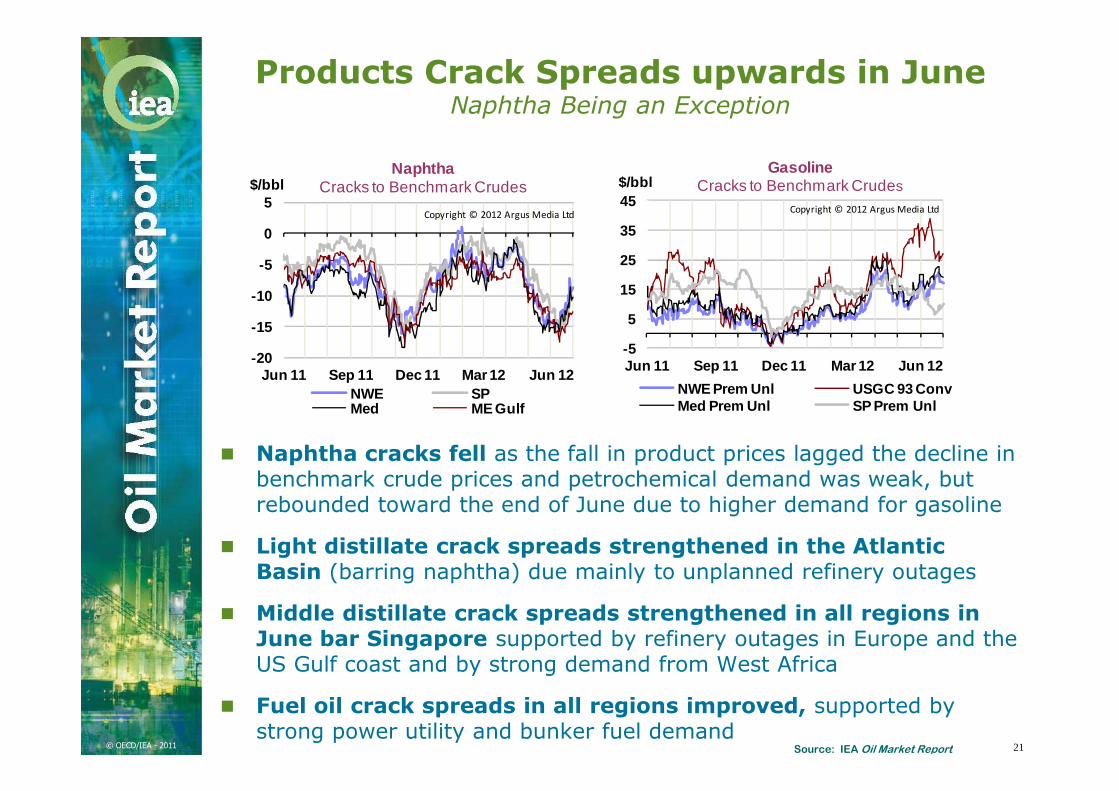
Products Crack Spreads upwards in June Naphtha Being an Exception
� Naphtha cracks fell as the fall in product prices lagged the decline in benchmark crude prices and petrochemical demand was weak, but rebounded toward the end of June due to higher demand for gasoline
� Light distillate crack spreads strengthened in the Atlantic Basin (barring naphtha) due mainly to unplanned refinery outages
� Middle distillate crack spreads strengthened in all regions in June bar Singapore supported by refinery outages in Europe and the US Gulf coast and by strong demand from West Africa
� Fuel oil crack spreads in all regions improved, supported by strong power utility and bunker fuel demand
21Source: IEA Oil Market Report
-20
-15
-10
-5
0
5
Jun 11 Sep 11 Dec 11 Mar 12 Jun 12
$/bblNaphtha
Cracks to Benchmark Crudes
NWE SPMed ME Gulf
Copyright © 2012 Argus Media Ltd
-5
5
15
25
35
45
Jun 11 Sep 11 Dec 11 Mar 12 Jun 12
$/bblGasoline
Cracks to Benchmark Crudes
NWE Prem Unl USGC 93 ConvMed Prem Unl SP Prem Unl
Copyright © 2012 Argus Media Ltd
© OECD/IEA - 2011
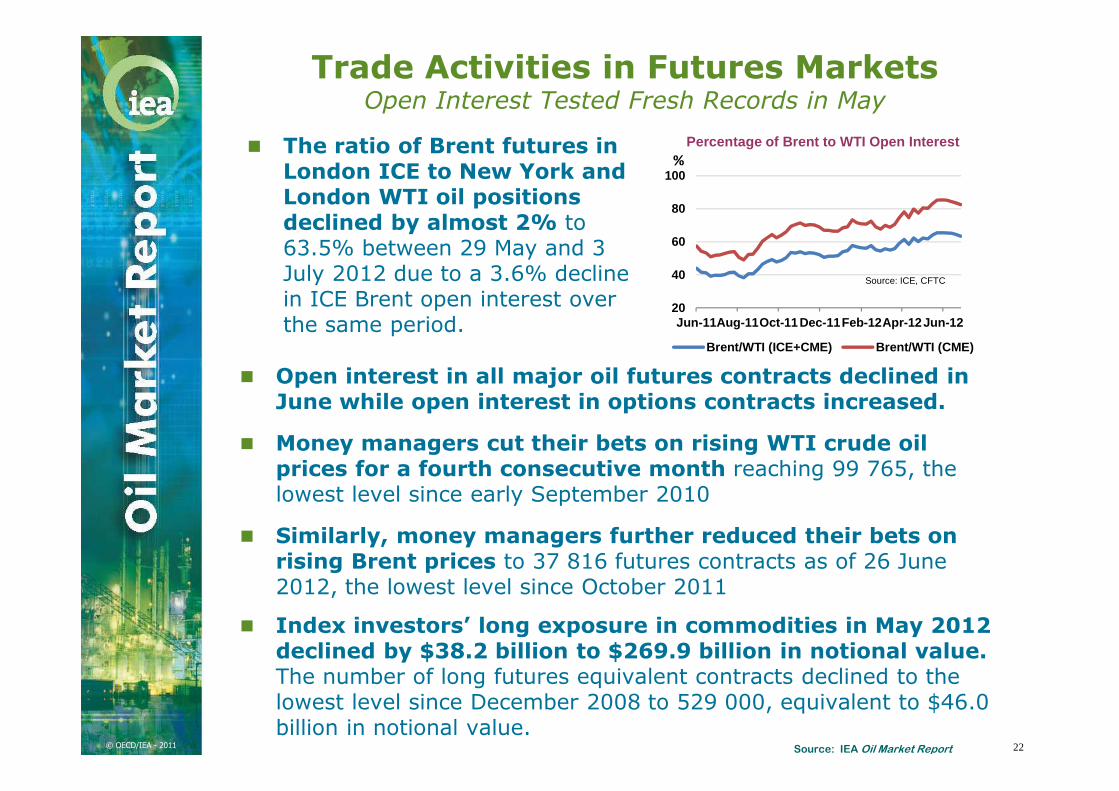
Trade Activities in Futures MarketsOpen Interest Tested Fresh Records in May
� Open interest in all major oil futures contracts declined in June while open interest in options contracts increased.
� Money managers cut their bets on rising WTI crude oil prices for a fourth consecutive month reaching 99 765, the lowest level since early September 2010
� Similarly, money managers further reduced their bets on rising Brent prices to 37 816 futures contracts as of 26 June 2012, the lowest level since October 2011
� Index investors’ long exposure in commodities in May 2012 declined by $38.2 billion to $269.9 billion in notional value. The number of long futures equivalent contracts declined to the lowest level since December 2008 to 529 000, equivalent to $46.0 billion in notional value.
22Source: IEA Oil Market Report
� The ratio of Brent futures in London ICE to New York and London WTI oil positions declined by almost 2% to 63.5% between 29 May and 3 July 2012 due to a 3.6% decline in ICE Brent open interest over the same period.
20
40
60
80
100
Jun-11Aug-11Oct-11Dec-11Feb-12Apr-12Jun-12
%
Brent/WTI (ICE+CME) Brent/WTI (CME)
Percentage of Brent to WTI Open Interest
Source: ICE, CFTC

© OECD/IEA - 2011
Global Crude Refinery Demand Seasonal low less so than normal, runs still set to rise sharply
through August
� Global refinery crude throughputs were revised higher for April(+300 kb/d) , now show less of a dip than normal
� Global crude demand still set to rise sharply through 2Q, by 2.4 mb/d from April to August
� In all, global throughputs are seen averaging 74.4 mb/d in 2Q12, rising to 75.8 in 3Q12
� A quarterly increase of 1.4 mb/d from 2Q12 shoulder season to 3Q12 peak is in line with historical trends (bar 2008/2009 recession years).
23Source: IEA Oil Market Report
71
72
73
74
75
76
77
Jan Mar May Jul Sep Nov Jan
mb/dGlobal RefiningCrude Throughput
Range 07-11 Average 07-112011 2012 est.
-2.0-1.5-1.0-0.50.00.51.01.52.0
1Q 2Q 3Q 4Q
mb/d Global Crude RunsQuarterly Change
2005 2006 2007 20082009 2010 2011 2012

© OECD/IEA - 2011
2012-2013 Refinery Capacity Overhang Suggest Weak Margins for Some
� After relatively little net refinery capacity growth in 2011 (0.4 mb/d), 2012 and 2013 see 1 mb/d and 1.3 mb/d new distillation capacity added, respectively.
� OECD rationalisation continues, Europe shut total of 1.6 mb/d since 2008, 3.5 mb/d total OECD.
� Additions largely surpass expected demand growth, suggesting weak margins to remain, unless further closures are announced or demand surprise to the upside
� Upgrading and desulphurisation capacity additions add 2.6 mb/d and 2.8 mb/d, respectively, in the two year period.
-1.0
0.0
1.0
2.0
2011 2012 2013
mb/d Crude Distillation Additions
OECD ChinaOther Asia Middle EastLatin America Other Non -OECDNet Additions
0.0
0.5
1.0
1.5
2011 2012 2013
mb/d Refinery Capacity Additions vs Demand Growth
Capacity increase Demand Growth

© OECD/IEA - 2011
Oil prices feed off multiple influences
Oil priceformation
OPEC policy Geopolitics
Expansion bottlenecks
Supply costs
Spare capacity
u/s
Spare capacity d/s - by
typeInventory
Demand growth, volume
and type
Price subsidies
Evolving crude slate
& env. regulations
.
Price elasticity
Macro-financial
Micro-financial
� Commodity financial markets aren’t a primary price driver, but amplify physical market impacts
� Financial impacts very short term compared to fundamentals
� Price inelasticity of supply & demand is key
� So too the influence of downstream factors
� 3* demand multiplier if incremental barrels sourced from simple refining capacity© OECD/IEA 2010

© OECD/IEA - 2011
Can +70% Price Change Be Justified by Fundamentals?
� “Prices cannot fall by 75% when you have a decline in demand of only 5%. Clearly, prices are driven by something other than fundamentals, i.e. speculation”
� But a highly inelastic supply curve can mean a tiny demand fluctuation causes highly volatile price changes
� Equally, inelastic demand means a small disruption or curtailment in oil supply could cause prices to move substantially
SD'D
P'
P
Q Q'
S
D'D
P'P
Q Q'
Price
PriceQuantity
Quantity

© OECD/IEA - 2011
Highly Inelastic Oil Demand & Supply
� Oil demand and supply likely to be completely inelastic due to the structure of the oil market and pricing practice in the industry in the short run
� This ensures that factors other than fundamentals can drive the price
� But the “sustainable” price “level” is always set by fundamentals
A Schematic Illustration of the Short-Term Demand and Supply Curves
The range "P" indicates that price "level" is set by fundamentals, but vertical shape of demand and supply curves within the range
ensures that other forces may dictate daily clearing prices.
S
D
P
Q
Price
Quantity
D
S
Price Level
S
D
P
Q
Price
Quantity
D
S
D
S
D
S
Price Level
Changes in
fundamenals

© OECD/IEA - 2011
0
100
200
300
400
500
Jul 07 Jul 08 Jul 09 Jul 10 Jul 11
$bn Institutional and retail commodity asset under management (AUM)
Medium term notesExchange traded products Commodity index swaps
Source: Barclays Capital
WTI Crude Oil Treasury Bill Treasury Bond GSCI GSCI Ene rgy S&P 500
WTI Crude Oil 1.000 -0.027 -0.027 0.840 0.883 -0.020
Treasury Bill -0.109 1.000 0.650 -0.013 -0.007 0.063
Treasury Bond 0.017 0.312 1.000 -0.008 -0.005 0.053
GSCI 0.877 -0.180 0.022 1.000 0.965 -0.008
GSCI Energy 0.891 -0.148 0.054 0.987 1.000 -0.013
S&P 500 0.522 -0.221 0.015 0.689 0.653 1.000
Weekly Returns Correlations (1991-2008: Upper Trian gle; 2008-2011: Lower Triangle)
� Investor commodity exposure rises ���� inflation & dollar hedge
� Driven by traditional rel. for commodities/other assets, commods./inflation
� Recent +ve correlation for commodities & other assets raises questions over asset class theory, portfolio diversification
� Will investor appetite for commodities sustain co-movements?
Will commodities remain an asset class in their own right?

© OECD/IEA - 2011
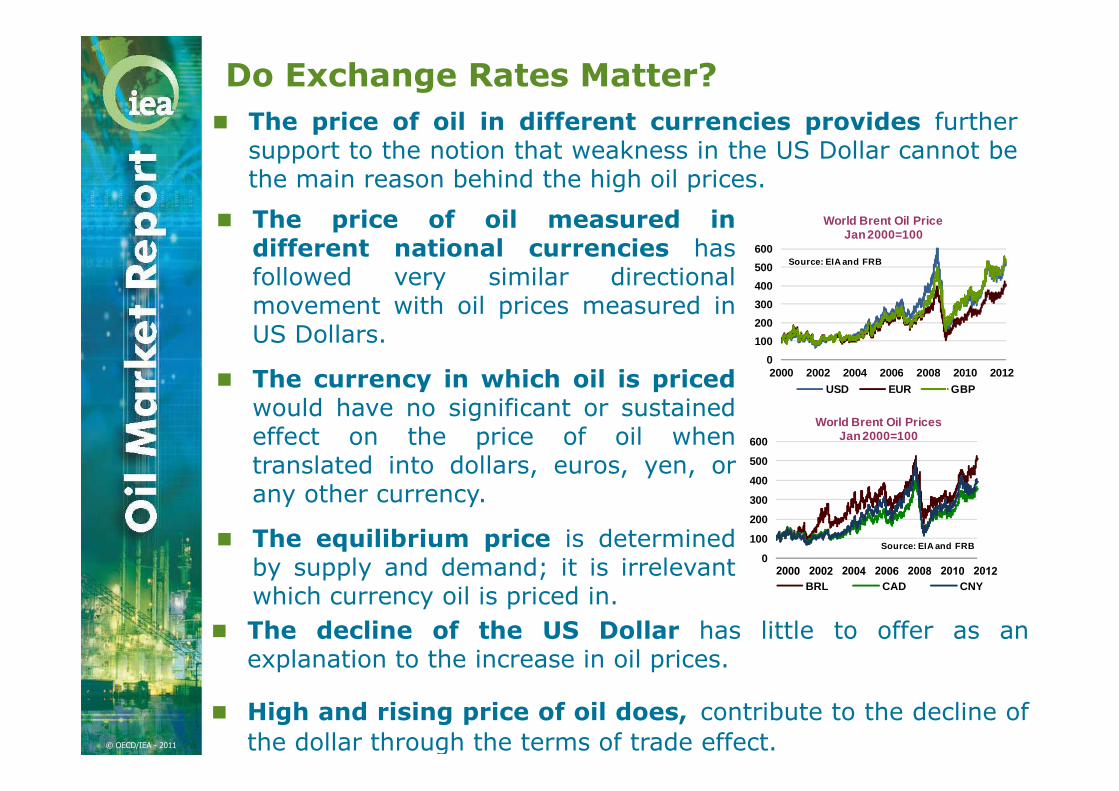
Do Exchange Rates Matter?
� US dollar weakness in recentyears is frequently cited asone reason for high oilprices. Empirically, there isclearly an inverse correlationbetween oil prices and exchangerates – that is, other thingsbeing equal, oil prices rise if thedollar falls.
-0.80
-0.60
-0.40
-0.20
0.00
0.20
0.40
Correlation Between Oil Price and Effective Exchange Rate
100-day Moving Average Correlation
Source: EIA and FRB
� However, this explanation is challenged by the empiricalobservations that (a) a change in oil price tends to lead to achange in the exchange rate as predicted by economic theoryand (b) the oil price has risen regardless of what currency unitone uses to measure the price of oil.

© OECD/IEA - 2011
Do Exchange Rates Matter?
� Inverse correlation between oil prices and exchangerates has been relatively strong in recent years, although thenegative correlation has been declining in recent months.
• However, the direction of causality tends to run from oil prices to exchange rate. This is consistent with the traditional terms of trade argument on the relationship between exchange rates and oil prices.
� However, reverse causation is possible
• A weaker dollar might lead to an increase in the demand for oil in non-dollar economies
• Investors increase demand for commodities as a hedge against inflation when the dollar falls
• Or, both exchange rate and oil prices might be reacting to some other common factor, e.g. expansionary monetary policy
© OECD/IEA - 2011
Do Exchange Rates Matter?
� The price of oil in different currencies provides furthersupport to the notion that weakness in the US Dollar cannot bethe main reason behind the high oil prices.
0
100
200
300
400
500
600
2000 2002 2004 2006 2008 2010 2012
World Brent Oil PriceJan 2000=100
USD EUR GBP
Source: EIA and FRB
0
100
200
300
400
500
600
World Brent Oil Prices Jan 2000=100
BRL CAD CNY
Source: EIA and FRB
� The price of oil measured indifferent national currencies hasfollowed very similar directionalmovement with oil prices measured inUS Dollars.
� The currency in which oil is pricedwould have no significant or sustainedeffect on the price of oil whentranslated into dollars, euros, yen, orany other currency.
� The equilibrium price is determinedby supply and demand; it is irrelevantwhich currency oil is priced in.
� The decline of the US Dollar has little to offer as anexplanation to the increase in oil prices.
� High and rising price of oil does, contribute to the decline of
the dollar through the terms of trade effect.

© OECD/IEA - 2011
Volatility in Crude Oil Prices� Prices for oil, like those for many other commodities, are inherently
volatile and volatility itself varies over time
� Examination of historical patterns shows volatility observed during 2008-2009 is actually lower than the peak observed in 1990-1991
� Pattern: Volatility increasing as oil prices decline and volatility declining as oil prices increase,
• is consistent with the empirical evidence in the stock market
0
20
40
60
80
100
120
140
160
0
2
4
6
8
10
12
1987 1991 1995 1999 2003 2007 2011
$/bbl%
Prices and Return Volatility: Brent Crude Oil
Volatility (GARCH(1,1) Brent Price
Source: EIA
� Conditional volatility estimation also suggests that the increase in volatility observed during 2008-2009 was a temporary phenomenon and that volatility in the oil market remains consistent with historical averages
� The apparent increase in the volatility of oil prices during 2008-2009 raises questions about the determinants of volatility in oil markets
• It has been argued that the emergence of a new class of financial traders, as well as increased participation of non-commercial traders in crude oil derivatives markets, has transformed the oil market into an intrinsically more volatile market.

© OECD/IEA - 2011
Volatility: Not Unique to Exchange-Traded Commodities
� A comparision of non-exchange-traded commodity price index, as well as crude oil price series, supports the notion that, starting in 2003 and more strongly after 2004, a demand shock pushed upward the prices of most commodities.
• Prices for non-exchange-traded commodities rose faster than crude oil prices between 2006 and 2008
• Commodity prices (of both crude oil and non-exchange-traded commodities) declined sharply amid the economic contraction of autumn 2008 and stabilised after 2009.
• Fall in crude prices to below $40/bbl in early 2009 was something of an under-shoot, and that subsequent recovery has been more in line with the strengthening evident across commodities in light of the economic recovery
33
0 1000 2000 3000
RiceTungsten
ManganeseCoal
Crude OilCobalt
RhodiumCadmium
∆%
Performance of Crude Oil and Non-Exchange-Traded Commodities
Highest -to -Lowest Price (2000 -2010 period)Price Change (Over 2000-2010 Period)
Source: Bloomberg 0
100
200
300
2000 2002 2004 2006 2008 2010
Non-Exchange-Traded Commodity Prices vs Crude Oil Prices
Crude OilNon -Exchange -Traded Commodity Index
Source: BloombergBase Year: 2005=100

© OECD/IEA - 2011
Volatility in commodities rose sharply after 2006
� Non-exchange-traded commodities’ index volatility experienced a large spike in early 2007 while crude oil prices were still relatively stable
� Unusually high volatility in commodity markets post-2007 does not appear unique to crude oil traded on exchanges
� Other commodities that are not traded in exchanges experienced similar fluctuations and price surges in the second part of 2000s.
� Volatility declined for both crude and non exchange-traded commodities once again through 2010.
� This is not to say that the trading of futures and derivatives contracts on exchanges has no impact on price levels and volatility.
� However, it does suggest that a more holistic and refined set of policy responses than simply ‘driving out the speculator’ may be needed to achieve more stable and predictable markets.
34

© OECD/IEA - 2011
Hedgers, Speculators and ‘Excessive’ Speculation
� Speculators provide immediacy and facilitate the needs of hedgers by mitigating price risk, add to overall trading volume, which contributes to more liquid and well-functioning markets
� Even when speculators trade with one another, the greater liquidity resulting from this ‘excess speculation’ should decrease hedgers’ trading costs
� Optimal level of speculation?
� If long and short hedgers’ positions in a given commodity futures market were exactly balanced, speculators would not be needed in that market
� Because long and short hedgers do not always trade simultaneously or in the same quantity, however, speculators must step in to fill the unmet hedging demand
� Also, speculators hold a range of views about the future and take positions on both sides of the market
� As a result, speculative activity almost always substantially exceeds the level required to offset any unbalanced hedging
1
1.1
1.2
1.3
1.4
1.5
2001
2002
2003
2004
2005
2006
2007
2008
2009
2010
2011
WTI Crude Oil Speculative Index
© OECD/IEA - 2011
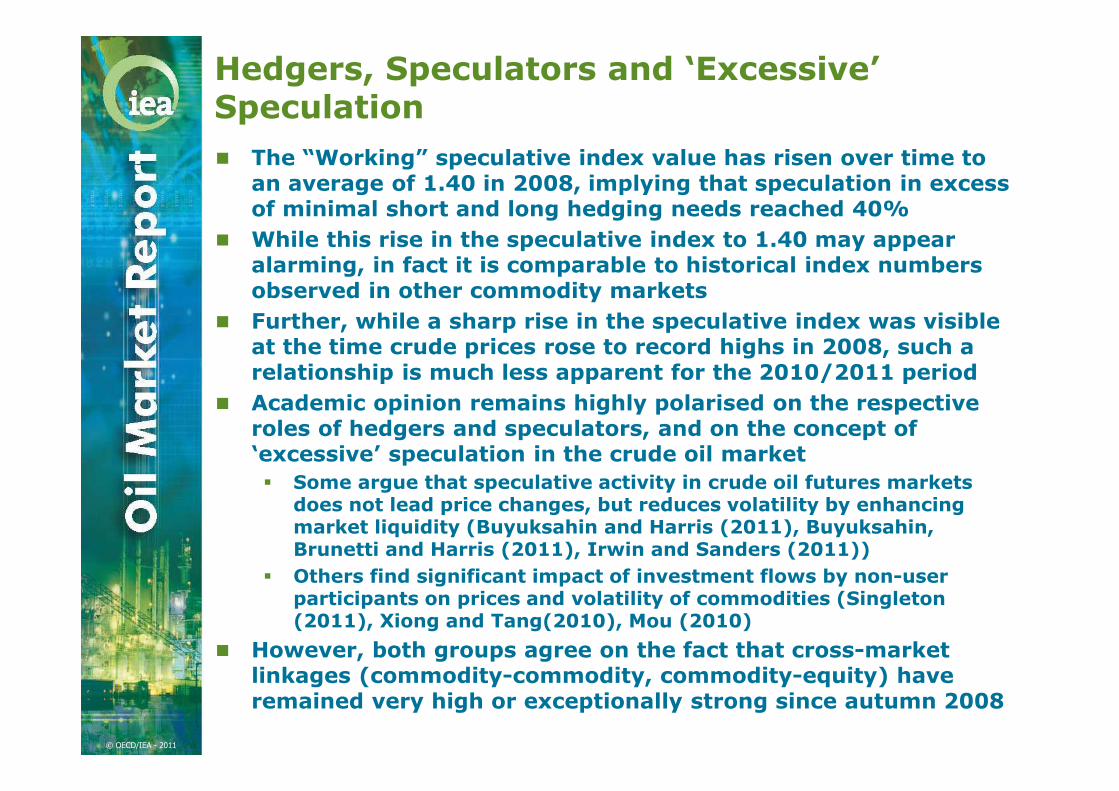
Hedgers, Speculators and ‘Excessive’ Speculation
� The “Working” speculative index value has risen over time to an average of 1.40 in 2008, implying that speculation in excess of minimal short and long hedging needs reached 40%
� While this rise in the speculative index to 1.40 may appear alarming, in fact it is comparable to historical index numbers observed in other commodity markets
� Further, while a sharp rise in the speculative index was visible at the time crude prices rose to record highs in 2008, such a relationship is much less apparent for the 2010/2011 period
� Academic opinion remains highly polarised on the respective roles of hedgers and speculators, and on the concept of ‘excessive’ speculation in the crude oil market
� Some argue that speculative activity in crude oil futures markets does not lead price changes, but reduces volatility by enhancing market liquidity (Buyuksahin and Harris (2011), Buyuksahin, Brunetti and Harris (2011), Irwin and Sanders (2011))
� Others find significant impact of investment flows by non-user participants on prices and volatility of commodities (Singleton (2011), Xiong and Tang(2010), Mou (2010)
� However, both groups agree on the fact that cross-market linkages (commodity-commodity, commodity-equity) have remained very high or exceptionally strong since autumn 2008

© OECD/IEA - 2011
Physical and Financial Market Linkages� Price discovery generally takes place in derivatives
markets, which themselves use perceptions on current physical demand and supply conditions as well as expectations of future conditions
� Increased correlations among commodities and equities
� They might be responding to common shocks, such as expectation of higher growth in China and other emerging countries
� Or investment by institutional investor help bring these two different markets into sync
� Empirical studies generally show no causal linkages from speculators’ futures market position to prices
� However, the lack of information about OTC markets make these studies’ finding questionable.
� The increased forays by both physical and financial market players into each others’ market make these two markets dependent, and estimating relative importance in price formation almost impossible.

© OECD/IEA - 2011
Economic Studies I: Inter-Commodity Linkages
� “Fundamentals, Trader Activity and Derivative Pricing”
� Buyuksahin, Haigh, Harris, Overdahl, and Robe
� Focus on Swap Dealer participation
� From commodity index trading in nearby futures
� From OTC positions in back-dated futures
� Cointegration of Crude Oil futures prices
� Result in “better” pricing for hedgers in 1-year and 2-year contracts
� Supports the notion that markets should encourage broad participation

© OECD/IEA - 2011
Overview
� Do ST and LT commodity futures move in sync?� Theory: yes (cost of carry relation ���� stable relation)
� Empirics: requires long series of backdated futures prices
� We focus on WTI sweet crude oil futures
� What do we find?
� ST and MT prices (<9 months) cointegrated since early 1990s
� LT contracts (>1 year):
� Before 2002: not cointegrated with nearby
� Since mid-2004: cointegration!
� + survives crisis
� Why the transformation?� Changes in level & structure of market activity? Yes
� Role of “fundamentals”? Yes

© OECD/IEA - 2011
NYMEX Crude Oil Futures (WTI)
Nearby, 1-yr and 2-yr Prices: 2000-2011
0
20
40
60
80
100
120
140
160

© OECD/IEA - 2011
Cointegration – Idea
� Futures prices should be cointegrated (i.e., there ought to be a stable LT relationship between different-maturity futures), simply through the cost-of-carry model:
Ft = St e(r+u-y)t
Where r = Interest rate
u = Storage costs
y = Convenience yield
t = Time to maturity
� Cointegration tests for a statistically significant link between futures prices (Ft ) at different horizons (t)

© OECD/IEA - 2011
Data
� Our focus:
� Nearby, 1- and 2-year WTI futures prices (“LT with nearby”)
� Also, check 2 to 9 months futures (“ST or MT with
nearby”)
� Prices
� Tuesday settlement prices (weekly analysis)
� Time period
� Prices for up to 1-year futures: March 1989 to May 2011
� Prices of 2-year futures: July 1995 to May 2011

© OECD/IEA - 2011
Table 3A: Order of Co-integration
� At most one co-integrating vector
� Robust to using 1995-2008 vs. 1995-2011
data
Panel A: Trace tests on order of cointegration
λtrace test statistic
HO: critical value(p-value)
50.93 r = 0 34.10 (0.000)
22.91 r ≤ 1 19.87 (0.020)
4.72 r ≤ 2 8.47 (0.323)

© OECD/IEA - 2011
Table 3B: LT & ST Parameter Tests
� Cannot reject that the 1-yr and 2-yr prices are not
part of the cointegrating relationship (economic
reasons to keep them)
� Nearby is weakly exogenous
� w.r.t. the short-run adjustment to the long-run relation, the
1- and 2-yr prices do all of the adjusting to perturbations in
the cointegrating space
Panel B: Tests for exclusion from the cointegrating vector
HO: value (p value)
Nearby βN = 0 3.115 (0.078)1 yr contract β1 = 0 0.969 (0.325)2 yr contract β2 = 0 0.468 (0.494)
Panel C: Tests for weak exogeneity
HO: value (p value)
Nearby αN = 0 0.198 (0.656)1 yr contract α1 = 0 6.63 (0.01)2 yr contract α2 = 0 6.08 (0.01)
2
)1(χ
2
)1(χ

© OECD/IEA - 2011
Identifying Changing Cointegration
� Recursive Cointegration Analysis
� Hansen & Johansen (1993)
� Highlights changes in LT relationship between the three price series (one co-integrating vector)
� Steps to recover the “R representation” (ECM)
� 1. Use full sample to estimate ST parameters (αααα)
� 2. Keeping ST estimates fixed, re-estimate LT parameters (ββββ)
� Start with a 3 years (“burn-in”) period to
calculate initial trace
� Adding one week at a time, recalculate trace;
then, repeat
© OECD/IEA - 2011
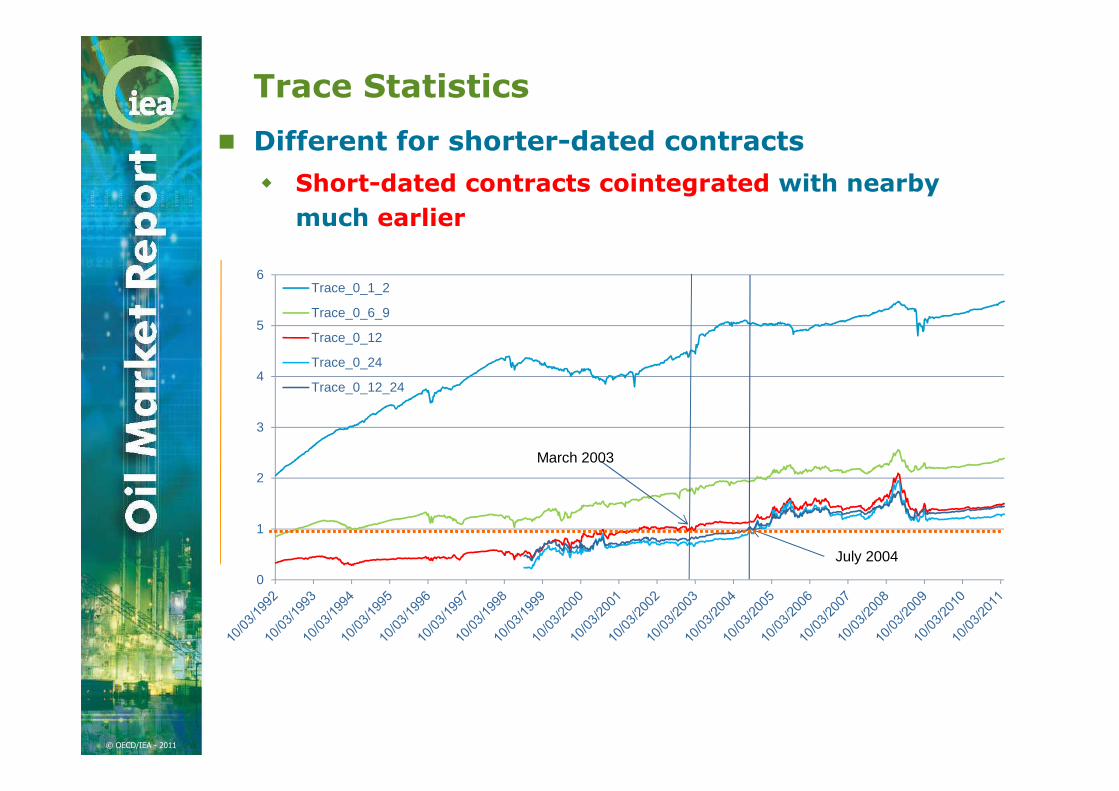
Trace Statistics
� Different for shorter-dated contracts
� Short-dated contracts cointegrated with nearby
much earlier
0
1
2
3
4
5
6Trace_0_1_2
Trace_0_6_9
Trace_0_12
Trace_0_24
Trace_0_12_24
March 2003
July 2004

© OECD/IEA - 2011
Idea #1
Cointegration stems from cost-of-carry relation:
Ft = St e(r+u-y)t
���� Fundamentals may have changed, affecting
� either the stochastic process driving the spot
price
� Bessembinder et al, JF ’95
� or the process for the net cost-of-carry
� Brenner & Kroner, JFQA ’95

© OECD/IEA - 2011
Hyp.#1: Demand Shock for Commodities?
Price index using equally-weighted average return on 8 non-
exchange-traded commodities (1990 = 100)
-
50.00
100.00
150.00
200.00
250.00
300.00
350.00
Nominal LPI series (excl coal)
Real LPI series (deflated with US CPI, incl. food & energy)
July 2008

© OECD/IEA - 2011
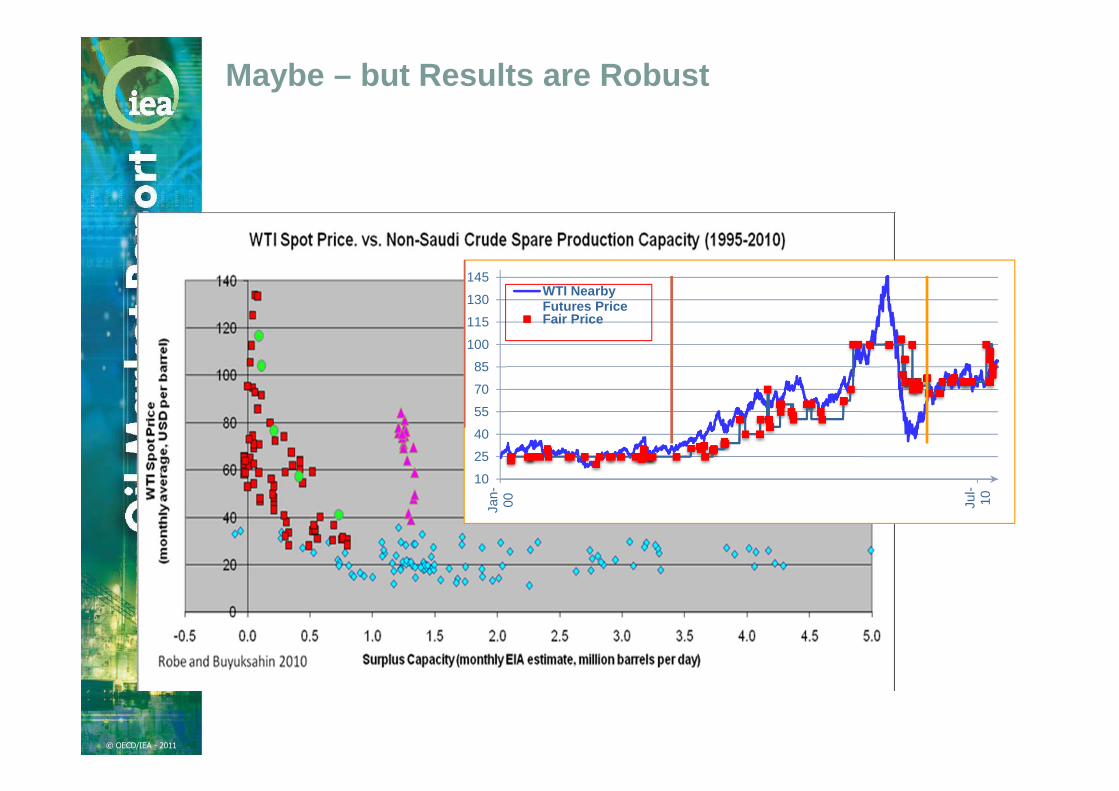
Hyp.#2: Structural Break in Oil Market?
Monthly data on crude oil spot prices and spare production
capacity outside Saudi Arabia
(Source: EIA)
0
20
40
60
80
100
120
140
-0.5 0.0 0.5 1.0 1.5 2.0 2.5 3.0 3.5 4.0 4.5 5.0
WT
I S
pot
Pri
ce
(m
onth
ly a
ve
rage
, US
D p
er
ba
rre
l)
Surplus Capacity (monthly EIA estimate, million bar rels per day)
WTI Spot Price v. Non-Saudi Crude Oil Spare Production Capacity (1995 -2010)
Jan.1995 - Feb. 2004
Mar.2004 - Jul. 2008
Jan. 2009-Aug. 2010
Aug. 2008-Dec. 2008
Robe and Buyuksahin 2010

© OECD/IEA - 2011
Hyp.#3: Storage?
Net cost of carry: positive after 2004, massively so
post-Lehman
Contango
Backwardation0
20
40
60
80
100
120
140
160
-75,00%
-50,00%
-25,00%
0,00%
25,00%
50,00%
75,00%
100,00%
125,00%(annualized) Nearby Slope = [p_1-p_0]/p_0Nearby WTI Price = p_0
Lehman
November 2004

© OECD/IEA - 2011
Idea #2
Cointegration requires trading activity that exploits perceived pricing aberrations:
Has arbitraging become easier and/or more prevalent?• More uninformed traders into the trading
stream?� “thick market” (Admati & Pfleiderer, 1988; Roll et al, 2007)
� Commodity-index investment flows?
• Arrival of new kinds of traders?
� Less constrained (Başak & Croitoru, JFE ’06)
� Hedge funds, other financial traders?

© OECD/IEA - 2011
Our Detailed Data: Sub-Categories
� Non-commercials
� Hedge Funds (includes Commodity Pool Operators
(CPOs), Commodity Trading Advisors (CTAs),
Associated Persons who control customer accounts,
and other Managed Money traders)
� Floor Brokers & Traders
� Non-Registered Participants (Traders not registered
under the Commodity Exchange Act (CEA) – mostly non
MMT financial traders)
� Commercials
� “Traditional”
� Producers
� Manufacturers (refiners, fabricators, etc.)
� Dealers (wholesalers, exporter/importers,
marketers, shippers, etc.)
� Commodity Swap Dealers (includes arbitrageurs)

© OECD/IEA - 2011
Research Questions
� Describe today’s Crude Oil futures market
� What is the “maturity structure”?
� What is the “participant structure”?
� Do these interact?
� Pricing Analysis
� Are near- and far-month futures prices co-
integrated?
� If so, why?
� Do fundamentals matter for cointegration?
� Does trading activity matter for cointegration? If so, whose?

© OECD/IEA - 2011
Results: Maturity Structure
� Growth was strongest in long-dated contracts
2000 2001 2002 2003 2004 2005 2006 2007 2008
> 3 yrs12-36 months
3-12 months< 3 months0
200,000
400,000
600,000
800,000
1,000,000
1,200,000
Open Interest In WTI Crude Oil Futures and Adjusted Option Positions
> 3 yrs
12-36 months
3-12 months
< 3 months

© OECD/IEA - 2011
• Financial traders areway up (MMT, CIT & other FI)
Results: Participant Structure

© OECD/IEA - 2011
Heterogeneity within Broad Categories
o Good idea to break out Swap Dealers & Hedge Funds (CFTC 2009)

© OECD/IEA - 2011
Results: Participant Structure
• Swap trading: Structural change in mid-2004Swap Dealers: net long “nearby” / net short “backdated”

© OECD/IEA - 2011
Results: Participant Structure
Hedge Funds
-
50,000
100,000
150,000
200,000
Jul-0
0O
ct-0
0Ja
n-01
Apr
-01
Jul-0
1O
ct-0
1Ja
n-02
Apr
-02
Jul-0
2O
ct-0
2Ja
n-03
Apr
-03
Jul-0
3O
ct-0
3Ja
n-04
Apr
-04
Jul-0
4O
ct-0
4Ja
n-05
Apr
-05
Jul-0
5O
ct-0
5Ja
n-06
Apr
-06
Jul-0
6O
ct-0
6Ja
n-07
Apr
-07
Jul-0
7O
ct-0
7Ja
n-08
Apr
-08
Jul-0
8
0-3 months
3-12 months
1-3 years
3+ years
• Hedge funds seem to follow

© OECD/IEA - 2011
Explaining Convergence
• Tables 8-9-10: Regress the Trace
statistic on… � …trader position data
� Each trader category entered separately
� Nearby vs. 1-yr plus 2-yr
� Market share vs. total number
� …real-sector variables
� …controls for exog. changes (e-trading, Dec &
June)
� Technical issue
� Some series are I(0), others I(1); also,
endogeneity?
���� Pesaran-Shin (1999) IV approach to
cointegration

© OECD/IEA 2011
Table 9.1: “Financials”
Model 1 Model 2(Market Shares) (Positions)
Coefficient p value Coefficient p valueConstant 0.3944 ** 0.0117 0.5433 *** 0.0003 Spare Capacity (0.0434) ** 0.0260 (0.0465) ** 0.0134 Slope 3.4561 *** 0.0037 3.9456 *** 0.0069 TOI (Total Open Interest) 7.81 E-07 *** 0.0076 6.95 E-07 ** 0.0131 Electronic Trading (0.5281) *** 0.0000 (0.6465) *** 0.0000 December 0.1302 0.3488 0.0163 0.9088 June 0.1423 0.1773 0.0264 0.7822
Floor Brokers & Traders Nearby (2.0397) 0.1665 -7.09 E-07 0.8713 (1-year + 2-year) 0.7341 0.8823 1.26 E-06 0.9107
Hedge Funds Nearby 0.0168 0.9768 -9.12 E-07 0.5030 (1-year + 2-year) 2.6162 * 0.0735 2.53 E-06 0.3391
Non-Reporting Traders Nearby 3.6755 ** 0.0476 7.44 E-06 ** 0.0348 (1-year + 2-year) 8.2870 0.1371 2.41 E-05 0.1402
Commodity Swap Dealers Nearby 0.7819 0.2177 1.22 E-06 0.2801 (1-year + 2-year) (3.6009) ** 0.0422 -6.22 E-06 0.1768
Non-registered participants

© OECD/IEA 2011
Table 9.2: “Hedgers”
Model 1 Model 2(Market Shares) (Positions)
Coefficient p value Coefficient p valueConstant 1.2188 *** 0.0008 0.5134 *** 0.0055 Spare Capacity (0.0348) ** 0.0212 (0.0381) ** 0.0422 Slope 4.9582 *** 0.0001 4.2750 *** 0.0060 TOI (Total Open Interest) 7.04 E-07 *** 0.0004 8.17 E-07 *** 0.0004 Electronic Trading (0.3683) *** 0.0005 (0.4727) *** 0.0003 December 0.2855 ** 0.0253 0.1091 0.5299 June 0.1021 0.2018 (0.0186) 0.8269
Manufacturers Nearby (1.9859) * 0.0560 -3.17 E-06 0.3653 (1-year + 2-year) 2.4473 0.3285 8.03 E-08 0.9900
Producers Nearby 1.1362 0.4592 8.85 E-06 0.1563 (1-year + 2-year) (22.5346) ** 0.0455 -7.59 E-05 * 0.1041
Commercial Dealers Nearby (1.4558) *** 0.0097 -5.76 E-07 0.6550 (1-year + 2-year) (3.7662) * 0.0786 7.31 E-08 0.9857
Commodity Swap Dealers Nearby 0.2253 0.6172 2.24 E-06 * 0.0841 (1-year + 2-year) (1.6968) 0.2249 7.74 E-07 0.7899

© OECD/IEA - 2011
Market Structure
� Participants
� Change in the relative importance of (non) financial
traders
� Different types of traders behave very differently
� Direction of net positions often varies with maturity
� Commodity swap dealers are often short in LT
contracts
� Pricing and Hedging
� Market for 1+ year contracts is now much larger than
the total market in 2000
� Prices up to 2 years are now co-integrated with shorter-
term contracts
� Growth of financial trading helps explains this
positive change
� Hedging ability is improved

© OECD/IEA - 2011
Explaining Cointegration
� Fundamentals matter
� Spare capacity & Slope
� Demand for all industrial commodities
� Trading activity matters as well
� Commodity swap dealers in nearby contracts
� Not further-out positions
� Financial traders in nearby and backdated
contracts
� Hedge funds (MMT), others (NRP)

© OECD/IEA - 2011
Do Speculators Drive Crude Oil Prices?
A simple question
� Is speculative activity destabilizing markets?
� Is speculative activity moving prices?
Theory: Stabilizing Speculation� Profitable speculation must involve buying when the price is
low and selling when the price is high (Friedman, 1953)
� Speculators fill hedgers’ demand-supply imbalances and provide liquidity to the market (Keynes, 1923)
� Speculative activity reduces cost of hedging (Hirshleifer, 1990 and 1991)
Theory: Destabilizing Speculation� Shleifer and Summers (1990) note that herding can result from
investors reacting to common signals or overreacting to recent news.
� Long et al. (1990) show, rational speculators trading via positive feedback strategies can increase volatility and destabilise prices.

© OECD/IEA - 2011
Economic Studies II: Herding and Positive feedback trading� “The Prevalence, Sources and Effects of Herding”
Buyuksahin, Boyd, Harris, Haigh
� Test for herding by assessing the degree of correlation across hedge funds and/or FBTs in buying and selling of futures.
� Also, we test for positive feedback trading by looking at the demand and past performance of futures product.
� Finally, we test for excess demand and price changes.
� Empirical Findings� Overall herding measure for nearby contract is 0.07
for hedge fund and 0.06 for FBTs (for nearby and first deferred it is 0.09 for hedge funds and .07 for FBTs).
� No indication of positive feedback trading by hedge funds or FBTs.
� When prices are falling (20 out of 32 markets) , hedge funds may be herding, but they are buying which implies a stabilization effect on prices.

© OECD/IEA - 2011
Causes of Herding and What we do� Large traders might have greater incentive to herd due
to:
� Perception that other agents might have superior
information and infer information about the quality of
investment holdings from one another’s trade.
� The basis of performance evaluation between institutions
� Reaction to the same exogenous shock
� In this paper, we study the trading behavior of two
groups of traders (hedge funds and floor brokers) to
examine:
� Herding between hedge funds as well as between FBTs
� Positive feedback trading across the groups
� Questions to be addressed here today:
� Does herding occur among hedge funds? If so, does their
trading pattern have a stabilizing or destabilizing effect on
market prices?
� Does herding occur among floor brokers? If so, does their
trading pattern have a stabilizing or destabilizing effect on
market prices?

© OECD/IEA - 2011
Herding: Empirical Results
Overall Herding for Hedge Funds and Floor Broker/Traders: Metal and Energy Commodity Contracts
-0.02
0
0.02
0.04
0.06
0.08
0.1
0.12
0.14
0.16
Gold Silver Copper Aluminum UnleadedGas
HeatingOil
NaturalGas
Crude Oil
Contract Market
Herd
ing V
alu
e
Hedge Funds
FBTs

© OECD/IEA - 2011
Economics Studies III: Role of Financial Players
� More investment money in commodity futures markets
� Thousands of hedge funds, commodity index funds,
etc.
� Assets under Management (AUM):
now exceed $400bn, inflows = $350bn in 10 years
(Barclays, Nov. 2011)
� What could this development mean for…
� Energy Price Levels? Buyuksahin and Harris (2011)
� Oil Market Volatility? Buyuksahin, Brunetti and Harris
(2011, 2011)
� Cross-Market Linkages? Buyuksahin and Robe (2010,
2011)

© OECD/IEA - 2011
Nice Data – Show us it matters!
2010 OPEC
“observation
”:
Strong
positive
correlation
between net
hedge fund
positions and
crude oil
prices

© OECD/IEA - 2011
� For each category we consider:
� Level of Net Futures Position
� Change in Net Futures Position
� Level of Net Total Position (Futures plus futures
equivalent options)
� Change in Net Total Position
� Trading Activity is measured at
� Daily and multiple day intervals
� What we found:
� Speculative activity does not Granger-cause prices
� In general, on the other hand, we find the reverse
causality to hold, i.e. position change is Granger
caused by price change.
Data and Findings

© OECD/IEA - 2011

© OECD/IEA - 2011

© OECD/IEA - 2011
Multivariate Granger Causality and Contemporaneous Effects Findings
� Multivariate Granger Causality-Empirical Results:� Returns are not Granger-caused by positions (including those
of swap dealers and hedge funds)� Hedge fund activity
� does not cause any variable in the system
� is caused by all the variables in the system
� reacts to market conditions and provides liquidity
� Reduces volatility
� Swap dealer activity
� Generally reduces volatility
� Contemporaneous Effects� Hedge funds are reacting to market conditions and providing
liquidity to the market; i.e. there is a uni-directional causation from change in price to change in MMT’s position
� Interestingly, Swap dealers change in position is preceded by change in prices
� More transparent information on composition of open interest is needed to have better understanding of role of different market participants on prices and observed high volatility in commodity derivatives markets

© OECD/IEA - 2011
Economics Studies IV: Cross-Market Linkages The “Marching in Step” – after Lehman
25
50
75
100
125
150
175
200
225
250
275
GSCI (Commodity)
DJUBS (Commodity)
DJIA (US equities)
S&P 500 (US equities)
MSCI World Equities
Base: Jan. 2, 2001 = 100
Lehman

© OECD/IEA - 2011
A “Market of One” – Really?
� Büyükşahin, Haigh & Robe (JAI 2010):
� Not so fast:
� Let’s look at return correlations, not price levels
� On average, return correlations between passive
equity and energy investments were about zero
(1991 to August 2008)
� No secular increase in dynamic conditional
correlations (DCC)
� General result?
� Yes
� True at daily, weekly & monthly frequencies
� True regardless of index choice (GSCI or DJ-UBS;
S&P or DJIA)
� And yet…

© OECD/IEA - 2011
-0,4
-0,2
0
0,2
0,4
0,6DCC_MR_GSENTR_SP
DCC_MR_GSENTR_MXWO
SP500 & GSCI Correlation (DCC), 1991-2011
Lehman collapse
Egypt protests
DCC estimates average close to Ø, fluctuate
substantially over time

© OECD/IEA - 2011
SP500 & GSCI Correlation (DCC), 1991-2011
Importance of accounting for volatility changes
�Rolling
�DCC
vs.

© OECD/IEA - 2011
Financialization in Pictures
� Overall speculation is up
� From about 10% excess spec till 2002
to 35-50% after 2005
� Commodity Index Trading is Up
� Swap Dealer positions account for about 35% of futures OI
� Hedge Funds are Up
� From 5-10% of the futures OI till 2002to 25-30%
after 2005
� Cross-Market Trading is Up
� Tripled since 2002
� Pattern does not follow other hedge funds

© OECD/IEA - 2011
Energy Speculation
Working’s T, January 2000 to March 2010
1
1,1
1,2
1,3
1,4
1,5
1,6
WSIAWSIS
L
e
h
m
a
n

© OECD/IEA - 2011
Swap Dealing & Commodity Index Trading
Overall vs. Near-dated Swap Dealer Positions (% of
OI), 2000-2010
0
0,05
0,1
0,15
0,2
0,25
0,3
0,35
0,4
0,45
0,5WSIAWSISWMSA_ASWMSS_AS
L
e
h
m
a
n

© OECD/IEA - 2011
Hedge Funds and Cross Traders
Hedge funds’ share of Energy Futures Open Interest,
2000 to 2010
0
0,05
0,1
0,15
0,2
0,25
0,3
0,35
WMSA_MMTWMSS_MMT
Spring 2008

© OECD/IEA - 2011
Hedge Funds and Cross Traders
� Hedge funds that Trade both Energy and Equity Futures, 2000-2010
0
0,05
0,1
0,15
0,2
0,25
0,3
0,35
WMSA_MMT
WMSS_MMT
WCMSA_MMT
Nov. 17, 2008

© OECD/IEA - 2011
Should It Matter Who Trades?
� Should trader identity matter for asset pricing?
� Theoretical reasons to believe trader identity matters
� Models show that less-constrained traders link asset markets
� During financial stress periods, contagion or retrenchment?
� Who is a “candidate” for enhancing linkages?
� Traditional commodity users, etc.? ���� Unlikely
� Index traders? Only insofar as they provide liquidity
� Hedge funds? ���� More likely
� Seek to exploit perceived mis-pricing
� Levered/subject to borrowing limits/wealth effects under stress

© OECD/IEA 2011
Hedge Funds and Stress Interact
Constant -0.826467 *** -1.96763 *** -2.56901 ** -3.17242 **
(0.2323) (0.7290) (1.057) (1.273)
SPARE 0.154870 *** 0.135986 *** 0.121034 *** 0.107117 ***
(0.03576) (0.03237) (0.03185) (0.03093)
UMD 0.0710231 * 0.0727269 * 0.0579558 * 0.0586289 *
(0.04025) (0.03981) (0.03378) (0.03274)
TED 1.77734 *** 4.60514 *** 1.38053 *** 3.39324 **
(0.5081) (1.485) (0.4230) (1.346)
WMSS_MMT 2.37960 *** 5.22120 ***
(0.8664) (1.523)
WMSS_AS 0.896538 -0.949729
(1.624) (1.275)
WMSS_TCOM 2.82919 ** 1.07074
(1.358) (0.9123)
WSIA 1.32955 ** 2.21413 ***
(0.5596) (0.7198)
INT_TED_MMT -5.51366 *** -4.30584 ***
(1.676) (1.402)
INT_TED_WSIA -3.20403 *** -2.37744 **
(1.064) (0.9594)
DUM 0.347098 *** 0.350655 *** 0.445824 *** 0.380342 ***
(0.09457) (0.09879) (0.09043) (0.08412)
Log likelihood 881.086 871.939 884.97 875.182

© OECD/IEA 2011
Cross-Trading Hedge Funds Matter
2000-2010 2000-2010 2000-2010 2000-2010 2000-2010 2000-2010
Constant -0.778333 *** 0.210448 -0.971063 -0.783793 *** 0.315275 -0.675490
(0.2196) (0.4022) (0.8296) (0.2277) (0.4216) (0.8831)
ADS 0.0381775 0.0536956 0.0631063
(0.06174) (0.05042) (0.04728)
SPARE 0.178190 *** 0.129834 *** 0.104834 *** 0.179592 *** 0.126999 *** 0.102546 ***
(0.04215) (0.03684) (0.03318) (0.04372) (0.03755) (0.03384)
UMD 0.0722604 0.0565843 0.0645123 * 0.0715149 0.0540846 0.0602626 *
(0.04570) (0.03696) (0.03534) (0.04713) (0.03760) (0.03580)
TED 1.37460 *** 1.01301 *** 3.29099 ** 1.46240 *** 1.07753 *** 3.14341 **
(0.4684) (0.3643) (1.400) (0.5075) (0.3831) (1.427)
WCMSA_MMT 5.10806 *** 3.92980 *** 5.13408 *** 3.76414 ***
(1.717) (1.358) (1.783) (1.392)
WCMSA_AS -3.73983 ** -2.86410 * -4.14034 ** -3.40879 **
(1.543) (1.567) (1.629) (1.653)
WSIA 1.08753 ** 0.946378 *
(0.5081) (0.5354)
INT_TED_CMMTA -9.82038 *** -6.96981 ** -10.2754 *** -7.13595 **
(3.644) (2.862) (3.853) (2.950)
INT_TED_WSIA -2.26677 ** -2.11807 **
(1.005) (1.028)
DUM 0.214922 * 0.370933 *** 0.431396 *** 0.230696 * 0.418018 *** 0.496860 ***
(0.1120) (0.1067) (0.1017) (0.1226) (0.1196) (0.1197)
Log likelihood 881.802 885.162 875.116 882.31 885.943 876.387

© OECD/IEA - 2011
Findings
� “Co-movements”
� Time variations in correlations, but no upward trend
till crisis
� Extreme-events analysis: commodity umbrella leaks
� “Speculation” in cross-section of energy paper
mkts
� Increase in speculation + hedge fund activity + cross-
mkt activity
� Impact of hedge funds in energy markets
� Hedge fund activity helps link markets
� Market stress matters, too
� Interaction – contagion through wealth effects?
� Information on OI composition is payoff-relevant
� CFTC decision to disaggregate more

© OECD/IEA - 2011
Economics Studies V: Do OPEC Members Know
Something the Market Doesn’t?

© OECD/IEA - 2011
“ ‘We expected at the start of the year oil prices between
$75 and $80 a barrel, this is a fair price… Oil prices (…)
might rise reasonably’, (Saudi Arabia’s King Abdullah)
said. On Thursday, U.S. oil crude futures rose $1.38 to
$78.05.”
Reuters, December 26, 2009
“WTI (prices) stabilized between $70 to $80 per barrel
since the middle of last year. This range is consistent with
the ‘fair price’ range for crude oil proposed by King
Abdullah of Saudi Arabia at the beginning of 2009.”
EIA Short-Term Energy Outlook, U.S. DoE, Feb. 2010
Some Quotes

© OECD/IEA - 2011
Does OPEC have Information the Market Doesn’t?
� As these quotes illustrates, news agencies, market commentators and even oil analysts often make references to OPEC pronouncements about crude oil prices.
� During the oil price surge of 2008, pundits and politicians instead used “fair price” statements by OPEC-linked officials as evidence that sky-high prices were “not caused by physical supply and demand factors”.
� Implicit in such views is an implicit assumption that OPEC-related “fair price” pronouncements contain information not already reflected in market prices.

© OECD/IEA - 2011
OPEC “Fair Price” Announcements’ Impact on the Futures Market Price of Crude Oil
� OPEC members, individually or collectively, often comment on what the “fair price” for crude oil should be
� We construct a sample of all fair price pronouncements
in 2000-10.
� No definition of “fair price” in classical economics
� We define the “fair price” to be the price that a particular
OPEC producer would like to see prevail in the market.
� We investigate whether “fair price” statements contain any new information (i.e., news content not already absorbed in the market) & the price effect of such pronouncements.

© OECD/IEA - 2011
Related Literature
� OPEC’s ability to influence the price of crude oil
� Efficiency of OPEC’s “official prices” (1970’s to mid-1980s):� E.g., Gately et al, EER-77; Verleger, REStat-82; Hubbard, QJE-
86, ...
� Impact of production-related OPEC conferences announcements ���� do they influence market prices, returns, or implied volatility?� Loderer, JF-85; Wirl & Kujundzic, EnJ-04; Horan et al, EnJ-04;
Wang et al, JFutM-08; Demirer & Kutan, EE-10.
� Efficiency of energy-derivatives markets
� Do energy futures market react to OPEC conference news?� Draper, JFutM-84; Deaves & Krinsky, JFutM-92.
� Impact of verbal interventions on markets
� Extant work focuses on communications in forex(see Blinder et al, JEL-08) or on interest rate markets (e.g., Fratzscher, EJ-08, JIE-09)

© OECD/IEA - 2011
Our Paper
� Contribution to the empirical literature
� We focus on OPEC statements related to prices,
not on statements related to production.
� Whereas OPEC conferences and meetings are
publicized ahead of time (and are thus
predictable), “fair price” pronouncements are
not timed with any predictability, and are thus
not likely to be forecasted ahead of time.
� Methodological contributions
� Adapt Kalman-filter and ADL methodologies to oil
issues
� Enhance the event-study methodology used in extant
oil literature.

© OECD/IEA - 2011
Our Findings in a Simple Picture
0
20
40
60
80
100
120
140
160
0
20
40
60
80
100
120
140
160
Jan-
00
Jul-0
0
Jan-
01
Jul-0
1
Jan-
02
Jul-0
2
Jan-
03
Jul-0
3
Jan-
04
Jul-0
4
Jan-
05
Jul-0
5
Jan-
06
Jul-0
6
Jan-
07
Jul-0
7
Jan-
08
Jul-0
8
Jan-
09
Jul-0
9
Jan-
10
Jul-1
0
WTI Nearby Futures Price
Fair Price (range bars in black)

© OECD/IEA - 2011
Our Findings in Words
� If “fair price” pronouncements contained news for non-OPEC market participants,
� e.g., signals of physical market conditions
� e.g., signals of a country’s or OPEC’s strategies
� Then, we should observe an impact on crude oil futures prices.
� In fact, we find that “fair price” announcements
� add little to pre-existing information in the market
� have little impact on the futures market price of crude oil.
© OECD/IEA - 2011
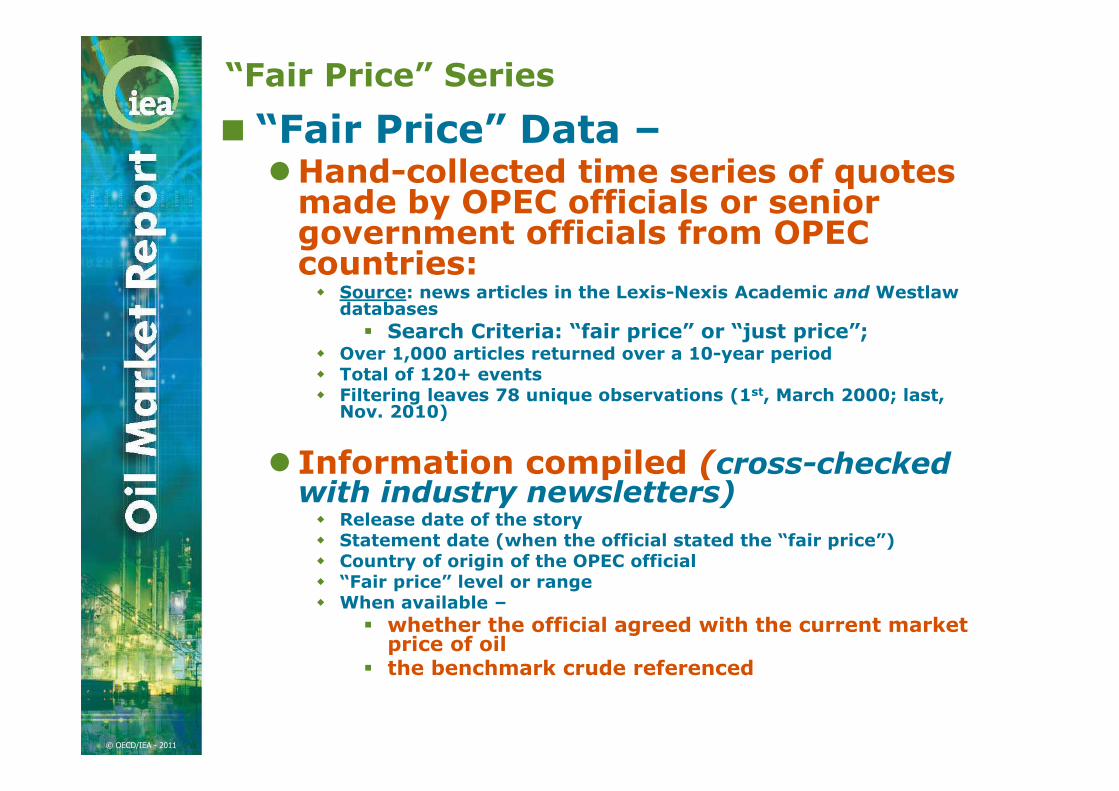
“Fair Price” Series
� “Fair Price” Data –�Hand-collected time series of quotes
made by OPEC officials or senior government officials from OPEC countries:
� Source: news articles in the Lexis-Nexis Academic and Westlaw databases
� Search Criteria: “fair price” or “just price”; � Over 1,000 articles returned over a 10-year period� Total of 120+ events� Filtering leaves 78 unique observations (1st, March 2000; last,
Nov. 2010)
� Information compiled (cross-checked with industry newsletters)
� Release date of the story� Statement date (when the official stated the “fair price”) � Country of origin of the OPEC official� “Fair price” level or range� When available –
� whether the official agreed with the current market price of oil
� the benchmark crude referenced

© OECD/IEA - 2011
Market Price Series
� Market Price Data –
� West Texas Intermediate (WTI) light sweet crude oil futures contract traded on the NYMEX. � World’s most liquid crude oil contract.
� Settlement price of the nearby-futures contract is used
� = “closest-to-delivery contract with the highest open interest”.
� Sample period – January 2000 to December 2010.
� Control Variables –
� Production announcements� Dates
� Direction of production announcement
� Only 13 of the 78 events had production announcements within 5 days of (before or after) the “fair price” pronouncement.
� Survey of economists regarding production expectations

© OECD/IEA - 2011
Q1. Do “OPEC” Officials Agree with the Current Market Price?
10
25
40
55
70
85
100
115
130
145
Jan-
00
Jul-0
0
Jan-
01
Jul-0
1
Jan-
02
Jul-0
2
Jan-
03
Jul-0
3
Jan-
04
Jul-0
4
Jan-
05
Jul-0
5
Jan-
06
Jul-0
6
Jan-
07
Jul-0
7
Jan-
08
Jul-0
8
Jan-
09
Jul-0
9
Jan-
10
Jul-1
0
WTI Nearby Futures Price
Agree with Price
Disagree with Price
Cannot Tell

© OECD/IEA - 2011
Explanation of Graphical Analysis 1
� “Fair price” statements subdivided into 3 groups:
� Official agrees with the market price 17 times (greentriangles).
� Mostly after mid-2009
� Official disagrees with the market price 25 times (reddots).
� Mostly before mid-2009
� Official does not say 36 times (purple squares).
� The graph suggests that, even when they are not explicit about it, officials often seemed to disagree with market prices before 2009
� From Summer 2003 to Summer 2008 – market price was viewed as “too high”
� From Fall 2008 to Spring 2009 – market price was viewed as “too low” (market price collapsed yet “fair price” remained in the $75-100 range).

© OECD/IEA - 2011
Q2. Heterogeneity within OPEC?
10
25
40
55
70
85
100
115
130
145
Jan-
00
Jul-0
0
Jan-
01
Jul-0
1
Jan-
02
Jul-0
2
Jan-
03
Jul-0
3
Jan-
04
Jul-0
4
Jan-
05
Jul-0
5
Jan-
06
Jul-0
6
Jan-
07
Jul-0
7
Jan-
08
Jul-0
8
Jan-
09
Jul-0
9
Jan-
10
Jul-1
0
WTI Nearby Futures Price
VILAN
Saudi Arabia
Other OPEC/OPEC Consensus

© OECD/IEA - 2011
Explanation of Graphical Analysis 2
� Idea: Country-specific factors may influence which price an individual cartel member would like to see prevail in the market.
� OPEC Member Classification -� OPEC “hawks” (red): Venezuela, Algeria, Iran and Libya
� Tend to advocate higher prices than current market prices?� Saudi Arabia (green):
� With ample oil reserves, tends to advocate lower prices?� Others (purple): all remaining individual member countries or a
“consensus” by OPEC
� The figure suggests that “hawks” do not make “fair price” statements more bullish than the other groups, yet: � Hawks more vocal in support of higher prices after price collapse
at the end of 2008� Venezuela –
� Favored production cuts through most of sample period� Exception – constant at $100 as “fair price” during price spike
and crash of 2008

© OECD/IEA - 2011
Q3. Which moves first – “fair price” or market price?
10
25
40
55
70
85
100
115
130
145Ja
n-00
Jul-1
0
WTI Nearby Futures Price
Fair Price
Fair Price Trend

© OECD/IEA - 2011
Explanation of Graphical Analysis 3
� We ask whether “fair price” statements lead or lag market prices.
� The figure strongly suggests that “fair price” statements lag market prices
� Interpretation: they contain no new information.
� We now turn to more formal analyses to test this apparent relationship between the two time series.

© OECD/IEA - 2011
1st Methodology - Event Study
� Event Study (see e.g. MacKinlay, JEL-97)
� Our interest –
� Arrival of “true news” (information content into the market)
� Compare the nearby oil futures price before & after the event� We use two non-parametric tests of statistical significance
� Event and event window –
� Event = “fair price” statement date.
� The event separates all preceding and succeeding observations � captures the normal performance and after-announcement
performance of the price of oil.
� We use windows of 2, 3, 4, and 5 days for robustness.

© OECD/IEA - 2011
Event Study continued
� Non-parametric tests:
� Humpage, JMCB-99; Fatum and Hutchinson, EJ-03.
� Criterion (1): “Direction Criterion”
� “Success” = “post-announcement market price moves in the direction suggested by ‘fair price’ level”.
� Formally:
� To test if the direction of futures prices is random or systematic following the event, we use a non-parametric sign test:
� Null : the direction is random.
� Equal probability that the post-event return is
positive or negative. X+
stands for the # of successes.

© OECD/IEA - 2011
Event Study continued
� Non-parametric tests:� Humpage, JMCB-99; Fatum and Hutchinson, EJ-03.
� Criterion (2): “Smoothing Criterion”
� “Success” = “the ‘fair price’ pronouncement smoothes prior market-price movements”.
� Formally: if it is successful according to “direction criterion” (1) or if :
� Judging success on the “smoothing criterion” is only meaningful if the official marking the statement is “leaning against the wind”.
� i.e., he is trying to reverse or to slow a prior market price trend.
� First case: signal = “prices are too high or increas ing too fast”.
� Second case: signal = “prices are too low or should not be falling”.
� Broad “smoothing criterion” – 75%; stricter “reversal criterion” – 50%.

© OECD/IEA - 2011
1. Event Study Analyses & Results
� Results –
� “Fair price” pronouncements are not successful (either at affecting the direction of the market or at slowing down the pace of prior market price movements).
� We cannot reject (at any statistical significance level) the hypothesis that the post-pronouncement return is random.
� Robust results regardless of: � Divisions based on a concomitant OPEC oil-production
announcement� Who is making the statements� Different event-window lengths (2- vs. 5- day)� Different time periods (SPARE)
� Tables –
� Panel A - “direction criterion”� Panel B - reversals (“leaning against the wind”)� Panel C - “smoothing criterion”
� Robust –

© OECD/IEA 2011
Event Study Tables
2-Day Returns; No Concomitant Production News
Panel A
Nonparametric Sign Test – Direct ion Criteria: No product ion cut or increase (2 Day)
# of Events # of Success z-value p-value
FP>P- 22 13 0.8528 0.1969 FP<P- 43 15 -1.9825 0.9763 Total 65 28 -1.1163 0.8679
Panel B
Reversal Cri teria Test – Leaning Against the Wind: No production cut or increase (2 Day)
# of Events # of Success z-value p-value FP>P- 11 7 0.9045 0.1829 FP<P- 21 5 -2.4004 0.9918 Total 32 12 -1.4142 0.9214
Panel C
Smoothing Criteria Test - Leaning Against the Wind: No production cut or increase (2 Day)
# of Events # of Success z-value p-value
FP>P- 11 10 0.7035 0.2409 FP<P- 21 12 -1.0911 0.8624 Total 32 22 -0.4714 0.6813
2-Day Returns Amid News of Production Changes

© OECD/IEA - 2011
“Fair Price” Events, Production News, and Median Returns
Production News and Median Returns after all “Fair Price” Events, 2000-2009

© OECD/IEA - 2011
Different regimes?
© OECD/IEA - 2011
Maybe – but Results are Robust
10
25
40
55
70
85
100
115
130
145
Jan-
00 Jul-
10
WTI NearbyFutures PriceFair Price

© OECD/IEA - 2011
No New Information
� “Fair price” statements seem to have little influence on crude oil futures prices.
� No evidence of price reversals (not even evidence of slowing down) when “fair price” announcements “lean against the wind” (differ from the current market trend).
� “Fair price” events supply no extra news to oil futures market participants and no new information content to the market.
� Going forward –Should commentators, reporters, and policy makers treat “fair price” pronouncements as informative when attempting to explain market prices or making policy decisions?

© OECD/IEA - 2011
Many drivers of volatile prices, and several policy responses to cope with them
Abrupt, visible & physical causes of price changes
� Technology shock : shale gas revolution in the US – is the same now happening with US onshore oil?
� Demand shock: unchecked emerging market demand growth under the influence of buoyant economic growth and subsidised prices
� Policy shock: resource nationalism & impact on investment, oil products spec changes, deepwater regulation, legislation to control derivatives markets and hedging, China’s late-2010 restriction on coal-fired power generation potentially boosted oil demand by 300-400 kb/d
� Geopolitical shocks: 1970s oil shocks, crisis in Libya, what’s next? (Iran? Nigeria?)
� Natural disasters: Hurricanes Katrina & Rita (2005), Japanese earthquake (2011)
But longer term trends also play a role
� Creeping price inelasticity of supply/demand mean that relatively small changes in each can have an exaggerated impact on price
� Expectations for future fundamentals – uncertainty & data
Helping ensure more stable markets in future needs:
� Better transparency across both the physical and derivatives markets
� Remove market distortions via price liberalisation & level investment playing field
� Ensure market liquidity & the ability to hedge are retained
� More predictable, harmonised international policies on climate change, fuel qualities, alternative fuels, investment terms
� Promote mutual energy security via interconnections, and diversifying fuel types and sources where it is economically viable
� Finally, widespread encouragement of energy efficiency
112