Embed Size (px)
Citation preview
The Price of Street Friends:
Social Networks, Informed Trading, and Shareholder Costs
Jay Cai+, Ralph A. Walkling++, and Ke Yang+++
Abstract
We document a significant and positive relation between a public firm’s social connections with
Wall Street and the firm’s bid-ask spread. One additional connected executive or director at a
typical firm increases her shareholders’ annual trading cost by nearly $1 million. Social ties
based on education or leisure activities exhibit a stronger effect on trading costs than ties based
on employment. Firms with more ties to Wall Street also exhibit lower abnormal volatility and
abnormal trading volume around earnings announcements. Our evidence illustrates the
importance of social ties in the transfer of privileged information and the significant
consequences for shareholders. Finally, SOX substantially reduces, but does not eliminate, the
importance of social networks in the transfer of information.
+ Assistant Professor of Finance, The LeBow College of Business, Drexel University, 3141 Chestnut Street, Philadelphia, PA. 19104-2875, [email protected], 215.895.1755. ++Stratakis Chair in Corporate Governance, Professor of Finance, The LeBow College of Business, Drexel University, 3141 Chestnut Street, Philadelphia, PA. 19104-2875, [email protected], 215.895.4920. +++ Assistant Professor of Finance , Perella Department of Finance, College of Business & Economics, Lehigh University, 621 Taylor Street, Bethlehem, PA 18015, 610.758.3684, [email protected].

2
The Price of Street Friends:
Social Networks, Informed Trading, and Shareholder Costs
1. Introduction A new and expanding literature in finance examines the impact and implications of social
networks. Of particular importance is the work of Cohen, Frazzini, and Malloy (2008) who
document that social networks often serve as the channels for the flow of inside information.
Cohen, Frazzini and Malloy (2010) also document that well-connected analysts outperform on
their stock recommendations.
It is intuitive that timely access to new information benefits the recipients. For example,
the mutual fund managers and analysts in the research of Cohen, Frazzini and Malloy are able to
outperform with information obtained through their social connections. The impact of social
networks to a firm’s shareholders is less clear. The existence of social networks can be either
beneficial or detrimental to shareholder wealth. To the extent that social networks expand the set
of information flowing to a company, shareholder wealth should increase. However, social
networks also impact the flow of information from a company and this can have a detrimental
impact. One unexplored area where the flow of information from a company could be
detrimental to shareholders is the link between social ties and trading costs. There are several
reasons why this link could prove important. First, we know that informed trading exists and is a
significant aspect of trading costs [e.g., Bagehot (1971), Stoll (1989), Glosten and Milgrom
(1985), Copeland and Galai (1988)]. As Stoll notes, “informed traders gain at the expense of
suppliers of immediacy.” [Stoll (2000), p. 1482]. Recognizing this, market makers seek to
protect themselves by increasing bid ask spreads for trades more likely to be informed [Bagehot
3
(1971)]. If the social networks surrounding a firm alter the probability of informed trades in that
company’s stock, the cost of trading could increase. To the extent that social networks increase
the cost of trading, they reduce shareholder wealth.
The extent to which market makers recognize social networks and alter trading spreads is
an empirical issue. However, the literature does document adjustments of the spread in other
contexts. Garfinkel and Nimalendran (2003) report increases in the effective spread for selected
trades by corporate insiders. Benveniste, Marcus, and Wilhelm (1992) argue that the relationship
between floor brokers and specialists on the NYSE leads to more transparency in identifying
informed trades.
The objective of this research is to examine the relation between social networks and
trading costs. Analysis of trading costs is important as they directly impact shareholder wealth.
We test our hypotheses on a sample of over 18,000 non-financial, public firm/year observations
during the period of 2000 to 2008. Using data from BoardEx, we identify the network of
connections between executives and directors of these public firms and key members of the
investment community. In particular, we look at social links between public firms and senior
managers and directors at firms classified as investment companies, private equity, or “specialty
and other finance” in BoardEx. The latter category includes investment banks, trading firms and
other related firms. For convenience, we refer to these firms collectively as “Wall Street” in the
text.1 There are numerous avenues for social connections. We examine three: employment,
education, and leisure activities.
1 Individual outside Wall Street certainly can also take advantage insider information they receive via social ties. Wall Street executives, however, are likely to be more sensitivity to information (from either verbal or non-verbal cues) related to stock value. They also have more capital to take advantage of the privileged information. Therefore, we focus on the social ties between public firms and Wall Street.

4
To preview our results, we find that the social connections between a firm’s executives
and Wall Street significantly increase the firm’s bid-ask spread. One additional connected
executive/ director increases her firm’s bid-ask spread by an average of 0.0077%, which
translates to $970,000 additional annual trading cost for a stock with a price of $50 and a daily
trading volume of 1 million shares. Since a typical firm has eight connected executives and
directors, we estimate the capitalized value of this cost to be $160 million using a discount rate
of 5%. The effect is even larger for connections through education and leisure activities. One
additional executive/ director connected to Wall Street through school ties increases her firm’s
annual trading cost by $2.7 million, while one such executive/director connected through leisure
activities increases annual trading cost by $1.7 million. This evidence suggests that the informal
(or non-professional) networks are more likely to facilitate illegitimate information transfer.
However, the important finding here is not just the magnitude of the increased trading costs but
the fact that the potential flow of information through social networks is somehow incorporated
into the cost of trading. The Sarbanes Oxley Act (hereafter SOX) significantly reduces, but does
not eliminate, the importance of social networks in the transfer of information.
If information flows through social networks to Wall Street, the impact can be visible in
other ways. For example, when a company releases new information, some of that information
will already be imparted through the social networks. Earnings announcements would be less
informative. As a further test of the importance of social connections, we examine the relation
between abnormal turnover and abnormal volatility around earnings announcements. We find
that social connections with Wall Street significantly reduce abnormal turnover and abnormal
volatility around earnings announcements. This is consistent with the idea that information

5
associated with the new earnings announcement has already been incorporated in a firm’s stock
price.
Our work adds to the growing literature on social networks and extends the literature on
determinants of the bid ask spread. We provide important evidence on the link between social
ties and trading costs and document that these ties produce a large (negative) economic impact to
a firm’s shareholders. Our work also sheds light on the relation between social ties and the
information content of earnings announcements and earnings surprises. Our evidence illustrates
the important consequences for shareholders when insider information is transferred through
social networks.
The remainder of our paper is organized as follows: Section 2 provides background and
develops the hypotheses to be tested. Section 3 presents our sample and research design.
Results are presented in Section 4. Section 5 concludes.
2. Background and Hypotheses
2.1 Social ties and the transfer of information
Executive suites and corporate boardrooms are continually devising and implementing
strategies that alter the level and riskiness of cash flows to their business. At the same time,
executives on Wall Street are continually assessing the values of these same firms in an attempt
to recognize trading opportunities. In essence, one team of executives operates inside the
corporate box; multiple teams operate outside the corporate box. Teams both inside and outside
the box are trying to estimate value. Those outside the corporate box are constrained by the laws
regulating the flow of insider information. Much of the information flow is heavily restricted by
regulation FD and the laws related to insider trading. Corporate insiders are warned to carefully

6
monitor their communications and take actions to avoid unintentional leakage of privileged
information. Nevertheless, social networks provide avenues for the unintended release of
privileged information.
To the extent that social connections link those within and external to the corporate box,
they provide the possibility of additional (perhaps inadvertent) information transfer through
direct and indirect means. It is not surprising that information is transferred through social
networks. Even a casual comment between social contacts can result in the inadvertent transfer
(or creation) of new information. In addition, we are trained from birth to detect information
from the non-verbal and social cues that surround us. There are an infinite number of non-verbal
cues that can transfer information between acquaintances. Obvious examples include a person’s
tone of voice, a smile, or other visual cues. We may notice that a contact seems stressed or
engages in more (or less) conspicuous consumption. We may even infer information by the
presence or absence of an acquaintance at social gatherings. All of these situations permit the
transfer of information. Wall Street veterans are likely to be sensitive to such subtle information
and its relation to stock value.
2.2 The Importance of Social Ties in Finance
A growing literature recognizes the importance of social ties in business. Cohen,
Frazzini, and Malloy (2008) find that social networks often serve as channels for the flow of
inside information. Their analysis indicates that mutual fund managers tend to outperform on
stocks of firms where they have social ties and that the superior performance is concentrated
around the release of corporate news (e.g., earnings announcements). The importance of social
ties is also documented in other contexts. Cohen, Frazzini and Malloy (2010) report that analysts
outperform on their stock recommendations when they have school ties with the company’s

7
senior officers. Social networks are also found to impact trading behavior of mutual fund
managers [Hong, Stein, and Kubik (2005)] and households [Hong, Stein, and Kubik (2004)].2
Social ties can be beneficial to firms if they facilitate (legitimate) information flow and
monitoring. Engelberg et al (2010) find that firms that have social ties with their banks obtain
loans with lower interest rate and fewer covenants. These firms also have better performance ex
post. They conclude that social connections between firms and banks help to improve
information flow ex ante or monitoring ex post. Engelberg et al (2009) find CEOs with more
social connections to outsiders receive higher compensation, in particular when other executives
have fewer social ties or when their companies are located in geographically isolated locations.
Hochberg, Ljungqvist, and Lu (2007) find that an expanded network for venture capital firms is
associated with improved fund performance. Larker et al (2010) find companies with boards at a
more central location in the interlocking network tend to have better stock and operating
performance.
2.3 Social ties and trading costs
It is not surprising to academics in finance that parties receiving superior information can
out perform. The interesting and surprising fact is the degree to which social networks provide
channels for the flow of this information. An unexplored issue relating to social ties concerns a
possible impact on trading costs. Do social connections between executives, directors and Wall
Street impact the cost of trading? The issue is ultimately an empirical question. There are,
however, several reasons to believe the answer is yes. First, Cohen, Frazzini, and Malloy (2008,
2010) find evidence that social ties facilitate the transfer of insider information. Second, the
2 There is also a growing literature examining the link between social ties and corporate governance. As a few examples, see Barnea and Guedj (2009), Hwang and Kim (2009, 2010), Larcker, Richardson, Seary, and Tuna (2005), Kuhnen (2009), Butler and Gurun (2009), and Fracassi and Tate (2010).

8
literature has long recognized the relation between asymmetric information and trading costs. In
particular, Bagehot (1971), among many others, notes that market makers widen bid-ask spreads
to protect themselves from informed trades. Our research combines the literature on trading
costs with the literature on social networks by examining the relation between social networks
and the cost of trading. In particular, we explore the answers to several questions related to
social networks, the flow of information and trading costs. First, the number of potential paths
for the flow of information from Corporate America to Wall Street increase with the network of
social interactions connecting the firm to the investment community. Do bid-ask spreads
increase with the number of social connections between a firm’s executives and directors and
Wall Street firms?
Second, are earnings announcements less informative when a firm has more social
connections to Wall Street? Suppose social connections enable the investment community to
detect the impact of new information before the quarterly announcement of earnings. Earnings
announcements would be less informative since some of the information content of these
announcements would already have been reflected in stock prices. We examine two implications
of the prior transfer of information before formal earnings announcements. First, does abnormal
return volatility surrounding an earnings announcement decrease with the level of social
connections? Second, does the level of abnormal trading decrease with the level of social
connections? We also reexamine these questions in situations associated with increased and
decreased information flows. To examine the impact of social ties around periods of
substantially increased information, we reexamine our results for firms with unusually large
earnings surprises. Finally, we examine the impact of SOX on the link between social networks
and trading costs.

9
3. Sample and Research Design
3.1 Sample selection
Our sample consists of data from a number of sources. We construct the social
connections between a U.S. public firm’s executives and directors with those of the investment
firms based on the director profile information provided by the BoardEx database of
Management Diagnostic Limited. BoardEX provides the social networks data of senior
executives and board members of over 14,000 U.S. and European public and private companies
since 1999. 3 From these profiles, we collect information on current employment, past
employment, education background, and affiliation to professional associations, not-for-profit
associations and club memberships.
We then match the BoardEx data with CRSP and Compustat databases to obtain the
financial and accounting variables used in our analysis. After excluding all financial firms, this
generates a sample of 18,505 firm/year observations during the period of 2000-2008. This is our
main sample. For the tests involving earnings surprises, we further require the sample firm be
followed by at least two financial analysts and have non-missing analyst forecasts of earnings per
share provided by the Institutional Broker Estimate System (I/B/E/S).
3.2. Measuring the social connection
We measure the social connection between a public firm executive and director and an
investment firm executive and director by their current and past overlap in employment,
education, and activities. Investment firms include all public and private companies classified by
BoardEx as “Investment companies,” “Private Equity,” and “Specialty and other Finance.” The 3 Social ties formed before 1999 are also captured since BoardEx records the covered executives and directors’ career, education, and activity history as long as data are available.

10
“Specialty and other Finance” classification includes investment banks, trading companies, etc.
We exclude from the public firm sample all financial firms since executive and directors of these
firms are more likely to have career overlap with those at the investment firms.
We define two individuals as connected via employment if their careers overlap at the
same employer in the past or at present. It is possible that the two individuals may not know each
other even if they both work at the same employer. Such misclassification increases the noise in
the data and works against our finding significant results.4
We define two individuals as connected via education if they attend the same university
or college and obtain the same degree within one year of each other. Individuals receiving more
specialized degrees, such as an MBA or JD, are likely to know others in the same class or the
class immediately before or after. Individuals receiving more general degrees, such as a
Bachelor of Science, are less likely to know all others receiving the same degree because there
are a larger number of people receiving such degrees. Again, misclassification increases noise in
the data and works against our finding significant results.
We define two individuals as connected via activities if they both serve as officers of the
same professional association, non-profit associations, or leisure clubs. Many individuals listed
in the activities section of the BoardEx data are members of such associations and clubs. These
individuals are unlikely to know each other. We, therefore, exclude individuals whose role is
“member” or “unknown” when defining social ties via activities.
We next aggregate the number of executives and directors in a public firm who are
connected to an executive or director of an investment firms. In our primary analyses, we also
include self connections; these are individuals from a public firm who are also affiliated with an
4 BoardEx regards the U.S. government and military as employers. However, two individuals who are in the Navy at the same time are unlikely to know each other. We, therefore, do not include such connections in the analysis.

11
investment firm. For example, an outside director of a public firm may be a senior executive of
an investment bank. Our results are robust when we exclude such self connections. Table 1
shows that for the average firm Board-Ex reports 17 executives and directors, among whom
eight are connected to a ‘Wall Street’ firm. Seven of the connected directors and executives are
connected to Wall Street through employment based ties, one and a half are connected through
education, and three and half are connected through activities. Note that one executive or director
may be connected through more than one type of connections. For example, she may have
attended the same school as investment banker A and may have once worked for the same
company as hedge fund manager B.
3.3 Measuring the trading costs and market impact of earnings announcements
This section describes the measures of trading costs and the market impact of earnings
announcements. Our first research question tests whether the social connection of a firm’s
executives and directors with Wall Street have a material impact on the firm’s trading costs.
Following Stoll (2000), we use the stock’s proportional quoted spread, as our measure of trading
costs. It is calculated as (ask price-bid price)/share price. We also follow Stoll in taking the
average of each underlying variables across the days over each year before calculating the annual
proportional spread. This reduces the noise associated with daily prices. Table 1 reports the
summary statistics of the annual bid-ask spread used in our main sample. An average firm’s
annual bid-ask spread is 0.8%.
We next ask the question whether information leakage prior to earnings announcements
increases when a firm has more connections to Wall Street. If a firm’s private information is
channeled to Wall Street through social connections prior to the earnings announcement date, we

12
expect to see less market reactions to the earnings announcements. To measure the market
impact of earnings announcements, we construct two measures following the previous literature.
First, we define abnormal turnover around the quarterly earnings announcements similarly to a
measure adopted by Chae (2005):
, ,
,
, ∑ ,
Where ∑ ,
Daily turnover is defined as the logarithm of daily trading volume scaled by the number of shares
outstanding. Abnormal turnover around earnings announcements is the difference between the
firm’s daily turnover averaged over the [-2, +2] window and the benchmark daily turnover
during the window of [-40, -11] prior to the earnings announcements.
We also measure the abnormal volatility around the quarterly earnings announcements
calculated as event volatility normalized by benchmark volatility minus 1. Similar to Griffin,
Hirschey, and Kelly (2009), our primary focus is on the amount of new information rather than
the direction of new information released by the earnings announcement. Therefore, the event
volatility is calculated as the mean absolute value of a firm’s stock return in excess of the
average value-weighted market return over the [-2, +2] window surrounding the earnings
announcement dates. We follow Griffin, Hirschey, and Kelly (2009) and define the benchmark
volatility as the mean absolute excess return estimated over the [-55, -3] and the [+3, +55]
13
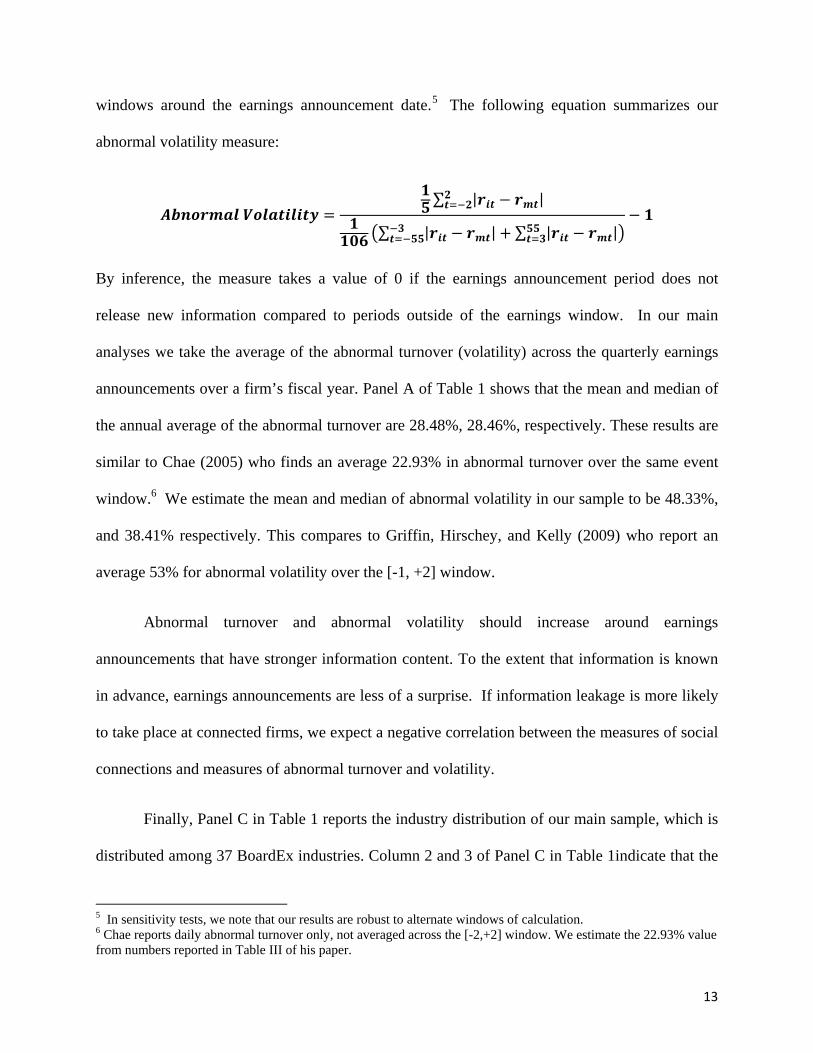
windows around the earnings announcement date.5 The following equation summarizes our
abnormal volatility measure:
∑ | |
∑ | | ∑ | |
By inference, the measure takes a value of 0 if the earnings announcement period does not
release new information compared to periods outside of the earnings window. In our main
analyses we take the average of the abnormal turnover (volatility) across the quarterly earnings
announcements over a firm’s fiscal year. Panel A of Table 1 shows that the mean and median of
the annual average of the abnormal turnover are 28.48%, 28.46%, respectively. These results are
similar to Chae (2005) who finds an average 22.93% in abnormal turnover over the same event
window.6 We estimate the mean and median of abnormal volatility in our sample to be 48.33%,
and 38.41% respectively. This compares to Griffin, Hirschey, and Kelly (2009) who report an
average 53% for abnormal volatility over the [-1, +2] window.
Abnormal turnover and abnormal volatility should increase around earnings
announcements that have stronger information content. To the extent that information is known
in advance, earnings announcements are less of a surprise. If information leakage is more likely
to take place at connected firms, we expect a negative correlation between the measures of social
connections and measures of abnormal turnover and volatility.
Finally, Panel C in Table 1 reports the industry distribution of our main sample, which is
distributed among 37 BoardEx industries. Column 2 and 3 of Panel C in Table 1indicate that the
5 In sensitivity tests, we note that our results are robust to alternate windows of calculation. 6 Chae reports daily abnormal turnover only, not averaged across the [-2,+2] window. We estimate the 22.93% value from numbers reported in Table III of his paper.

14
number of connected executives and directors in an average firm is similar across most industries
with Health and Electronic & Electrical Equipment being the least connected industries and Life
Assurance and Publishing being the most connected industries.
4. Empirical Results
Recent studies (Cohen, Frazzini, and Malloy, 2008, 2010) find evidence that social ties
facilitate the transfer of privileged insider information to outside parties. If this practice is
prevalent, firms with more ties to the investment community may have more informed trading in
their stocks. In this case, we expect these firms to have higher bid-ask spreads because informed
trading is a significant component of the spreads. These firms may also have less pronounced
market reaction to news announcements because the news may have leaked to some market
participants before the formal announcement. Empirically, we test whether firms with more ties
to Wall Street have lower abnormal trading volume and lower abnormal volatility when their
earnings are announced.
4.1. Social ties and bid-ask spread
We first examine the empirical relation between social ties and bid-ask spreads. The
micro-structure literature identifies a number of firm characteristics that are related to the cross-
sectional variation of bid-ask spread. Stoll (2000) lists five important determinants of bid-ask
spread: trading volume, volatility, stock price, market capitalization, and the number of trades
per day. We control these firm characteristics in all regression models. We also include a dummy
variable for trading on the Nasdaq exchange and calendar year dummies to control for any

15
secular trend in bid-ask spread. Thus, all of our models examine the impact of social ties
abstracting from variables known to affect bid-ask spreads.
Table 2 presents the regression results where the dependent variable is the annual percent
bid-ask spread and the key independent variable is the number of directors or executives of a
firm who are connected to Wall Street. In all models we obtain an adjusted R2 above 0.55. This
result suggests that our model captures over half of the cross-sectional variation of bid-ask
spreads in a sample of over 18,000 firms. Thus, our main result is unlikely to be driven by
omitted variables. Since the social connections are annual variables, we use the average daily
bid-ask spread over a firm’s fiscal year in this analysis. Model (1) reports a coefficient of 0.0077
for the main independent variable which is the number of connected executives and directors;
this figure is statistically significant at the 1% level with a t-statistic of 6.27. In models (2) to
(4), we separate the types of social ties by how a public firm executive and director is connected
to an investment firm executive or director – whether they know each other from current or past
employment, education, or social activities.7 The results in models (2) to (4) show that all three
types of social ties have a positive effect on the trading cost, with the coefficients for
employment-, education-, and activity-based ties equal to 0.0082, 0.0218, and 0.0135, respective.
All three coefficients are statistically significant at the 1% level. Interestingly, the ties via
education and social activities have a substantially stronger effect in increasing trading costs than
the ties via employment. The coefficient of the educational ties is more than 2.6 times higher
than the coefficient of employment ties. It appears that people connected through casual non-
professional ties are more likely to share potentially privileged information.
This coefficient on the number of connected executives and directors in Model 1 suggests
that one additional connected executive or director increases her firm’s bid-ask spread by 0.0077% 7 One executive or director may be connected to investment firms via more than one type of social ties.

16
of the stock price. This coefficient is economically significant given that the average bid-ask
spread is 0.80% of stock price and the average firm has 8 connected executive and directors. To
better understand the economic impact of connected executives and directors to shareholders, we
perform a calibration of the incremental trading costs in Table 3. We set the stock price to $50
and daily trading volume to 1 million shares. Using regression coefficients from Table 2, we
estimate that one additional connected executive or director increases her firm’s annual trading
cost by just under $1 million. Given that the average firm has eight connected directors and
assuming a discount rate of 5% to capitalize the annual trading cost, the director and executives’
social ties with Wall Street reduces shareholder wealth by about $160 million ($1million ×
8/0.05 = $160 million) for the average firm.
Table 3 also shows that one executive or director connected through employment
increases the firm’s annual trading cost by just over $1 million. In contrast, one additional
executive or director connected through education or activity increases the firm’s annual trading
cost by $2.7 million and $1.7 million, respectively. These results suggest that executive and
directors’ informal social ties to Wall Street can be quite costly to their shareholders. Of course,
these connections to Wall Street can easily provide benefits to the firm and its shareholders. The
existence and magnitude of any benefits is beyond the scope of the current analysis.
Nevertheless, our results provide a benchmark against which any benefits can be measured.
4.2. Social ties and the market impact of earnings announcements
Earnings announcements are arguable one of the most important corporate disclosures to
investors and often have a direct impact on stock prices, resulting in substantial increases in
trading volume and volatility. If earnings information is transferred through the social ties of a

17
firm’s executive and directors prior to the formal earnings announcement, we expect to observe a
smaller market impact when these firms announce earnings. Following Chae (2005) and Griffin,
Hirschey, and Kelly (2009), we measure the market impact using abnormal share turnover and
abnormal return volatility around earnings announcements. Since the social connection variables
are of annual frequency, we average the abnormal turnover ratio or abnormal volatility over the
four quarterly earnings announcements of a year for results reported in Tables 4 and 5.
4.2.1. Social ties and abnormal trading activities around earnings announcements
We first examine the empirical relation between a firm’s social ties with Wall Street and
the trading activities of its stock around earnings announcements. If such social ties facilitate
information transfer to investors prior to the formal earnings announcements, we expect the firms
to experience lower abnormal trading activities upon formal announcements. Following Chae
(2005), we measure trading activities using abnormal turnover. This variable measures the
additional share turnover around earnings announcement compared to that of the normal period.
Table 4 reveals that a firm’s social ties with the investment community have a significantly
negative effect on its abnormal turnover ratio around earnings announcements. Model (1) shows
that one additional connected executive or director reduces abnormal turnover ratio by 0.4%, and
this figure is statistically significant at the 1% level. Models (2) to (4) reveals that one additional
connection via employment, education, and activities reduces the abnormal turnover ratio by
0.27%, 0.86%, and 1.10%, respective. All three figures are statistically significant at the 1%
level. Again, insiders appear more likely to transfer private information through social ties based
on education or leisure activities than ties based on employment.

18
To put these numbers in perspective, we note that the average firm has an abnormal log
turnover ratio of 28% around earnings announcement. That is, the average firm experiences a 32%
(e0.28 – 1) higher turnover ratio around earnings announcement than during the normal period.
Given that the average firm has eight connected directors and executives and each of them
reduces the abnormal turnover ratio by 0.4%, the social ties on average reduce the abnormal
turnover ratio by 3.2% (e0.032 – 1), or about10% of the average abnormal turnover ratio. It is
possible that abnormal turnover surrounding earnings announcements is 10% lower due to
trading activity occurring before the formal announcements as a result of information transfers
through social ties.
4.2.2. Social ties and abnormal volatility around earnings announcements
We next examine the relation between social ties and the abnormal return volatility
around earnings announcements. Similar to abnormal turnover, abnormal return volatility
measures the market impact, or surprise, of an earnings announcement. Table 5 reveals that a
firm’s social ties with Wall Street significantly weaken the information content of its earnings
announcement. Model (1) shows that one additional executive or director who is connected to
Wall Street reduces her firm’s abnormal volatility by 0.51% around earnings announcements,
and this figure is statistically significant at the 1% level. Models (2) to (4) show that one
additional social tie based on employment, education, and leisure activities reduces abnormal
volatility by 0.29%, 1.13%, and 1.89%, respectively. All three figures are statistically significant
at the 1% level.
To put these numbers in perspective, we note that the average firm has an abnormal
volatility of 48% around earnings announcement. That is, the average firm’s return volatility is

19
48% higher around earnings announcement than during the normal period. Given that the
average firm has eight connected executives and directors and one additional connected
individual reduces the abnormal volatility by 0.51%, the social ties of the average firm reduces
its abnormal volatility ratio by 4.1%, or about 8% of the average abnormal volatility around
earnings announcements.
4.2.3. Do social ties make earnings surprise less surprising to the market?
The market impact of an earnings announcement depends on how much the actual
earnings differ from the expected earnings, commonly known as earnings surprise. Following the
literature, we measure the expected earnings with the consensus analyst forecast.8,9 We ask the
following question in this investigation – for firms with many social ties to Wall Street, is an
earnings surprise to the analysts less of a surprise to the market? Since earnings surprise differs
from quarter to quarter, we estimate regressions of firm/quarter panels in Tables 6 and 7.
In Table 6, the dependent variable is the quarterly abnormal turnover. The key
independent variables include a dummy variable of a large earnings surprise (above median) and
the interaction of this dummy variable with social tie variables. For control variables, we include
firm size, analyst forecast dispersion, number of analysts, and calendar quarter fix effects.
Model (1) of Tables 6 shows that firms with larger earnings surprise on average
experience 6% higher abnormal share turnover when they announce the earnings. This figure is
statistically significant at the 1% level. Models (2) to (4) show similar coefficients for the large
earnings surprise dummy, and all coefficients are statistically significant well beyond the 1% 8 DeFond and Park (2001), Bailey, Karolyi, and Salva (2006), Barron, Byard, and Yu (2008), among others, measure expected earnings with consensus analyst forecast.
9 Our measure of social network does not capture a firm’s ties with the analyst community unless an analyst is also listed as an executive or director of her firm, which is very unlikely. As a result, we do not find that the highly connected firms are associated with less surprising earnings announcements.

20
level. Social ties, however, significantly reduce the effect of an earnings surprise. That is, an
earnings surprise is not as surprising to the market if a firm is well connected with Wall Street.
Model (1) shows that for firms with a large earnings surprise one additional connected executive
or director reduces the abnormal turnover ratio by 0.3%, and this figure is statistically significant
at the 1% level. For the average firm with eight executives and directors connected to Wall Street,
the market impact of large earnings surprise is reduced by 40%. Models (2) to (4) again show
that social ties resulting from education or leisure activities have a substantially larger effect in
reducing an earnings surprise than ties resulting from employment overlap. For firms with a
large earnings surprise, one additional connected executive or director via education or leisure
activities reduces the abnormal turnover ratio by 0.72% while one additional individual
connected via employment only reduces abnormal turnover by 0.23%.
In Table 7 we replace the abnormal turnover ratio with the abnormal volatility. The
results are qualitatively similar, although the only one social tie variable is statistically
significant.
4.3. Sarbanes-Oxley Act
The Sarbanes-Oxley Act was intended to make executives and directors of U.S. public
companies more accountable. It could help to reduce the transfer of insider information to their
friends and affiliates. We examine in Table 8 whether the relation between a firm’s social ties
with Wall Street and its trading cost becomes weaker after SOX. We define a SOX dummy that
takes the value of one for observations after year 2002 and zero otherwise. We then interact this
dummy variable with the social network variables and include this interaction variable in the bid-
ask spread regressions.

21
Model (1) of Table 8 shows that the number of connected executives and directors in a
firm has a positive coefficient of 0.021 while the interaction indicating the post SOX period has a
negative coefficient of -0.015. Both figures are statistically significant at the 1% level. This
result suggests that before SOX one additional connected director or executive increases her
firm’s bid-ask spread by 0.021% while this effect is reduced by 0.015% after SOX. That is,
nearly 75% of the effects of the connected executives and directors on bid-ask spread disappear
after SOX. The difference between the two figures is 0.006% and is statistically significant at the
1% level. Thus, although SOX significantly reduces the potentially illegitimate transfer of
insider information, SOX does not entirely eliminate such information transfer. Model (2) shows
that for employment based connections, SOX reduces the effect of each connected individual on
her firm’s bid-ask spread from 0.02% to 0.006%. For education based connections reported in
Model (3), SOX reduces the effect of each connected individual on her firm’s bid-ask spread
from 0.044% to 0.019%. For activity based connections reported in Model (4), SOX reduces the
effect of each connected individual on her firm’s bid-ask spread from 0.028% to 0.01%. In all
three models, SOX significantly reduces the effect of social ties on a firm’s trading costs yet
does not entirely eliminate the effect.
We next examine whether SOX helps to reduce the effect of social ties on abnormal
trading volume around earnings announcements. In previous tables we have shown that firms
with more social ties to Wall Street tend to have lower abnormal trading volume and abnormal
volatility around their earnings announcements, possibly due to information leakage. If SOX
helps to reduce such information leakage, we expect to see a positive coefficient for the
interaction variable between the SOX dummy and social tie variables. Table 9 shows that in all
four models the social ties variables have significantly negative coefficients, similar to our
22
findings in Table 4. The interaction variables between the SOX dummy and the social ties have
positive coefficients but are statistically insignificant.
Table 10 reports the results for abnormal volatility. In all four regression models, the
social tie variables are significantly negative, consistent with our earlier results in Table 5. In
contrast, all four coefficients of the interaction variables are positive. Three of the four figures
are statistically significant at the 1% level and the fourth one is significant at the 5% level. This
result suggests that after SOX the negative effect of social ties on abnormal volatility around
earnings announcements becomes significantly weaker. The overall results of Tables 8 to 10
suggest that SOX legislation is associated with significant reduction of insider information
transfer through social networks.
5. Summary and conclusions
A growing literature in finance examines the consequences of the flow of information
through social networks and the resulting impact on financial markets. Several influential
studies examine the benefits of timely access to this information. Nevertheless, there is one area
in which information flows through social networks can produce negative impacts to shareholder
wealth – the cost of trading. Quite simply, the selective flows of information to particular parties
connected with Wall Street increase the probability of informed trading. We find that spreads
increase with the degree of social connections surrounding a firm.
The extent to which social networks actually impact bid-ask spreads is an empirical issue.
To explore this issue, we test several hypotheses using a network of connections between
executives and directors of public firms and key members of the investment community. Our
sample includes over 18,000 firm/year observations. Our results indicate that the social

23
connections between a firm’s executives and Wall Street are associated with significantly and
economically meaningful increases in the firm’s bid-ask spread. At a typical firm one such
connection is associated with additional trading cost amounts to approximately a million dollars
per year. We estimate that at the average firm of eight connected executive and directors such
connections reduce shareholder wealth by over $160 million. We examine three types of social
connections: education, employment and leisure activities. The effects we document are even
larger for connections through school ties and leisure activities. In addition to the absolute
magnitude of the increased trading costs, our work provides evidence of the importance of social
networks in the transfer of privileged information. The Sarbanes Oxley Act significantly
reduces, but does not eliminate, the importance of social networks in the transfer of information.
We also examine other implications of information flows to Wall Street through social
networks. In particular, when a company releases new information, some of that information
will already be reflected in a firm’s stock price through social networks; earnings announcements
would be less informative. Consistent with this, we find that social connections with Wall Street
significantly reduce abnormal turnover and abnormal volatility around earnings announcements.
Our work contributes to the growing literature on social networks. The results are
consistent with information flows through social networks and the adjustment for these flows in
Wall Street trading. These adjustments significantly impact trading costs to shareholders. Thus,
we also provide additional evidence on components of the bid-ask spread. Finally, we provide
information on the relation between social ties and the information content of earnings
announcements and earnings surprises.
24
References
Bagehot, W. (pseudonum for Jack Treynor), 1971. The only game in town. Financial Analysts Journal 27, 31-53.
Bailey, W., Karolyi GA., and Salva, C., 2006. The economic consequence of increased disclosure: Evidence from international cross-listings. Journal of Financial Economics 81, 175-213.
Barnea, A., and Guedj, I., 2009. Director network. Available at SSRN: http://ssrn.com/abstract=966555.
Barron, OE., Byard, D., and Yu, Y., 2008. Earnings surprises that motivate analysts to reduce average forecast error. The Accounting Review 83, 303-325.
Benveniste, LM., Marcus AJ., and Wilhelm, WJ., 1992. What’s special about the specialist? Journal of Fianncial Economics 32, 61-86.
Butler, A., and Gurun, UG., 2009. Connected companies’ compensation. Available at SSRN: http://ssrn.com/abstract=1195202
Chae, J., 2005. Trading volume, information asymmetry, and timing information. The Journal of Finance 60, 413-442.
Cohen, L., Frazzini, A., and Malloy, C., 2008. The small world of investing: board connections and mutual fund managers. Journal of Political Economy 116, 951-979.
Cohen, L., Frazzini, A., and Malloy, C., 2010. Sell-side school tie. The Journal of Finance 65, 1409-1437.
Copeland T., and Galai, D., 1983. Information effects of the bid-ask spread. The Journal of Finance 28, 1457-1469.
DeFond, ML., and Park, CW., 2001. The reversal of abnormal accruals and the market valuation of earnings surprises. The Accounting Review 76, 375-404.
Engelberg, J., Gao, P., and Parson, CA., 2009. The value of rolodex: CEO pay and personal networks. Available at SSRN: http://ssrn.com/abstract=1364595
Engelberg, J., Gao, P., and Parson, CA., 2010. Friends with Money. Available at SSRN: http://ssrn.com/abstract=1572386
Fracassi, C., and Tate, GA., 2010. External networking and internal firm governance. Available at SSRN: http://ssrn.com/abstract=1213358
Kuhnen, C., 2009. Business networks, corporate governance, and contracting in the mutual fund industry. The Journal of Finance 44, 2185-2220.

25
Larcker, DF., Richardson, SA., and Seary, A., and Tuna, A.I., 2005. Back door links between directors and executive compensation. Available at SSRN: http://ssrn.com/abstract=671063.
Larcker, DF., So, EC., and Wang, CCY., 2010. Boardroom centrality and stock returns. Rock Center for Corporate Governance working paper series No. 84, Stanford University.
Garfinkel, JA., and Nimalendran, M., 2003. The Journal of Financial and Quantitative Analysis 38, 591-610.
Glosten, L., and Milgrom, P., 1985. Bid, ask and transaction prices in specialist market with heterogeously informed traders. Journal of Financial Economics 14, 71-100.
Griffin, J., Hirschey. N., and Kelly, P., 2010. How important is the financial press in global markets? The University of Taxes Working Paper.
Hochberg, YV., Ljungqvist, A., and Lu, Y., 2007. Whom you know matters: venture capital networks and investment performance. The Journal of Finance 62, 251-301.
Hong, H., Kubik, JD., and Stein, JC., 2004. Social interaction and stock –market participation. The Journal of Finance 59, 137-163.
Hong, H., Kubik, JD., and Stein, JC., 2005. Thy neighbor’s portfolio: world-of-mouth effects in the holdings and trades of money managers. The Journal of Finance 60, 2801-2824.
Hwang, BH., and Kim, S., 2009. It pays to have friends. Journal of Financial Economics 93,138-158.
Hwang, BH., and Kim, S., 2010. Earnings management and social ties. Available at SSRN: http://ssrn.com/abstract=1215962.
Stoll, H., 1989. Inferring the components of the bid-ask spread: Theory and Empirical Tests. The Journal of Finance 44, 115-134.
Stoll, H., 2000. Friction. The Journal of Finance 55, 1479-1514.
26
Table 1: Summary statistics
The sample consists of 18,505 firm/year observations available from CRSP, Compustat, and BoardEx during the period of 2000-2008. We exclude all financial firms from the analysis. Panel A presents the summary statistics of the firm characteristics. Log market cap is the logarithm of the product of average number of shares outstanding and the average share price over a firm’s fiscal year. We follow Stoll (2000) and define the stock’s proportional quoted bid-ask spread as (ask price-bid price)/share price. We also follow Stoll in taking the average of each underlying variable over a firm’s fiscal year in calculating the annual bid-ask spread. Following Chae (2005), we calculate abnormal turnover around quarterly earnings announcements as the difference between the average daily turnover across the [-2, +2] window and the benchmark daily turnover, where the daily turnover is the logarithm of trading volume divided by shares outstanding. The benchmark turnover is the average daily turnover estimated during the [-40, -11] window prior to the earnings announcements. To calculate the annual abnormal turnover, we take the average abnormal turnovers across the quarterly earnings announcements over a firm’s fiscal year. Abnormal volatility around quarterly earnings announcements is calculated as the event volatility estimated over the [-2, +2] window normalized by the benchmark volatility estimated over the [-55, -3] and [+3, +55] windows minus 1, where the volatility is calculated as the absolute difference between the stock daily return and the market return. The annual abnormal volatility is the average of the abnormal volatility over the firm’s fiscal year. Panel B reports the number of connected executives and directors a company has via employment, education, or activities. An executive or director is connected to the Wall Street, if she is affiliated with an investment firm or once had employment, education, or activity overlap with an executive or director of an investment firm. Investment firms include all firms classified by BoardEx as “Private Equity,” “Investment Companies,” or “Specialty and other Finance”. Panel C reports the distribution of the BoardEx industry classifications of the sample.
N Mean Median Std. Dev Panel A: Firm Characteristics Log (Market value) 18,505 13.04 13.03 1.80 Bid-ask spread (annual %) 18,505 0.80 0.39 1.12 Abnormal turnover around EA (%) 18,505 28.48 28.46 30.64 Abnormal volatility around EA (%) 18,505 48.33 38.41 53.96 Panel B: Social Tie # of reported executive and directors 18,505 17.17 16.00 6.59 # of connected executive and directors 18,505 8.33 7.00 5.95
via employment 18,505 7.01 5.00 6.13 via education 18,505 1.50 1.00 1.69 via activities 18,505 3.56 3.00 3.42
(continued)

27
Panel C: Industry Distribution
Number of Firm/year observations
Number of connected executive and directors
Industry Mean Median Aerospace & Defense 149 8.3 8.0 Automobiles & Parts 274 9.3 8.0 Beverages 67 12.0 7.0 Blank Check / Shell Companies 2 7.5 7.5 Business Services 1084 8.2 7.0 Chemicals 518 9.7 8.0 Clothing, Leisure and Personal Products 355 8.5 6.0 Construction & Building Materials 493 8.3 7.0 Consumer Services 111 8.7 7.0 Containers & Packaging 94 9.1 8.5 Diversified Industrials 142 8.9 7.0 Education 103 8.9 8.0 Electricity 81 13.0 11.0 Electronic & Electrical Equipment 2307 7.0 6.0 Engineering & Machinery 943 7.9 7.0 Food & Drug Retailers 127 9.0 7.0 Food Producers & Processors 490 8.7 6.0 Forestry & Paper 174 10.5 9.0 General Retailers 977 9.5 8.0 Health 1091 6.8 6.0 Household Products 247 8.3 7.0 Information Technology Hardware 743 7.7 6.0 Leisure & Hotels 535 8.5 7.0 Life Assurance 23 13.3 11.0 Media & Entertainment 391 8.2 6.0 Mining 179 8.0 6.0 Oil & Gas 796 7.2 6.0 Pharmaceuticals and Biotechnology 1377 8.2 7.0 Publishing 226 13.3 12.0 Real Estate 787 8.7 8.0 Software & Computer Services 1447 8.2 7.0 Steel & Other Metals 186 8.9 8.0 Telecommunication Services 537 8.7 7.0 Tobacco 31 8.8 9.0 Transport 605 8.5 7.0 Utilities - Other 543 11.7 10.0 Wholesale Trade 270 7.2 6.0

28
Table 2: Do a firm’s social connections to Wall Street affect its trading cost?
The sample is described in Table 1. The dependent variable is a firm’s annual bid-ask spread as defined in Table 1. Volume is the logarithm of the average daily dollar volume of trading over the firms’ prior fiscal year. Log market cap is the logarithm of the product of average number of shares outstanding and the average share price over the prior fiscal year. Price is the logarithm of the average closing sharing price over the prior fiscal year. The Nasdaq dummy equals one if the stock is listed on Nasdaq and zero otherwise. Average daily trade is the logarithm of the average number of trades per day over the firm’s prior fiscal year. Return variance is the variance of the stock’s daily return over the prior fiscal year. t-statistics are shown in parentheses. ***, **, and * denote statistical significance at the 1%, 5%, and 10% levels, respectively.
Variable
Dependent variable = Annual Bid-Ask Spread (%)
(1) (2) (3) (4) Intercept 1.78 1.79 1.74 1.84 (20.55)*** (20.82)*** (20.41)*** (20.46)*** # of connected executives and directors (× 10-2) 0.77 (6.27)*** # of connected executives and directors via employment(× 10-2) 0.82 (7.26)*** # of connected executives and directors via education (× 10-2) 2.18 (5.89)*** # of connected executives and directors via activities (× 10-2) 1.35
(6.23)***
Log volume -0.31 -0.31 -0.31 -0.31 (-41.31)*** (-41.40)*** (-41.20)*** (-40.94)*** Log market cap 0.16 0.16 0.17 0.16 (15.70)*** (15.92)*** (16.85)*** (15.06)*** Log Price -0.23 -0.23 -0.24 -0.23 (-28.37)*** (-28.32)*** (-29.18)*** (-28.67)*** Nasdaq Dummy 0.73 0.73 0.73 0.73 (19.27)*** (19.19)*** (19.26)*** (19.03)*** Log average daily trades* Nasdaq dummy -0.15 -0.15 -0.15 -0.14 (-25.09)*** (-25.06)*** (-25.29)*** (-24.53)*** Return variance 95.31 95.20 94.89 94.95 (36.31)*** (36.28)*** (36.13)*** (36.16)*** Year dummy Yes Yes Yes Yes Adj-R2 0.57 0.57 0.57 0.57 N 18,505 18,505 18,505 18,505

29
Table 3: The economic impact of one additional connection to Wall Street on annual trading costs.
This table reports a calibration of the dollar value impact associated with one more connection to Wall Street on a typical firm’s trading cost. We perform our calculations using the regression coefficients of the social tie measures reported in Table 2. For this exercise, we assume a stock price of $50 with a daily trading volume of 1,000,000 shares. We set the number of trading days per year to 252 days and calibrate the additional annual trading costs. To calculate the Capitalized present value of additional future transaction cost, we assume a discount rate of 5%.
All Ties Employment Based Ties
Education Based Ties
Activities Based Ties
Regression Coefficient 0.77 0.82 2.18 1.35 Stock Price $50 $50 $50 $50 Increase in Bid-Ask spread $0.004 $0.004 $0.011 $0.007 Daily Trading Volume (in 1,000 shares) 1,000 1,000 1,000 1,000 Number of trading days/year 252 252 252 252 Additional annual trading cost from one
connected executive or director (in $million)
$0.97 $1.03 $2.75 $1.70
Avg. Number of connected executives and directors 8.3 7 1.5 3.5
Capitalized PV of additional future transaction cost from all connected executives and directors (in $ million)
$161.0 $144.6 $82.4 $119.1

30
Table 4: Does a firm’s social connection to Wall Street affect its trading activity around earnings announcements?
The sample is described in Table1. The dependent variable is a firm’s annual average abnormal turnover (trading) around its quarterly earnings announcements. All variables are as defined in Table1. t-statistics are shown in parentheses. ***, **, and * denote statistical significance at the 1%, 5%, and 10% levels, respectively.
Variable
Dependent variable = Annual average abnormal turnover over earnings announcements
(1) (2) (3) (4) Intercept 25.52 27.61 28.62 18.97 (12.14)*** (13.27)*** (14.05)*** (8.70)*** # of connected executive and directors
-0.40 (-8.25)***
# of connected executive and directors via employment
-0.27
(-5.98)***
# of connected executive and directors via education
-0.86
(-5.75)***
# of connected executive and directors via activities
-1.10
(-13.25)***
Log market cap 0.88 0.58 0.43 1.39 (5.48)*** (3.79)*** (3.04)*** (8.65)*** Year dummy Yes Yes Yes Yes Adj-R2 0.04 0.04 0.04 0.05 N 18,505 18,505 18,505 18,505
31
Table 5: Does a firm’s social connection to Wall Street affect its volatility around earnings announcements?
The sample is described in Table1. The dependent variable is a firm’s annual average abnormal volatility around quarterly earnings announcements. All variables are as defined in Table1. t-statistics are shown in parentheses. ***, **, and * denote statistical significance at the 1%, 5%, and 10% levels, respectively.
Variable
Dependent variable = Annual average abnormal volatility around earnings announcements (1) (2) (3) (4)
Intercept -17.46 -14.04 -13.65 -31.52 (-4.81)*** (-3.91)*** (-3.88)*** (-8.38)*** # of connected executive and directors
-0.51 (-6.08)***
# of connected executive and directors via employment
-0.29
(-3.77)***
# of connected executive and directors via education
-1.13
(-4.39)***
# of connected executive and directors via activities
-1.89
(-13.22)***
Log market cap 5.75 5.28 5.20 7.01 (20.74)*** (19.90)*** (21.24)*** (25.21)*** Year dummy Yes Yes Yes Yes Adj-R2 0.08 0.08 0.08 0.09 N 18,505 18,505 18,505 18,505

32
Table 6: Abnormal turnover and large earnings surprises
This sample consists of 39,489 firm/quarter observations during the period of 2000-2008. Following the sample selection criteria defined in Table1, we further require that the firm be followed by at least two analysts and have non-missing analyst forecasts of earnings per share provided by the Institutional Brokers Estimate System (I/B/E/S). The dependent variable is the abnormal turnover around a firm’s quarterly earnings announcements. Earnings surprises are calculated as the absolute value of the difference between actual earnings per share and the median analyst forecast, normalized by the median analyst forecast. Earnings surprises are winsorized at the 1st and 99th percentiles. The large earnings surprise dummy equals one if the earnings surprise is above the sample median in that quarter and zero otherwise. Log market cap is the logarithm of the product of average number of shares outstanding and the average share price over the 20 days prior to the earnings announcement. Dispersion is the cross-sectional standard deviation of the analyst’s forecasts. Number of analysts is the number of analysts that follow the firm at the time of the earnings announcements. All the other variables are as defined in Table1. t-statistics are shown in parentheses. ***, **, and * denote statistical significance at the 1%, 5%, and 10% levels, respectively.
Variable
Dependent variable = Abnormal turnover around quarterly earnings announcement
period [-2, +2] (1) (2) (3) (4)
Intercept 28.19 29.28 29.97 25.77 (6.76)*** (7.05)*** (7.24)*** (6.13)*** Large earnings surprise dummy 6.22 5.24 4.64 6.31 (8.93)*** (8.47)*** (8.58)*** (10.48)*** Large earnings surprise dummy *# of connected executive and directors -0.30 (-5.09)*** Large earnings surprise dummy *# of connected executive and directors via employment -0.23 (-4.07)*** Large earnings surprise dummy *# of connected executive and directors via education -0.72 (-3.71)*** Large earnings surprise dummy *# of connected executive and directors via activities -0.72 (-6.86)*** Log market cap -0.08 -0.17 -0.22 0.09 (-0.39) (-0.81) (-1.08) (0.41) Dispersion 0.00 0.00 0.00 0.00 (-0.25) (-0.26) (-0.33) (-0.27) Number of analysts 0.56 0.57 0.57 0.55 (11.45)*** (11.54)*** (11.59)*** (11.17)*** Quarter dummy Yes Yes Yes Yes Adj-R2 0.05 0.05 0.05 0.05 N 39,489 39,489 39,489 39,489

33
Table 7: Abnormal volatility and Large earnings surprises
The sample is defined in Table 6. The dependent variable is the abnormal volatility around quarterly earnings announcements. Earnings surprises are calculated as the absolute value of the difference between actual earnings per share and the median analyst forecast, normalized by the median analyst forecast. Earnings surprises are winsorized at the 1st and 99th percentiles. The large earnings surprise dummy equals one, if the earnings surprise is above the sample median and zero otherwise. Log market cap is the logarithm of the product of average number of shares outstanding and the average share price over the 20 days prior to the earnings announcement. Dispersion is the cross-sectional standard deviation of the analyst’s forecasts. Number of analysts is the number of analysts that follows the firm at the time of the earnings announcements. All the other variables are as defined in Table1. t-statistics are shown in parentheses. ***, **, and * denote statistical significance at the 1%, 5%, and 10% levels, respectively.
Variable
Dependent variable = Abnormal volatility around quarterly earnings announcement
period [-2, +2] (1) (2) (3) (4)
Intercept -21.23 -19.89 -20.64 -27.74 (-2.53)** (-2.38)** (-2.48)** (-3.28)*** Large earnings surprise dummy 8.95 7.89 8.31 11.39 (6.38)*** (6.34)*** (7.63)*** (9.39)*** Large earnings surprise dummy *# of connected executive and directors -0.17 (-1.47) Large earnings surprise dummy *# of connected executive and directors via employment -0.07 (-0.63) Large earnings surprise dummy *# of connected executive and directors via education -0.59 (-1.51) Large earnings surprise dummy *# of connected executive and directors via activities -1.03 (-4.83)*** Log market cap 4.85 4.75 4.81 5.33 (11.58)*** (11.43)*** (11.69)*** (12.55)*** Dispersion 0.00 0.00 0.00 0.00 (-0.20) (-0.21) (-0.23) (-0.20) Number of analysts 0.24 0.24 0.24 0.21 (2.43)** (2.47)** (2.46)** (2.16)** Quarter dummy Yes Yes Yes Yes Adj-R2 0.05 0.05 0.05 0.05 N 39,489 39,489 39,489 39,489

34
Table 8: Does SOX reduce the effect of social network on trading costs?
The sample is described in Table1. The dependent variable is a firm’s annual bid-ask spread. The Sox dummy equals one if it is year 2003 or after and zero otherwise. All the other variables are as defined in Table1. t-statistics are shown in parentheses. ***, **, and * denote statistical significance at the 1%, 5%, and 10% levels, respectively.
Dependent variable =
Annual Bid-Ask Spread (%) (1) (2) (3) (4) Intercept 1.83 1.83 1.75 1.85 (20.98)*** (21.16)*** (20.52)*** (20.57)*** # of connected executive and directors (× 10-2)
2.11 (7.96)***
# of connected executive and directors (× 10-2) * SOX Dummy
-1.54 (-5.70)***
# of connected executive and directors via employment(× 10-2)
2.00 (7.79)***
# of connected executive and directors via employment(× 10-2) * SOX Dummy
-1.36 (-5.11)***
# of connected executive and directors via education (× 10-2)
4.42 (4.59)***
# of connected executive and directors via education (× 10-2) * SOX Dummy
-2.53 (-2.52)**
# of connected executive and directors via activities (× 10-2)
2.79 (7.08)***
# of connected executive and directors via activities (× 10-2) * SOX Dummy
-1.79 (-4.36)***
Log volume -0.31 -0.31 -0.31 -0.31 (-40.90)*** (-41.10)*** (-41.09)*** (-40.64)*** Log market cap 0.15 0.16 0.16 0.15 (15.28)*** (15.59)*** (16.74)*** (14.93)*** Log Price -0.23 -0.23 -0.24 -0.23 (-27.91)*** (-27.96)*** (-29.07)*** (-28.38)*** Nasdaq Dummy 0.74 0.73 0.73 0.73 (19.43)*** (19.29)*** (19.32)*** (19.20)*** Log average daily trades* Nasdaq dummy -0.15 -0.15 -0.15 -0.15 (-25.18)*** (-25.12)*** (-25.34)*** (-24.67)*** Return variance 95.48 95.21 94.91 95.35 (36.40)*** (36.31)*** (36.14)*** (36.31)*** Year dummy Yes Yes Yes Yes Adj-R2 0.57 0.57 0.57 0.57 N 18,505 18,505 18,505 18,505

35
Table 9: Does SOX reduce the effect of social network on abnormal turnover
The sample is described in Table1. The dependent variable is a firm’s annual average abnormal turnover (i.e., trading) around quarterly earnings announcement. The Sox dummy equals one if it is year 2003 or after and zero otherwise. All the other variables are as defined in Table1. t-statistics are shown in parentheses. ***, **, and * denote statistical significance at the 1%, 5%, and 10% levels, respectively.
Dependent variable =
Annual average abnormal turnover around earnings announcements (1) (2) (3) (4)
Intercept 25.39 27.57 28.58 18.97 (12.06)*** (13.23)*** (14.02)*** (8.70)***
# of connected executive and directors -0.50
(-4.76)*** # of connected executive and directors * SOX Dummy
0.1229 (1.12)
# of connected executive and directors via employment
-0.31 (-3.01)***
# of connected executive and directors via employment* SOX Dummy
0.05 (0.45)
# of connected executive and directors via education
-1.04 (-2.64)***
# of connected executive and directors via education * SOX Dummy
0.20 (0.49)
# of connected executive and directors via activities
-1.10 (-7.06)***
# of connected executive and directors via activities * SOX Dummy
0.01 (0.04)
Log market cap 0.87 0.58 0.43 1.39 (5.45)*** (3.78)*** (3.03)*** (8.62)*** Year dummy Yes Yes Yes Yes Adj-R2 0.04 0.04 0.04 0.05 N 18,505 18,505 18,505 18,505

36
Table 10: Does SOX reduce the effect of social networks on abnormal volatility
The sample is described in Table1. The dependent variable is a firm’s abnormal volatility. The Sox dummy equals one if it is year 2003 or after and zero otherwise. All the other variables are as defined in Table1. t-statistics are shown in parentheses. ***, **, and * denote statistical significance at the 1%, 5%, and 10% levels, respectively.
Dependent variable =
Annual average abnormal volatility around earnings announcements (1) (2) (3) (4) Intercept -18.40 -14.71 -14.07 -31.39 (-5.06)*** (-4.09)*** (-4.00)*** (-8.34)***
# of connected executive and directors -1.26
(-6.90)*** # of connected executive and directors * SOX Dummy
0.88 (4.63)***
# of connected executive and directors via employment
-0.91 (-5.10)***
# of connected executive and directors via employment* SOX Dummy
0.72 (3.84)***
# of connected executive and directors via education
-3.00 (-4.43)***
# of connected executive and directors via education * SOX Dummy
2.12 (2.98)***
# of connected executive and directors via activities
-2.46 (-9.15)***
# of connected executive and directors via activities * SOX Dummy
0.73 (2.53)**
Log market cap 5.72 5.26 5.19 6.95 (20.63)*** (19.82)*** (21.22)*** (24.93)*** Year dummy Yes Yes Yes Yes Adj-R2 0.08 0.08 0.08 0.08 N 18,505 18,505 18,505 18,505