Embed Size (px)
Citation preview

The Price of Violence
Long term effects of assault on labor force participation
and health
Petra Ornstein, Uppsala university
Violence is bad, but how bad?
Information on the impact of assault is useful for:
• Meeting the needs of assault victims
• Policy decisions through information on expected benefit of crime reduction strategies
• Sociological understanding of violence
The Price of Violence 2

Identification problem
• Focus: Violence -> ill-healthLack of studies on causal link! (Ehrensaft et al, 2006; Kilpatrick et
al., 1997; Lindhorst and Oxford, 2008; Stevenson & Wolfers, 2006)
• Reverse causationsubstance abuse -> violence exposure (Kilpatrick et al, 1997)
• ConfoundingLack of resources -> stress -> ill health
(Aizer, 2010) -> violence exposure
The Price of Violence 3
Robust connection between assault and ill-health (in women), but what are the causal effects?

Identification strategy
• Large-scale and high-quality longitudinal data• Follow individuals previous to assault• Rich background information• Propensity score matching
The Price of Violence 4
• Identification• Including men• Large sample (-> Heterogenous effects)• Long term effects• Objective measures
Improvements on previous studies

SetupDATA• Micro data from administrative registers• LOUISE/LISA: Swedish population 16-64 years 1994-2008• Cause of death Register • National Inpatient Care Register
SELECTED SAMPLE• Registered in Sweden at least two consecutive years in 1997-2002• Not hospitalized because of assault previous to 1998• Cases have been hospitalized with cause of injury ”assault” in 1998-
2002• Matches are selected on information 1-4 years prior to the assault
The Price of Violence 5
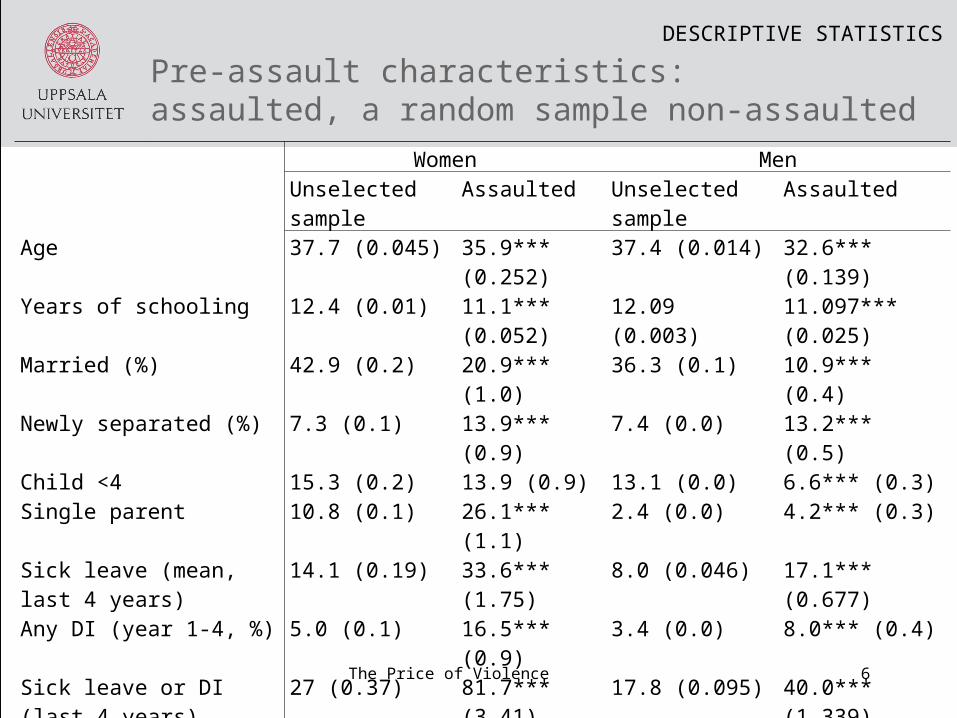
Pre-assault characteristics:assaulted, a random sample non-assaulted
The Price of Violence 6
DESCRIPTIVE STATISTICS
Women MenUnselected sample Assaulted Unselected sample Assaulted
Age 37.7 (0.045) 35.9*** (0.252) 37.4 (0.014) 32.6*** (0.139)Years of schooling 12.4 (0.01) 11.1*** (0.052) 12.09 (0.003) 11.097*** (0.025)Married (%) 42.9 (0.2) 20.9*** (1.0) 36.3 (0.1) 10.9*** (0.4)Newly separated (%) 7.3 (0.1) 13.9*** (0.9) 7.4 (0.0) 13.2*** (0.5)Child <4 15.3 (0.2) 13.9 (0.9) 13.1 (0.0) 6.6*** (0.3)Single parent 10.8 (0.1) 26.1*** (1.1) 2.4 (0.0) 4.2*** (0.3)Sick leave (mean, last 4 years)
14.1 (0.19) 33.6*** (1.75) 8.0 (0.046) 17.1*** (0.677)
Any DI (year 1-4, %) 5.0 (0.1) 16.5*** (0.9) 3.4 (0.0) 8.0*** (0.4)Sick leave or DI (last 4 years) 27 (0.37) 81.7*** (3.41) 17.8 (0.095) 40.0*** (1.339)In-care patient (%) 55.8 (0.2) 81.7*** (1.0) 35.4 (0.1) 58.6*** (0.7)Mental problem diagnose (%) 4.0 (0.1) 34.9*** (1.2) 4.1 (0.0) 22.5*** (0.6)Working (%) 75.2 (0.2) 38.2*** (1.2) 78.8 (0.1) 50.8*** (0.7)Real income + transactions (mean, last 4 years, SEK)
120,000 (280) 106,000 (1280) 144,000 (295) 910,000 (957)
Risk occupation (%) 35.8 (0.2) 22.2*** (1.1) 7.6 (0.0) 5.1 (0.3)Observations 500,000 1 536 500,000 5345

Missing Data
Di: Assault victimization
Yi1: Potential outcome for unit i after assault
Yi0: Potential outcome for unit i, not assaulted
For individual i=1,...,N we observe
Yi = Yi1 Di +(1- Di) Yi0
-> Never both potential outcomes!The Price of Violence 7
EVALUATION PROBLEM

Identifying Assumption 1: SUTVA
Stable Unit Treatment Value Assumption:
{Yi1, Yi0 } are functions of Di and the individual only.
(Unobservable) effect of assault for individual i:
Δi= Yi1-Yi0
Average effect of assault on the assaulted =
ATT = E(Δ|D=1) = E(Y1|D=1) - E(Y0|D=1)The Price of Violence 8
EVALUATION PROBLEM
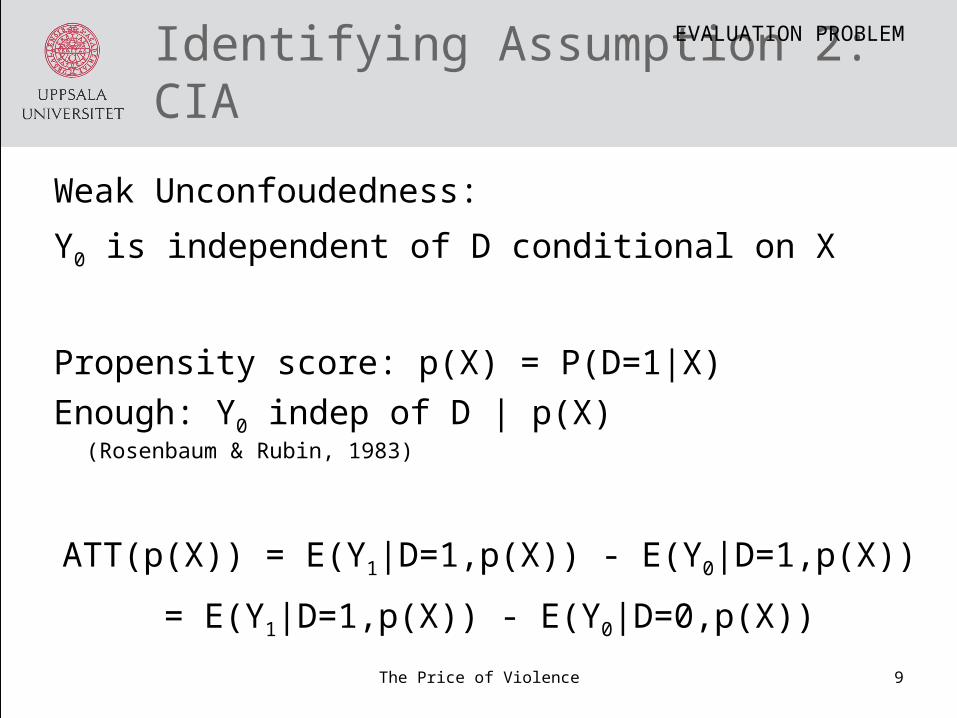
Identifying Assumption 2: CIA
Weak Unconfoudedness:
Y0 is independent of D conditional on X
Propensity score: p(X) = P(D=1|X)
Enough: Y0 indep of D | p(X) (Rosenbaum & Rubin, 1983)
ATT(p(X)) = E(Y1|D=1,p(X)) - E(Y0|D=1,p(X))
= E(Y1|D=1,p(X)) - E(Y0|D=0,p(X))
The Price of Violence 9
EVALUATION PROBLEM
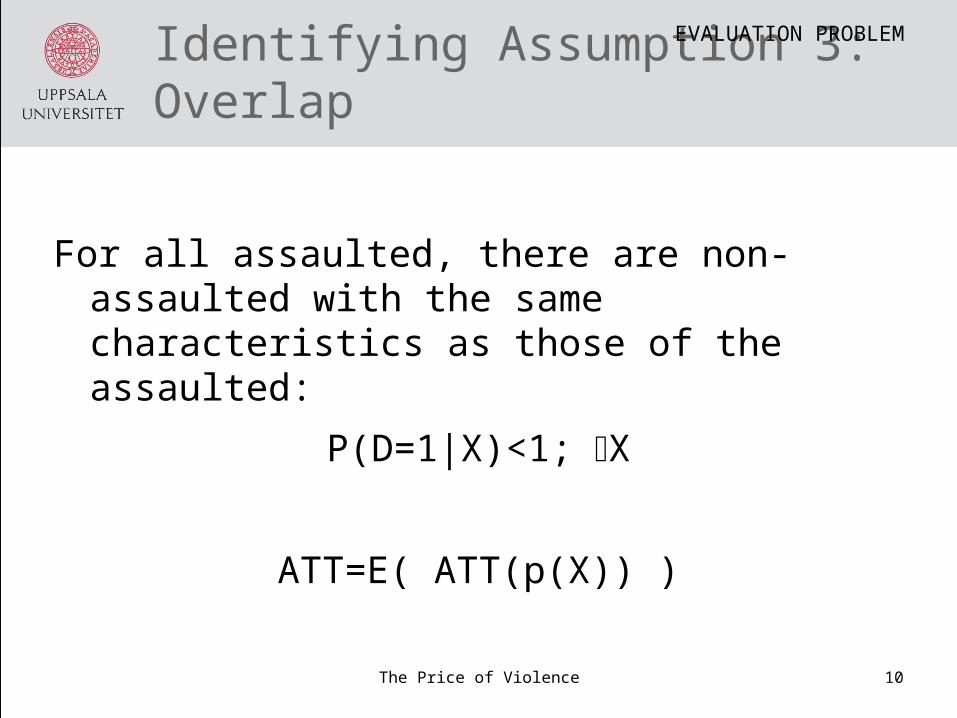
Identifying Assumption 3: Overlap
For all assaulted, there are non-assaulted with the same characteristics as those of the assaulted:
P(D=1|X)<1; X
ATT=E( ATT(p(X)) )
The Price of Violence 10
EVALUATION PROBLEM

Matching: Basic Idea
Match assaulted to non-assaulted with similar characteristics (here: close values on p(X))
{k(1,i),..., k(M,i)} the M nearest matches for i
Define:
Ỹi1=Yi1|D=1
Ỹi0 =Yk(j,i)/M|D=0; j=1,...,M
Estimator: ATTM= (Ỹi1-Ỹi0)/N; 1,...,N
The Price of Violence 11
MATCHING
Matching In Practice
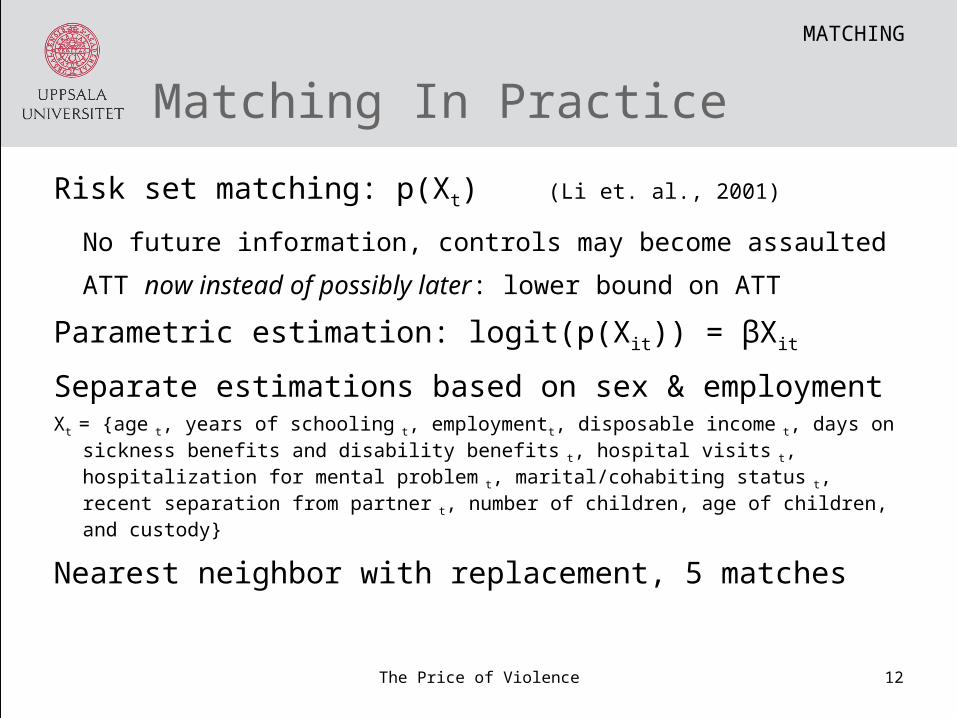
Risk set matching: p(Xt) (Li et. al., 2001)
No future information, controls may become assaulted
ATT now instead of possibly later: lower bound on ATT
Parametric estimation: logit(p(Xit)) = βXit
Separate estimations based on sex & employmentXt = {age t, years of schooling t, employmentt, disposable income t, days on
sickness benefits and disability benefits t, hospital visits t, hospitalization for mental problem t, marital/cohabiting status t, recent separation from partner t, number of children, age of children, and custody}
Nearest neighbor with replacement, 5 matchesThe Price of Violence 12
MATCHING

How well can we estimate ATT?
The Price of Violence 13
Estimated propensity score:
Bias of order Op(N-1/dim(X))
Bias correction -> Reduces bias to Op(N-1/2)
Match values: Ỹi0 = j Yk(j,i)/M|D=0; j=1,...,M
Regression estimate: μ0(X)=E(Ỹ0|X) (matches)
Bias corrected match value:
Y_biask(j,i) = Yk(j,i) + μ0(Xi) - μ0(Xk(j,i))
(Abadie & Imbens, 2012)
MATCHING
Inference: V(ATTM)
The Price of Violence 14
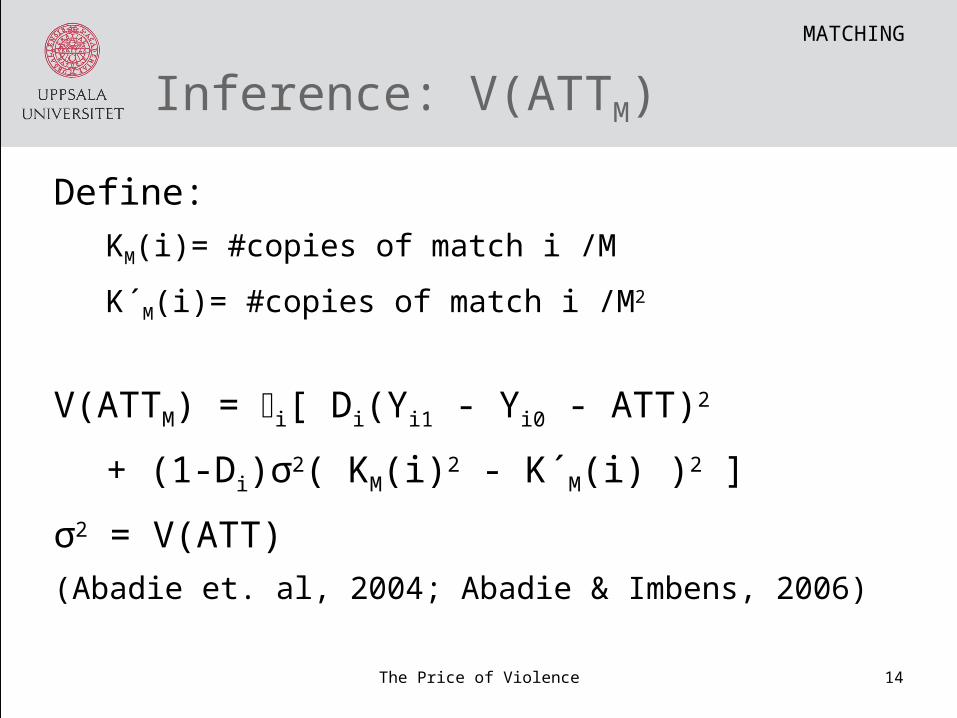
Define:
KM(i)= #copies of match i /M
K´M(i)= #copies of match i /M2
V(ATTM) = i[ Di(Yi1 - Yi0 - ATT)2
+ (1-Di)σ2( KM(i)2 - K´M(i) )2 ]
σ2 = V(ATT)
(Abadie et. al, 2004; Abadie & Imbens, 2006)
MATCHING

Assessing Assumptions
The Price of Violence 15
1) Overlap
2) Unconfoundedness
Check match quality
Selection on observables only: Plausible?
Sensitivity analysis
MATCHING

Overlap
01
.0e+
052
.0e+
053
.0e+
054
.0e+
05N
umb
er o
f co
ntro
ls
05
01
001
50N
umb
er o
f ass
aulte
d
.0007517 .2375102phat
assaulted controls
MATCHING
Right tail of propensity score distribution for assault in1998, women not working 1997.
Match Quality
The Price of Violence 17
MATCHING
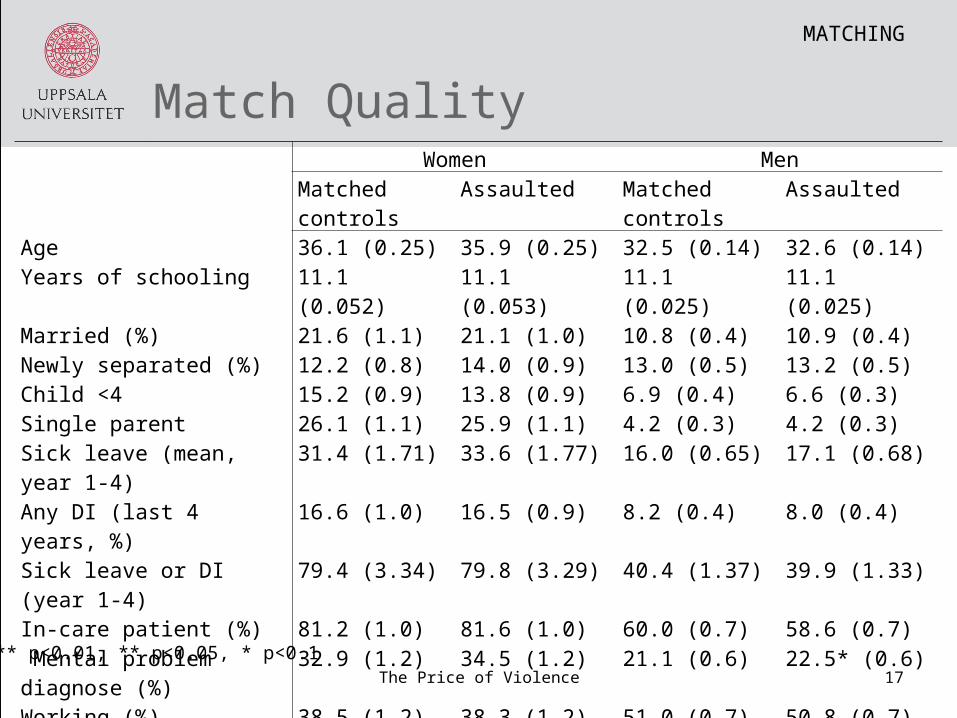
Women MenMatched controls Assaulted Matched controls Assaulted
Age 36.1 (0.25) 35.9 (0.25) 32.5 (0.14) 32.6 (0.14)Years of schooling 11.1 (0.052) 11.1 (0.053) 11.1 (0.025) 11.1 (0.025)Married (%) 21.6 (1.1) 21.1 (1.0) 10.8 (0.4) 10.9 (0.4)Newly separated (%) 12.2 (0.8) 14.0 (0.9) 13.0 (0.5) 13.2 (0.5)Child <4 15.2 (0.9) 13.8 (0.9) 6.9 (0.4) 6.6 (0.3)Single parent 26.1 (1.1) 25.9 (1.1) 4.2 (0.3) 4.2 (0.3)Sick leave (mean, year 1-4) 31.4 (1.71) 33.6 (1.77) 16.0 (0.65) 17.1 (0.68)Any DI (last 4 years, %) 16.6 (1.0) 16.5 (0.9) 8.2 (0.4) 8.0 (0.4)Sick leave or DI (year 1-4) 79.4 (3.34) 79.8 (3.29) 40.4 (1.37) 39.9 (1.33)In-care patient (%) 81.2 (1.0) 81.6 (1.0) 60.0 (0.7) 58.6 (0.7) Mental problem diagnose (%) 32.9 (1.2) 34.5 (1.2) 21.1 (0.6) 22.5* (0.6)Working (%) 38.5 (1.2) 38.3 (1.2) 51.0 (0.7) 50.8 (0.7)Real income + transactions (mean year 1-4, SEK)
109,000 (4,579) 106,000 (1,285) 90,000 (752) 91,000 (977)
Risk occupation (%) 21.1 (1.0) 22.4 (1.1) 5.3 (0.3) 5.1 (0.3)7,627 1,534 25,896 5,205*** p<0.01, ** p<0.05, * p<0.1
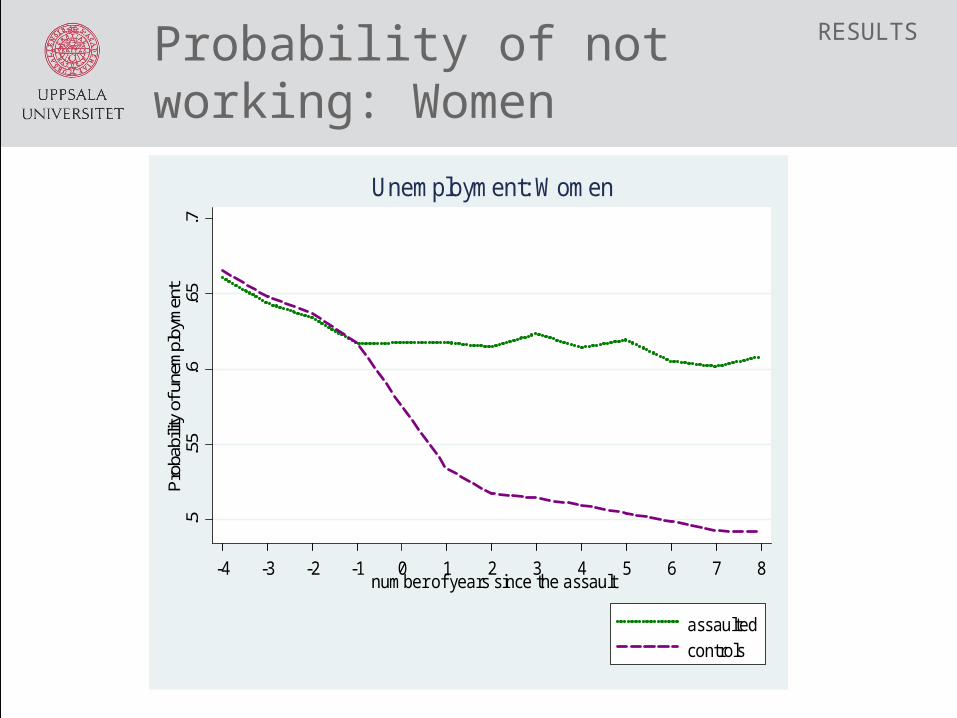
Probability of not working: Women
.5.5
5.6
.65
.7P
roba
bilit
y of
une
mpl
oym
ent
-4 -3 -2 -1 0 1 2 3 4 5 6 7 8number of years since the assault
assaultedcontrols
Unemployment: Women
RESULTS
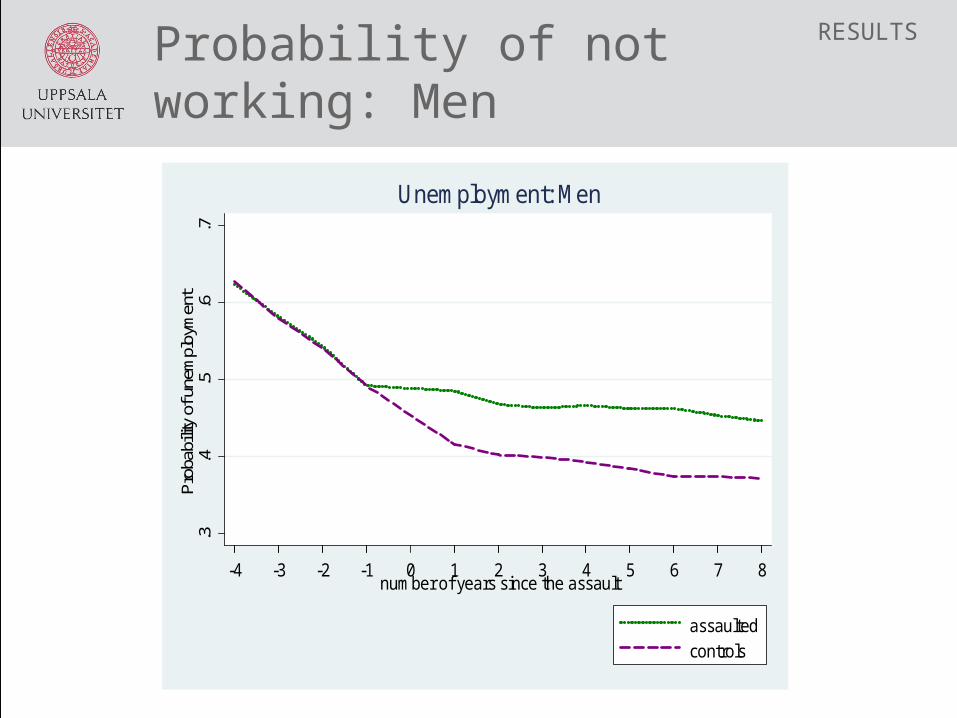
Probability of not working: Men
.3.4
.5.6
.7P
roba
bilit
y of
une
mpl
oym
ent
-4 -3 -2 -1 0 1 2 3 4 5 6 7 8number of years since the assault
assaultedcontrols
Unemployment: Men
RESULTS
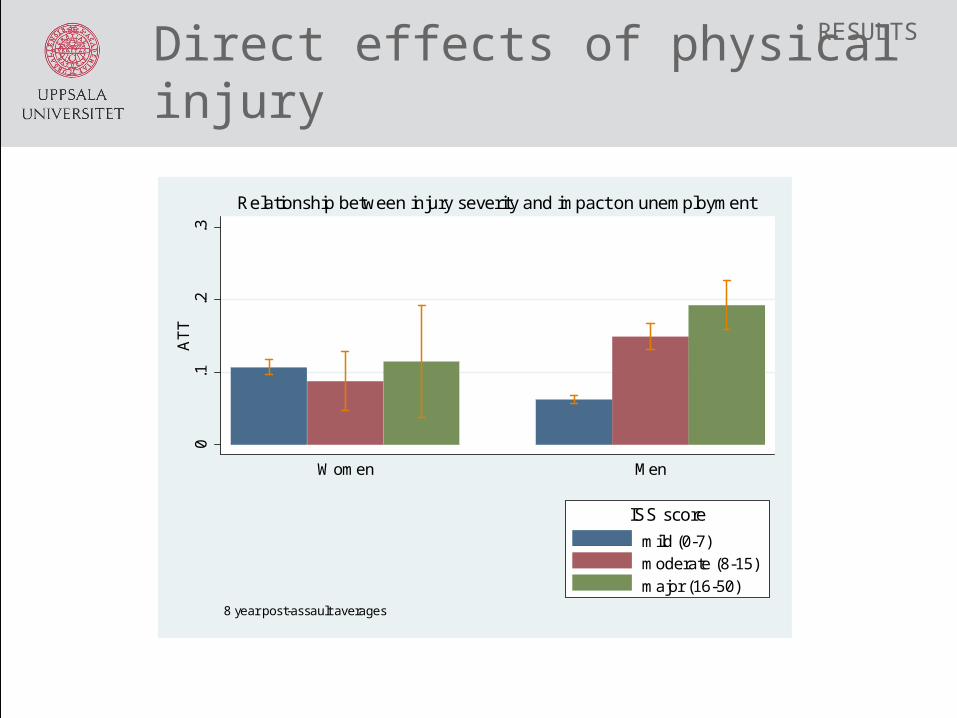
Direct effects of physical injury
0.1
.2.3
AT
T
Women Men
mild (0-7)moderate (8-15)
major (16-50)
ISS score
8 year post-assault averages
Relationship between injury severity and impact on unemployment
RESULTS

Direct effects of physical injury
RESULTS
02
04
06
08
01
00A
TT
Women Men
mild (0-7)moderate (8-15)
major (16-50)
ISS score
5 year post-assault averages
Relationship between injury severity and impact on sick leave
The Price of Violence 22
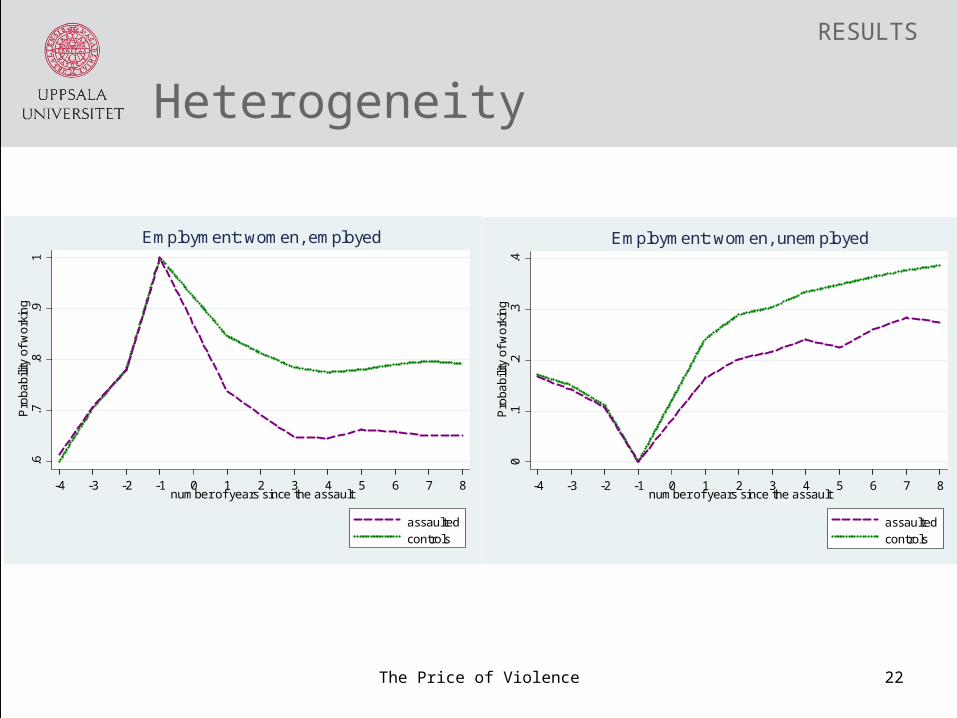
.6.7
.8.9
1P
roba
bilit
y of
wo
rkin
g
-4 -3 -2 -1 0 1 2 3 4 5 6 7 8number of years since the assault
assaultedcontrols
Employment: women, employed
0.1
.2.3
.4P
roba
bilit
y of
wo
rkin
g
-4 -3 -2 -1 0 1 2 3 4 5 6 7 8number of years since the assault
assaultedcontrols
Employment: women, unemployed
Heterogeneity
RESULTS

The Price of Violence 23
.6.7
.8.9
1P
roba
bilit
y of
wo
rkin
g
-4 -3 -2 -1 0 1 2 3 4 5 6 7 8number of years since the assault
assaultedcontrols
Employment: men, employed
0.1
.2.3
.4.5
Pro
babi
lity
of w
ork
ing
-4 -3 -2 -1 0 1 2 3 4 5 6 7 8number of years since the assault
assaultedcontrols
Employment: men, unemployed
Heterogeneity
RESULTS

The Price of Violence 24
20
40
60
80
100
120
num
ber
of d
ays
on
sick
lea
ve/D
I
-4 -3 -2 -1 0 1 2 3 4 5number of years since the assault
assaultedcontrols
Sickleave/DI: women, employed
100
120
140
160
180
num
ber
of d
ays
on
sick
lea
ve/D
I-4 -3 -2 -1 0 1 2 3 4 5
number of years since the assault
assaultedcontrols
Sickleave/DI: women, unemployed
Days on sickness insurance, women
GRAPHICAL EVIDENCE
The Price of Violence 25
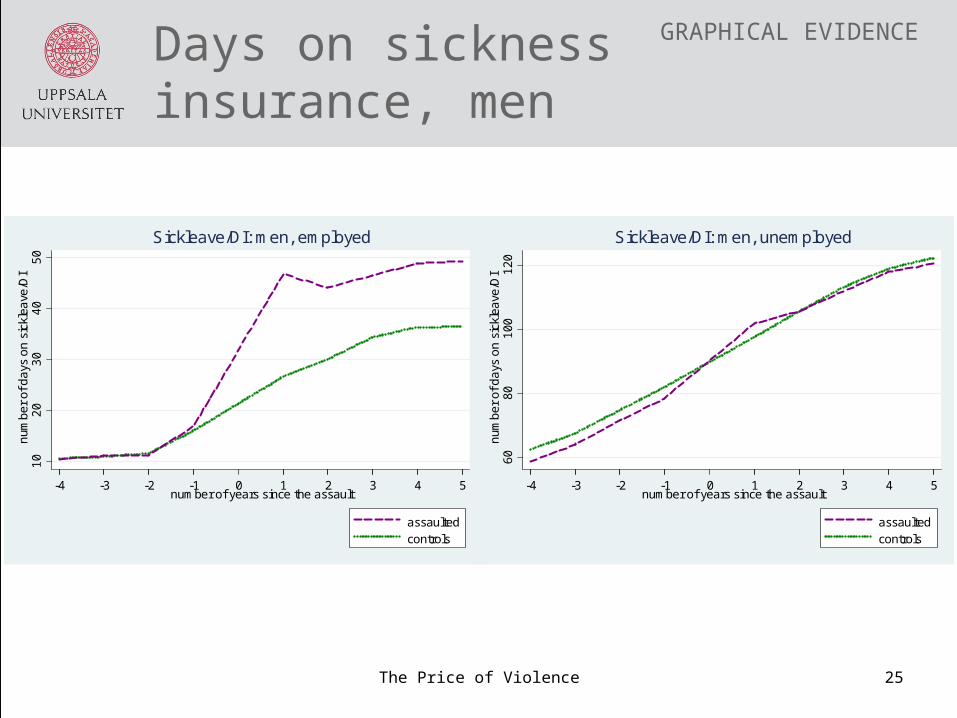
10
20
30
40
50
num
ber
of d
ays
on
sick
lea
ve/D
I
-4 -3 -2 -1 0 1 2 3 4 5number of years since the assault
assaultedcontrols
Sickleave/DI: men, employed
60
80
100
120
num
ber
of d
ays
on
sick
lea
ve/D
I-4 -3 -2 -1 0 1 2 3 4 5
number of years since the assault
assaultedcontrols
Sickleave/DI: men, unemployed
Days on sickness insurance, men
GRAPHICAL EVIDENCE

• Large selection and large causal effect of violence on both employment and sickness insurance uptake
• Physical injuries explain majority of effect in men, have little explanatory power in women
• Larger impact on sick leave for employed than unemployed
• Larger impact for women than for men – but large effects for men as well
• Effects remain over time
The Price of Violence 26
Summing up...

The Price of Violence 27
Women MenUnemployed:Assault -0.077*** -0.071*** -0.060*** -0.059***
(0.014) (0.013) (0.010) (0.009)
# observations 1888 1871 5090 5048Employed:Assault -0.107*** -0.104*** -0.074*** -0.070***
(0.020) (0.019) (0.008) (0.008)
# observations 1176 1176 5272 5263Assault year Yes Yes Yes YesBias correction Yes Yes
Short-term effects of assault on employment probability
Standard errors in parentheses. *** p<0.01, ** p<0.05, * p<0.1
ESTIMATION RESULTS

The Price of Violence 28
Years after assault: (1) (2) (3) (4) (5) (6) (7) (8)Unemployed womenAssault -0.071*** -0.074*** -0.081*** -0.087*** -0.112*** -0.094*** -0.082*** -0.101***
(0.013) (0.014) (0.014) (0.015) (0.015) (0.016) (0.016) (0.016)# obs 1871 1859 1839 1817 1797 1753 1718 1694Employed womenAssault -0.104*** -0.119*** -0.125*** -0.109*** -0.088*** -0.101*** -0.124*** -0.117***
(0.019) (0.020) (0.021) (0.021) (0.021) (0.021) (0.021) (0.021)# obs 1176 1178 1170 1160 1158 1148 1134 1132Unemployed men
Assault -0.059*** -0.056*** -0.055*** -0.066*** -0.081*** -0.096*** -0.080*** -0.072***(0.009) (0.009) (0.010) (0.010) (0.010) (0.010) (0.010) (0.010)
# obs 5048 4994 4914 4841 4780 4635 4545 4481Employed menassault -0.070*** -0.064*** -0.059*** -0.061*** -0.068*** -0.077*** -0.074*** -0.069***
(0.008) (0.008) (0.009) (0.009) (0.008) (0.008) (0.008) (0.008)# obs 5263 5239 5207 5171 5127 5083 5053 5033
Long term impact of assault on probability of employment
Standard errors in parentheses. *** p<0.01, ** p<0.05, * p<0.1
ESTIMATION RESULTS
The Price of Violence 29
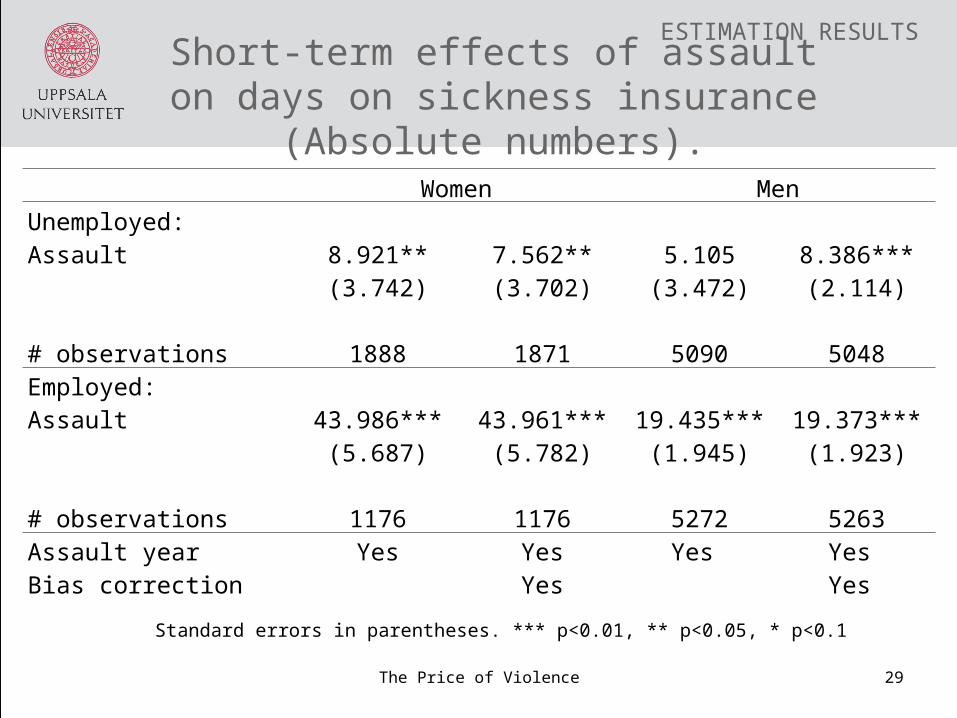
Women MenUnemployed:Assault 8.921** 7.562** 5.105 8.386***
(3.742) (3.702) (3.472) (2.114)
# observations 1888 1871 5090 5048Employed:Assault 43.986*** 43.961*** 19.435*** 19.373***
(5.687) (5.782) (1.945) (1.923)
# observations 1176 1176 5272 5263Assault year Yes Yes Yes Yes Bias correction Yes Yes
Short-term effects of assault on days on sickness insurance (Absolute numbers).
Standard errors in parentheses. *** p<0.01, ** p<0.05, * p<0.1
ESTIMATION RESULTS

The Price of Violence 30
Long term impact of assault on sickness insurance uptake
Years since assault (1) (2) (3) (4) (5)Unemployed womenAssault 7.562** 11.351*** 14.278*** 15.893*** 19.100***
(3.702) (4.288) (4.676) (4.826) (5.073)# obs 1871 1859 1839 1817 1797Employed womenAssault 43.961*** 40.453*** 32.670*** 31.230*** 30.058***
(5.782) (6.154) (6.139) (6.191) (6.361)# obs 1176 1178 1170 1160 1158Unemployed menAssault 8.094*** 4.573** 5.373** 5.573** 5.699**
(1.999) (2.255) (2.486) (2.691) (2.792)# obs 5048 4994 4914 4841 4780Employed menAssault 19.373*** 13.522*** 11.612*** 12.368*** 12.005***
(1.923) (1.963) (2.072) (2.163) (2.202)# obs 5263 5239 5207 5171 5127
ESTIMATION RESULTS
Standard errors in parentheses. *** p<0.01, ** p<0.05, * p<0.1

Match Quality: Women
The Price of Violence 31
X in t-1 Unemployed/ Absent EmployedUnselected controls assaulted Unselected controls assaulted
. .
age 43.19*** 35.27 35.70 42.79*** 36.69 36.26
years of schooling 11.44*** 10.67 10.71 12.48*** 11.78 11.71married 0.41*** 0.19 0.18 0.51*** 0.27 0.26not cohabiting 0.46*** 0.74 0.76 0.38*** 0.66 0.68
newly separated 0.09*** 0.14 0.14 0.05*** 0.15 0.14
single parent 0.10*** 0.27 0.26 0.08*** 0.26 0.26no. of children 0.42*** 0.52 0.50 0.46 0.51 0.51risk occupation 0.14*** 0.09 0.09 0.43 0.41 0.43Sickleave (4 years) 22.17*** 31.01 34.18 12.86*** 32.75 33.01
DI (4 years) 78.81 77.43 73.29 5.27 5.28 7.10Sick/DI (last 4 years) 97.78 106.92 105.72 17.60*** 37.03 38.17in-care patient 1.00*** 0.87 0.85 1.00*** 0.75 0.76
psychiatric problem 0.08*** 0.42 0.43 0.02*** 0.19 0.21real income (4 years) 893.25 956.08 951.15 1313.94*** 1230.40 1238.30
*** p<0.01, ** p<0.05, * p<0.1
MATCHING

Match Quality: Men
The Price of Violence 32
X in t-1 Unemployed/ Absent EmployedUnselected controls assaulted Unselected controls assaulted
. .
age 42.72*** 33.78* 33.23 42.39*** 32.27 32.01
years of schooling 11.39*** 10.81 10.80 12.14*** 11.39 11.38married 0.32*** 0.09 0.07 0.47*** 0.15 0.14not cohabiting 0.53*** 0.76 0.78 0.39*** 0.68 0.68
newly separated 0.08*** 0.12 0.13 0.06*** 0.14 0.13
single parent 0.02*** 0.04 0.04 0.02*** 0.04 0.04no. of children 0.19*** 0.15 0.16 0.45*** 0.29 0.27risk occupation 0.04 0.04* 0.03 0.08*** 0.07 0.08Sickleave (4 years) 19.23*** 22.25 23.85 6.68*** 10.36 10.77
DI (4 years) 70.60*** 49.91 44.69 2.27 2.05 1.76Sick/DI (last 4 years) 87.97*** 71.66 68.22 8.80*** 12.33 12.46in-care patient 1.0*** 0.68 0.67 1.00*** 0.51 0.51
psychiatric problem 0.11*** 0.32* 0.34 0.02*** 0.11 0.12real income (4 years) 991.90*** 713.07 706.90 1650.36*** 1127.88 1113.69*** p<0.01, ** p<0.05, * p<0.1
MATCHING
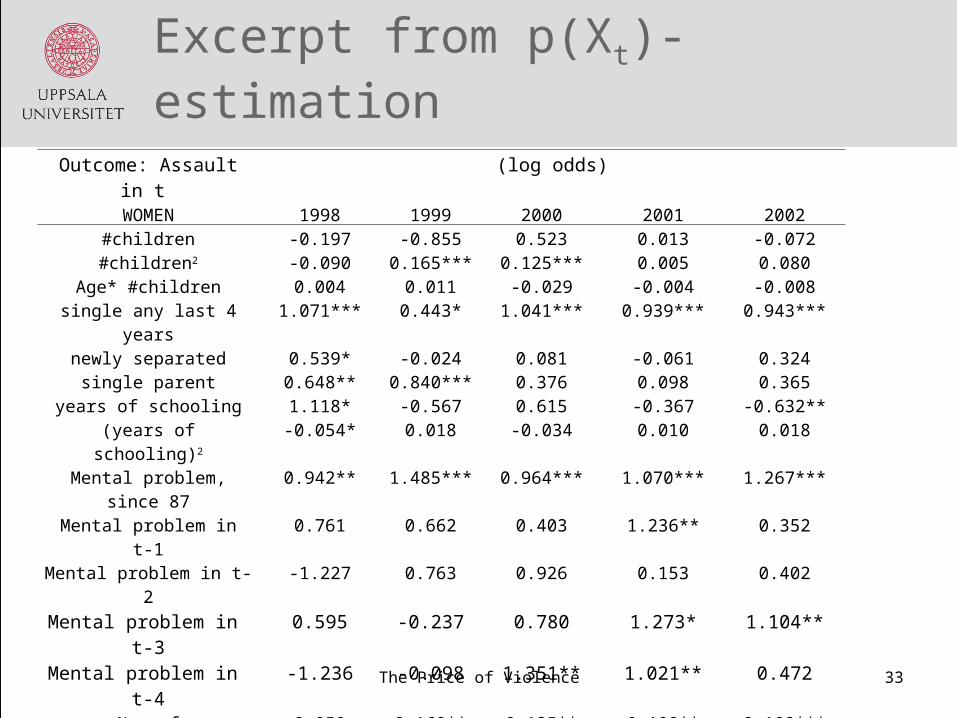
Excerpt from p(Xt)-estimation
The Price of Violence 33
Outcome: Assault in t (log odds)WOMEN 1998 1999 2000 2001 2002#children -0.197 -0.855 0.523 0.013 -0.072#children2 -0.090 0.165*** 0.125*** 0.005 0.080
Age* #children 0.004 0.011 -0.029 -0.004 -0.008single any last 4 years 1.071*** 0.443* 1.041*** 0.939*** 0.943***
newly separated 0.539* -0.024 0.081 -0.061 0.324single parent 0.648** 0.840*** 0.376 0.098 0.365
years of schooling 1.118* -0.567 0.615 -0.367 -0.632**(years of schooling)2 -0.054* 0.018 -0.034 0.010 0.018
Mental problem, since 87 0.942** 1.485*** 0.964*** 1.070*** 1.267***Mental problem in t-1 0.761 0.662 0.403 1.236** 0.352Mental problem in t-2 -1.227 0.763 0.926 0.153 0.402
Mental problem in t-3 0.595 -0.237 0.780 1.273* 1.104**Mental problem in t-4 -1.236 -0.098 1.351** 1.021** 0.472
No. of hospitalizations, last 4 0.050 0.160** 0.125** 0.108** 0.109***Any hospital care, last 4 -0.345 0.440 0.525 0.698* 0.433
Any hospital care, since 87 -0.106 -0.703** -0.596* -0.863*** -1.077***Any hospital care in t-1 -0.257 -0.537 0.008 -0.827** 0.242
Any hospital care t-2 -0.249 -0.346 -0.986*** -1.068*** -1.227***Any hospital care t-3 -0.899** -1.142*** -1.001*** -1.794*** -1.000***
...