Embed Size (px)
Citation preview

The pricing of conservative accountingand the measurement of conservatismat the firm-year level
Jeffrey L. Callen Æ Dan Segal Æ Ole-Kristian Hope
� Springer Science+Business Media, LLC 2009
Abstract This paper analyzes the relation between equity prices and conditional
conservatism and introduces a new measure of conservatism at the firm-year level.
We show that the asymmetric properties of conservative accounting, the existence
of non-accounting sources of information, and the properties of GAAP related to
special items combine to generate a nonlinear relation between unexpected equity
returns and earnings news (the shock to expected current and future earnings).
Based on this model, we construct a conservatism ratio (CR) defined as the ratio of
the current earnings shock to earnings news. CR measures the proportion of the total
shock to expected current and future earnings recognized in current year earnings.
Ranking firms according to CR, we show empirically that higher CR firms have
more leverage, increased volatility of returns, more incidence of losses, more
negative accruals, and increased volatility of earnings and accruals, consistent with
the literature on conservative accounting.
Keywords Conservatism special items � Linearity � Return decomposition �Conservatism ratio
JEL Classification M41 � G14
J. L. Callen � D. Segal (&) � O.-K. Hope
Rotman School of Management, University of Toronto, 105 St. George St,
Toronto, ON, Canada M5S 3E6
e-mail: [email protected]; [email protected]
J. L. Callen
e-mail: [email protected]
O.-K. Hope
e-mail: [email protected]
D. Segal
Arison School of Business, Interdisciplinary Center (IDC) Herzliya,
P.O. Box 167, Herzliya 46150, Israel
123
Rev Account Stud
DOI 10.1007/s11142-009-9087-6

1 Introduction
This paper analyzes the relation between equity prices and conditional conservatism
and introduces a new measure of conservatism at the firm-year level. Specifically,
we contribute to the conservatism literature in two main ways. First, using the return
decomposition model of Vuolteenaho (2002), we contend that the asymmetric
properties of conservative accounting, together with the existence of alternative
non-accounting sources of information, generate nonlinear relations between
revisions to equity returns and earnings news and between revisions to equity
returns and special items. Revisions to equity returns are defined as unexpected
current period equity returns. Earnings news is the conceptually correct measure of
an earnings surprise and is defined as the shock to the discounted sum of expected
current and future earnings over the lifetime of the firm.1
Underlying these nonlinear pricing relations is the reasonable assumption that
equity markets learn about (and therefore react to) both positive and negative shocks
to firm cash flows from non-accounting as well as accounting sources of
information. In contrast, under conservative accounting, only negative shocks are
recorded immediately, generally through special items, whereas GAAP does not
generally allow for the recognition of positive shocks until realized. This asymmetry
between the accounting system’s treatment of positive and negative shocks and the
market’s reaction to positive shocks generates nonlinear and discontinuous relations
between revisions to equity returns and special items (earnings news).
Second, based on the Vuolteenaho (2002) model, we construct a conservatism
ratio (CR) at the firm-year level that can be used to measure the asymmetry
between gain and loss recognition timeliness. CR measures the proportion of the
total shock to the firm’s expected current and future cash flows recognized in
current year earnings. By this criterion, firm A is more conservative than firm B,
if for a given negative (positive) shock to current and future expected cash flows,
firm A recognizes more (less) of the shock in current year earnings than does
firm B.2
Although our approach is in the spirit of Basu (1997), the structure of the
Vuolteenaho (2002) model necessitates a different analysis along a number of
dimensions. First, good and bad news in the model are defined in terms of shocks(revisions) to returns and not return levels.3 This definition accords with intuition.
Suppose that the firm’s cost of capital is 15% so that future returns are expected to
be 15% and, because of an information shock, returns expectations are revised
downwards to 5%. This is surely bad news despite the fact that returns are positive.4
Second, the model shows that shocks to returns are not merely a function of the
1 In other words, earnings news is the conventional current earnings surprise plus the surprise to future
earnings (appropriately discounted).2 Hence, CR is a meaningful measure of conservatism only if conditioned on the sign of the shock.3 We use the terms ‘‘unexpected,’’ ‘‘revision to,’’ and ‘‘shock to’’ interchangeably in this paper.4 Positive (negative) raw returns are neither necessary nor sufficient conditions for good (bad) news.
Basu (1997), in a sensitivity analysis, subtracts total market returns from firm returns. However, this
measure of unexpected returns is potentially misspecified because it fails to account for systematic risk.
J. L. Callen et al.
123

conventionally measured earnings surprise but rather a function of earnings news.5
Specifically, unless shocks to current earnings are completely transitory, they affect
expectations of future earnings as well current earnings. Therefore, the impact of
good and bad news shocks on current earnings (the conventional earnings surprise)
is an insufficient metric of conservative accounting.6 Third, the Vuolteenaho model
also explicitly controls for shocks to time-varying expected discount rates (discount
rate news). This issue is potentially important because, as shown by Campbell et al.
(1997, p. 265), among others, small changes in expected discount rates can have a
large impact on equity returns, especially when expected returns are persistent.
The empirical results are consistent with our conceptual analysis. In particular,
we confirm the hypothesized nonlinear relation between the revision to equity
returns and earnings news; the association between negative earnings news and
unexpected returns is significant and larger than the association between positive
earnings news and unexpected returns. We further show that the GAAP treatment of
special items generates a similar, albeit weaker, nonlinear relation between revisions
to equity returns and special items. Further, our empirical results indicate that the
impact of conservatism on the recognition of bad news relative to good news
(differential timeliness) is far smaller than what Basu (1997) reports.
Finally, we establish the properties of the new conservatism ratio (CR) for which
the Vuolteenaho model provides the requisite inputs. We show empirically that CR
incorporates bad news faster than good news at the firm-year level; when there is a
negative shock to current and future expected cash flows, a greater proportion of the
total shock is incorporated into current period earnings than when there is a positive
shock. This finding is consistent with the asymmetric timeliness of conservative
accounting. We find that, on average, more than 58% of bad news is recognized in
current earnings as opposed to less than 45% of good news.
In what follows, Sect. 2 briefly reviews the literature on conservatism and special
items. Section 3 and the Appendix present the conceptual analysis. Section 4
describes the return decomposition model, the measures of earnings and discount
rate news, and the conservatism ratio. Section 5 describes the data, and Sect. 6
provides the empirical results. Section 7 concludes.
2 Brief review of literature on conservatism and special items
Basu (1997) interprets conservatism as capturing accountants’ tendency to require
a higher degree of verification for recognizing good news than bad news in
5 The conventional view of the earnings-return paradigm is that the current level of earnings provides
information about expected future cash flows and, this in turn (partially) determines the current level of
security returns. We do not contest this. However, the standard Basu-type analysis of conservative
accounting focuses correctly on the asymmetry between ‘‘good’’ news and ‘‘bad’’ news events on equity
valuation. Good news and bad news refer to revisions or equivalently to shocks, not levels. Thus, it is
more useful to analyze conservative accounting with a revisions approach rather than a levels approach.
Specifically, the perspective of this study is that revisions to current earnings provide information about
revisions to expected future cash flows which, in turn, (partially) determines revisions to equity returns.6 Focusing on the conventional earnings surprise instead of earnings news, results in a potential
correlated omitted variables problem.
The pricing of conservative accounting
123

financial statements. Under this interpretation, earnings reflect bad news such as
unrealized losses more quickly than good news such as unrealized gains. Based on
this interpretation, Basu (1997) predicts and finds strong evidence that reported
earnings are timely in reflecting publicly available bad news compared with good
news.7 The subsequent literature refers to the Basu measure of conservatism as
‘‘differential timeliness.’’8 The literature following Basu has established that the
differential timeliness attribute of the financial statements increases the effective-
ness of corporate governance, compensation systems, and debt agreements in
motivating and monitoring managers. (See Ryan 2006 for a comprehensive
literature review.)
Notwithstanding the large number of studies employing differential timeliness as
their measure of conservatism, recently researchers have argued that the use of this
measure should be more selective and qualified. Givoly et al. (2007) show that the
measure fails to detect conservatism in instances where it is most likely to exist. In
addition, although one might expect the degree of conservatism to be a relatively
long-term characteristic of the firm’s reporting system, they document that
differential timeliness is highly volatile over time. They attribute the results to
the use of aggregated measures of earnings and returns as well as the nature of
events occurring during the period and firms’ disclosure policies. They conclude
that differential timeliness suffers from serious measurement errors and that care
should be taken when employing the measure in empirical studies.
Dietrich et al. (2007) argue that the empirical results in the conservatism
literature based on the Basu measure are attributable to the estimation procedure
rather than to conservatism. Specifically, they argue that, if price is a function of
earnings and other information, then reversing the regression leaving out the other
information yields a biased earnings coefficient, even if earnings and other
information are uncorrelated. They further argue that the standard Basu nonlinear
regression equation is really comprised of two equations conditioned on whether
returns, an endogenous variable, are greater than zero or less than zero. Since OLS
abstracts from the endogeneity and the conditioning of returns, the Basu regression
yields biased coefficients.9
We argue and show that special items are one of the tools through which
accounting conservatism is facilitated. According to GAAP, special (or unusual)
items are material items that are considered unusual in nature or occur infrequently.
They can have a very large impact on earnings and book value of assets and equity.
For example, in their review of empirical studies of asset writedowns, Alciatore
et al. (1998) identify a mean writedown ranging from 4% to more than 19% of total
assets, with maximum writedowns reaching 90%. In addition, Riedl and Srinivasan
7 Specifically, Basu (1997) uses a reverse regression of price-deflated earnings (EARN) on an indicator
variable for negative stock returns (D), stock returns (R), and stock returns interacted with the indicator
variable (subscripts omitted): EARN ¼ a0 þ a1Dþ a2Rþ a3R �D: He finds the coefficient a3 to be
significantly positive.8 Some studies refer to differential timeliness as ‘‘earnings conservatism’’ or ‘‘conditional conservatism’’
as compared with ‘‘balance sheet conservatism’’ or ‘‘unconditional conservatism’’ (as reflected in the
market-to-book ratio) (e.g., Beaver and Ryan 2005; Pae et al. 2005).9 We perform tests that address these issues in Sect. 6.3.
J. L. Callen et al.
123
(2007) document a large increase in both the frequency and magnitude of reported
special items throughout the period 1993 through 2002. Although gains also occur,
such as gains from sales of assets, the majority of special items are losses. The
preponderance of special or unusual losses reflects the conservative bias of accrual
accounting which requires early recognition of declines in asset values but tends to
delay recognition of most gains until realized. In addition, the magnitude of special
items suggests that they represent an economically significant proxy for how
conservatism is achieved by firms.
Frankel and Roychowdhury (2008) find that the timeliness of IBES earnings is
less asymmetric than that of GAAP earnings. Since IBES earnings are purged of
many special items, this finding can be interpreted as special items being an
important means of implementing accounting conservatism. Consistent with this
notion, Shroff et al. (2004) find that negative special items have a stronger relation
with concurrent stock returns than positive special items.10
3 The conceptual analysis
This section provides a conceptual analysis of the relations among earnings news,
special items, and revisions to returns. In particular, we claim that earnings news is
nonlinearly related to revisions to equity returns provided that (1) the accounting
system is conservative and (2) equity markets learn about shocks to the firm’s
expected cash flows from non-accounting as well as accounting sources. We also
maintain that special items are nonlinearly related to revisions to equity returns
under GAAP, although the relation is weaker than for earnings news. For simplicity,
absent specific information such as special items to indicate otherwise, shocks to
earnings are assumed to be completely transitory and discount rates (expected
returns) are assumed to be intertemporally constant.11
We illustrate the nonlinear relations between earnings news, special items, and
revisions to returns using a relatively simple but nevertheless rich example. This
section focuses on the underlying logic. To help explicate these ideas, the Appendix
provides a related numerical example.
Suppose that management or the auditor or both suddenly anticipate a negative
shock to the firm’s expected future cash flows, for example, in the form of a
reduction in the market value of a long-lived asset. In an ideal conservative
accounting system, the negative shock will be accrued in earnings in a timely
fashion relative to actual cash flow realizations, in the form of a special Item (asset
writedown). Provided that the asset is carried on the books at its market value
before the shock, meaning that accumulated book depreciation equals accumulated
economic depreciation, and provided the firm has a 100% dividend-payout ratio
policy, the asset writedown will exactly equal the shock to current and future
expected cash flows (earnings news). Furthermore, investors should correctly
10 In contrast, Riedl and Srinivasan (2007) do not find a significant difference in response coefficients
across positive and negative special items.11 In the empirical analysis below, we specifically control for discount rate news.
The pricing of conservative accounting
123

interpret the special item as conveying new information of an impending negative
shock to current and future expected cash flows, driving down equity returns by
the amount of the asset writedown in a timely fashion. Thus, earnings news,
special items, and the revision to equity returns are all negative and equal to each
other.
Now consider the symmetrically opposite case in which management
anticipates a positive shock to expected future cash flows, that is, positive
earnings news. In an ideal conservative accounting system there are no special
items to reflect the positive shock, and positive earnings news will not be
recorded in the accounts until the future cash flows are realized. Furthermore, if
accounting is the only source of news about shocks to future cash flows, then the
revision to returns is zero.
Thus, when the accounting reports are the only source of information, the
relations among the three variables are linear with the only difference being that,
with negative shocks these variables (earnings news, the special item and the change
to market value) are negative, and with positive shocks they are zero. In addition,
linearity obtains whether the accounting system is conservative or not, although the
size of the shock recognized in earnings and, hence, in equity returns depends upon
the extent of conservatism.12
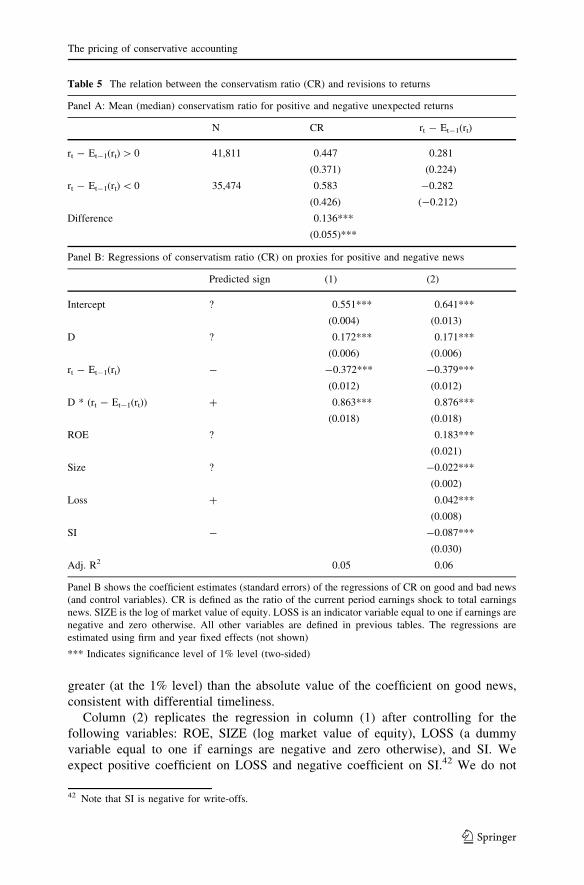
Suppose instead that investors learn about positive shocks to future cash flows
from non-accounting sources. When the shock to cash flows is negative, earnings
news, special items, and revisions to returns are negative and equal to each other as
before since all the information is disclosed in the financial reports. However, when
the shocks to future cash flows are positive, earnings news and special items are
equal and zero because of conservatism, but equity returns will adjust to reflect the
positive shock. In other words, when investors learn about positive shocks to future
firm cash flows from non-accounting sources, the ideal conservative accounting
system generates a nonlinear relation between earnings news and revisions to
returns and between special items and revisions to returns. Hence, the existence of
information sources other than the accounting system is a necessary condition for
the nonlinear relation between revisions in returns and earnings news (special
items).13
The above analysis suggests that in an ideal conservative accounting system, the
nonlinear relation between earnings news and revisions to returns is identical to the
nonlinear relation between special items and revisions to returns. However, the
conservative accounting system defined by GAAP is far from ideal. In particular,
GAAP and firm financing/investment policies create a wedge between earnings
news and special items. There are three main reasons why special items are a less
than perfect measure of negative earnings news and, hence, a less than perfect
measure of the revision to equity returns. First, book depreciation rarely equals
economic depreciation. If accumulated book depreciation is greater than accumu-
lated economic depreciation, then the asset writedown to bring the asset’s book
12 Scenarios 1 and 2 of the example in the Appendix and the related Fig. 1 illustrate this linearity result.13 Scenarios 1 and 3 of the example in the Appendix and the related Fig. 2 illustrate this nonlinearity
result.
J. L. Callen et al.
123

value to market value will be less than earnings news. Conversely, if accumulated
book depreciation is less than accumulated economic depreciation then the asset
writedown to bring book value to market value will necessarily be greater than
earnings news. Second, under GAAP, if the sum of the future undiscounted cash
flows from the asset is greater than the carrying value of the asset, no special item is
recognized even though there is a negative shock to the asset’s future cash flows.
Third, if the firm’s policy is to reinvest free cash flows from the asset, the reduction
in free cash flows arising from the negative shock to the asset’s future cash flows
will also drive a wedge between special items that do not recognize this opportunity
cost and revision to returns (or negative earnings news). Thus, under GAAP, when
earnings news is negative, special items and revision to returns (earnings news) will
be positively correlated but they will not be equal to each other.
Similarly, under GAAP, special items that provide timely information about
positive earnings shocks are sometimes recognized, albeit fairly infrequently (for
example, if the firm recognizes a gain on sale of an asset or reverses a portion of a
restructuring charge expected to be larger). Thus, under GAAP, special items can be
positive and positively correlated with (although unlikely to be equal to) positive
earnings news. Therefore, under GAAP, the relation between special items and
revision to returns will be nonlinear but generally weaker than the nonlinear relation
between earnings news and the revision to returns.14
In short, the asymmetry inherent in conservative accounting under GAAP,
coupled with alternative sources of value-relevant information, lead to an
asymmetric response by investors to positive earnings news (special items) relative
to negative earnings news (special items). As a result, revisions to equity returns are
more highly correlated with negative earnings news (special items) than with
positive earnings news (special items). Furthermore, under GAAP, special items,
positive or negative, provide an imperfect measure of the impact of new information
on equity returns relative to earnings news, yielding a weaker nonlinear relation
between special items and revision to returns by comparison to the nonlinear
relation between earnings news and revision to returns.
Together with the Vuolteenaho (2002) model (see next section), the above
conceptual analysis and the numerical example of the Appendix provide the
framework for our empirical investigation. First, we examine the association
between earnings news and special items, and, in particular, we contrast the
association between negative earnings news and special items and positive earnings
news and special items. Second, we analyze the nonlinear relations between
revisions to equity returns and earnings news and between revisions to equity
returns and special items. Third, for the sake of completeness, we investigate the
potential nonlinear relations between the conventional earnings surprise, the
earnings level revisions, and revisions to equity returns. Finally, we empirically
analyze the conservatism ratio.
14 Scenarios 1 and 3 of the example in the Appendix and the related Fig. 3 illustrate this nonlinearity
result.
The pricing of conservative accounting
123

4 The Vuolteenaho (2002) return decomposition model and the conservatismratio
In this section, we explain the Vuolteenaho (2002) model, describe how we estimate
the model, and introduce and describe the conservatism ratio CR.
4.1 The Vuolteenaho return decomposition model
The Vuolteenaho (2002) return decomposition model is essentially an identity so the
intuition behind the model is fairly straightforward.15 If equity prices are the present
value of expected future dividends, then shocks to prices or, equivalently, to returns
can only come from two sources, namely, shocks to current and expected future
dividends (cash flows) or shocks to current and expected future discount rates (or
both) over the firm’s lifetime. Replacing dividends with earnings via the clean
surplus relation implies that shocks to returns are necessarily attributable to shocks
to current and expected future earnings (earnings news) or shocks to current and
expected future discount rates (discount rate news) over the firm’s lifetime or both.
Formally, extending prior work by Campbell (1991), Campbell and Ammer
(1993), Vuolteenaho (2002) employs the clean surplus relation to show that
revisions to stock returns can be expressed as follows:
rt � Et�1ðrtÞ ¼ DEtX1
j¼0
q jðroetþj � itþjÞ � DEtX1
j¼1
q jrtþj ð1Þ
where D denotes the first differencing operator; Et is the expectations operator and
DEt = Et(�) - Et-1(�); rt = log equity return (cum dividend) in excess of the risk
free rate in period t; q is a constant discount rate term; it = log of one plus the risk
free rate in period t; roet = log of one plus return on equity (that is, earnings divided
by beginning of period book value of equity) in period t.
Defining the unexpected stock return components as expected-return news (Nr)
and earnings news (Ne), Eq. 1 can be expressed more simply as:16
rt � Et�1 rtð Þ ¼ Ne� Nr ð2Þ
where
Ne ¼ DEtX1
j¼0
q jðroetþj � itþjÞ ¼ earnings news ð3Þ
15 The return decomposition (Eq. 2) is derived from the definition of the market to book ratio and the
clean surplus relation; hence, it is an identity. See Callen (2009) for a formal proof that emphasizes the
tautological nature of the Vuolteenaho (2002) return decomposition model.16 As a sensitivity analysis we estimate earnings news as the sum of accruals news and cash flow news
(see Callen and Segal 2004). The idea behind this alternative estimation is that the breakdown of earnings
into cash flows and accruals may provide a better prediction of future cash flows than earnings alone. No
inferences are affected if we use this alternative approach. However, breaking down earnings to accruals
and cash flows precludes us from computing our conservatism ratio so we do not pursue this approach.
J. L. Callen et al.
123

Nr ¼ DEtX1
j¼1
q jrtþj ¼ discount rate news ð4Þ
Equation 2 shows that the unexpected revision to current equity returns increases
with earnings news and decreases with discount rate news. An unanticipated
increase in the firm’s earnings conveys positive information about the firm’s
prospects and translates into higher returns. Conversely, an unexpected increase in
future expected returns (discount rates) due to higher risk, for example, translates
into negative unexpected current returns, similar to the effect of an increase in the
yield rate on bond prices.
It is worth emphasizing that the standard Vuolteenaho return decomposition
model (Eq. 2) is linear in earnings news and discount rate news because it fails to
consider the conservative nature of the accounting system. In particular, Vuoltee-
naho (2002) implicitly assumes that market expectations are conditioned solely on
accounting information, and other information sources are irrelevant. However, by
restricting accounting recognition rules to specific (and primarily) negative shocks,
conservative accounting and GAAP drive a wedge between the market’s expec-
tations, which are conditioned upon the immediate recognition of both positive and
negative expected cash flow shocks from all information sources, and expectations
based solely on conservative accounting numbers for which some negative shocks
and almost all positive shocks remain unrecognized in earnings until realized. This
wedge drives the nonlinear relation between unexpected returns and earnings news
(less discount rate news), as emphasized in the analysis above and in the numerical
example of the Appendix. This intuition is related to that of Gonedes (1978) and
Antle et al. (1994) who show, that except under very restrictive conditions, the
relation between revisions to returns and revisions to earnings need not be linear (or
even monotone) if the accounting system uses a more restrictive information set
than does the market.
In order to empirically examine the associations between earnings news, special
items, and unexpected returns, and to construct the conservatism ratio, we need
estimates of earnings news and discount rate news. The return decomposition
(Eq. 2) provides the basis. However, to implement the return decomposition,
estimates of expected future returns and expected future earnings are required.
Following prior studies we implement the return decomposition using a log-linear
vector autoregressive (VAR) model. We next describe the estimation procedure in
detail.
4.2 Estimation of the Vuolteenaho model
The VAR estimation is facilitated by assuming that the dynamics of the data are
well described by a (stationary) time-series model. Specifically, define zi,t to be a
vector of firm-specific state variables that follows the vector autoregressive process:
zi;t ¼ Azi;t�1 þ gi;t ð5Þ
The pricing of conservative accounting
123

Consistent with prior studies, the VAR coefficient matrix A is assumed to be
constant over time and over firms. The error term vectors gi,t are vectors of shocks
and are assumed to have a variance-covariance matrix X and to be independent of
all variables known at t - 1.
We estimate a parsimonious VAR with three state variables consisting of log
stock returns (rt), log of one plus ROE (earnings scaled by book value of equity),
and the log book-to-market ratio (bmt).17 The VAR model can then be described as
a system of (mean-adjusted) equations:
rt ¼ a1rt�1 þ a2roet�1 þ a3bmt�1 þ g1;t ð6aÞ
roet ¼ b1rt�1 þ b2roet�1 þ b3bmt�1 þ g2;t ð6bÞ
bmt ¼ d1rt�1 þ d2roet�1 þ d3bmt�1 þ g3;t ð6cÞ
We estimate the regressions separately by industry (as per the Fama and French
(1997) classifications) using weighted least squares with one pooled regression per
state variable.18 Each annual cross-section is weighted equally by deflating the data
for each firm-year by the number of firms in that year.19
As shown by Campbell (1991), the variance decomposition of these valuation
models can be implemented empirically by combining the residuals from the VAR
estimation with the unexpected current return equation (Eq. 1). Formally, let
ei = (0,…, 1,…, 0), where the 1 is in the ith position. The revision to returns is then
computed as:
rt � Et�1 rtð Þ ¼ e1g1;t ð7Þ
Equation 5 implies that forecasts of the state vector zi,t can be computed as:
Et zi;tþ1þj
� �¼ Ajþ1zi;t ð8Þ
Substituting Eq. 8 into Eq. 4 yields discount rate news computed as:20
Nrt ¼ DEtX1
j¼1
q jrtþj ¼ EtX1
j¼1
q jrtþj � Et � 1X1
j¼1
q jrtþj
¼ e10qAðI � qAÞ�1gi;t
ð9Þ
Similarly, earnings news is computed as:21
17 The book-to-market ratio is included in the parsimonious VAR because the decomposition model is
generated from this ratio. Vuolteenaho (2002) similarly includes the book-to-market ratio in his VAR
specifications. It also helps to control for the firm’s growth prospects and the firm’s unconditional
conservatism.18 Industry subscripts are suppressed in the above equations.19 Using OLS gives similar results.20 Note that (I - qA)-1 is a present value operator.21 Following Vuolteenaho (2002), Callen and Segal (2004), Callen et al. (2005), and Callen et al. (2006),
we assume that q = 0.967. The results are not sensitive to this assumption.
J. L. Callen et al.
123

Net ¼ DEtX1
j¼0
q jðroetþj � itÞ ¼ EtX1
j¼0
q jðroetþj � itÞ � Et � 1X1
j¼0
q jðroetþj � itÞ
¼ e20ðI � qAÞ�1gi;t
ð10ÞTo facilitate the analysis, we generate firm-year estimates of earnings and
discount rate news by estimating the firm-year variance-covariance matrix from the
residuals of the VAR regression (Eqs. 6a–6c) and by assuming that within-industry
observations have the same VAR coefficient matrix. For example, earnings news
can be estimated at the firm-year level using the estimated VAR coefficient matrix
and the vector of residuals eit = [e1it, e2it, e3it], where ejit is the estimated residual
from equation j and i(t) is the firm (time) index. The variance-covariance matrix Xit
is computed as [eit0eit].
4.3 The conservatism ratio (CR)
The conservatism ratio is defined as ratio of unexpected current earnings to total
earnings news. The ratio measures how much of the total earnings shock is
incorporated into current period unexpected earnings. Thus, for a given negative
shock, the greater the conservatism ratio the more conservative is the firm because
more of the total negative shock to current and future cash flows is recognized in the
current financial statements. Formally, we measure CR as:
CRt ¼ g2;t=Net ð11Þ
where g2,t is the earnings surprise from the VAR system (see Eq. 6b).
The conservatism ratio can best be understood by reference to the time series
properties of the earnings news measure (Eq. 3). Perhaps the simplest example is to
assume that the firm’s earnings, as measured by roet, follow a stationary AR(1)
process with drift and that the firm’s expected rate of return (cost of capital) is
intertemporally constant so that:
roet ¼ aþ broet�1 þ et ð12Þ
where b is the persistence parameter assumed to lie between 0 and 1, and et �ð0; r2Þis a zero-mean error term. It is fairly straightforward to show that in this case
CRt & 1 - b.22 In other words, the conservatism ratio (approximately) equals one
minus the persistence of roet so that the more persistent are earnings, the less of the
total earnings shock recognized in current earnings relative to future earnings. This
accords with intuition since an earnings shock to an AR(1) firm will persist over the
lifetime of the firm, with the impact of the shock on earnings increasing directly
with the firm’s earnings persistence. As a result, the more persistent are earnings,
the smaller is proportion of the total shock that will be recognized in any given
period’s earnings.
22 Substituting the AR(1) dynamic of Eq. 12 into the definition of earnings news (Eq. 3) and noting that
DEt(roet?j) = (qb)jet for j C 0 yields Net = et/(1 - qb). By definition CRt = et/Net = (1 - qb). Since qis very close to 1 (0.967), the result follows.
The pricing of conservative accounting
123

In the simple AR(1) example, CR varies by firm but is intertemporally constant.
The empirical analysis below allows for far more complex and realistic time-series
patterns in earnings and discount rates by assuming a VAR system. In the case of a
VAR, the CR varies generally both by firm and over time. To see this, consider the
simple stationary VAR example with only two variables rt and roet:
rt ¼ a1rt�1 þ a2roet�1 þ g1t ð13Þroet ¼ b1rt�1 þ b2roet�1 þ g2t ð14Þ
It can be shown that the conservatism ratio in this case is23
CRt �ð1� a1Þð1� b2Þ � a2 � b1
b1g1t
g2t
� �þ ð1� a1Þ
ð15Þ
Clearly, in the case of a VAR system, the conservatism ratio is generally dependent
upon all of the parameters of the dynamics. Also, unless (1) the shocks to earnings
and returns are always equal or (2) the shocks to returns are always zero or (3)
b1 = 0, the conservatism ratio will depend upon the relative shocks (g1t/g2t). In
particular, the greater the shock of earnings relative to the shock to expected returns
in absolute value, the greater the conservatism ratio. Since the shocks are time
dependent, so is CR. Straightforward observation shows that the conservatism ratio
is a decreasing function of the earnings persistence parameter b2 and the earnings
parameter a2. The relation between the other parameters and the conservatism ratio
is ambiguous.
5 Sample and descriptive statistics
The data are obtained from annual COMPUSTAT and monthly CRSP files for the
years 1962 through 2006. Return on equity is computed as income before
extraordinary items (DATA18) scaled by the beginning of the period stockholders’
equity (DATA60). The risk-free rate is the annualized 3-month Treasury bill rate.
Annual stock returns are computed from monthly CRSP data adjusted for dividends.
Returns are computed over a period starting 9 months before and ending 3 months
after the fiscal year-end.
We impose the following restrictions on the data. First, we remove firms in the
financial industry (SIC 6000-6999). Second, we require non-missing values of
contemporaneous and one lag each of ROE, annual returns, and the book-to-market
ratio. In addition, we require non-missing values of special items (DATA 17). These
restrictions yield a sample size of 124,217 firm-years. Eliminating firms with market
value of equity less than $10 million reduces the sample size to 104,471. Finally, to
mitigate data errors and scaling problems, we delete the top and bottom one percent
of all the variables included in the VAR system. These restrictions reduce the
sample to 95,653 (10,292) firm-years (firms).
23 Note that if past returns have no impact on roet so that b1 = 0 then roet is AR(1) as before and the
conservatism ratio equals one minus the persistence of earnings (1 - b2) as before.
J. L. Callen et al.
123

Table 1 shows the distribution of the major variables of interest. The sample
firms exhibit large variation in market capitalization; the mean and median market
values of equity are $1.475 billion and $138 million, respectively. Median cum
dividend equity market returns and accounting returns on book value of equity are
10 and 12%, respectively. The median book-to-market ratio is 0.62. To be consistent
with the computation of earnings news, we compute special items (SI) as DATA 17
scaled by beginning of the period book value of equity.24 Since SI is nonzero for
only 34,416 firm-years, the 25th percentile, median, and 75th percentile of SI are
zero.25 Finally, the mean (median) CR is 0.51 (0.39), indicating that on average the
current period shock to earnings equals approximately 50% of the total economic
shock to current and future cash flows.
6 Empirical results
6.1 VAR estimation
We estimate the VAR equations by industry using the Fama and French (1997)
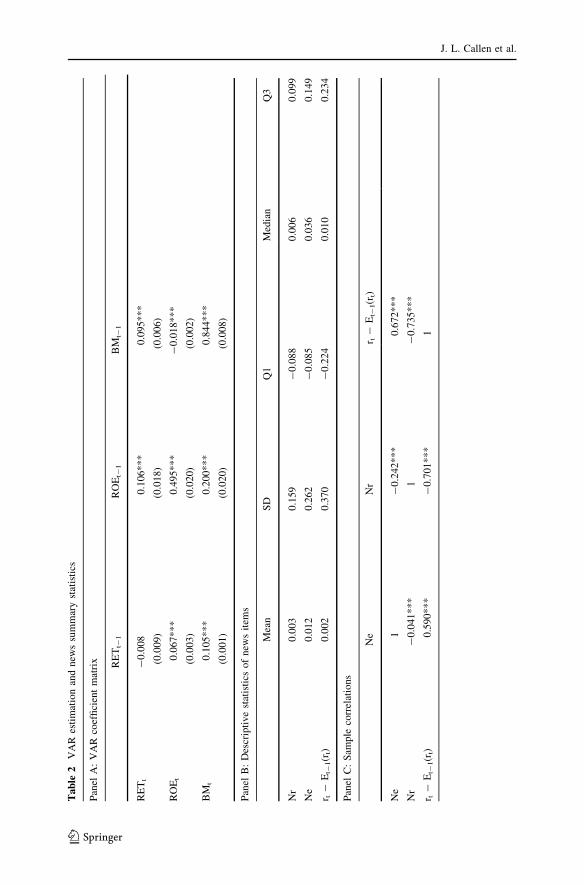
industry classification. Table 2, Panel A, shows the mean estimated parameters
across industries and their standard errors.26 The standard errors are computed using
the Fama and MacBeth (1973) method. The significant parameter estimates imply
that returns are positively associated with past earnings and the past book-to-market
ratio. Earnings are positively associated with past returns and past earnings and
Table 1 Descriptive statistics
Mean SD Q1 Median Q3
MV 1,475 8,664 39 138 615
ROE 0.100 0.174 0.042 0.121 0.188
BM 0.848 1.081 0.377 0.624 0.991
RET 0.186 0.515 -0.141 0.103 0.397
SI -0.013 0.082 0.000 0.000 0.000
CR 0.510 0.521 0.267 0.391 0.556
The table shows the sample distribution for selected variables where SD is the standard deviation, and Qi
denotes the ith quartile. MV is market value of equity in millions of dollars, ROE is the book return on
equity computed as earnings before extraordinary items (DATA 18) divided by beginning of period book
value of equity (DATA 60), BM is the book-to-market ratio, RET is the annual cum dividend return
computed from monthly returns, SI is special items (DATA 17) scaled by lagged book value of equity, CRis the conservatism ratio measure computed as the earnings surprise divided by earnings news. The
number of firm-year observations is 95,653 (CR is based on 77,285 observations)
24 As sensitivity tests, we repeat the analysis scaling special items by beginning of the period total assets
and market value of equity. The results are similar to those reported.25 Untabulated results show that if we restrict the sample to observations with non-zero SI, then the mean
and median SI are -0.037 and -0.014, respectively.26 Reported results are based on a parsimonious VAR with only one lag per variable. Untabulated results
show that our inferences are robust to including two lags per variable in the VAR estimation.
The pricing of conservative accounting
123
Tab
le2
VA
Res
tim
atio
nan
dnew
ssu
mm
ary
stat
isti
cs
Pan
elA
:V
AR
coef
fici
ent
mat
rix RE
Tt-
1R
OE
t-1
BM
t-1
RE
Tt
-0
.008
(0.0
09)
0.1
06
**
*
(0.0
18)
0.0
95
**
*
(0.0
06)
RO
Et
0.0
67
**
*
(0.0
03)
0.4
95
**
*
(0.0
20)
-0
.018
**
*
(0.0
02)
BM
t0
.105
**
*
(0.0
01)
0.2
00
**
*
(0.0
20)
0.8
44
**
*
(0.0
08)
Pan
elB
:D
escr
ipti
ve
stat
isti
csof
new
sit
ems
Mea
nS
DQ
1M
edia
nQ
3
Nr
0.0
03
0.1
59
-0
.08
80
.00
60
.099
Ne
0.0
12
0.2
62
-0
.08
50
.03
60
.149
r t-
Et-
1(r
t)0
.00
20
.370
-0
.22
40
.01
00
.234
Pan
elC
:S
ample
corr
elat
ions
Ne
Nr
r t-
Et-
1(r
t)
Ne
1-
0.2
42
**
*0
.672
**
*
Nr
-0
.041
**
*1
-0
.735
**
*
r t-
Et-
1(r
t)0
.590
**
*-
0.7
01
**
*1
J. L. Callen et al.
123

Tab
le2
con
tin
ued
Pan
elD
:M
ean
so
fd
isco
un
tra
ten
ews
and
rev
isio
nto
retu
rns
rank
edb
yea
rnin
gs
new
sq
uin
tile
po
rtfo
lio
s
Qu
inti
leN
eN
rr t
-E
t-1(r
t)
1-
0.3
65
0.0
29
-0
.349
2-
0.0
57
0.0
58
-0
.152
30
.036
0.0
10
0.0
08
40
.124
-0
.030
0.1
53
50
.321
-0
.050
0.3
52
Pan
elA
list
sth
ep
aram
eter
esti
mat
eso
fth
ep
arsi
mo
nio
us
VA
R.
We
esti
mat
eth
eV
AR
equ
atio
ns
by
ind
ust
ry(F
ama–
Fre
nch
19
97)
ind
ust
rycl
assi
fica
tio
n).
Pan
elA
sho
ws
the
mea
nes
tim
ated
par
amet
ers
acro
ssin
du
stri
esan
dth
eir
stan
dar
der
rors
inp
aren
thes
es.
Th
est
and
ard
erro
rsar
eco
mp
ute
du
sin
gth
eF
ama
and
Mac
Bet
h(1
97
3)
met
ho
d.
Th
em
od
elv
aria
ble
sin
clu
de
the
mea
n-a
dju
sted
cum
div
iden
dan
nu
alex
cess
log
retu
rn,
r t(t
he
firs
tel
emen
to
fth
est
ate
vec
tor
z);
the
mea
n-a
dju
sted
log
of
earn
ing
s
no
rmal
ized
by
pri
or
per
iod
bo
ok
val
ues
,ro
e t(t
he
seco
nd
elem
ent)
;an
dth
em
ean-a
dju
sted
log
bo
ok-t
o-m
ark
etv
alue
rati
o,
bm
t(t
he
thir
del
emen
t).
Th
esa
mp
lesi
zefo
rth
e
VA
Res
tim
atio
nis
95,6
53
firm
-yea
robse
rvat
ions
Th
ep
aram
eter
sin
the
tab
leco
rres
po
nd
toth
efo
llo
win
gsy
stem
z i;t¼
Cz i;t�
1þ
g i;t;X¼
Eg i;t;g0 i;
t
��
Pan
elB
list
ssu
mm
ary
stat
isti
csof
the
new
sit
ems
asdefi
ned
inS
ect.
4.2
Nr
=D
isco
unt
Rat
eN
ews
=e10 q
C(I
-qC
)-1g i
,t=
k 10 g
i,t
Ne
=E
arn
ing
sN
ews
=e20 (
I-
qC
)-1g i
,t=
k 20 g
i,t
ei0
=(0
,…,
1,…
,0
),w
her
eth
e1
isin
the
ith
po
siti
on
.W
eel
imin
ate
the
top
and
bo
tto
mo
ne
per
cen
tile
of
the
new
sit
ems
and
the
rev
isio
ns
tore
turn
s,r t
-E
t-1(r
t).
Th
us,
the
pan
elan
dal
lsu
bse
qu
ent
tab
les
are
bas
edo
n9
1,0
09
firm
-yea
ro
bse
rvat
ion
s
Pan
elC
show
sth
eco
rrel
atio
ns
bet
wee
nN
e,N
r,an
dr t
-E
t-1(r
t).
Th
ere
vis
ion
tore
turn
sis
defi
ned
inS
ect.
4.2
asr t
-E
t-1(r
t)=
e10 g
1t.
Pea
rson
(Spea
rman
)co
rrel
atio
ns
are
repo
rted
bel
ow
(ab
ov
e)th
ed
iago
nal
Pan
elD
list
sth
em
eans
of
Ne,
Nr,
and
r t-
Et-
1(r
t),
all
rank
edb
yN
ep
ort
foli
oq
uin
tile
s
***
Indic
ate
signifi
cance
level
of
1%
(tw
o-t
aile
d)
The pricing of conservative accounting
123

negatively associated with the past book-to-market ratio. The book-to-market ratio
is positively related to past returns, past earnings, and the past book-to-market.
Table 2, Panel B, provides descriptive statistics of expected-return news (Nr),
earnings news (Ne), and revisions to returns (rt - Et-1(rt)).27 To eliminate potential
outliers, we delete the top and bottom 1% of the news items and the revisions to
returns, resulting in a sample of 91,009 observations. The mean and median of Ne
(0.012 and 0.036, respectively) are significantly positive, indicating that on average
the earnings news is good. The mean and median Nr are also significantly positive
(0.003 and 0.006, respectively) and, consistent with prior literature, significantly
smaller than Ne, indicating that earnings news is the main driver of revisions to
returns at the firm level. The mean and median revisions to returns (0.002 and 0.010,
respectively) are also positive, consistent with the positive mean and median
earnings news.
Table 2, Panel C, shows the Pearson and Spearman correlations among the
variables of Eq. 2. Ne (Nr) is positively (negatively) and significantly correlated
with unexpected returns (rt - Et-1(rt)), and Ne and Nr are negatively and
significantly correlated with each other. These correlations are consistent with the
predictions of the model (Eq. 2). Specifically, the model predicts that the
association of the revision to returns with Ne (Nr) is positive (negative).
Table 2, Panel D, presents the means for earnings news (Ne), expected-return
news (Nr), and revisions to returns ranked by earnings news quintile portfolios.
Quintile 1 is the most negative, and quintile 5 is the most positive. This panel shows
that revisions to returns increase monotonically with the Ne quintiles. Specifically,
revisions to returns increase from -35%, in the lowest quintile, to 35% in the
highest quintile. The Nr column shows that, excluding the first quintile, the mean of
Nr decreases monotonically with Ne. This result indicates that earnings news is
inversely related to discount rate news, suggesting that positive earnings news is
associated with risk reduction and a concomitant decrease in the discount rate.28
6.2 Earnings news and special items
Table 3 analyzes the relation between earnings news (Ne) and special items (SI). Panel
A lists mean Ne and mean SI ranked by Ne quintile portfolios. Quintile 1 is the most
negative, and quintile 5 is the most positive. The results in this panel are generally
consistent with our expectations. Specifically, when earnings news is negative
(quintiles 1 and 2), so are special items. In addition, special items are positive only for
the highest quintile of earnings news. This panel also shows that the means of SI
increase monotonically from quintile 1 to quintile 5. For example, the mean of SI in
quintile 1 is -0.049, and it increases monotonically to 0.005 in quintile 5.29 Overall,
27 The revision to returns is computed as the residual from the VAR return equation. See Eq. 6a.28 We are not making a causality statement here but rather documenting an association.29 As a sensitivity analysis, we examine the frequencies of positive and negative special items by
earnings news portfolio quintiles. Going from the most negative earnings news (quintile 1) to the most
positive earnings news (quintile 5), the proportion of firms with negative (positive) special items
decreases (increases) monotonically with earnings news.
J. L. Callen et al.
123
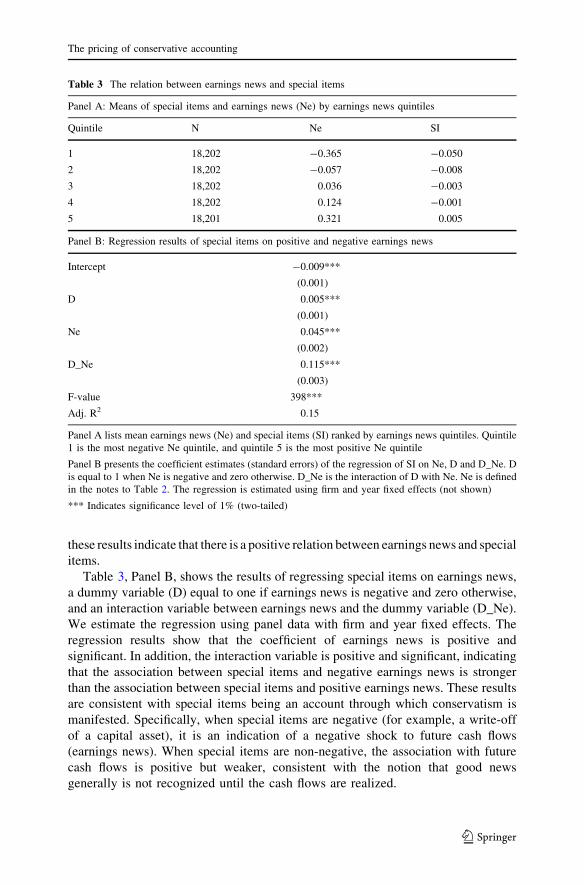
these results indicate that there is a positive relation between earnings news and special
items.
Table 3, Panel B, shows the results of regressing special items on earnings news,
a dummy variable (D) equal to one if earnings news is negative and zero otherwise,
and an interaction variable between earnings news and the dummy variable (D_Ne).
We estimate the regression using panel data with firm and year fixed effects. The
regression results show that the coefficient of earnings news is positive and
significant. In addition, the interaction variable is positive and significant, indicating
that the association between special items and negative earnings news is stronger
than the association between special items and positive earnings news. These results
are consistent with special items being an account through which conservatism is
manifested. Specifically, when special items are negative (for example, a write-off
of a capital asset), it is an indication of a negative shock to future cash flows
(earnings news). When special items are non-negative, the association with future
cash flows is positive but weaker, consistent with the notion that good news
generally is not recognized until the cash flows are realized.
Table 3 The relation between earnings news and special items
Panel A: Means of special items and earnings news (Ne) by earnings news quintiles
Quintile N Ne SI
1 18,202 -0.365 -0.050
2 18,202 -0.057 -0.008
3 18,202 0.036 -0.003
4 18,202 0.124 -0.001
5 18,201 0.321 0.005
Panel B: Regression results of special items on positive and negative earnings news
Intercept -0.009***
(0.001)
D 0.005***
(0.001)
Ne 0.045***
(0.002)
D_Ne 0.115***
(0.003)
F-value 398***
Adj. R2 0.15
Panel A lists mean earnings news (Ne) and special items (SI) ranked by earnings news quintiles. Quintile
1 is the most negative Ne quintile, and quintile 5 is the most positive Ne quintile
Panel B presents the coefficient estimates (standard errors) of the regression of SI on Ne, D and D_Ne. D
is equal to 1 when Ne is negative and zero otherwise. D_Ne is the interaction of D with Ne. Ne is defined
in the notes to Table 2. The regression is estimated using firm and year fixed effects (not shown)
*** Indicates significance level of 1% (two-tailed)
The pricing of conservative accounting
123
6.3 Earnings news, special items, and revisions to returns
We estimate Vuolteenaho’s (2002) equation in reverse regression form in the spirit
of Basu (1997).30 More formally, based on Eq. 2, we regress earnings news on
revisions to returns and expected-return news:
Net ¼ a0 þ a1 rt � Et�1 rtð Þð Þ þ a2Nrt þ et ð16Þ
where the aj are parameters, and et is a white noise innovation term. Consistent with
the model, we expect a1 [ 0 and a2 [ 0.31
Given that earnings news equals the sum of the current period earnings shock and
future earnings shocks (Ne = CES ? FNe), one can decompose Ne into its
components and regress the current period earnings shock (CES) on the independent
variables in Eq. 5 as well as the shock to future expected earnings (FNe). We also
estimate a variant of the model using the level of earnings. Specifically, the current
period earnings shock equals current period ROE (that is, earnings scaled by
beginning of period book value of equity) minus the expected ROE (see Eq. 10).
Thus, we include the predicted ROE (PROE) as an explanatory variable in the levels
regression.32
Furthermore, we argued above that special items are an imperfect substitute for
earnings news so that special items should be non-negatively associated with
revisions in equity returns. To examine this conjecture, we re-estimate the
regression with special items as the dependent variable.
We estimate the regressions using panel data with firm and year fixed effects.33
The regression results are presented in Table 4, Panel A. The results of the earnings
news regression are presented in the Ne column in Panel A.34 The signs of the
estimated coefficients are as conjectured—positive and highly significant at the 1%
level. Similar to the earnings news regression, the signs of the estimated coefficients
in the special items regression (SI column) are positive and significant at the 1%
level, indicating a positive relation between special items and unexpected returns.35
In a further analysis, we regress the current period earnings shock (CES) and the
earnings level (ROE) on the revision to returns, discount rate news, and other
control variables as dictated by the Vuolteenaho model. The shock to future
earnings (FNe) and the predicted (expected) next period ROE (PROE) are the
30 In Eq. 2, the revisions in returns are tautologically determined by Ne and Nr so that there are no
parameters to estimate. However, we test Eq. 2 using ex post revisions in returns so that the relation has
an error structure.31 Note that a2 [ 0 because Nr is on the other side of the equation in a reverse regression.32 Formally, Ne = CES ? FNe = ROE – PROE ? FNe.33 We obtain similar results when estimating the regressions using the Fama–MacBeth (1973)
methodology.34 Although Nrt and (rt – Et-1(rt)) are highly correlated (see Table 2, Panel C), the maximum variance
inflation factor of 2.18 and condition index of 2.56 are not indicative of serious multicollinearity.35 We also test whether the coefficients across the Ne and SI regressions are equal by estimating both
equations as a system. The coefficient on the revisions to returns in the SI regression is significantly
smaller (at less than the 1% level) than the coefficient on the revisions to returns in the Ne regression (a1)
consistent with special items being a noisy measure of earnings news.
J. L. Callen et al.
123

Table 4 The relation between revisions to returns and earnings news, special items, current period
earnings shock, and earnings
Ne SI CES ROE
Panel A: Linear specification
Intercept 0.013***
(0.002)
-0.013***
(0.001)
-0.001
(0.001)
0.006***
(0.001)
rt - Et-1(rt) 0.763***
(0.002)
0.075***
(0.001)
0.044***
(0.001)
0.046***
(0.001)
Nr 1.137***
(0.005)
0.192***
(0.002)
0.343***
(0.002)
0.343***
(0.002)
FNe 0.550***
(0.002)
0.540***
(0.002)
PROE 0.932***
(0.002)
Adj. R2 0.63 0.11 0.74 0.80
Panel B: Nonlinear specification
Intercept 0.018***
(0.002)
-0.011***
(0.001)
0.001
(0.001)
0.008***
(0.001)
D -0.004***
(0.002)
-0.001
(0.001)
-0.001
(0.001)
-0.001**
(0.001)
rt - Et-1(rt) 0.744***
(0.004)
0.067***
(0.002)
0.038***
(0.002)
0.040***
(0.002)
D * (rt - Et-1(rt)) 0.028***
(0.005)
0.013***
(0.002)
0.010***
(0.002)
0.009***
(0.002)
Nr 1.136***
(0.005)
0.191***
(0.002)
0.343***
(0.002)
0.342***
(0.002)
FNe 0.549***
(0.002)
0.540***
(0.002)
PROE 0.932***
(0.002)
Adj. R2 0.63 0.11 0.74 0.80
Regime 1
rt - Et-1(rt) C 0
Regime 2
rt - Et-1(rt) \ 0
Difference
Panel C: Switching regression analysis
Intercept 0.162***
(0.001)
0.178***
(0.001)
0.015***
(0.002)
Ne–Nr 1.456***
(0.005)
0.569***
(0.002)
0.887***
(0.006)
Panel A shows the coefficient estimates (standard errors) of the earnings news (Ne), special items (SI),
current period earning shock (CES), and earnings scaled by beginning of period book value of equity
(ROE) regressions. FNe is the shock to future earnings (i.e., FNe = Ne–CES). PROE is the predicted
ROE from Eq. 6b. Ne, rt - Et-1(rt), and Nr are defined in the notes to Table 2. SI is defined in the notes
to Table 1
The pricing of conservative accounting
123

relevant controls.36 Consistent with the findings above, the coefficients on revisions
to returns and discount rate news in the current period earnings shock and the
earnings level regressions (CES and ROE columns, respectively) are positive and
significant. The coefficients on the shock to future earnings (FNe) in both
regressions are positive and significant, and the coefficient on the predicted ROE in
the ROE regression is also positive and significant.
These latter regressions abstract from the potential nonlinearity induced by
conservative accounting as discussed in the conceptual analysis. To test for
nonlinearity, we estimate the following equation:
Net ¼ b0 þ b1Dþ b1 rt � Et�1 rtð Þð Þ þ b2D � rt � Et�1 rtð Þð Þ þ b3Nrt þ et ð17Þ
where the indicator variable (D) takes on a value of one if revisions to returns are
negative and zero otherwise.37
Panel B shows the regression results.38 In all regressions, the coefficient
estimates of the revisions to returns, the interaction term, and discount rate news are
positive and significant at the 1% significance level. The positive coefficient on the
interaction variable suggests differential timeliness in the incorporation of negative
news relative to positive news.
Following Basu (1997), we compute the ratio of the coefficient on the
interaction variable to the sum of the coefficients on the interaction variable and
revisions to returns to gauge the extent to which earnings news, special items,
current period earnings shock, and earnings levels capture differential timeliness.
These ratios are 1.04, 1.19, 1.26, and 1.23, respectively, vs. 4.66 reported by
Basu (1997).39
Table 4 continued
Panel B repeats the analysis allowing for a nonlinear relation between the dependent variables and
revisions to returns. D equals 1 when revision to returns (rt - Et-1(rt)) are negative and zero otherwise.
The regressions are estimated using firm and year fixed effects (not shown)
Panel C presents the results of the switching regression analysis. The dependent variable is rt - Et-1(rt), and
the independent variable is Ne–Nr. Regime 1 (Regime 2) shows the estimation results for positive (negative)
unexpected returns. The Difference column shows the difference in the coefficients across the two regimes
(Regime 1 minus Regime 2)
*** Indicates significance level of 1% (two-tailed)
36 These variables obtain by decomposing Ne in Eq. 2 as per footnote 33 so that CES and ROE are the
variables on the left-hand of the equation, respectively.37 Equation 17 generalizes the Basu (1997) nonlinear relation. In particular, assuming inter-temporally
constant discount rates so that Nrt = 0 and assuming that shocks to expected future earnings (FNe) are
identically 0 yields the Basu relation: ROEt ¼ b0 þ b1Dþ b1 rt � Et�1 rtð Þð Þ þ b2D � rt � Et�1 rtð Þð Þ:38 The variance inflation factors for all four regressions are less than 10, indicating that multicollinearity
is not a concern.39 The difference between the ratios is likely attributable to the inclusion of discount rate news, the shock
to future earnings, and the predicted ROE in our regression, as required by the Vuolteenaho model.
J. L. Callen et al.
123
It is worth noting that the first Dietrich et al. (2007) critique of the reverse
regression procedure of Basu (1997) does not apply with equal force to Eq. 17
above. The dependent variable in the Basu analysis is earnings while the dependent
variable in Eq. 17 is earnings news. The relations among earnings news, discount
rate news, and revisions to returns in Eq. 17 are derived from a return
decomposition identity and identities do not suffer from (correlated) omitted
variables. Nevertheless, their second critique does apply since even in the absence
of correlated omitted variables, the OLS coefficients may be biased given that
revisions to returns are endogenous, and the regression is conditioned on the sign of
an endogenous variable. Specifically, conditioning on an endogenous variable
results in a non-random sample and, hence, in a sample selectivity bias, unless one
accounts for sample selectivity in the estimation procedure.
To mitigate these concerns, we perform two additional tests. First, in the absence
of correlated omitted variables, Dietrich et al.’s equation (1.9) shows that the
probability limit of the coefficient on earnings news conditioned on whether
revisions to returns are positive (negative) is the product of the true unconditional
coefficient times the ratio of the variance of earnings news to the variance of
revision to returns conditioned on whether revisions to returns are positive
(negative). Since the ratio of these variances is significantly greater when
conditioned on negative revisions to returns as opposed to positive revisions to
returns (untabulated), it indicates that the probability limit of earnings news is
significantly greater when revisions to returns are negative than when revisions to
returns are positive, consistent with nonlinearity and the differential timeliness of
earnings news.40
Second, and more importantly, we decompose Eq. 17 into a two equations
system, depending upon whether the dummy variable D is 1 or 0, yielding the
switching regression format (with known sample separation):41
rt � Et�1 rtð Þ ¼ a0 þ a1 Net � Nrtð Þ þ et rt � Et�1 rtð Þ� 0 ð18aÞrt � Et�1 rtð Þ ¼ b0 þ b1 Net � Nrtð Þ þ /t rt � Et�1 rtð Þ\0 ð18bÞ
The conservative nature of the accounting system implies that the coefficient on
earnings news in the negative unexpected return regime, b1, should be smaller than
the coefficient on earnings news in the positive unexpected return regime, a1. We
control for the sample selectivity by estimating these switching regressions
simultaneously by maximum likelihood. Moreover, since these switching
40 To account for discount rate news, we subtract discount rate news from earnings news, effectively
forcing the coefficient on discount rate news to take on its theoretically correct value of one. Therefore,
everywhere that earnings news appears in this statement, one should read earnings news less discount rate
news.41 The switching regressions (Eqs. 18a and b) are of the exogenous known sample separation type first
analyzed by Goldfeld and Quandt (1973). A potentially better approach is to estimate the degree of
conservatism endogenously. Unfortunately, since the firm’s degree of conservatism is unobservable to the
researcher, the switching regression would be of the unknown sample separation type. The latter raises
difficult technical estimations issues and is the subject of ongoing research. For surveys of switching
regression models, see especially Maddala (1983, 1986).
The pricing of conservative accounting
123

regressions are estimated directly (that is, not in reverse regression form), Dietrich
et al.’s first criticism is also mitigated by the switching regression methodology.
Table 4, Panel C, presents the results of the switching regression analysis. As
predicted, the coefficient on earnings news for positive unexpected returns (1.456) is
significantly greater than the coefficient on earnings news for negative unexpected
returns (0.569).
6.4 Conservatism ratio
We measure the conservatism ratio CR (at the firm year level) as the current period
earnings shock (CES) divided by earnings news (Ne). The current period earnings
shock is measured by the residual from the earnings equation (Eq. 6b), and earnings
news is calculated from Eq. 10. Therefore, CR shows the proportion of the total
shock to current and expected future earnings recognized in current year earnings.
By this criterion, firm X is more conservative than firm Y at time t if given some bad
(good) news shock at time t, firm X recognizes more (less) of the bad (good) news
shock in current earnings than does firm Y. Thus, one has to control for economic
news when gauging the degree of conservatism.
We investigate the empirical properties of CR by examining its association with
good and bad news using both univariate and multivariate analyses. Consistent with
the conservative nature of accounting, we expect CR to be negatively associated
with unexpected returns (a proxy for news) and to be more highly negatively
associated with bad news events than with good news events. In a conservative
environment, more of the earnings shock should be recognized in current period
earnings for bad news than for good news (for a given level of economic shock).
Since a negative CR raises interpretation issues (see below), we delete the
negative CR observations (12,147) from the analysis. In addition, we eliminate the
top and bottom one percentile of CR (1,577 observations), resulting in a sample of
77,285 observations.
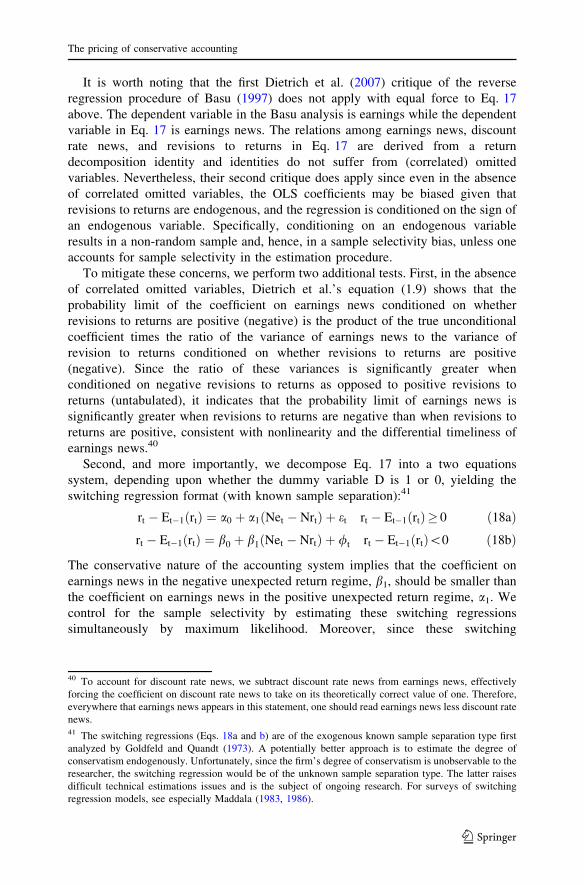
Table 5, Panel A, presents a univariate analysis of the mean and median CR
conditioned on the sign of unexpected returns. The mean (median) of CR for
positive unexpected returns is 0.447 (0.371) as compared with 0.583 (0.426) for
negative unexpected returns. The differences in the means and medians are
significant at less than the 1% level. Hence, the univariate analysis indicates that CR
is higher for bad news in comparison to good news, consistent with differential
timeliness.
Panel B presents the multivariate analysis. In column (1), CR is regressed on
unexpected returns, a dummy variable (D) equal to one if unexpected returns are
negative and zero otherwise, and the interaction of D and unexpected returns. As
expected the coefficient on the revisions to returns is negative and significant, and
the coefficient on the interaction variable is positive and significant. Specifically, the
coefficient on the revisions to returns is -0.372, and the coefficient on the
interaction variable is 0.863. Hence, the coefficient on negative news equals 0.491.
This indicates that CR is positively (negatively) associated with bad (good) news,
consistent with the conservative nature of financial accounting. In addition, similar
to the findings in the univariate analysis, the coefficient for bad news is significantly
J. L. Callen et al.
123
greater (at the 1% level) than the absolute value of the coefficient on good news,
consistent with differential timeliness.
Column (2) replicates the regression in column (1) after controlling for the
following variables: ROE, SIZE (log market value of equity), LOSS (a dummy
variable equal to one if earnings are negative and zero otherwise), and SI. We
expect positive coefficient on LOSS and negative coefficient on SI.42 We do not
Table 5 The relation between the conservatism ratio (CR) and revisions to returns
Panel A: Mean (median) conservatism ratio for positive and negative unexpected returns
N CR rt - Et-1(rt)
rt - Et-1(rt) [ 0 41,811 0.447
(0.371)
0.281
(0.224)
rt - Et-1(rt) \ 0 35,474 0.583
(0.426)
-0.282
(-0.212)
Difference 0.136***
(0.055)***
Panel B: Regressions of conservatism ratio (CR) on proxies for positive and negative news
Predicted sign (1) (2)
Intercept ? 0.551***
(0.004)
0.641***
(0.013)
D ? 0.172***
(0.006)
0.171***
(0.006)
rt - Et-1(rt) - -0.372***
(0.012)
-0.379***
(0.012)
D * (rt - Et-1(rt)) ? 0.863***
(0.018)
0.876***
(0.018)
ROE ? 0.183***
(0.021)
Size ? -0.022***
(0.002)
Loss ? 0.042***
(0.008)
SI - -0.087***
(0.030)
Adj. R2 0.05 0.06
Panel B shows the coefficient estimates (standard errors) of the regressions of CR on good and bad news
(and control variables). CR is defined as the ratio of the current period earnings shock to total earnings
news. SIZE is the log of market value of equity. LOSS is an indicator variable equal to one if earnings are
negative and zero otherwise. All other variables are defined in previous tables. The regressions are
estimated using firm and year fixed effects (not shown)
*** Indicates significance level of 1% level (two-sided)
42 Note that SI is negative for write-offs.
The pricing of conservative accounting
123

have predictions for the signs of the coefficients on ROE and SIZE. The coefficients
on revisions to returns and the interaction variable are identical to those reported
above. As expected the coefficient on LOSS is positive and significant indicating
that CR is generally higher when firms report losses. The coefficient on SI is
negative and significant consistent with higher CR when firms report negative
special items (for example, writeoffs).
A negative CR raises interpretation issues. Specifically, the cases where earnings
news is negative and the current period earnings shock (CES) is positive may
represent overly aggressive financial reporting because the firm has a positive CES
even though it will experience an overall negative shock to expected current and
future cash flows. Similarly, cases where earnings news is positive and CES is
negative may represent overly conservative financial reporting. The data are
consistent with this conjecture. The correlation between CES and revisions to
returns for negative CR observations is -0.68, in contrast to a correlation of 0.35 for
observations where CES and earnings news are of the same sign (untabulated).43
We leave it for future research to investigate the negative CR cases more
thoroughly.
Table 6 partially validates CR as a measure of conditional conservatism. Since
conservatism is likely to be manifested when news is bad, we restrict the sample to
observations with negative unexpected returns. Next, we control for the magnitude
of the shock when determining the rank of the degree of conservatism. Specifically,
we rank the observations (again only those with negative unexpected returns) to
quintiles according to the size of the shock. Next, within each quintile of negative
shocks, we rank the observations to quintiles based on the CR.
Table 6, Panel A, examines the univariate association between the CR rank and
firm leverage, volatility of returns, frequency of losses, total accruals, the market-to-
book (MB) ratio, and size. Watts (2003) argues that conditional conservatism should
be positively correlated with asymmetric information in debt and equity contracts—
which we proxy by firm leverage and return volatility, respectively. Specifically,
leverage is a proxy for the agency conflict between shareholders and bondholders.
The higher the degree of leverage, the greater is the demand for conservatism by
bondholders to constrain diversion of resources from the firm to shareholders. The
standard deviation of returns is a proxy for operational uncertainty. The greater the
operational uncertainty the greater the demand for conservatism by shareholders
primarily because managerial performance is harder to verify and less certain. In
addition, firms with greater operational uncertainty are exposed to a greater
litigation risk because of higher risk of shareholder losses. Conditional conservatism
should also be positively correlated with the incidence of losses and negatively
correlated with accruals. Firms that have high incidence of losses are likely to be
more conservative. Since conservatism is manifested primarily in negative accruals
(see Givoly et al. 2007; Ball and Shivakumar 2006) we also expect that firms with
high degree of conservatism to report more negative accruals. Many of the studies
on conservatism document a negative relation between Basu’s asymmetric
43 Earnings news is a weighted average of the CES and revisions to returns. Hence, CES and earnings
news may be of opposite sign if CES and revisions to returns are also of opposite sign.
J. L. Callen et al.
123

Table 6 Validation of the estimated degree of conservatism (CR)
Panel A: Correlation between the rank of CR and conservatism determinants
Variable Correlation
Leverage 0.064***
(0.000)
MB -0.0031
(0.578)
TACC -0.048***
(0.000)
Loss 0.078***
(0.000)
STD_RET 0.062***
(0.000)
MV -0.018***
(0.001)
Panel B: Means of variables by rank of CR
RANKCR Leverage TACC STD_TACC Loss STD_ROE STD_RET
1 0.256 -0.021 0.065 0.101 0.108 0.117
2 0.264 -0.028 0.069 0.187 0.123 0.123
3 0.287 -0.035 0.073 0.346 0.149 0.129
4 0.299 -0.044 0.077 0.396 0.195 0.134
5 0.288 -0.031 0.073 0.179 0.186 0.127
Panel C: Stability of CR at the firm level
Period t Period t ? 1
High Medium Low
High 0.43 0.31 0.25
Medium 0.27 0.40 0.34
Low 0.22 0.30 0.48
Ranks the conservatism ratio (CR) by quintiles with the lowest (highest) quintile exhibiting the lowest (highest) degree
of conservatism. The sample is restricted to firms with negative unexpected returns (33,956 observations)
Panel A presents the correlation of the rank of CR with selected variables. STD_RET is standard deviation of monthly
stock returns in the previous 3 years. DLOSS is an indicator variable with one if the firm reports negative income before
extraordinary items and zero otherwise. TACC is total accruals. MB is the market-to-book ratio
Panel B shows the means of selected variables by the rank of CR. STD_TACC (STD_ROE) is the standard deviation of
total accruals (ROE) within each quintile of CR
Panel C shows the frequency table of the rank of CR. CR is ranked by terciles of high, medium, and low conservatism
for period t and period t ? 1. The table entries show the proportions frequencies. For example, the upper left cell (High
conservatism in period t and high conservatism in period t ? 1) indicates that 43% of the companies that were classified
as high conservatism firms in period t are classified as high conservatism firms in period t ? 1
*** Indicate significance level of 1%
The pricing of conservative accounting
123

timeliness measure and the market to book ratio (MB), a measure of overall
conservatism (Ryan 2006). This result suggests that unconditional and conditional
conservatism are substitutes for each other. In contrast, Roychowdhury and Watts
(2007) provide evidence that asymmetric timeliness better captures overall
conservatism when it is measured over multiple years and the relation is positive.
Thus, we have no prediction regarding the correlation between CR and MB. The
relation between size and degree of conservatism is also ambiguous ex ante. On one
hand, larger firms face lower operational uncertainty and therefore lower demand
for conservatism. On the other hand, larger firms are likely to have more resources
and are subject to greater litigation risk, which increases the demand for
conservatism.
With the exception of the MB ratio, the univariate correlations in Panel A are all
highly statistically significant and consistent with the above predictions. The degree
of conservatism is positively correlated with leverage, the incidence of losses, and
the standard deviation of returns, and negatively correlated with the total accruals
and firm size. The latter correlation suggest that smaller firms are more conservative
consistent with greater operational uncertainty. The correlation with the market-to-
book ratio is close to zero and not statistically significant.
Panel B shows the means of the variables in Panel A for each quintile of the rank
of CR. The results tend to confirm the findings of Panel A. Specifically, except for
quintile 5, leverage, the volatility of returns, and the incidence of losses (total
accruals) are almost monotonically increasing (decreasing) with the rank of CR. In
addition, this panel shows that the volatility of accruals and the volatility of ROE
increase almost monotonically with the rank of CR, consistent with Givoly et al.
(2007) who argue that conservatism is manifested partly in greater volatility of
accruals and profitability.
Givoly et al. (2007) also argue that since conservatism is a policy variable, it
should be reasonably stable over time at the firm level. Panel C provides evidence
on the stability of the rank of CR. CR is ranked by terciles of high, medium, and low
degrees of conservatism for period t and period t ? 1. The diagonal shows that CR
is fairly stable. For example, high, medium, and low CR’s in period t have a
probability of 43, 40, and 48%, respectively, of remaining in the same tercile in
period t ? 1.44 These results are highly significant (v2 = 523, p = 0.00).
7 Conclusion
This paper analyzes the nonlinear pricing of conservatism using the return
decomposition model of Vuolteenaho (2002) and investigates the pricing implica-
tions of special items, one of the major accrual items through which conservatism is
facilitated. Consistent with implications of accounting conservatism for revisions in
security returns, we show empirically that there is a significant nonlinear relation
44 Although the degree conservatism is expected to be stable over time, it should not be too stable if only
because CR is a function of the relative shock of earnings to unexpected returns (see Eq. 15), which
varies substantially over time even at the firm level.
J. L. Callen et al.
123

between revisions to equity returns and revisions to expected current and future cash
flows (earnings news). In particular, revisions to equity returns are more highly
associated with negative earnings news than with positive earnings news. Our
analysis of conservative accounting also implies that revisions to equity returns are a
nonlinear function of special items such that revisions to equity returns are either
more highly positively correlated with negative special items than with positive
special items or revisions to equity returns are uncorrelated with special items. The
empirical results confirm this conjecture as well. Our results imply that special items
are an imperfect and noisy measure of revisions to expected future cash flows by
comparison to earnings news, consistent with our conceptual analysis.
Future research should try to control for a number of potential measurement
issues that may be affecting these results. First, reporting special items as a separate
line item, especially before the mid-1990s, may have involved extensive self-
selection by managers. Riedl (2004) reports on a survey by the Financial Executives
Institute from 1991, which shows that 52% of write-offs were not included as
special items (see also Riedl and Srinivasan 2007). This suggests that firms self
select into reporting special items (within GAAP enforcement constraints). Hence,
we expect and observe that most special items will be negative to encourage
investors to view them as one-time or non-recurring items. This self-selection
process suggests that it may prove interesting and fruitful to examine extreme
discretionary accruals in place of special items as an alternative measure of
conditional conservatism. Of course, discretionary accruals, like special items, can
also be used as an earnings management tool. Second, the literature reveals that not
all special items are homogeneous and that, subject to data limitations, it may be
useful to split special items into their component parts.
This paper also develops a new direct metric of conservatism at the firm-year
level based on the Vuolteenaho (2002) model. This conservatism ratio (CR) is
computed as the ratio of the current earnings shock to earnings news. Hence, CR
shows how much of the total shock to expected current and future earnings (cash
flows) over the lifetime of the firm is recognized in current year earnings. Focusing
on positive CR’s, we find that a greater proportion of the shock to earnings is
recognized in the current period when the shock is negative than when the shock is
positive, consistent with conservative accounting. In addition, we show that the
degree of conservatism, formed on the basis of CR, is positively related to leverage
and the volatility of returns, consistent with conservatism being determined by the
asymmetric information in debt and equity contracts. The degree of conservatism is
also negatively related to total accruals and size, and positively related to the
volatility of accruals and the volatility of ROE. CR is also fairly stable over time as
would be expected for a conservatism measure.
The conservatism ratio has potential for future research. One can use this
measure of conservatism both for cross-sectional and time-series analyses. For
instance, researchers can examine how cross-sectional differences in conservatism
relate to factors that affect the reporting choices of the firm such as governance,
auditor independence, or compensation. Another avenue for research is to
investigate how the time-series properties of the degree of conservatism change
The pricing of conservative accounting
123

with external factors such as new regulation (for example, new accounting
standards, Sarbanes-Oxley, etc.).
Acknowledgments We have benefited from comments by Jim Ohlson (the editor), Gus De Franco,
Peter Easton, Hai Lu, Stephen Ryan, by workshop participants at the City University of Hong Kong, EAA
meetings in Dublin, Hebrew University, Interdisciplinary Center-Israel, MIT, University of Cyprus,
University of Illinois at Urbana-Champagne, University of Notre Dame, SUNY-Buffalo, Tel-Aviv
University, University of Toronto, and by an anonymous referee. Hope gratefully acknowledges the
financial support of the Deloitte Professorship.
Appendix: A numerical example to illustrate the conceptual analysis in Sect. 3
The following numerical example is used to illustrate the conceptual analysis.
Benchmark Scenario 1 Scenario 2 Scenario 3
t = 0 t = 1 t = 2 t = 3 t = 2 t = 3 t = 2 t = 3
CF -30,000 13,139 11,825 9,854 14,453 16,424 14,453 16,424
NI – 3,139 2,365 5,326 6,424 10,859 6,424 10,859
MS – 13,139 26,936 40,830 29,563 50,422 29,563 50,422
PPE-BV 30,000 20,000 8,569 0 10,000 0 10,000 0
PPE-MV 30,000 21,361 8,569 0 14,282 0 14,282 0
BV 30,000 33,139 35,505 40,830 39,563 50,422 39,563 50,422
MV 30,000 34,500 35,505 40,830 43,845 50,422 43,845 50,422
Ne = DE(ROE) * BVt-1 – 0 -4,266 0 1,314 3,285 1,314 3,285
DEL(MV) – 0 -4,170 0 1,314 3,285 4,170 0
SI – 0 -1,431 0 0 0 0 0
COC (%) – 15 15 15 15 15 15 15
RET (%) – 15 3 15 19 23 27 15
rt - Et-1(rt) (%) – 0 -12 0 4 8 12 0
Consider a new all-equity firm that invests $30,000 in a depreciable plant at
t = 0. The firm’s cost of capital (COC) is an intertemporally constant 15%. The
plant earns expected cash returns of $13,139 (end of year) for each of three periods
and then costlessly liquidates. Cash returns from plant activity are invested in
marketable securities that earn the firm’s cost of capital.45 The firm depreciates the
asset using the straight-line method. There are no taxes. Given these data, the
present value of the plant and its market value at t = 0 is $30,000. An investor
would earn an internal rate of return of 15% on the investment. Each period the
financial report shows a straight-line depreciation expense accrual of $10,000. The
45 The assumption that free cash flows remain invested in the firm and are not paid out as dividends adds
additional illustrative complexity to the analysis.
J. L. Callen et al.
123

stock price rises by 15% a year. See the Benchmark scenario in the table above for
details regarding period 0 and period 1.46
Scenario 1 is similar to the benchmark scenario with one major difference. Just
before publication of the financial report at t = 2, management discovers that cash
flows for the period are 10% lower than expected, $11,825 instead of $13,139, and
consequently revises downwards its estimates of expected future plant cash flows
from $13,139 to $9,854 at t = 3, a reduction of 25% from the benchmark scenario.
The carrying value of PPE at t = 2 before the change in estimate is $10,000
whereas the (revised) undiscounted future cash flows from the asset are $9,854.
Since the carrying value of PPE is less than the undiscounted future cash flows,
an impairment is recognized under current GAAP and a special accrual of
-1,431 = (9,854/(1.15) - 10,000) is recorded to bring PPE down to its market
value of $8,569. In contrast, earnings news (Ne), the reduction in the value of the
firm over its remaining lifetime due to the revision of expected future cash flows, is
-$4,266, closely corresponding to the unexpected change in market value
(DEL(MV)) of -$4,170 (=35,505–39,675).47 The reduction in market value
translates into a revision in expected returns (rt - Et-1(rt)) of -12% relative to the
benchmark scenario. Note that the change in the market value of the firm is
comprised of a reduction in the market value of PPE of -$2,856 (=8,569–11,425)
and of a reduction in the end of year balance of marketable securities of -$1,314
(=26,396–28,250). Of course, whether this negative earnings shock is fully reflected
in equity returns in the current period depends upon whether shareholders learn of
the downward revision of expected cash flows. Absent non-accounting sources of
information, the primary source of information to the equity market regarding the
downward revision in future cash flows is the recorded special item.
Scenario 1 raises a measurement issue. The recorded special item is only
-$1,431 while the reduction in equity value is the earnings news of -$4,170, a
difference of -$2,739. This difference has two sources: (1) the difference between
the carrying value of the asset and its market value of -$1,425 = (10,000–11,425),
caused by a (straight-line) depreciation policy that differs from economic
depreciation, and (2) the reduction in the investment in marketable securities due
to the reduced operational cash flows of -$1,314, caused by the less than 100%
dividend payout ratio and the fact that the GAAP definition of special items does not
include this opportunity cost.
46 Net income (NI) equals cash flow (CF) minus depreciation expense plus investment income, computed
as beginning-of-period balance of marketable securities (MS) multiplied by the cost of capital (COC).
PPE-MV is computed as the present value of future cash flows. Finally, market value (MV) is computed
as the sum of PPE-MV and MS.47 The small difference in the two numbers is due to the fact that earnings news is computed here
somewhat inexactly but more simply as the sum of the changes in ROE multiplied by the beginning of
period book value of equity over the life of the firm. Earnings news is defined more exactly in Sect. 4.
Note that earnings news in Scenario 1 is computed based upon the period 2 report. This computation does
not presuppose knowledge of the period 3 shock beyond the period 2 special items. In particular, given
the asset writedown (special items) in period 2, plant cash flows in the next period equal the product of the
asset value and COC. Moreover, the period 3 return on marketable securities (the beginning of the period
balance of MS times COC) and depreciation expense are also known. Ultimately, special items are what
link the period 3 shock to the period 2 report.
The pricing of conservative accounting
123

The comparison of Scenario 1 with the benchmark scenario is illustrative. First,
the conventional earnings surprise is an incomplete measure of the news event,
because the change in market value is determined both by revisions to current cash
flows (the conventional earnings surprise) in period 2 and revision to expected
future cash flows in period 3. Indeed, the conventional earnings surprise of -$2,745
(=2,365–5,110) understates the overall shock to future cash flows, while earnings
news captures the total shock to future cash flows. Second, bad news is defined by
the revision to period 2 returns of -12% (=3-15%) and not by the period 2 return
of 3%. Therefore, an analysis using raw returns is potentially misspecified. Third,
the special items accrual significantly understates earnings news and the revision to
equity returns.48 This scenario indicates that while earnings news and the revision in
equity returns are perfectly positively correlated, special items are less than
perfectly positively correlated with either earnings news or the revision in equity
returns, despite the fact that special items signal and provide information about the
shock to future cash flows to shareholders. Further, the accounting recognition of
special items is subject to GAAP, which may allow recognition only if specific
criteria are met. As such, special items are not a perfect proxy either for earnings
news or the revision to equity returns.
Scenario 2 illustrates a positive earnings news event. Again, it is assumed that
accounting reports are the only source of information about shocks to future cash
flows. Instead of expecting cash flows to decrease, management expects cash flows
Earnings News 4%
4%-12%
-12%
rt –Et-1(rt)
Fig. 1 The relation between revisions to equity returns and earnings news information solely fromaccounting sources. The figure shows the linear relation between revisions to equity returns and earningsnews when accounting reports are the sole source of news for equity market participants. The numbers inthe figure are obtained from Scenarios 1 and 2. Note that dollar earnings news numbers in the Scenariostable of the Appendix are converted to percentages in this and subsequent figures by dividing the dollarearnings news by beginning of period book value of equity. Hence, the earnings news in the figure equalsthe sum of the unexpected changes in ROE as per footnote 51
48 Of course, if the firm adopts a depreciation policy such that book depreciation is less than economic
depreciation, the special item could potentially overstate earnings news and the revision in equity values,
although this is unlikely. It is even more unlikely if free cash flows are not paid out as dividends. More
often than not, the historical cost basis of asset value understates market value, so that special items are
likely to understate earnings news and the revision to equity values.
J. L. Callen et al.
123

to increase 10% relative to the benchmark at t = 2, from $13,139 to $14,453, and
25% relative to the benchmark at t = 3, from $13,139 to $16,424. Thus, Scenario 2
is completely symmetric to Scenario 1 but with positive shocks to future cash flows.
Absent accrual information on the gains because of conservatism and absent
external sources of information about the shock, shareholders do not learn about the
new situation until the cash flows are realized (that is, no positive special items are
recognized). In this scenario, earnings news (unexpected change in market value) is
$1,314 ($1,314) in period 2 and $3,229 ($3,285) in period 3, resulting in unexpected
returns of 4 and 8%, respectively. Thus, under this scenario, there is no association
between special items and earnings news and between special items and the revision
in equity returns. The revision in equity returns is (perfectly) positively associated
with earnings news.49
Figure 1 illustrates the relation between the revision to returns and earnings news
for Scenarios 1 and 2 assuming unrealistically that accounting reports are the only
source of information for equity markets. Since accounting reports are the only
source of news, the revision in returns are necessarily linearly related to earnings
news, although because of conservatism negative news has a greater impact on
returns than positive news (-12 vs. 4%).50
Once we allow for alternative sources of information for positive shocks, the
relation between the revision to returns and earnings news become nonlinear.51 The
case of negative earnings shocks (Scenario 1) remains unchanged since in that case
all the relevant information is available to the equity markets from the accounts
anyway. What does change is the case of positive earnings shocks (Scenario 2).
Scenario 3 shows what happens when accounting reports are not the only source of
information for the capital markets in the case of positive earnings shocks. Because
of the information from non-accounting sources, shareholders learn at t = 2 of
management’s expectations of future cash flow increases. Consequently, returnsadjust fully at t = 2 to the positive news. Period 2 returns increase from 15 to 28%
to reflect expected cash flow changes in both periods 2 and 3 ($4,170). In contrast,
under conservative accounting, the accounts are unaffected by the change in
expectations about future cash flow increases so that earnings news and special
items are unchanged from Scenario 2. A comparison of Scenarios 1 and 3 shows that
alternative non-accounting sources of information about positive firm shocks and
49 Scenario 2 assumes that no positive special items are recorded. However, as noted above, under
GAAP, positive special items are sometimes recognized when earnings news is positive so that
empirically one should expect a weak correlation between special items and positive earnings news and
special items and the revision in returns.50 We convert dollar earnings news to a percentage by dividing the dollar earnings news by beginning of
the period book value of equity. For example, in Scenario 2 the percentage earnings news equals 4%
(=1,314/33,139). The percentage earnings news equals (by construction) unexpected ROE. The expected
ROE is 15.4% (=5,110/33,139, see Benchmark Scenario), and the actual ROE is 19.4% (=6,424/33,139).51 The nonlinearity result is robust to allowing non-accounting information to also inform about negative
shocks. But, in that case, accounting might be irrelevant (or dominated) to the extent that external sources
provide similar information about negative shocks and better information about positive shocks. More
realistically, the more conservative the accounting system, the more likely is management to provide
more timely information about negative shocks and the non-accounting system to provide better
information about positive shocks. In that case, nonlinearity obtains and accounting matters.
The pricing of conservative accounting
123
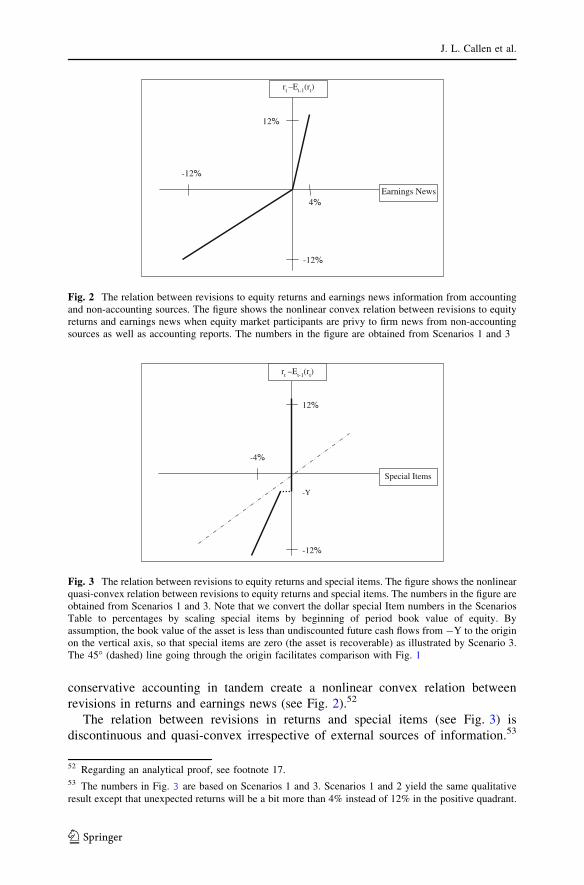
conservative accounting in tandem create a nonlinear convex relation between
revisions in returns and earnings news (see Fig. 2).52
The relation between revisions in returns and special items (see Fig. 3) is
discontinuous and quasi-convex irrespective of external sources of information.53
Earnings News 4%
12%
-12%
-12%
rt –Et-1(rt)
Fig. 2 The relation between revisions to equity returns and earnings news information from accountingand non-accounting sources. The figure shows the nonlinear convex relation between revisions to equityreturns and earnings news when equity market participants are privy to firm news from non-accountingsources as well as accounting reports. The numbers in the figure are obtained from Scenarios 1 and 3
Special Items
12%
-4%
-12%
rt –Et-1(rt)
-Y
Fig. 3 The relation between revisions to equity returns and special items. The figure shows the nonlinearquasi-convex relation between revisions to equity returns and special items. The numbers in the figure areobtained from Scenarios 1 and 3. Note that we convert the dollar special Item numbers in the ScenariosTable to percentages by scaling special items by beginning of period book value of equity. Byassumption, the book value of the asset is less than undiscounted future cash flows from -Y to the originon the vertical axis, so that special items are zero (the asset is recoverable) as illustrated by Scenario 3.The 45� (dashed) line going through the origin facilitates comparison with Fig. 1
52 Regarding an analytical proof, see footnote 17.53 The numbers in Fig. 3 are based on Scenarios 1 and 3. Scenarios 1 and 2 yield the same qualitative
result except that unexpected returns will be a bit more than 4% instead of 12% in the positive quadrant.
J. L. Callen et al.
123

This is because special items in our scenarios are uniformly zero for positive shocks.
Even under GAAP, special items typically understate the revision in returns for
positive news shocks, yielding a nonlinear relation whether or not securities adjust
fully to positive news.
References
Alciatore, M., Callaway, C., Easton, P., & Spear, N. (1998). Asset write downs: A decade of research.
Journal of Accounting Literature,17, 1–39.
Antle, R., Demski, J. S., & Ryan, S. G. (1994). Multiple sources of information, valuation, and accounting
earnings. Journal of Accounting, Auditing and Finance,9, 675–696.
Ball, R., & Shivakumar, L. (2006). The role of accruals in asymmetrically timely gain and loss
recognition. Journal of Accounting Research,44, 207–242.
Basu, S. (1997). The conservatism principle and asymmetric timeliness of earnings. Journal ofAccounting and Economics,24, 3–37.
Beaver, W. H., & Ryan, S. G. (2005). Conditional and unconditional conservatism: Concepts and
modeling. Review of Accounting Studies,51, 269–309.
Callen, J. L. (2009). Shocks to shocks: A theoretical foundation for the information content of earnings.
Contemporary Accounting Research, 26, 1–33.
Callen, J. L., Hope, O.-K., & Segal, D. (2005). Domestic and foreign earnings, stock return variability,
and the impact of investor sophistication. Journal of Accounting Research,43, 377–412.
Callen, J. L., Livnat, J., & Segal, D. (2006). The information content of sec filings and investor
sophistication: A variance decomposition analysis. The Accounting Review,81, 1017–1043.
Callen, J. L., & Segal, D. (2004). Do accruals drive firm-level stock returns? A variance decomposition
analysis. Journal of Accounting Research,42, 527–560.
Campbell, J. Y. (1991). A variance decomposition for stock returns. Economic Journal,101, 157–179.
Campbell, J. Y., & Ammer, J. (1993). What moves the stock and bond markets? A variance
decomposition for long-term asset returns. Journal of Finance,48, 3–38.
Campbell, J. Y., Lo, A. W., & MacKinlay, A. C. (1997). The econometrics of financial markets.
Princeton: Princeton University Press.
Dietrich, J. R., Muller, K. A., & Riedl, E. J. (2007). Asymmetric timeliness tests of accounting
conservatism. Review of Accounting Studies,12, 95–124.
Fama, E. F., & French, K. R. (1997). Industry costs of equity. Journal of Financial Economics,43, 153–
193.
Fama, E. F., & MacBeth, J. D. (1973). Risk, return, and equilibrium: Empirical tests. Journal of PoliticalEconomy,81, 607–636.
Frankel, R. M. & Roychowdhury, S. (2008). Are all special items equally special? The predictive role of
conservatism. Working paper, Washington University and MIT. www.ssrn.com.
Givoly, D., Hayn, C., & Natarajan, A. (2007). Measuring reporting conservatism. The AccountingReview,82, 65–106.
Goldfeld, S. M., & Quandt, R. E. (1973). The estimation of structural shifts by switching regressions.
Annals of Economic and Social Measurement,2, 475–485.
Gonedes, N. J. (1978). Corporate signaling, external accounting, and capital market equilibrium:
Evidence on dividends, income, and extraordinary items. Journal of Accounting Research,16, 26–
79.
Maddala, G. S. (1983). Limited-dependent and qualitative variables in Econometrics. Cambridge:
Cambridge University Press.
Maddala, G. S. (1986). Disequilibrium, self-selection and switching models. In Z. Griliches & M. D.
Intrilligator (Eds.), Handbook of econometrics. Vol. III. Amsterdam: North-Holland.
Pae, J., Thornton, D., & Welker, M. (2005). The link between conservatism and the price-to-book ratio.
Contemporary Accounting Research,22, 693–717.
Riedl, E. J. (2004). An examination of long-lived asset impairments. The Accounting Review,79, 823–
852.
The pricing of conservative accounting
123

Riedl, E. J. & Srinivasan, S. (2007). Signaling firm performance through financial statement presentation:
an analysis using special items. Working paper, Harvard Business School and University of
Chicago.
Roychowdhury, S., & Watts, R. L. (2007). Asymmetric timeliness of earnings, market-to-book and
conservatism in financial reporting. Journal of Accounting and Economics,44, 2–31.
Ryan, S. G. (2006). Identifying conditional conservatism. European Accounting Review,15, 511–525.
Shroff, P. K., Venkataraman R., & Zhang S. (2004). The conservatism principle and the asymmetric
timeliness of earnings: An event-based approach. Working paper (www.ssrn.com), University of
Minnesota.
Vuolteenaho, T. (2002). What drives firm-level stock returns. Journal of Finance,57, 233–264.
Watts, R. L. (2003). Conservatism in accounting part I: Explanations and implications. AccountingHorizons,17, 207–221.
J. L. Callen et al.
123