Embed Size (px)
Citation preview

Learning in Focus
The Primary Classroom: Insights fromthe Growing Up in Ireland Study
Selina McCoy, Emer Smyth and Joanne Banks
THE ECONOMIC AND SOCIAL RESEARCH INSTITUTE

THE PRIMARY CLASSROOM:
INSIGHTS FROM THE
GROWING UP IN IRELAND STUDY
Selina McCoy
Emer Smyth
Joanne Banks
January 2012
Available to download from www.esri.ie
An Institiúid Taighde Eacnamaíochta agus Sóisialta
© The Economic and Social Research Institute
Whitaker Square, Sir John Rogerson’s Quay, Dublin 2
ISBN 9780707003238

Acknowledgements
Growing Up in Ireland data have been funded by the Government of Ireland
through the Department of Children and Youth Affairs; have been collected under
the Statistics Act, 1993, of the Central Statistics Office. The project has been
designed and implemented by the joint ESRI-TCD Growing Up in Ireland Study
Team. © Department of Children and Youth Affairs.
This study was funded by the National Council for Curriculum and Assessment
(NCCA). We are particularly grateful to Dr Sarah Fitzpatrick, Deputy CEO, and Dr
Anne Looney, CEO, for their extremely helpful support and feedback. Within the
ESRI, we are very grateful for detailed and helpful comments on an earlier draft
given by our colleague, Léan McMahon, and for the support of the Principal
Investigator on the Growing Up in Ireland study, Professor James Williams, our
head of division, Professor Philip O’Connell, and Director, Professor Frances
Ruane.
The Authors
Dr Selina McCoy is a Senior Research Officer and joint Education Programme Co-
ordinator, Dr Emer Smyth is a Research Professor and joint Education Programme
Co-ordinator and Dr Joanne Banks is a Research Analyst at the Economic and
Social Research Institute.

Table of Contents
Abbreviations i
EXECUTIVE SUMMARY ii
CHAPTER 1 INTRODUCTION 1
1.1 Introduction 1
1.1.1 The Primary Curriculum in Context 2
1.2 Methodology 3
1.2.1 The Sample 4
1.2.2 Fieldwork in the School 4
1.2.3 Fieldwork in the Home 5
CHAPTER 2 TIME ALLOCATION TO DIFFERENT SUBJECTS 7
2.1 Introduction 7
2.2 Time Allocation to Subject Areas 9
2.2.1 General Time Allocation Patterns 9
2.2.2 Time Allocation and School Characteristics 10
2.2.3 Time Allocation and Teacher Characteristics 12
2.2.4 Factors Influencing Time Allocation 13
2.2.5 Trade-offs between Subjects 18
2.3 Curriculum Groupings 18
2.4 Conclusions 20
CHAPTER 3 TEACHING METHODS 22
3.1 Introduction 22
3.2 Variation in Teaching Methods Across Teachers 24
3.3 Teaching Methods and Class Size 26
3.4 Teaching Methods and School Type 27
3.5 Variation in the Use of Active Teaching Methods 29
3.6 Use of Multimedia/ICT 31
3.7 Influences on Teaching Methods 32
3.8 Summary 35
CHAPTER 4 CHILDREN'S ENGAGEMENT 36
4.1 Introduction 36
4.2 Variation in Children’s Engagement 37
4.3 Children’s Engagement across School Settings 39
4.4 Children’s Engagement and Teaching Approach 40
4.5 Influences on School Engagement 41
4.6 Attitudes to School Subjects 43

4.6.1 Influences on Attitudes to School Subjects 48
4.7 Summary 50
CHAPTER 5 SUMMARY AND CONCLUSIONS 52
5.1 Summary of Main Findings 52
5.2 Implications for Policy 53
APPENDIX A 62

List of Tables
Table 2.1: Weekly minimum time framework suggested in the Primary Curriculum (1999) 8
Table 2.2a: School-level factors influencing time allocation to subjects (OLS regression model) 13
Table 2.2b: School-level factors influencing time allocation to subjects (OLS regression model) 14
Table 2.3: Proportion of variance at the teacher and school levels (null models) 15
Table 2.4a: School-level and teacher-level factors influencing time allocation to subjects 16
Table 2.4b: School-level and teacher-level factors influencing time allocation to subjects 17
Table 2.5: Correlations (Pearson’s) between the proportions of time spent on different
subject areas 18
Table 2.6: Multinomial logistic regression model of curriculum clusters, contrasting
‘broad’ and ‘core’ groupings against a ‘balanced’ curriculum 19
Table 3.1: Multilevel regression model of active teaching methods scale 34
Table 4.1: Multilevel logistic regression model of factors influencing attitudes to school
and teachers 43
Table 4.2: Multilevel logistic regression model of factors influencing attitudes to Reading,
Mathematics and Irish, contrasting ‘never like’ with ‘always/sometimes like’ 50
List of Figures
Figure 2.1: Average weekly time allocation to subject areas 9
Figure 2.2: Time spent on English, Irish and Mathematics per week 10
Figure 2.3: Average time spent on selected subjects, contrasting DEIS urban band 1 and
non-disadvantaged schools 11
Figure 2.4: Average time allocated to selected subjects by language medium of the school 11
Figure 2.5: Average time allocated to selected subjects by gender mix of the school 12
Figure 2.6: Average time allocated to selected subjects by teacher gender 13
Figure 3.1: Proportion of children in classes where teachers use pair-work and group- work
most days/every day, by length of teacher’s experience 25
Figure 3.2: Proportion of children in classes where teachers use hands-on activities most
days/every day, by length of teacher’s experience 26
Figure 3.3: Proportion of children in classes where teachers use pair-work and group- work
most days/every day, by class size 27
Figure 3.4: Proportion of children in classes where teacher provides differentiated activities
most days/every day, by class size 27
Figure 3.5: Proportion of children in classes where teachers use pair-work and group-work
most days/every day, by school gender mix 28
Figure 3.6: Proportion of children in classes where teachers use differentiated activities and
encourage them to find things out most days/every day, by school gender mix 28
Figure 3.7: Proportion of children with teachers scoring high on the active methods scale by
teacher’s gender and length of teaching experience 30
Figure 3.8: Proportion of children with teachers scoring high on the active methods scale by
school DEIS status 30
Figure 3.9: Proportion of children with teachers scoring high on the active methods scale by
school type and gender mix 31
Figure 3.10: Proportion of children with teachers scoring high on the active methods scale by
class size 31
Figure 3.11: Frequency with which children use a computer in the classroom by school DEIS
status 32
Figure 4.1: Percentage of children reporting that they never like school, never look forward
to school and never like their teacher 38
Figure 4.2: Percentage of children reporting that they never like school, never look forward
to school and never like their teacher, by child’s SEN status 39
Figure 4.3: The extent to which children like school, by DEIS status 40
Figure 4.4: Percentage of children who never like school, never like their teacher and never
look forward to school, by frequency of group-work 41
Figure 4.5 Attitudes (‘always’, ‘sometimes’ or ‘never like’) to Reading, Mathematics and
Irish by gender 44
Figure 4.6: Attitudes (‘always’, ‘sometimes’ or ‘never like’) to Reading, Irish and Mathematics
by mother’s educational level 45
Figure 4.7: Attitudes (‘always’, ‘sometimes’ or ‘never like’) to Reading, Irish and Mathematics
by SEN status 46
Figure 4.8: Attitudes (‘always’, ‘sometimes’ or ‘never like’) to Reading, Irish and Mathematics
by DEIS status of the school 47
Figure 4.9: Attitudes (‘always’, ‘sometimes’ or ‘never like’) to Reading, Irish and Mathematics
by language medium of the school 47

Abbreviations | i
Abbreviations
DEIS Delivering Equality of Opportunity in Schools
DES Department of Education and Skills
EBD Emotional behavioural difficulty
EPSEN Education for Persons with Special Educational Needs
ESRI Economic and Social Research Institute
NCCA National Council for Curriculum and Assessment
NCSE National Council for Special Education
OECD Organisation for Economic Co-operation and Development
PDST Professional Development Service for Teachers
PE Physical Education
PIRLS Progress in International Reading Literacy Study
PISA Programme for International Student Assessment
RE Religious Education
SEN Special educational needs
SESE Social, Environmental and Scientific Education
SPHE Social, Personal and Health Education
TIMSS Trends in International Mathematics and Science Study

ii | The Primary Classroom – Insights from the Growing Up in Ireland Study
Executive Summary
The Growing Up in Ireland study provides a unique opportunity to examine the
school and classroom experiences of primary school children, placing these
experiences in the context of very detailed information from school principals
and classroom teachers. This report draws on the first wave of the Growing Up in
Ireland study, examining the lives and experiences of one-in-seven 9-year-old
children in Ireland. Combining detailed information from parents, school
principals and teachers, as well as, crucially, children themselves, this report
addresses a number of important themes in Irish primary education. These
include the allocation of time to different subject areas, the approaches and
strategies teachers adopt in teaching 9-year-olds, and children’s engagement in
school.
The Primary School Curriculum (Government of Ireland, 1999) presented a strong
vision of child-centred education, with children viewed as active agents in their
own learning. To what extent is this vision matched by the reality? Findings in this
report provide systematic evidence that whole-class teaching continues to be the
dominant approach used in primary education, with much less use of active
learning methods (such as group-work) than had been envisaged in the original
curriculum document. The current study not only provides systematic
information on the teaching methods used but also explores the way in which
access to more active learning methods varies by teacher characteristics and
classroom setting. Variation by teacher experience suggests that initial teacher
education for more recent education graduates has contributed to the greater
use of active methodologies in the classroom. Less use of such methods among
more experienced teachers suggests that continuous professional development
in support of the Primary Curriculum has not led to a change in pedagogical
approaches among this group. More active methods are much less prevalent in
larger classes, indicating the constraints of class size on the effective
implementation of the primary curriculum. It is of policy concern too that some
groups of children have greater access than other groups to the kinds of active
methods which may engage them in learning. Thus, girls, those attending fee-
paying schools, those attending gaelscoileanna and those in non-disadvantaged
schools are more likely to experience active learning in their classroom than boys,
those in English-medium schools and those in disadvantaged (DEIS) schools. The
reasons for such differences are unclear from the data available here, but may
reflect group-work and pair-work being seen as ‘easier’ to manage with more
engaged groups of students.
The Primary Curriculum (1999) emphasises flexibility at the school and classroom
level for teachers to address the needs of their students. While such flexibility is
crucial for effective teaching and learning, there is potential for differences to

Executive Summary | iii
emerge which may negatively impact on longer term educational outcomes. In
the longer term, this may translate into differences in student engagement and
achievement in particular domains. For example, the findings point to significant
variation in the time allocated to particular subject areas. Between-school
differences in the time allocated to subjects may be as much as two hours a
week, meaning that some students have over 18 full days less instruction than
others in subjects such as Mathematics. Differences in time allocation are evident
between schools and among individual teachers working in the same school. In
some cases, teachers appear to adjust their timetable to reflect the mix of
students in the school, with marked differences found between DEIS
(disadvantaged) and non-DEIS schools, and between single-sex and coeducational
schools. Timetabling variation is also found to reflect teachers’ own
characteristics, with more experienced teachers much more likely to emphasise a
‘core’ curriculum, spending greater amounts of time on English, Irish and
Mathematics.
Finally, the results show generally high levels of engagement with school among
Irish 9-year-olds. For the most part, children like school, look forward to coming
to school and like their teachers. However, it is of policy concern that even at this
early stage boys are more likely to be disengaged from school and to be more
negative about literacy-based subjects than girls. Even more striking are the
significant disengagement levels found among children with special educational
needs, raising issues for policies around inclusion at primary level. The findings
also point to the emergence of more negative attitudes to Irish than to Reading
and Mathematics among children, even at this early stage.
In sum, this report provides valuable insights into the way in which the Primary
Curriculum is implemented in the classroom. It has important implications for the
Department of Education and Skills Literacy and Numeracy for Life strategy,
published in 2011; for teacher education programmes; for the DEIS programme;
for curricular and school organisation policy; and for policy on the inclusion of
students with special educational needs.

Introduction and Methodology | 1
Chapter 1
Introduction and Methodology
1.1 INTRODUCTION
It is now more than a decade since the introduction of the Primary School
Curriculum (Government of Ireland, 1999; henceforth ‘Primary Curriculum’). Two
review reports by the NCCA (2005; 2008) indicate that teachers report that the
curriculum has had a positive impact on aspects of children’s learning. However,
many teachers report challenges in covering the entire curriculum in the time
available and in providing differentiated learning opportunities within the context
of larger classes. Furthermore, whole-class teaching appears to be the dominant
mode for most of the subject areas examined. While the NCCA review reports
provide extremely useful insights into the implementation of the primary
curriculum, there has been an absence of nationally representative data on
teaching and learning within primary classrooms from both the teacher and
student perspective. In particular, there has been a lack of research on the impact
of specific features of the Irish system, such as the prevalence of multi-grade
teaching, the persistence of single-sex schooling and significant variation in the
size of classes. This study aims to address this gap in knowledge, using data from
a large sample of primary school children and their teachers drawn from the
Growing Up in Ireland study.
An advantage of the database is that it collects very rich information on teaching
and learning within the primary classroom. This study addresses three sets of
questions:
• How do teachers allocate time between the different subject areas of the
primary curriculum? Does the allocation of time vary across different types of
schools and/or across individual teachers?
• What are the most frequent teaching methods used in primary classrooms?
Do the teaching methods used vary across different types of schools and/or
by teacher characteristics?
• What are children’s attitudes to school, their teachers and individual
subjects? Do their attitudes to subjects vary by the time allocated to these
subject areas? Do their attitudes to school vary by the type of teaching
methods used?
These questions are addressed in Chapters 2 to 4 of the report. The remainder of
this chapter places the current study in context and provides information on the
Growing Up in Ireland study.

2 | The Primary Classroom – Insights from the Growing Up in Ireland Study
1.1.1 The Primary Curriculum in Context
The Primary Curriculum (1971) was seen as a shift to a new, child-centred
approach within Irish education. However, concerns were raised about the extent
to which this philosophy was fully reflected in classroom practice (see, for
example, Sugrue, 1997). The process of revising the curriculum was initiated with
the Report of the Review Body on the Primary Curriculum (1990), with these
recommendations and subsequent extensive consultations with stakeholders
culminating in the publication of the revised curriculum in 1999 (Government of
Ireland, 1999). The new curriculum was seen as incorporating the key principles
of the 1971 curriculum while also taking account of current educational thinking
and wider societal change. The three key aims of the curriculum were:
• to enable the child to live a full life as a child and to realise his or her
potential as a unique individual;
• to enable the child to develop as a social being through living and
cooperating with others and so contribute to the good of society;
• to prepare the child for further education and lifelong learning
(Government of Ireland, 1999, p. 7).
From this perspective, the child is seen as an active agent in their own learning, in
keeping with constructivist philosophy which regards education as a process in
which the child constructs knowledge in interaction with others (see Muijs and
Reynolds, 2011).
The general aim was to provide children with a broad and balanced curriculum,
comprised of six subject areas: language, comprising of English and Irish;
Mathematics; Social, Environmental and Scientific Education (SESE), comprising of
History, Geography and Science; Arts Education, including Visual Arts, Music and
Drama; Physical Education; and Social, Personal and Health Education. The
curriculum for Religious Education is the responsibility of the relevant school
patron. The curriculum document strongly emphasised the importance of school
and classroom planning in effective curriculum implementation. Guidelines for
teachers on the different subject areas explicitly refer to constructivist
approaches, emphasising the importance of using ‘hands-on’ activities and peer
learning (child-child discussion).
Although the 1999 Primary Curriculum represented a significant milestone in the
development of primary education in Ireland, relatively little empirical evidence is
available on how this curriculum has been implemented. Review reports by the
NCCA (2005; 2008) explored teacher perspectives on curriculum implementation.
In spite of the guidelines’ emphasis on the use of more active teaching and
learning methods, whole-class teaching was found to be the dominant approach
used in many subject areas. Teachers pointed to a number of challenges,
including the lack of time and availability of appropriate assessment tools. They

Introduction and Methodology | 3
also reported difficulties in catering for the range of student abilities, most
notably, in the area of Mathematics. Variation was evident in the integration of
ICT into day-to-day teaching and learning and less integrated (cross-curricular)
work was evident than had been anticipated in the original curriculum
documents.
Two studies have explored the implementation of the primary curriculum in
infant classes. Based on research in senior infant classes, Murphy (2004) points to
less use of play, particularly more intellectually stimulating play, than had been
envisaged in the original curriculum documents. Work on numeracy development
and on fostering writing skills was also found to be ‘traditional’ rather than
interactive in nature. Overall, senior infant classrooms were found to be teacher-
centred, with whole-class teaching representing the dominant approach used. In
a study of Mathematics teaching in infant classes, Dunphy (2009) pointed to a
lack of confidence among teachers in using group-work with younger children
and indicated the strong role of the textbook, or workbooks, in structuring work
on numeracy development. Class size and lack of time were also mentioned as
potential constraints on successful curriculum implementation. Research by
Darmody et al. (2010) points to the potential for school design to facilitate the
effective implementation of the primary curriculum, indicating potential
constraints in many current primary settings, including class size, classroom size
and layout, and the lack of outdoor space.
In the absence of a large body of research on the implementation of the primary
curriculum, it is therefore timely to use a very rich data source, the Growing Up in
Ireland study, to explore practices and processes in primary classrooms. The
following section outlines the background to this study.
1.2 METHODOLOGY
The data for this report come from the first wave of Growing Up in Ireland—the
National Longitudinal Study of Children in Ireland, a nationally representative
study of children living in Ireland. It will extend over a seven year period and will
track the progress of two cohorts of children at two time points. Between
September 2007 and May 2008, Growing Up in Ireland interviewed 8,578 nine-
year-old children, their parents and their teachers about a wide range of issues
and the results presented here are from this wave of data collection. The
underlying framework of the Growing Up in Ireland study emphasises children’s
connectedness to the world in which they live. It draws on Bronfenbrenner’s
perspective (Bronfenbrenner, 1979; Bronfenbrenner et al., 2006) which
emphasises the importance of considering the multifaceted and multilayered
nature of the influences on development over the life course.

4 | The Primary Classroom – Insights from the Growing Up in Ireland Study
1.2.1 The Sample
The sample design for the 9-year-old cohort in Growing Up in Ireland was based
on a two-stage selection process in which the school was the primary sampling
unit with the children within school being the secondary units. Using a sample
design based on the primary school system had a number of advantages: it
provided an almost complete frame of 9-year-old children in Ireland;1 it allowed
for direct access to the children’s principal and teachers (who were key study
informants); and it facilitated the self-completion of academic assessment tests in
a group setting. A random sample of 857 schools was recruited and an
interviewer was assigned to each school to meet with the principal to explain the
objectives and procedures of the study. In schools which had 40 or fewer 9-year-
old children, all children were included into the sample; in schools with more
than 40 children, a random sample of 40 children was taken for inclusion in the
sample. Information packs, including consent forms, were sent home with all
selected children to give to their parent/guardian. These provided the children
and their parents/guardians with information leaflets to allow them to make an
informed decision on whether or not to participate in the study. Parents/
guardians were asked to return completed consent forms (one each for a parent/
guardian and child) to the school. The completed forms were then collected by
the interviewer and returned to the Study Team. These forms contained the
address and contact details of the family, which were then used to make direct
contact with the family and arrange interviews. The total sample size achieved
was 8,578.
1.2.2 Fieldwork in the School
There were two main components to the fieldwork: school-based and household-
based. School-based fieldwork involved a self-completion questionnaire for the
school principal and two self-completion questionnaires for the child’s teacher.
The principal’s questionnaire recorded details on school characteristics including
size, challenges, ethos etc., along with some personal details about the principal.
The teacher-on-self questionnaire recorded class-level details such as class size,
curriculum, teaching methods etc. and some personal details about teachers
themselves. The teacher-on-child questionnaire recorded child-level details on
the child’s temperament, academic performance, school preparedness and peer
relationships. Teachers were asked to complete one teacher-on-child
questionnaire for each sample child that they taught. The final parts of the
school-based fieldwork were the academic assessment tests and a short self-
concept questionnaire that all children were asked to complete in a group setting
facilitated by an interviewer.
1 Potential exclusions are children who are home-schooled and also children who are in residential care; the numbers in
both of these groups are very small.
Introduction and Methodology | 5
1.2.3 Fieldwork in the Home
The informants in the household-based component of the fieldwork were the 9-
year-old child, their primary caregiver (defined as the person who provides most
care to the child—in most cases, the child’s mother) and, if resident in the
household, the spouse/partner of the child’s primary caregiver (usually, but not
always, the child’s father). The main interviews were completed on a CAPI
(Computer Assisted Personal Interview) basis and there was also a self-complete
paper-based module for all respondents, which included some potentially
sensitive questions. This multi-informant model gives very rich information from
a number of sources. A particular strength of this model is that information is
recorded on the children themselves from their own perspective. Children were
consulted at all stages throughout the instrumentation design process to aid in
the development of ‘child-friendly’ questionnaires in order to ensure good quality
information from the children. At the school level, a response rate of 80 per cent
was achieved. At the level of the household (i.e. eligible child selected within the
school), a total of 59 per cent of target families participated in the study. The
completed sample was highly representative of the population at the level of
school characteristics such as county, designated disadvantaged status,
categorical size of the school (measured in terms of number of 9-year-olds in the
school) and gender mix of the school. The sample was slightly over-represented
in terms of larger schools and also disadvantaged status. At the family level, the
sample somewhat under-represents children from lower social class categories
and those whose mothers had lower levels of educational attainment. These
issues were addressed in a two-phased re-weighting of the data to reflect school
characteristics as well as individual/family characteristics. The main external
controls were extracted from administrative data provided by the Irish
Department of Education and Skills in respect of the school-based characteristics,
the Irish Census of Population 2006 and the European Union Survey of Income
and Living Conditions (EU-SILC) in respect of individual/family-based
characteristics. This ensures that the data are representative of the population of
all 9-year-olds resident in Ireland at the time of the survey.2
The Growing Up in Ireland study represents a very rich source of data for
examining practices and processes within primary classrooms. Very detailed
information on teacher characteristics, teaching methods and school
characteristics allow us to explore the extent to which teaching and learning
processes vary across different settings. For the first time too, the perspective of
primary school children is placed at the centre of the information collected,
allowing us to explore their own attitudes to school and to school subjects.
This report addresses three central themes in Irish primary education. The first is
focused on the allocation of time to different subject areas, which is addressed in
2 Further details of the study can be found in Murray et al. (2011).
6 | The Primary Classroom – Insights from the Growing Up in Ireland Study
Chapter 2. The second (in Chapter 3) considers the approaches and strategies
teachers adopt in teaching 9-year-old children, while in Chapter 4 the final theme
considers children’s engagement in school.
Time Allocation to Different Subject Areas | 7
Chapter 2
Time Allocation to Different Subject Areas
2.1 INTRODUCTION
There has been a good deal of debate internationally about the amount of time
devoted to formal schooling and its effects on child outcomes. In 1963, Carroll
proposed that students who spend more time engaged at the appropriate level of
challenge on curriculum tasks would have higher achievement levels than those
who spent less time. Later empirical research in the United States indicated the
further importance of distinguishing between ‘allocated time’, timetabled
periods, and ‘academic learning time’, the amount of time in which students are
working ‘on task’ at an appropriate level of difficulty (Rosenshine, 1980).
Extended academic learning time appears to be particularly influential in schools
serving more disadvantaged populations (Smith et al., 2005). Reduced time
devoted to learning has been found to allow teachers to ‘cover’ the material but
without facilitating deeper understanding on the part of students (Clark and Linn,
2003). A reduced primary school year in Germany was found to result in a greater
degree of grade repetition and fewer students continuing to the more academic
secondary tracks (Pischke, 2007). A longer school day or extended school year
have therefore been advanced as potential policy levers to raise student
achievement (AERA, 2007).
The total amount of time devoted to formal schooling has been found to vary
significantly across countries (OECD, 2010). Total compulsory time for Irish
students aged 9 to 11 is estimated at 941 hours per year, significantly above the
EU19 and OECD averages of just over 800 hours per year. Studies of variation
within national systems have been supplemented by research which has sought
to explore whether international variation in the length of the school day (or
year) is associated with achievement differentials in international tests. These
studies generally showed no significant relationship between overall instruction
time and average test scores at the country level (Lee and Barro, 2001;
Wößmann, 2003).
Somewhat less attention has been devoted to the amount of time spent on
different subject areas within the school day. One American study found that
primary school teachers spent about two-thirds of their time on the core
academic subjects. Of this time, fifty per cent was spent on English/Reading, 25
per cent on Mathematics and 13 per cent each on Social Studies and Science
(Perie et al., 1997). This study revealed very little variation in time allocation
across different groups of schools and teachers. However, as students advanced
through the year groups, less time was devoted to English and more time was
spent on Social Studies and Science (Perie et al., 1997). OECD data (2010) indicate

8 | The Primary Classroom – Insights from the Growing Up in Ireland Study
variation across countries in the amount of time devoted to various subject areas.
Irish students aged 9 to 11 spend comparatively more intended instruction time
on reading/writing and on Religion and less time on Mathematics and PE than
those in many other countries (OECD, 2010). However, it should be noted that
these patterns are based on the amount of time specified in guidelines rather
than empirical research on actual time spent. In contrast to the lack of effects on
average test scores cross-nationally, Lavy (2010) found a significant relationship
across countries taking part in the PISA study (which covers 15-year-olds)
between the time spent on the language of instruction, Mathematics, Science,
and test scores in those subjects. These effects were stronger for Mathematics
and Science than for language, reflecting the more important role of school-
based learning in these subjects (see Mortimore et al., 1988).
As outlined in Chapter One, the primary school curriculum in Ireland is made up
of six subject areas comprising eleven subjects.3 The minimum number of
teaching days per school year and the minimum length of a school day are
specified by Department of Education and Skills circular (DES, 1995). From first
class onwards, a minimum of 4 hours 10 minutes per day should be devoted to
‘secular instruction’ with 30 minutes per day spent on ‘religious instruction’. The
Curriculum document specifies guidelines for the time spent on subjects other
than RE but these are not mandatory (see Table 2.1). The Literacy and Numeracy
for Life strategy document (2011) indicates that schools will be required to
increase the amount of time spent on literacy and numeracy to 90 minutes and
50 minutes per day respectively. The implications for the classroom timetable will
very much depend on how narrowly ‘literacy’ and ‘numeracy’ are interpreted
within the broader curriculum. If they are taken, in the narrow sense, to mean
the language of instruction (English/Irish) and Mathematics, the time allocation
for these subjects would increase to 7.5 hours and 4.2 hours per week
respectively. At the time of writing, new guidelines are being drafted which take
account of the literacy and numeracy strategy.
Table 2.1: Weekly minimum time framework suggested in the Primary Curriculum (1999)
Subject area Time
Language of instruction 4 hours
Second language (Irish/English) 3 hours 30 minutes
Mathematics 3 hours
Social Environmental and Science Education (SESE - History, Geography, Science) 3 hours
Social, Personal and Health Education (SPHE) 30 minutes
Physical Education (PE) 1 hour
Arts education (Visual arts, Music, Drama) 3 hours
Discretionary curriculum time 2 hours
Little is known, however, about the actual amount of time devoted to different
subject areas within primary classrooms. This is all the more important given that
many teachers have highlighted the ‘over-crowded’ nature of the curriculum. In
3 The curriculum for Religious Education is the responsibility of the relevant Church/School Authority.

Time Allocation to Different Subject Areas | 9
this context, what subjects ‘lose out’ when time is constrained? The remainder of
this chapter draws on Growing Up in Ireland data to address the gap in
knowledge regarding time allocation. Section 2.2 outlines the time devoted to
different subject areas and examines whether time allocation differs across
different types of schools and/or teachers. Section 2.3 looks at the way in which
teachers combine time spent on subjects in particular ‘clusters’ while Section 2.4
concludes.
2.2 TIME ALLOCATION TO SUBJECT AREAS
2.2.1 General Time Allocation Patterns
Figure 2.1 indicates the average weekly time allocated to subject areas for
classrooms in which 9-year-olds are taught. More time is devoted to English than
to other subjects, with over four hours per week spent on this subject.
Considerable amounts of time are also spent on Mathematics and Irish, at 3.7
hours and 3.6 hours per week respectively. Among the other subject areas, the
greatest amount of time is spent on Religious Education (RE), averaging just over
two hours per week. Generally an average of one hour per week is spent on each
of the other subjects, with slightly less than an hour being spent on Drama and
SPHE.
Figure 2.1: Average weekly time allocation to subject areas
0 1 2 3 4 5
SPHE
Drama
Music
Science
Geography
History
PE
Art
RE
Irish
Maths
English
Average no. of hours per week

10 | The Primary Classroom – Insights from the Growing Up in Ireland Study
Figure 2.2: Time spent on English, Irish and Mathematics per week
Although more time is spent on English, Irish and Mathematics than on other
subjects, Figure 2.2 indicates variation across different classrooms in the time
allocated to these subjects. The most common pattern for English is four hours
per week, although 40 per cent of classrooms spend five or more hours on the
subject. For Irish, the most prevalent pattern is four hours but almost a third of
classes spend three hours or less on the subject. A significant minority (40 per
cent) of primary classrooms are found to spend three hours or less per week on
Mathematics, while at the same time, a quarter of classes spend five or more
hours on Mathematics.
2.2.2 Time Allocation and School Characteristics
To what extent does time allocation vary across different types of schools? Three
characteristics of schools were considered: DEIS status, language medium and
gender mix. The discussion highlights those subjects for which significant
variation in time allocation is found. The social mix of the school, as measured by
DEIS status, is significantly associated with the time allocated to particular
subjects. Nine-year-old children in DEIS urban band 1 schools spend more time on
English and SPHE, and less time on Irish, RE and Art, than those in non-
disadvantaged schools (see Figure 2.3 which depicts subjects for which significant
differences were evident). Time spent on other subjects, including Mathematics,
does not differ significantly by DEIS status. This suggests that primary teachers
are adjusting their class timetable to reflect the perceived needs of their student
intake, focusing on core literacy skills and also on personal-social development
among more disadvantaged groups.
0%
10%
20%
30%
40%
50%
60%
70%
80%
90%
100%
English Irish Maths
5+ hours
4 hours
<3 hours

Time Allocation to Different Subject Areas | 11
Figure 2.3: Average time spent on selected subjects, contrasting DEIS urban band 1
and non-disadvantaged schools
Differences are also evident in terms of the language medium of the school. Not
surprisingly, English-medium schools allocate more time to English and less time
to Irish than Irish-medium schools, both Gaeltacht schools and gaelscoileanna.
However, other differences are evident, with gaelscoileanna devoting more time
to Drama, Music and PE than either English-medium or Gaeltacht schools (Figure
2.4). The pattern appears to reflect a broader orientation to the promotion of
Irish language and culture in gaelscoileanna rather than language medium per se.
Figure 2.4: Average time allocated to selected subjects by language medium of the
school
Variation in time allocation is apparent depending on the gender mix of the
school. Children attending girls’ schools spend somewhat more time on Art,
Music and RE than those in boys’ or coeducational schools; they also spend
somewhat less time on English. Those attending boys’ schools tend to spend
somewhat more time on PE, History, Geography and SPHE than those in other
schools (Figure 2.5).
0
0.5
1
1.5
2
2.5
3
3.5
4
4.5
5
English Irish RE SPHE Art
Hours
per week
Urban band 1 Non-disadvantaged
0
0.5
1
1.5
2
2.5
3
3.5
4
4.5
5
English Irish Maths Music Drama PE
Hours
per week
English-medium Gaelscoil Gaeltacht

12 | The Primary Classroom – Insights from the Growing Up in Ireland Study
Figure 2.5: Average time allocated to selected subjects by gender mix of the school
2.2.3 Time Allocation and Teacher Characteristics
The Growing Up in Ireland study collected information at both the school and
classroom levels, allowing us to examine the extent to which time allocation
reflects variation in teacher characteristics. Time allocation is found to vary by
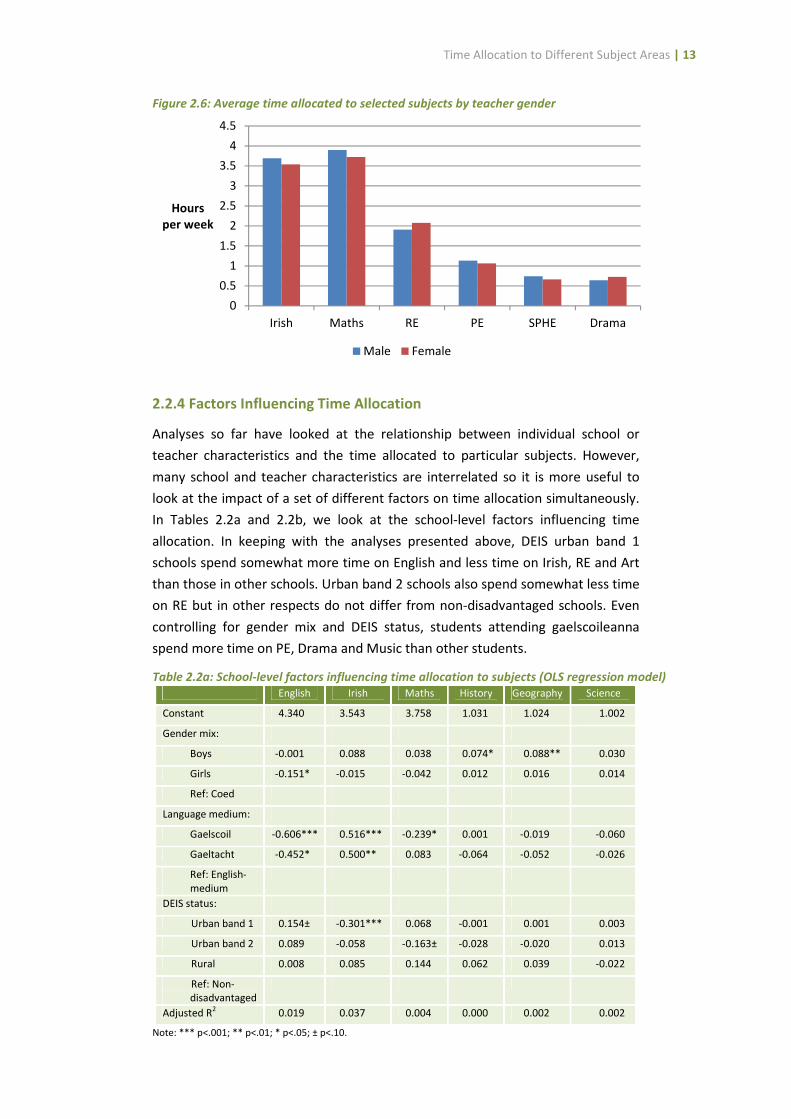
teacher gender and years of teaching experience.4
Male teachers spend
somewhat more time on Irish, Mathematics, SPHE and PE, and less time on RE
and Drama, than female teachers (see Figure 2.6, which depicts patterns for
those subjects in which significant gender differences are found). Newly qualified
teachers are found to spend somewhat less time on certain subjects, including
Irish, Mathematics, History, Geography and Art, than their more experienced
counterparts; they are also likely to devote more time to Drama. Differences
between those teaching a single-grade class and those teaching a multi-grade
class are not marked, but multi-grade teachers are found to spend slightly more
time on RE, Science and Music. Because the Growing Up in Ireland sample was
based on age (being nine years old) rather than stage, the classroom settings
surveyed covered second to fourth class. No significant variation was found in
time allocation by year group, with the exception of RE, where greater time spent
on the subject in second class is likely to reflect sacramental preparation.
4 As might be expected, years of teaching experience and age are closely correlated. Throughout this report, we focus on
teaching experience rather than age because of the important impact of professional life phases on teacher practice
(see Day et al., 2007).
0
0.5
1
1.5
2
2.5
3
3.5
4
4.5
5
Hours
per week
Girls Boys Coeducational
Time Allocation to Different Subject Areas | 13
Figure 2.6: Average time allocated to selected subjects by teacher gender
2.2.4 Factors Influencing Time Allocation
Analyses so far have looked at the relationship between individual school or
teacher characteristics and the time allocated to particular subjects. However,
many school and teacher characteristics are interrelated so it is more useful to
look at the impact of a set of different factors on time allocation simultaneously.
In Tables 2.2a and 2.2b, we look at the school-level factors influencing time
allocation. In keeping with the analyses presented above, DEIS urban band 1
schools spend somewhat more time on English and less time on Irish, RE and Art
than those in other schools. Urban band 2 schools also spend somewhat less time
on RE but in other respects do not differ from non-disadvantaged schools. Even
controlling for gender mix and DEIS status, students attending gaelscoileanna
spend more time on PE, Drama and Music than other students.
Table 2.2a: School-level factors influencing time allocation to subjects (OLS regression model) English Irish Maths History Geography Science
Constant 4.340 3.543 3.758 1.031 1.024 1.002
Gender mix:
Boys -0.001 0.088 0.038 0.074* 0.088** 0.030
Girls -0.151* -0.015 -0.042 0.012 0.016 0.014
Ref: Coed
Language medium:
Gaelscoil -0.606*** 0.516*** -0.239* 0.001 -0.019 -0.060
Gaeltacht -0.452* 0.500** 0.083 -0.064 -0.052 -0.026
Ref: English-
medium
DEIS status:
Urban band 1 0.154± -0.301*** 0.068 -0.001 0.001 0.003
Urban band 2 0.089 -0.058 -0.163± -0.028 -0.020 0.013
Rural 0.008 0.085 0.144 0.062 0.039 -0.022
Ref: Non-
disadvantaged
Adjusted R2 0.019 0.037 0.004 0.000 0.002 0.002
Note: *** p<.001; ** p<.01; * p<.05; ± p<.10.
0
0.5
1
1.5
2
2.5
3
3.5
4
4.5
Irish Maths RE PE SPHE Drama
Hours
per week
Male Female

14 | The Primary Classroom – Insights from the Growing Up in Ireland Study
Table 2.2b: School-level factors influencing time allocation to subjects (OLS regression model)
RE SPHE Music Art Drama PE
Constant 2.077 0.657 0.996 1.159 0.691 1.058
Gender mix:
Boys -0.099* 0.069* -0.071** -0.007 0.053± 0.062*
Girls 0.112* -0.055± -0.018 0.060± 0.059± -0.037
Ref: Coed
Language medium:
Gaelscoil -0.117 0.077 0.078±* 0.000 0.137** 0.183***
Gaeltacht -0.045 -0.048 0.038 0.058 -0.018 0.112
Ref: English-
medium
DEIS status:
Urban band 1 -0.156** 0.087* -0.014 -0.076± -0.002 0.004
Urban band 2 -0.153* 0.054 -0.043 -0.029 0.016 0.031
Rural 0.087 0.034 -0.045 -0.069 -0.031 -0.022
Ref: Non-
disadvantaged
Adjusted R2 0.013 0.006 0.006 0.001 0.004 0.015
Note: *** p<.001; ** p<.01; * p<.05; ± p<.10.
Differences are again evident by gender mix of the school. Students in boys’
schools spend more time on History, Geography, SPHE, and PE than those in
coeducational schools; they also spend less time on RE and Music. Those in girls’
schools spend more time on RE and Art and less time on English and SPHE than
their counterparts in coeducational schools. Students in single-sex schools (both
girls and boys) are found to spend more time on Drama than those in
coeducational schools.
The next set of tables looks at the simultaneous influence of school and teacher
characteristics on time allocation. Because teachers were sampled within schools,
we use multilevel modelling to take into account the fact that teachers in the
same school will share common experiences (see Goldstein, 2003). A two-level
(teacher within school) regression model is employed to look at the influences on
time allocation in each of the subject areas. A positive coefficient indicates that a
factor is associated with more time spent on the subject and a negative
coefficient indicates that a characteristic is associated with less time spent. These
analyses also indicate the extent to which variation between schools or variation
among teachers in the same school is greater in shaping time allocation. Table 2.3
shows the proportion of variance which is due to the school and the teacher for
each of the subjects. Across all subjects, there is more variation between teachers
than between schools, indicating that teachers have a good deal of autonomy in
the way in which they allocate time to different subject areas. The higher
proportion of variance at the school level in some subjects, specifically, PE, RE
and Irish, indicates that schools are relatively more important in relation to these
subjects.

Time Allocation to Different Subject Areas | 15
Table 2.3: Proportion of variance at the teacher and school levels (null models)
School level Teacher level
English 7.0 93.0
Irish 11.8 88.2
Maths 3.9 96.1
History 6.7 93.3
Geography 7.4 92.6
Science 6.0 94.0
RE 13.1 86.9
SPHE 4.1 95.9
Music 4.7 95.3
Art 6.3 93.7
Drama 9.6 90.4
PE 18.8 81.2
Tables 2.4a and 2.4b look at the impact of school and teacher factors on time
allocation to different subjects. Teacher gender has a significant effect, all else
being equal, with female teachers spending more time on RE, Drama and Art, and
less time on Irish, Mathematics and PE, than their male counterparts. Newly
qualified teachers (that is, those teaching for less than three years) have a
distinctive profile, spending less time than more experienced teachers on English,
Irish and Mathematics; they also spend more time on Drama than other teachers.
In addition, those teaching for more than 30 years tend to spend more time than
other teachers on History, Geography and, to some extent, Science. All else being
equal, multi-grade teachers spend more time on PE, Science and Music, and less
time on Irish and English than teachers of single-grade classes. Teacher
qualifications do not have a marked impact on time allocation. However, teachers
with post-graduate qualifications (a postgraduate diploma, Master’s or Ph.D.)
spend slightly more time on History, Geography, Science, Music and Drama than
teachers with undergraduate qualifications. The extent to which teachers feel
they have control over various dimensions of their teaching is not found to
impact on time allocation. The exception is that teachers who report greater
control over the learning resources they use tend to spend more time on English.
Teachers teaching classes in which at least one student has an
emotional/behavioural difficulty tend to spend slightly more time in class on
Mathematics, and on History and Geography. Other aspects of class composition
were considered in the initial analysis, including the presence of students with
learning disabilities, physical disabilities and/or with English/Irish as a second
language. However, no association was found between these factors and time
allocation, and these factors were subsequently excluded from the final analysis.
Only the presence of children with emotional/behavioural difficulties was
associated with time allocation (see Table 2.4a).
Even taking account of teacher characteristics, some differences remain evident
between different types of schools. Gaelscoileanna spend more time on PE, and
to some extent, on Music and Art than other schools. Boys’ schools spend more
time on History, Geography, PE and SPHE than other schools. In contrast, girls’
schools spend more time on RE and Art. Controlling for other factors, DEIS urban

16 | The Primary Classroom – Insights from the Growing Up in Ireland Study
band 1 schools spend more time on English and SPHE, and less time on Irish, than
other schools.
Table 2.4a: School-level and teacher-level factors influencing time allocation to subjects
English Irish Maths History Geography Science
Constant 3.907 3.379 3.501 0.881 0.891 0.866
School characteristics
Gender mix:
Boys -0.017 0.071 0.027 0.075* 0.095** 0.041
Girls -0.155 -0.022 -0.003 0.021 0.025 0.020
Ref.: Coed
Language medium:
Gaelscoil -0.611*** 0.502*** -0.246* 0.024 0.008 -0.029
Gaeltacht -0.472* 0.478*** 0.034 -0.071 -0.059 -0.039
Ref.: English-medium
DEIS status:
Urban band 1 0.165± -0.298*** 0.072 -0.002 -0.001 0.017
Urban band 2 0.047 -0.048 -0.179± -0.020 -0.012 0.033
Rural 0.024 0.101 0.155 0.040 0.020 -0.041
Ref.: Non-
disadvantaged
Teacher characteristics
Gender (female) 0.050 -0.100± -0.155* -0.001 0.004 0.044
Teaching experience:
3-5 years 0.258*** 0.099 0.167* -0.009 -0.014 -0.032
6-10 years 0.233** 0.245*** 0.202** 0.076* 0.053 0.054
11-20 years 0.290*** 0.253*** 0.379*** 0.037 0.005 -0.018
21-30 years 0.295*** 0.219*** 0.362*** 0.029 0.001 0.002
>30 years 0.313*** 0.397*** 0.375*** 0.152*** 0.141*** 0.069±
Ref.: <2 years
Postgraduate
qualifications
0.007 0.025 -0.018 0.060** 0.045* 0.041*
Contextual factors
Multi-grade class -0.109± -0.129** -0.072 0.028 0.028 0.050*
Degree of control over
learning resources used
0.043± 0.024 0.025 0.011 0.013 0.009
Composition of class
(>1 pupil with EBD)
0.074 0.029 0.163*** 0.065** 0.050* 0.026
School-level variation 0.060* 0.038* 0.033 0.012* 0.010* 0.009±
Teacher-level variation 0.895*** 0.532*** 0.758*** 0.177*** 0.161*** 0.157***
Note: *** p<.001; ** p<.01; * p<.05; ± p<.10.

Time Allocation to Different Subject Areas | 17
Table 2.4b: School-level and teacher-level factors influencing time allocation to subjects
RE SPHE Music Art Drama PE
Constant 1.755 0.669 0.888 1.040 0.721 1.098
School characteristics
Gender mix:
Boys -0.035 0.061± -0.059* -0.006 0.048 0.062*
Girls 0.115* -0.040 -0.014 0.046± 0.061 -0.011
Ref: Coed
Language medium:
Gaelscoil -0.072 0.080 0.095*** 0.006*** 0.135 0.191***
Gaeltacht -0.081 -0.063 0.018 0.029 0.013 0.097
Re: English-medium
DEIS status:
Urban band 1 -0.110± 0.090* 0.004 -0.052 -0.024 0.005
Urban band 2 -0.100 0.050 -0.033 -0.010 -0.011 0.046
Rural 0.075 0.023 -0.063 -0.064 -0.029 -0.056
Ref: Non-
disadvantaged
Teacher characteristics
Gender (female) 0.170 -0.057 0.030 0.076* 0.074* -0.064*
Teaching experience:
3-5 years 0.098± -0.011 0.030 -0.005 -0.089** 0.015
6-10 years -0.008 0.066 0.027 0.051 -0.179*** -0.038
11-20 years -0.019 0.092 0.076* 0.105* -0.161*** -0.021
21-30 years 0.110* 0.062± 0.057± 0.164*** -0.196*** -0.015
>30 years 0.159** 0.090* 0.084* 0.201*** -0.190*** -0.044
Ref: <2 years
Postgraduate
qualifications
0.038 0.031 0.033± 0.027 0.043* 0.021
Contextual factors
Multi-grade class 0.058 0.016 0.035± -0.044± 0.020 0.070**
Degree of control over
learning resources used
0.018 -0.009 0.000 -0.005 0.004 -0.003
Composition of class (>1
pupil with EBD)
-0.003 0.018 0.027 0.008 -0.007 0.004
School-level variation 0.048*** 0.007 0.004 0.011± 0.014** 0.023**
Teacher-level variation 0.336*** 0.185*** 0.123** 0.188*** 0.154** 0.108**
Note: *** p<.001; ** p<.01; * p<.05; ± p<.10.

18 | The Primary Classroom – Insights from the Growing Up in Ireland Study
Table 2.5: Correlations (Pearson’s) between the proportions of time spent on different subject
areas
English Irish Maths History Geog-
raphy
Science RE SPHE Music Art Drama PE
English 1.00 -0.05± 0.25*** -0.41** -0.42*** -0.38*** -0.25*** -0.17*** -0.26*** -0.10*** -0.25*** -0.15***
Irish 1.00 0.18*** -0.30*** -0.33*** -0.32*** -0.12*** -0.27*** -0.15*** -0.06* -0.21*** -0.15***
Maths 1.00 -0.37*** -0.37*** -0.41*** -0.38*** -0.10*** -0.26*** -0.09*** -0.39*** -0.17***
History 1.00 0.83*** 0.63*** -0.12*** -0.05 0.01 0.00 -0.02 -0.06*
Geography 1.00 0.70*** -0.11*** -0.03 -0.02 0.01 0.01 -0.07**
Science 1.00 -0.04 -0.08*** 0.046± 0.02 0.04 -0.07**
RE 1.00 -0.16*** 0.12*** 0.10*** 0.05± -0.08**
SPHE 1.00 0.007 0.03 0.03 0.18***
Music 1.00 0.10*** 0.10*** 0.13***
Art 1.00 0.00 0.16***
Drama 1.00 0.10***
PE 1.00
Note: *** p<.001; ** p<.01; * p<.05; ± p<.10.
2.2.5 Trade-offs between Subjects
An important policy issue relates to whether there are trade-offs between the
amount of time spent on particular subjects: to what extent does spending more
time on English, for example, have implications for the time spent on certain
other subject areas? Table 2.5 presents the correlation coefficients between the
proportions of time spent on different subjects. Correlations range between 0,
where is no relationship between the two variables, and 1, where two variables
are perfectly related. The proportion of time spent on English is negatively
associated with the proportion spent on all other subjects except Mathematics,
and the trade-off is greatest between English and History, Geography and
Science. Similarly, there appears to be a trade-off between Mathematics and
other subjects, except English and Irish, and this is most evident for History,
Geography and Science. Teachers who spend a greater proportion of time on
Science also spend a greater proportion on History and Geography.
2.3 CURRICULUM GROUPINGS
Analyses so far have focused on the factors associated with the time spent on
different subjects. However, it is worth exploring whether some schools or
teachers combine subjects in particular ways to give children different
experiences of the primary curriculum. Cluster analysis was used to examine the
extent to which different curriculum clusters or groupings are evident. Based on
the proportion of time spent on different subjects, three distinct clusters
emerged:
• A balanced curriculum, accounting for the majority (60 per cent) of settings;
these classes spend time on a range of subjects;
• A broad curriculum, accounting for a tenth of classes, where more time is
spent on a variety of subject areas, especially History, Geography, Science,
and SPHE;

Time Allocation to Different Subject Areas | 19
• A core curriculum, accounting for 30 per cent of classes, where more time is
spent on English, Irish and Mathematics, and less time is spent on Drama
and Music.
Table 2.6 looks at the school and teacher factors which influence the curriculum
grouping adopted, contrasting the ‘broad’ and ‘core’ groups against the
‘balanced’ group. Boys’ schools are more likely than coeducational schools to
provide a broad curriculum than a balanced or core curriculum. Meanwhile, girls’
schools are less likely to provide a core curriculum. Gaelscoileanna are more likely
than Gaeltacht or English-medium schools to provide a broad curriculum. Private
(fee-paying) schools are much more likely to provide either a broad or a core
curriculum than non-fee-paying schools. All else being equal, DEIS schools do not
differ markedly from non-disadvantaged schools in their curriculum cluster;
however, DEIS urban band 1 schools are somewhat more likely to provide a broad
curriculum.
Table 2.6: Multinomial logistic regression model of curriculum clusters, contrasting
‘broad’ and ‘core’ groupings against a ‘balanced’ curriculum
Broad Core
Constant -2.771 -0.996
School characteristics
Gender mix:
Boys 0.656** 0.093
Girls -0.204 -0.562**
Ref: Coed
Language medium:
Gaelscoil 0.798* -0.116
Gaeltacht -0.828 -0.298
Re: English-medium
DEIS status:
Urban band 1 0.670* 0.207
Urban band 2 0.358 0.096
Rural 0.406 -0.190
Ref: Non-disadvantaged
Private school 2.738*** 1.698**
Teacher characteristics
Gender (female) -0.186 -0.375*
Teaching experience:
3-5 years -0.281 0.457*
6-10 years 0.536* 0.808***
11-20 years 0.277 0.952***
21-30 years 0.335 1.086***
>30 years 1.062*** 0.822***
Ref: <2 years
Postgraduate qualifications 0.465* -0.164
Contextual factors
Multi-grade class 0.439* -0.298*
Composition of class (>1 pupil with EBD) 0.451* 0.215±
School-level variation 0.491* 0.190±
Note: *** p<.001; ** p<.01; * p<.05; ± p<.10.

20 | The Primary Classroom – Insights from the Growing Up in Ireland Study
In terms of teacher characteristics, female teachers are less likely to focus on a
core curriculum than their male counterparts. The likelihood of providing a core
curriculum tends to increase over the course of teaching service, with some fall-
off after 30 years of teaching. Teachers who have been teaching for more than 30
years are more likely to provide either a broad or a core curriculum than other
teachers. Qualifications also make a difference, with those with post-graduate
qualifications being more likely to provide a broad curriculum, even controlling
for experience and gender. Teachers whose classes have at least one student
with an emotional/behavioural difficulty are more likely to provide either a broad
or a core curriculum. Teachers working with a multi-grade class are more likely to
provide a broad curriculum, and less likely to focus on a core curriculum, than
other teachers.
2.4 CONCLUSIONS
This chapter has explored the allocation of time to different subject areas within
the primary classroom. The Primary Curriculum was designed to allow teachers
flexibility in planning their class-work across different subjects, although
recommended guidelines were provided. Analyses in this chapter show
considerable variation between schools and between individual teachers in the
amount of time spent on different subject areas. The greatest amount of time is
allocated to English, Irish and Mathematics. However, variation is also evident for
these subjects, with class settings differing by two hours or more per week in the
time spent. These differences are substantial, and averaged over the school year
can mean over 18 full days less instruction in a particular subject. If, as
international evidence suggests, more time on a particular subject enhances
achievement, all else being equal, then this is likely to facilitate the emergence of
achievement gaps in certain subjects.
The study indicates that the time a child spends on different subjects reflects the
school they attend and the teacher they have. The gender mix of the school, its
language medium and DEIS status are all associated with the pattern of variance
in time allocation. Thus, it appears that teachers adjust their classroom planning
to reflect the intake of students to the school and the overall school ethos. Time
allocation also varies by teacher characteristics. Female teachers are found to
spend more time on particular subject areas, including RE and Drama. Male
teachers are more likely to focus on a ‘core’ curriculum, with more time spent on
English, Irish and Mathematics. This focus on a core curriculum also appears to
increase with teacher experience. However, this pattern should not be
interpreted as causal; it may be that teacher education for earlier cohorts
emphasised a focus on the ‘core’ curriculum rather than that individual teachers
change their approach as they become older. Teachers with post-graduate
qualifications are found to provide a broader curriculum in terms of time
allocation to a range of subjects than other teachers.
In the context of policy debate about the ‘overcrowded’ curriculum, these
analyses yield fresh insights into possible ‘trade-offs’ between different subject

Time Allocation to Different Subject Areas | 21
areas. Teachers who devote more time to English tend to spend less time on
other subjects, especially History, Geography and Science. Similarly, additional
time on Mathematics is traded-off against these three subjects as well as RE and
Drama. The implementation of the Literacy and Numeracy for Life strategy,
through additional time devoted to literacy and numeracy, is therefore likely to
have important consequences for the teaching of other subjects. This impact will
very much depend on whether literacy and numeracy skills are taught in a cross-
curricular way. Devoting additional time to the subjects of English and
Mathematics is likely to lead to a very significant reduction in the time devoted to
other subject areas and thus children’s access to a broad and balanced
curriculum.

22 | The Primary Classroom – Insights from the Growing Up in Ireland Study
Chapter 3
Teaching Methods
3.1 INTRODUCTION
There has been considerable discussion about teaching methods and their
relative effectiveness, particularly for primary school students. Teachers may
draw from a wide repertoire of approaches, including whole-class teaching,
setting individual work for students, having students work in pairs or groups,
using discussion, providing practical demonstrations (e.g. in Science), and
allowing students to work with their hands (e.g. in visual arts). International
literature suggests that different teaching approaches and strategies may vary in
their effectiveness, particularly across different student groups and across lessons
of differing content and goals. Much of the literature compares teacher-centred
or direct instruction approaches (that is, the ‘traditional’ image of the students
facing the teacher who is at the top of the class and who does most of the talking)
to more interactive and child-centred approaches, within which ‘constructivist’
approaches could be included. While there is a good deal of debate about the
meaning and application of constructivist approaches, the core elements centre
on the child’s own perspective and knowledge being a starting point for learning
and on the importance of the child as active learner rather than passive
‘recipient’ of knowledge. In a synthesis of British research on effective teaching,
Muijs and Reynolds (2011) point to some general features of effective teaching,
but also to variation across studies in the characteristics of effective and
ineffective teachers. Muijs and Reynolds (2002) found that it was teachers who
spent more time teaching the whole class as opposed to individual pupils whose
pupils showed stronger gains. However, they also point to a review of Dutch
research which found that whole-class teaching was positively related to pupil
outcomes at primary level in just four out of 29 studies, while differentiation (that
is, tailoring the lesson to the different needs of students in the class) was
negatively related to outcomes in two studies, and positively related to outcomes
in none (Scheerens and Creemers, 1996).
Some international comparative studies, such as the ‘Worlds Apart’ report
(Reynolds and Farrell, 1996), note that one of the main factors that distinguished
more successful countries in international achievement rankings (like Singapore)
was a more widespread use of whole-class interactive teaching. Muijs and
Reynolds (2011) argue that the most widely used and most effective strategy at
the disposal of teachers is direct or teacher-centred instruction. They note,
however, that this approach has been found to be most effective in teaching
rules, procedures and basic skills, especially to younger pupils (Good and Brophy,
1986). Research also points to variation in teacher effectiveness across groups –
evidence suggests that direct instruction is particularly helpful for pupils from

Teaching Methods | 23
lower socio-economic backgrounds and low attaining pupils (Muijs and Reynolds,
2005; Schippen et al., 2005). Similarly, this approach has been found to be more
effective for pupils from disadvantaged backgrounds, or for pupils starting from a
low level of achievement in a subject (Muijs and Reynolds, 2000).
In the United States, D’Agostino (2000) points to changes in the effectiveness of
different teaching approaches over the elementary school years. His research
found that in grades 1 and 2, teachers who emphasised a teacher-directed, basic-
skill orientation appeared to be most effective in both mathematics and reading
gains. A student-centred, advanced-skill focus did not appear to be an effective
teaching strategy in these early primary grades. However, by fourth grade, there
was evidence that the introduction of student-centred instructional elements into
classroom activities and structures was the most effective approach, even for
facilitating the development of students’ basic skills. He concludes that ‘students
in the middle elementary grades need to be provided critical thinking
opportunities and they need to have occasions where they direct their own
learning’ (p.231).
A number of studies point to the potential benefits of small group work, or
collaborative peer learning, and peer tutoring in student learning. In synthesising
the evidence, Muijs and Reynolds (2011) highlight the potential advantages of
small group work over individual practice. The main benefit appears to lie in the
cooperative aspects it can help foster. Working with other pupils may help them
to develop their empathetic abilities, by allowing them to see others’ viewpoints.
Pupils can provide each other with scaffolding in the same way the teacher can
during questioning. Small group work can also help students to restructure their
own thinking through talking to others, allowing them to understand their own
strengths and weaknesses better (O’Donnell, 2006). Veenman et al. (2005) found
a significant relationship between providing explanations in small groups and
students’ mathematics achievement. Webb and Mastergeorge (2003) highlight
the importance for student learning of students asking for specific explanations
rather than general questions or requesting answers; emphasising the
importance of creating a classroom culture that focuses on meaning and solution
rather than correct answers.
Constructivism, as much a teaching philosophy as an educational strategy, has
been highly influential in education (Muijs and Reynolds, 2011). Within
education, constructivist ideas are translated as meaning that all learners actually
construct knowledge for themselves, rather than knowledge coming from the
teacher and being ‘absorbed’ by the student. As a result, learning is an active
process and the construction of knowledge is not just an individual process but
socially constructed through interaction with peers, teachers, parents and so on.
Teaching is about empowering the learner, and allowing the learner to discover
and reflect on realistic experiences, often with the use of hands-on and real-life
materials, leading to authentic learning and deeper understanding. Muijs and
Reynolds (2011) cite a range of studies assessing the value of constructivist

24 | The Primary Classroom – Insights from the Growing Up in Ireland Study
teaching strategies. Many of the studies show positive effects on student learning
– including research in Korean classrooms (Kim, 2005), a Dutch study on primary
students (De Jager, 2002) and the MathsWings project in the US (Madden at al.,
1999) – as well as on other outcomes like students’ writing (Au and Carroll, 1997)
and student motivation (Koebley and Soled, 1998). However, Muijs and Reynolds
also point to research showing that pupils taught by teachers using a direct
instruction approach have higher achievement levels than students taught by
teachers with constructivist beliefs (Gales and Yan, 2001; Klahr and Nigam, 2004).
Further, they note that good classroom management and a positive climate are
essential to making constructivism work in the classroom. Kirschner et al. (2006)
argue that much of the empirical evidence indicates that constructivist-based
minimally guided instruction is less effective and less efficient than instructional
approaches that place a strong emphasis on guidance of the student learning
process. However, Spiro and DeSchryver (2009) note that many of the studies
finding that direct instruction approaches have more positive learning outcomes
than constructivist approaches are typically focused on well-structured domains
like mathematics and Science. Few studies have examined the effectiveness of
different approaches for successful learning in less structured domains like Social
Studies, Humanities and Art.
3.2 VARIATION IN TEACHING METHODS ACROSS TEACHERS
The Growing Up in Ireland data offer a valuable opportunity to assess the
approaches teachers take in teaching (middle stage) primary school children and
the extent to which teaching approaches vary across teachers and schools and
classrooms of differing composition. Teachers were asked a series of 19 questions
about the frequency with which different activities took place in their classroom –
including ‘pupils copy notes from the board’, ‘pupils suggest topics to be covered
in class’ and ‘you teach pupils as a whole class’ (the full list is presented in
Appendix A) – to which teachers could respond ‘never or almost never’, ‘some
days’, ‘most days’ or ‘every day’. For many of the items, there was little variation
across teachers in their responses. For example, almost all (95 per cent) teachers
responded that ‘pupils work individually in class using their textbook or
worksheet’ most days or every day. Similarly, the vast majority of teachers
reported that they asked pupils questions in class (99 per cent), pupils asked
them questions (92 per cent) and they teach pupils as a whole class (84 per cent)
most days or every day.
However, teachers varied somewhat in the frequency with which they employ
more active teaching approaches, including the use of pair-work and group-work,
the frequency with which differentiated activities are provided and the extent to
which pupils get the opportunity to engage in hands-on learning. The prominence
of these approaches appears to vary across teachers of differing teaching
experience and across different student groups, particularly in terms of the
gender composition of the student body.

Teaching Methods | 25
The results show important differences in the prominence of pair-work, group-
work and hands-on activities and the extent to which teachers provide
differentiated activities to pupils. Such differences are particularly apparent when
we consider the length of teaching experience – young teachers and those more
recently qualified are far more likely to provide pair- and group-work and hands-
on activities to pupils than older and more experienced teachers. As illustrated in
Figure 3.1, nearly three-quarters of children with recently qualified teachers (less
than two years experience) work in pairs frequently, while this compares to just
one-third of 9-year-olds with a teacher of more than 30 years experience.
Similarly, as shown in Figure 3.2, while 70 per cent of children with recently
qualified teachers have the opportunity to engage in hands-on activities most
days/every day, this is the case for 44 per cent of children with highly
experienced teachers (more than 30 years experience). Less experienced teachers
are also more likely to encourage pupils to ask each other questions in class (over
three-quarters of teachers of less than two years do so daily compared to half of
the most experienced teachers) and they are more likely to consider the pupils’
experience and environment as the starting point for learning. These results
suggest an important shift in the approaches taken by teachers – with more
recent graduates adopting more active teaching methods than their more
experienced counterparts.
At first glance, it appears that male teachers are less likely to take such innovative
approaches in their teaching. However, this largely reflects the differing age
profile of male and female teachers: male teachers are less likely to be in the
three to ten year teaching bracket, with a greater proportion teaching more than
30 years. When we take account of the age composition of the group, there do
not appear to be significant differences between male and female teachers in
their approach to teaching.
Figure 3.1: Proportion of children in classes where teachers use pair-work and group-
work most days/every day, by length of teacher’s experience
0
10
20
30
40
50
60
70
80
<2 yrs 3-5 yrs 6-10 yrs 11-20 yrs 21-30 yrs 30+ yrs
%
Number of Years Teaching
Pupils work in pairs
Pupils work in groups

26 | The Primary Classroom – Insights from the Growing Up in Ireland Study
Figure 3.2: Proportion of children in classes where teachers use hands-on activities most
days/every day, by length of teacher’s experience
3.3 TEACHING METHODS AND CLASS SIZE
There is some evidence that class size makes a difference to the approach taken
by teachers at primary level, with smaller class sizes allowing a greater focus on
differentiated activities and group activities. In assessing the teaching approaches
taken with classes of differing size, it is important to keep in mind that class size is
correlated with other school characteristics, in particular DEIS status and school
type (in terms of fee-paying status, language medium and gender mix). For
example, the vast majority of children in urban band 1 DEIS schools have class
sizes of less than 25 pupils, whereas over three-quarters of children attending
non-DEIS schools are in class sizes of greater than 25 pupils (with over one-third
attending classes of greater than 30 pupils). Children attending gaelscoileanna are
more likely to be in classes of greater than 30 pupils, while girls attending single-
sex schools are less likely to be in large classes.
Figure 3.3 shows the prevalence of pair-work and group-work by class size. While
teachers are increasingly likely to employ pair-work with increasing class size, the
opposite is the case for group-work; such opportunities are more prevalent
among smaller classes. It appears increasing class size means less group-work
activities and an increasing reliance on grouping children in pairs. When we
consider the extent to which teachers provide differentiated activities to their
pupils, again smaller classes seem to allow more child-centred approaches. As
shown in Figure 3.4, while over 80 per cent of children in small classes (less than
20 pupils) are taught by teachers who provide differentiated activities in most
lessons/every lesson, this is the case for just two-thirds of children in classes of
more than 30 pupils. Overall, the findings suggest that children in smaller class
sizes may benefit in terms of the opportunity their teacher has to employ more
active methods.
0
10
20
30
40
50
60
70
80
<2 yrs 3-5 yrs 6-10 yrs 11-20 yrs 21-30 yrs 30+ yrs
%
Number of Years Teaching

Teaching Methods | 27
Figure 3.3: Proportion of children in classes where teachers use pair-work and group-
work most days/every day, by class size
Figure 3.4: Proportion of children in classes where teacher provides differentiated
activities most days/every day, by class size
3.4 TEACHING METHODS AND SCHOOL TYPE
The results also suggest that children across different school settings receive
different teaching approaches, with particularly noteworthy findings based on
school gender mix. Children in girls’ only schools are more likely to have teachers
who provide differentiated activities as appropriate and are substantially more
likely to get frequent opportunities to engage in hands-on activities. While 73 per
cent of pupils in girls’ only schools participate in hands-on activities most
days/every day, this is the case for just half of pupils in boys’ only schools.
Similarly, girls enrolled in single-sex schools are substantially more likely to have
teachers who use pair-work and group-work most/every day (Figure 3.5).
Teachers in girls’ only schools also tend to place less emphasis on students
0
10
20
30
40
50
60
< 20 20-24 25-29 30 +
%
Class Size
Pupils work in pairs
Pupils work in groups
50
55
60
65
70
75
80
85
< 20 20-24 25-29 30 +
%
Class Size

28 | The Primary Classroom – Insights from the Growing Up in Ireland Study
copying notes from the board, with a greater emphasis on students ‘finding
things out for themselves’. In relation to homework, teachers in boys’ schools are
more likely to check homework during class time, while homework is taken up for
correction more often in girls’ schools.
Figure 3.5: Proportion of children in classes where teachers use pair-work and group-work
most days/every day, by school gender mix
Children in DEIS schools also appear to receive somewhat distinct teaching
approaches compared with children in non-disadvantaged schools. On the one
hand, children in the most disadvantaged school contexts are more likely to have
teachers who regularly use differentiated activities in their classrooms. However,
these children are also less likely to have teachers who encourage them to find
things out for themselves, with teachers preferring more structured teacher-
directed approaches in these school contexts (Figure 3.6).
Figure 3.6: Proportion of children in classes where teachers use differentiated activities and
encourage them to find things out most days/every day, by school gender mix
0
10
20
30
40
50
60
70
80
Mixed Boys Girls
%
Gender Mix of School
Pupils work in pairs
Pupils work in groups
0
10
20
30
40
50
60
70
80
90
Urban
Band 1
Urban
Band 2
Rural Non-DEIS
%Differentiated Activities
Pupils encouraged to find
things out

Teaching Methods | 29
Children in gaelscoileanna are more likely to benefit from pair- and group-work
than children in other school settings, as are children attending fee-paying
schools. While in both the fee-paying sector and Irish-medium schools teachers
place less emphasis on providing differentiated activities, they place a greater
emphasis on hands-on activities, using play to facilitate learning and encouraging
pupils to find things out for themselves. In contrast, they appear to rely less
frequently on more traditional approaches like copying notes from the board.
3.5 VARIATION IN THE USE OF ACTIVE TEACHING METHODS
Factor analysis of the teaching methods items revealed a scale variable measuring
the extent to which teachers encouraged more interaction in the classroom or
what can be termed an active teaching approach. The scale is comprised of the
following six items (with a high reliability: alpha score = .72):
• Pupils work in pairs
• Pupils work in groups in class
• Pupils ask each other questions in class
• Pupils get the opportunity to engage in hands-on activities
• Pupils are encouraged to find things out for themselves
• You use play to facilitate pupil learning.
The results show wide variation across teachers in the extent to which they adopt
active teaching methods in their primary classrooms. As illustrated in Figure 3.7,
more recently qualified teachers are far more likely to score highly on the active
teaching methods scale than their more experienced counterparts. For half of
children with teachers teaching less than two years, their teachers score high on
the active methods scale; this is the case for less than a quarter of children with
teachers of more than 30 years experience. While female teachers appear more
likely to adopt such active methods, this largely reflects the differing age profile
of male and female teachers noted earlier.
When we consider the school setting, it appears that children in rural DEIS and
urban band 1 DEIS schools are less likely to have teachers who adopt active
teaching methods (Figure 3.8). There is also some evidence to suggest that
teachers in fee-paying schools are more likely to adopt more active teaching
approaches, as are teachers in single-sex girls’ schools (Figure 3.9). Finally, it
appears that class size plays a role in the approach taken – children in small
classes are significantly more likely to have teachers who score highly on the
active teaching methods scale. While 30 per cent of children in larger class
groupings have teachers who adopt active teaching approaches, this is the case
for nearly half of children in smaller class groups (Figure 3.10).

30 | The Primary Classroom – Insights from the Growing Up in Ireland Study
Figure 3.7: Proportion of children with teachers scoring high on the active methods scale by
teacher’s gender and length of teaching experience
Figure 3.8: Proportion of children with teachers scoring high on the active methods scale by
school DEIS status
0
10
20
30
40
50
60
<2 yrs 3-5 yrs 6-10 yrs 11-20 yrs21-30 yrs 30+ yrs Male Female
Years teaching Teacher Gender
%
0
5
10
15
20
25
30
35
40
45
Urban Band 1 Urban Band 2 Rural Non-DEIS
DEIS Status
%

Teaching Methods | 31
Figure 3.9: Proportion of children with teachers scoring high on the active methods scale by
school type and gender mix
Figure 3.10: Proportion of children with teachers scoring high on the active methods scale by
class size
3.6 USE OF MULTIMEDIA/ICT
Teachers were also asked about their use of multimedia in the classroom and the
frequency with which students accessed computers and the internet. The results
show a greater use of DVD/audio in single-sex girls’ schools and in schools in the
fee-paying sector. The use of computer facilities, however, is much less prevalent
in the fee-paying sector: less than 10 per cent of children in fee-paying schools
reported daily use of a computer compared to one-quarter of children in non-fee-
paying schools. The use of ICT also appears higher in rural DEIS and urban band 1
DEIS schools, along with schools in the Gaeltacht. To illustrate, while 70 per cent
of children in urban band 1 DEIS schools use computer facilities in the classroom
0
10
20
30
40
50
60
Non-Fee Fee English Irish Mixed Boys Girls
Fee-Paying Language Medium Gender Mix
%
0
10
20
30
40
50
60
< 20 20-24 25-29 30 +
%
Class Size

32 | The Primary Classroom – Insights from the Growing Up in Ireland Study
at least once a week, this is the case for just over half of their peers in non-DEIS
schools (Figure 3.11).
Figure 3.11: Frequency with which children use a computer in the classroom by school DEIS status
McCoy et al. (2012, forthcoming) point to the potentially beneficial role played by
ICT access in the classroom. They find that internet access in the classroom plays
an important role in enhancing social networking activities outside of the
classroom, while children who have access to a computer in the classroom are
more likely to engage in cultural activities outside of the classroom. The results
further showed that participation in these cultural and social networking
activities outside school are associated with enhanced reading and mathematics
performance.
3.7 INFLUENCES ON TEACHING METHODS
This section uses the scale of active teaching methods described above to explore
the teacher and school factors influencing the type of teaching used in the
classroom. As in Chapter Two, multilevel modelling is used to take account of the
clustering of teachers within schools. Multilevel modelling indicates that, without
taking account of any teacher and school factors, there is significant variation
between schools and among teachers within schools in the type of teaching
methods used. Interestingly, 56 per cent of the variation is between schools, with
44 per cent between teachers. This is quite different from the pattern for time
allocation and implies a greater consistency at the school level in the teaching
methods used than in the organisation of the class day.
In keeping with the descriptive analyses presented above, the teaching methods
used vary by teacher gender and years of teaching experience (Table 3.1). Female
teachers are more likely to use active methods than their male counterparts,
even when the composition of the class group and school characteristics are
taken into account. Newly qualified teachers are the most likely to use more
0%
10%
20%
30%
40%
50%
60%
70%
80%
90%
100%
Urban Band 1 Urban Band 2 Rural Non-DEIS
3 or more times/wk
1-2 times/wk
2-3 times/mth
Once a mth or less
Never

Teaching Methods | 33
active learning methods while the lowest levels of use are found among teachers
who have more than 20 years experience.
The approach to teaching is found to reflect the type of classroom setting.
Teachers with small classes (fewer than 20 pupils) are most likely to use active
teaching approaches while those with large classes (with more than 30 pupils) are
least likely to do so. This is likely to reflect greater (perceived) logistical
constraints in using active methods with larger groups but may also reflect space
constraints within the classroom (see Darmody et al., 2010). The mix of pupils
within the class also influences the approach to teaching used. Teachers with
classes where at least one student has a learning disability or an
emotional/behavioural problem are more likely to use active teaching methods,
most likely in an attempt to fully engage all groups of children. The situation is
quite different when newcomer (immigrant) students are considered. Here the
relationship is negative, meaning that teachers with newcomer students are less
likely to use active methods.
Teaching methods are found to vary by school characteristics. In keeping with the
descriptive analyses presented above, teachers in girls’ schools are more likely to
use more active approaches than those in boys’ or coeducational schools. In
addition, teachers in gaelscoileanna are more likely to use active methods than
those in English-medium or Gaeltacht schools. Finally, teachers in DEIS urban
band 1 schools are less likely to use such active methods than teachers in other
schools, a pattern which may reflect the greater use of established literacy and
numeracy programmes in these settings. Even taking teacher background, class
setting and school factors into account, significant variation in teaching methods
remains between schools and between teachers. It is likely that a range of other
factors, including initial education, continuous professional development,
principal leadership strategy and whole-school policies, all play a role in shaping
this variation.

34 | The Primary Classroom – Insights from the Growing Up in Ireland Study
Table 3.1: Multilevel regression model of active teaching methods scale Coefficient
Constant 2.837
Teacher characteristics Gender (female) ‐0.093*** Teaching experience:
3‐5 years ‐0.103***
6‐10 years ‐0.160***
11‐20 years ‐0.131***
21‐30 years ‐0.241***
>30 years ‐0.245***
Ref: <2 years
Contextual factors
Size of class:
20‐24 ‐0.140***
25‐29 ‐0.114***
30+ ‐0.214***
Ref:<20
Composition of class:
>1 pupil with learning disabilities 0.041**
>1 pupil with EBD 0.095***
>1 newcomer pupil ‐0.039***
School characteristics
Gender mix:
Boys 0.005
Girls 0.144**
Ref: Coed
Language medium:
Gaelscoil 0.168**
Gaeltacht ‐0.058
Re: English‐medium
DEIS status:
Urban band 1 ‐0.130*
Urban band 2 0.021
Rural ‐0.046
Ref: Non‐disadvantaged school
School‐level variation 0.139***
Teacher‐level variation 0.102***
Note: *** p<.001; ** p<.01; * p<.05; ± p<.10.

Teaching Methods | 35
3.8 SUMMARY
International research suggests that different teaching approaches and strategies
may vary in their effectiveness, particularly across different student groups and
across lessons of differing content and goals. The current study shows important
differences between initial teachers or those relatively recently qualified and
longer-serving teachers in the approach taken in teaching children in the mid-
primary years. More active teaching approaches like pair-work, group-work and
hands-on activities are all more prevalent among recently qualified teachers and
decline in prominence with length of teaching experience. This is a significant
finding and may signify an important shift in teacher training methodologies over
time. There is also evidence to suggest that teachers take different approaches in
different school and classroom contexts – with more active methods adopted in
single-sex girls’ schools, fee-paying schools and gaelscoileanna, and more
teacher-centred approaches in rural DEIS and urban band 1 DEIS schools. Finally
the results point to the significance of class size for teaching approaches – with
smaller classes allowing more active approaches while teachers of larger classes
are more likely to take more traditional approaches, perhaps reflecting greater
logistical constraints and space constraints.

36 | The Primary Classroom – Insights from the Growing Up in Ireland Study
Chapter 4
Children’s Engagement
4.1 INTRODUCTION
This chapter is focused on children’s engagement with their school activities and
school work. Jimerson et al. (2003) argue that school engagement is best
conceptualised as ‘a multifaceted construct that includes affective, behavioural
and cognitive dimensions’ (pp.11-12). This definition is a consistent feature of the
literature on school engagement, with many viewing school engagement as
encompassing the affective (e.g., likes school), behavioural (e.g., finishing
homework, participating in activities) and cognitive (e.g., self-efficacy,
motivation) investments that a student makes at both the classroom and school
level (Perdue et al., 2009). However, research also suggests that in many ways
these different dimensions are intertwined. McCoy and Banks (2012,
forthcoming), in examining school engagement among children with special
educational needs, find that both academic engagement and peer/social relations
play a central role in understanding children’s affective engagement with school.
Perdue et al. (2009) also point to the centrality of peer relations – in their study
they find that peer relations early in primary education play a significant role in
understanding school engagement a number of years later.
School engagement is argued to be a key element of academic achievement, as
well as lowering the risk of negative behaviours like delinquency, aggression and
early school dropout (Fredricks et al., 2004; Hill and Werner, 2006; Jimerson et
al., 2003; Simons-Morton, 2004; Sinclair et al., 2003; Perdue et al., 2009). As
Perdue et al. (2009) note, specific academic and social experiences as early as
first grade can relate to eventual dropout, as they represent the beginning of a
process of disengagement (Alexander et al., 1997). Further they note that
students at risk for potential dropout can be reliably identified as early as the
third grade on the basis of their cognitive and behavioural engagement in school
(Barrington and Hendricks, 1989; Lehr et al., 2004). Similarly, Kortering and
Braziel (2008) point to the centrality of school engagement to school success and
completion. Other studies find that perceiving an emotional connection to the
school or teachers can be a protective factor that keeps at-risk children in school
(Wehlage et al., 1989; Fredricks et al., 2004). Perhaps of particular importance, it
has also been argued that engagement is relatively ‘malleable, responsive to
contextual features, and amenable to environmental change’ (Fredricks et al.,
2004, p. 59), offering an important area for intervention with children at risk of
longer term educational underperformance.

Children’s Engagement | 37
As noted by Furlong and Christenson (2008), children’s affective engagement
with school is an internal indicator that is less observable than academic
engagement or behavioural engagement. They note that student self-report
measures are the most valid and reliable way to capture this type of engagement.
In this context we draw on a number of self-reported responses reflecting
children’s affective engagement with school. We first focus on three measures of
specifically affective engagement – whether children report that they like school,
look forward to school and like their teacher; response categories for all
measures are ‘always’, ‘sometimes’ and ‘never’. Later in the chapter we examine
other dimensions of engagement, namely whether children report that they like
specific school subjects (Reading, Irish and Mathematics). These could be argued
to reflect both affective and cognitive aspects of children’s engagement. In each
section we examine the extent to which engagement varies across students of
differing social backgrounds, as well as other characteristics such as gender,
immigrant status, family structure and whether the child has been identified with
a special educational need (according to the definition derived from the EPSEN
Act, as discussed in detail in Banks and McCoy, 2011).
4.2 VARIATION IN CHILDREN’S ENGAGEMENT
The results show broadly high levels of engagement among primary school
children, with the vast majority indicating that they like school (always or
sometimes – 93 per cent), look forward to school (always or sometimes – 89 per
cent) and like their teacher (always or sometimes – 94 per cent). When we
examine levels of engagement across social class and income groups, we find
largely comparable levels of engagement. For example, over 90 per cent of
children from each of the income quintile groups report that they like school
(sometimes or always). A similar result emerges when we consider parental
educational level – the percentage of children reporting that they like school and
their teacher does not vary significantly by level of mother’s education. This is
somewhat at odds with international research showing social differentiation in
school engagement (see Smith et al., 1997 for example). However, the bulk of this
research has been undertaken with second-level students, with much less
research examining engagement at primary level.
The results from the Growing Up in Ireland study show important differences in
school engagement among boys and girls, even at this relatively early age. In line
with research elsewhere (Sirin and Rogers-Sirin, 2005), boys are significantly
more likely to report that they never like school, never look forward to school and
never like their teacher. Figure 4.1 shows the gender breakdown, with boys
dominating the ‘disengaged’ group. To illustrate, while 6 per cent of girls respond
that they never look forward to school, this is the case for one-in-six boys. Boys
are two and a half times more likely to report that they never like school and
three times more likely than girls to indicate that they never like their teacher.
These results raise concern over boys’ engagement with, and enjoyment of,

38 | The Primary Classroom – Insights from the Growing Up in Ireland Study
schooling, with a potentially detrimental impact on their longer-term educational
development and performance.
Figure 4.1: Percentage of children reporting that they never like school, never look
forward to school and never like their teacher
Alongside important gender differences in children’s engagement, the results also
show that children with a special educational need (SEN) are significantly more
likely to indicate that they never like school or their teacher. While nine per cent
of children who are not identified with a SEN indicate that they never look
forward to school, this is the case for 16 per cent of children with SEN (Figure
4.2). McCoy and Banks (2012, forthcoming) attempt to further understand the
processes underlying the difficulties children with SEN face. They point to the
need to move beyond the predominant focus on children’s academic engagement
in understanding how children fare at school, to taking a more holistic approach
looking at both academic engagement and social relations, both with teachers
and peers.
0
2
4
6
8
10
12
14
16
18
Never like school Never look forward
to school
Never like their
teacher
% Boys
Girls

Children’s Engagement | 39
Figure 4.2: Percentage of children reporting that they never like school, never look
forward to school and never like their teacher, by child’s SEN status
4.3 CHILDREN’S ENGAGEMENT ACROSS SCHOOL SETTINGS
Examining children’s engagement across different school types and settings, for
the most part we find little variation in engagement. As shown in Figure 4.3,
children’s reporting of the extent to which they like school does not vary
substantially across DEIS and non-DEIS schools. However, there is some evidence
that children attending fee-paying schools are less likely to never like school and
never look forward to school, although small numbers mean that these results
should be interpreted with caution. Children attending gaelscoileanna are also
less likely to report that they never like school, although again small numbers
point to the need for caution in the interpretation of these results. Given the
gender differences shown above, it is not surprising to find that children
attending boys’ only schools are less engaged than children attending other
school settings. It is interesting to note that the gender difference persists even in
gender-mixed school settings: while one-in-ten boys in coeducational schools
report that they never like school, this is the case for just three per cent of girls in
these schools.
0
2
4
6
8
10
12
14
16
18
Never like school Never look forward
to school
Never like their
teacher
% No SEN
SEN

40 | The Primary Classroom – Insights from the Growing Up in Ireland Study
Figure 4.3: The extent to which children like school, by DEIS status
4.4 CHILDREN’S ENGAGEMENT AND TEACHING APPROACH
A number of studies point to the role of school and classroom factors in children’s
engagement. In particular, Newmann theorises that engagement in learning will
be enhanced in classrooms where tasks are authentic, provide opportunities for
students to assume ownership of their learning, provide opportunities for
collaboration, permit diverse forms of talents and provide opportunities for fun
(Newmann et al., 1992). Similarly, Guthrie and Wigfield argue that engagement in
reading is enhanced in classrooms with interesting texts, real-world interactions,
autonomy support, strategy instruction, opportunities for collaboration and
teacher involvement (Guthrie and Wigfield, 2000; Fredricks et al., 2004). Among
elementary, middle and high school US students, Marks (2000) also found that
students’ perceptions of the opportunities to be involved in authentic instruction
were a strong predictor of engagement.
For the most part, the results suggest that children's engagement, at least at nine
years of age, does not appear to be highly related to the approach taken by the
teacher. However, there are a few notable exceptions. In particular, the results
show that children appear to be more engaged where teachers employ group-
work; nearly one quarter of children whose teachers never employ group-work
report that they never like school. This compares to less than one-in-ten children
who work in groups most days/every day (Figure 4.4). The direction of causality is
not clear using just one wave of data, however. It may be that children are more
engaged in classrooms where group-work is a common feature. Alternatively,
teachers may be more reluctant to use group-work if they feel that children are
already disengaged and may not therefore work productively in groups.
0%
10%
20%
30%
40%
50%
60%
70%
80%
90%
100%
Urban Band 1 Urban Band 2 Rural Non-DEIS
DEIS Status
Never like school
Sometimes like
school
Always like school

Children’s Engagement | 41
Figure 4.4: Percentage of children who never like school, never like their teacher and never look forward to school, by frequency of group‐work
0
5
10
15
20
25
(Almost) never
Some days Most/every day
%
Frequency with which pupils work in groups
Never like school
Never like teacher
Never look forward to school
4.5 INFLUENCES ON SCHOOL ENGAGEMENT
This section looks at the simultaneous impact of child, family, school and teacher
characteristics in shaping children’s engagement with school. As in previous
chapters, multilevel modelling is used to provide more precise estimates of the
effects. Here we focus on predicting the likelihood of a child ‘never’ liking school,
‘never’ looking forward to coming to school and ‘never’ liking their teacher. The
first issue to note is the relative absence of significant variation by social
background factors (Table 4.1). While this may reflect the small size of the
‘disengaged’ group (see above), it is also clear that children with similar
backgrounds have quite distinct experiences of school engagement. What is
striking is the very significant gender differences found in school engagement. At
the age of nine, boys are markedly more likely to never like school, never look
forward to school and never like their teacher. These effects are large in size;
boys are over three times as likely to report never liking school or never looking
forward to it as girls with similar characteristics. The gender gap is similarly large
in terms of attitudes to their teacher, with boys being 2.8 times more likely to
have negative views than girls, all else being equal. Research is increasingly
concerned with whether the ‘feminisation’ of teaching may be playing a role in
the growing educational disadvantage of males. In the Canadian context, Sokal
and Katz (2008) examined the impact of male teachers and the use of computer‐
based books on third and fourth‐grade boys’ reading performance. However,
they found that neither male teachers nor computer‐based reading had a
significant effect on boys’ reading performance. Similarly, Neugebauer et al.
(2011), drawing on large‐scale data for Germany, found no evidence of a benefit
from having a same‐sex teacher for boys or girls. They conclude ‘the popular call
for more male teachers in primary schools is not the key to tackling the growing
disadvantage of boys’ (p.669). Additional analyses (not shown here) were
undertaken to assess whether teacher gender played a role in boys’ and girls’

42 | The Primary Classroom – Insights from the Growing Up in Ireland Study
levels of affective engagement. Consistent with the literature, we find that there
is no significant difference in the engagement levels of boys with male and female
teachers, all else being equal (Neugebauer et al., 2011).
A further striking finding is the greater school disengagement found among
children who are deemed to have a special education need; they are around 1.5
times more likely than other children to fall into the disengaged group regardless
of the measure used. McCoy and Banks (2012, forthcoming) further explore the
processes underlying the difficulties encountered by children identified with
special educational needs.
In contrast to the strong effects of gender and SEN, there is remarkably little
variation in subjective school engagement by social background factors. Children
whose mothers have degree‐level or higher qualifications are less likely to have
negative views about school but parental education has little impact on the other
measures of disengagement. Children from lone parent families are somewhat
more likely to never look forward to going to school but do not differ from
children from two‐parent families in relation to the other dimensions. Being from
an immigrant family is associated with looking forward to school (with immigrant
children being more positive on this dimension) but not with liking school or the
teacher.
The analyses included a range of teacher and school characteristics. However,
none of these effects are found to be significant. In other words, children in the
same classroom or school context can have very different levels of engagement
with schooling.

Children’s Engagement | 43
Table 4.1: Multilevel logistic regression model of factors influencing attitudes to
school and teachers
Never like
school
Never look forward
to school
Never like teacher
Constant -3.206 -2.911 -3.258
Individual characteristics
Gender (male) 1.146*** 1.139*** 1.048***
Social class:
Professional -0.229 -0.134 -0.377
Managerial -0.250 -0.205 -0.419±
Non-manual -0.089 -0.008 -0.076
Skilled manual -0.142 0.178 0.006
Economically inactive 0.311 0.177 -0.039
Ref: semi/unskilled manual
Mother’s education:
Upper secondary -0.181 0.024 0.059
Post-secondary -0.116 0.046 0.020
Degree -0.483* -0.010 -0.133
Postgraduate degree -0.796** -0.195 0.093
Immigrant student -0.233 -0.367* -0.214
Lone parent family 0.199 0.349* 0.096
Has special educational needs (SEN) 0.461*** 0.486*** 0.440***
Teacher characteristics
Teacher gender (male) 0.214 0.069 -0.077
Teaching experience:
3-5 years -0.090 -0.166 -0.119
6-10 years -0.184 -0.084 0.121
11-20 years -0.346 -0.090 -0.273
21-30 years -0.103 -0.120 0.014
>30 years -0.289 -0.190 0.218
Ref: <2 years
Use of active teaching methods:
Medium level 0.004 0.140 0.020
High level -0.065 0.055 -0.228
Ref.: Low level
School characteristics
Gender mix:
Boys -0.170 -0.087 -0.137
Girls 0.326 -0.176 0.036
Ref: Coed
Language medium:
Gaelscoil -0.106 0.027 0.195
Gaeltacht -0.400 -0.829 -0.449
Re: English-medium
DEIS status:
Urban band 1 0.309 0.228 0.064
Urban band 2 0.101 0.218 -0.664±
Rural 0.003 0.035 -0.358
Ref: Non-disadvantaged
4.6 ATTITUDES TO SCHOOL SUBJECTS
Research on the attitudes of second-level students indicates that young people
tend to have very positive views on English throughout their second-level career,

44 | The Primary Classroom – Insights from the Growing Up in Ireland Study
finding it interesting and useful and not finding it difficult (Smyth et al., 2011).
Mathematics is generally seen as interesting and useful, but the perceived
difficulty of Mathematics increases as students move through junior cycle and
beyond. In general, Irish is seen more negatively by second-level students than
other subjects, with only a minority seeing it as interesting or useful. However,
little is known about attitudes among primary school children. International
research from the PIRLS study indicates that, across very different countries,
primary school (fourth grade) children are generally positive about reading,
though this finding relates to overall attitudes both within and outside school
(Mullis et al., 2007). As might be expected, children with the most positive
attitudes tend to have the highest level of reading achievement. The broadly
similar TIMSS study indicated positive attitudes to Mathematics among fourth-
grade children across countries (Mullis et al., 2008). Research from England
suggests that children’s attitudes to Mathematics are less positive than towards
reading or school in general (Mortimore et al., 1988; Tymms, 2001). English
research further indicates that attitudes to Mathematics decline with age
(Mortimore et al., 1988; Albone and Tymms, 2004). This section explores
children’s attitudes to Reading/English, Mathematics and Irish, allowing us to
explore the extent to which later differences in subject attitudes have their
origins in patterns at primary school level.
Figure 4.5 Attitudes (‘always’, ‘sometimes’ or ‘never like’) to Reading, Mathematics
and Irish by gender
Figure 4.5 shows that 9-year-old children are more positive about Reading than
the other two subjects, with the majority ‘always’ liking the subject. Attitudes to
Mathematics are more finely balanced between positive views and ambiguous or
even negative views. Views on Irish are the least positive, with only a fifth of
children ‘always’ liking the subject. Furthermore, a third of boys and a quarter of
girls report never liking Irish. Gender differences in subject attitudes are
apparent; girls have more positive attitudes to Irish and especially to Reading
while boys have more positive attitudes to Mathematics.
0%
10%
20%
30%
40%
50%
60%
70%
80%
90%
100%
Boys Girls Boys Girls Boys Girls
Reading Irish Maths
Never
Sometimes
Always
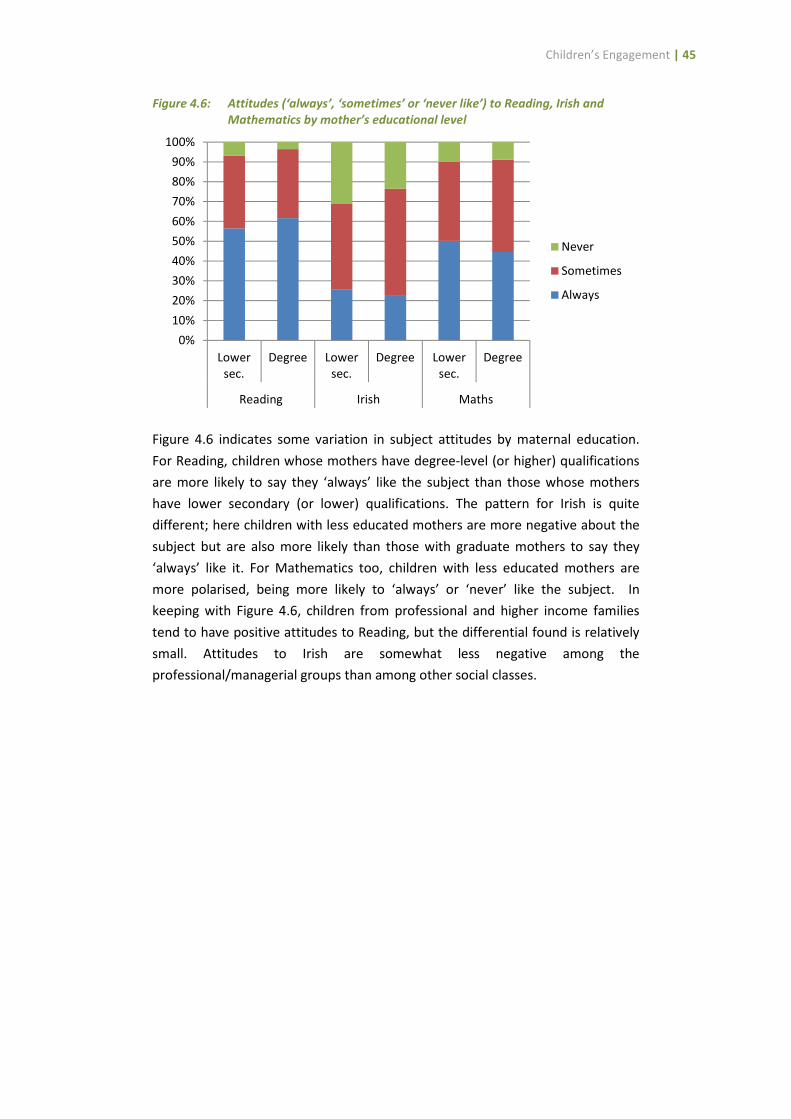
Children’s Engagement | 45
Figure 4.6: Attitudes (‘always’, ‘sometimes’ or ‘never like’) to Reading, Irish and
Mathematics by mother’s educational level
Figure 4.6 indicates some variation in subject attitudes by maternal education.
For Reading, children whose mothers have degree-level (or higher) qualifications
are more likely to say they ‘always’ like the subject than those whose mothers
have lower secondary (or lower) qualifications. The pattern for Irish is quite
different; here children with less educated mothers are more negative about the
subject but are also more likely than those with graduate mothers to say they
‘always’ like it. For Mathematics too, children with less educated mothers are
more polarised, being more likely to ‘always’ or ‘never’ like the subject. In
keeping with Figure 4.6, children from professional and higher income families
tend to have positive attitudes to Reading, but the differential found is relatively
small. Attitudes to Irish are somewhat less negative among the
professional/managerial groups than among other social classes.
0%
10%
20%
30%
40%
50%
60%
70%
80%
90%
100%
Lower
sec.
Degree Lower
sec.
Degree Lower
sec.
Degree
Reading Irish Maths
Never
Sometimes
Always

46 | The Primary Classroom – Insights from the Growing Up in Ireland Study
Figure 4.7: Attitudes (‘always’, ‘sometimes’ or ‘never like’) to Reading, Irish and
Mathematics by SEN status
Children who have special educational needs are found to differ from their peers
in their subject attitudes. Children without a SEN are more likely to ‘always’ like,
and less likely to ‘never’ like, Reading. For Mathematics, differences between the
two groups are less marked, with children with a SEN more likely to ‘never’ like
the subject (Figure 4.7). Between-group differences in attitudes to Irish are more
striking; 39 per cent of 9-year-olds with a SEN ‘never’ like Irish compared with 25
per cent of those without a SEN.
Variation in subject attitudes by teacher gender and experience was considered.
Attitudes to Reading and Mathematics do not vary by teacher gender. However,
children being taught by a male teacher tend to have somewhat more negative
views on Irish; 33 per cent of those with a male teacher ‘never’ like Irish while this
is the case for 28 per cent of those with a female teacher. This pattern is not due
to the gender profile of children being taught by male teachers or to their
representation in Irish-medium schools. There is little systematic variation in
children’s attitudes to subjects by the number of years’ experience their teacher
has. Attitudes to Reading or Mathematics do not vary by whether children are
taught in a single- or a multi-grade class. However, children in multi-grade classes
are slightly more negative about Irish than others; 20 per cent ‘always’ like it
compared to 24 per cent in single-grade classes, while 30 per ‘never’ like it
compared to 28 per cent in single-grade settings.
There are few differences by school DEIS status in attitudes to Reading, with
children in urban band 1 schools only very slightly more likely than those in non-
disadvantaged schools to ‘never’ like it (see Figure 4.8). For Irish and
Mathematics, children in urban band 1 schools are more likely to ‘always’ or
‘never’ like the subject than those in non-disadvantaged schools. Interestingly,
children in rural DEIS schools are found to have more negative attitudes to Irish
than other groups.
0%
10%
20%
30%
40%
50%
60%
70%
80%
90%
100%
SEN No SEN SEN No SEN SEN No SEN
Reading Irish Maths
Never
Sometimes
Always

Children’s Engagement | 47
Figure 4.8: Attitudes (‘always’, ‘sometimes’ or ‘never like’) to Reading, Irish and
Mathematics by DEIS status of the school
Not surprisingly, children in Irish-medium schools are more positive about Irish
than those in English-medium schools (see Figure 4.9), with the most positive
attitudes evident among children attending gaelscoileanna. Interestingly, children
attending Irish-medium schools, both gaelscoileanna and Gaeltacht schools, also
have more positive attitude to Reading than those in English-medium schools. No
variation is evident in attitudes to Mathematics by language medium of the
school.
Figure 4.9: Attitudes (‘always’, ‘sometimes’ or ‘never like’) to Reading, Irish and
Mathematics by language medium of the school
Analyses presented above point to gender differences in attitudes to the three
subjects. Figure 4.10 looks at whether these differences are apparent across the
coeducational and single-sex sectors. The most positive attitudes to Reading are
found among girls, regardless of whether they attend a single-sex or
coeducational school. Boys who attend single-sex schools have somewhat more
positive attitudes to Reading than those in coeducational schools. The pattern for
0%
10%
20%
30%
40%
50%
60%
70%
80%
90%
100%
Urb
an
ba
nd
1
No
n-d
isa
dv
.
Urb
an
ba
nd
1
No
n-d
isa
dv
.
Urb
an
ba
nd
1
No
n-d
isa
dv
.
Reading Irish Maths
Never
Sometimes
Always
0%
10%
20%
30%
40%
50%
60%
70%
80%
90%
100%
En
gli
sh
Ga
els
coil
Ga
elt
ach
t
En
gli
sh
Ga
els
coil
Ga
elt
ach
t
En
gli
sh
Ga
els
coil
Ga
elt
ach
t
Reading Maths Irish
Never
Sometimes
Always
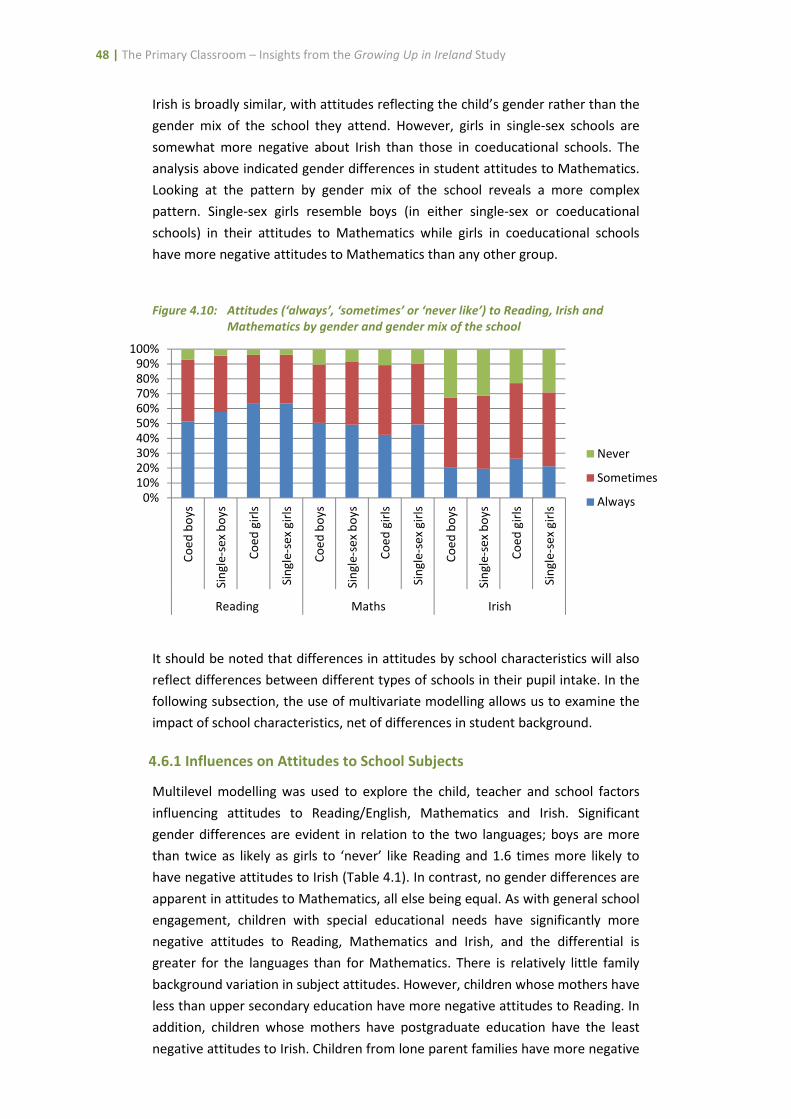
48 | The Primary Classroom – Insights from the Growing Up in Ireland Study
Irish is broadly similar, with attitudes reflecting the child’s gender rather than the
gender mix of the school they attend. However, girls in single-sex schools are
somewhat more negative about Irish than those in coeducational schools. The
analysis above indicated gender differences in student attitudes to Mathematics.
Looking at the pattern by gender mix of the school reveals a more complex
pattern. Single-sex girls resemble boys (in either single-sex or coeducational
schools) in their attitudes to Mathematics while girls in coeducational schools
have more negative attitudes to Mathematics than any other group.
Figure 4.10: Attitudes (‘always’, ‘sometimes’ or ‘never like’) to Reading, Irish and
Mathematics by gender and gender mix of the school
It should be noted that differences in attitudes by school characteristics will also
reflect differences between different types of schools in their pupil intake. In the
following subsection, the use of multivariate modelling allows us to examine the
impact of school characteristics, net of differences in student background.
4.6.1 Influences on Attitudes to School Subjects
Multilevel modelling was used to explore the child, teacher and school factors
influencing attitudes to Reading/English, Mathematics and Irish. Significant
gender differences are evident in relation to the two languages; boys are more
than twice as likely as girls to ‘never’ like Reading and 1.6 times more likely to
have negative attitudes to Irish (Table 4.1). In contrast, no gender differences are
apparent in attitudes to Mathematics, all else being equal. As with general school
engagement, children with special educational needs have significantly more
negative attitudes to Reading, Mathematics and Irish, and the differential is
greater for the languages than for Mathematics. There is relatively little family
background variation in subject attitudes. However, children whose mothers have
less than upper secondary education have more negative attitudes to Reading. In
addition, children whose mothers have postgraduate education have the least
negative attitudes to Irish. Children from lone parent families have more negative
0%
10%
20%
30%
40%
50%
60%
70%
80%
90%
100%
Co
ed
bo
ys
Sin
gle
-se
x b
oy
s
Co
ed
gir
ls
Sin
gle
-se
x g
irls
Co
ed
bo
ys
Sin
gle
-se
x b
oy
s
Co
ed
gir
ls
Sin
gle
-se
x g
irls
Co
ed
bo
ys
Sin
gle
-se
x b
oy
s
Co
ed
gir
ls
Sin
gle
-se
x g
irls
Reading Maths Irish
Never
Sometimes
Always

Children’s Engagement | 49
views than other children on Mathematics and Irish, but no such difference is
evident for Reading. Children from immigrant backgrounds are more positive
about Mathematics than other children but the two groups do not vary in their
attitudes to Reading and Irish.
There is markedly little variation in subject attitudes by teacher characteristics.
Teacher gender, years of experience and use of active teaching methods are not
significantly associated with views on the three subjects. Time allocation is not
significantly related to attitudes to Reading or Irish. The pattern for Mathematics
is a little puzzling: children whose teachers spend more time on Mathematics are
less positive about the subject. This pattern is likely to reflect that teachers whose
students struggle with Mathematics are likely to spend more time on it rather
than being a causal effect of time allocation.
There is tentative evidence that boys attending single-sex schools have somewhat
more positive attitudes to the three subjects than boys in coeducational schools,
though the effects are of borderline significance. Furthermore, girls attending
single-sex schools have more positive attitudes to Mathematics and more
negative attitudes to Irish than their coeducational counterparts. Further analysis,
perhaps using later waves of the Growing Up in Ireland study, would be needed
to unpack whether this is a causal effect since the single-sex sector is likely to be
highly selective in other ways (see Hannan et al., 1996, on the selective profile of
the, much larger, second-level single-sex sector). However, the finding for
Mathematics is consistent with some international research, which indicates less
gendering of mathematical and scientific subjects within single-sex schools (see,
for example, Rowe, 1988). Not surprisingly, children attending gaelscoileanna
have more positive attitudes to Irish than those in English-medium schools.
Interestingly, however, no significant differences are found between Gaeltacht
and English-medium schools in attitudes to Irish. Finally, attitudes to the three
subjects do not vary between DEIS and non-disadvantaged schools.

50 | The Primary Classroom – Insights from the Growing Up in Ireland Study
Table 4.2: Multilevel logistic regression model of factors influencing attitudes to Reading,
Mathematics and Irish, contrasting ‘never like’ with ‘always/sometimes like’
Reading Maths Irish
Constant -3.434 -3.046 -1.390
Individual characteristics
Gender (male) 0.758*** -0.094 0.477***
Social class:
Professional -0.129 0.020 0.092
Managerial -0.162 -0.044 0.022
Non-manual 0.188 -0.237 0.128
Skilled manual 0.005 -0.117 0.282*
Economically inactive -0.143 -0.079 0.015
Ref: semi/unskilled manual
Mother’s education:
Upper secondary -0.357± 0.292* -0.026
Post-secondary -0.491* 0.116 -0.169
Degree -0.480± 0.072 -0.155
Postgraduate degree -0.585± -0.057 -0.315*
Immigrant student -0.066 -0.367± -0.001
Lone parent family 0.106 0.273± 0.264*
Has special educational needs (SEN) 0.649*** 0.363** 0.525***
Teacher characteristics
Teacher gender (male) -0.071 -0.013 0.143
Teaching experience:
3-5 years -0.417± -0.007 -0.120
6-10 years -0.293 -0.124 0.009
11-20 years 0.067 -0.061 0.116
21-30 years -0.496* 0.041 0.008
>30 years 0.077 -0.293 -0.075
Ref: <2 years
Time spent on subject 0.091 0.175** -0.011
Use of active teaching:
Medium level -0.091 0.155 0.118
High level 0.011 0.124 0.037
Ref: low level
School characteristics
Gender mix:
Boys -0.390± -0.284± -0.187±
Girls -0.058 -0.343* 0.264*
Ref: Coed
Language medium:
Gaelscoil -0.322 0.197 -1.280***
Gaeltacht -0.815 0.189 -0.400
Re: English-medium
DEIS status:
Urban band 1 0.148 0.289 -0.004
Urban band 2 -0.279 0.159 -0.059
Rural -0.478 0.101 0.018
Ref: Non-disadvantaged
4.7 SUMMARY
The results show broadly high levels of engagement among Irish primary children,
with only a small minority indicating that they do not like school, do not like their

Children’s Engagement | 51
teacher or do not look forward to school. That said, certain groups of children are
at much greater risk of disengagement even at the relatively young age of nine
years. In line with research elsewhere, boys are much more likely to report low
levels of affective engagement with school. Children with special educational
needs are also likely to respond with low levels of affective engagement, which
recent research (McCoy and Banks, 2012, forthcoming) suggests stems from both
academic engagement and social relations in the school context.
When we consider attitudes towards English, Irish and Mathematics, we find
important differences in attitudes across subject areas and across different
groups of students. Students are most positive about English, while views on Irish
are least positive. Girls have more positive attitudes to the two literacy subjects
than boys. Further, children with special educational needs have much more
negative attitudes to all three subjects. While the results show that gender mix of
the school bears a relationship to student attitudes, with more positive attitudes
among boys in single-sex schools, student attitudes do not vary across other
school characteristics like DEIS status. As might be expected attitudes towards
Irish are more positive among children attending gaelscoileanna, although no
significant differences are found between Gaeltacht and English-medium schools
in attitudes towards Irish.
Much of the international research points to the serious implications of
disengagement for educational development in the short-term and for longer-
term outcomes. A wealth of studies point to the centrality of school engagement
for academic achievement, and other outcomes like delinquency, aggression and
early school dropout (Fredricks et al., 2004; Hill and Werner, 2006; Jimerson et
al., 2003; Simons-Morton, 2004; Sinclair et al., 2003; Perdue et al., 2009).
However, analysis of PISA data also shows that there is considerable variation
among countries in levels of student engagement5 and in the prevalence of
disaffected students at secondary level. Further, this analysis indicates that
literacy performance and student engagement do not necessarily go hand-in-
hand, a finding which has emerged in some international studies, which indicate a
significant number of students with a strong literacy performance who are
nevertheless disaffected from school (Willms, 2003).
5 The measure of engagement in this research has two dimensions: a student’s sense of belonging and school
attendance.

52 | The Primary Classroom – Insights from the Growing Up in Ireland Study
Chapter 5
Summary and Conclusions
5.1 SUMMARY OF MAIN FINDINGS
The Primary Curriculum (1999) has now been in place for more than a decade but
relatively little is known about how the aims of the curriculum have been
translated into classroom practice. The Growing Up in Ireland study provides a
unique opportunity to examine the school and classroom experiences of primary
school children, placing these experiences in the context of very detailed
information from school principals and classroom teachers. This report draws on
the first wave of the Growing Up in Ireland study, examining the lives and
experiences of one-in-seven 9-year-old children in Ireland. Drawing on
Bronfenbrenner’s perspective (Bronfenbrenner et al., 2006), the study provides a
unique opportunity to consider the multifaceted and multilayered influences on
children’s development. Combining detailed information from parents, school
principals and teachers as well as, crucially, children themselves, this report
addresses a number of important themes in Irish primary education. Chapter 2
assesses the allocation of time to different subject areas. This is followed by an
examination of the approaches and strategies teachers adopt in teaching 9-year-
olds in Chapter 3. Chapter 4 examines children’s engagement in school, an
important predictor of longer-term educational outcomes.
In examining the allocation of time to different subject areas, it appears that
teachers are adjusting their class timetable to reflect the perceived needs of their
student intake, focusing more on core literacy skills and also on personal-social
development among more disadvantaged groups. This is very much in keeping
with the objectives of the DEIS programme. The gender-mix of the school and its
language medium were also associated with a distinct pattern of time allocation
in the classroom. Thus, children attending gaelscoileanna are more likely to
experience a broad curriculum and spend more time not only on Irish but also on
Music, Art and PE. Boys in single-sex schools are found to spend more time on
History, Geography and PE than those in coeducational schools. For girls, being in
a single-sex school means spending more time on RE. There are also differences
across teacher characteristics, particularly gender and the length of teaching
experience, in the allocation of time to different subject areas. In particular, more
experienced teachers are found to devote greater amounts of time to a ‘core’
curriculum which emphasises English, Irish and Mathematics.
The findings in relation to teaching approaches adopted by teachers suggest that,
all else being equal, more recently qualified teachers place a greater emphasis on
more active teaching methodologies, with this emphasis declining with the length
of teaching experience. While this finding may reflect, in part, the monitoring of
teachers in their diploma year, it also suggests an important shift in teacher

Summary and Conclusions | 53
training methodologies over time. The results also indicate that teachers are
likely to take different approaches with different student groups – with a stronger
emphasis on active teaching approaches in single-sex girls’ schools and fee-paying
private schools, and more traditional approaches more prevalent in DEIS schools.
It was of particular interest that class size seems to matter for the types of
approaches teachers take, with smaller class groupings appearing to allow
teachers greater opportunity to take more active teaching approaches.
Finally, the results show high levels of affective engagement among Irish 9-year-
olds. However, levels of engagement were substantially lower among two
student groups: namely, boys and children with special educational needs (as
defined in the EPSEN Act, see Banks and McCoy, 2011). In relation to student
attitudes towards the core subjects, English, Irish and Mathematics, there is some
evidence of more positive attitudes towards the languages among girls, more
positive attitudes towards Mathematics among girls in single-sex schools and
more positive attitudes towards all three subjects among boys in single-sex
schools as compared to coeducational settings. Perhaps not surprisingly, children
attending gaelscoileanna indicated more positive attitudes towards Irish;
however, children in Gaeltacht schools did not.
5.2 IMPLICATIONS FOR POLICY
The Primary Curriculum (1999) presented a strong vision of child-centred
education, with children viewed as active agents in their own learning. To what
extent is this vision matched by the reality? Findings in this report provide the
first systematic evidence that whole-class teaching continues to be the dominant
approach used in primary classrooms, reinforcing the findings of earlier studies
which drew on different data sources (Murphy, 2004; NCCA, 2005, 2008). The
current study goes further by documenting the way in which access to more
active learning methods varies by teacher characteristics and classroom setting.
Variation by teacher experience suggests that initial teacher education has
contributed to the greater use of active methodologies in the classroom among
more recent cohorts of graduates. Less use of such methods among more
experienced teachers suggests that continuous professional development in
support of the Primary Curriculum has not led to a change in pedagogical
approaches among this group. These findings point to the need for targeted
professional development to support teachers in utilising a range of pedagogies
(see Murphy, 2004). More active methods are much less prevalent in larger
classes, indicating the constraints of class size on the effective implementation of
the primary curriculum. It is of policy concern too that some groups of children,
namely, girls, those attending fee-paying schools, those attending gaelscoileanna
and those in non-disadvantaged schools, have greater access to the kinds of
active methods which may engage them in learning. Couched differently, boys
and children from disadvantaged backgrounds, groups with lower levels of
achievement later on in the school system, are less likely to experience active and
engaging settings for learning. The reasons for such differences are unclear from
54 | The Primary Classroom – Insights from the Growing Up in Ireland Study
the data available here, but may reflect group-work and pair-work being seen as
‘easier’ to manage with more engaged groups of students.
The Primary Curriculum (1999) emphasises flexibility at the school and classroom
level for teachers to address the needs of their students. While such flexibility is
crucial for effective teaching and learning, there is potential for differences to
emerge which may negatively impact on longer term educational outcomes. For
example, the findings point to significant variation in the time allocated to
particular subject areas, including Mathematics. In the longer term, this may
translate into differences in student engagement and achievement in particular
domains. In keeping with the findings on teaching methods, more recently
qualified teachers are found to provide a broader curriculum with more
experienced teachers spending more time on the ‘core’ areas of English, Irish and
Mathematics. The findings highlight the important role of initial teacher
education, which has undergone significant change and restructuring in recent
years. It appears that such changes have led to a significant shift in the relative
emphasis on different teaching approaches and curricular areas over time. The
results also indicate the important role to be played by continuous professional
development for primary teachers in supporting curriculum implementation. The
additional hours allocated to non-class contact time under the Croke Park
Agreement (2011) may provide the space within which teachers can share
experiences of using different teaching methods and an opportunity to engage in
continuous professional development to reflect school needs. Such professional
development is necessary to ensure that all primary school children have access
to a broad and balanced curriculum.
A significant contribution of the Growing Up in Ireland study is its insight into
children’s own perspectives on schooling. Policy-makers dealing with minors are
increasingly recognising the value of talking and listening to children about the
issues that concern them directly (in accordance with the United Nations
Convention on the Rights of the Child, Article 12). Nine-year-old children are
found to be broadly positive about school and about their teachers. However, it is
of policy concern that even at this early stage boys are more likely to be
disengaged from school and to be more negative about literacy-based subjects
than girls. Even more striking are the significant disengagement levels found
among children with special educational needs, raising issues for policies around
inclusion at primary level (which is further addressed in McCoy and Banks, 2012,
forthcoming). The findings also point to the emergence of more negative
attitudes to Irish than to Reading and Mathematics among children, even at this
early stage.
In conclusion, the Growing Up in Ireland data provided a rich evidence base for
analysing the way in which the Primary Curriculum is implemented in the
classroom. It has important implications for the Department of Education and
Skills Literacy and Numeracy for Life strategy document, published in 2011; for
teacher education programmes; for the DEIS programme; for curricular and
school organisation policy; and for policy on the inclusion of students with special

Summary and Conclusions | 55
educational needs. The findings have relevance for all of the key stakeholders in
education, including the NCCA, the Teaching Council, the Professional
Development Service for Teachers (PDST), the Department of Education and Skills
Inspectorate (Primary), the NCSE, school principals and parents. Later waves of
the study will provide detailed information on the way in which primary
experiences influence the transition to second-level education and beyond.
56 | The Primary Classroom – Insights from the Growing Up in Ireland Study
References
Albone, S. and P. Tymms (2004). “The impact of the National Numeracy Strategy
on children’s attitudes to mathematics”. Paper presented at the British
Educational Research Association annual conference, Manchester, September.
Alexander, K.L., D.R. Entwisle and C.S. Horsey (1997). “From First Grade Forward:
Early Foundations of High School Dropout”, Sociology of Education, 70: 87-107.
American Educational Research Association (AERA) (2007). Time to Learn.
Washington: AERA.
Au, K.H. and J.H. Carroll (1997). “Improving Literacy Achievement through a
Constructivist Approach: The KEEP Demonstration Classroom Project”,
Elementary School Journal, 97(3): 203-221.
Banks, J. and S. McCoy (2011). A Study on the Prevalence of Special Educational
Needs. Dublin: National Council for Special Education.
Barrington, B.L. and B. Hendricks (1989). “Differentiating Characteristics of High
School Graduates, Dropouts and Nongraduates”, Journal of Educational Research,
82: 309-319.
Bronfenbrenner, U. (1979). The Ecology of Human Development. Cambridge:
Harvard University Press.
Bronfenbrenner, U., Morris, P., et al. (2006). The bioecological model of human
development. In R.M.V. Lerner, W. Damon & R.M.S. Lerner (Eds.), Handbook of
Child Psychology, Vol. 1: Theoretical Models of Human Development (6th ed., pp.
793–828). Hoboken: Wiley.
Carroll, J. (1963). “A Model for School Learning”, Teachers College Record, 64:
723-733.
Clark, D. and M.C. Linn (2003). “Designing for Knowledge Integration: The Impact
of Instructional Time”, The Journal of the Learning Sciences, 12(4): 451–493.
D’Agostino, J. (2000). “Instructional and School Effects on Students’ Longitudinal
Reading and Mathematics Achievements”, School Effectiveness and School
Improvement, 11 (2): 197-235.
Darmody, M., E. Smyth and C. Doherty (2010). Designing Primary Schools for the
Future. Dublin: ESRI.
Day, C., P. Sammons, G. Stobart, A. Kington and Q. Gu (2007). Teachers Matter:
Connecting Work, Lives and Effectiveness. Milton Keynes: Open University Press.
De Jager, B. (2002). Teaching Reading Comprehension: The Effects of Direct
Instruction and Cognitive Apprenticeship on Comprehension Skills and
Metacognition. Groningen: Proefschrift GION.

References | 57
Department of Education and Science (1995). Time in School: Primary Circular
11/95. Dublin: The Department of Education and Science.
Department of Education and Skills (2011). Literacy and Numeracy for Learning
and Life. Dublin: Department of Education and Skills.
Dunphy, E. (2009). “Early Childhood Mathematics Teaching: Challenges,
Difficulties and Priorities of Teachers of Young Children in Primary Schools in
Ireland”, International Journal of Early Years Education, 17 (1): 3-16.
Fredricks, J.A., P.C. Blumenfeld and A.H. Paris (2004). “School Engagement:
Potential of the Concept, State of the Evidence”, Review of Educational Research,
74: 59-109.
Furlong, M.J. and S.L. Christenson (2008). “Engaging Students At School and With
Learning: A Relevant Construct for All Students”, Psychology in the Schools, 45(5):
365-368.
Gales, M.J. and W. Yan (2001). “Relationship between Constructivist Teacher
Beliefs and Instructional Practices to Students’ Mathematical Achievement:
Evidence from TIMMS”. Paper presented at the Annual Meeting of AERA, Seattle,
April.
Goldstein, H. (2003). Multilevel Statistical Models. Third Edition. London, Edward
Arnold.
Good, T.L. and J.E. Brophy (1986). Looking in Classrooms (6th
Edition). New York:
Harper Row.
Government of Ireland (1999). Primary School Curriculum: Introduction. Dublin:
Stationery Office.
Guthrie, J.T. and A. Wigfield (2000). “Engagement and Motivation in Reading”. In
M. Kamil and P. Mosenthal (Eds) Handbook of Reading Research (Vol 3, pp.403-
422). Mahwah, NY: Lawrence Erlbaum.
Hannan, D.F., E. Smyth, J. McCullagh, R. O’Leary and D. McMahon (1996).
Coeducation and Gender Equality, Dublin: Oak Tree Press.
Hill, L.G. and N.E. Werner (2006). “Affiliative Motivation, School Attachment and
Aggression in School”, Psychology in the Schools, 43(2): 231-246.
Jimerson, S., E. Campos and J. Greif (2003). “Towards an understanding of
definitions and measures of school engagement and related terms”, California
School Psychologist, 8: 7-28.
Kim, J.S. (2005). “The Effects of a Constructivist Teaching Approach on Student
Academic Achievement, Self-concept and Learning Strategies”, Asia Pacific
Education Review, 6 (1):7-19.
Kirschner, P.A., J. Sweller and R.E. Clark (2006). “Why Minimal Guidance During
Instruction Does Not Work: An Analysis of the Failure of Constructivist, Discovery,

58 | The Primary Classroom – Insights from the Growing Up in Ireland Study
Problem-Based, Experiential, and Inquiry-Based Teaching”, Educational
Psychologist, 41 (2): 75-86.
Klahr, D. and M. Nigam (2004). “The Equivalence of Learning Paths in Early
Science Instruction: Effects of Direct Instruction and Discovery Learning”,
Psychological Science, 15: 661-667.
Koebley, S.C. and S.W. Soled (1998). “The Effects of a Constructivist-Oriented
Mathematics Classroom on Student and Parent Beliefs and Motivations towards
Being Successful in Mathematics”, Paper presented at the Annual Meeting of
AERA, San Diego, April.
Kortering, L. and P. Braziel (2008). “Engaging youth in school and learning: the
emerging key to school success and completion”, Psychology in the Schools,
45(5): 461-465.
Lavy, V. (2010). Do Differences in School’s Instruction Time Explain International
Achievement Gaps in Math, Science, and Reading? Evidence from Developed and
Developing Countries. NBER Working Paper w16227, July 2010.
Lee, J.W. and R. Barro (2001). “School Quality in a Cross-Section of Countries”,
Economica, 68: 465-88.
Lehr, C.A., M.F. Sinclair and S.L. Christenson (2004). “Addressing Student
Engagement and Truancy Prevention during the Elementary School Years: A
Replication of the Check & Connect Model”, Journal of Education for Students
Placed at Risk, 9: 279-301.
Madden, N.A., R.E. Slavin and K. Simons (1999). MathsWings: Effects on Student
Mathematics Performance. Baltimore, Maryland: John Hopkins University, Center
for Social Organisation of Schools.
Marks, H.M. (2000). “Student Engagement in Instructional Activity: Patterns in
the Elementary, Middle and High School Years”, American Educational Research
Journal, 37: 153-184.
McCoy, S. and J. Banks (2012, forthcoming). “Simply Academic? Why Children
with Special Educational Needs Don’t Like School”, European Journal of Special
Needs Education, online first.
McCoy, S., A. Quail and E. Smyth (2012, forthcoming). Influences on Children’s
Learning: Home, School and Community. Dublin: Department of Children and
Youth Affairs.
Mortimore, P., P. Sammons, L. Stoll, D. Lewis and R. Ecob (1988). School Matters:
The Junior Years. Wells: Open Books.
Muijs, D. and D. Reynolds (2000). “Effective Mathematics Teaching: Year 2 of a
Research Project”, paper presented at the International Conference on School
Effectiveness and School Improvement, Hong Kong, 8 January.
Muijs, D. and D. Reynolds (2002). “Teacher Beliefs and Behaviours: What
Matters”, Journal of Classroom Interaction, 37(2): 3-15.

References | 59
Muijs, D. and D. Reynolds (2005). Effective Teaching: Evidence and Practice.
London: Sage Publications.
Muijs, D. and D. Reynolds (2011). Effective Teaching: Evidence and Practice.
Second Edition. London: Sage Publications.
Mullis, I.V.S., M.O. Martin, A.M. Kennedy and P. Foy (2007). IEA's Progress in
International Reading Literacy Study in Primary School in 40 Countries. Chestnut
Hill, MA: TIMSS & PIRLS International Study Center, Boston College.
Mullis, I.V.S, M.O. Martin and P. Foy (2008). TIMSS 2007 International
Mathematics Report: Findings from IEA’s Trends in International Mathematics
and Science Study at the Fourth and Eighth Grades. Chestnut Hill, MA: TIMSS &
PIRLS International Study Center, Boston College.
Murphy, B. (2004). “Practice in Irish Infant Classrooms in the Context of the Irish
Primary School Curriculum (1999)”, International Journal of Early Years Education,
12 (3): 245-257.
Murray, A., C. McCrory, M. Thornton, J. Williams, A. Quail, L. Swords, E. Doyle
and E. Harris (2011). Growing Up in Ireland: Design, Instrumentation and
Procedures for the Child Cohort, Technical Report Number 1. Dublin: Office of the
Minister for Children. http://www.growingup.ie/fileadmin/user_upload/
documents/Technical_Reports/GUI_-_DIPR_09.02.2011.pdf
NCCA (2005). Primary Curriculum Review: Phase One Report. Dublin: NCCA.
NCCA (2008). Primary Curriculum Review: Phase Two Report. Dublin: NCCA.
Neugebauer, M., M. Helbig and A. Landman (2011). “Unmasking the Myth of the
Same-Sex Teacher Advantage”, European Sociological Review, 27(5): 669-689.
Newmann, F., G.G. Wehlage and S.D. Lamborn (1992). “The significance and
sources of student engagement”. In F. Newmann (Ed.), Student Engagement and
Achievement in American Secondary Schools (pp.62-91). New York: Teachers
College Press.
O’Donnell, A.M. (2006). “The role of peers and group learning”. In P. Alexander
and P. Winne (Eds.) Handbook of Educational Psychology (2nd
Edition). New
Jersey: Lawrence Erlbaum.
OECD (2010). Education at a Glance. Paris: OECD.
Perdue, N.H., D.P. Manzeske and D.B. Estell (2009). “Early Predictors of School
Engagement: Exploring the Role of Peer Relationships”, Psychology in the Schools,
46(10): 1084-1097.
Perie, M., D.P. Baker and S.A. Bobbitt (1997). Time Spent Teaching Core Academic
Subjects in Elementary Schools: Comparisons Across Community, School, Teacher,
and Student Characteristics. Washington DC: National Center for Education
Statistics.

60 | The Primary Classroom – Insights from the Growing Up in Ireland Study
Pischke, J.S. (2007). “The Impact of Length of the School Year on Student
Performance and Earnings: Evidence From the German Short School Years.”,
Economic Journal, Royal Economic Society, 117 (523): 1216-1242.
Reynolds, D. and S. Farrell (1996). Worlds Apart? - A Review of International
Studies of Educational Achievement Involving England. London: HMSO for
OFSTED.
Rosenshine, B. (1980). “How time is spent in elementary classrooms”. In D.
Denham and A. Lieberman (Eds.) Time To Learn (pp.107-126). Washington DC:
National Institute of Education.
Rowe, K. J. (1988). “Single-sex and Mixed-sex Classes: The Effects of Class Type on
Student Achievement, Confidence and Participation in Mathematics”, Australian
Journal of Education, 32: 180-202.
Scheerens, J. and B.P.M. Creemers (1996). “School Effectiveness in the
Netherlands: The Modest Influence of a Research Programme”, School
Effectiveness and School Improvement, 7(2): 181-195.
Schippen, M., D. Houchins, C. Stenenton and D. Sartor (2005). “A Comparison of
Two Direct Instruction Reading Programs for Urban Middle School Students”,
Remedial and Special Education, 26(3): 175-182.
Simons-Morton, B. (2004). “Prospective Association of Peer Influence, School
Engagement, Drinking Expectancies and Parent Expectations with Drinking
Initiation among Sixth Graders”, Addictive Behaviours, 29: 299-309.
Sinclair, M.F., S.L. Christenson, C.A. Lehr and A. Reschly-Anderson (2003).
“Facilitating School Engagement: Lessons Learned from Check & Connect
Longitudinal Studies”, The California School Psychologist, 8: 29-41.
Sirin, S.R. and L. Rogers-Sirin (2005). “Components of School Engagement among
African American Adolescents”, Applied Developmental Science, 9 (1): 5-13.
Smith, B.E., M. Roderick and S.C. Degener (2005). “Extended Learning Time and
Student Accountability: Assessing Outcomes and Options for Elementary and
Middle Grades”, Educational Administration Quarterly, 41 (2): 195-236.
Smith, J., I. Brooks-Gunn and P.K. Klebanov (1997). “Consequences of living in
poverty for young children’s cognitive and verbal ability and early school
achievement”. In G. Duncan and J. Brooks-Gunn (Eds.), Consequences of Growing
Up Poor (pp.132-189). New York: Russell Sage Foundation.
Smyth, E., J. Banks and E. Calvert (2011). From Leaving Certificate to Leaving
School. Dublin: The Liffey Press.
Sokal, L. and H. Katz (2008). “Effects of Technology and Male Teachers on Boys’
Reading”, Australian Journal of Education, 52 (1): 81-94.
Spiro, R.J. and M. DeSchryver (2009). “Constructivism: When it’s the wrong idea
and when it’s the only idea”. In S. Tobias and T. Duffy (Eds.), Constructivist
Education: Success or Failure?. New York: Routledge.

References | 61
Sugrue, C. (1997). Complexities of Teaching: Child-Centred Perspectives,
Abingdon: RoutledgeFalmer.
Tymms, P. (2001). “A Test of the Big Fish in a Little Pond Hypothesis: An
Investigation into the Feelings of Seven Year Old Pupils in School”, School
Effectiveness and School Improvement, 12(2): 161 – 181.
Veenman, S., E. Denessen, A. van den Akker and J. van der Rijt. (2005). “Effects of
a Cooperative Learning Program on the Elaborations of Students During Help
Seeking and Help Giving”, American Educational Research Journal, 42 (1): 115-
151.
Webb, M. and A.M. Mastergeorge (2003). “The Development of Students’
Helping Behaviour and Learning in Peer-Directed Small Groups”, Cognition and
Instruction, 21 (4): 361-428.
Wehlage, G.G., R.A. Rutter, G.A. Smith, N.L. Lesko and R.R. Fernandez (1989).
Reducing the Risk: Schools as Communities of Support. Philadelphia: Farmer Press.
Willms, J.D. (2003). Student Engagement at School: A Sense of Belonging and
Participation, Results from PISA 2000. Paris: OECD.
Wößmann, L. (2003). “Schooling Resources, Educational Institutions and Student
Performance: The International Evidence”, Oxford Bulletin of Economics and
Statistics, 65: 117-70.

62 | The Primary Classroom – Insights from the Growing Up in Ireland Study
Appendix A
Teaching Methods Question
Please indicate how frequently the following things happen in the Study Child’s
class [never/almost never, some days, most days and every day]:
1. Pupils copy notes from the board in class
2. Pupils work in pairs
3. Pupils work individually in class using their textbook or
worksheets
4. Homework is checked in class
5. Homework is taken up for correction
6. Pupils work in groups in class
7. You ask pupils questions in class
8. Pupils ask you questions in class
9. Pupils ask each other questions in class
10. You read aloud to pupils
11. Pupils suggest subjects or topics to be covered in class
12. Pupils are encouraged to find things out for themselves
13. You use video/DVD or audiotapes/CDs in class
14. You use play to facilitate pupil learning
15. Pupils use computer facilities in class
16. You provide differentiated activities, as appropriate, to pupils
17. Pupils get the opportunity to engage in hands-on activities
18. The pupil’s experience and their environment is the starting point
for learning
19. You teach pupils as a whole class

978 0 7070 0323 8
Learning in Focus
The Primary Classroom: Insights from the Growing Up in Ireland StudySelina McCoy, Emer Smyth and Joanne Banks
THE ECONOMIC AND SOCIAL RESEARCH INSTITUTE